Attached files
| file | filename |
|---|---|
| EX-10.24 - EX-10.24 - MITEK SYSTEMS INC | mitk-ex1024_480.htm |
| EX-32.1 - EX-32.1 - MITEK SYSTEMS INC | mitk-ex321_6.htm |
| EX-31.2 - EX-31.2 - MITEK SYSTEMS INC | mitk-ex312_7.htm |
| EX-31.1 - EX-31.1 - MITEK SYSTEMS INC | mitk-ex311_8.htm |
| EX-23.1 - EX-23.1 - MITEK SYSTEMS INC | mitk-ex231_9.htm |
| EX-10.25 - EX-10.25 - MITEK SYSTEMS INC | mitk-ex1025_479.htm |
UNITED STATES
SECURITIES AND EXCHANGE COMMISSION
Washington, D.C. 20549
Form 10-K
|
☒ |
ANNUAL REPORT PURSUANT TO SECTION 13 OR 15(d) OF THE SECURITIES EXCHANGE ACT OF 1934 |
For the fiscal year ended September 30, 2016
|
☐ |
TRANSITION REPORT PURSUANT TO SECTION 13 OR 15(d) OF THE SECURITIES EXCHANGE ACT OF 1934 |
For the transition period from to .
Commission File Number 001-35231
MITEK SYSTEMS, INC.
(Exact name of registrant as specified in its charter)
|
Delaware |
87-0418827 |
|
(State of Incorporation) |
(I.R.S. Employer Identification No.) |
|
600 B Street, Suite 100 San Diego, California |
92101 |
|
(Address of principal executive offices) |
(Zip Code) |
Registrant’s telephone number: (619) 269-6800
Securities registered pursuant to Section 12(b) of the Act:
|
Title of Each Class |
Name of Each Exchange on Which Registered |
|
Common Stock, par value $0.001 per share |
NASDAQ Capital Market |
Securities registered pursuant to Section 12(g) of the Act:
None
Indicate by check mark if the registrant is a well-known seasoned issuer, as defined in Rule 405 of the Securities Act. Yes ☐ No ☒
Indicate by check mark if the registrant is not required to file reports pursuant to Section 13 or Section 15(d) of the Act. Yes ☐ No ☒
Indicate by check mark whether the registrant (1) has filed all reports required to be filed by Section 13 or 15(d) of the Securities Exchange Act of 1934 during the preceding 12 months (or for such shorter period that the registrant was required to file such reports), and (2) has been subject to such filing requirements for the past 90 days. Yes ☒ No ☐
Indicate by check mark whether the registrant has submitted electronically and posted on its corporate website, if any, every Interactive Data File required to be submitted and posted pursuant to Rule 405 of Regulation S-T (§ 232.405 of this chapter) during the preceding 12 months (or such shorter period that the registrant was required to submit and post such files). Yes ☒ No ☐
Indicate by check mark if disclosure of delinquent filers pursuant to Item 405 of Regulation S-K (§ 229.405) is not contained herein, and will not be contained, to the best of the registrant’s knowledge, in definitive proxy or information statements incorporated by reference in Part III of this Form 10-K or any amendment to this Form 10-K. ☒
Indicate by check mark whether the registrant is a large accelerated filer, an accelerated filer, a non-accelerated filer, or a smaller reporting company. See the definitions of “large accelerated filer,” “accelerated filer” and “smaller reporting company” in Rule 12b-2 of the Exchange Act. (Check one):
|
Large Accelerated Filer |
☐ |
Accelerated Filer |
☒ |
|
|
|
|
|
|
Non-Accelerated Filer |
☐ (Do not check if a smaller reporting company) |
Smaller Reporting Company |
☐ |
Indicate by check mark whether the registrant is a shell company (as defined in Rule 12b-2 of the Exchange Act). Yes ☐ No ☒
The aggregate market value of the voting stock held by non-affiliates of the registrant, based upon the closing sale price of the registrant’s common stock on March 31, 2016, the last business day of the registrant’s most recently completed second fiscal quarter, as reported on the NASDAQ Capital Market, was $205,961,297. Shares of stock held by officers and directors have been excluded in that such persons may be deemed to be affiliates. This determination of affiliate status is not necessarily a conclusive determination for other purposes.
There were 33,081,039 shares of the registrant’s common stock outstanding as of November 30, 2016.
DOCUMENTS INCORPORATED BY REFERENCE
Portions of the registrant’s definitive proxy statement for the 2017 Annual Meeting of Stockholders to be filed with the Securities and Exchange Commission pursuant to Regulation 14A are incorporated by reference into Part III of this Form 10-K to the extent stated herein.
FORM 10-K
For The Fiscal Year Ended September 30, 2016
|
i |
||
|
|
|
|
|
Part I |
|
|
|
Item 1. |
1 |
|
|
Item 1A. |
6 |
|
|
Item 1B. |
16 |
|
|
Item 2. |
16 |
|
|
Item 3. |
17 |
|
|
Item 4. |
17 |
|
|
|
|
|
|
Part II |
|
|
|
Item 5. |
18 |
|
|
Item 6. |
20 |
|
|
Item 7. |
Management’s Discussion and Analysis of Financial Condition and Results of Operations |
21 |
|
Item 7A. |
30 |
|
|
Item 8. |
30 |
|
|
Item 9. |
Changes in and Disagreements with Accountants on Accounting and Financial Disclosure |
30 |
|
Item 9A. |
31 |
|
|
Item 9B. |
31 |
|
|
|
|
|
|
Part III |
|
|
|
Item 10. |
32 |
|
|
Item 11. |
32 |
|
|
Item 12. |
Security Ownership of Certain Beneficial Owners and Management and Related Stockholder Matters |
32 |
|
Item 13. |
Certain Relationships and Related Transactions, and Director Independence |
32 |
|
Item 14. |
32 |
|
|
|
|
|
|
Part IV |
|
|
|
Item 15. |
33 |
|
|
33 |
||
|
35 |
||
In this Annual Report on Form 10-K (“Form 10-K”), unless the context indicates otherwise, the terms “Mitek,” “the Company,” “we,” “us,” and “our” refer to Mitek Systems, Inc., a Delaware corporation.
IMPORTANT NOTE ABOUT FORWARD-LOOKING STATEMENTS
This Form 10-K contains “forward-looking statements” within the meaning of Section 27A of the Securities Act of 1933, as amended (the “Securities Act”) and Section 21E of the Securities and Exchange Act of 1934, as amended (the “Exchange Act”) that involve risks and uncertainties, as well as assumptions that, if they never materialize or prove incorrect, could cause our results to differ materially and adversely from those expressed or implied by such forward-looking statements. The forward-looking statements are contained principally in Item 1—“Business,” Item 1A.—“Risk Factors” and Item 7—“Management’s Discussion and Analysis of Financial Condition and Results of Operations,” but appear throughout this Form 10-K. Forward-looking statements may include, but are not limited to, statements relating to our outlook or expectations for earnings, revenues, expenses, asset quality or other future financial or business performance, strategies, expectations or business prospects, or the impact of legal, regulatory or supervisory matters on our business, results of operations or financial condition. Specifically, forward- looking statements may include statements relating to our future business prospects, revenue, income and financial condition.
Forward-looking statements can be identified by the use of words such as “estimate,” “plan,” “project,” “forecast,” “intend,” “expect,” “anticipate,” “believe,” “seek,” “target” or similar expressions. Forward-looking statements reflect our judgment based on currently available information and involve a number of risks and uncertainties that could cause actual results to differ materially from those described in the forward-looking statements.
In addition to those factors discussed under Item 1A—“Risk Factors,” important factors could cause actual results to differ materially from our expectations. These factors include, but are not limited to:
|
|
• |
adverse economic conditions; |
|
|
• |
general decreases in demand for our products and services; |
|
|
• |
changes in timing of introducing new products into the market; |
|
|
• |
intense competition (including entry of new competitors), including among competitors with substantially greater resources than us; |
|
|
• |
increased or adverse federal, state and local government regulation; |
|
|
• |
inadequate capital; |
|
|
• |
unexpected costs; |
|
|
• |
revenues and net income lower than forecasted; |
|
|
• |
litigation; |
|
|
• |
the possible fluctuation and volatility of operating results and financial conditions; |
|
|
• |
inability to carry out our marketing and sales plans; and |
|
|
• |
the loss of key employees and executives. |
All forward-looking statements included in this Form 10-K speak only as of the date of this Form 10-K and you are cautioned not to place undue reliance on any such forward-looking statements. Except as required by law, we undertake no obligation to publicly update or release any revisions to these forward-looking statements to reflect any events or circumstances that arise after the date of this Form 10-K or to reflect the occurrence of unanticipated events. The above list is not intended to be exhaustive and there may be other factors that could preclude us from realizing the predictions made in the forward-looking statements. We operate in a continually changing business environment and new factors emerge from time to time. We cannot predict such factors or assess the impact, if any, of such factors on our financial position or results of operations.
i
Overview
Mitek is a global provider of mobile capture and identity verification software solutions for enterprises. We are currently serving more than 5,400 financial services organizations and leading brands across the globe. Our solutions are embedded in native mobile apps and mobile optimized websites to facilitate better mobile user experiences and compliant transactions.
Mitek invented Mobile Deposit® which is used today by millions of consumers in the U.S. and Canada for mobile check deposit. Following the success of Mobile Deposit®, Mitek has introduced a multi-check capture solution that enables businesses to deposit multiple checks in one batch using a mobile device.
Mitek is also applying our mobile and imaging expertise to digital identity verification globally. Mitek’s image based identity verification product, Mobile Verify™, is empowering the digital transformation of companies operating in highly regulated markets by enabling them to identify with whom they are conducting business. Identity verification is mandatory to be in compliance with many governmental Know Your Customer and Anti-Money Laundering regulatory requirements around the globe.
Our identity verification technology has been selected for use with digital/mobile on-boarding, fast money movement, and user re-authentication when irregular activity is suspected. While our solutions are primarily used in financial services (banks, credit unions, lenders, payments processers, card issuers, insurers, etc) we are also seeing adoption by telecommunications, healthcare, travel, retail, sharing economy companies and more.
We market and sell our products and services worldwide through internal, direct sales teams located in the US and Europe as well as through channel partners. Our direct sales strategy concentrates on large financial services organizations and medium sized companies. Our partner sales strategy includes channel partners who are financial services technology providers. These partners integrate our products into their solutions to meet the needs of their customers. The majority of our revenue is derived from software licenses with an increasing percentage of revenue from software as a service (“SaaS”) contracts.
Mitek is headquartered in San Diego, California, and has offices in Haarlem (the Netherlands) and London (United Kingdom).
Product and Technology Overview
Technology
During the fiscal year ended September 30, 2016, we had one operating segment: the development, sale, and service of our proprietary software solutions related to mobile image capture and identity verification.
Our mobile technology solutions are provided in two parts: (i) a software development kit (SDK) for mobile capture and (ii) a software platform for image correction, detection, extraction and authentication. This proprietary technology effectively turns camera-equipped smartphones and tablets into mobile digital scanning devices that facilitate safe and compliant mobile onboarding and monetary transactions.
Our products and services process images of documents in many ways. These include quality analysis, image repair and optimization, document identification, the extraction of hand-printed and machine-printed text, and verification as to the validity of the document using both proprietary checks as well as verification of security features present on the document.
Products
Mobile Fill™
Mobile Fill™, which includes our touch free auto capture experience, enables the camera to serve as a keyboard. Using Mobile Fill™, consumers can pre-fill forms with personal data by simply snapping a picture of their driver license, credit card, or other document. Organizations can use Mobile Fill™ for a variety of purposes, including streamlining the process of opening a customer checking, savings or credit card account, paying a bill, activating a “switch and save” offer, and more. Mitek’s prime users for Mobile Fill include national and regional banks, credits unions, wireless telecom operators and insurance providers.
The second generation of our Mobile Fill™ product, Mobile Fill for Mobile Web™, enables consumers to use their camera as a keyboard right from the organization’s mobile website, eliminating the need to download an application.
1
Mobile Fill™ is integrated into native mobile apps and mobile websites.
Mobile Verify™
Mobile Verify™ is an identity verification solution that can be integrated into mobile apps, mobile websites, and desktop applications. Mobile Verify combines our advanced auto capture experience with our computer vision technology to perform algorithmic-based tests that verify the authenticity of thousands of ID document types around the globe, including passports, driver's licenses and identity cards from nearly every nation. The key driver of digital identity verification is to meet stringent regulatory requirements mandated by governments and industry regulators globally for digital onboarding and money movement.
Mobile Docs™
Mobile Docs™ is a mobile document scanning solution. It enables consumers to take photos of documents resulting in scanner-quality images. Mobile Docs can be used to submit the trailing documents required for digital onboarding, lending and other use cases where additional documentation is required in a workflow.
Mobile Deposit® (for retail banking)
Mitek invented Mobile Deposit® to allow individuals and businesses to remotely deposit checks using their camera-equipped smartphone or tablet.
Mobile Deposit® is utilized by the mobile banking apps of U.S. and Canadian retail banks. As of September 30, 2016, more than 5,400 financial institutions had signed agreements to deploy Mobile Deposit®. It allows users to make deposits by photographing the front and back of a check and submitting the image electronically.
The Mobile Deposit® process allows the consumer to take photographs of the front and back off a check and remotely deposit the check with their participating bank. Mitek also enables a better user experience by making available our proprietary advanced mobile auto capture process which can assist users in automatically capturing a usable image of a check by simply holding their mobile device over the check. We began selling Mobile Deposit® in the second fiscal quarter of 2008.
We received our first patent issued for this product in August 2010. Of Mitek’s 27 patents, 9 are related to methods and systems used to deposit a check via a mobile device’s camera, and an additional 13 support our core image processing science.
Commercial Mobile Deposit Capture™ (for business banking)
Our Commercial Mobile Deposit Capture™ product integrates the same core technology as Mobile Deposit® with additional capabilities specific to small and medium size businesses. Additional capabilities include a mobile multi-check capture to help businesses eliminate the need for check scanners and trips to the ATM or bank branches.
Of the 19 billion checks deposited in the U.S. per the 2013 Federal Reserve Payments Study, a majority were deposited by businesses. Many of the checks deposited by businesses are deposited in small batches and by businesses that are geographically dispersed. In the past, banks have attempted to alleviate some of the issues related to commercial deposits by providing costly, single purpose scanners to their business customers to allow them to scan their checks on site. Like many proprietary hardware solutions in the mobile era, the scanners are increasingly viewed as a costly annoyance by many businesses, plus they are not available at the point of service, which may occur away from the office, for instance when a delivery driver receives a check from a customer at the customer’s location.
Our Commercial Mobile Deposit Capture solution makes the process of depositing multiple checks significantly easier by, for instance, enabling the user to capture multiple checks individually in one video session (powered by our MiSnap technology) and then providing capabilities to virtually edit, append information to, and “batch” the items into a single business deposit which can be deposited remotely from the mobile device.
Our technology processes images of documents in many ways. These include quality analysis, image repair, document identification and the extraction of hand-printed and machine-printed text. Our solutions can be deployed on any back office, industrial or desktop scanner, or on camera-equipped smartphones or tablets, to optimize and extract select data from any scanned or photographed identity document, check, bill or other financial document. Our capabilities include mobile document capture, image recognition, repair and optimization, dynamic data extraction and several document-specific capabilities, such as courtesy amount recognition, legal amount recognition, passport machine readable zones, and reading of barcodes.
2
Our proprietary, patented technology combines our patented core character recognition software with advanced mobile capture processing capabilities that transform a four-color photograph of a document into a digital image equivalent in size and resolution to a scanned document. This process overcomes several critical issues inherent in mobile photography. Documents captured by camera-equipped smartphones and tablets are exposed to variable lighting conditions and various angles and focal distances. Raw photos of documents taken by a camera-equipped smartphone or tablet may be of an unknown size and resolution. They are often geometrically distorted, skewed or warped. As a result, the “raw” mobile document image is virtually unusable without Mitek’s solution. Our technology uses advanced algorithms designed to identify and correct geometric and optical distortions, automatically correcting each mobile document image.
Sales and Marketing
We market and sell our products and services worldwide through internal, direct sales teams located in the US and Europe as well as through channel partners. Our direct sales strategy concentrates on large financial services organizations and medium sized companies. Our partner sales strategy includes channel partners who are financial services technology providers. These partners integrate our products into their solutions to meet the needs of their customers.
We derive revenue predominately from the sale of licenses (to both our on premise and SaaS products) and transaction fees to use our Mobile Deposit®, Commercial Mobile Deposit Capture™, Mobile Verify™, Mobile Fill™ and Mobile Docs™ products, and to a lesser extent by providing maintenance and professional services for the products we offer. The revenue we derive from the sale of such licenses is derived from both the sale to our channel partners of licenses to sell the applications we offer as well as the direct sale to customers of licenses.
We have an internal marketing group that develops corporate and digital marketing strategies. The internal team executes these strategies with the help of external resources as needed to support both direct sales and channel partners’ sales efforts.
For the fiscal year ended September 30, 2016, we derived revenue of $6.3 million, or 18% of our total revenue, from one customer, compared to revenue of $6.3 million or 25% of our total revenue, from one customer in the fiscal year ended September 30, 2015. For the fiscal year ended September 30, 2014, we derived revenue of $5.7 million, or 30% of our total revenue from one customer.
International revenues accounted for 15%, 5%, and 4% of our total revenue for the fiscal years ended September 30, 2016, 2015 and 2014, respectively. Revenues from our products are primarily denominated in U.S. dollars.
Intellectual Property
Our success depends in large part upon our proprietary technology. We attempt to protect our intellectual property rights primarily through a combination of patents, copyrights, trademarks, trade secrets, employee and third party non-disclosure agreements and other measures. We believe that factors such as the technological and creative skills of our personnel, new product development, frequent product enhancements, name recognition, and reliable product maintenance are essential to establishing and maintaining a technological leadership position. There can be no assurance that our means of protecting our proprietary rights in the U.S. or abroad will be adequate. We seek to protect our software, documentation, and other written materials under trade secret and copyright laws, which afford only limited protection. Further, there can be no assurance that our patents will offer any protection or that they will not be challenged, invalidated, or circumvented. If we are unable to protect our intellectual property, or we infringe on the intellectual property rights of a third party, our operating results could be adversely affected.
As of September 30, 2016, the U.S. Patent and Trademark Office has issued us 27 patents and we have filed for 16 additional domestic and international patents. We have 19 registered trademarks and will continue to evaluate the registration of additional trademarks, as appropriate. We claim common law protection for, and may seek to register, other trademarks. In addition, we generally enter into confidentiality agreements with our employees.
Market Opportunities, Challenges and Risks
We believe that financial institutions and other companies see our patented solutions as a way to provide an enhanced mobile customer experience, and at the same time, meet regulatory requirements. The value of digital transformation to our customers is an increase in top line revenue and a reduction in the cost of sales and service.
3
We believe digital transformation initiatives are in their infancy. We predict growth in both our Mobile Deposit® and our ID products based on current trends of bank branch closure, more stringent regulations and ever increasing demand for mobile sales and service by millennials and mobile-first consumers.
Factors adversely affecting the pricing of, or demand for, our mobile solutions, such as competition from other products or technologies, any decline in the demand for mobile applications, or negative publicity or obsolescence of the software environments in which our products operate, could result in lower revenues or gross margins. Further, because substantially all of our revenues are from a few types of technology, our product concentration may make us especially vulnerable to market demand and competition from other technologies, which could reduce our revenues.
The sales cycle for our software and services can be lengthy and the implementation cycles for our software and services by our channel partners and customers can also be lengthy, often a minimum of six months and sometimes longer for larger customers, and require significant investments. If implementation of our products by our channel partners and customers is delayed or otherwise not completed, our business, financial condition and results of operations may be adversely affected.
Revenues related to most of our on premise licenses for mobile products are required to be recognized up front upon satisfaction of all applicable revenue recognition criteria. Revenue related to our SaaS products is recognized ratably over the life of the contract or as transactions are used depending on the contract criteria. The recognition of future revenues from these licenses is dependent upon a number of factors, including, but not limited to, the term of our license agreements, the timing of implementation of our products by our channel partners and customers and the timing of any re-orders of additional licenses and/or license renewals by our channel partners and customers.
During each of the last few years, sales of licenses to one or more channel partners have comprised a significant part of our revenue each year. This is attributable to the timing of renewals or purchases of licenses and does not represent a dependence on any single channel partner. If we were to lose a channel partner relationship, we do not believe such a loss would adversely affect our operations because either we or another channel partner could sell our products to the end-users that had purchased products from the channel partner we lost. However, in that case, we or another channel partner must establish a relationship with the end-users, which could take time to develop, if it develops at all.
We have a growing number of competitors in the mobile capture and identity verification industry, many of which have greater financial, technical, marketing and other resources. However, we believe our patented mobile capture and identity verification technology, our growing portfolio of products for the financial services industry and our market expertise gives us a distinct competitive advantage. To remain competitive, we must continue to offer products that are attractive to the consumer as well as being secure, accurate and convenient. To help us remain competitive, we intend to further strengthen our portfolio of products through research and development as well as partnering with other technology providers.
Competition
The market for our products and solutions is intensely competitive, subject to rapid change, and significantly affected by new product introductions and other market activities of industry participants. We face direct and indirect competition from a broad range of competitors who offer a variety of products and solutions to our current and potential customers. Our principal competition comes from: (i) customer-developed solutions; (ii) companies offering alternative methods of identity verification; and (iii) companies offering competing technologies capable of mobile remote deposit capture or authenticating identity documents and facial photo comparison.
It is also possible that we will face competition from new industry participants or alternative technologies. Moreover, as the market for automated document processing, image recognition and authentication, check imaging and fraud detection software develops, a number of companies with significantly greater resources than we have could attempt to enter or increase their presence in our industry, either independently or by acquiring or forming strategic alliances with our competitors, or otherwise increase their focus on the industry. In addition, current and potential competitors have established or may establish cooperative relationships among themselves or with third parties to increase the ability of their products to address the needs of our current and potential customers.
Our products are compliant with Service-Oriented Architecture standards and compete, to various degrees, with products produced by a number of substantial competitors. Competition among product providers in this market generally focuses on price, accuracy, reliability and technical support. We believe our primary competitive advantages in this market are: (i) our mobile auto capture user experience used by millions of consumers; (ii) our patented science; (iii) scalability; and (iv) an architectural software design that allows our products to be more readily modified, improved with added functionality and configured for new products, thereby allowing our software to be easily upgraded.
4
Increased competition may result in price reductions, reduced gross margins and loss of market share, any of which could have a material adverse effect on our business, operating results and financial condition.
Research and Development
We develop software products internally and also purchase or license rights to third-party intellectual property. We believe that our future success depends in part on our ability to maintain and improve our core technologies, enhance our existing products and develop new products that meet an expanding range of customer requirements.
Internal research and development allows us to maintain closer technical control over our products and gives us the ability to determine which modifications and enhancements are most important and when they should be implemented to ensure the proper functioning of our software products. We intend to expand our existing product offerings and introduce new mobile capture and identity verification capabilities that meet a broader set of needs of our customers. We intend to continue to support the major industry standard operating environments.
Our research and development organization includes software engineers and scientists, many of whom have advanced degrees, as well as additional personnel in quality assurance and related disciplines. All of our scientists and software engineers are involved in product development.
The development team includes specialists in artificial intelligence, computer vision, software engineering, user interface design, product documentation and quality assurance. The team is responsible for maintaining and enhancing the performance, quality and utility of all of our products. In addition to research and development, our engineering staff provides customer technical support on an as-needed basis.
Our research and development expenses for the years ended September 30, 2016, 2015 and 2014 were $7.8 million, $5.6 million, and $6.0 million respectively. We expect research and development expenses during fiscal year 2017 to increase as compared with those incurred in fiscal year 2016 as we continue our new product research and development efforts.
Employees and Labor Relations
As of September 30, 2016, we had 117 employees, 81 in the U.S. and 36 in Europe (UK and The Netherlands), 104 of which are full time. Our total employee base consists of 57 sales and marketing and professional services employees, 41 research and development and support employees, and 19 employees in executive, finance, network administration and other capacities. In addition, we engaged various consultants in the areas of research and development, product development, finance and marketing during fiscal year 2016. We have never had a work stoppage and none of our employees are represented by a labor organization. Substantially all of our employees, other than certain of our executive officers and employees with customary employment arrangements within Europe, are at will employees, which means that each employee can terminate his or her relationship with us and we can terminate our relationship with him or her at any time. We offer industry competitive wages and benefits and are committed to maintaining a workplace environment that promotes employee productivity and satisfaction. We consider our relations with our employees to be good.
Available Information
Our principal offices are located at 600 B Street, Suite 100, San Diego, CA 92101 and our telephone number is (619) 269-6800. We are subject to the reporting requirements of the Exchange Act. Consequently, we are required to file reports and information with the Securities and Exchange Commission (the “SEC”), including reports on the following forms: annual reports on Form 10-K, quarterly reports on Form 10-Q, current reports on Form 8-K and amendments to those reports filed or furnished pursuant to Section 13(a) or 15(d) of the Exchange Act. These reports and other information concerning us may be accessed, free of charge, through the SEC’s website at www.sec.gov and our website at www.miteksystems.com. These reports are placed on our website as soon as reasonably practicable after they are filed with the SEC. Information contained in, or that can be accessed through, our website is not incorporated by reference into, nor is it in any way a part of, this Form 10-K.
5
The following risk factors and other information included in this Form 10-K should be carefully considered. The risks and uncertainties described below are not the only ones we face. Additional risks and uncertainties not presently known to us or that we presently deem less significant may also impair our business operations. If any of the following risks actually occur, our business, financial condition, results of operations, cash flows, projected results and future prospects could be materially and adversely affected. In these circumstances, the market price of our common stock could decline, and you could lose all or part of your investment or interest.
Risks Associated With Our Business
We have a history of losses and we may not be able to maintain profitability in the future.
Our operations resulted in a net loss of $5.3 million and $7.3 million for the years ended September 30, 2014 and 2013, respectively. Although we generated net income for the years ended September 30, 2015 and September 30, 2016, we may experience future net losses which may limit our ability to fund our operations and we may not generate income from operations in the future. We have a history of losses and may continue to incur significant losses for the foreseeable future. As of September 30, 2016 and 2015, we had an accumulated deficit of $31.5 million and $33.5 million, respectively. Our future profitability depends upon many factors, including several that are beyond our control. These factors include, without limitation:
|
|
• |
changes in the demand for our products and services; |
|
|
• |
loss of key customers or contracts; |
|
|
• |
the introduction of competitive software; |
|
|
• |
the failure to gain market acceptance of our new and existing products; |
|
|
• |
the failure to successfully and cost effectively develop, introduce and market new products, services and product enhancements in a timely manner; and |
|
|
• |
the timing of recognition of revenue. |
In addition, we incur significant legal, accounting, and other expenses related to being a public company. As a result of these expenditures, we will have to generate and sustain increased revenue to achieve and maintain future profitability.
We may need to raise additional capital to fund continuing operations and an inability to raise the necessary capital or to do so on acceptable terms could threaten the success of our business.
We currently anticipate that our available capital resources and operating cash flows will be sufficient to meet our expected working capital and capital expenditure requirements for at least the next 12 months. However, such resources may not be sufficient to fund the long-term growth of our business. If we determine that it is necessary to raise additional funds, we may choose to do so through strategic collaborations, licensing arrangements, public or private equity or debt financing, a bank line of credit, or other arrangements. We cannot be sure that any additional funding, if needed, will be available on terms favorable to us or at all. Furthermore, any additional equity or equity-related financing may be dilutive to our stockholders, new equity securities may have rights, preferences or privileges senior to those of existing holders of our shares of common stock, and debt or equity financing, if available, may subject us to restrictive covenants and significant interest costs. If we obtain funding through a strategic collaboration or licensing arrangement, we may be required to relinquish our rights to certain of our technologies, products or marketing territories. If we are unable to obtain the financing necessary to support our operations, we may be required to defer, reduce or eliminate certain planned expenditures or significantly curtail our operations.
6
Our ability to utilize our net operating loss carryforwards and certain other tax attributes may be limited.
Federal and state tax laws impose restrictions on the utilization of net operating loss (“NOL”) and tax credit carryforwards in the event of an “ownership change” as defined by Section 382 of the Internal Revenue Code of 1986, as amended (“Section 382”). Generally, an “ownership change” occurs if the percentage of the value of the stock that is owned by one or more direct or indirect “five percent shareholders” increases by more than 50% over their lowest ownership percentage at any time during the applicable testing period (typically, three years). Under Section 382, if a corporation undergoes an “ownership change,” the corporation’s ability to use its pre-change NOL carryforwards and other pre-change tax attributes to offset its post-change income may be limited. We have not completed a study to assess whether an “ownership change” has occurred or whether there have been multiple “ownership changes” since we became a “loss corporation” as defined in Section 382. Future changes in our stock ownership, which may be outside of our control, may trigger an “ownership change.” In addition, future equity offerings or acquisitions that have equity as a component of the purchase price could result in an “ownership change.” If an “ownership change” has occurred or does occur in the future, utilization of the NOL carryforwards or other tax attributes may be limited, which could potentially result in increased future tax liability to us.
We currently derive substantially all of our revenue from a single type of technology. If this technology and the related products do not achieve or continue to achieve market acceptance, our business, financial condition and results of operations would be adversely affected.
We currently derive substantially all of our product revenues from licenses and sales of software products to customers incorporating our intelligent mobile imaging technology and software products. If we are unable to achieve or continue to achieve market acceptance of our core technology or products incorporating such technology, we will not generate significant revenue growth from the sale of our products.
Additionally, factors adversely affecting the pricing of or demand for our products and services, such as competition from other products or technologies, any decline in the demand for mobile image processing, negative publicity or obsolescence of the software environments in which our products operate could adversely affect our business, financial condition and results of operations.
If economic or other factors negatively affect the small and medium-sized business sector, our customers may become unwilling or unable to purchase our products and services, which could cause our revenue to decline.
Many of our existing and target customers are in the small and medium-sized business sector. These businesses are more likely to be significantly affected by economic downturns than larger, more established businesses. Additionally, these customers often have limited discretionary funds, which they may choose to spend on items other than our products and services. If small and medium-sized businesses experience economic hardship, it could negatively affect the overall demand for our products and services, and could cause our revenue to decline.
We face competition from several companies that may have greater resources than we do, which could result in price reductions, reduced margins or loss of market share.
We compete against numerous companies in the mobile imaging software market. Competition in this market may increase as a result of a number of factors, such as the entrance of new or larger competitors or alternative technologies. These competitors may have greater financial, technical, marketing and public relations resources, larger client bases and greater brand or name recognition. These competitors could, among other things:
|
|
• |
announce new products or technologies that have the potential to replace our existing product offerings; |
|
|
• |
force us to charge lower prices; or |
|
|
• |
adversely affect our relationships with current clients. |
We may be unable to compete successfully against our current and potential competitors and if we lose business to our competitors or are forced to lower our prices, our revenue, operating margins and market share could decline.
7
We must continue to engage in extensive research and development in order to remain competitive.
Our ability to compete effectively with our mobile imaging software products depends upon our ability to meet changing market conditions and develop enhancements to our products on a timely basis in order to maintain our competitive advantage. The markets for products incorporating mobile imaging software technology and products are characterized by rapid advancements in technology and changes in user preferences. Our continued growth will ultimately depend upon our ability to develop additional technologies and attract strategic alliances for related or separate products. There can be no assurance that we will be successful in developing and marketing product enhancements and additional technologies, that we will not experience difficulties that could delay or prevent the successful development, introduction and marketing of these products, or that our new products and product enhancements will adequately meet the requirements of the marketplace, will be of acceptable quality, or will achieve market acceptance.
Our annual and quarterly results have fluctuated greatly in the past and will likely continue to do so, which may cause substantial fluctuations in our common stock price.
Our annual and quarterly operating results have in the past and may in the future fluctuate significantly depending on factors including the timing of customer projects and purchase orders, new product announcements and releases by us and other companies, gain or loss of significant customers, price discounting of our products, the timing of expenditures, customer product delivery requirements, the availability and cost of components or labor, and economic conditions, both generally and in the information technology market. Revenues related to our licenses for mobile imaging software products are required to be recognized upon satisfaction of all applicable revenue recognition criteria. The recognition of future revenues from these licenses is dependent on a number of factors, including, but not limited to, the terms of our license agreements, the timing of implementation of our products by our channel partners and customers and the timing of any re-orders of additional licenses and/or license renewals by our channel partners and customers.
In fiscal years 2016, 2015 and 2014, sales of licenses to channel partners have comprised a significant part of our revenue. This is attributable to the timing of the purchase or renewal of licenses and does not represent a dependence on any single channel partner. If we were to lose a channel partner relationship, we do not believe such a loss would adversely affect our operations because either we or another channel partner could sell our products to the end-users that had purchased products from the channel partner we lost. However, in that case, we or another channel partner must establish a relationship with the end-users, which could take time to develop, if it develops at all.
Any unfavorable change in these or other factors could have a material adverse effect on our operating results for a particular quarter or year, which may cause downward pressure on our common stock price. We expect quarterly and annual fluctuations to continue for the foreseeable future.
Our historical order flow patterns, which we expect to continue, have caused forecasting difficulties for us. If we do not meet our forecasts or analysts’ forecasts for us, the price of our common stock may decline.
Historically, a significant portion of our sales have resulted from shipments during the last few weeks of the quarter from orders received in the final month of the applicable quarter. We do, however, base our expense levels, in significant part, on our expectations of future revenue. As a result, we expect our expense levels to be relatively fixed in the short term. Any concentration of sales at the end of the quarter may limit our ability to plan or adjust operating expenses. Therefore, if anticipated shipments in any quarter do not occur or are delayed, expenditure levels could be disproportionately high as a percentage of sales, and our operating results for that quarter would be adversely affected. As a result, we believe that period-to-period comparisons of our results of operations are not and will not necessarily be meaningful, and you should not rely upon them as an indication of future performance. If our operating results for a quarter are below the expectations of public market analysts and investors, it could have a material adverse effect on the price of our common stock.
Defects or malfunctions in our products could hurt our reputation, sales and profitability.
Our business and the level of customer acceptance of our products depend upon the continuous, effective and reliable operation of our products. Our products are extremely complex and are continually being modified and improved, and as such may contain undetected defects or errors when first introduced or as new versions are released. To the extent that defects or errors cause our products to malfunction and our customers’ use of our products is interrupted, our reputation could suffer and our revenue could decline or be delayed while such defects are remedied. We may also be subject to liability for the defects and malfunctions of third party technology partners and others with whom our products and services are integrated.
8
In addition, our products are typically intended for use in applications that are critical to a customer’s business. As a result, we believe that our customers and potential customers have a greater sensitivity to product defects than the market for software products in general. There can be no assurance that, despite our testing, errors will not be found in new products or releases after commencement of commercial shipments, resulting in loss of revenues or delay in market acceptance, diversion of development resources, damage to our reputation, adverse litigation, or increased service and warranty costs, any of which would have a material adverse effect upon our business, operating results and financial condition.
Entry into new lines of business, and our offering of new products and services, resulting from our acquisition of IDchecker may result in exposure to new risks.
IDchecker operates primarily in the areas of cloud based identity document verification and facial recognition solutions. We have not previously conducted business in facial recognition solutions. New lines of business, products or services could have a significant impact on the effectiveness of our system of internal controls and could reduce our revenues and potentially generate losses. New products and services, or entrance into new markets, may require substantial time, resources and capital, and profitability targets may not be achieved. Entry into new markets entails inherent risks associated with our inexperience, which may result in costly decisions that could harm our profit and operating results. There are material inherent risks and uncertainties associated with offering new products and services, especially when new markets are not fully developed or when the laws and regulations regarding a new product are not mature. Factors outside of our control, such as developing laws and regulations, regulatory orders, competitive product offerings and changes in commercial and consumer demand for products or services may also materially impact the successful implementation of new products or services. Failure to manage these risks, or failure of any product or service offerings to be successful and profitable, could have a material adverse effect on our financial condition and results of operations.
We face risks related to the storage of our customers’ and their end users’ confidential and proprietary information.
Our products are designed to maintain the confidentiality and security of our customers’ and their end users’ confidential and proprietary information that is stored on our systems, which may include sensitive financial data. However, any accidental or willful security breaches or other unauthorized access to this data could expose us to liability for the loss of such information, time-consuming and expensive litigation and other possible liabilities as well as negative publicity. Techniques used to obtain unauthorized access or to sabotage systems change frequently and generally are difficult to recognize and react to. We may be unable to anticipate these techniques or implement adequate preventative or reactionary measures.
Risks Related to Our Intellectual Property
If the patents we own or license, or our other intellectual property rights, do not adequately protect our technologies, we may lose market share to our competitors and be unable to operate our business profitably.
Our success depends significantly on our ability to protect our rights to the technologies used in our products, including Mobile Deposit®. We rely on trademark, trade secret, copyright and patent law, as well as a combination of non-disclosure, confidentiality and other contractual arrangements to protect our technology and rights. However, these legal means afford only limited protection and may not adequately protect our rights or permit us to gain or maintain any competitive advantage. In addition, we cannot be assured that any of our pending patent applications will result in the issuance of a patent. The Patent and Trademark Office (“PTO”) may deny or require significant narrowing of claims in our pending patent applications, and patents issued as a result of the pending patent applications, if any, may not provide us with significant commercial protection or may not be issued in a form that is advantageous to us. We could also incur substantial costs in proceedings before the PTO. Our issued and licensed patents and those that may be issued or licensed in the future may expire or may be challenged, invalidated or circumvented, which could limit our ability to stop competitors from marketing related technologies. Additionally, upon expiration of our issued or licensed patents, we may lose some of our rights to exclude others from making, using, selling or importing products using the technology based on the expired patents. We also must rely on contractual provisions with the third parties that license technology to us and that obligate these third parties to protect our rights in the technology licensed to us. There is no guarantee that these third parties would be successful in attempting to protect our rights in any such licensed technology. There is no assurance that competitors will not be able to design around our patents or other intellectual property or any intellectual property or technology licensed to us. We also rely on unpatented proprietary technology. We cannot assure you that we can meaningfully protect all our rights in our unpatented proprietary technology or that others will not independently develop substantially equivalent proprietary products or processes or otherwise gain access to our unpatented proprietary technology.
9
We seek to protect our know-how and other unpatented proprietary technology with confidentiality agreements and intellectual property assignment agreements with our employees, consultants, partners, and customers. However, such agreements may not be enforceable or may not provide meaningful protection for our proprietary information in the event of unauthorized use or disclosure or other breaches of the agreements or in the event that our competitors discover or independently develop similar or identical designs or other proprietary information. In addition, we rely on the use of registered and common law trademarks with respect to the brand names of some of our products. Common law trademarks provide less protection than registered trademarks. Loss of rights in our trademarks could adversely affect our business, financial condition and results of operations.
Furthermore, the laws of foreign countries may not protect our intellectual property rights to the same extent as the laws of the U.S. If we fail to apply for intellectual property protection or if we cannot adequately protect our intellectual property rights in these foreign countries, our competitors may be able to compete more effectively against us, which could adversely affect our competitive position, as well as our business, financial condition and results of operations.
Claims that we infringe upon the rights, or have otherwise utilized proprietary information, of third parties may give rise to costly and lengthy litigation, and we could be prevented from selling products, forced to pay damages, and defend against litigation.
In the past, third parties have asserted claims that certain technologies incorporated in our products infringe on their patent rights. Although we have resolved past claims that we have infringed on third party patents, there can be no assurance that we will not receive notices in the future from parties asserting, directly or indirectly through our customers, that our products infringe, or may infringe, on their intellectual property rights, or otherwise utilize their proprietary information. (See also Item 3—Legal Proceedings) If our technology and products are found to infringe upon or otherwise utilize the proprietary rights of other parties, we could incur substantial costs and we may have to:
|
|
• |
obtain licenses, which may not be available on commercially reasonable terms, if at all, and may be non-exclusive, thereby giving our competitors access to the same intellectual property licensed to us; |
|
|
• |
expend significant resources to redesign our products or technology to avoid infringement; |
|
|
• |
discontinue the use and sale of infringing products; |
|
|
• |
pay substantial damages; and |
|
|
• |
defend litigation or administrative proceedings which may be costly whether we win or lose, and which could result in a substantial diversion of our valuable management resources and limit our exclusive rights to the technology we have developed. |
Furthermore, we may initiate claims or litigation against parties for infringement of our proprietary rights or to establish the validity of our proprietary rights. Litigation, either as plaintiff or defendant, could result in significant expense to us, whether or not such litigation is resolved in our favor. Even if we were to prevail, any litigation could be costly and time-consuming and would divert the attention of our management and key personnel from our business operations. As a result of a patent infringement or other intellectual property suit brought against us or our channel partners or licensees, we or our channel partners or licensees may be forced to stop or delay developing, manufacturing or selling technologies or potential products that are claimed to infringe on a third party’s intellectual property rights unless that party grants us or our channel partners or licensees rights to use its intellectual property. Ultimately, we may be unable to develop some of our technologies or potential products or may have to discontinue development of a product candidate or cease some of our business operations as a result of patent infringement or other intellectual property claims, which could severely harm our business.
Risks Related to our Operations
If we are unable to retain and recruit qualified personnel, or if any of our key executives or key employees discontinues his or her employment with us, it may have a material adverse effect on our business.
We are highly dependent on the key members of our management team and other key technical personnel. If we were to lose the services of one or more of our key personnel, or if we failed to attract and retain additional qualified personnel, it could materially and adversely affect our customer relationships, competitive position and revenues. Furthermore, recruiting and retaining qualified highly skilled engineers involved in the ongoing developments required to refine our technologies and introduce future applications is critical to our success. We may be unable to attract, assimilate and retain qualified personnel on acceptable terms given the competition within the high technology industry. We do not have any employment agreements providing for a specific term of employment with any member of our senior management. We do not maintain “key man” insurance policies on any of our officers or employees.
10
We plan to grant stock options or other forms of equity awards in the future as a method of attracting and retaining employees, motivating performance and aligning the interests of employees with those of our stockholders. As of September 30, 2016, we had 2,170,549 shares of common stock available for issuance pursuant to future grants of equity awards under our existing equity compensation plans, which may limit our ability to provide equity incentive awards to existing and future employees. If we are unable to adopt, implement and maintain equity compensation arrangements that provide sufficient incentives, we may be unable to retain our existing employees and attract additional qualified candidates. If we are unable to retain our existing employees, including qualified technical personnel, and attract additional qualified candidates, our business and results of operations could be adversely affected.
Legislation and governmental regulations enacted in the U.S. and other countries that apply to us or to our customers may require us to change our current products and services and/or result in additional expenses, which could adversely affect our business and results of operations.
Legislation and governmental regulations including changes in legislation and governmental regulations impacting financial institutions, insurance companies and mobile device companies, affect how our business is conducted. Globally, legislation and governmental regulations also influence our current and prospective customers’ activities, as well as their expectations and needs in relation to our products and services. Compliance with these laws and regulations may be onerous and expensive, and may be inconsistent from jurisdiction to jurisdiction, further increasing the cost of compliance. Any such increase in costs as a result of changes in these laws and regulations or in their interpretation could individually or in the aggregate make our products and services less attractive to our customers, delay the introduction of new products in one or more regions, cause us to change or limit our business practices or affect our financial condition and operating results.
We expect to incur substantial expenses related to the integration of IDchecker.
We expect to incur substantial expenses in connection with the integration of the business, policies, procedures, operations, technologies and systems of IDchecker. There are a large number of systems and functions that must be integrated, including, but not limited to, management information, accounting and finance, billing, payroll and benefits and regulatory compliance. In addition, acquisitions of foreign entities, such as IDchecker, are particularly challenging because their prior practices may not meet the requirements of the Sarbanes-Oxley and/or accounting principles generally accepted in the U.S. (“GAAP”). While we have assumed that a certain level of expenses would be incurred, there are a number of factors beyond our control that could affect the total amount or the timing of all of the expected integration expenses. Moreover, many of the expenses that will be incurred, by their nature, are difficult to estimate accurately at the present time.
We may be unable to successfully integrate our business with the business of IDchecker and realize the anticipated benefits of the acquisition.
Our management has limited integration experience and will be required to devote significant attention and resources to integrating our business practices and operations with that of IDchecker. In particular, the acquisition of IDchecker involves the combination of two companies that previously operated as independent companies in different countries. Potential difficulties we may encounter as part of the integration process include, but are not limited to, the following:
|
|
• |
complexities associated with managing our business and the business of IDchecker following the completion of the acquisition, including the challenge of integrating complex systems, technology, networks and other assets of each of the companies in a seamless manner that minimizes any adverse impact on customers, suppliers, employees and other constituencies; |
|
|
• |
integrating the workforces of the companies while maintaining focus on providing consistent, high quality customer service; and |
|
|
• |
potential unknown liabilities and unforeseen increased expenses or delays associated with the acquisition, including costs to integrate the companies that may exceed anticipated costs. |
Any of the potential difficulties listed above could adversely affect our ability to maintain relationships with customers, suppliers, employees and other constituencies or our ability to achieve the anticipated benefits of the acquisition or otherwise adversely affect our business and financial results.
11
Our actual financial and operating results following the acquisition of IDchecker could differ materially from any expectations or guidance provided by us concerning our future financial and operating results.
The combined company resulting from the acquisition of IDchecker may not perform as we or the market expects. Expectations regarding IDchecker’s impact on our financial and operating results are subject to numerous assumptions, including assumptions derived from our diligence efforts concerning the status of and prospects for the business of IDchecker and assumptions relating to the near-term prospects for our industry generally and the market for the products of IDchecker in particular. Additional assumptions that we have made relate to numerous matters, including, without limitation, the following:
|
|
• |
projections of future revenues; |
|
|
• |
anticipated financial performance of products and products currently in development; |
|
|
• |
our expected capital structure after the acquisition, including after the distribution of any earnout-shares that may (under certain circumstances) become payable to the former shareholders of IDchecker; |
|
|
• |
our ability to maintain, develop and deepen relationships with the customers of IDchecker; and |
|
|
• |
other financial and strategic risks of the acquisition. |
We cannot provide any assurances with respect to the accuracy of our assumptions, including our assumptions with respect to future revenues or revenue growth rates, if any, of IDchecker. Risks and uncertainties that could cause our actual results to differ materially from currently anticipated results include, but are not limited to, risks relating to our ability to realize incremental revenues from the acquisition in the amounts that we currently anticipate; risks relating to the willingness of customers and other partners of IDchecker to continue to conduct business with the combined company; and numerous risks and uncertainties that affect our industry generally and the markets for our products and those of IDchecker, specifically. Any failure to realize the financial benefits we currently anticipate from the acquisition would have a material adverse impact on our future operating results and financial condition and could materially and adversely affect the trading price or trading volume of our common stock.
Due to our operations in non-U.S. markets, we are subject to certain risks that could adversely affect our business, results of operations or financial condition.
IDchecker generates revenue in markets outside of the U.S. The risks inherent in global operations include:
|
|
• |
lack of familiarity with, and unexpected changes in, foreign laws and legal standards, including employment laws, and privacy laws, which may vary widely across the countries in which we sell our products; |
|
|
• |
increased expense to comply with U.S. laws that apply to foreign corporations, including the Foreign Corrupt Practices Act; |
|
|
• |
compliance with, and potentially adverse tax consequences of, foreign tax regimes; |
|
|
• |
fluctuations in currency exchange rates, currency exchange controls, price controls and limitations on repatriation of earnings; |
|
|
• |
local economic conditions; |
|
|
• |
increased expense related to localization of products and development of foreign language marketing and sales materials; |
|
|
• |
longer accounts receivable payment cycles and difficulty in collecting accounts receivable in foreign countries; |
|
|
• |
increased financial accounting and reporting burdens and complexities; |
|
|
• |
restrictive employment regulations; |
|
|
• |
difficulties and increased expense in implementing corporate policies and controls; |
|
|
• |
international intellectual property laws, which may be more restrictive or may offer lower levels of protection than U.S. law; |
|
|
• |
compliance with differing and changing local laws and regulations in multiple international locations, including regional data privacy laws, as well as compliance with U.S. laws and regulations where applicable in these international locations; and |
|
|
• |
limitations on our ability to enforce legal rights and remedies. |
12
If we are unable to successfully manage these and other risks associated with managing and expanding our international business, the risks could have a material adverse effect on our business, results of operations or financial condition. Further, operating in international markets requires significant management attention and financial resources. Due to the additional uncertainties and risks of doing business in foreign jurisdictions, international acquisitions tend to entail risks and require additional oversight and management attention that are typically not attendant to acquisitions made within the U.S. We cannot be certain that the investment and additional resources required to establish, acquire or integrate operations in other countries will produce desired levels of revenue or profitability.
Our international operations may increase our exposure to potential liability under anti-corruption, trade protection, tax and other laws and regulations.
The Foreign Corrupt Practices Act and other anti-corruption laws and regulations (“Anti-Corruption Laws”) prohibit corrupt payments by our employees, vendors or agents. From time to time, we may receive inquiries from authorities in the U.S. and elsewhere about our business activities outside of the U.S. and our compliance with Anti-Corruption Laws. While we have implemented policies, training and internal controls designed to reduce the risk of corrupt payments, our employees, vendors or agents may violate our policies. Our acquisition of IDchecker may significantly increase our exposure to potential liability under Anti-Corruption Laws. IDchecker was not historically subject to the Foreign Corrupt Practices Act, Sarbanes-Oxley, or other laws, to which we are subject, and we may become subject to liability if in the past, IDchecker’s operations did not comply with such laws.
Our failure to comply with Anti-Corruption Laws could result in significant fines and penalties, criminal sanctions against us, our officers or our employees, prohibitions on the conduct of our business, and damage to our reputation. Operations outside of the U.S. may be affected by changes in trade protection laws, policies and measures, and other regulatory requirements affecting trade and investment.
Due to our international operations, we are subject to certain foreign tax regulations. Such regulations may not be clear, not consistently applied and subject to sudden change, particularly with regard to international transfer pricing. Our earnings could be reduced by the uncertain and changing nature of such tax regulations.
Fluctuations in foreign currency exchange and interest rates could adversely affect our results of operations.
Our business is generally conducted in U.S. dollars. However, the costs of operating in the Netherlands and other European markets are subject to the effects of exchange fluctuations of the Euro against the U.S. dollar. When the U.S. dollar weakens against the Euro, our operating costs denominated in such currency will increase. Fluctuations in the value of the Euro against the U.S. dollar will create greater uncertainty in our revenues and can adversely affect our operating results.
Compliance with changing regulations concerning corporate governance and public disclosure may result in additional expenses.
In recent years, there have been several changes in laws, rules, regulations and standards relating to corporate governance and public disclosure, including the Dodd-Frank Wall Street Reform and Consumer Protection Act (the “Dodd-Frank Act”), the Sarbanes-Oxley Act of 2002 (“Sarbanes-Oxley”) and various other new regulations promulgated by the SEC and rules promulgated by the national securities exchanges.
The Dodd-Frank Act, enacted in July 2010, expands federal regulation of corporate governance matters and imposes requirements on publicly-held companies, including us, to, among other things, provide stockholders with a periodic advisory vote on executive compensation and also adds compensation committee reforms and enhanced pay-for-performance disclosures. While some provisions of the Dodd-Frank Act were effective upon enactment, others will be implemented upon the SEC’s adoption of related rules and regulations. The scope and timing of the adoption of such rules and regulations is uncertain and accordingly, the cost of compliance with the Dodd-Frank Act is also uncertain.
13
In addition, Sarbanes-Oxley specifically requires, among other things, that we maintain effective internal control over financial reporting and disclosure of controls and procedures. In particular, we must perform system and process evaluation and testing of our internal control over financial reporting to allow management to report on the effectiveness of our internal control over financial reporting, as required by Section 404 of Sarbanes-Oxley Act (“Section 404”), and our independent registered public accounting firm is required to attest to our internal control over financial reporting. Our testing, or the subsequent testing by our independent registered public accounting firm may reveal deficiencies in our internal control over financial reporting that are deemed to be material weaknesses. Our compliance with Section 404 will require that we incur substantial accounting expenses and expend significant management efforts. We currently have limited internal audit capabilities and will need to hire additional accounting and financial staff with appropriate public company experience and technical accounting knowledge. Moreover, if we are not able to comply with the requirements of Section 404 in a timely manner, or if we or our independent registered public accounting firm identifies deficiencies in our internal control over financial reporting that are deemed to be material weaknesses, the market price of our stock could decline, and we could be subject to sanctions or investigations by the SEC or other regulatory authorities, which would require additional financial and management resources.
These and other new or changed laws, rules, regulations and standards are, or will be, subject to varying interpretations in many cases due to their lack of specificity. As a result, their application in practice may evolve over time as new guidance is provided by regulatory and governing bodies, which could result in continuing uncertainty regarding compliance matters and higher costs necessitated by ongoing revisions to disclosure and governance practices. Our efforts to comply with evolving laws, regulations and standards are likely to continue to result in increased general and administrative expenses and a diversion of management time and attention from revenue-generating activities to compliance activities. Further, compliance with new and existing laws, rules, regulations and standards may make it more difficult and expensive for us to maintain director and officer liability insurance, and we may be required to accept reduced coverage or incur substantially higher costs to obtain coverage. Members of our board of directors and our principal executive officer and principal financial officer could face an increased risk of personal liability in connection with the performance of their duties. As a result, we may have difficulty attracting and retaining qualified directors and executive officers, which could harm our business. We continually evaluate and monitor regulatory developments and cannot estimate the timing or magnitude of additional costs we may incur as a result.
Our restated certificate of incorporation and second amended and restated bylaws provide for indemnification of officers and directors at our expense and limits their liability, which may result in a major cost to us and hurt the interests of our stockholders because corporate resources may be expended for the benefit of officers and/or directors.
Pursuant to our restated certificate of incorporation and second amended and restated bylaws and as authorized under applicable Delaware law, our directors and officers are not liable for monetary damages for breach of fiduciary duty, except for liability (i) for any breach of the director’s duty of loyalty to the corporation or its stockholders; (ii) for acts or omissions not in good faith or that involve intentional misconduct or a knowing violation of law; (iii) under Section 174 of the Delaware General Corporation Law (the “DGCL”); or (iv) for any transaction from which the director derived an improper personal benefit.
We have entered into a separate Indemnification Agreement (the “Indemnification Agreement”) with each of our directors. Under the Indemnification Agreement, each director is entitled to be indemnified against all expenses, judgments, penalties, fines and amounts paid in settlement actually and reasonably incurred by or on behalf of such director in connection with any claims, proceedings or other actions brought against such director as a result of the director’s service to us, provided that the director (i) acted in good faith; (ii) reasonably believed the action was in our best interest; and (iii) in criminal proceedings, reasonably believed the conduct was not unlawful. Additionally, the Indemnification Agreement entitles each director to contribution of expenses from us in any proceeding in which we are jointly liable with such director, but for which indemnification is not otherwise available. The Indemnification Agreement also entitles each director to advancement of expenses incurred by such director in connection with any claim, proceeding or other action in advance of the final adjudication of any such claim, proceeding or other action, provided the director agrees to reimburse us for all such advances if it shall ultimately be determined that the director is not entitled to indemnification.
The foregoing limitations of liability and provisions for expenses may result in a major cost to us and hurt the interests of our stockholders because corporate resources may be expended for the benefit of officers and/or directors.
14
From time-to-time our board of directors explores and considers strategic alternatives, including financings, strategic alliances, acquisitions, or the possible sale of the Company. Our board of directors may not be able to identify or complete any suitable strategic alternatives and any such alternatives that are completed could have an impact on our operations or stock price.
From time-to-time our board of directors explores and considers potential strategic alternatives that may be available to us, including financings, strategic alliances, acquisitions, or the possible sale of the Company. We currently have no agreements or commitments to engage in any specific strategic transactions, and we cannot assure you that our exploration of various strategic alternatives will result in any specific action or transaction. If we determine to engage in a strategic transaction, we cannot predict the impact that such strategic transaction might have on our operations or stock price. We do not intend to provide updates or make further comments regarding the evaluation of strategic alternatives, unless otherwise required by law.
Risks Related to Our Common Stock
Concentration of ownership among our existing directors and executive officers may limit an investor’s ability to influence significant corporate decisions.
As of September 30, 2016: (i) our President, CEO and Chairman of our board of directors beneficially owned approximately 4.3% of our outstanding common stock; and (ii) our directors and executive officers as a group beneficially owned approximately 7.2% of our outstanding common stock. Subject to any fiduciary duties owed to our other stockholders under Delaware law, these stockholders may be able to exercise significant influence over matters requiring stockholder approval, including the election of directors and approval of significant corporate transactions, and will have some control over our management and policies. Some of these persons may have interests that are different from yours. For example, these stockholders may support proposals and actions with which you may disagree. The concentration of ownership could delay or prevent a change in control of the Company or otherwise discourage a potential acquirer from attempting to obtain control of the Company, which in turn could reduce the price of our stock. In addition, these stockholders could use their voting influence to maintain our existing management and directors in office, delay or prevent changes in control of the Company, or support or reject other management and board proposals that are subject to stockholder approval, such as amendments to our employee stock plans and approvals of significant financing transactions.
Future sales of our common stock by our insiders may cause our stock price to decline.
A significant portion of our outstanding shares are held by directors and executive officers. Resales of a substantial number of shares of our stock by these stockholders, announcements of the proposed resale of substantial amounts of our stock, or the perception that substantial resales may be made by such stockholders could adversely impact the market price of our stock. Some of our directors and executive officers have entered into Rule 10b5-1 trading plans pursuant to which they have arranged to sell shares of our stock from time to time in the future. Actual or potential sales by these insiders, including those under a pre-arranged Rule 10b5-1 trading plan, could be interpreted by the market as an indication that the insider has lost confidence in our stock and adversely impact the market price of our stock.
We have registered and expect to continue to register shares reserved under our equity plans under a registration statement on Form S-8. All shares issued pursuant to a registration statement on Form S-8 can be freely sold in the public market upon issuance, subject to restrictions on our affiliates under Rule 144 of the Securities Act. If a large number of these shares are sold in the public market, the sales could adversely impact the trading price of our stock.
Future sales of our common stock could cause the market price of our common stock to decline.
We cannot predict the effect, if any, that market sales of shares of our common stock or the availability of shares of our common stock for sale will have on the market price of our common stock prevailing from time to time. Although we currently do not have an effective universal shelf registration statement on file with the SEC, we have in the past and may in the future file such registration statements providing for the potential issuance of shares of our common stock and other securities. Sales of substantial amounts of shares of our common stock or other securities in the public market, or the perception that those sales could occur, may cause the market price of our common stock to decline. In addition, any such decline may make it more difficult for you to sell shares of our common stock at prices you may deem acceptable.
Our corporate documents and Delaware law contain provisions that could discourage, delay or prevent a change in control of our company, prevent attempts to replace or remove current management and reduce the market price of our stock.
Provisions in our restated certificate of incorporation and second amended and restated bylaws may discourage, delay or prevent a merger or acquisition involving us that our stockholders may consider favorable. For example, our restated certificate of incorporation authorizes our board of directors to issue up to one million shares of “blank check” preferred stock. As a result, without further stockholder approval, the board of directors has the authority to attach special rights, including voting and dividend rights, to this preferred stock. With these rights, preferred stockholders could make it more difficult for a third party to acquire us.
15
We are also subject to the anti-takeover provisions of the DGCL. Under these provisions, if anyone becomes an “interested stockholder,” we may not enter into a “business combination” with that person for three years without special approval, which could discourage a third party from making a takeover offer and could delay or prevent a change in control of us. An “interested stockholder” is, generally, a stockholder who owns 15% or more of our outstanding voting stock or an affiliate of ours who has owned 15% or more of our outstanding voting stock during the past three years, subject to certain exceptions as described in the DGCL.
The market price of our common stock has been volatile and your investment in our stock could suffer a decline in value.
The market price of our common stock has experienced significant price and volume fluctuations. For example, during the three year period ended September 30, 2016, the closing price of our common stock ranged from $1.91 to $9.28. In addition, the stock market has from time to time experienced significant price and volume fluctuations that have particularly affected the market prices for the common stock of technology companies and that have often been unrelated to the operating performance of particular companies. These broad market fluctuations may adversely affect the market price of our common stock. You may not be able to resell your shares at or above the price you paid for them due to fluctuations in the market price of our stock caused by changes in our operating performance or prospects and other factors.
Some specific factors, in addition to the other risk factors identified above, that may have a significant effect on the price of our stock, many of which we cannot control, include but are not limited to:
|
|
• |
our announcements or our competitors’ announcements of technological innovations; |
|
|
• |
quarterly variations in operating results; |
|
|
• |
changes in our product pricing policies or those of our competitors; |
|
|
• |
claims of infringement of intellectual property rights or other litigation; |
|
|
• |
the public’s reaction to our press releases, our other public announcements and our filings with the SEC; |
|
|
• |
changes in accounting standards, policies, guidance, interpretations or principles; |
|
|
• |
changes in our growth rate or our competitors’ growth rates; |
|
|
• |
developments regarding our patents or proprietary rights or those of our competitors; |
|
|
• |
our inability to raise additional capital as needed; |
|
|
• |
changes in financial markets or general economic conditions; |
|
|
• |
sales of stock by us or members of our management team or board of directors; and |
|
|
• |
changes in stock market analyst recommendations or earnings estimates regarding our stock, other comparable companies or our industry generally. |
Because we do not intend to pay dividends, our stockholders will benefit from an investment in our common stock only if our stock price appreciates in value.
We have never declared or paid a dividend on our common stock. We currently intend to retain our future earnings, if any, for use in the operation and expansion of our business and do not expect to pay any dividends in the foreseeable future. As a result, the success of an investment in our common stock will depend entirely upon any future appreciation in its value. There is no guarantee that our common stock will appreciate in value or even maintain the price at which it was purchased.
None.
Our principal executive offices, as well as our research and development facility, are located in approximately 28,354 square feet of office space in San Diego, California. The term of the lease for our offices continues through April 30, 2020. The annual base rent under the lease is approximately $0.6 million per year. IDchecker offices are located in Haarlem, The Netherlands. The term of the lease for the office continues through May 31, 2020. The annual base rent under the lease is approximately €48,000 per year. We have a sales office in London, UK. The term of this lease continues through May 31, 2017. The annual base rent under this lease is approximately £65,000 per year.
16
We believe our existing properties are in good condition and are sufficient and suitable for the conduct of our business.
Rothschild Mobile Imaging Innovations, Inc.
On May 16, 2014, Rothschild Mobile Imaging Innovations, Inc. (“RMII”) filed a complaint against us in the U.S. District Court for the District of Delaware alleging that certain of our mobile imaging products infringe four RMII-owned patents related to mobile imaging technology. On June 1, 2014, RMII amended its complaint to add JPMorgan Chase & Co. and JPMorgan Chase Bank, N.A. (together, “Chase”), one of our customers, as a defendant in the lawsuit (as amended, the “Initial Lawsuit”). On September 8, 2014, RMII filed three additional complaints (the “Subsequent Lawsuits”) against us in the U.S. District Court for the District of Delaware. The Subsequent Lawsuits contain allegations substantially similar to the Initial Lawsuit regarding infringement by our mobile imaging products of the four RMII-owned patents related to mobile imaging technology, but name as co-defendants Citibank, N.A., Citigroup Inc., Wells Fargo & Company, Wells Fargo Bank, N.A., Bank of America Corporation and Bank of America, N.A., respectively (together with Chase, the “Bank Defendants”). RMII subsequently filed amended complaints (together with the Initial Lawsuit and the Subsequent Lawsuits, the “RMII Lawsuits”) adding as defendants both Fiserv and NCR (the “Distributor Defendants”), each of whom distributes our mobile imaging technology to one or more of the Bank Defendants. Based on our understanding of the claims, we agreed to accept the demands for indemnity and defense tendered by each of the Bank Defendants and Distributor Defendants in connection with the RMII Lawsuits. We are currently controlling the defense of such claims and have taken actions to defend the RMII Lawsuits, as more fully described herein.
On November 10, 2014, we filed a motion to sever and stay the claims against Chase in the Initial Lawsuit pending resolution of RMII’s claims against us, which motion was granted on August 3, 2015. On November 19, 2014, we filed joinders to the motion to stay with respect to the Subsequent Lawsuits, which joinders were also granted on August 3, 2015. Additionally, the Patent Trial and Appeal Board (“PTAB”) of the Patent and Trademark Office instituted our petitions for Inter Partes Review (“IPR”) challenging the patentability of all four asserted patents, and the Court agreed to stay the litigation in its entirety until all of the decisions are rendered in the IPR proceedings.
On July 20, 2016, the PTAB entered its final decision in the IPR proceedings. The PTAB ruled that all claims asserted in the litigation in all four RMII patents were directed to unpatentable subject matter and thus not patent eligible. On September 16, 2016, the parties filed a joint status report notifying the Court of the PTAB’s decisions in the IPRs. Through that notice, Mitek requested that the Court enter a judgment of non-infringement, or, in the alternative, dismiss all of RMII’s claims against all defendants with prejudice. On September 16, 2016, RMII filed a motion to dismiss without prejudice.
We do not believe that the results of the RMII Lawsuits will have a material adverse effect on our financial condition or results of operations.
Other Legal Matters
In addition to the foregoing, we are subject to various claims and legal proceedings arising in the ordinary course of our business. While any legal proceeding has an element of uncertainty, we believe that the disposition of such matters, in the aggregate, will not have a material effect on our financial condition or results of operations.
None.
17
|
ITEM 5. |
MARKET FOR REGISTRANT’S COMMON EQUITY, RELATED STOCKHOLDER MATTERS AND ISSUER PURCHASES OF EQUITY SECURITIES. |
Market Information
Our common stock trades on the NASDAQ Capital Market under the ticker symbol “MITK.” The closing sales price of our common stock on November 30, 2016 was $5.60.
The following table sets forth, for the fiscal period indicated, the high and low closing sales prices per share of our common stock as reported on the NASDAQ Capital Market.
|
|
|
High |
|
|
Low |
|
||
|
FISCAL YEAR ENDED SEPTEMBER 30, 2016 |
|
|
|
|
|
|
|
|
|
Fourth Quarter |
|
$ |
8.50 |
|
|
$ |
7.07 |
|
|
Third Quarter |
|
|
9.28 |
|
|
|
5.62 |
|
|
Second Quarter |
|
|
6.54 |
|
|
|
4.10 |
|
|
First Quarter |
|
|
5.28 |
|
|
|
3.07 |
|
|
FISCAL YEAR ENDED SEPTEMBER 30, 2015 |
|
|
|
|
|
|
|
|
|
Fourth Quarter |
|
$ |
3.98 |
|
|
$ |
3.15 |
|
|
Third Quarter |
|
|
3.99 |
|
|
|
3.03 |
|
|
Second Quarter |
|
|
3.85 |
|
|
|
2.75 |
|
|
First Quarter |
|
|
3.96 |
|
|
|
1.91 |
|
Holders
As of November 30, 2016, there were 315 shareholders of record of our common stock and an undetermined number of beneficial owners.
Dividends
We have not paid any dividends on our common stock. We currently intend to retain earnings for use in our business and do not anticipate paying cash dividends in the foreseeable future.
Securities Authorized for Issuance Under Equity Compensation Plans
The information required by Item 201(d) of Regulation S-K is incorporated by reference to our definitive proxy statement filed in connection with our 2017 Annual Meeting of Stockholders or an amendment to this Form 10-K to be filed with the SEC within 120 days after the close of our fiscal year ended September 30, 2016.
Sales of Equity Securities During the Period
All equity securities that we sold during the period covered by this Form 10-K that were not registered under the Securities Act have been previously reported in our quarterly reports on Form 10-Q or on our current reports on Form 8-K.
18
The following information shall not be deemed to be “filed” with the SEC nor shall such information be incorporated by reference into any future filing under the Securities Act or the Exchange Act, except to the extent that we specifically incorporate it by reference into such future filing.
The following graph and table compare the cumulative total stockholder return data for our common stock from September 30, 2011 through September 30, 2016 to the cumulative return over such period of (i) a broad market index, the NASDAQ Composite Index and (ii) an industry index, the NASDAQ-100 Technology Sector Index. The graph and table assume that $100 was invested in our common stock at $9.25 per share on September 30, 2011, and in each of the referenced indices, and assumes reinvestment of all dividends. The stock price performance on the following graph and table is not necessarily indicative of future stock price performance.
Comparison of 5 Year Cumulative Total Return
Among Mitek Systems, Inc., the NASDAQ Composite Index and the NASDAQ-100 Technology Sector Index
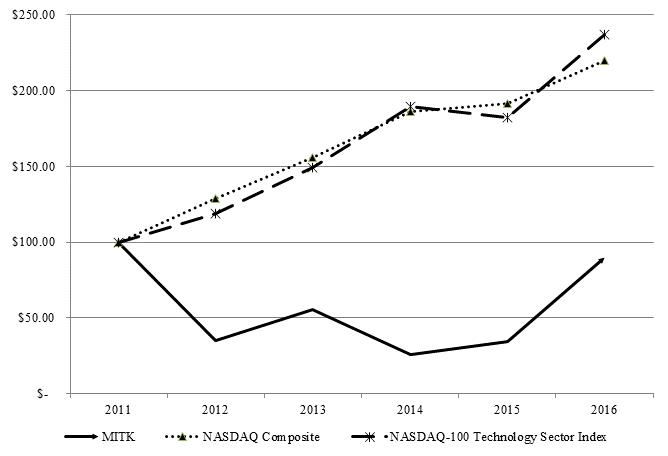
The graph above reflects the following values:
|
|
|
2011 |
|
|
2012 |
|
|
2013 |
|
|
2014 |
|
|
2015 |
|
|
2016 |
|
||||||
|
MITK |
|
$ |
100.00 |
|
|
$ |
34.92 |
|
|
$ |
55.78 |
|
|
$ |
26.05 |
|
|
$ |
34.49 |
|
|
$ |
89.62 |
|
|
NASDAQ Composite |
|
$ |
100.00 |
|
|
$ |
129.03 |
|
|
$ |
156.14 |
|
|
$ |
186.03 |
|
|
$ |
191.28 |
|
|
$ |
219.92 |
|
|
NASDAQ-100 Technology Sector Index |
|
$ |
100.00 |
|
|
$ |
118.83 |
|
|
$ |
149.46 |
|
|
$ |
189.30 |
|
|
$ |
182.30 |
|
|
$ |
236.97 |
|
19
The following selected financial data has been derived from our audited financial statements. This data should be read in conjunction with Item 7— “Management’s Discussion and Analysis of Financial Condition and Results of Operations” and our financial statements and related notes thereto included elsewhere in this Form 10-K. Our historical results are not necessarily indicative of operating results to be expected in the future.
Selected Financial Data
(In Thousands, Except Per Share Data)
|
|
|
Year Ended September 30, |
|
|||||||||||||||||
|
|
|
2016 |
|
|
2015 |
|
|
2014 |
|
|
2013 |
|
|
2012 |
|
|||||
|
Income Statement Data |
|
|
|
|
|
|
|
|
|
|
|
|
|
|
|
|
|
|
|
|
|
Revenue |
|
$ |
34,701 |
|
|
$ |
25,367 |
|
|
$ |
19,150 |
|
|
$ |
14,803 |
|
|
$ |
9,093 |
|
|
Operating income (loss) |
|
$ |
1,824 |
|
|
$ |
1,892 |
|
|
$ |
(5,408 |
) |
|
$ |
(7,300 |
) |
|
$ |
(7,881 |
) |
|
Net income (loss) |
|
$ |
1,959 |
|
|
$ |
2,526 |
|
|
$ |
(5,292 |
) |
|
$ |
(7,276 |
) |
|
$ |
(7,840 |
) |
|
Net income (loss) per share—basic |
|
$ |
0.06 |
|
|
$ |
0.08 |
|
|
$ |
(0.17 |
) |
|
$ |
(0.26 |
) |
|
$ |
(0.31 |
) |
|
Net income (loss) per share—diluted |
|
$ |
0.06 |
|
|
$ |
0.08 |
|
|
$ |
(0.17 |
) |
|
$ |
(0.26 |
) |
|
$ |
(0.31 |
) |
|
Balance Sheet Data |
|
|
|
|
|
|
|
|
|
|
|
|
|
|
|
|
|
|
|
|
|
Working capital |
|
$ |
31,980 |
|
|
$ |
24,005 |
|
|
$ |
21,484 |
|
|
$ |
25,363 |
|
|
$ |
11,001 |
|
|
Total assets |
|
$ |
48,385 |
|
|
$ |
38,746 |
|
|
$ |
31,103 |
|
|
$ |
32,853 |
|
|
$ |
16,723 |
|
|
Stockholders’ equity |
|
$ |
39,485 |
|
|
$ |
30,433 |
|
|
$ |
23,942 |
|
|
$ |
25,729 |
|
|
$ |
13,557 |
|
20
You should read this discussion together with the financial statements, related notes and other financial information included in this Form 10-K. The following discussion may contain predictions, estimates and other forward-looking statements that involve a number of risks and uncertainties, including those discussed under Item 1A—“Risk Factors” and elsewhere in this Form 10-K. These risks could cause our actual results to differ materially from any future performance suggested below. Please see “Important Note About Forward–Looking Statements” at the beginning of this Form 10-K.
Overview
Mitek Systems, Inc. develops, markets and sells proprietary mobile capture and identity verification software solutions for enterprise customers.
Our mobile capture and identify verification technologies are embedded into the mobile applications of leading brands across the globe to improve usability while minimizing risk. They serve the needs of any regulated business that has obligations to know their customers.
By licensing our proprietary technology, enterprise customers improve customer acquisition and other key objectives including securing high risk transactions, verification for age sensitive and age-restricted commerce, and meeting know your customer (“KYC”) and other compliance regulations.
Our technology uses advanced algorithms to correct image distortion, extract relevant data, route images to their desired location and process transactions.
On June 17, 2015, Mitek completed the acquisition (the “Acquisition”) of IDchecker NL B.V., a company incorporated under the laws of the Netherlands (“IDC NL”), and ID Checker, Inc., a California corporation and wholly owned subsidiary of IDC NL (“IDC Inc.” and together with IDC NL, “IDchecker”), pursuant to a Share Purchase Agreement (the “Share Purchase Agreement”) dated May 26, 2015, by and among the Company, IDC NL, ID Checker Holding B.V. (“Parent”), Stichting Administratiekantoor OPID (together with Parent, the “Sellers”), and the other individuals specified therein. Upon completion of the Acquisition, IDC NL and IDC Inc. became wholly owned subsidiaries of the Company. IDchecker is a global provider of cloud based identity document verification. The Acquisition expands Mitek’s mobile ID verification capabilities through IDchecker’s ability to read several different types of passports, international driver’s licenses and identity cards from around the world. The Acquisition also adds an international customer base in the payments, financial services and information services verticals.
More than 90% of millennials own a smartphone and its most utilized feature is the camera, according to industry analyst ComScore. A 2015 survey conducted by Zogby Analytics (“Millennials – The Next Mobile Disruptors”) revealed three key findings: (i) millennials are embracing adoption of a mobile self-service channel; (ii) they expect to use their mobile device’s camera to deliver an easy mobile commerce experience; and (iii) the mobile camera is key for businesses looking to engage with this demographic. Mitek is leveraging the mobile camera through our Mitek Mobile Identity Suite to create a superior user experience across Apple iPhone and Android devices.
The core of our user experience is Mitek MiSnap™, a touch-free automated capture technology, which can be incorporated across our product line. It provides a simple and superior user experience, making transactions on mobile devices fast and easy for the consumer while helping organizations drive revenue from the increasingly popular mobile channel.
Our Mobile Verify™ products can combine the Mitek MiSnap auto capture experience with a variety of advanced computer vision techniques to provide verification of ID documents. These products enable banks and other businesses to improve KYC processes. This is especially valuable to highly regulated industries with a large and growing percentage of transactions conducted remotely via mobile devices. These products also enable trust to be achieved on peer-to-peer and merchant processing networks where identity is an inherent part of the transaction. Mobile Verify users include international payments, financial services and information services providers.
Mobile Fill™, our mobile identity capture solution, enables the camera to serve as a keyboard. Using Mobile Fill, consumers can quickly pre-fill any form with personal data by simply snapping a picture of their driver license, credit card, or other document. Organizations use Mobile Fill to verify identity for service. This can include streamlining the process of opening a customer checking, savings or credit card account, paying a bill, activating a ‘switch and save’ offer, and more. Mitek’s prime customers for Mobile Fill include national and regional banks, credits unions, wireless telecom operators and insurance providers.
21
The second generation of our Mobile Fill product, Mobile Fill for Mobile Web™, enables potential new customers to use their camera as a keyboard right from the organization’s mobile website, eliminating the need to download an application.
Mitek’s Mobile Identity Suite has been developed pursuant to the success of Mobile Deposit®, a category leading product that allows individuals and businesses to remotely deposit checks using their camera-equipped smartphone or tablet. Our Mobile Deposit® solution has now processed over one billion check deposits. We began selling Mobile Deposit® in the second fiscal quarter of 2008, and received our first patent issued for this product in August 2010. Our Commercial Mobile Deposit Capture™ utilizes the same core technology as Mobile Deposit®, but is specific to small and medium size businesses. It adds capabilities such as mobile multi-check capture to help businesses reduce or eliminate their need for check scanners and trips to the ATM or bank branch. Just like the retail side of banks, the commercial and treasury divisions recognize substantially lower transaction costs associated with processing checks through the mobile channel, and are thus highly motivated to drive more mobile deposit transactions as an alternative to branch or ATM transactions. In addition, many businesses are seeking to lower operating costs through mobile tools that enable them to quickly process payments without a trip to the bank, extra hardware or interchange fees associated with credit cards.
We market and sell our Mitek Mobile Identity Suite line of mobile capture and identity verification software products directly to enterprise customers or through channel partners. Our mobile capture software solutions are often embedded in other mobile banking or enterprise applications developed by banks, insurance companies or their partners, and then marketed under their own proprietary brands.
Fiscal Year 2016 Highlights
|
|
• |
Revenues for the year ended September 30, 2016 were $34.7 million, an increase of 37% compared to revenues of $25.4 million for the year ended September 30, 2015. |
|
|
• |
Our mobile check deposit business continued to grow. During the fiscal year 2016 the total number of financial institutions licensing our technology exceeded 5,400. All of the top 10 U.S. retail banks, and nearly all of the top 50 U.S. retail banks utilize our technology. |
|
|
• |
We added 5 new patents to our portfolio during the fiscal year ended September 30, 2016 bringing our total number of issued patents to 27 as of September 30, 2016. In addition, we have 16 patent applications as of September 30, 2016. |
Market Opportunities, Challenges & Risks
The increase in the acceptance of mobile banking by financial institutions and their customers has helped drive our recent growth in revenue. In the past year, we experienced a significant increase in the number of financial institutions that have integrated and launched our mobile applications, particularly our Mobile Deposit® product, as part of their offering of mobile banking choices for their customers. We believe that financial institutions see our patented solutions as a way to provide an enhanced customer experience and reduce the cost of sales and service.
To sustain our growth in 2017 and beyond, we believe we must continue to offer imaging technology for mobile applications that address a growing market for mobile banking and mobile imaging solutions sold into other vertical markets. Our entry into the ID capture and verification market has expanded our addressable market and we intend to leverage the success of our mobile check deposit solution at more than 5,400 financial institutions to increase adoption of our ID capture and verification solutions.
Factors adversely affecting the pricing of or demand for our mobile applications, such as competition from other products or technologies, any decline in the demand for mobile applications, or negative publicity or obsolescence of the software environments in which our products operate, could result in lower revenues or gross margins. Further, because most of our revenues are from a single type of technology, our product concentration may make us especially vulnerable to market demand and competition from other technologies, which could reduce our revenues.
22
Comparison of the Years Ended September 30, 2016 and 2015
The following table summarizes certain aspects of our results of operations for the year ended September 30, 2016 compared to the year ended September 30, 2015 (in thousands, except percentages):
|
|
|
2016 |
|
|
2015 |
|
|
Change $ |
|
|
Change % |
|
||||
|
Revenue |
|
|
|
|
|
|
|
|
|
|
|
|
|
|
|
|
|
Software |
|
$ |
22,586 |
|
|
$ |
17,870 |
|
|
$ |
4,716 |
|
|
|
26 |
% |
|
SaaS, maintenance and consulting |
|
|
12,115 |
|
|
|
7,497 |
|
|
|
4,618 |
|
|
|
62 |
% |
|
Total revenue |
|
$ |
34,701 |
|
|
$ |
25,367 |
|
|
$ |
9,334 |
|
|
|
37 |
% |
|
Cost of revenue |
|
$ |
3,395 |
|
|
$ |
2,471 |
|
|
$ |
924 |
|
|
|
37 |
% |
|
% of revenue |
|
|
10 |
% |
|
|
10 |
% |
|
|
|
|
|
|
|
|
|
Selling and marketing |
|
$ |
10,937 |
|
|
$ |
6,458 |
|
|
$ |
4,479 |
|
|
|
69 |
% |
|
% of revenue |
|
|
32 |
% |
|
|
25 |
% |
|
|
|
|
|
|
|
|
|
Research and development |
|
$ |
7,794 |
|
|
$ |
5,577 |
|
|
$ |
2,217 |
|
|
|
40 |
% |
|
% of revenue |
|
|
22 |
% |
|
|
22 |
% |
|
|
|
|
|
|
|
|
|
General and administrative |
|
$ |
8,575 |
|
|
$ |
7,601 |
|
|
$ |
974 |
|
|
|
13 |
% |
|
% of revenue |
|
|
25 |
% |
|
|
30 |
% |
|
|
|
|
|
|
|
|
|
Acquisition-related costs and expenses |
|
$ |
2,176 |
|
|
$ |
1,368 |
|
|
$ |
808 |
|
|
|
59 |
% |
|
% of revenue |
|
|
6 |
% |
|
|
5 |
% |
|
|
|
|
|
|
|
|
|
Income tax benefit (provision) |
|
$ |
1 |
|
|
$ |
543 |
|
|
$ |
(542 |
) |
|
|
(100 |
)% |
|
% of revenue |
|
|
0 |
% |
|
|
2 |
% |
|
|
|
|
|
|
|
|
|
Other income (expense), net |
|
$ |
134 |
|
|
$ |
91 |
|
|
$ |
43 |
|
|
|
47 |
% |
|
% of revenue |
|
|
0 |
% |
|
|
0 |
% |
|
|
|
|
|
|
|
|
Revenue
Total revenue increased $9.3 million, or 37%, to $34.7 million in 2016 compared to $25.4 million in 2015. The increase was primarily due to an increase in sales of software licenses of $4.7 million, or 26%, to $22.6 million in 2016 compared to $17.9 million in 2015. The increase in software license revenue primarily relates to increases in sales of our Mobile Deposit®, Mobile Fill® and Mobile Verify® products due to an increase in the number of software licenses purchased by partners and customers and the timing of license renewals in 2016 compared to 2015. Services revenue increased $4.6 million, or 62%, to $12.1 million in 2016 compared to $7.5 million in 2015 primarily due to additional software license arrangements, which typically include recurring maintenance contracts as well as additional SaaS revenue from the Acquisition.
Cost of Revenue
Cost of revenue includes the costs of royalties for third party products embedded in our products, the cost of reproduction of compact discs and other media devices and shipping costs, personnel costs and overhead related to software support and billable professional services engagements. Cost of revenue increased $0.9 million, or 37%, to $3.4 million in 2016 compared to $2.5 million in 2015. The increase in cost of revenue is primarily due to the increase in maintenance revenue and revenue related to the Acquisition. As a percentage of revenue, cost of revenue remained at 10% in 2016 and 2015.
Selling and Marketing Expenses
Selling and marketing expenses include payroll, employee benefits and other headcount-related costs associated with sales and marketing personnel, non-billable costs of professional services personnel and advertising, promotions, trade shows, seminars and other programs. Selling and marketing expenses increased $4.5 million, or 69%, to $10.9 million in 2016 compared to $6.5 million in 2015. As a percentage of revenue, selling and marketing expenses increased to 32% in 2016 compared to 25% in 2015. The increase in selling and marketing expenses is primarily due to increased personnel-related costs, including stock-based and other incentive compensation expense totaling $3.0 million, increased outside services totaling $0.3 million and marketing costs totaling $0.2 million.
23
Research and Development Expenses
Research and development expenses include payroll, employee benefits, consultant expenses and other headcount-related costs associated with software engineering and mobile imaging science. Research and development expenses increased $2.2 million, or 40%, to $7.8 million in 2016 compared to $5.6 million in 2015. The increase is primarily due to increased personnel-related costs, included stock-based compensation expense totaling $1.5 million and additional outside contract services totaling $0.1 million. As a percentage of revenue, research and development expenses remained at 22% in 2016 and 2015.
General and Administrative Expenses
General and administrative expenses include payroll, employee benefits, and other headcount-related costs associated with finance, legal, accounting, and other administrative items. General and administrative expenses increased $1.0 million, or 13%, to $8.6 million in 2016 compared to $7.6 million in 2015. The increase is primarily due to increased personnel-related costs totaling $0.7 million, increased outside services totaling $0.2 million, partially offset by lower litigation expenses. As a percentage of revenue, general and administrative expenses decreased to 25% in 2016 compared to 30% in 2015, primarily due to the increase in revenue.
Acquisition-related Costs and Expenses
Acquisition-related costs and expenses consist primarily of intangible asset amortization, amortization of deferred compensation and legal expenses and fees paid to outside consultants in connection with the Acquisition. Acquisition-related costs and expenses increased $0.8 million, or 59%, to $2.2 million in 2016 compared to $1.4 million in 2015, due to a full year of intangible asset amortization and amortization of deferred compensation in 2016 compared to 2015. As a percentage of revenue, acquisition-related costs and expenses increased to 6% in 2016 compared to 5% in 2015.
Income tax benefit
Income tax benefit decreased $0.5 million to $1,000 in 2016 compared to $0.5 million in 2015. In 2015 we recognized a discrete tax benefit of $0.6 million which arose from the recognition of a deferred tax liability related to identifiable intangibles recorded through purchase accounting in connection with the Acquisition. The recognition of the deferred tax liability results in the release of a corresponding valuation allowance on the existing deferred tax assets.
Other Income (Expense), Net
Other income (expense), net includes interest income net of amortization on our marketable securities portfolio and interest expense on our capital lease. Other income (expense), net was $0.1 million in 2016 compared to $91,000 in 2015, a decrease of $43,000 or 47%.
24
Comparison of the Years Ended September 30, 2015 and 2014
The following table summarizes certain aspects of our results of operations for the year ended September 30, 2015 compared to the year ended September 30, 2014 (in thousands, except percentages):
|
|
|
2015 |
|
|
2014 |
|
|
Change $ |
|
|
Change % |
|
||||
|
Revenue |
|
|
|
|
|
|
|
|
|
|
|
|
|
|
|
|
|
Software |
|
$ |
17,870 |
|
|
$ |
13,312 |
|
|
$ |
4,558 |
|
|
|
34 |
% |
|
SaaS, maintenance and consulting |
|
|
7,497 |
|
|
|
5,838 |
|
|
|
1,659 |
|
|
|
28 |
% |
|
Total revenue |
|
$ |
25,367 |
|
|
$ |
19,150 |
|
|
$ |
6,217 |
|
|
|
32 |
% |
|
Cost of revenue |
|
$ |
2,471 |
|
|
$ |
2,148 |
|
|
$ |
323 |
|
|
|
15 |
% |
|
% of revenue |
|
|
10 |
% |
|
|
11 |
% |
|
|
|
|
|
|
|
|
|
Selling and marketing |
|
$ |
6,458 |
|
|
$ |
6,836 |
|
|
$ |
(378 |
) |
|
|
(6 |
)% |
|
% of revenue |
|
|
25 |
% |
|
|
36 |
% |
|
|
|
|
|
|
|
|
|
Research and development |
|
$ |
5,577 |
|
|
$ |
6,020 |
|
|
$ |
(443 |
) |
|
|
(7 |
)% |
|
% of revenue |
|
|
22 |
% |
|
|
31 |
% |
|
|
|
|
|
|
|
|
|
General and administrative |
|
$ |
7,601 |
|
|
$ |
9,554 |
|
|
$ |
(1,953 |
) |
|
|
(20 |
)% |
|
% of revenue |
|
|
30 |
% |
|
|
50 |
% |
|
|
|
|
|
|
|
|
|
Acquisition-related costs and expenses |
|
$ |
1,368 |
|
|
$ |
— |
|
|
$ |
1,368 |
|
|
|
0 |
% |
|
% of revenue |
|
|
5 |
% |
|
|
0 |
% |
|
|
|
|
|
|
|
|
|
Income tax benefit (provision) |
|
$ |
543 |
|
|
$ |
(2 |
) |
|
$ |
545 |
|
|
|
(27250 |
)% |
|
% of revenue |
|
|
2 |
% |
|
|
(0 |
)% |
|
|
|
|
|
|
|
|
|
Other income (expense), net |
|
$ |
91 |
|
|
$ |
118 |
|
|
$ |
(27 |
) |
|
|
(23 |
)% |
|
% of revenue |
|
|
0 |
% |
|
|
1 |
% |
|
|
|
|
|
|
|
|
Revenue
Total revenue increased $6.2 million, or 32%, to $25.4 million in 2015 compared to $19.2 million in 2014. The increase was primarily due to an increase in sales of software licenses of $4.6 million, or 34%, to $17.9 million in 2015 compared to $13.3 million in 2014. The increase in software license revenue primarily relates to increases in sales of our Mobile Deposit® product due to an increase in the number of software licenses purchased by partners and customers and the timing of license renewals in 2015 compared to 2014. Services revenue increased $1.7 million, or 28%, to $7.5 million in 2015 compared to $5.8 million in 2014 primarily due to the sale of additional software license arrangements, which typically include recurring maintenance contracts as well as additional revenue from the Acquisition.
Cost of Revenue
Cost of revenue includes the costs of royalties for third party products embedded in our products, the cost of reproduction of compact discs and other media devices and shipping costs, and personnel costs and overhead related to software support and billable professional services engagements. Cost of revenue increased $0.3 million, or 15%, to $2.5 million in 2015 compared to $2.1 million in 2014. The increase in cost of revenue is primarily due to the increase in maintenance revenue and revenue related to the Acquisition. As a percentage of revenue, cost of revenue decreased to 10% in 2015 compared to 11% in 2014.
Selling and Marketing Expenses
Selling and marketing expenses include payroll, employee benefits and other headcount-related costs associated with sales and marketing personnel, non-billable costs of professional services personnel and advertising, promotions, trade shows, seminars and other programs. Selling and marketing expenses decreased $0.4 million, or 6%, to $6.5 million in 2015 compared to $6.8 million in 2014. As a percentage of revenue, selling and marketing expenses decreased to 25% in 2015 compared to 36% in 2014. The decrease in selling and marketing expenses is primarily due to decreased personnel-related costs, including stock-based and other incentive compensation expense, totaling $0.7 million; offset by increased outside services and product promotion expense of $0.3 million. The decrease in selling and marketing expenses as a percentage of revenues is primarily attributable to improved operating efficiencies resulting from our revenue growth.
25
Research and Development Expenses
Research and development expenses include payroll, employee benefits, consultant expenses and other headcount-related costs associated with software engineering and mobile imaging science.
Research and development expenses decreased $0.4 million, or 7%, to $5.6 million in 2015 compared to $6.0 million in 2014. The decrease is primarily due to decreased personnel-related costs, including stock-based compensation expense of $0.5 million, and additional outside contract services expense of $57,000. As a percentage of revenue, research and development expenses decreased to 22% in 2015, compared to 31% in 2014, primarily due to the increase in revenue.
General and Administrative Expenses
General and administrative expenses include payroll, employee benefits, and other headcount-related costs associated with finance, legal, accounting, and other administrative items. General and administrative expenses decreased $2.0 million, or 20%, to $7.6 million in 2015 compared to $9.6 million in 2014. The decrease is primarily due to a decrease in legal fees of $1.8 million related to intellectual property litigation. As a percentage of revenue, general and administrative expenses decreased to 30% in 2015 compared to 50% in 2014, primarily due to the increase in revenue.
Acquisition-related Costs and Expenses
Acquisition-related costs and expenses in 2015 of $1.4 million, or 5% of revenue, consist primarily of intangible asset amortization, amortization of deferred compensation and legal expenses and fees paid to outside consultants in connection with the Acquisition.
Income tax benefit (provision)
Income tax benefit (provision) was a $0.5 million benefit in 2015 compared to a provision of $2,000 in 2014. Included in the benefit is a discrete tax benefit of $0.6 million which arises from the recognition of a deferred tax liability related to identifiable intangibles recorded through purchase accounting in connection with the Acquisition. The recognition of the deferred tax liability results in the release of a corresponding valuation allowance on the existing deferred tax assets.
Other Income (Expense), Net
Other income (expense), net includes interest income net of amortization on our marketable securities portfolio and interest expense on our capital lease. Other income (expense), net was $91,000 in 2015 compared to $0.1 million in 2014, a decrease of $27,000 or 23%.
Liquidity and Capital Resources
On September 30, 2016, we had $35.8 million in cash and cash equivalents and investments compared to $26.7 million on September 30, 2015, an increase of $9.1 million, or 34%. The increase in cash and cash equivalents and investments was primarily due to an increase in cash provided by operating activities, as well as proceeds received from the exercise of stock options.
Net Cash Provided by (Used in) Operating Activities
Net cash provided by operating activities during fiscal 2016 was $7.9 million and resulted primarily from net income of $2.0 million and non-cash charges of $7.1 million, partially offset by changes in operating assets and liabilities of $1.2 million. The primary non-cash adjustments to operating activities were stock-based compensation expense, amortization of closing and earnout shares related to the Acquisition, amortization of intangible assets, depreciation, and accretion and amortization on debt securities totaling $4.1 million, $1.5 million, $0.6 million, $0.8 million, and $0.1 million, respectively.
During fiscal 2015, net cash provided from operating activities was $6.1 million and resulted primarily from net income of $2.5 million and non-cash charges of $4.8 million, partially offset by changes in operating assets and liabilities of $1.2 million. The primary non-cash adjustments to operating activities were stock-based compensation expense, amortization of closing and earnout shares related to the Acquisition, amortization of intangible assets, depreciation, and accretion and amortization on debt securities totaling $3.4 million, $0.4 million, $0.2 million, $0.4 million, and $0.4 million, respectively.
26
Net Cash (Used in) Provided by Investing Activities
Net cash used in investing activities was $3.3 million during fiscal 2016, which consisted of purchases of investments of $33.7 million, and $0.3 million related to the purchase and sale of property and equipment, partially offset by $30.6 million related to the sale and maturity of investments.
During fiscal 2015, net cash used in investing activities was $11.3 million, which consisted of cash paid for the Acquisition of $5.4 million, purchases of investments of $27.3 million, and $73,000 related to the purchase and sale of property and equipment, partially offset by $21.4 million related to the sale and maturity of investments.
Net Cash Provided by Financing Activities
Net cash provided by financing activities was $1.7 million during fiscal 2016, which included net proceeds of $1.8 million from the exercise of stock options partially offset by principal payments on capital lease obligations of $22,000.
During fiscal 2015, net cash provided by financing activities was $0.2 million, which included net proceeds of $0.2 million from the exercise of stock options partially offset by principal payments on capital lease obligations of $21,000.
Other Liquidity Matters
On September 30, 2016, we had investments of $26.8 million, designated as available-for-sale marketable securities, which consisted of commercial paper and corporate issuances, carried at fair value as determined by quoted market prices for identical or similar assets, with unrealized gains and losses, net of tax, and reported as a separate component of stockholders’ equity. All securities for which maturity or sale is expected within one year are classified as “current” on the balance sheet. All other securities are classified as “long-term” on the balance sheet. At September 30, 2016, we had $24.9 million of our available-for-sale securities classified as current and $2.0 million of our available-for-sale securities classified as long-term.
We had working capital of $32.0 million at September 30, 2016, compared to $24.0 million at September 30, 2015.
Based on our current operating plan, we believe the current cash balance and cash expected to be generated from operations will be adequate to satisfy our working capital needs for the next 12 months.
Off-Balance Sheet Arrangements
We have no off-balance sheet arrangements as defined in Item 304(a)(4)(ii) of Regulation S-K.
Contractual Obligations
The following table summarizes our contractual obligations as of September 30, 2016 (in thousands):
|
Contractual obligations by period as of September 30, 2016 |
|
Less than 1 year |
|
|
1-3 years |
|
|
3-5 years |
|
|
More than 5 years |
|
|
Total |
|
|||||
|
Operating lease obligations |
|
$ |
546 |
|
|
$ |
1,574 |
|
|
$ |
484 |
|
|
$ |
— |
|
|
$ |
2,604 |
|
|
Total |
|
$ |
546 |
|
|
$ |
1,574 |
|
|
$ |
484 |
|
|
$ |
— |
|
|
$ |
2,604 |
|
Critical Accounting Policies
Our financial statements and accompanying notes are prepared in accordance with U.S. GAAP. Preparing financial statements requires management to make estimates and assumptions that affect the reported amounts of assets, liabilities, stockholders’ equity, revenue, expenses and related disclosure of contingent assets and liabilities. Management regularly evaluates its estimates and assumptions. These estimates and assumptions are based on historical experience and on various other factors that are believed to be reasonable under the circumstances, and form the basis for making management’s most difficult, subjective or complex judgments, often as a result of the need to make estimates about the effects of matters that are inherently uncertain. Actual results could vary from those estimates under different assumptions or conditions. Our critical accounting policies include revenue recognition, allowance for accounts receivable, investments, fair value of equity instruments, goodwill and purchased intangible assets, business combinations accounting for income taxes and capitalized software development costs.
27
We enter into contractual arrangements with integrators, resellers and directly with our customers that may include licensing of our software products, product support and maintenance services, consulting services or various combinations thereof, including the sale of such products or services separately. Our accounting policies regarding the recognition of revenue for these contractual arrangements are fully described in Note 1 to our financial statements included in this Form 10-K.
We consider many factors when applying GAAP to revenue recognition. These factors include, but are not limited to, whether:
|
|
• |
Persuasive evidence of an arrangement exists; |
|
|
• |
Delivery of the product or performance of the service has occurred; |
|
|
• |
The fees are fixed or determinable; |
|
|
• |
Collection of the contractual fee is probable; and |
|
|
• |
Vendor-specific objective evidence of the fair value of undelivered elements or other appropriate method of revenue allocation exists. |
Each of the relevant factors is analyzed to determine its impact, individually and collectively with other factors, on the revenue to be recognized for any particular contract with a customer. Management is required to make judgments regarding the significance of each factor in applying the revenue recognition standards, as well as whether or not each factor complies with such standards. Any misjudgment or error by management in its evaluation of the factors and the application of the standards, especially with respect to complex or new types of transactions, could have a material adverse effect on our future revenues and operating results.
Accounts Receivable
We consistently monitor collections from our customers and maintain a provision for estimated credit losses that is based on historical experience and on specific customer collection issues. While such credit losses have historically been within our expectations and the provisions established, we cannot guarantee that we will continue to experience the same credit loss rates that we have in the past. Since our revenue recognition policy requires customers to be deemed creditworthy, our accounts receivable are based on customers whose payment is reasonably assured. Our accounts receivable are derived from sales to a wide variety of customers. We do not believe a change in liquidity of any one customer or our inability to collect from any one customer would have a material adverse impact on our financial position.
Investments
We determine the fair value of our assets and liabilities based on the exchange price that would be received for an asset or paid to transfer a liability (an exit price) in the principal or most advantageous market for the asset or liability in an orderly transaction between market participants on the measurement date. Valuation techniques used to measure fair value maximize the use of observable inputs and minimize the use of unobservable inputs. We use a fair value hierarchy with three levels of inputs, of which the first two are considered observable and the last unobservable, to measure fair value:
|
|
• |
Level 1—Quoted prices in active markets for identical assets or liabilities; |
|
|
• |
Level 2—Inputs other than Level 1 that are observable, either directly or indirectly, such as quoted prices for similar assets or liabilities; quoted prices in markets that are not active; or other inputs that are observable or can be corroborated by observable market data for substantially the full term of the assets or liabilities; and |
|
|
• |
Level 3—Unobservable inputs that are supported by little or no market activity and that are significant to the fair value of the assets or liabilities. |
In using this fair value hierarchy, management may be required to make assumptions about pricing by market participants and assumptions about risk, specifically when using unobservable inputs to determine fair value. These assumptions are subjective in nature and may significantly affect our results of operations.
Fair Value of Equity Instruments
The valuation of certain items, including valuation of warrants, the beneficial conversion feature related to convertible debt and compensation expense related to stock options granted, involves significant estimates based on underlying assumptions made by management. The valuation of warrants and stock options are based upon a Black-Scholes valuation model, which involves estimates of stock volatility, expected life of the instruments and other assumptions.
28
Goodwill and Purchased Intangible Assets
Our goodwill resulted from the Acquisition. Goodwill and intangible assets with indefinite useful lives are not amortized, but are tested for impairment at least annually or as circumstances indicate that their value may no longer be recoverable. In accordance with ASC Topic 350, Intangibles—Goodwill and Other (“ASC Topic 350”), we review our goodwill and indefinite-lived intangible asset for impairment at least annually in our fiscal fourth quarter and more frequently if events or changes in circumstances occur that indicate a potential reduction in the fair value of our reporting unit and/or our indefinite-lived intangible asset below their respective carrying values. Examples of such events or circumstances include: a significant adverse change in legal factors or in the business climate, a significant decline in our stock price, a significant decline in our projected revenue or cash flows, an adverse action or assessment by a regulator, unanticipated competition, a loss of key personnel, or the presence of other indicators that would indicate a reduction in the fair value of a reporting unit.
Our goodwill is considered to be impaired if we determine that the carrying value of the reporting unit to which the goodwill has been assigned exceeds management’s estimate of its fair value. Based on the guidance provided by ASC Topic 350 and ASC Topic 280, Segment Reporting, (“ASC Topic 280”) management has determined that the Company operates in one segment and consists of one reporting unit given the similarities in economic characteristics between our operations and the common nature of our products, services and customers. Because we have only one reporting unit, and because we are publicly traded, we determine the fair value of the reporting unit based on our market capitalization as we believe this represents the best evidence of fair value. In the fourth quarter of fiscal 2016, we completed our annual goodwill impairment test as of September 30, 2016 and concluded that our goodwill was not impaired. Our conclusion that goodwill was not impaired was based on a comparison of our net assets as of September 30, 2016 to our market capitalization.
Because we determine the fair value of our reporting unit based on our market capitalization, our future reviews of goodwill for impairment may be impacted by changes in the price of our common stock. For example, a significant decline in the price of our common stock may cause the fair value of our goodwill to fall below its carrying value. Therefore, we cannot assure you that when we complete our future reviews of goodwill for impairment a material impairment charge will not be recorded.
Business Combinations
Accounting for business combinations requires us to make significant estimates and assumptions, especially at the acquisition date with respect to tangible and intangible assets acquired and liabilities assumed and pre-acquisition contingencies. We use our best estimates and assumptions to accurately assign fair value to the tangible and intangible assets acquired and liabilities assumed at the acquisition date.
Examples of critical estimates in valuing certain of the intangible assets and goodwill we have acquired include but are not limited to:
|
|
• |
future expected cash flows subscription and support contracts, professional services contracts, other customer contracts and acquired developed technologies and patents; |
|
|
• |
the acquired company’s trade name, trademark and existing customer relationship, as well as assumptions about the period of time the acquired trade name and trademark will continue to be used in our offerings; |
|
|
• |
uncertain tax positions and tax related valuation allowances assumed; and |
|
|
• |
discount rates |
Deferred Income Taxes
Deferred income taxes reflect the net tax effects of temporary differences between the carrying amounts of assets and liabilities for financial reporting purposes and the amounts used for income tax purposes. We maintain a valuation allowance against deferred tax assets due to uncertainty regarding the future realization based on historical taxable income, projected future taxable income, and the expected timing of the reversals of existing temporary differences. Until such time as we can demonstrate that we will no longer incur losses or if we are unable to generate sufficient future taxable income, we could be required to maintain the valuation allowance against our deferred tax assets.
29
Capitalized Software Development Costs
Research and development costs are charged to expense as incurred. Costs incurred for the development of computer software that will be sold, leased or otherwise marketed are capitalized when technological feasibility has been established. These capitalized costs are subject to an ongoing assessment of recoverability based on anticipated future revenues and changes in hardware and software technologies. Costs that are capitalized include direct labor and related overhead. No such costs were capitalized during the fiscal years ended September 30, 2016 and 2015 because the time period and cost incurred between technological feasibility and general release for all software product releases were not material.
Amortization of capitalized software development costs begins when product sales commence. Amortization is provided on a product-by-product basis on either the straight-line method over periods not exceeding three years or the sales ratio method. Unamortized capitalized software development costs determined to be in excess of the net realizable value of the product are expensed immediately. No amortization was recorded during the fiscal years ended September 30, 2016, 2015 and 2014.
Interest Rates
The primary objective of our investment activities is to preserve principal while at the same time maximizing after-tax yields without significantly increasing risk. To achieve this objective, we maintain our investment portfolio of cash equivalents and marketable securities in a variety of securities, including corporate debt securities, commercial paper and certificates of deposit. We have not used derivative financial instruments in our investment portfolio, and none of our investments are held for trading or speculative purposes. Short-term and long-term marketable securities are generally classified as available-for-sale and consequently are recorded on the balance sheet at fair value with unrealized gains or losses reported as a separate component of accumulated other comprehensive income, net of estimated tax. Our short-term marketable securities had a fair market value of $24.9 million at September 30, 2016, representing approximately 51% of our total assets.
The fair value of our cash equivalents and marketable securities is subject to change as a result of changes in market interest rates and investment risk related to the issuers’ credit worthiness. We do not utilize financial contracts to manage our investment portfolio’s exposure to changes in market interest rates. A hypothetical 100 basis point increase or decrease in market interest rates would not have a material impact on the fair value of our cash equivalents and marketable securities due to the relatively short maturities of these investments. While changes in market interest rates may affect the fair value of our investment portfolio, any gains or losses will not be recognized in our results of operations until the investment is sold or if the reduction in fair value was determined to be an other-than-temporary impairment.
Foreign Currency Risk
With the Acquisition we now have operations in the Netherlands and will be exposed to fluctuations in the foreign currency exchange rate between the U.S. dollar and the Euro. The functional currency of our Dutch operations is the Euro. Our results of operations and cash flows are subject to fluctuations due to changes in foreign currency exchange rates, particularly changes in the Euro. Translation adjustments resulting from translating the functional currency financial statements into U.S. dollar equivalents are reported separately in accumulated other comprehensive income in stockholders’ equity and in the statement of comprehensive income (loss).
Our financial statements and supplementary data required by this item are set forth at the pages indicated in Part IV, Item 15(a)(1) and (a)(2), respectively, of this Form 10-K.
None.
30
Disclosure Controls and Procedures
We maintain disclosure controls and procedures, as such term is defined in Rules 13a-15(e) and 15d-15(e) under the Exchange Act, that are designed to provide reasonable assurance that information required to be disclosed by us in the reports that we file or submit under the Exchange Act is recorded, processed, summarized and reported within the time periods specified in the SEC rules and forms, and that such information is accumulated and communicated to our management, including our principal executive officer and principal financial officer, as appropriate, to allow timely decisions regarding required financial disclosures. Under the supervision and with the participation of our management, including our principal executive officer and principal financial officer, we conducted an evaluation of our disclosure controls and procedures as of the end of the period covered by this Form 10-K. We recognize that any controls and procedures, no matter how well designed and operated, can provide only reasonable assurance of achieving their objectives and management necessarily applies its judgment in evaluating the cost-benefit relationship of possible controls and procedures. Based on this evaluation, our principal executive officer and principal financial officer concluded that our disclosure controls and procedures were effective as of September 30, 2016.
Management’s Report on Internal Control over Financial Reporting
Our management is responsible for establishing and maintaining adequate internal control over financial reporting, as such term is defined in Rules 13a-15(f) and 15d-15(f) under the Exchange Act. All internal control systems, no matter how well designed, have inherent limitations. Therefore, even those systems determined to be effective can provide only reasonable assurance with respect to financial statement preparation and presentation.
Under the supervision and with the participation of our management, including our principal executive officer and principal financial officer, we conducted an evaluation of the effectiveness of our internal control over financial reporting based on the framework in Internal Control—Integrated Framework (2013) issued by the Committee of Sponsoring Organizations of the Treadway Commission. Based on this evaluation, our management concluded that our internal control over financial reporting was effective as of September 30, 2016.
Our internal control over financial reporting has been audited by Mayer Hoffman McCann P.C., an independent registered public accounting firm, as stated in their report appearing below, which expresses an unqualified opinion on the effectiveness of our internal control over financial reporting as of September 30, 2016.
Changes in Internal Control over Financial Reporting
Except for the addition of controls related to IDchecker as a result of the Acquisition, there has been no change in our internal control over financial reporting during the year ended September 30, 2016 that has materially affected, or is reasonably likely to materially affect, our internal control over financial reporting.
None.
31
The information required by this item is incorporated by reference to our definitive proxy statement filed in connection with our 2017 Annual Meeting of Stockholders or an amendment to this Form 10-K to be filed with the SEC within 120 days after the close of our fiscal year ended September 30, 2016.
The information required by this item is incorporated by reference to our definitive proxy statement filed in connection with our 2017 Annual Meeting of Stockholders or an amendment to this Form 10-K to be filed with the SEC within 120 days after the close of our fiscal year ended September 30, 2016.
|
ITEM 12. |
SECURITY OWNERSHIP OF CERTAIN BENEFICIAL OWNERS AND MANAGEMENT AND RELATED STOCKHOLDER MATTERS. |
The information required by this item is incorporated by reference to our definitive proxy statement filed in connection with our 2017 Annual Meeting of Stockholders or an amendment to this Form 10-K to be filed with the SEC within 120 days after the close of our fiscal year ended September 30, 2016.
The information required by this item is incorporated by reference to our definitive proxy statement filed in connection with our 2017 Annual Meeting of Stockholders or an amendment to this Form 10-K to be filed with the SEC within 120 days after the close of our fiscal year ended September 30, 2016.
The information required by this item is incorporated by reference to our definitive proxy statement filed in connection with our 2017 Annual Meeting of Stockholders or an amendment to this Form 10-K to be filed with the SEC within 120 days after the close of our fiscal year ended September 30, 2016.
32
(a)(1) Financial Statements
The Financial Statements of Mitek Systems, Inc. and Report of Independent Registered Public Accounting Firm are included in a separate section of this Form 10-K beginning on page F-1.
(a)(2) Financial Statement Schedules
These schedules have been omitted because the required information is included in the financial statements or notes thereto or because they are not applicable or not required.
|
Exhibit No. |
|
Description |
|
Incorporated by Reference from Document |
|
|
|
|
|
|
|
3.1 |
|
Restated Certificate of Incorporation of Mitek Systems, Inc., as amended. |
|
(1) |
|
|
|
|
|
|
|
3.2 |
|
Second Amended and Restated Bylaws of Mitek Systems, Inc. |
|
(2) |
|
|
|
|
|
|
|
4.1 |
|
Form of debenture issued on December 10, 2009. |
|
(3) |
|
|
|
|
|
|
|
4.2 |
|
Form of warrant issued on December 10, 2009. |
|
(3) |
|
|
|
|
|
|
|
10.1 |
|
Share Purchase Agreement, dated May 26, 2015, by and among Mitek Systems, Inc., ID Checker NL B.V., ID Checker Holding B.V., Stichting Administratiekantoor OPID, Pierre L.M. deBoer, and Michael Hagen. |
|
(4) |
|
|
|
|
|
|
|
10.2 |
|
Mitek Systems, Inc. 2000 Stock Option Plan. |
|
(5) |
|
|
|
|
|
|
|
10.3 |
|
Mitek Systems, Inc. 2002 Stock Option Plan. |
|
(6) |
|
|
|
|
|
|
|
10.4 |
|
Mitek Systems, Inc. 2006 Stock Option Plan. |
|
(7) |
|
|
|
|
|
|
|
10.5 |
|
Mitek Systems, Inc. 2010 Stock Option Plan. |
|
(8) |
|
|
|
|
|
|
|
10.6 |
|
Mitek Systems, Inc. 2012 Incentive Plan, as amended. |
|
(9) |
|
|
|
|
|
|
|
10.7 |
|
Mitek Systems, Inc. Director Restricted Stock Unit Plan. |
|
(10) |
|
|
|
|
|
|
|
10.8 |
|
Mitek Systems, Inc. 401(k) Savings Plan. |
|
(11) |
|
|
|
|
|
|
|
10.9 |
|
Form of Securities Purchase Agreement, dated December 10, 2009, between Mitek Systems, Inc. and certain accredited investors. |
|
(3) |
|
|
|
|
|
|
|
10.10 |
|
Form of Security Agreement dated, December 10, 2009, between Mitek Systems, Inc. and certain secured parties. |
|
(3) |
|
|
|
|
|
|
|
10.11 |
|
Executive Severance and Change of Control Plan, dated February 28, 2011, by and between Mitek Systems, Inc. and James B. DeBello. |
|
(12) |
|
|
|
|
|
|
|
10.12 |
|
Offer Letter, dated October 3, 2011, by and between Mitek Systems, Inc. and Russell C. Clark. |
|
(13) |
|
|
|
|
|
|
|
10.13 |
|
Executive Severance and Change of Control Plan, dated October 11, 2011, by and between Mitek Systems, Inc. and Russell C. Clark. |
|
(13) |
|
|
|
|
|
|
|
10.14 |
|
Offer Letter, dated June 6, 2012, by and between Mitek Systems, Inc. and Michael Diamond. |
|
(11) |
|
|
|
|
|
|
|
10.15 |
|
Offer Letter, dated June 11, 2012, by and between Mitek Systems, Inc. and Michael Strange. |
|
(11) |
|
|
|
|
|
|
|
10.16 |
|
Offer Letter, dated May 10, 2013, by and between Mitek Systems, Inc. and Scott Carter. |
|
(11) |
|
|
|
|
|
|
|
10.17 |
|
Form of Executive Severance and Change of Control Plan. |
|
(12) |
|
|
|
|
|
|
|
10.18 |
|
Form of Indemnification Agreement. |
|
(1) |
|
|
|
|
|
|
|
10.19 |
|
Mitek Systems, Inc. Executive Bonus Program Fiscal Year 2014 |
|
(14) |
|
|
|
|
|
|
|
10.20 |
|
Mitek Systems, Inc. Executive Bonus Program Fiscal Year 2015 |
|
(2) |
33
|
Exhibit No. |
|
Description |
|
Incorporated by Reference from Document |
|
|
|
|
|
|
|
10.21 |
|
Mitek Systems, Inc. Executive Bonus Program Fiscal Year 2016 |
|
(15) |
|
10.22 |
|
Mitek Systems, Inc. Executive Bonus Program Fiscal Year 2017 |
|
(16) |
|
|
|
|
|
|
|
10.23 |
|
Lease, dated September 13, 2005, by and between Arden Realty Finance V, L.L.C. and Mitek Systems, Inc., as amended. |
|
(17) |
|
|
|
|
|
|
|
10.24 |
|
Sublease, dated August 12, 2016, by and between Bridgepoint Education, Inc. and Mitek Systems, Inc. |
|
* |
|
|
|
|
|
|
|
10.25 |
|
Lease Termination Agreement, dated August 16, 2016, by and between The Realty Associated Fund VIII, L.P. and Mitek Systems, Inc. |
|
* |
|
|
|
|
|
|
|
23.1 |
|
Consent of Mayer Hoffman McCann P.C. |
|
* |
|
|
|
|
|
|
|
24.1 |
|
Power of Attorney (included on the signature page). |
|
* |
|
|
|
|
|
|
|
31.1 |
|
Certification of Chief Executive Officer Pursuant to Rule 13a-14(a) of the Securities Exchange Act of 1934. |
|
* |
|
|
|
|
|
|
|
31.2 |
|
Certification of Chief Financial Officer Pursuant to Rule 13a-14(a) of the Securities Exchange Act of 1934. |
|
* |
|
|
|
|
|
|
|
32.1 |
|
Certification Chief Executive Officer and Chief Financial Officer Pursuant to Section 906 of the Sarbanes-Oxley Act of 2002. |
|
* |
|
|
|
|
|
|
|
101 |
|
Financial statements from the Annual Report on Form 10-K of Mitek Systems, Inc. for the year ended September 30, 2016, formatted in XBRL: (i) the Balance Sheets, (ii) the Statements of Operations and Other Comprehensive Income (Loss), (iii) the Statements of Stockholders’ Equity, (iv) the Statements of Cash Flows, (v) the Notes to the Financial Statements. |
|
* |
|
* |
Filed herewith. |
|
(1) |
Incorporated by reference to the Company’s Annual Report on Form 10-K for the fiscal year ended September 30, 2015 filed with the SEC on December 4, 2015. |
|
(2) |
Incorporated by reference to the Company’s Current Report on Form 8-K filed with the SEC on November 10, 2014. |
|
(3) |
Incorporated by reference to the Company’s Current Report on Form 8-K filed with the SEC on December 16, 2009. |
|
(4) |
Incorporated by reference to the Company’s Current Report on Form 8-K filed with the SEC on June 17, 2015. |
|
(5) |
Incorporated by reference to the exhibits to the Company’s Registration Statement on Form S-8 filed with the SEC on March 30, 2001. |
|
(6) |
Incorporated by reference to the exhibits to the Company’s Registration Statement on Form S-8 filed with the SEC on July 7, 2003. |
|
(7) |
Incorporated by reference to the exhibits to the Company’s Registration Statement on Form S-8 filed with the SEC on May 3, 2006. |
|
(8) |
Incorporated by reference to the exhibits to the Company’s Registration Statement on Form S-8 filed with the SEC on March 14, 2011. |
|
(9) |
Incorporated by reference to the exhibits to the Company’s Registration Statement on Form S-8 filed with the SEC on February 26, 2014. |
|
(10) |
Incorporated by reference to Appendix A to the Company’s Definitive Proxy Statement filed with the SEC on January 18, 2011. |
|
(11) |
Incorporated by reference to the Company’s Annual Report on Form 10-K for the fiscal year ended September 30, 2013 filed with the SEC on December 12, 2013. |
|
(12) |
Incorporated by reference to the Company’s Current Report on Form 8-K filed with the SEC on March 1, 2011. |
|
(13) |
Incorporated by reference to the Company’s Current Report on Form 8-K filed with the SEC on October 13, 2011. |
|
(14) |
Incorporated by reference to the Company’s Current Report on Form 8-K filed with the SEC on December 17, 2013. |
|
(15) |
Incorporated by reference to the Company’s Current Report on Form 8-K filed with the SEC on November 12, 2015. |
|
(16) |
Incorporated by reference to the Company’s Current Report on Form 8-K filed with the SEC on November 18, 2016. |
|
(17) |
Incorporated by reference to the Company’s Annual Report on Form 10-K for the fiscal year ended September 30, 2012 filed with the SEC on December 7, 2012. |
34
Pursuant to the requirements of Section 13 or 15(d) of the Securities Exchange Act of 1934, the registrant has duly caused this report to be signed on its behalf by the undersigned, thereunto duly authorized.
|
December 9, 2016 |
|
MITEK SYSTEMS, INC. |
|
|
|
|
|
|
|
|
|
By: |
/s/ James B. DeBello |
|
|
|
|
James B. DeBello |
|
|
|
|
President, Chief Executive Officer and Chairman of the Board of Directors |
|
|
|
|
(Principal Executive Officer) |
POWER OF ATTORNEY
KNOW ALL PERSONS BY THESE PRESENTS, that each person whose signature appears below hereby severally constitutes and appoints James B. DeBello and Russell C. Clark, his or her true and lawful agent and attorney-in-fact, with full power of substitution and resubstitution, for him or her and in his or her name, place and stead, in any and all capacities, to sign any and all amendments to this report, and to file the same, with all exhibits thereto, and other documents in connection therewith, with the Commission, granting unto said attorney-in-fact full power and authority to do and perform each and every act and thing requisite or necessary fully to all intents and purposes as he or she might or could do in person, hereby ratifying and confirming all that said attorney-in-fact and agent or his or her substitute or substitutes, may lawfully do or cause to be done by virtue hereof.
Pursuant to the requirements of the Securities Exchange Act of 1934, this report has been signed below by the following persons on behalf of the registrant and in the capacities and on the dates indicated.
|
/s/ James B. DeBello
James B. DeBello |
President, Chief Executive Officer and Chairman of the Board of Directors (Principal Executive Officer) |
December 9, 2016 |
|
|
|
|
|
/s/ Russell C. Clark
Russell C. Clark |
Chief Financial Officer (Principal Financial and Accounting Officer) |
December 9, 2016 |
|
|
|
|
|
/s/ Bill Aulet
Bill Aulet |
Director |
December 9, 2016 |
|
|
|
|
|
/s/ Vinton P. Cunningham
Vinton P. Cunningham |
Director |
December 9, 2016 |
|
|
|
|
|
/s/ James C. Hale
James C. Hale |
Director |
December 9, 2016 |
|
|
|
|
|
/s/ Bruce E. Hansen
Bruce E. Hansen |
Director |
December 9, 2016 |
|
|
|
|
|
/s/ Alex W. Hart
Alex W. Hart |
Director |
December 9, 2016 |
35
MITEK SYSTEMS, INC.
F-1
Report of Independent Registered Public Accounting Firm
To the Board of Directors and Stockholders of
Mitek Systems, Inc.
We have audited the accompanying consolidated balance sheets of Mitek Systems, Inc. as of September 30, 2016 and 2015, and the related consolidated statements of operations and other comprehensive income (loss), stockholders’ equity, and cash flows for each of the years in the three year period ended September 30, 2016. Mitek Systems, Inc.’s management is responsible for these financial statements. Our responsibility is to express an opinion on these financial statements based on our audits.
We conducted our audits in accordance with the standards of the Public Company Accounting Oversight Board (United States). Those standards require that we plan and perform the audit to obtain reasonable assurance about whether the consolidated financial statements are free of material misstatement. An audit includes examining, on a test basis, evidence supporting the amounts and disclosures in the financial statements. An audit also includes assessing the accounting principles used and significant estimates made by management, as well as evaluating the overall financial statement presentation. We believe that our audits provide a reasonable basis for our opinion.
In our opinion, the consolidated financial statements referred to above present fairly, in all material respects, the financial position of Mitek Systems, Inc. as of September 30, 2016 and 2015, and the results of its operations and its cash flows for each of the years in the three year period ended September 30, 2016, in conformity with accounting principles generally accepted in the United States of America.
We also have audited, in accordance with the standards of the Public Company Accounting Oversight Board (United States), Mitek Systems, Inc.’s internal control over financial reporting as of September 30, 2016, based on criteria established in Internal Control—Integrated Framework (2013) issued by the Committee of Sponsoring Organizations of the Treadway Commission (COSO), and our report dated December 9, 2016, expressed an unqualified opinion.
/s/ Mayer Hoffman McCann P.C.
San Diego, California
December 9, 2016
F-2
Report of Independent Registered Public Accounting Firm
To the Board of Directors and Stockholders of
Mitek Systems, Inc.
We have audited Mitek Systems, Inc.’s internal control over financial reporting as of September 30, 2016, based on criteria established in Internal Control—Integrated Framework (2013) issued by the Committee of Sponsoring Organizations of the Treadway Commission (COSO). Mitek Systems, Inc.’s management is responsible for maintaining effective internal control over financial reporting and for its assessment of the effectiveness of internal control over financial reporting included in the accompanying Management’s Report on Internal Control over Financial Reporting. Our responsibility is to express an opinion on the Company’s internal control over financial reporting based on our audit.
We conducted our audit in accordance with the standards of the Public Company Accounting Oversight Board (United States). Those standards require that we plan and perform the audit to obtain reasonable assurance about whether effective internal control over financial reporting was maintained in all material respects. Our audit of internal control over financial reporting included obtaining an understanding of internal control over financial reporting, assessing the risk that a material weakness exists, and testing and evaluating the design and operating effectiveness of internal control based on the assessed risk. Our audit also included performing such other procedures as we considered necessary in the circumstances. We believe that our audit provides a reasonable basis for our opinion.
A company’s internal control over financial reporting is a process designed to provide reasonable assurance regarding the reliability of financial reporting and the preparation of financial statements for external purposes in accordance with generally accepted accounting principles. A company’s internal control over financial reporting includes those policies and procedures that (1) pertain to the maintenance of records that, in reasonable detail, accurately and fairly reflect the transactions and dispositions of the assets of the company; (2) provide reasonable assurance that transactions are recorded as necessary to permit preparation of financial statements in accordance with generally accepted accounting principles, and that receipts and expenditures of the company are being made only in accordance with authorizations of management and directors of the company; and (3) provide reasonable assurance regarding prevention or timely detection of unauthorized acquisition, use, or disposition of the company’s assets that could have a material effect on the financial statements.
Because of its inherent limitations, internal control over financial reporting may not prevent or detect misstatements. Also, projections of any evaluation of effectiveness to future periods are subject to the risk that controls may become inadequate because of changes in conditions, or that the degree of compliance with the policies or procedures may deteriorate.
In our opinion, Mitek Systems, Inc. maintained, in all material respects, effective internal control over financial reporting as of September 30, 2016, based on criteria established in Internal Control—Integrated Framework (2013) issued by the Committee of Sponsoring Organizations of the Treadway Commission (COSO).
We have also audited, in accordance with the standards of the Public Company Accounting Oversight Board (United States), the consolidated balance sheets and the related consolidated statements of operations and other comprehensive income (loss), stockholders’ equity, and cash flows of Mitek Systems, Inc., and our report dated December 9, 2016 expressed an unqualified opinion.
/s/ Mayer Hoffman McCann P.C.
San Diego, California
December 9, 2016
F-3
(amounts in thousands except share data)
|
|
|
September 30, |
|
|||||
|
|
|
2016 |
|
|
2015 |
|
||
|
ASSETS |
|
|
|
|
|
|
|
|
|
Current assets: |
|
|
|
|
|
|
|
|
|
Cash and cash equivalents |
|
$ |
9,010 |
|
|
$ |
2,753 |
|
|
Short-term investments |
|
|
24,863 |
|
|
|
23,921 |
|
|
Accounts receivable, net |
|
|
4,949 |
|
|
|
3,937 |
|
|
Other current assets |
|
|
1,485 |
|
|
|
798 |
|
|
Total current assets |
|
|
40,307 |
|
|
|
31,409 |
|
|
Long-term investments |
|
|
1,952 |
|
|
|
— |
|
|
Property and equipment, net |
|
|
440 |
|
|
|
975 |
|
|
Intangible assets, net |
|
|
2,783 |
|
|
|
3,397 |
|
|
Goodwill |
|
|
2,863 |
|
|
|
2,873 |
|
|
Other non-current assets |
|
|
40 |
|
|
|
92 |
|
|
Total assets |
|
$ |
48,385 |
|
|
$ |
38,746 |
|
|
LIABILITIES AND STOCKHOLDERS’ EQUITY |
|
|
|
|
|
|
|
|
|
Current liabilities: |
|
|
|
|
|
|
|
|
|
Accounts payable |
|
$ |
1,318 |
|
|
$ |
1,538 |
|
|
Accrued payroll and related taxes |
|
|
3,263 |
|
|
|
2,061 |
|
|
Deferred revenue, current portion |
|
|
3,391 |
|
|
|
3,516 |
|
|
Other current liabilities |
|
|
355 |
|
|
|
289 |
|
|
Total current liabilities |
|
|
8,327 |
|
|
|
7,404 |
|
|
Deferred revenue, non-current portion |
|
|
259 |
|
|
|
222 |
|
|
Other non-current liabilities |
|
|
314 |
|
|
|
687 |
|
|
Total liabilities |
|
|
8,900 |
|
|
|
8,313 |
|
|
Stockholders’ equity |
|
|
|
|
|
|
|
|
|
Preferred stock, $0.001 par value, 1,000,000 shares authorized, none issued and outstanding |
|
|
— |
|
|
|
— |
|
|
Common stock, $0.001 par value, 60,000,000 shares authorized, 32,781,704 and 31,721,114 issued and outstanding, respectively |
|
|
33 |
|
|
|
32 |
|
|
Additional paid-in capital |
|
|
71,036 |
|
|
|
63,905 |
|
|
Accumulated other comprehensive loss |
|
|
(42 |
) |
|
|
(3 |
) |
|
Accumulated deficit |
|
|
(31,542 |
) |
|
|
(33,501 |
) |
|
Total stockholders’ equity |
|
|
39,485 |
|
|
|
30,433 |
|
|
Total liabilities and stockholders’ equity |
|
$ |
48,385 |
|
|
$ |
38,746 |
|
The accompanying notes form an integral part of these consolidated financial statements.
F-4
CONSOLIDATED STATEMENTS OF OPERATIONS AND OTHER COMPREHENSIVE INCOME (LOSS)
(amounts in thousands except share data)
|
|
|
For the years ended September 30, |
|
|||||||||
|
|
|
2016 |
|
|
2015 |
|
|
2014 |
|
|||
|
Revenue |
|
|
|
|
|
|
|
|
|
|
|
|
|
Software |
|
$ |
22,586 |
|
|
$ |
17,870 |
|
|
$ |
13,312 |
|
|
SaaS, maintenance and consulting |
|
|
12,115 |
|
|
|
7,497 |
|
|
|
5,838 |
|
|
Total revenue |
|
|
34,701 |
|
|
|
25,367 |
|
|
|
19,150 |
|
|
Operating costs and expenses |
|
|
|
|
|
|
|
|
|
|
|
|
|
Cost of revenue-software |
|
|
953 |
|
|
|
992 |
|
|
|
1,001 |
|
|
Cost of revenue-SaaS, maintenance and consulting |
|
|
2,442 |
|
|
|
1,479 |
|
|
|
1,147 |
|
|
Selling and marketing |
|
|
10,937 |
|
|
|
6,458 |
|
|
|
6,836 |
|
|
Research and development |
|
|
7,794 |
|
|
|
5,577 |
|
|
|
6,020 |
|
|
General and administrative |
|
|
8,575 |
|
|
|
7,601 |
|
|
|
9,554 |
|
|
Acquisition-related costs and expenses |
|
|
2,176 |
|
|
|
1,368 |
|
|
|
— |
|
|
Total operating costs and expenses |
|
|
32,877 |
|
|
|
23,475 |
|
|
|
24,558 |
|
|
Operating income (loss) |
|
|
1,824 |
|
|
|
1,892 |
|
|
|
(5,408 |
) |
|
Other income (expense), net |
|
|
134 |
|
|
|
91 |
|
|
|
118 |
|
|
Income (loss) before income taxes |
|
|
1,958 |
|
|
|
1,983 |
|
|
|
(5,290 |
) |
|
Income tax benefit (provision) |
|
|
1 |
|
|
|
543 |
|
|
|
(2 |
) |
|
Net income (loss) |
|
$ |
1,959 |
|
|
$ |
2,526 |
|
|
$ |
(5,292 |
) |
|
Net income (loss) per share—basic |
|
$ |
0.06 |
|
|
$ |
0.08 |
|
|
$ |
(0.17 |
) |
|
Net income (loss) per share—diluted |
|
$ |
0.06 |
|
|
$ |
0.08 |
|
|
$ |
(0.17 |
) |
|
Shares used in calculating net income (loss) per share—basic |
|
|
31,586,535 |
|
|
|
30,790,258 |
|
|
|
30,466,063 |
|
|
Shares used in calculating net income (loss) per share—diluted |
|
|
33,818,501 |
|
|
|
31,480,241 |
|
|
|
30,466,063 |
|
|
Other comprehensive income (loss): |
|
|
|
|
|
|
|
|
|
|
|
|
|
Net income (loss) |
|
$ |
1,959 |
|
|
$ |
2,526 |
|
|
$ |
(5,292 |
) |
|
Foreign currency translation adjustment |
|
|
(46 |
) |
|
|
— |
|
|
|
— |
|
|
Unrealized gain (loss) on investments |
|
|
7 |
|
|
|
5 |
|
|
|
(10 |
) |
|
Other comprehensive income (loss) |
|
$ |
1,920 |
|
|
$ |
2,531 |
|
|
$ |
(5,302 |
) |
The accompanying notes form an integral part of these consolidated financial statements.
F-5
CONSOLIDATED STATEMENTS OF STOCKHOLDERS’ EQUITY
For the years ended September 30, 2016, 2015 and 2014
(amounts in thousands except share data)
|
|
|
Common Stock Outstanding Shares |
|
|
Common Stock |
|
|
Additional Paid-In Capital |
|
|
Accumulated Deficit |
|
|
Accumulated Other Comprehensive Income (Loss) |
|
|
Total Stockholders’ Equity |
|
||||||
|
Balance, September 30, 2013 |
|
|
30,361,442 |
|
|
$ |
30 |
|
|
$ |
56,432 |
|
|
$ |
(30,735 |
) |
|
$ |
2 |
|
|
$ |
25,729 |
|
|
Exercise of stock options |
|
|
105,280 |
|
|
|
1 |
|
|
|
118 |
|
|
|
— |
|
|
|
— |
|
|
|
119 |
|
|
Settlement of restricted stock units |
|
|
54,358 |
|
|
|
— |
|
|
|
(48 |
) |
|
|
— |
|
|
|
— |
|
|
|
(48 |
) |
|
Stock-based compensation expense |
|
|
— |
|
|
|
— |
|
|
|
3,444 |
|
|
|
— |
|
|
|
— |
|
|
|
3,444 |
|
|
Components of other comprehensive income: |
|
|
|
|
|
|
|
|
|
|
|
|
|
|
|
|
|
|
|
|
|
|
|
|
|
Net loss |
|
|
— |
|
|
|
— |
|
|
|
— |
|
|
|
(5,292 |
) |
|
|
— |
|
|
|
(5,292 |
) |
|
Change in unrealized gain (loss) on investments |
|
|
— |
|
|
|
— |
|
|
|
— |
|
|
|
— |
|
|
|
(10 |
) |
|
|
(10 |
) |
|
Total other comprehensive loss |
|
|
|
|
|
|
|
|
|
|
|
|
|
|
|
|
|
|
|
|
|
|
(5,302 |
) |
|
Balance, September 30, 2014 |
|
|
30,521,080 |
|
|
$ |
31 |
|
|
$ |
59,946 |
|
|
$ |
(36,027 |
) |
|
$ |
(8 |
) |
|
$ |
23,942 |
|
|
Exercise of stock options |
|
|
232,203 |
|
|
|
— |
|
|
|
246 |
|
|
|
— |
|
|
|
— |
|
|
|
246 |
|
|
Settlement of restricted stock units |
|
|
255,041 |
|
|
|
— |
|
|
|
— |
|
|
|
— |
|
|
|
— |
|
|
|
— |
|
|
Acquisition-related closing shares |
|
|
712,790 |
|
|
|
1 |
|
|
|
346 |
|
|
|
— |
|
|
|
— |
|
|
|
347 |
|
|
Stock-based compensation expense |
|
|
— |
|
|
|
— |
|
|
|
3,367 |
|
|
|
— |
|
|
|
— |
|
|
|
3,367 |
|
|
Components of other comprehensive income: |
|
|
|
|
|
|
|
|
|
|
|
|
|
|
|
|
|
|
|
|
|
|
|
|
|
Net income |
|
|
— |
|
|
|
— |
|
|
|
— |
|
|
|
2,526 |
|
|
|
— |
|
|
|
2,526 |
|
|
Change in unrealized gain (loss) on investments |
|
|
— |
|
|
|
— |
|
|
|
— |
|
|
|
— |
|
|
|
5 |
|
|
|
5 |
|
|
Total other comprehensive income |
|
|
|
|
|
|
|
|
|
|
|
|
|
|
|
|
|
|
|
|
|
|
2,531 |
|
|
Balance, September 30, 2015 |
|
|
31,721,114 |
|
|
$ |
32 |
|
|
$ |
63,905 |
|
|
$ |
(33,501 |
) |
|
$ |
(3 |
) |
|
$ |
30,433 |
|
|
Exercise of stock options |
|
|
661,663 |
|
|
|
1 |
|
|
|
1,754 |
|
|
|
— |
|
|
|
— |
|
|
|
1,755 |
|
|
Settlement of restricted stock units |
|
|
261,621 |
|
|
|
— |
|
|
|
— |
|
|
|
— |
|
|
|
— |
|
|
|
— |
|
|
IDchecker shares issued |
|
|
137,306 |
|
|
|
— |
|
|
|
— |
|
|
|
— |
|
|
|
— |
|
|
|
— |
|
|
Stock-based compensation expense |
|
|
— |
|
|
|
— |
|
|
|
4,079 |
|
|
|
— |
|
|
|
— |
|
|
|
4,079 |
|
|
Amortization of closing shares |
|
|
|
|
|
|
|
|
|
|
1,298 |
|
|
|
— |
|
|
|
— |
|
|
|
1,298 |
|
|
Components of other comprehensive income: |
|
|
|
|
|
|
|
|
|
|
|
|
|
|
|
|
|
|
|
|
|
|
|
|
|
Net income |
|
|
— |
|
|
|
— |
|
|
|
— |
|
|
|
1,959 |
|
|
|
— |
|
|
|
1,959 |
|
|
Currency translation adjustment |
|
|
— |
|
|
|
— |
|
|
|
— |
|
|
|
— |
|
|
|
(46 |
) |
|
|
(46 |
) |
|
Change in unrealized gain (loss) on investments |
|
|
— |
|
|
|
— |
|
|
|
— |
|
|
|
— |
|
|
|
7 |
|
|
|
7 |
|
|
Total other comprehensive income |
|
|
|
|
|
|
|
|
|
|
|
|
|
|
|
|
|
|
|
|
|
|
1,920 |
|
|
Balance, September 30, 2016 |
|
|
32,781,704 |
|
|
$ |
33 |
|
|
$ |
71,036 |
|
|
$ |
(31,542 |
) |
|
$ |
(42 |
) |
|
$ |
39,485 |
|
The accompanying notes form an integral part of these consolidated financial statements.
F-6
CONSOLIDATED STATEMENTS OF CASH FLOWS
(amounts in thousands)
|
|
|
For the years ended September 30, |
|
|||||||||
|
|
|
2016 |
|
|
2015 |
|
|
2014 |
|
|||
|
OPERATING ACTIVITIES |
|
|
|
|
|
|
|
|
|
|
|
|
|
Net income (loss) |
|
$ |
1,959 |
|
|
$ |
2,526 |
|
|
$ |
(5,292 |
) |
|
Adjustments to reconcile net income (loss) to net cash used in operating activities: |
|
|
|
|
|
|
|
|
|
|
|
|
|
Stock-based compensation expense |
|
|
4,079 |
|
|
|
3,367 |
|
|
|
3,444 |
|
|
Amortization of closing and earnout shares |
|
|
1,503 |
|
|
|
393 |
|
|
|
— |
|
|
Amortization of intangible assets |
|
|
598 |
|
|
|
172 |
|
|
|
— |
|
|
Depreciation |
|
|
790 |
|
|
|
433 |
|
|
|
471 |
|
|
Accretion and amortization on debt securities |
|
|
149 |
|
|
|
426 |
|
|
|
401 |
|
|
Other |
|
|
— |
|
|
|
9 |
|
|
|
(5 |
) |
|
Changes in assets and liabilities: |
|
|
|
|
|
|
|
|
|
|
|
|
|
Accounts receivable |
|
|
(1,002 |
) |
|
|
(566 |
) |
|
|
(1,455 |
) |
|
Other assets |
|
|
(586 |
) |
|
|
(533 |
) |
|
|
(88 |
) |
|
Accounts payable |
|
|
(222 |
) |
|
|
(449 |
) |
|
|
(84 |
) |
|
Accrued payroll and related taxes |
|
|
1,197 |
|
|
|
480 |
|
|
|
(20 |
) |
|
Deferred revenue |
|
|
(67 |
) |
|
|
478 |
|
|
|
291 |
|
|
Deferred taxes |
|
|
(127 |
) |
|
|
(647 |
) |
|
|
— |
|
|
Other liabilities |
|
|
(417 |
) |
|
|
16 |
|
|
|
(132 |
) |
|
Net cash provided by (used in) operating activities |
|
|
7,854 |
|
|
|
6,105 |
|
|
|
(2,469 |
) |
|
INVESTING ACTIVITIES |
|
|
|
|
|
|
|
|
|
|
|
|
|
Purchases of investments |
|
|
(33,658 |
) |
|
|
(27,254 |
) |
|
|
(24,643 |
) |
|
Sales and maturities of investments |
|
|
30,623 |
|
|
|
21,406 |
|
|
|
11,667 |
|
|
Acquisition, net of cash acquired |
|
|
— |
|
|
|
(5,423 |
) |
|
|
— |
|
|
Purchases of property and equipment |
|
|
(250 |
) |
|
|
(73 |
) |
|
|
(135 |
) |
|
Sale of property and equipment |
|
|
— |
|
|
|
— |
|
|
|
1 |
|
|
Net cash used in investing activities |
|
|
(3,285 |
) |
|
|
(11,344 |
) |
|
|
(13,110 |
) |
|
FINANCING ACTIVITIES |
|
|
|
|
|
|
|
|
|
|
|
|
|
Proceeds from exercise of stock options |
|
|
1,755 |
|
|
|
246 |
|
|
|
70 |
|
|
Principal payments on capital lease obligations |
|
|
(22 |
) |
|
|
(20 |
) |
|
|
(19 |
) |
|
Net cash provided by financing activities |
|
|
1,733 |
|
|
|
226 |
|
|
|
51 |
|
|
Foreign currency effect on cash and cash equivalents |
|
|
(45 |
) |
|
|
(1 |
) |
|
|
— |
|
|
NET (DECREASE) INCREASE IN CASH AND CASH EQUIVALENTS |
|
|
6,257 |
|
|
|
(5,014 |
) |
|
|
(15,528 |
) |
|
CASH AND CASH EQUIVALENTS AT BEGINNING OF PERIOD |
|
|
2,753 |
|
|
|
7,767 |
|
|
|
23,295 |
|
|
CASH AND CASH EQUIVALENTS AT END OF PERIOD |
|
$ |
9,010 |
|
|
$ |
2,753 |
|
|
$ |
7,767 |
|
|
SUPPLEMENTAL DISCLOSURE OF CASH FLOW INFORMATION |
|
|
|
|
|
|
|
|
|
|
|
|
|
Cash paid for interest |
|
$ |
1 |
|
|
$ |
4 |
|
|
$ |
6 |
|
|
Cash paid for income taxes |
|
$ |
17 |
|
|
$ |
105 |
|
|
$ |
2 |
|
|
NON-CASH FINANCING AND INVESTING ACTIVITIES |
|
|
|
|
|
|
|
|
|
|
|
|
|
Settlement of note receivable as consideration for business acquisition |
|
$ |
— |
|
|
$ |
250 |
|
|
$ |
— |
|
|
Unrealized holding gain (loss) on available for sale investments |
|
$ |
7 |
|
|
$ |
5 |
|
|
$ |
(10 |
) |
The accompanying notes form an integral part of these consolidated financial statements.
F-7
NOTES TO CONSOLIDATED FINANCIAL STATEMENTS
FOR THE YEARS ENDED SEPTEMBER 30, 2016, 2015 AND 2014
1. NATURE OF OPERATIONS AND SUMMARY OF SIGNIFICANT ACCOUNTING POLICIES
Nature of Operations
Mitek Systems, Inc. (the “Company”) develops, markets and sells proprietary mobile capture and identity verification software solutions for enterprise customers.
The Company applies its patented technology in image capture, correction and intelligent data extraction in the mobile financial and business services markets. The Company’s technology allows users to remotely deposit checks, open accounts, get insurance quotes, pay bills as well as verify their identity by taking pictures of various documents with their camera-equipped smartphones and tablets instead of using the device keyboard. As of September 30, 2016, the Company’s has been granted 27 patents and it has an additional 16 patent applications pending.
The Mobile Verify™ products combine the Mitek MiSnap auto capture experience with a variety of advanced computer vision techniques to provide verification of ID documents. Mobile Verify provides a check of authenticity of U.S state-issued driver’s licenses and includes full global coverage. These products enable banks and other businesses to improve KYC processes. Mobile Fill™ enables the camera to serve as a keyboard. Using Mobile Fill, consumers can quickly pre-fill any form with personal data by simply snapping a picture of their driver license, credit card, or other document. The Company’s Mobile Deposit® product is software that allows users to remotely deposit a check using their camera-equipped smartphone or tablet. As of September 30, 2016, over 5,400 financial institutions have signed agreements to deploy Mobile Deposit®. These include all of the top ten, and nearly all of the top 50 U.S. retail banks. The Company’s mobile imaging software solutions are available for iOS and Android operating systems.
The Company markets and sells the Mitek Mobile Identity Suite of mobile capture and identity verification software products directly to enterprise customers or through channel partners. These software solutions are embedded in mobile banking or enterprise applications developed by banks, insurance companies or their partners, and then marketed under their own proprietary brands.
Basis of Presentation
The financial statements are prepared under the Financial Accounting Standards Board (“FASB”) Accounting Standards Codification (“ASC”) Topic 105-10, Generally Accepted Accounting Principles, in accordance with accounting principles generally accepted in the U.S. (“GAAP”).
Principles of Consolidation
The consolidated financial statements include the accounts of the Company and its wholly-owned subsidiaries. All significant intercompany balances and transactions have been eliminated in consolidation.
Foreign Currency
The Company has foreign subsidiaries that operate and sell its products and services in various countries and jurisdictions around the world. As a result, the Company is exposed to foreign currency exchange risks. For those subsidiaries whose functional currency is not the U.S. dollar, assets and liabilities are translated into U.S. dollars equivalents at the exchange rate in effect on the balance sheet date and revenues and expenses are translated into U.S. dollars using the average exchange rate over the period. Resulting currency translation adjustments are recorded in accumulated other comprehensive income in the consolidated balance sheet. The Company recorded net losses resulting from foreign exchange translation of $46,000 for the fiscal year ended September 30, 2016. There were no foreign exchange translation gains or losses recorded in fiscal 2015 and 2014.
Use of Estimates
The preparation of financial statements in conformity with GAAP requires management to make estimates and assumptions that affect the reported amounts of assets, liabilities, revenue, expenses and related disclosure of contingent assets and liabilities. On an ongoing basis, management reviews its estimates based upon currently available information. Actual results could differ materially from those estimates. These estimates include, but are not limited to, assessing the collectability of accounts receivable, estimation of the value of stock-based compensation awards, fair value of assets and liabilities acquired, impairment of goodwill, useful lives of intangible assets, vendor specific objective evidence (“VSOE”) of fair value related to revenue recognition and income taxes.
F-8
Goodwill and Purchased Intangible Assets
The Company’s goodwill resulted from the acquisition of IDchecker in fiscal year 2015. Goodwill and intangible assets with indefinite useful lives are not amortized, but are tested for impairment at least annually or as circumstances indicate that their value may no longer be recoverable. In accordance with ASC Topic 350, Intangibles—Goodwill and Other (“ASC Topic 350”), the Company reviews its goodwill and indefinite-lived intangible asset for impairment at least annually in its fiscal fourth quarter and more frequently if events or changes in circumstances occur that indicate a potential reduction in the fair value of its reporting unit and/or its indefinite-lived intangible asset below their respective carrying values. Examples of such events or circumstances include: a significant adverse change in legal factors or in the business climate, a significant decline in the Company’s stock price, a significant decline in the Company’s projected revenue or cash flows, an adverse action or assessment by a regulator, unanticipated competition, a loss of key personnel, or the presence of other indicators that would indicate a reduction in the fair value of a reporting unit.
The Company’s goodwill is considered to be impaired if management determines that the carrying value of the reporting unit to which the goodwill has been assigned exceeds management’s estimate of its fair value. Based on the guidance provided by ASC Topic 350 and ASC Topic 280, Segment Reporting, (“ASC Topic 280”) management has determined that the Company operates in one segment and consists of one reporting unit given the similarities in economic characteristics between its operations and the common nature of its products, services and customers. Because the Company has only one reporting unit, and because the Company is publicly traded, the Company determines the fair value of the reporting unit based on its market capitalization as it believe this represents the best evidence of fair value. In the fourth quarter of fiscal 2016, management completed its annual goodwill impairment test as of September 30, 2016 and concluded that the Company’s goodwill was not impaired. The Company’s conclusion that goodwill was not impaired was based on a comparison of its net assets as of September 30, 2016 to its market capitalization.
Because the Company determines the fair value of its reporting unit based on our market capitalization, the Company’s future reviews of goodwill for impairment may be impacted by changes in the price of its common stock. For example, a significant decline in the price of the Company’s common stock may cause the fair value of its goodwill to fall below its carrying value. Therefore, the Company cannot assure you that when it completes its future reviews of goodwill for impairment a material impairment charge will not be recorded.
Net Income (Loss) Per Share
The Company calculates net income (loss) per share in accordance with FASB ASC Topic 260, Earnings per Share. Basic net income (loss) per share is based on the weighted average number of common shares outstanding during the period. Diluted net income (loss) per share also gives effect to all potentially dilutive securities outstanding during the period, such as options, warrants and restricted stock units (“RSUs”), if dilutive. In a period with a net loss position, potentially dilutive securities are not included in the computation of diluted net loss because to do so would be antidilutive, and the number of shares used to calculate basic and diluted net loss is the same.
At September 30, 2016, 2015 and 2014, the following potentially dilutive common shares were excluded from the net income (loss) per share calculation, as they would have been antidilutive:
|
|
|
2016 |
|
|
2015 |
|
|
2014 |
|
|||
|
Stock options |
|
|
1,258,844 |
|
|
|
2,202,844 |
|
|
|
2,334,326 |
|
|
Warrants |
|
|
— |
|
|
|
— |
|
|
|
6,667 |
|
|
Restricted stock units |
|
|
623,883 |
|
|
|
287,147 |
|
|
|
1,101,303 |
|
|
IDchecker shares |
|
|
349,239 |
|
|
|
63,037 |
|
|
|
— |
|
|
Total potentially dilutive common shares outstanding |
|
|
2,231,966 |
|
|
|
2,553,028 |
|
|
|
3,442,296 |
|
F-9
The computation of basic and diluted net income (loss) per share for the fiscal years ended September 30, 2016, 2015 and 2014 is as follows (amounts in thousands, except share data):
|
|
|
2016 |
|
|
2015 |
|
|
2014 |
|
|||
|
Net income (loss) |
|
$ |
1,959 |
|
|
$ |
2,526 |
|
|
$ |
(5,292 |
) |
|
Weighted-average common shares and share equivalents outstanding—basic |
|
|
31,586,535 |
|
|
|
30,790,258 |
|
|
|
30,466,063 |
|
|
Dilutive potential common stock equivalents |
|
|
2,231,966 |
|
|
|
689,983 |
|
|
|
— |
|
|
Weighted-average common shares and share equivalents outstanding—diluted |
|
|
33,818,501 |
|
|
|
31,480,241 |
|
|
|
30,466,063 |
|
|
Net income (loss) per share: |
|
|
|
|
|
|
|
|
|
|
|
|
|
Basic |
|
$ |
0.06 |
|
|
$ |
0.08 |
|
|
$ |
(0.17 |
) |
|
Diluted |
|
$ |
0.06 |
|
|
$ |
0.08 |
|
|
$ |
(0.17 |
) |
Revenue Recognition
Revenue from sales of software licenses sold through direct and indirect channels is recognized upon shipment of the related product, if the requirements of FASB ASC Topic 985-605, Software Revenue Recognition (“ASC 985-605”) are met, including evidence of an arrangement, delivery, fixed or determinable fee, collectability and VSOE of the fair value of the undelivered element. If the requirements of ASC 985-605 are not met at the date of shipment, revenue is not recognized until such elements are known or resolved. Revenue from customer support services, or maintenance revenue, includes post-contract support and the rights to unspecified upgrades and enhancements. VSOE of fair value for customer support services is determined by reference to the price the customer pays for such element when sold separately; that is, the renewal rate offered to customers. In those instances when objective and reliable evidence of fair value exists for the undelivered items but not for the delivered items, the residual method is used to allocate the arrangement consideration. Under the residual method, the amount of arrangement consideration allocated to the delivered items equals the total arrangement consideration less the aggregate fair value of the undelivered items. Revenue from post-contract customer support is recognized ratably over the term of the contract. Certain customers have agreements that provide for usage fees above fixed minimums. Usage fees above fixed minimums are recognized as revenue when such amounts are reasonably estimable and billable. Revenue from professional services is recognized when such services are delivered. When a software sales arrangement requires professional services related to significant production, modification or customization of software, or when a customer considers professional services essential to the functionality of the software product, revenue is recognized based on predetermined milestone objectives required to complete the project, as those milestone objectives are deemed to be substantive in relation to the work performed. Any expected losses on contracts in progress are recorded in the period in which the losses become probable and reasonably estimable.
The Company provides hosting services that give customers access to software that resides on its servers. The Company’s model typically includes an up-front fee and a monthly commitment from the customer that commences upon completion of the implementation through the remainder of the customer life. The up-front fee is the initial setup fee, or the implementation fee. The monthly commitment includes, but is not limited to, a fixed monthly fee or a transactional fee based on system usage that exceeds monthly minimums. The Company does not view the signing of the contract or the provision of initial setup services as discrete earnings events that have stand-alone value. Revenue is typically deferred until the date the customer commences use of services, at which point the up-front fees are recognized ratably over the life of the customer arrangement.
Cash and Cash Equivalents
Cash and cash equivalents are defined as highly liquid financial instruments with original maturities of three months or less. A substantial portion of the Company’s cash is deposited with one financial institution. The Company monitors the financial condition of this financial institution and does not believe that funds on deposit are subject to a significant degree of risk.
F-10
Investments consist of corporate notes and bonds, and commercial paper. The Company classifies investments as available-for-sale at the time of purchase and reevaluates such classification as of each balance sheet date. All investments are recorded at estimated fair value. Unrealized gains and losses for available-for-sale securities are included in accumulated other comprehensive income, a component of stockholders’ equity. The Company evaluates its investments to assess whether those with unrealized loss positions are other than temporarily impaired. Impairments are considered to be other-than-temporary if they are related to deterioration in credit risk or if it is likely that the Company will sell the securities before the recovery of its cost basis. Realized gains and losses and declines in value judged to be other-than-temporary are determined based on the specific identification method and are reported in other income (expense), net in the statements of other comprehensive income (loss). No other-than-temporary impairment charges were recognized in the fiscal years ended September 30, 2016, 2015 and 2014.
All investments whose maturity or sale is expected within one year are classified as “current” on the balance sheet. All other securities are classified as “long-term” on the balance sheet.
Fair Value Measurements
The carrying amounts of cash equivalents, investments, accounts receivable, accounts payable and other accrued liabilities are considered representative of their respective fair values because of the short-term nature of those instruments.
Accounts Receivable and Allowance for Doubtful Accounts
Trade accounts receivable are recorded at the net invoice value and are not interest bearing. The Company considers receivables past due based on the contractual payment terms. Allowances for doubtful accounts are established based on various factors including credit profiles of the Company’s customers, contractual terms and conditions, historical payments, and current economic trends. The Company reviews its allowances by assessing individual accounts receivable over a specific aging and amount. Accounts receivable are written off on a case-by-case basis, net of any amounts that may be collected. The Company had no write-offs of the allowance for doubtful accounts for the years ended September 30, 2016 and 2015, respectively. The Company maintained an allowance for doubtful accounts of $35,000 and $13,000 as of September 30, 2016 and September 30, 2015, respectively.
Deferred Maintenance Fees
Deferred maintenance fees consist of capitalized costs associated with software maintenance fees paid to vendors who supply licenses and maintenance for software embedded in the Company’s products that it sells to customers. These software maintenance fees, which are included in other current assets on the balance sheet, are typically billed annually to the Company and are amortized to cost of revenue-maintenance and professional services in the statements of operations and other comprehensive income (loss) over the maintenance period, which is typically one year.
Property and Equipment
Property and equipment are carried at cost. The following is a summary of property and equipment as of September 30, 2016 and 2015 (amounts shown in thousands):
|
|
|
2016 |
|
|
2015 |
|
||
|
Property and equipment—at cost: |
|
|
|
|
|
|
|
|
|
Equipment |
|
$ |
1,476 |
|
|
$ |
1,281 |
|
|
Furniture and fixtures |
|
|
249 |
|
|
|
229 |
|
|
Leasehold improvements |
|
|
1,018 |
|
|
|
995 |
|
|
|
|
|
2,743 |
|
|
|
2,505 |
|
|
Less: accumulated depreciation and amortization |
|
|
(2,303 |
) |
|
|
(1,530 |
) |
|
Total property and equipment, net |
|
$ |
440 |
|
|
$ |
975 |
|
F-11
Depreciation and amortization of property and equipment are provided using the straight-line method over estimated useful lives ranging from three to five years. Leasehold improvements are amortized over the lease term. Depreciation and amortization of property and equipment totaled $0.8 million, $0.4 million and $0.5 million for the fiscal years ended September 30, 2016, 2015 and 2014, respectively. Included in property and equipment as of September 30, 2016 and 2015 in the table above is equipment of $0.1 million purchased under a capital lease. Depreciation expense related to the equipment purchased under the capital lease was $19,000 in the fiscal years ended September 30, 2016, 2015 and 2014, respectively, and accumulated depreciation was $0.1 million in each of the years ended September 30, 2016 and 2015, respectively. Expenditures for repairs and maintenance are charged to operations. Total repairs and maintenance expenses were $0.2 million, $0.1 million and $0.1 million for the fiscal years ended September 30, 2016, 2015 and 2014, respectively.
Long-Lived Assets
The Company evaluates the carrying value of long-lived assets, including license agreements and other intangible assets, when events and circumstances indicate that these assets may be impaired or in order to determine whether any revision to the related amortization periods should be made. This evaluation is based on management’s projections of the undiscounted future cash flows associated with each product or asset. If management’s evaluation indicates that the carrying values of these intangible assets were impaired, the impairment to be recognized is measured by the amount by which the carrying amount of the assets exceeds the fair value of the assets. The Company did not record any impairment for the fiscal years ended September 30, 2016, 2015 and 2014.
Capitalized Software Development Costs
Costs incurred for the development of software that will be sold, leased, or otherwise marketed are capitalized when technological feasibility has been established. Software development costs consist primarily of compensation of development personnel and related overhead incurred to develop new products and upgrade and enhance the Company’s current products, as well as fees paid to outside consultants. Capitalization of software development costs ceases and amortization of capitalized software development costs commences when the products are available for general release. For the fiscal years ended September 30, 2016 and 2015, no software development costs were capitalized because the time period and cost incurred between technological feasibility and general release for all software product releases were not material.
Deferred Revenue
Deferred revenues represent advance payments or billings for software licenses, professional services and maintenance billed in advance of the time we recognize the related revenues. Deferred maintenance revenue represents customer billings, paid up front, generally annually at the beginning of each maintenance period, with revenue recognized ratably over such period. For certain other licensing arrangements, revenue attributable to undelivered elements, including post-contract customer support which typically includes telephone support and the right to receive unspecified upgrades and enhancements of software on a when-and-if-available basis, is based upon the sales price of those elements when sold separately and is recognized ratably on a straight-line basis over the term of the arrangement.
Guarantees
In the ordinary course of business, the Company is not subject to potential obligations under guarantees that fall within the scope of FASB ASC Topic 460, Guarantees (“ASC 460”), except for standard indemnification and warranty provisions that are contained within many of the Company’s customer license and service agreements and certain supplier agreements, and give rise only to the disclosure requirements prescribed by ASC 460. Indemnification and warranty provisions contained within the Company’s customer license and service agreements and certain supplier agreements are generally consistent with those prevalent in the Company’s industry. The Company has not historically incurred significant obligations under customer indemnification or warranty provisions and does not expect to incur significant obligations in the future. Accordingly, the Company does not maintain accruals for potential customer indemnification or warranty-related obligations.
Loss Contingencies
The Company records its best estimates of a loss contingency when it is considered probable and the amount can be reasonably estimated. When a range of loss can be reasonably estimated with no best estimate in the range, the Company records the minimum estimated liability related to the claim. As additional information becomes available, the Company assesses the potential liability related to the Company’s pending loss contingency and revises its estimates. The Company discloses contingencies if there is at least a reasonable possibility that a material loss or a material additional loss may have been incurred. The Company’s legal costs are expensed as incurred.
F-12
The Company accounts for income taxes in accordance with FASB ASC Topic 740, Income Taxes (“ASC 740”). Deferred tax assets and liabilities arise from temporary differences between the tax bases of assets and liabilities and their reported amounts in the financial statements that will result in taxable or deductible amounts in future years.
Management evaluates the available evidence about future taxable income and other possible sources of realization of deferred tax assets. The valuation allowance reduces deferred tax assets to an amount that represents management’s best estimate of the amount of such deferred tax assets that more likely than not will be realized. See Note 6 for additional details.
The Company recognizes the tax benefit from an uncertain tax position only if it is more likely than not that the tax position will be sustained on examination by the tax authorities, based on the technical merits of the position. The tax benefit is measured based on the largest benefit that has a greater than 50% likelihood of being realized upon ultimate settlement. The Company recognizes interest and penalties related to income tax matters in income tax expense. See Note 6 for additional details.
Stock-Based Compensation
The Company records stock-based compensation in accordance with FASB ASC Topic 718, Compensation-Stock Compensation (“ASC 718”). The Company estimates the fair value of stock options using the Black-Scholes option pricing model. The fair value of stock options granted is recognized as an expense over the requisite service period. Stock-based compensation expense for all share-based payment awards is recognized using the straight-line single-option method.
The Black-Scholes option pricing model requires subjective assumptions, including future stock price volatility and expected time to exercise, which greatly affect the calculated values. The expected term of options granted is derived from historical data on employee exercises and post-vesting employment termination behavior. The risk-free rate selected to value any particular grant is based on the U.S. Treasury rate that corresponds to the expected life of the grant effective as of the date of the grant. The expected volatility is based on the historical volatility of the Company’s stock price. These factors could change in the future, affecting the determination of stock-based compensation expense in future periods.
Advertising Expense
Advertising costs are expensed as incurred and totaled $0.2 million, $0.2 million and $0.1 million during the fiscal years ended September 30, 2016, 2015 and 2014, respectively.
Research and Development
Research and development costs are expensed in the period incurred.
Leases
Leases are reviewed and classified as capital or operating at their inception. For leases that contain rent escalations, the Company records the total rent payable on a straight-line basis over the term of the lease. The difference between rent payments and straight-line rent expense is recorded as deferred rent.
Segment Reporting
FASB ASC Topic 280, Segment Reporting, requires the use of a management approach in identifying segments of an enterprise. During the fiscal year ended September 30, 2016, management determined that the Company has only one operating segment: the development, sale and service of proprietary software solutions related to mobile imaging.
F-13
Comprehensive loss consists of net loss and unrealized gains and losses on available-for-sale securities and foreign currency translation adjustments. The following table summarizes the components of comprehensive loss for the fiscal years ended September 30, 2016, 2015 and 2014 (amounts shown in thousands):
|
|
|
2016 |
|
|
2015 |
|
|
2014 |
|
|||
|
Net income (loss) |
|
$ |
1,959 |
|
|
$ |
2,526 |
|
|
$ |
(5,292 |
) |
|
Other comprehensive income (loss): |
|
|
|
|
|
|
|
|
|
|
|
|
|
Foreign currency translation adjustment |
|
|
(46 |
) |
|
|
— |
|
|
|
— |
|
|
Change in unrealized gains (losses) on marketable securities |
|
|
7 |
|
|
|
5 |
|
|
|
(10 |
) |
|
Total comprehensive income (loss) |
|
$ |
1,920 |
|
|
$ |
2,531 |
|
|
$ |
(5,302 |
) |
Included on the balance sheet at September 30, 2016 is an accumulated other comprehensive loss of $42,000, compared to an accumulated other comprehensive loss of $3,000 at September 30, 2015.
Recent Accounting Pronouncements
On November 20, 2015, the FASB issued Accounting Standards Update (“ASU”) No 2015-17, Income Taxes (Topic 740): Balance Sheet Classification of Deferred Taxes (“ASU 2015-17”), which requires all deferred tax assets and liabilities to be classified as noncurrent on the balance sheet. The new accounting guidance is effective for annual reporting periods beginning after December 31, 2016 and interim periods therein. Early adoption is permitted as of the beginning of interim or annual reporting periods. The Company has adopted the standard prospectively as of September 30, 2016 and no adjustment was made to prior periods.
In May 2014, the FASB issued guidance codified in ASC No. 606, Revenue Recognition – Revenue from Contracts with Customers (“ASC 606”), which amends the guidance in former ASC No. 605, Revenue Recognition. This accounting standard update will be effective for the Company beginning in the first quarter of fiscal 2019. The Company is currently evaluating the impact of the provisions of ASC 606 on its consolidated financial statements.
In September 2015, the FASB issued ASU No. 2015-16, Simplifying the Accounting for Measurement-Period Adjustments (Topic 805) (“ASU 2015-16”), which eliminates the requirement to restate prior period financial statements for measurement period adjustments. ASU 2015-16 requires that the cumulative impact of a measurement period adjustment (including the impact on prior periods) be recognized in the reporting period in which the adjustment is identified. The new standard is effective for interim and annual periods beginning after December 15, 2015 and early adoption is permitted. The Company does not believe the adoption of ASU 2015-16 will have a material impact on its consolidated financial statements
In January 2016, the FASB issued ASU No. 2016-01, Financial Instruments—Overall (Subtopic 825-10) Recognition and Measurement of Financial Assets and Financial Liabilities (“ASU 2016-01”). ASU 2016-01 is intended to provide users of financial statements with more useful information on the recognition, measurement, presentation, and disclosure of financial instruments. ASU 2016-01 is effective for fiscal years beginning after December 15, 2017 with early adoption permitted. The Company is assessing the impact of adopting ASU 2016-01 on its consolidated financial statements.
In February 2016, the FASB issued ASU No. 2016-02, Leases (Topic 842) (ASU 2016-02), which requires lessees to recognize assets and liabilities for operating leases with lease terms greater than twelve months in the balance sheet. The update also requires improved disclosures to help users of financial statements better understand the amount, timing and uncertainty of cash flows arising from leases. ASU 2016-02 is effective for fiscal years beginning after December 15, 2018, including interim periods within those fiscal years, with early adoption permitted. The Company is currently evaluating the impact of the adoption of ASU 2016-02 on its consolidated financial statements.
In March 2016, the FASB issued ASU No. 2016-09, Stock Compensation (Topic 718): Improvements to Employee Share-Based Payment Accounting (“ASU 2016-19”), as part of the initiative to reduce complexity in accounting standards. The areas for simplification in ASU 2016-09 involve several aspects of the accounting for employee share-based payment transactions, including the income tax consequences, classification of awards as either equity or liabilities, or classification on the statement of cash flows. ASU 2016-09 is effective for the Company beginning in its first quarter of fiscal 2018. The Company is currently evaluating the impact of adopting the new stock compensation standard on its consolidated financial statements.
F-14
In June 2016, the FASB issued ASU No. 2016-13, Financial Instruments – Credit Losses (Topic 326): Measurement of Credit Losses on Financial Instruments (“ASU 2016-13”), which requires entities to use a Current Expected Credit Loss model which is a new impairment model based on expected losses rather than incurred losses. Under this model, an entity would recognize an impairment allowance equal to its current estimate of all contractual cash flows that the entity does not expect to collect from financial assets measured at amortized cost. The entity's estimate would consider relevant information about past events, current conditions and reasonable and supportable forecasts. ASU 2016-13 is effective for interim and annual reporting periods beginning after December 31, 2019 with early adoption permitted for annual reporting periods beginning after December 31, 2018. The Company is currently evaluating the impact ASU 2016-13 will have on its consolidated financial statements
2. BUSINESS COMBINATION
On June 17, 2015, the Company completed the acquisition (the “Acquisition”) of IDchecker NL B.V., a company incorporated under the laws of the Netherlands (“IDC NL”), and ID Checker, Inc., a California corporation and wholly owned subsidiary of IDC NL (“IDC Inc” and together with IDC NL, “IDchecker”), pursuant to a Share Purchase Agreement (the “Share Purchase Agreement”) dated May 26, 2015, by and among the Company, IDC NL, ID Checker Holding B.V. (“Parent”), Stichting Administratiekantoor OPID (together with Parent, the “Sellers”), and the other individuals specified therein. Upon completion of the Acquisition, IDC NL and IDC Inc became wholly owned subsidiaries of the Company. IDchecker is a provider of cloud-based identification document verification services.
Pursuant to the terms of the Share Purchase Agreement, the Company acquired all of the issued and outstanding shares of IDC NL and IDC Inc. At the closing of the Acquisition, the Company paid a purchase price of $5.9 million, which consists of (i) a cash payment to the Sellers of $5.6 million, subject to adjustments for transaction expenses, indebtedness, and working capital adjustments (the “Cash Payment”) and (ii) the forgiveness of the outstanding balance of approximately $0.3 million on a promissory note issued by the Company to Parent. In addition, approximately $2.7 million in shares of the Company’s common stock (the “Closing Shares”), par value $0.001 per share (“Common Stock”), or 712,790 shares, were issued to the Sellers, and subject to the achievement of certain revenue and net income targets by IDchecker for the nine-month period ending on September 30, 2015, and the twelve-month period ending on September 30, 2016, the Company will issue to the Sellers up to an aggregate of $2.0 million in shares of Common Stock (the “Earnout Shares”). Vesting of both the Closing Shares and Earnout Shares (if any) is subject to the continued employment of the founders of IDchecker and such shares are being accounted for as compensation for future services in accordance with ASC 718 Compensation – Stock Compensation. For additional information regarding the Closing Shares and Earnout Shares, see Note 5 to these consolidated financial statements.
Upon the closing of the Acquisition, the Company deposited $1.8 million of the Cash Payment and 20% of the Closing Shares into an escrow fund to serve as collateral and partial security for working capital adjustments and certain indemnification rights. To the extent any Earnout Shares are issued to the Sellers, 20% of such Earnout Shares will be placed in the escrow fund. The escrow fund will be maintained for up to 24 months following the last issuance of Earnout Shares or until such earlier time as the escrow fund is exhausted.
The purchase price is subject to a post-closing adjustment in net working capital as provided in the Share Purchase Agreement.
The following table summarizes the estimated fair values of the assets acquired and liabilities assumed as part of the Acquisition as of June 17, 2015 (amounts shown in thousands):
|
|
|
June 17, 2015 |
|
|
|
Current assets |
|
$ |
620 |
|
|
Property, plant and equipment |
|
|
42 |
|
|
Intangible assets |
|
|
3,570 |
|
|
Assets acquired |
|
$ |
4,232 |
|
|
Current liabilities |
|
$ |
(476 |
) |
|
Other liabilities |
|
|
(810 |
) |
|
Liabilities assumed |
|
$ |
(1,286 |
) |
|
Fair value of net assets acquired |
|
$ |
2,946 |
|
|
Total consideration paid |
|
|
5,819 |
|
|
Goodwill before effect in exchange rates |
|
$ |
2,873 |
|
|
Effect of movements in exchange rates |
|
|
(10 |
) |
|
Goodwill |
|
$ |
2,863 |
|
F-15
The Company estimated the fair value of identifiable acquisition-related intangible assets primarily based on discounted cash flow projections that will arise from these assets. The Company exercised significant judgment with regard to assumptions used in the determination of fair value such as discount rates and the determination of the estimated useful lives of the intangible assets, see Note 4. The excess of the purchase price over the fair value of the assets acquired and liabilities assumed was allocated to goodwill. Goodwill in the amount of $2.9 million was recorded. The goodwill recognized is due to expected synergies and other factors and it is not expected to be deductible for income tax purposes.
3. INVESTMENTS
The Company determines the appropriate designation of investments at the time of purchase and reevaluates such designation as of each balance sheet date. All of the Company’s investments are designated as available-for-sale debt securities. As of September 30, 2016 and 2015, the Company’s short-term investments have maturity dates of greater than 90 days and less than one year from the balance sheet date. The Company’s long-term investments have maturity dates of greater than one year from the balance sheet date.
Available-for-sale marketable securities are carried at fair value as determined by quoted market prices for identical or similar assets, with unrealized gains and losses, net of tax, and reported as a separate component of stockholders’ equity. Management reviews the fair value of the portfolio at least monthly, and evaluates individual securities with fair value below amortized cost at the balance sheet date. For debt securities, in order to determine whether impairment is other-than-temporary, management must conclude whether the Company intends to sell the impaired security and whether it is more likely than not that the Company will be required to sell the security before recovering its amortized cost basis. If management intends to sell an impaired debt security or it is more likely than not the Company will be required to sell the security prior to recovering its amortized cost basis, an other-than-temporary impairment is deemed to have occurred. The amount of an other-than-temporary impairment related to a credit loss, or securities that management intends to sell before recovery, is recognized in earnings. The amount of an other-than-temporary impairment on debt securities related to other factors is recorded consistent with changes in the fair value of all other available-for-sale securities as a component of stockholders’ equity in other comprehensive income. No other-than-temporary impairment charges were recognized in the fiscal years ended September 30, 2016, 2015 and 2014.
The cost of securities sold is based on the specific identification method. Amortization of premiums, accretion of discounts, interest, dividend income, and realized gains and losses are included in investment income.
The following table summarizes investments by security type as of September 30, 2016 and 2015 (amounts shown in thousands):
|
|
|
September 30, 2016 |
|
|||||||||||||
|
|
|
Cost |
|
|
Gross Unrealized Gains |
|
|
Gross Unrealized Losses |
|
|
Fair Market Value |
|
||||
|
Available-for-sale securities: |
|
|
|
|
|
|
|
|
|
|
|
|
|
|
|
|
|
US Treasury |
|
$ |
12,907 |
|
|
$ |
8 |
|
|
$ |
— |
|
|
$ |
12,915 |
|
|
Corporate debt securities, short-term |
|
|
11,949 |
|
|
|
2 |
|
|
|
(3 |
) |
|
|
11,948 |
|
|
Corporate debt securities, long-term |
|
|
1,954 |
|
|
|
1 |
|
|
|
(3 |
) |
|
|
1,952 |
|
|
Total |
|
$ |
26,810 |
|
|
$ |
11 |
|
|
$ |
(6 |
) |
|
$ |
26,815 |
|
|
|
|
September 30, 2015 |
|
|||||||||||||
|
|
|
Cost |
|
|
Gross Unrealized Gains |
|
|
Gross Unrealized Losses |
|
|
Fair Market Value |
|
||||
|
Available-for-sale securities: |
|
|
|
|
|
|
|
|
|
|
|
|
|
|
|
|
|
Corporate debt securities, short-term |
|
$ |
23,924 |
|
|
$ |
3 |
|
|
$ |
(6 |
) |
|
$ |
23,921 |
|
|
Total |
|
$ |
23,924 |
|
|
$ |
3 |
|
|
$ |
(6 |
) |
|
$ |
23,921 |
|
F-16
Fair Value Measurements and Disclosures
FASB ASC Topic 820, Fair Value Measurements (“ASC 820”) defines fair value, establishes a framework for measuring fair value under GAAP and enhances disclosures about fair value measurements. Fair value is defined under ASC 820 as the exchange price that would be received for an asset or paid to transfer a liability (an exit price) in the principal or most advantageous market for the asset or liability in an orderly transaction between market participants on the measurement date. Valuation techniques used to measure fair value under ASC 820 must maximize the use of observable inputs and minimize the use of unobservable inputs. ASC 820 describes a fair value hierarchy based on three levels of inputs, of which the first two are considered observable and the last unobservable, that may be used to measure fair value which consists of the following:
|
|
• |
Level 1—Quoted prices in active markets for identical assets or liabilities; |
|
|
• |
Level 2—Inputs other than Level 1 that are observable, either directly or indirectly, such as quoted prices for similar assets or liabilities; quoted prices in markets that are not active; or other inputs that are observable or can be corroborated by observable market data for substantially the full term of the assets or liabilities; and |
|
|
• |
Level 3—Unobservable inputs that are supported by little or no market activity and that are significant to the fair value of the assets or liabilities. |
Fair value measurements are classified according to the lowest level input or value-driver that is significant to the valuation. A measurement may therefore be classified within Level 3 even though there may be significant inputs that are readily observable.
Because many fixed income securities do not trade on a daily basis or have market prices from multiple sources, the pricing applications may apply available information as applicable to determine the fair value as of the measurement date. This methodology applies to the Company’s Level 2 investments. Currently, the Company does not hold any Level 3 investments.
F-17
The Company recorded an acquisition-related liability for contingent consideration representing the amounts payable to former IDchecker shareholders, as outlined under the terms of the Share Purchase Agreement, subject to the achievement of certain revenue and net income targets by IDchecker for the nine-month period ended on September 30, 2015, and the twelve-month period ended September 30, 2016. The fair value of this Level 3 liability is estimated using the Monte-Carlo simulation (using the Company’s stock price, the annual risk-free interest rate, expected volatility, the probability of reaching the performance targets and a 10 trading day average stock price). Subsequent changes in the fair value of the contingent consideration liability were recorded in the consolidated statement of operations and comprehensive income (loss) and resulted from updates to assumed probability of achievement of the performance targets and adjustments to the inputs discussed previously (amounts shown in thousands).
|
|
|
Balance |
|
|
Quoted Prices in Active Markets (Level 1) |
|
|
Significant Other Observable Inputs (Level 2) |
|
|
Significant Unobservable Inputs (Level 3) |
|
||||
|
September 30, 2016: |
|
|
|
|
|
|
|
|
|
|
|
|
|
|
|
|
|
Assets: |
|
|
|
|
|
|
|
|
|
|
|
|
|
|
|
|
|
Short-term investments: |
|
|
|
|
|
|
|
|
|
|
|
|
|
|
|
|
|
US Treasury |
|
$ |
12,915 |
|
|
$ |
12,915 |
|
|
$ |
— |
|
|
$ |
— |
|
|
Corporate debt securities |
|
|
|
|
|
|
|
|
|
|
|
|
|
|
|
|
|
Financial |
|
|
3,963 |
|
|
|
— |
|
|
|
3,963 |
|
|
|
— |
|
|
Industrial |
|
|
4,445 |
|
|
|
— |
|
|
|
4,445 |
|
|
|
— |
|
|
Commercial paper |
|
|
|
|
|
|
|
|
|
|
|
|
|
|
|
|
|
Industrial |
|
|
697 |
|
|
|
— |
|
|
|
697 |
|
|
|
— |
|
|
Financial |
|
|
2,843 |
|
|
|
— |
|
|
|
2,843 |
|
|
|
— |
|
|
Total short-term investments at fair value |
|
|
24,863 |
|
|
|
12,915 |
|
|
|
11,948 |
|
|
|
— |
|
|
Long-term investments: |
|
|
|
|
|
|
|
|
|
|
|
|
|
|
|
|
|
Corporate debt securities |
|
|
|
|
|
|
|
|
|
|
|
|
|
|
|
|
|
Financial |
|
|
502 |
|
|
|
— |
|
|
|
502 |
|
|
|
— |
|
|
Industrial |
|
|
1,450 |
|
|
|
— |
|
|
|
1,450 |
|
|
|
— |
|
|
Total assets at fair value |
|
$ |
26,815 |
|
|
$ |
12,915 |
|
|
$ |
13,900 |
|
|
$ |
— |
|
|
Liabilities: |
|
|
|
|
|
|
|
|
|
|
|
|
|
|
|
|
|
Acquisition-related contingent consideration |
|
|
252 |
|
|
|
— |
|
|
|
— |
|
|
|
252 |
|
|
Total liabilities at fair value |
|
$ |
252 |
|
|
$ |
— |
|
|
$ |
— |
|
|
$ |
252 |
|
|
|
|
|
|
|
|
|
|
|
|
|
|
|
|
|
|
|
|
September 30, 2015: |
|
|
|
|
|
|
|
|
|
|
|
|
|
|
|
|
|
Assets: |
|
|
|
|
|
|
|
|
|
|
|
|
|
|
|
|
|
Short-term investments: |
|
|
|
|
|
|
|
|
|
|
|
|
|
|
|
|
|
Corporate debt securities |
|
|
|
|
|
|
|
|
|
|
|
|
|
|
|
|
|
Financial |
|
$ |
10,308 |
|
|
$ |
— |
|
|
$ |
10,308 |
|
|
$ |
— |
|
|
Industrial |
|
|
9,665 |
|
|
|
— |
|
|
|
9,665 |
|
|
|
— |
|
|
Utility |
|
|
1,802 |
|
|
|
— |
|
|
|
1,802 |
|
|
|
— |
|
|
Commercial paper |
|
|
|
|
|
|
|
|
|
|
|
|
|
|
|
|
|
Industrial |
|
|
1,448 |
|
|
|
— |
|
|
|
1,448 |
|
|
|
— |
|
|
Financial |
|
|
698 |
|
|
|
— |
|
|
|
698 |
|
|
|
— |
|
|
Total assets at fair value |
|
$ |
23,921 |
|
|
$ |
— |
|
|
$ |
23,921 |
|
|
$ |
— |
|
|
Liabilities: |
|
|
|
|
|
|
|
|
|
|
|
|
|
|
|
|
|
Acquisition-related contingent consideration |
|
|
47 |
|
|
|
— |
|
|
|
— |
|
|
|
47 |
|
|
Total liabilities at fair value |
|
$ |
47 |
|
|
$ |
— |
|
|
$ |
— |
|
|
$ |
47 |
|
The following table includes a summary of the Acquisition-related contingent consideration measured at fair value using significant unobservable inputs (Level 3) during the year ended September 30, 2016 (amounts shown in thousands):
|
Balance at September 30, 2015 |
|
|
|
|
|
$ |
47 |
|
|
Expenses recorded due to changes in fair value |
|
|
|
|
293 |
|
||
|
Issuance of common stock |
|
|
|
|
|
|
(88 |
) |
|
Balance at September 30, 2016 |
|
|
|
|
|
$ |
252 |
|
F-18
4. GOODWILL AND INTANGIBLE ASSETS
Goodwill
The Company has goodwill balances of $2.9 million at September 30, 2016 and September 30, 2015, associated with the acquisition of IDchecker which occurred during 2015. For information regarding the acquisition of IDchecker, see Note 2. Goodwill represents the excess of costs over fair value of assets of businesses acquired. Goodwill acquired in a business combination and determined to have an indefinite useful life is not amortized, but instead is tested for impairment at least annually in accordance with the FASB ASC Topic 350, Intangibles – Goodwill and Other. The Company has concluded that no impairment of goodwill exists as of September 30, 2016.
Intangible assets
Intangible assets include the value assigned to completed technology, customer relationships, and trade names. The estimated useful lives for all of these intangible assets, range from five to six years. Intangible assets are summarized as follows (amounts shown in thousands, except for years):
|
|
|
Weighted Average Amortization Period |
|
Cost |
|
|
Accumulated Amortization |
|
|
Net |
|
|||
|
Completed technologies |
|
6 years |
|
$ |
2,370 |
|
|
$ |
516 |
|
|
$ |
1,854 |
|
|
Customer relationships |
|
6 years |
|
|
970 |
|
|
|
211 |
|
|
|
759 |
|
|
Tradenames |
|
5 years |
|
|
230 |
|
|
|
60 |
|
|
|
170 |
|
|
Total intangible assets |
|
|
|
$ |
3,570 |
|
|
$ |
787 |
|
|
$ |
2,783 |
|
Amortization expense related to acquired intangible assets was $0.6 million and $0.2 million for fiscal year ended September 30, 2016 and 2015, respectively. There was no amortization expense related to intangibles assets during fiscal 2014.
The estimated future amortization expense related to intangible assets for each of the five succeeding fiscal years is expected to be as follows (amounts shown in thousands):
|
|
|
Estimated Future Amortization Expense |
|
|
|
2017 |
|
$ |
601 |
|
|
2018 |
|
|
601 |
|
|
2019 |
|
|
601 |
|
|
2020 |
|
|
587 |
|
|
2021 |
|
|
393 |
|
|
Thereafter |
|
|
— |
|
|
|
|
$ |
2,783 |
|
5. STOCKHOLDERS’ EQUITY
Common Stock
In June 2013, the Company sold 2,857,142 shares of its common stock at a price of $5.25 per share in an underwritten public offering (the “Offering”) and received $13.9 million in net proceeds, after deducting underwriting discounts and commissions and other offering expenses of $1.1 million. Under the terms of the underwriting agreement for the Offering, the Company granted the underwriter a 30-day option to purchase an additional 428,571 shares of its common stock to cover overallotments. The underwriter exercised its overallotment option during June 2013 and the closing of the sale of shares of the Company’s common stock pursuant to such option occurred during July 2013, resulting in $2.1 million in additional net proceeds to the Company, after deducting other offering expenses of $0.1 million.
Warrants
Historically, the Company has granted warrants to purchase its common stock to service providers and investors. As of September 30, 2014, there were warrants to purchase 6,667 shares of the Company’s common stock outstanding with an exercise price of $0.91 per share, subject to adjustment for stock splits, stock dividends and the like. These warrants expired in December 2014.
F-19
The Company applies the fair value recognition provisions of ASC 718.
The fair value of stock options granted to employees and directors is calculated using the Black-Scholes option pricing model. The Black-Scholes option pricing model requires subjective assumptions, including future stock price volatility and expected time to exercise, which greatly affect the calculated values. The expected term of options granted is derived from historical data on employee exercises and post-vesting employment termination behavior. The risk-free rate selected to value any particular grant is based on the U.S. Treasury rate that corresponds to the expected life of the grant effective as of the date of the grant. The expected volatility is based on the historical volatility of the Company’s stock price. These factors could change in the future, affecting the determination of stock-based compensation expense in future periods.
The value of stock-based compensation is based on the single option valuation approach under ASC 718. It is assumed no dividends will be declared. The estimated fair value of stock-based compensation awards is amortized using the straight-line method over the vesting period of the option.
ASC 718 requires forfeitures to be estimated at the time of grant and revised, if necessary, in subsequent periods if actual forfeitures differ from those estimates. The estimated average forfeiture rate for the fiscal year ended September 30, 2016 of 12.1% for all stock option grants was based on historical forfeiture experience.
ASC 718 requires the cash flows from tax benefits resulting from tax deductions in excess of the compensation cost recognized for options to be classified as financing cash flows. Due to the Company’s valuation allowance from losses in the previous years, there were no such tax benefits during the fiscal years ended September 30, 2016, 2015 and 2014.
No stock options were granted to employees during the fiscal year ended September 30, 2014. The fair value calculations for stock-based compensation awards to employees for the fiscal years ended September 30, 2016 and 2015 were based on the following assumptions:
|
|
|
2016 |
|
|
2015 |
|
||
|
Risk-free interest rate |
|
1.43% - 1.66% |
|
|
1.29% - 1.66% |
|
||
|
Expected life (years) |
|
5.9 |
|
|
5.3 |
|
||
|
Expected volatility |
|
|
83% |
|
|
|
90% |
|
|
Expected dividends |
|
None |
|
|
None |
|
||
The following table summarizes stock-based compensation expense under ASC 718 for the fiscal years ended September 30, 2016, 2015 and 2014, which were allocated as follows (amounts shown in thousands):
|
|
|
2016 |
|
|
2015 |
|
|
2014 |
|
|||
|
Sales and marketing |
|
$ |
1,122 |
|
|
$ |
743 |
|
|
$ |
824 |
|
|
Research and development |
|
|
669 |
|
|
|
592 |
|
|
|
675 |
|
|
General and administrative |
|
|
2,288 |
|
|
|
2,032 |
|
|
|
1,945 |
|
|
Acquisition-related costs and expenses |
|
|
1,503 |
|
|
|
393 |
|
|
|
— |
|
|
Stock-based compensation expense related to employee stock options included in operating expenses |
|
$ |
5,582 |
|
|
$ |
3,760 |
|
|
$ |
3,444 |
|
The following table summarizes vested and unvested options, weighted average exercise price per share, weighted average remaining term and aggregate intrinsic value at September 30, 2016:
|
|
|
Number of Shares |
|
|
Weighted Average Exercise Price Per Share |
|
|
Weighted Average Remaining Contractual Life (in Years) |
|
|
Aggregate Intrinsic Value |
|
||||
|
Vested |
|
|
2,107,825 |
|
|
$ |
4.31 |
|
|
|
5.55 |
|
|
$ |
9,491,803 |
|
|
Unvested |
|
|
907,549 |
|
|
$ |
3.11 |
|
|
|
8.33 |
|
|
|
4,700,241 |
|
|
Total |
|
|
3,015,374 |
|
|
$ |
3.95 |
|
|
|
6.39 |
|
|
$ |
14,192,044 |
|
F-20
The Company recognized $1.3 million, $2.2 million and $2.2 million in stock-based compensation expense related to outstanding stock options in the fiscal years ended September 30, 2016, 2015 and 2014, respectively. As of September 30, 2016, the Company had $2.0 million of unrecognized compensation expense related to outstanding stock options expected to be recognized over a weighted average period of approximately 2.3 years.
The following table summarizes stock option activity under the Company’s stock option plans during the fiscal years ended September 30, 2016, 2015 and 2014:
|
|
|
Number of Shares |
|
|
Weighted Average Exercise Price Per Share |
|
|
Weighted Average Remaining Contractual Term (in Years) |
|
|||
|
Outstanding, September 30, 2013 |
|
|
2,824,964 |
|
|
$ |
4.09 |
|
|
|
7.29 |
|
|
Granted |
|
|
— |
|
|
$ |
— |
|
|
|
|
|
|
Exercised |
|
|
(108,135 |
) |
|
$ |
1.27 |
|
|
|
|
|
|
Cancelled |
|
|
(382,503 |
) |
|
$ |
4.77 |
|
|
|
|
|
|
Outstanding, September 30, 2014 |
|
|
2,334,326 |
|
|
$ |
4.11 |
|
|
|
5.46 |
|
|
Granted |
|
|
1,927,500 |
|
|
$ |
2.92 |
|
|
|
|
|
|
Exercised |
|
|
(232,203 |
) |
|
$ |
1.06 |
|
|
|
|
|
|
Cancelled |
|
|
(381,918 |
) |
|
$ |
3.85 |
|
|
|
|
|
|
Outstanding, September 30, 2015 |
|
|
3,647,705 |
|
|
$ |
3.70 |
|
|
|
7.15 |
|
|
Granted |
|
|
98,500 |
|
|
$ |
4.51 |
|
|
|
|
|
|
Exercised |
|
|
(661,663 |
) |
|
$ |
2.67 |
|
|
|
|
|
|
Cancelled |
|
|
(69,168 |
) |
|
$ |
4.51 |
|
|
|
|
|
|
Outstanding, September 30, 2016 |
|
|
3,015,374 |
|
|
$ |
3.95 |
|
|
|
6.39 |
|
The total intrinsic value of options exercised during the fiscal years ended September 30, 2016, 2015 and 2014 was $3.3 million, $0.6 million and $0.5 million, respectively. The per-share weighted average fair value of options granted during the fiscal years ended September 30, 2016 and 2015 was $3.29 and $2.83, respectively. No stock options were granted to employees during the fiscal year ended September 30, 2014.
2012 Incentive Plan
In January 2012, the Company’s board of directors adopted the Mitek Systems, Inc. 2012 Incentive Plan (the “2012 Plan”), upon the recommendation of the compensation committee of the board of directors. The 2012 Plan was approved by the Company’s stockholders on February 22, 2012. On February 19, 2014, the Company’s stockholders approved an amendment to the 2012 Plan that increased the total number of shares of the Company’s common stock reserved for issuance thereunder from 2,000,000 shares to 4,000,000 shares, plus that number of shares of the Company’s common stock that would otherwise return to the available pool of unissued shares reserved for awards under the Company’s 1999 Stock Option Plan, 2000 Stock Option Plan, 2002 Stock Option Plan, 2006 Stock Option Plan and 2010 Stock Option Plan (collectively, the “Prior Plans”). There were no awards granted under the Prior Plans after the approval of the 2012 Plan by the Company’s stockholders on February 22, 2012. Stock options granted under the Prior Plans that were outstanding at such date remain in effect until such options are exercised or expire.
The 2012 Plan authorizes the grant of stock options, stock appreciation rights, restricted stock, RSUs and cash awards. Stock options granted under the 2012 Plan may be either options intended to constitute incentive stock options or nonqualified stock options, in each case as determined by the compensation committee of the board of directors in accordance with the terms of the 2012 Plan. As of September 30, 2016, stock options to purchase 1,916,646 shares of the Company’s common stock and 1,401,169 RSUs were outstanding under the 2012 Plan, and 2,040,378 shares of the Company’s common stock were reserved for future grants.
The following table summarizes the number of stock options outstanding under the Prior Plans as of September 30, 2016:
|
2000 Stock Option Plan |
|
|
6,262 |
|
|
2002 Stock Option Plan |
|
|
36,750 |
|
|
2006 Stock Option Plan |
|
|
43,000 |
|
|
2010 Stock Option Plan |
|
|
1,012,716 |
|
|
Total stock options outstanding under the Prior Plans |
|
|
1,098,728 |
|
F-21
In January 2011, the Company’s board of directors adopted, subject to stockholder approval, the Mitek Systems, Inc. Director Restricted Stock Unit Plan, as amended and restated (the “Director Plan”), reserving up to 1,000,000 shares of the Company’s common stock for the issuance of RSUs to both employee and non-employee members of the board of directors of the Company. On February 23, 2011, the Director Plan was approved by the Company’s stockholders at its annual meeting.
In addition, the Company has awarded RSUs to certain of its employees under the 2012 Plan. The RSUs vest in equal annual installments over four years.
The following table summarizes RSU activity in the fiscal years ended September 30, 2016, 2015 and 2014:
|
|
|
Number of shares |
|
|
Weighted- average fair value per share |
|
||
|
Outstanding at September 30, 2013 |
|
|
692,504 |
|
|
$ |
4.85 |
|
|
Granted |
|
|
625,139 |
|
|
$ |
4.83 |
|
|
Settled |
|
|
(63,334 |
) |
|
$ |
4.66 |
|
|
Cancelled |
|
|
(153,006 |
) |
|
$ |
5.03 |
|
|
Outstanding at September 30, 2014 |
|
|
1,101,303 |
|
|
$ |
4.71 |
|
|
Granted |
|
|
104,000 |
|
|
$ |
2.29 |
|
|
Settled |
|
|
(255,041 |
) |
|
$ |
2.96 |
|
|
Cancelled |
|
|
(147,345 |
) |
|
$ |
3.54 |
|
|
Outstanding at September 30, 2015 |
|
|
802,917 |
|
|
$ |
4.49 |
|
|
Granted |
|
|
1,536,000 |
|
|
$ |
4.82 |
|
|
Settled |
|
|
(261,621 |
) |
|
$ |
4.77 |
|
|
Cancelled |
|
|
(31,127 |
) |
|
$ |
4.19 |
|
|
Outstanding at September 30, 2016 |
|
|
2,046,169 |
|
|
$ |
4.90 |
|
The cost of a RSU is determined using the fair value of the Company’s common stock on the award date, and the compensation expense is recognized ratably over the vesting period. The Company recognized $2.7 million, $1.2 million and $1.3 million in stock-based compensation expense related to outstanding RSUs in the fiscal years ended September 30, 2016, 2015 and 2014, respectively. As of September 30, 2016, the Company had approximately $6.3 million of unrecognized compensation expense related to outstanding RSUs expected to be recognized over a weighted-average period of approximately 2.7 years.
Closing Shares
In connection with the Acquisition, the Company issued to the Sellers 712,790 shares of Common Stock. Vesting of these shares is subject to the continued employment of the founders of IDchecker and occurs over a period of 27 months from the date of issuance. The cost of the Closing Shares is determined using the fair value of Common Stock on the award date, and the stock based compensation is recognized ratably over the vesting period. The Company recognized $1.3 million and $0.3 million in stock based compensation expense related to the Closing Shares for the years ended September 30, 2016 and 2015, respectively. As of September 30, 2016, the Company had $1.2 million of unrecognized compensation expense related to Closing Shares expected to be recognized over the remaining service period.
Earnout Shares
In addition to the cash payments made to the Sellers and the issuance of Closing Shares, in each case at the closing of the Acquisition, and subject to the achievement of certain revenue and net income targets for IDchecker for the nine-month period ended on September 30, 2015, and the twelve-month period ended September 30, 2016, the Company will issue to the Sellers up to an aggregate of $2,000,000 in shares of Common Stock (referred to elsewhere herein as the “Earnout Shares”) as follows (i) for the nine month period ending September 30, 2015, a maximum of $1,000,000 in Common Stock if certain revenue and net income targets (as set forth in the Share Purchase Agreement) are met; and (ii) for the twelve month period ending September 30, 2016, a maximum of $1,000,000 in Common Stock if certain revenue and net income targets (as set forth in the Share Purchase Agreement) are met.
F-22
Within 75 days after the last date of the respective earnout period (the “Earnout Determination Date”), the Company shall deliver to the Sellers a written statement of the calculation of the revenue and net income for the applicable earnout period. The number of shares issuable upon achievement of the revenue targets and net income targets, as applicable, will be calculated based on the volume weighted average closing price of the Common Stock over the 10 trading-day period ending on and including the applicable Earnout Determination Date. Earnout Shares issued, if any, shall vest and be eligible for resale such that 12.5% of the Earnout Shares shall vest and be released for resale on the six-month anniversary of the Earnout Determination Date applicable to such Earnout Shares and thereafter, the remaining 87.5% of the applicable Earnout Shares shall vest and be released for resale in equal quarterly installments. Vesting of the Earnout Shares is subject to the continued employment of the founders of IDchecker and occurs over a period of 27 months from the applicable Earnout Determination Date.
As of the closing date of the Acquisition, the Company calculated the fair value of the Earnout Shares using the Monte-Carlo simulation (using the Company’s stock price, the annual risk-free interest rate, expected volatility, the probability of reaching the performance targets and a 10 trading day average stock price). This model was updated as of September 30, 2016 and will be updated and the respective fair value adjusted each reporting period based on the relevant facts and conditions at the reporting date. The Company recognized $0.3 million and $47,000 in stock based compensation expense related to the Earnout Shares for the fiscal years ended September 30, 2016 and 2015, respectively.
6. INCOME TAXES
For the fiscal years ended September 30, 2016, 2015 and 2014 the income tax (provision) benefit was as follows (amounts shown in thousands):
|
|
|
2016 |
|
|
2015 |
|
|
2014 |
|
|||
|
Federal—current |
|
$ |
(129 |
) |
|
$ |
(84 |
) |
|
$ |
— |
|
|
Federal—deferred |
|
|
— |
|
|
|
621 |
|
|
|
— |
|
|
State—current |
|
|
(16 |
) |
|
|
(10 |
) |
|
|
(2 |
) |
|
State—deferred |
|
|
— |
|
|
|
13 |
|
|
|
— |
|
|
Foreign—current |
|
|
146 |
|
|
|
3 |
|
|
|
— |
|
|
Total |
|
$ |
1 |
|
|
$ |
543 |
|
|
$ |
(2 |
) |
Significant components of the Company’s net deferred tax assets and liabilities as of September 30, 2016 and 2015 are as follows (amounts shown in thousands):
|
|
|
2016 |
|
|
2015 |
|
||
|
Deferred tax assets: |
|
|
|
|
|
|
|
|
|
Net operating loss carryforwards |
|
$ |
7,095 |
|
|
$ |
9,825 |
|
|
Foreign net operating losses |
|
|
327 |
|
|
|
258 |
|
|
Stock based compensation |
|
|
2,898 |
|
|
|
2,333 |
|
|
AMT credit carryforwards |
|
|
279 |
|
|
|
149 |
|
|
Other, net |
|
|
320 |
|
|
|
305 |
|
|
Research credit carryforwards |
|
|
44 |
|
|
|
44 |
|
|
Total deferred assets |
|
|
10,963 |
|
|
|
12,914 |
|
|
Deferred tax liabilities: |
|
|
|
|
|
|
|
|
|
Intangibles |
|
|
(473 |
) |
|
|
(603 |
) |
|
Foreign deferred liabilities |
|
|
(356 |
) |
|
|
(415 |
) |
|
Net deferred tax asset |
|
|
10,134 |
|
|
|
11,896 |
|
|
Valuation allowance for net deferred tax assets |
|
|
(10,163 |
) |
|
|
(12,053 |
) |
|
Net deferred tax liability |
|
$ |
(29 |
) |
|
$ |
(157 |
) |
The Company has provided a valuation allowance against deferred tax assets recorded as of September 30, 2016 and 2015 due to uncertainties regarding the realization of such assets.
F-23
The net change in the total valuation allowance for the fiscal years ended September 30, 2016 and 2015 was a decrease in 2016 of $1.9 million and a decrease in 2015 of $0.9 million, respectively. In assessing the realizability of deferred tax assets, the Company considers whether it is more likely than not that some portion or all of the deferred tax assets will not be realized. The ultimate realization of deferred tax assets is dependent upon the generation of future taxable income during periods in which those temporary differences become deductible. The Company considers projected future taxable income and planning strategies in making this assessment. Based on the level of historical operating results and projections for future taxable income, the Company has determined that it is more likely than not that the deferred tax assets will not be realized. Accordingly, the Company has recorded a valuation allowance to reduce deferred tax assets to zero. There can be no assurance that the Company will ever be able to realize the benefit of some or all of the federal and state loss carryforwards or the credit carryforwards, either due to ongoing operating losses or due to ownership changes, which limit the usefulness of the loss carryforwards.
As of September 30, 2016, the Company has available net operating loss carryforwards of $37.4 million for federal income tax purposes, which will start to expire in 2018. The net operating loss carryforwards for state purposes are $31.7 million and will begin to expire in 2017. Included in these amounts are federal and state net operating losses of $18.8 million attributable to stock option deductions of which the tax benefit will be credited to equity when realized. As of September 30, 2016, the Company has available federal research and development credit carryforwards of $29,000 and alternative minimum tax credit carryforwards of $0.3 million. The federal research and development credits will start to expire in 2023. As of September 30, 2016, the Company has available California research and development credit carryforwards of $14,000, which do not expire.
The Company’s ability to use its net operating loss and research and development credit carryforwards may be substantially limited due to ownership change limitations that may have occurred or that could occur in the future, as required by Section 382 of the Internal Revenue Code of 1986, as amended (“Section 382”), as well as similar state provisions. The Company has not completed a study to assess whether an ownership change has occurred or whether there have been multiple ownership changes since the Company became a “loss corporation” as defined in Section 382. Due to the existence of the valuation allowance, it is not expected that any possible limitation will have an impact on the results of operations or financial position of the Company.
The difference between the income tax (provision) benefit and income taxes computed using the U.S. federal income tax rate was as follows for the years ended September 30, 2016, 2015 and 2014 (amounts shown in thousands):
|
|
|
2016 |
|
|
2015 |
|
|
2014 |
|
|||
|
Amount computed using statutory rate |
|
$ |
(666 |
) |
|
$ |
(674 |
) |
|
$ |
1,798 |
|
|
Net change in valuation allowance for net deferred tax assets |
|
|
1,889 |
|
|
|
1,619 |
|
|
|
(1,677 |
) |
|
AMT and other |
|
|
(148 |
) |
|
|
151 |
|
|
|
— |
|
|
Foreign rate differential |
|
|
(70 |
) |
|
|
(1 |
) |
|
|
— |
|
|
Non-deductible items |
|
|
(1,136 |
) |
|
|
(182 |
) |
|
|
(411 |
) |
|
State income tax |
|
|
(15 |
) |
|
|
(370 |
) |
|
|
288 |
|
|
Foreign net operating loss |
|
|
147 |
|
|
|
— |
|
|
|
— |
|
|
Income tax (provision) benefit |
|
$ |
1 |
|
|
$ |
543 |
|
|
$ |
(2 |
) |
The Company files income tax returns in the U.S. federal jurisdiction and various state jurisdictions. Because the Company is carrying forward federal and state net operating losses from 1997 and 2002, respectively, the Company is subject to U.S. federal and state income tax examinations by tax authorities for all years since 1997 and 2002, as the case may be. The Company does not have any uncertain tax positions. As of September 30, 2016, no accrued interest or penalties are recorded in the consolidated financial statements.
F-24
7. COMMITMENTS AND CONTINGENCIES
Legal Matters
Rothschild Mobile Imaging Innovations, Inc.
On May 16, 2014, Rothschild Mobile Imaging Innovations, Inc. (“RMII”) filed a complaint against us in the U.S. District Court for the District of Delaware alleging that certain of our mobile imaging products infringe four RMII-owned patents related to mobile imaging technology. On June 1, 2014, RMII amended its complaint to add JPMorgan Chase & Co. and JPMorgan Chase Bank, N.A. (together, “Chase”), one of our customers, as a defendant in the lawsuit (as amended, the “Initial Lawsuit”). On September 8, 2014, RMII filed three additional complaints (the “Subsequent Lawsuits”) against us in the U.S. District Court for the District of Delaware. The Subsequent Lawsuits contain allegations substantially similar to the Initial Lawsuit regarding infringement by our mobile imaging products of the four RMII-owned patents related to mobile imaging technology, but name as co-defendants Citibank, N.A., Citigroup Inc., Wells Fargo & Company, Wells Fargo Bank, N.A., Bank of America Corporation and Bank of America, N.A., respectively (together with Chase, the “Bank Defendants”). RMII subsequently filed amended complaints (together with the Initial Lawsuit and the Subsequent Lawsuits, the “RMII Lawsuits”) adding as defendants both Fiserv and NCR (the “Distributor Defendants”), each of whom distributes our mobile imaging technology to one or more of the Bank Defendants. Based on our understanding of the claims, we agreed to accept the demands for indemnity and defense tendered by each of the Bank Defendants and Distributor Defendants in connection with the RMII Lawsuits.
On November 10, 2014, we filed a motion to sever and stay the claims against Chase in the Initial Lawsuit pending resolution of RMII’s claims against us, which motion was granted on August 3, 2015. On November 19, 2014, we filed joinders to the motion to stay with respect to the Subsequent Lawsuits, which joinders were also granted on August 3, 2015. Additionally, the Patent Trial and Appeal Board (“PTAB”) of the Patent and Trademark Office instituted our petitions for Inter Partes Review (“IPR”) challenging the patentability of all four asserted patents, and the Court agreed to stay the litigation in its entirety until all of the decisions are rendered in the IPR proceedings.
On July 20, 2016, the PTAB entered its final decision in the IPR proceedings. The PTAB ruled that all claims asserted in the litigation in all four RMII patents were directed to unpatentable subject matter and thus not patent eligible. On September 16, 2016 , the parties filed a joint status report notifying the Court of the PTAB’s decisions in the IPRs. Through that notice, Mitek requested that the Court enter a judgment of non-infringement, or, in the alternative, dismiss all of RMII’s claims against all defendants with prejudice. On September 16, 2016, RMII filed a motion to dismiss without prejudice.
The Company is currently controlling the defense of such claims and have taken actions to defend the RMII Lawsuits, as more fully described above. The Company believes that RMII’s claims are without merit and have vigorously defended against those claims. The Company does not believe that the results of the RMII Lawsuits will have a material adverse effect on the Company’s financial condition or results of operations.
Other Legal Matters
In addition to the foregoing, the Company is subject to various claims and legal proceedings arising in the ordinary course of its business. The Company accrues for such liabilities when it is both (i) probable that a loss has occurred and (ii) the amount of the loss can be reasonably estimated in accordance with ASC 450, Contingencies. While any legal proceeding has an element of uncertainty, the Company believes that the disposition of such matters, in the aggregate, will not have a material effect on the Company’s financial condition or results of operations.
Employee 401(k) Plan
The Company has a 401(k) plan that allows participating employees to contribute a percentage of their salary, subject to Internal Revenue Service annual limits. During the fiscal year ended September 30, 2015, the Company implemented a company match to the plan. As of September 30, 2016 and 2015, the Company had $63,000 and $42,000 accrued for the 401(k) match, respectively. During the fiscal years ended September 30, 2014, the Company did not match contributions to the plan.
F-25
The Company’s principal executive offices, as well as its research and development facility, are located in approximately 28,354 square feet of office space in San Diego, California. The term of the lease for the Company’s offices commenced on October 1, 2016 and continues through April 30, 2020. The annual base rent under this lease is approximately $0.6 million per year. In connection with this lease, the Company received tenant improvement allowances totaling $0.3 million. These lease incentives are being amortized as a reduction of rent expense over the term of the lease. The Company’s previous facility lease terminated on October 16, 2016 and the unamortized balance of the lease incentives associated with that lease were $49,000 at September 30, 2016. The offices of IDchecker are located in the Netherlands. The term of the lease for the office continues through May 31, 2020. The annual base rent under the lease is approximately €48,000 per year. The Company has a sales office in London, UK. The term of this lease continues through May 31, 2017. The annual base rent under this lease is approximately £65,000 per year.
Future annual minimum rental payments payable under the facility leases are as follows (shown in thousands):
|
Years ending September 30: |
|
|
|
|
|
2017 |
|
$ |
499 |
|
|
2018 |
|
|
755 |
|
|
2019 |
|
|
776 |
|
|
2020 |
|
|
469 |
|
|
2021 |
|
|
— |
|
|
Thereafter |
|
|
— |
|
|
Total |
|
$ |
2,499 |
|
Rent expense for the Company’s operating leases for its facilities for the years ended September 30, 2016, 2015 and 2014 totaled $0.3 million, $0.4 million and $0.4 million, respectively.
8. REVENUE AND VENDOR CONCENTRATIONS
Revenue Concentration
For the fiscal year ended September 30, 2016, the Company derived revenue of $6.3 million, or 18% of the Company’s total revenue, from one customer, compared to revenue of $6.3 million, or 25% of the Company’s total revenue, from one customer for the fiscal year ended September 30, 2015. For the fiscal year ended September 30, 2014, the Company derived revenue of $5.7 million or 30% of the Company’s total revenue, from one customer. The corresponding accounts receivable balances of customers from which revenues were in excess of 10% of total revenue were $1.0 million, $1.1 million and $1.4 million at September 30, 2016, 2015 and 2014, respectively.
The Company’s revenue is derived primarily from the sale by the Company to channel partners, including systems integrators and resellers, and end-users of licenses to sell products covered by the Company’s patented technologies. In most cases, the channel partners purchase the license from the Company after they receive an order from an end-user. The channel partners receive orders from various individual end-users; therefore, the sale of a license to a channel partner may represent sales to multiple end-users. End-users can purchase the Company’s products through more than one channel partner.
Revenues can fluctuate based on the timing of license renewals by channel partners. When a channel partner purchases or renews a license, the Company receives a license fee in consideration for the grant of a license to sell the Company’s products and there are no future payment obligations related to such agreement; therefore, the license fee the Company receives with respect to a particular license renewal in one period does not have a correlation with revenue in future periods. During the last few years, sales of licenses to one or more channel partners have comprised a significant part of the Company’s revenue. This is attributable to the timing of renewals or purchases of licenses and does not represent a dependence on any single channel partner. The Company believes that it is not dependent upon any single channel partner, even those from which revenues were in excess of 10% of the Company’s total revenue in a specific reporting period, and that the loss or termination of the Company’s relationship with any such channel partner would not have a material adverse effect on the Company’s future operations because either the Company or another channel partner could sell the Company’s products to the end-user that had purchased from the channel partner the Company lost.
International sales accounted for approximately 15%, 5% and 4% of the Company’s total revenue for the fiscal years ended September 30, 2016, 2015 and 2014, respectively.
F-26
The Company purchases its integrated software components from multiple third-party software providers at competitive prices. For the fiscal years ended September 30, 2016, 2015 and 2014, the Company did not make purchases from any one vendor comprising 10% or more of the Company’s total purchases. The Company has entered into contractual relationships with some of its vendors; however, the Company does not believe it is substantially dependent upon nor exposed to any significant concentration risk related to purchases from any of its vendors, given the availability of alternative sources for its necessary integrated software components.
9. QUARTERLY INFORMATION (UNAUDITED)
The following table sets forth selected quarterly financial data for 2016, 2015 and 2014 (shown in thousands except share data):
|
|
|
2016 (by quarter) |
|
|||||||||||||
|
|
|
1 |
|
|
2 |
|
|
3 |
|
|
4 |
|
||||
|
Revenue |
|
$ |
7,404 |
|
|
$ |
8,522 |
|
|
$ |
9,105 |
|
|
$ |
9,670 |
|
|
Cost of revenue |
|
|
942 |
|
|
|
720 |
|
|
|
793 |
|
|
|
940 |
|
|
Operating expenses |
|
|
6,804 |
|
|
|
7,171 |
|
|
|
7,618 |
|
|
|
7,889 |
|
|
Operating income (loss) |
|
|
(342 |
) |
|
|
631 |
|
|
|
694 |
|
|
|
841 |
|
|
Other income (expense), net |
|
|
36 |
|
|
|
30 |
|
|
|
45 |
|
|
|
23 |
|
|
Income tax benefit (provision) |
|
|
(16 |
) |
|
|
(79 |
) |
|
|
— |
|
|
|
96 |
|
|
Net income (loss) |
|
|
(322 |
) |
|
|
582 |
|
|
|
739 |
|
|
|
960 |
|
|
Net income (loss) per share: |
|
|
|
|
|
|
|
|
|
|
|
|
|
|
|
|
|
Basic income (loss) per share |
|
|
(0.01 |
) |
|
|
0.02 |
|
|
|
0.02 |
|
|
|
0.03 |
|
|
Shares used in calculating net income (loss) per share - basic |
|
|
31,094,417 |
|
|
|
31,325,577 |
|
|
|
31,823,386 |
|
|
|
32,086,223 |
|
|
Diluted income (loss) per share |
|
|
(0.01 |
) |
|
|
0.02 |
|
|
|
0.02 |
|
|
|
0.03 |
|
|
Shares used in calculating net income (loss) per share - diluted |
|
|
31,094,417 |
|
|
|
33,133,920 |
|
|
|
34,531,964 |
|
|
|
34,859,861 |
|
|
|
|
2015 (by quarter) |
|
|||||||||||||
|
|
|
1 |
|
|
2 |
|
|
3 |
|
|
4 |
|
||||
|
Revenue |
|
$ |
5,389 |
|
|
$ |
5,672 |
|
|
$ |
6,440 |
|
|
$ |
7,866 |
|
|
Cost of revenue |
|
|
497 |
|
|
|
558 |
|
|
|
591 |
|
|
|
825 |
|
|
Operating expenses |
|
|
4,758 |
|
|
|
4,628 |
|
|
|
5,539 |
|
|
|
6,079 |
|
|
Operating income (loss) |
|
|
134 |
|
|
|
486 |
|
|
|
310 |
|
|
|
962 |
|
|
Other income (expense), net |
|
|
15 |
|
|
|
21 |
|
|
|
30 |
|
|
|
25 |
|
|
Income tax benefit (provision) |
|
|
(3 |
) |
|
|
— |
|
|
|
578 |
|
|
|
(32 |
) |
|
Net income (loss) |
|
|
146 |
|
|
|
507 |
|
|
|
918 |
|
|
|
955 |
|
|
Net income (loss) per share: |
|
|
|
|
|
|
|
|
|
|
|
|
|
|
|
|
|
Basic income (loss) per share |
|
|
0.00 |
|
|
|
0.02 |
|
|
|
0.03 |
|
|
|
0.03 |
|
|
Shares used in calculating net income (loss) per share - basic |
|
|
30,618,097 |
|
|
|
30,697,391 |
|
|
|
30,764,694 |
|
|
|
30,969,157 |
|
|
Diluted income (loss) per share |
|
|
0.00 |
|
|
|
0.02 |
|
|
|
0.03 |
|
|
|
0.03 |
|
|
Shares used in calculating net income (loss) per share - diluted |
|
|
31,173,815 |
|
|
|
31,321,259 |
|
|
|
31,645,696 |
|
|
|
31,664,178 |
|
F-27
|
|
|
2014 (by quarter) |
|
|||||||||||||
|
|
|
1 |
|
|
2 |
|
|
3 |
|
|
4 |
|
||||
|
Revenue |
|
$ |
4,463 |
|
|
$ |
4,484 |
|
|
$ |
4,660 |
|
|
$ |
5,544 |
|
|
Cost of revenue |
|
|
571 |
|
|
|
450 |
|
|
|
608 |
|
|
|
520 |
|
|
Operating expenses |
|
|
5,373 |
|
|
|
6,246 |
|
|
|
5,702 |
|
|
|
5,089 |
|
|
Operating income (loss) |
|
|
(1,481 |
) |
|
|
(2,212 |
) |
|
|
(1,650 |
) |
|
|
(65 |
) |
|
Other income (expense), net |
|
|
13 |
|
|
|
19 |
|
|
|
17 |
|
|
|
67 |
|
|
Income tax benefit (provision) |
|
|
— |
|
|
|
— |
|
|
|
— |
|
|
|
— |
|
|
Net income (loss) |
|
|
(1,468 |
) |
|
|
(2,193 |
) |
|
|
(1,633 |
) |
|
|
2 |
|
|
Net income (loss) per share: |
|
|
|
|
|
|
|
|
|
|
|
|
|
|
|
|
|
Basic income (loss) per share |
|
|
(0.05 |
) |
|
|
(0.07 |
) |
|
|
(0.05 |
) |
|
|
0.00 |
|
|
Shares used in calculating net income (loss) per share - basic |
|
|
30,402,397 |
|
|
|
30,453,455 |
|
|
|
30,481,168 |
|
|
|
30,510,587 |
|
|
Diluted income (loss) per share |
|
|
(0.05 |
) |
|
|
(0.07 |
) |
|
|
(0.05 |
) |
|
|
0.00 |
|
|
Shares used in calculating net income (loss) per share - diluted |
|
|
30,402,397 |
|
|
|
30,453,455 |
|
|
|
30,481,168 |
|
|
|
31,022,148 |
|
F-28