Attached files
| file | filename |
|---|---|
| 8-K - WEX INC. 8-K - WEX Inc. | a51846864.htm |
Exhibit 99.1

WEX Second Quarter 2018 Earnings August 2, 2018

WEX Forward-Looking Statements This earnings presentation contains forward-looking statements, including statements regarding: financial guidance and assumptions underlying the Company's financial guidance. Any statements that are not statements of historical facts may be deemed to be forward-looking statements. When used in this earnings presentation and the discussion accompanying it, the words “anticipate,” “believe,” “continue,” “could,” “estimate,” “expect,” “intend,” “may,” “plan,” “project” and similar expressions are intended to identify forward-looking statements, although not all forward-looking statements contain such words. These forward-looking statements are subject to a number of risks and uncertainties that could cause actual results to differ materially, including: the effects of general economic conditions on fueling patterns as well as payment and transaction processing activity; the impact of foreign currency exchange rates on the Company’s operations, revenue and income; changes in interest rates; the impact of fluctuations in fuel prices; the effects of the Company’s business expansion and acquisition efforts; potential adverse changes to business or employee relationships, including those resulting from the completion of an acquisition; competitive responses to any acquisitions; uncertainty of the expected financial performance of the combined operations following completion of an acquisition; the ability to successfully integrate the Company's acquisitions; the ability to realize anticipated synergies and cost savings; unexpected costs, charges or expenses resulting from an acquisition; the Company's ability to successfully acquire, integrate, operate and expand commercial fuel card programs; the failure of corporate investments to result in anticipated strategic value; the impact and size of credit losses; the impact of changes to the Company's credit standards; breaches of the Company’s technology systems or those of its third-party service providers and any resulting negative impact on the Company's reputation, liabilities or relationships with customers or merchants; the Company’s failure to maintain or renew key commercial agreements; failure to expand the Company’s technological capabilities and service offerings as rapidly as the Company’s competitors; failure to successfully implement the Company's information technology strategies and capabilities in connection with its technology outsourcing and insourcing arrangements and any resulting cost associated with that failure; the actions of regulatory bodies, including banking and securities regulators, or possible changes in banking or financial regulations impacting the Company’s industrial bank, the Company as the corporate parent or other subsidiaries or affiliates; the impact of the Company’s outstanding notes on its operations; the impact of increased leverage on the Company's operations, results or borrowing capacity generally, and as a result of acquisitions specifically; the incurrence of impairment charges if our assessment of the fair value of certain of our reporting units changes; the uncertainties of litigation; as well as other risks and uncertainties identified in Item 1A of our Annual Report for the year ended December 31, 2017 filed on Form 10-K filed with the Securities and Exchange Commission on March 1, 2018. The Company's forward-looking statements do not reflect the potential future impact of any alliance, merger, acquisition, disposition or stock repurchases. The forward-looking statements speak only as of the date of this earnings presentation and undue reliance should not be placed on these statements. The Company disclaims any obligation to update any forward-looking statements as a result of new information, future events or otherwise.Non-GAAP Information:For additional important information and disclosure regarding our use of non-GAAP metrics, specifically adjusted net income and adjusted operating margin, please see our most recent earnings release, issued on August 2, 2018. See the Appendix to this presentation for an explanation and reconciliation of non-GAAP adjusted net income (or “ANI”) to GAAP net income, ANI per diluted share to GAAP net income per diluted share, and adjusted operating margin to GAAP operating margin.

2Q2018 Highlights 20.6% 37.8% 10.4% Fleet Travel & Corporate Health & Employee Benefits 22.0% 65.9% 21.5% 2Q2018 Revenue Growth Vs. 2Q2017

Strategic Pillars HIGHLIGHTS FOR THE QUARTER Continue to experience strong organic revenue growth, driven primarily by volumeVisa issuing live - expanding product value proposition with added networkClearview Snap offering fleet analytics for small businesses launched in June with Amazon Alexa integration for voice-command capability OTR customer enhancements reduce application and implementation process Launched WEX Health Cloud Cobra and Direct Billing mobile appWEX implements sabbatical program for employees

Executing on the WEX Strategy FLEET TRAVEL & CORPORATE HEALTH & EMPLOYEE BENEFITS Redesigned OTR mobile functionality with improved user experienceNew features added to fleet customer portal included new UI to enhance customer experience and provide more responsive featuresExpanding Driver Dash network to include new merchantsNew real-time analytics partner dashboards provide more transparency, allow for faster data-driven decision-making Expanded product optionality with Visa launch offering multi-scheme optionsEnhancing supplier enrollment capabilities with advanced analyticsDeveloping pilot use-cases utilizing emerging technologies Launched WEX Health Cloud Cobra and Direct Billing mobile appImproved Mobile App, including a user interface refresh, enhanced customer capabilities, a healthcare Eligible Expense Scanner, and access to health savings account (HSA) investment detailsDeveloped a new, dynamic and interactive consumer portal home page featuring enhanced message center LEADING WITH SUPERIOR PRODUCTS AND TECHNOLOGY BUILDING A BEST-IN-CLASS GROWTH ENGINE

DEEP INTEGRATION TO SYSTEMS AND INVESTMENT IN PLATFORM PRIMARY DISTRIBUTION CHANNELS HSA, HRA, FSA, VEBA, COBRA, Transit, Wellness, QSE-HRA Flexible Plan Types Benefit Accounts Mobile App, Consumer Portal, Personalized Messages, Stacked Payment Card Consumer Engagement Easy, Compelling Experience Comparative Analytics, Predictive Analytics, Compliance Reports, Ad-hoc Queries, Trends and Insights Easy Analytics Bi And Reporting Consolidated Premium Billing and Payments Collection, Medicaid, Refunds and Adjusted Billing Processing Power Billing And Payments Easy to Use Portals Leading Mobile Integrated Experience Private Label and Customizable Banks and Financial Institutions Health Plans Public Sector Payroll and Software Providers Third Party Administrators Deep Dive on the US Health Business

WEX Second Quarter 2018 Financial Results

Company Results - Q2 2018 2Q18 2Q17 $ ∆ Yr/Yr % ∆ Yr/Yr Total Revenue $370,876 $303,884 $66,992 22.0% Net income attributable to shareholders $39,298 $17,090 $22,208 129.9% Net income attributable to WEX Inc. per diluted share $0.90 $0.40 $0.50 125.0% Adjusted net income attributable to shareholders $90,832 $54,200 $36,632 67.6% Adjusted net income attributable to shareholders per diluted share $2.09 $1.26 $0.83 65.9% Strong underlying growth across the businesses drove adjusted net income and margin expansion In thousands except per share data

Revenue Breakdown - Q2 2018 2Q18 2Q17 $ ∆ Yr/Yr % ∆ Yr/Yr Total Revenue $370,876 $303,884 $66,992 22.0% Segment Revenue Fleet Solutions $241,470 $200,304 $41,166 20.6% Travel and Corporate Solutions $75,764 $55,000 $20,764 37.8% Health and Employee Benefit Solutions $53,642 $48,580 $5,062 10.4% Another record setting revenue quarter, driven by double digit growth rates in all segments In thousands unless otherwise noted
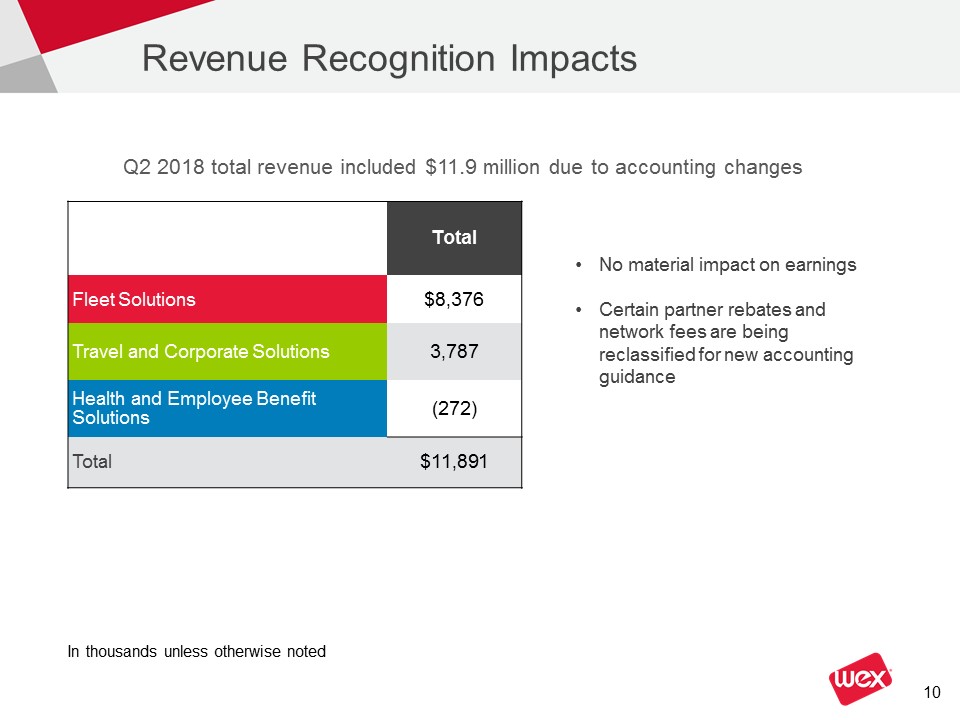
Revenue Recognition Impacts Total Fleet Solutions $8,376 Travel and Corporate Solutions 3,787 Health and Employee Benefit Solutions (272) Total $11,891 Q2 2018 total revenue included $11.9 million due to accounting changes In thousands unless otherwise noted No material impact on earningsCertain partner rebates and network fees are being reclassified for new accounting guidance

Fleet Solutions 2Q18 2Q17 $ ∆ Yr/Yr % ∆ Yr/Yr Total Segment Revenue ($) 241,470 200,304 41,166 20.6% Payment Processing Revenue ($) 112,895 87,678 25,217 28.8% Finance Fee Revenue ($) 45,188 36,552 8,636 23.6% All Other Revenue ($) 83,387 76,074 7,313 9.6% Payment Processing Transactions 115,919 108,134 7,785 7.2% Net Payment Processing Rate (%) 1.19% 1.18% 0.01% 0.8% Average US Fuel Price (USD/gallon) $3.02 $2.41 $0.61 25.3% Net Late Fee Rate (%) 0.38% 0.39% (0.01)% (2.6)% Organic revenue and transaction growth bolstered by fuel price tailwinds result in second consecutive quarter of +20% growth In thousands unless otherwise noted
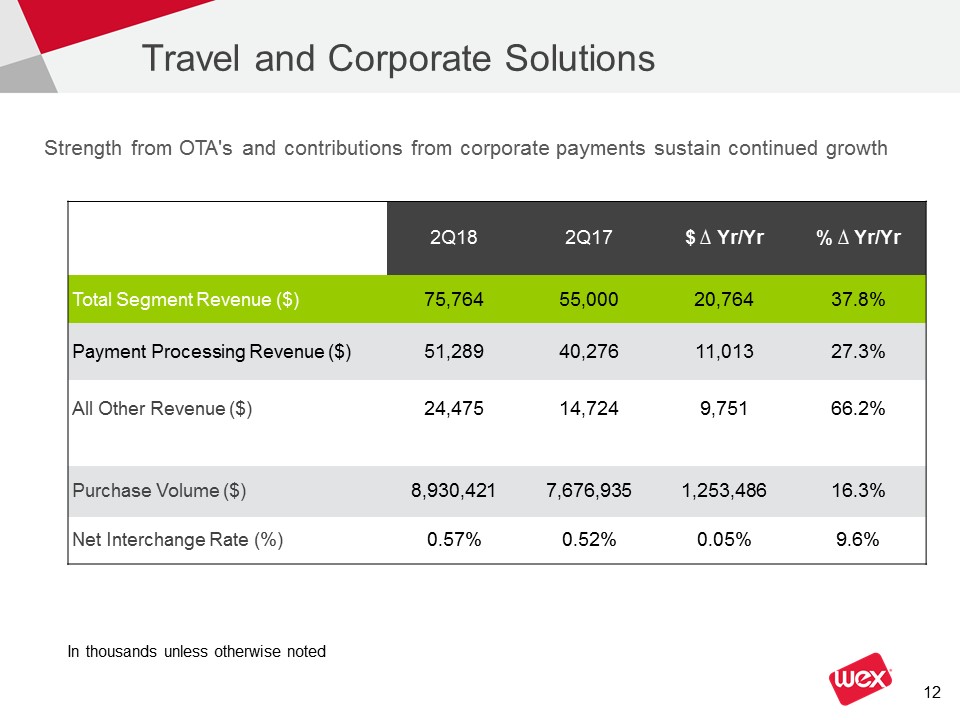
Travel and Corporate Solutions 2Q18 2Q17 $ ∆ Yr/Yr % ∆ Yr/Yr Total Segment Revenue ($) 75,764 55,000 20,764 37.8% Payment Processing Revenue ($) 51,289 40,276 11,013 27.3% All Other Revenue ($) 24,475 14,724 9,751 66.2% Purchase Volume ($) 8,930,421 7,676,935 1,253,486 16.3% Net Interchange Rate (%) 0.57% 0.52% 0.05% 9.6% Strength from OTA's and contributions from corporate payments sustain continued growth In thousands unless otherwise noted

Health and Employee Benefit Solutions 2Q18 2Q17 $ ∆ Yr/Yr % ∆ Yr/Yr Total Segment Revenue ($) 53,642 48,580 5,062 10.4% Payment Processing Revenue ($) 14,554 13,400 1,154 8.6% Account Servicing Revenue ($) 26,702 24,199 2,503 10.3% All Other Revenue ($) 12,386 10,981 1,405 12.8% Purchase Volume * ($) 1,253,309 1,126,854 126,455 11.2% Average Number of SaaS Accounts* 10,745 8,934 1,811 20.3% Strong US Health revenue growth in high teens and continued positive trends on new accounts In thousands unless otherwise noted* US Only

Selected Operating Expenses and Margins Service fees declined primarily due to Revenue Recognition changesFleet credit loss in basis points declined to 11.2; fraud at 2.5Sales and marketing expenses up mainly due to Revenue Recognition changes in thousands 2Q18 2Q18 2Q17 2Q17 $ ∆ Yr/Yr $ ∆ Yr/Yr % ∆ Yr/Yr Processing costs $ 76,306 $ 69,233 $ 7,073 10.2 % Service Fees 13,809 20,177 (6,368 ) (31.6 )% Provision for Credit Losses 11,505 16,082 (4,577 ) (28.5 )% Operating Interest expense 9,528 4,619 4,909 106.3 % General and Administrative 48,488 40,073 8,415 21.0 % Sales and Marketing 57,697 39,983 17,714 44.3 % 2Q18 2Q17 ∆ Yr/Yr in basis points GAAP operating income margin 27.7% 15.7% 1,200 Non-GAAP operating income margin 39.5% 36.8% 270 Operating Income Margin Cost of services Selling General and Administrative Selected Operating Expenses (GAAP)

Tax Rate Key Updates Following tax reform in December, our Q2 tax rate decreased significantlyTax rate down slightly from Q1 due to mix of US vs foreign earnings

Additional Balance Sheet Items Key Updates Corporate cash1 balances increased $31.1 million to $75.6 millionBorrowing capacity of $516 million on line of creditLeverage ratio reduced to 3.5, down from 4.2 in Q2 last yearRepriced Term Loan B in January, reducing spreads 50 basis pointsInterest rate hedges in place with a market value of $31.7 millionSignificant mitigation of interest rate risk - nearly 80% of Financing Debt at effectively fixed rates 1- Corporate cash is calculated in accordance with the terms of our consolidated leverage ratio in the Company’s amended 2016 Credit Agreement as filed with the SEC

Guidance 3Q2018 OUTLOOK ∆ Yr/Yr FY2018 OUTLOOK ∆ Yr/Yr Revenue (in millions) $363 - $373 12% - 15% $1445 - $1475 16% - 18% Adjusted Net Income1 (in millions) $88 - $93 43% - 51% $344 - $355 48% - 52% Adjusted Net Income Earnings per Diluted Share1 $2.03 - $2.13 42% - 49% $7.90 - $8.15 46% - 51% Domestic Fuel Prices ($ / Gallon) $2.90 $2.84 Fleet Credit Loss (Basis Points) 11 - 16 11 - 16 Adjusted Net Income Tax Rate 25.5% - 26.5% 25.5% - 26.5% Number of Shares Outstanding 43.5 million 43.5 million 1 The Company's adjusted net income guidance, which is a non-GAAP measure, excludes unrealized gains and losses on financial instruments, net foreign currency remeasurement gains and losses, acquisition related intangible amortization, other acquisition and divestiture related items, stock-based compensation, restructuring and other costs, debt restructuring and debt issuance cost amortization, similar adjustments attributable to our non-controlling interest and certain tax related items. We are unable to reconcile our adjusted net income guidance to the comparable GAAP measure without unreasonable effort because of the difficulty in predicting the amounts to be adjusted, including but not limited to, foreign currency exchange rates, unrealized gains and losses on derivative instruments and acquisition and divestiture related items, which may have a significant impact on our financial results.

Appendix
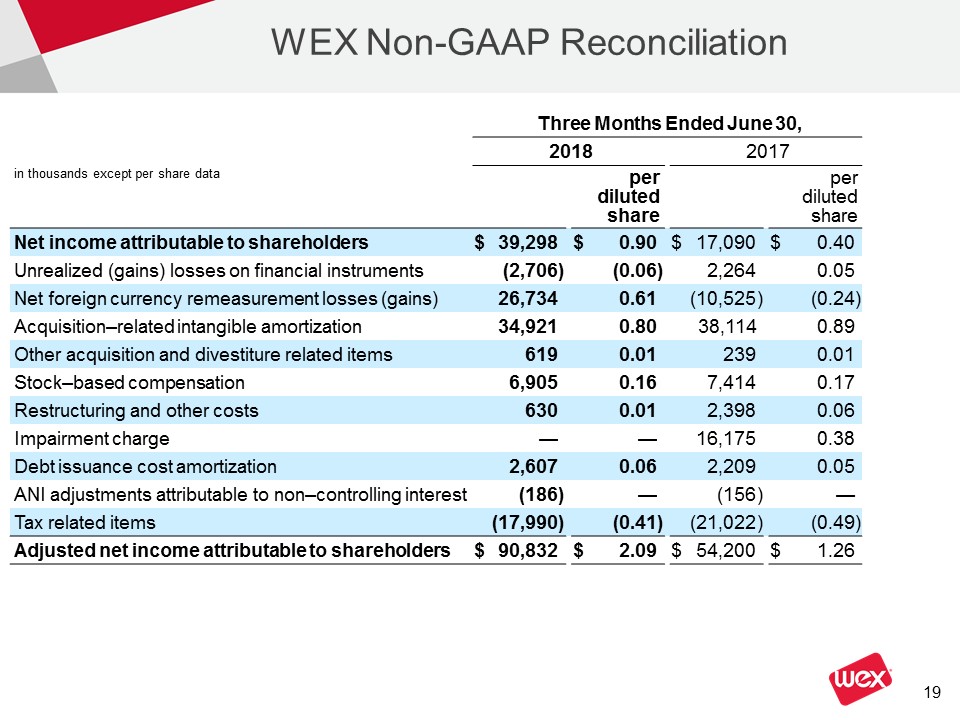
WEX Non-GAAP Reconciliation Three Months Ended June 30, Three Months Ended June 30, 2018 2018 2017 2017 in thousands except per share data per diluted share per diluted share per dilutedshare per dilutedshare Net income attributable to shareholders $ 39,298 $ 0.90 $ 17,090 $ 0.40 Unrealized (gains) losses on financial instruments (2,706 ) (0.06 ) 2,264 0.05 Net foreign currency remeasurement losses (gains) 26,734 0.61 (10,525 ) (0.24 ) Acquisition–related intangible amortization 34,921 0.80 38,114 0.89 Other acquisition and divestiture related items 619 0.01 239 0.01 Stock–based compensation 6,905 0.16 7,414 0.17 Restructuring and other costs 630 0.01 2,398 0.06 Impairment charge — — 16,175 0.38 Debt issuance cost amortization 2,607 0.06 2,209 0.05 ANI adjustments attributable to non–controlling interest (186 ) — (156 ) — Tax related items (17,990 ) (0.41 ) (21,022 ) (0.49 ) Adjusted net income attributable to shareholders $ 90,832 $ 2.09 $ 54,200 $ 1.26

WEX Non-GAAP Reconciliation Three Months Ended June 30, Three Months Ended June 30, (In thousands) 2018 2018 2017 2017 Operating income (GAAP) $ 102,911 $ 47,581 Acquisition–related intangible amortization 34,921 38,114 Other acquisition and divestiture related items 619 239 Debt restructuring costs 466 — Stock–based compensation 6,905 7,414 Restructuring and other costs 630 2,398 Impairment charges — 16,175 Adjusted operating income $ 146,452 $ 111,921 Three Months Ended June 30, Three Months Ended June 30, (In thousands except margin data) 2018 2018 2017 2017 Operating income (GAAP) $ 102,911 $ 47,581 Total Revenue $ 370,876 $ 303,884 Operating income margin (GAAP) 27.7 % 15.7 % Adjusted operating income $ 146,452 $ 111,921 Total Revenue $ 370,876 $ 303,884 Adjusted operating income margin 39.5 % 36.8 %
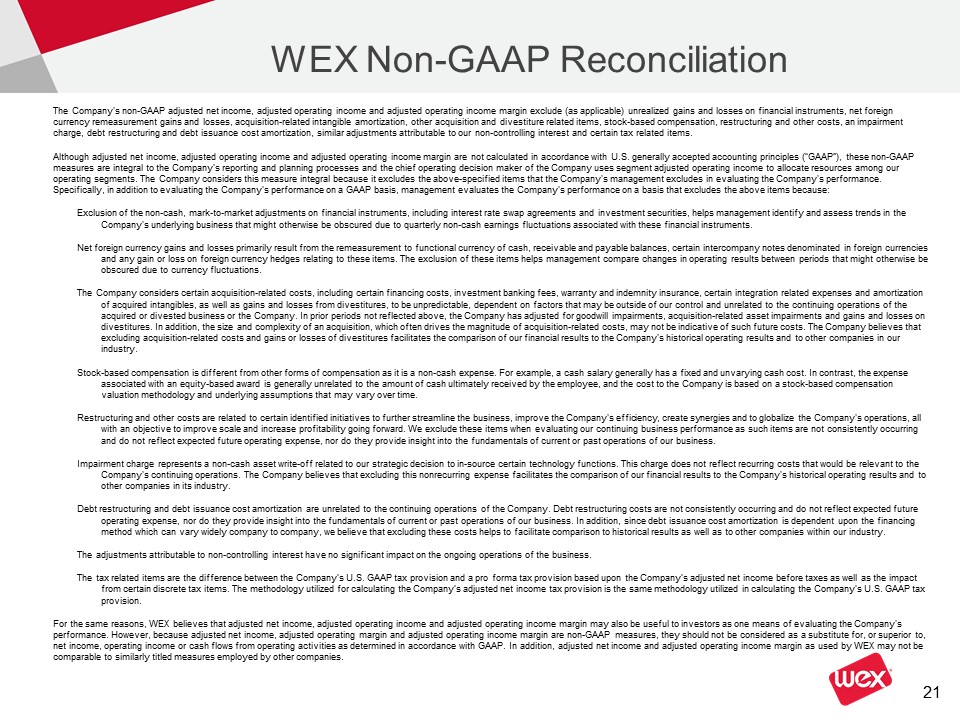
WEX Non-GAAP Reconciliation The Company's non-GAAP adjusted net income, adjusted operating income and adjusted operating income margin exclude (as applicable) unrealized gains and losses on financial instruments, net foreign currency remeasurement gains and losses, acquisition-related intangible amortization, other acquisition and divestiture related items, stock-based compensation, restructuring and other costs, an impairment charge, debt restructuring and debt issuance cost amortization, similar adjustments attributable to our non-controlling interest and certain tax related items. Although adjusted net income, adjusted operating income and adjusted operating income margin are not calculated in accordance with U.S. generally accepted accounting principles (“GAAP”), these non-GAAP measures are integral to the Company's reporting and planning processes and the chief operating decision maker of the Company uses segment adjusted operating income to allocate resources among our operating segments. The Company considers this measure integral because it excludes the above-specified items that the Company's management excludes in evaluating the Company's performance. Specifically, in addition to evaluating the Company's performance on a GAAP basis, management evaluates the Company's performance on a basis that excludes the above items because:Exclusion of the non-cash, mark-to-market adjustments on financial instruments, including interest rate swap agreements and investment securities, helps management identify and assess trends in the Company's underlying business that might otherwise be obscured due to quarterly non-cash earnings fluctuations associated with these financial instruments.Net foreign currency gains and losses primarily result from the remeasurement to functional currency of cash, receivable and payable balances, certain intercompany notes denominated in foreign currencies and any gain or loss on foreign currency hedges relating to these items. The exclusion of these items helps management compare changes in operating results between periods that might otherwise be obscured due to currency fluctuations.The Company considers certain acquisition-related costs, including certain financing costs, investment banking fees, warranty and indemnity insurance, certain integration related expenses and amortization of acquired intangibles, as well as gains and losses from divestitures, to be unpredictable, dependent on factors that may be outside of our control and unrelated to the continuing operations of the acquired or divested business or the Company. In prior periods not reflected above, the Company has adjusted for goodwill impairments, acquisition-related asset impairments and gains and losses on divestitures. In addition, the size and complexity of an acquisition, which often drives the magnitude of acquisition-related costs, may not be indicative of such future costs. The Company believes that excluding acquisition-related costs and gains or losses of divestitures facilitates the comparison of our financial results to the Company's historical operating results and to other companies in our industry.Stock-based compensation is different from other forms of compensation as it is a non-cash expense. For example, a cash salary generally has a fixed and unvarying cash cost. In contrast, the expense associated with an equity-based award is generally unrelated to the amount of cash ultimately received by the employee, and the cost to the Company is based on a stock-based compensation valuation methodology and underlying assumptions that may vary over time.Restructuring and other costs are related to certain identified initiatives to further streamline the business, improve the Company's efficiency, create synergies and to globalize the Company's operations, all with an objective to improve scale and increase profitability going forward. We exclude these items when evaluating our continuing business performance as such items are not consistently occurring and do not reflect expected future operating expense, nor do they provide insight into the fundamentals of current or past operations of our business.Impairment charge represents a non-cash asset write-off related to our strategic decision to in-source certain technology functions. This charge does not reflect recurring costs that would be relevant to the Company's continuing operations. The Company believes that excluding this nonrecurring expense facilitates the comparison of our financial results to the Company's historical operating results and to other companies in its industry.Debt restructuring and debt issuance cost amortization are unrelated to the continuing operations of the Company. Debt restructuring costs are not consistently occurring and do not reflect expected future operating expense, nor do they provide insight into the fundamentals of current or past operations of our business. In addition, since debt issuance cost amortization is dependent upon the financing method which can vary widely company to company, we believe that excluding these costs helps to facilitate comparison to historical results as well as to other companies within our industry.The adjustments attributable to non-controlling interest have no significant impact on the ongoing operations of the business.The tax related items are the difference between the Company’s U.S. GAAP tax provision and a pro forma tax provision based upon the Company’s adjusted net income before taxes as well as the impact from certain discrete tax items. The methodology utilized for calculating the Company’s adjusted net income tax provision is the same methodology utilized in calculating the Company’s U.S. GAAP tax provision.For the same reasons, WEX believes that adjusted net income, adjusted operating income and adjusted operating income margin may also be useful to investors as one means of evaluating the Company's performance. However, because adjusted net income, adjusted operating margin and adjusted operating income margin are non-GAAP measures, they should not be considered as a substitute for, or superior to, net income, operating income or cash flows from operating activities as determined in accordance with GAAP. In addition, adjusted net income and adjusted operating income margin as used by WEX may not be comparable to similarly titled measures employed by other companies.