Attached files
| file | filename |
|---|---|
| 8-K - FORM 8-K - Square, Inc. | d584754d8k.htm |
Exhibit 99.1

Highlights
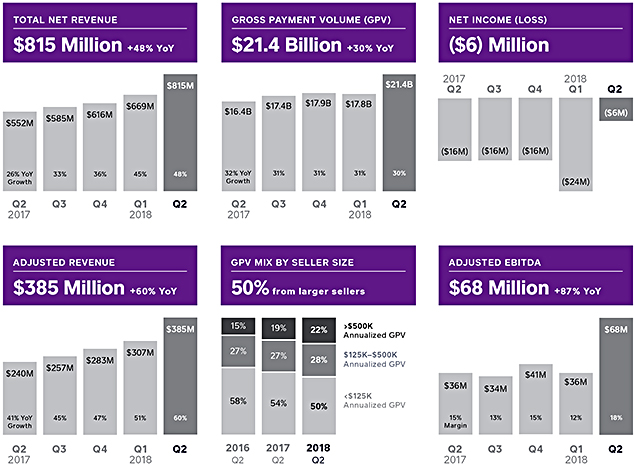
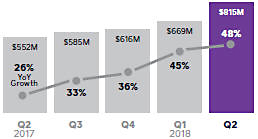
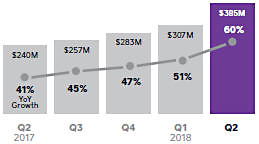
We continue to accelerate revenue growth: In the second quarter of 2018, total net revenue grew 48% year over year and Adjusted Revenue grew 60% year over year, compared to 45% and 51%, respectively, in the first quarter of 2018. Excluding the impact of acquisitions from this quarter, year-over-year revenue growth also accelerated.

We launched Square for Restaurants, our third industry-specific point of sale and our first for full-service restaurants.

Caviar is growing rapidly: Revenue in the second quarter of 2018 more than doubled year over year.

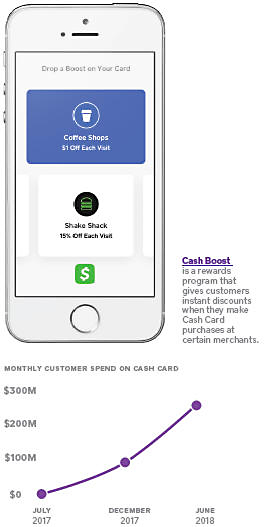
In June 2018, Cash App customers spent $250 million with Cash Card, nearly tripling since December 2017 and representing $3 billion on an annualized basis.
SECOND QUARTER KEY RESULTS
A reconciliation of non-GAAP metrics used in this letter to their nearest GAAP equivalents is provided at the end of this letter.
Adjusted Revenue is total net revenue less transaction-based costs and bitcoin costs, and excludes the effect of deferred revenue adjustment related to purchase accounting.
Adjusted EBITDA margin is calculated as Adjusted EBITDA divided by Adjusted Revenue.
 SQUARE Q2 2018 2
 |
Twenty Manning Grill
is located in Philadelphia. The restaurant uses Square for Restaurants, Square Stand, and Square Reader for contactless and chip to run the business, and Caviar to deliver food to hungry diners.
August 1, 2018
A larger seller generates more than $125,000 in annualized GPV.

To Our Shareholders
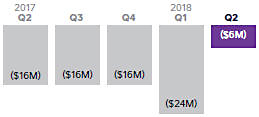
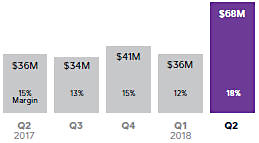
In the second quarter of 2018, we accelerated revenue growth for the fifth consecutive quarter. Total net revenue was $815 million, up 48% year over year, and Adjusted Revenue was $385 million, up 60% year over year. This is an increase from the first quarter of 2018, when total net revenue and Adjusted Revenue grew 45% and 51%, respectively, year over year. Excluding the impact of the Weebly and Zesty acquisitions, year-over-year revenue growth also accelerated. Gross Payment Volume (GPV) was $21.4 billion, up 30% year over year. In the second quarter, we continued to grow upmarket: For the first time, half of GPV came from larger sellers. Net loss in the second quarter was $6 million, compared to a net loss of $16 million in the second quarter of 2017. Net loss per share, basic and diluted, was $0.01 for the second quarter of 2018, compared to a net loss per share of $0.04 in the second quarter of 2017. In the second quarter, non-recurring acquisition-related costs negatively affected net loss per share by $0.01. Adjusted EBITDA was $68 million in the second quarter of 2018, compared to $36 million in the second quarter of 2017.
 SQUARE Q2 2018 3
 |
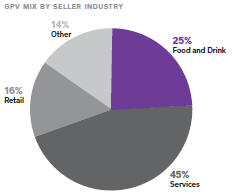
Services includes industries such as beauty professionals, health and fitness, home and repair services, and professional services.
¹ Full-service restaurants
include sit-down restaurants, bars, and lounges with less than $100 million in annual gross receipts, according to 2012 U.S. Census Bureau data.
We launched Square for Restaurants, our third industry-specific point of sale and our first for full-service restaurants.
Square for Restaurants, together with Square Appointments and Square for Retail, rounds out our industry-specific point-of-sale offerings for food, services, and retail—industries that together represent approximately 85% of our GPV. With Square for Restaurants, we are now able to meet the needs of full-service restaurants (FSRs), which represent a total addressable market of over 300,000 restaurants that generate nearly $200 billion in annual gross receipts in the U.S.¹ The average annualized GPV of a Square for Restaurants seller is more than $650,000, demonstrating that the product resonates with larger sellers.
FSRs are busy and have complex needs—Square brings speed and ease of use to the restaurant point of sale, making it easy for servers to delight diners while managing tables, orders, courses, and tickets. “Back of the house” functionality, such as revenue and cost reporting, enables managers and owners to make informed decisions and run an efficient business. Speed and ease of use also extend to the onboarding and customization process: While most restaurant points of sale require assisted implementation, to date more than 60% of Square for Restaurants sellers have self-onboarded. Additionally, we are enabling restaurants to manage an omnichannel business. Square is the only company that provides both the point of sale and the food delivery and pickup platform, and we are integrating Caviar with Square for Restaurants.
Located in San Francisco, Bar Agricole specializes in food and drinks that celebrate local, seasonal ingredients. The restaurant wanted to upgrade to a new system that would allow it to easily update its menu and seating configurations. Bar Agricole chose Square for Restaurants because it was easy to install and customize, and it provides the flexibility the business needs to operate efficiently. Taking advantage of the Square ecosystem, Bar Agricole uses Square Stand and our contactless and chip reader to accept payments and Square Payroll to pay its employees. It has also taken a Square Capital loan to grow the business. Bar Agricole has implemented Square for Restaurants at its sister restaurant, Trou Normand, and its new delivery-only Caribbean concept, Obispo, is exclusive to Caviar.
SELLER HIGHLIGHT

When we decided it was time to change our point-of-sale software, it was important that we choose a solution and company that really understood our complex restaurant needs and could evolve with us. Square has done just that; this new software has helped us streamline our business with its simplicity, intuitiveness, fast setup, and customization options.”
Chris Hanawalt
Bar Agricole
San Francisco, CA
|
SQUARE Q2 2018 4 |
CAVIAR FOOD-ORDERING PLATFORM

Food order volume is the dollar amount for food items only (i.e., excluding taxes and fees).
Caviar is growing rapidly: Revenue in the second quarter of 2018 more than doubled year over year.
Caviar makes it easy for restaurants to offer diners more ways to order, handling all the logistics and technology so the restaurant can focus on food. For diners, Caviar facilitates a wide variety of fulfillment types (pickup, delivery, group ordering) through an easy-to-use experience that delivers personalized recommendations powered by machine learning. Caviar also offers diners popular restaurants and menu items they cannot get on any other food-ordering platform: More than 25% of food order volume is driven by restaurants that are exclusive to Caviar.
Rooster Soup Co. is a popular Philadelphia luncheonette that has pledged to give all its profits to support Philadelphians in need through Broad Street Ministry’s Hospitality Collaborative. Given this mission, it is particularly important to Rooster Soup that it maximize sales and margins. Rooster Soup selected Caviar as its exclusive delivery partner to create another revenue stream while maintaining its high quality and standard of service.
Caviar has also expanded its group ordering capabilities. With Caviar for Teams, groups of diners have the ability to easily place large orders through Caviar with a shared cart. In April we acquired Zesty, which added a white-glove catering option for corporate customers to the Caviar for Teams offering. Both Caviar and our restaurant partners benefit from catering: It is predictable, creates repeat customers, and has larger ticket sizes with higher margins. This comprehensive approach of delivery, pickup, and corporate ordering resonates in a market like San Francisco, where Caviar is the top food-ordering platform.

Rooster Soup Co. is a popular Philadelphia luncheonette that selected Caviar as its exclusive delivery partner. More than 25% of food order volume is driven by restaurants that are exclusive to Caviar.
|
SQUARE Q2 2018 5 |
In June 2018, Cash App customers spent $250 million with Cash Card, nearly tripling since December 2017 and representing $3 billion on an annualized basis.
We continue to focus on extending Cash App beyond peer to peer to build an ecosystem of financial services that has daily utility for customers. In May we launched Cash Boost, a rewards program that gives customers instant discounts when they make Cash Card purchases at merchants such as coffee shops and national brands such as Shake Shack. Most card rewards programs require expensive annual fees and are associated with credit cards. With Cash Boost, we can provide more people with access to card benefits.
We further integrated Cash App with the Square ecosystem to give people faster access to their money. Via Cash App, Caviar couriers can now automatically receive payment immediately after completing a delivery, and they can spend the money immediately via Cash Card (or transfer the money to a bank account). This feature provides people who may be underbanked with fast access to their money and is a unique capability that Caviar is able to offer as part of the Square ecosystem. Nearly 30% of couriers who have joined Caviar since the launch of this integration have chosen to be paid instantly via Cash App.
Customer spend with Cash Card continues to grow: In June 2018—just one year since launch—customers spent $250 million. This spend has nearly tripled since December 2017 and represents $3 billion on an annualized basis. Overall, Cash App continues to increase in popularity: In the second quarter of 2018 in the U.S., it was the #1 finance app and on average a top-30 free app in the App Store. In the UK, Cash App has reached as high as the #10 finance app in just three months since launch.
|
SQUARE Q2 2018 6 |
Adjusted Revenue is total net revenue less transaction-based costs and bitcoin costs, and excludes the effect of deferred revenue adjustment related to purchase accounting.
A reconciliation of non-GAAP metrics used in this letter to their nearest GAAP equivalents is provided at the end of this letter.
We define Adjusted Revenue from subscription and services as the total net subscription and services based revenue adjusted to add back the impact of the write-down adjustment to acquired deferred revenue related to purchase accounting. We add back this deferred revenue that was written down since we believe it is correlated with ordinary and ongoing operations of the acquired company and facilitates analysis of revenue growth and business trends.
Financial
Discussion
GROSS PAYMENT VOLUME (GPV)
In the second quarter of 2018, we processed $21.4 billion in GPV, up 30% year over year. We continue to see strength from larger sellers. GPV from this group grew 42% year over year and accounted for 50% of total GPV, up from 46% in the second quarter of 2017.
REVENUE
Total net revenue was $815 million in the second quarter of 2018, up 48% year over year. This includes $37 million of bitcoin revenue. Excluding bitcoin revenue, total net revenue was $778 million, up 41% year over year.
Adjusted Revenue was $385 million in the second quarter of 2018, up 60% year over year.
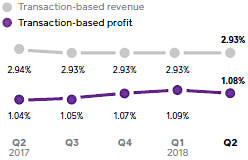
Transaction-based revenue was $625 million in the second quarter of 2018, up 30% year over year. Transaction-based profit as a percentage of GPV was 1.08% in the second quarter of 2018, up from 1.04% in the second quarter of 2017. Transaction-based profit continued to benefit from growth in higher-margin products and improvements in our transaction cost profile.
Subscription and services-based revenue was $134 million on a GAAP basis in the second quarter of 2018, up 127% year over year. The Adjusted Revenue from subscription and services-based revenue was $137 million in the second quarter, up 131% year over year. Growth was driven primarily by Instant Deposit, Caviar, Cash Card, and Square Capital, as well as acquisitions completed in the second quarter. Instant Deposit volume was $4 billion in the second quarter, benefiting from both sellers and Cash App customers. In the second quarter of 2018, Square Capital facilitated over 60,000 business loans totaling $390 million, up 22% year over year.
Hardware revenue in the second quarter of 2018 was $18 million, up 78% year over year, driven by Square Register and continued growth in Square Stand and Square Reader for contactless and chip.
TOTAL NET REVENUE
ADJUSTED REVENUE
AS A PERCENTAGE OF GPV
|
SQUARE Q2 2018 7 |
Adjusted EBITDA margin is calculated as Adjusted EBITDA divided by Adjusted Revenue.
Adjusted EPS is calculated by dividing net loss, excluding share-based compensation expense, amortization of intangible assets, amortization of debt discount and issuance costs, gain or loss on sale of property and equipment, acquisition-related costs, and deferred revenue and cost adjustment related to purchase accounting, by the weighted-average number of shares of common stock during the period, including the dilutive effect of all potential shares.
| OPERATING EXPENSES / EARNINGS
Operating expenses were $318 million in the second quarter of 2018, up 45% year over year, representing 39% of total net revenue. Non-GAAP operating expenses were up 46% year over year, representing 65% of Adjusted Revenue.
• Product development expenses were $115 million on a GAAP basis and $75 million on a non-GAAP basis in the second quarter of 2018, up 47% and 51%, respectively, year over year. This primarily reflects increases in engineering, data science, and design personnel costs.
• Sales and marketing expenses were $98 million on a GAAP basis and $92 million on a non-GAAP basis in the second quarter of 2018, up 64% and 65%, respectively, year over year. This increase was driven primarily by Cash App expenses, growth in advertising expenditures, and personnel costs.
• General and administrative expenses were $83 million on a GAAP basis and $63 million on a non-GAAP basis in the second quarter of 2018, up 31% and 28%, respectively, year over year. The increase was due primarily to increased finance, legal, and support personnel costs, as well as non-recurring acquisition-related costs.
• Transaction, loan, and advance losses were $22 million in the second quarter of 2018. Transaction losses as a percentage of GPV continue to trend below our 0.1% historical average, underscoring ongoing improvements in risk management.
Net loss in the second quarter of 2018 was $6 million, compared to a net loss of $16 million in the second quarter of 2017. Net loss per share, basic and diluted, was $0.01 for the second quarter of 2018, compared to a net loss per share of $0.04 in the second quarter of 2017. Non-recurring acquisition-related costs negatively affected net loss per share by $0.01. We had 403 million weighted-average shares for the second quarter of 2018.
Adjusted EBITDA was $68 million in the second quarter of 2018, compared to $36 million in the second quarter of 2017, up 87% year over year. We achieved an Adjusted EBITDA margin of 18%, compared with 15% in the second quarter of 2017.
Adjusted Net Income Per Share (Adjusted EPS) was $0.13 based on 470 million weighted-average diluted shares for the second quarter of 2018, representing a $0.06 improvement year over year. |
NET INCOME (LOSS)
ADJUSTED EBITDA
|
|
SQUARE Q2 2018 8 |
| BALANCE SHEET/CASH FLOW
We ended the second quarter of 2018 with $1.8 billion in cash, cash equivalents, restricted cash, and investments in marketable securities, up from $1.2 billion at the end of the first quarter of 2018. Positive Adjusted EBITDA and proceeds from the exercise of stock options and stock purchases under the employee stock purchase plan contributed to the balance increase at the end of the quarter. In addition, we had two transactions in the quarter that significantly affected our cash balance.
First, on May 25, 2018, we completed an offering for $862.5 million in convertible senior notes. The convertible senior notes mature in 2023 with a coupon of 0.50%. In connection with the offering, we entered into multiple hedge and warrant transactions, which increased the effective conversion premium to approximately 100%, and thus mitigates future potential equity dilution. Total net proceeds from the offering were $795 million, after deducting the costs of the hedge and warrant transactions and certain offering expenses.
Second, on May 31, 2018, we completed our acquisition of Weebly. The acquisition was partly funded with $106 million in cash (net of cash acquired). |
Weebly provides customers with tools to easily build a professional website or online store. |

|
SQUARE Q2 2018 9 |
Guidance
| Q3
|
Current 2018
|
Previous 2018
| ||||||||||
| Total net revenue |
$840M to $860M | $3.19B to $3.22B | $3.03B to $3.09B | |||||||||
| Adjusted Revenue |
$407M to $412M | $1.52B to $1.54B | $1.45B to $1.48B | |||||||||
| Year-over-year growth (midpoint) |
59% | 55% | 49% | |||||||||
| Adjusted EBITDA |
$62M to $65M
|
$240M to $250M
|
$240M to $250M
| |||||||||
| Net income (loss) per share | $(0.09) to $(0.07) | $(0.21) to $(0.17) | $(0.28) to $(0.24) | |||||||||
| Adjusted EPS (diluted) | $0.08 to $0.10 | $0.42 to $0.46 | $0.42 to $0.46 | |||||||||
Based on our results in the second quarter, we are raising our full-year guidance for total net revenue and Adjusted Revenue to reflect the ongoing momentum of our business. Given the significant market opportunity ahead of us, we will continue to reinvest in our business to drive future growth and are therefore maintaining our full-year Adjusted EBITDA guidance.
We have not reconciled Adjusted EBITDA and Adjusted EPS guidance to their GAAP equivalents as a result of the uncertainty regarding, and the potential variability of, reconciling items such as share-based compensation expense and weighted-average fully diluted shares outstanding. Accordingly, a reconciliation of these non-GAAP guidance metrics to their corresponding GAAP equivalents is not available without unreasonable effort. However, we have provided a reconciliation of GAAP to non-GAAP metrics in tables at the end of this letter. It is important to note that the actual amount of such reconciling items would have a significant impact if they were included in our Adjusted EBITDA and Adjusted EPS
 SQUARE Q2 2018 10
 |
MEDIA CONTACT
press@squareup.com
INVESTOR RELATIONS CONTACT
ir@squareup.com
Earnings
Webcast
Square (NYSE:SQ) will host a conference call and earnings webcast at 2:00 p.m. Pacific time/5:00 p.m. Eastern time today, August 1, 2018, to discuss these financial results. The domestic dial-in for the call is (866) 393-4306. The Conference ID is 1499390. To listen to a live audio webcast, please visit Square’s Investor Relations website at square.com/investors. A replay will be available on the same website following the call.
We will release financial results for the third quarter of 2018 on November 7, 2018, after the market closes, and will also host a conference call and earnings webcast at 2:00 p.m. Pacific time/5:00 p.m. Eastern time on the same day to discuss those financial results.
|
|

| |
| Jack Dorsey |
Sarah Friar | |
| CEO | CFO |

|
SQUARE Q2 2018 11 |

At Rooster Soup Co., we knew that delivery orders would be an important growth lever for the business—we chose to deliver exclusively through Caviar because we knew it would maintain the kind of quality service that diners receive in our restaurant.”
Steve Cook
Cofounder, CookNSolo Restaurant Partners
Philadelphia, PA
SQUARE Q2 2018 12
SAFE HARBOR STATEMENT
This letter contains forward-looking statements within the meaning of the Safe Harbor provisions of the Private Securities Litigation Reform Act of 1995. All statements other than statements of historical fact could be deemed forward-looking, including, but not limited to, statements regarding the future performance of Square, Inc. and its consolidated subsidiaries (the Company); the Company’s expected financial results for future periods; future growth in the Company’s businesses and products; the expected impact of the Company’s recent acquisitions; expectations regarding the Company’s ability to integrate its technologies; the Company’s expectations regarding scale, profitability, total addressable market, and the demand for or benefits from its products, product features, and services in the U.S. and in international markets; and management’s statements related to business strategy, plans, and objectives for future operations. In some cases, forward-looking statements can be identified by terms such as “may,” “will,” “appears,” “should,” “expects,” “plans,” “anticipates,” “could,” “intends,” “target,” “projects,” “contemplates,” “believes,” “estimates,” “predicts,” “potential,” or “continue,” or the negative of these words or other similar terms or expressions that concern our expectations, strategy, plans, or intentions. Such statements are subject to a number of known and unknown risks, uncertainties, assumptions, and other factors that may cause the Company’s actual results, performance, or achievements to differ materially from results expressed or implied in this letter. Investors are cautioned not to place undue reliance on these statements. Actual results could differ materially from those expressed or implied, and reported results should not be considered as an indication of future performance.
Risks that contribute to the uncertain nature of the forward-looking statements include, among others, the Company’s ability to deal with the substantial and increasingly intense competition in its industry; changes to the rules and practices of payment card networks and acquiring processors; the impact of acquisitions or divestitures, strategic investments, or entries into new businesses; the effect of evolving regulations and oversight related to the Company’s provision of payments services and other financial services; the effect of management changes and business initiatives; and changes in political, business, and economic conditions; as well as other risks listed or described from time to time in the Company’s filings with the Securities and Exchange Commission (the SEC), including the Company’s Quarterly Report on Form 10-Q for the fiscal quarter ended March 31, 2018, which is on file with the SEC and available on the investor relations page of the Company’s website. Additional information will also be set forth in the Company’s Quarterly Report on Form 10-Q for the fiscal quarter ended June 30, 2018. All forward-looking statements are based on information and estimates available to the Company at the time of this letter and are not guarantees of future performance. Except as required by law, the Company assumes no obligation to update any of the statements in this letter.
KEY OPERATING METRICS AND NON-GAAP FINANCIAL MEASURES
To supplement our financial information presented in accordance with generally accepted accounting principles in the United States (GAAP), we consider certain operating and financial measures that are not prepared in accordance with GAAP, including Gross Payment Volume, Adjusted Revenue, Adjusted EBITDA, Adjusted EBITDA margin, Adjusted Net Income (Loss), Adjusted EPS, and non-GAAP operating expenses. We believe these metrics and measures are useful to facilitate period-to-period comparisons of our business and to facilitate comparisons of our performance to that of other payments solution providers.
We define Gross Payment Volume (GPV) as the total dollar amount of all card payments processed by sellers using Square, net of refunds. Additionally, GPV includes Cash App activity related to peer-to-peer payments sent from a credit card, and Cash for Business.
Adjusted Revenue is a non-GAAP financial measure that we define as our total net revenue less transaction-based costs and bitcoin costs, and we add back the impact of the acquired deferred revenue adjustment, which was written down to fair value in purchase accounting. We believe it is useful to subtract transaction-based costs and bitcoin costs from total net revenue to derive Adjusted Revenue as this is a primary metric used
by management to measure our business performance, and it affords greater comparability to other payments solution providers. Substantially all of the transaction-based costs are interchange and assessment fees, processing fees, and bank settlement fees paid to third-party payment processors and financial institutions. While some payments solution providers present their revenue in a similar fashion to us, others present their revenue net of transaction-based costs because, unlike us, they pass through these costs directly to their sellers and are not deemed the principal in these arrangements. Under our standard pricing model, we do not pass through these costs directly to our sellers. We deduct bitcoin costs because we consider our role in the bitcoin transactions to be facilitating customer access to bitcoin. Since we only apply a small margin to the market cost of bitcoin when we sell bitcoin to customers, and we have no control over the cost of bitcoin in the market, which tends to be volatile, we believe deducting bitcoin costs is a better reflection of the economic benefits as well as the Company’s performance from the bitcoin transactions. We recognize acquired deferred revenue that was written down for purchase accounting since we believe that it is correlated with ordinary and ongoing operations of the acquired company and facilitates analysis of revenue growth and business trends. We define Adjusted Revenue from subscription and services as the total net subscription and services based revenue adjusted to add back the impact of the write-down adjustment to acquired deferred revenue related to purchase accounting. We add back this deferred revenue that was written down since we believe it is correlated with ordinary and ongoing operations of the acquired company and facilitates analysis of revenue growth and business trends.The acquired deferred revenue adjustment was not included in prior periods because it was immaterial or zero. Adjusted Revenue has limitations as a financial measure, should be considered as supplemental in nature, and is not meant as a substitute for the related financial information prepared in accordance with GAAP.
Adjusted EBITDA, Adjusted Net Income (Loss), Adjusted EPS, and non-GAAP operating expenses are non-GAAP financial measures that represent our net loss and net loss per share, adjusted to eliminate the effect of share-based compensation expenses, amortization of intangible assets, amortization of debt discount and issuance costs in connection with our offering of convertible senior notes in the first quarter of 2017 and in the second quarter of 2018, the gain or loss on the sale of property and equipment, and impairment of intangible assets, as applicable. We also exclude certain costs associated with acquisitions that are not normal recurring operating expenses, including amounts paid to redeem acquirees’ unvested stock-based compensation awards, and legal, accounting, and due diligence costs, and we add back the impact of the acquired deferred revenue and deferred cost adjustment, which was written down to fair value in purchase accounting. Such amounts were not included in prior periods as they were immaterial or zero. In addition to the items above, Adjusted EBITDA and non-GAAP operating expenses are non-GAAP financial measures that also exclude depreciation, other cash interest income and expense, other income and expense, and provision or benefit from income taxes, as applicable. Basic Adjusted Net Income (Loss) Per Share is computed by dividing the Adjusted Net Income (Loss) by the weighted-average number of shares of common stock outstanding during the period. Diluted Adjusted Net Income Per Share is computed by dividing Adjusted Net Income by the weighted-average number of shares of common stock outstanding, adjusted for the dilutive effect of all potential shares of common stock.
We have included Adjusted EBITDA and Adjusted EPS because they are key measures used by our management to evaluate our operating performance, generate future operating plans, and make strategic decisions, including those relating to operating expenses and the allocation of internal resources. Accordingly, we believe that Adjusted EBITDA and Adjusted EPS provide useful information to investors and others in understanding and evaluating our operating results in the same manner as our management and board of directors. In addition, they provide useful measures for period-to-period comparisons of our business, as they remove the effect of certain non-cash items and certain variable charges. Adjusted EBITDA and Adjusted EPS have limitations as financial measures, should be considered as supplemental in nature, and are not meant as substitutes for the related financial information prepared in accordance with GAAP.
These non-GAAP financial measures should not be considered in isolation from, or as a substitute for, financial information prepared in accordance with GAAP. These non-GAAP financial measures are not based on any standardized methodology prescribed by GAAP and are not necessarily comparable to similarly titled measures presented by other companies.
|
SQUARE Q2 2018 13 |
Consolidated Statements
of Operations
UNAUDITED
In thousands, except per share data
| THREE MONTHS ENDED | SIX MONTHS ENDED | |||||||||||||||
| Jun 30, 2018 | Jun 30, 2017 | Jun 30, 2018 | Jun 30, 2017 | |||||||||||||
| Revenue: |
||||||||||||||||
| Transaction-based revenue |
$ | 625,228 | $ | 482,065 | $ | 1,148,265 | $ | 885,543 | ||||||||
| Subscription and services-based revenue |
134,332 | 59,151 | 231,386 | 108,211 | ||||||||||||
| Hardware revenue |
18,362 | 10,289 | 32,779 | 19,305 | ||||||||||||
| Bitcoin revenue |
37,016 | — | 71,111 | — | ||||||||||||
|
|
|
|
|
|
|
|
||||||||||
| Total net revenue |
814,938 | 551,505 | 1,483,541 | 1,013,059 | ||||||||||||
|
|
|
|
|
|
|
|
||||||||||
| Cost of revenue: |
||||||||||||||||
| Transaction-based costs |
395,349 | 311,092 | 723,260 | 568,870 | ||||||||||||
| Subscription and services-based costs |
39,784 | 17,116 | 70,152 | 32,992 | ||||||||||||
| Hardware costs |
25,536 | 14,173 | 45,238 | 26,835 | ||||||||||||
| Bitcoin costs |
36,596 | — | 70,468 | — | ||||||||||||
| Amortization of acquired technology |
1,857 | 1,695 | 3,437 | 3,502 | ||||||||||||
|
|
|
|
|
|
|
|
||||||||||
| Total cost of revenue |
499,122 | 344,076 | 912,555 | 632,199 | ||||||||||||
|
|
|
|
|
|
|
|
||||||||||
| Gross profit |
315,816 | 207,429 | 570,986 | 380,860 | ||||||||||||
|
|
|
|
|
|
|
|
||||||||||
| Operating expenses: |
||||||||||||||||
| Product development |
114,800 | 78,126 | 219,895 | 146,708 | ||||||||||||
| Sales and marketing |
98,243 | 59,916 | 175,509 | 109,816 | ||||||||||||
| General and administrative |
82,772 | 62,988 | 158,273 | 119,923 | ||||||||||||
| Transaction, loan and advance losses |
21,976 | 18,401 | 40,007 | 30,292 | ||||||||||||
| Amortization of acquired customer assets |
672 | 222 | 941 | 427 | ||||||||||||
|
|
|
|
|
|
|
|
||||||||||
| Total operating expenses |
318,463 | 219,653 | 594,625 | 407,166 | ||||||||||||
|
|
|
|
|
|
|
|
||||||||||
| Operating loss |
(2,647) | (12,224) | (23,639) | (26,306) | ||||||||||||
|
|
|
|
|
|
|
|
||||||||||
| Interest and other expense, net |
2,655 | 3,266 | 5,474 | 3,765 | ||||||||||||
|
|
|
|
|
|
|
|
||||||||||
| Loss before income tax |
(5,302) | (15,490) | (29,113) | (30,071) | ||||||||||||
|
|
|
|
|
|
|
|
||||||||||
| Provision for income taxes |
604 | 472 | 779 | 981 | ||||||||||||
|
|
|
|
|
|
|
|
||||||||||
| Net loss |
$ | (5,906) | (15,962) | (29,892) | (31,052) | |||||||||||
|
|
|
|
|
|
|
|
||||||||||
| Net loss per share: |
||||||||||||||||
| Basic |
$ | (0.01) | $ | (0.04) | $ | (0.07) | $ | (0.08) | ||||||||
|
|
|
|
|
|
|
|
||||||||||
| Diluted |
$ | (0.01) | $ | (0.04) | $ | (0.07) | $ | (0.08) | ||||||||
|
|
|
|
|
|
|
|
||||||||||
| Weighted-average shares used to compute net loss per share |
||||||||||||||||
| Basic |
403,301 | 376,357 | 399,624 | 371,573 | ||||||||||||
|
|
|
|
|
|
|
|
||||||||||
| Diluted |
403,301 | 376,357 | 399,624 | 371,573 | ||||||||||||
|
|
|
|
|
|
|
|
||||||||||
|
SQUARE Q2 2018 14 |
Consolidated Balance Sheets
UNAUDITED
In thousands, except share and per share data
| Assets | Jun 30, 2018 | Dec 31, 2017 | ||||||
| Current assets: |
||||||||
| Cash and cash equivalents |
$ | 1,387,977 | $ | 696,474 | ||||
| Short-term investments |
233,599 | 169,576 | ||||||
| Restricted cash |
27,487 | 28,805 | ||||||
| Settlements receivable |
806,688 | 620,523 | ||||||
| Customer funds |
208,855 | 103,042 | ||||||
| Loans held for sale |
85,040 | 73,420 | ||||||
| Other current assets |
120,250 | 86,454 | ||||||
|
|
|
|
||||||
| Total current assets |
2,869,896 | 1,778,294 | ||||||
|
|
|
|
||||||
| Property and equipment, net |
121,708 | 91,496 | ||||||
| Goodwill |
255,656 | 58,327 | ||||||
| Acquired intangible assets, net |
85,514 | 14,334 | ||||||
| Long-term investments |
168,150 | 203,667 | ||||||
| Restricted cash |
12,908 | 9,802 | ||||||
| Other non-current assets |
40,995 | 31,350 | ||||||
|
|
|
|
||||||
| Total assets |
$ | 3,554,827 | $ | 2,187,270 | ||||
|
|
|
|
||||||
| Liabilities and Stockholders’ Equity |
||||||||
| Current liabilities: |
||||||||
| Accounts payable |
$ | 9,214 | $ | 16,763 | ||||
| Customers payable |
1,001,422 | 733,736 | ||||||
| Settlements payable |
140,616 | 114,788 | ||||||
| Accrued transaction losses |
29,207 | 26,893 | ||||||
| Accrued expenses |
74,816 | 52,280 | ||||||
| Other current liabilities |
60,635 | 28,367 | ||||||
|
|
|
|
||||||
| Total current liabilities |
1,315,910 | 972,827 | ||||||
|
|
|
|
||||||
| Long-term debt |
1,071,437 | 358,572 | ||||||
|
|
|
|
||||||
| Other non-current liabilities |
85,851 | 69,538 | ||||||
|
|
|
|
||||||
| Total liabilities |
2,473,198 | 1,400,937 | ||||||
|
|
|
|
||||||
| Commitments and contingencies |
||||||||
| Stockholders’ equity: |
||||||||
| Preferred stock, $0.0000001 par value: 100,000,000 shares authorized at June 30, 2018, and December 31, 2017. None issued and outstanding at June 30, 2018, and December 31, 2017. |
— | — | ||||||
| Class A common stock, $0.0000001 par value: 1,000,000,000 shares authorized at June 30, 2018, and December 31, 2017; 297,371,047 and 280,400,813 issued and outstanding at June 30, 2018, and December 31, 2017, respectively. |
— | — | ||||||
| Class B common stock, $0.0000001 par value: 500,000,000 shares authorized at June 30, 2018, and December 31, 2017; 109,580,981 and 114,793,262 issued and outstanding at June 30, 2018, and December 31, 2017, respectively. |
— | — | ||||||
| Additional paid-in capital |
1,963,298 | 1,630,386 | ||||||
| Accumulated deficit |
(877,213) | (842,735) | ||||||
| Accumulated other comprehensive loss |
(4,456) | (1,318) | ||||||
|
|
|
|
||||||
| Total stockholders’ equity |
1,081,629 | 786,333 | ||||||
|
|
|
|
||||||
| Total liabilities and stockholders’ equity |
$ | 3,554,827 | $ | 2,187,270 | ||||
|
|
|
|
||||||
|
SQUARE Q2 2018 15 |
Consolidated Statements of Cash Flows
UNAUDITED
In thousands
| SIX MONTHS ENDED | ||||||||
| Cash Flows from Operating Activities | Jun 30, 2018 | Jun 30, 2017 | ||||||
| Net loss |
$ | (29,892) | $ | (31,052) | ||||
| Adjustments to reconcile net loss to net cash provided by operating activities: |
||||||||
| Depreciation and amortization |
22,488 | 18,562 | ||||||
| Non-cash interest and other expense |
11,855 | 5,680 | ||||||
| Share-based compensation |
98,943 | 71,263 | ||||||
| Replacement stock awards issued in connection with acquisition |
757 | — | ||||||
| Recovery of common stock in connection with indemnification settlement agreement |
(2,745) | — | ||||||
| Transaction, loan and advance losses |
40,007 | 30,292 | ||||||
| Deferred provision (benefit) for income taxes |
(688) | 99 | ||||||
| Changes in operating assets and liabilities: |
||||||||
| Settlements receivable |
(191,987) | 8,934 | ||||||
| Customer funds |
(105,813) | (30,022) | ||||||
| Purchase of loans held for sale |
(734,251) | (570,819) | ||||||
| Sales and principal payments of loans held for sale |
716,950 | 560,209 | ||||||
| Other current assets |
(33,495) | (2,201) | ||||||
| Other non-current assets |
(9,696) | (110) | ||||||
| Accounts payable |
(9,716) | 143 | ||||||
| Customers payable |
267,746 | 34,149 | ||||||
| Settlements payable |
25,828 | (9,317) | ||||||
| Charge-offs to accrued transaction losses |
(26,030) | (22,243) | ||||||
| Accrued expenses |
6,083 | 17,000 | ||||||
| Other current liabilities |
18,008 | 4,327 | ||||||
| Other non-current liabilities |
6,680 | 5,696 | ||||||
|
|
|
|
||||||
| Net cash provided by operating activities |
71,032 | 90,590 | ||||||
|
|
|
|
||||||
| Cash Flows from Investing Activities | ||||||||
| Purchase of marketable securities |
(165,024) | (314,055) | ||||||
| Proceeds from maturities of marketable securities |
79,273 | 52,064 | ||||||
| Proceeds from sale of marketable securities |
56,259 | 21,730 | ||||||
| Purchase of property and equipment |
(23,143) | (13,883) | ||||||
| Purchase of intangible assets |
(1,584) | — | ||||||
| Business combinations, net of cash acquired |
(111,828) | (1,600) | ||||||
|
|
|
|
||||||
| Net cash used in investing activities: |
(166,047) | (255,744) | ||||||
|
|
|
|
||||||
| Cash Flows from Financing Activities | ||||||||
| Proceeds from issuance of convertible senior notes, net |
855,663 | 428,250 | ||||||
| Purchase of convertible senior note hedges |
(172,586) | (92,136) | ||||||
| Proceeds from issuance of warrants |
112,125 | 57,244 | ||||||
| Settlement of deferred purchase consideration |
(640) | — | ||||||
| Payment for termination of Starbucks warrant |
— | (54,808) | ||||||
| Principal payments on capital lease obligation |
(1,375) | (634) | ||||||
| Proceeds from the exercise of stock options and purchases |
67,199 | 89,863 | ||||||
| under the employee stock purchase plan, net |
||||||||
| Payments for tax withholding related to vesting of restricted stock units |
(68,575) | — | ||||||
|
|
|
|
||||||
| Net cash provided by financing activities |
791,811 | 427,779 | ||||||
|
|
|
|
||||||
| Effect of foreign exchange rate on cash and cash equivalents |
(3,505) | 2,331 | ||||||
|
|
|
|
||||||
| Net increase in cash, cash equivalents and restricted cash |
693,291 | 264,956 | ||||||
| Cash, cash equivalents and restricted cash, beginning of period |
735,081 | 488,745 | ||||||
|
|
|
|
||||||
| Cash, cash equivalents and restricted cash, end of period |
$ | 1,428,372 | $ | 753,701 | ||||
|
|
|
|
||||||
|
SQUARE Q2 2018 16 |
Key Operating Metrics and
Non-GAAP Financial Measures
UNAUDITED
In thousands, except GPV and per share data
| THREE MONTHS ENDED | SIX MONTHS ENDED | |||||||||||||||
| Jun 30, 2018 | Jun 30, 2017 | Jun 30, 2018 | Jun 30, 2017 | |||||||||||||
| Gross Payment Volume (GPV) (in millions) |
$ | 21,372 | $ | 16,421 | $ | 39,198 | $ | 30,068 | ||||||||
| Adjusted Revenue |
$ | 385,433 | $ | 240,413 | $ | 692,253 | $ | 444,189 | ||||||||
| Adjusted EBITDA |
$ | 68,322 | $ | 36,496 | $ | 104,216 | $ | 63,521 | ||||||||
| Adjusted Net Income Per Share: |
||||||||||||||||
| Basic |
$ | 0.15 | $ | 0.08 | $ | 0.23 | $ | 0.13 | ||||||||
| Diluted |
$ | 0.13 | $ | 0.07 | $ | 0.20 | $ | 0.12 | ||||||||
Adjusted Revenue Reconciliation
UNAUDITED
In thousands
| THREE MONTHS ENDED | SIX MONTHS ENDED | |||||||||||||||
| Jun 30, 2018 | Jun 30, 2017 | Jun 30, 2018 | Jun 30, 2017 | |||||||||||||
| Total net revenue |
$ | 814,938 | $ | 551,505 | $ | 1,483,541 | $ | 1,013,059 | ||||||||
| Less: transaction-based costs |
395,349 | 311,092 | 723,260 | 568,870 | ||||||||||||
| Less: bitcoin costs |
36,596 | — | 70,468 | — | ||||||||||||
| Add: deferred revenue adjustment related to purchase accounting |
2,440 | — | 2,440 | — | ||||||||||||
|
|
|
|
|
|
|
|
||||||||||
| Adjusted Revenue |
$ | 385,433 | $ | 240,413 | $ | 692,253 | $ | 444,189 | ||||||||
|
|
|
|
|
|
|
|
||||||||||
Adjusted EBITDA Reconciliation
UNAUDITED
In thousands
| THREE MONTHS ENDED | SIX MONTHS ENDED | |||||||||||||||
| Jun 30, 2018 | Jun 30, 2017 | Jun 30, 2018 | Jun 30, 2017 | |||||||||||||
| Net loss |
$ | (5,906) | $ | (15,962) | $ | (29,892) | $ | (31,052) | ||||||||
| Share-based compensation expense |
52,119 | 39,593 | 98,943 | 71,263 | ||||||||||||
| Depreciation and amortization |
12,328 | 9,125 | 22,488 | 18,562 | ||||||||||||
| Interest and other expense, net |
2,655 | 3,266 | 5,474 | 3,765 | ||||||||||||
| Provision for income taxes |
604 | 472 | 779 | 981 | ||||||||||||
| Loss (gain) on sale of property and equipment |
73 | 2 | (25) | 2 | ||||||||||||
| Acquisition-related costs |
4,363 | — | 4,363 | — | ||||||||||||
| Acquired deferred revenue adjustment |
2,440 | — | 2,440 | — | ||||||||||||
| Acquired deferred costs adjustment |
(354) | — | (354) | — | ||||||||||||
|
|
|
|
|
|
|
|
||||||||||
| Adjusted EBITDA |
$ | 68,322 | $ | 36,496 | $ | 104,216 | $ | 63,521 | ||||||||
|
|
|
|
|
|
|
|
||||||||||
|
SQUARE Q2 2018 17 |
Adjusted Net Income (Loss)
Reconciliation
UNAUDITED
In thousands, except per share data
| THREE MONTHS ENDED | SIX MONTHS ENDED | |||||||||||||||
| Jun 30, 2018 | Jun 30, 2017 | Jun 30, 2018 | Jun 30, 2017 | |||||||||||||
| Net loss |
$ | (5,906) | $ | (15,962) | $ | (29,892) | $ | (31,052) | ||||||||
| Share-based compensation expense |
52,119 | 39,593 | 98,943 | 71,263 | ||||||||||||
| Amortization of intangible assets |
2,816 | 1,943 | 4,691 | 4,064 | ||||||||||||
| Amortization of debt discount and issuance costs |
6,830 | 4,221 | 11,223 | 5,611 | ||||||||||||
| Loss (gain) on sale of property and equipment |
73 | 2 | (25) | 2 | ||||||||||||
| Acquisition-related costs |
4,363 | — | 4,363 | — | ||||||||||||
| Acquired deferred revenue adjustment |
2,440 | — | 2,440 | — | ||||||||||||
| Acquired deferred costs adjustment |
(354) | — | (354) | — | ||||||||||||
|
|
|
|
|
|
|
|
||||||||||
| Adjusted Net Income |
$ | 62,381 | $ | 29,797 | $ | 91,389 | $ | 49,888 | ||||||||
|
|
|
|
|
|
|
|
||||||||||
| Adjusted Net Income Per Share: |
||||||||||||||||
| Basic |
$ | 0.15 | $ | 0.08 | $ | 0.23 | $ | 0.13 | ||||||||
|
|
|
|
|
|
|
|
||||||||||
| Diluted |
$ | 0.13 | $ | 0.07 | $ | 0.20 | $ | 0.12 | ||||||||
|
|
|
|
|
|
|
|
||||||||||
| Weighted-average shares used to compute |
||||||||||||||||
| Adjusted Net Income Per Share: |
||||||||||||||||
| Basic |
403,301 | 376,357 | 399,624 | 371,573 | ||||||||||||
|
|
|
|
|
|
|
|
||||||||||
| Diluted |
470,022 | 418,468 | 465,892 | 411,420 | ||||||||||||
|
|
|
|
|
|
|
|
||||||||||
Adjusted Revenue
Guidance Reconciliation
UNAUDITED
In thousands
| THREE MONTHS ENDED | YEAR ENDED | |||||||
| Sep 30, 2018 | Dec 31, 2018 | |||||||
| Total net revenue |
$ | 840,000 - 860,000 | $ | 3,190,000 - 3,220,000 | ||||
| Less: Transaction-based costs, bitcoin costs, deferred revenue adjustment related to purchase accounting | 433,000 - 448,000 | 1,670,000 - 1,680,000 | ||||||
|
|
|
|
||||||
| Adjusted Revenue |
$ | 407,000 - 412,000 | $ | 1,520,000 - 1,540,000 | ||||
|
|
|
|
||||||
|
SQUARE Q2 2018 18 |
Non-GAAP Operating Expenses
UNAUDITED
In thousands
| THREE MONTHS ENDED | SIX MONTHS ENDED | |||||||||||||||
| Jun 30, 2018 | Jun 30, 2017 | Jun 30, 2018 | Jun 30, 2017 | |||||||||||||
| Operating expenses |
$ | (318,463) | $ | (219,653) | $ | (594,625) | $ | (407,166) | ||||||||
| Share-based compensation |
52,089 | 39,575 | 98,882 | 71,245 | ||||||||||||
| Depreciation and amortization |
10,242 | 7,400 | 18,822 | 14,931 | ||||||||||||
| Loss (gain) on sale of property and equipment |
73 | 2 | (25) | 2 | ||||||||||||
| Acquisition-related costs |
4,363 | — | 4,363 | — | ||||||||||||
|
|
|
|
|
|
|
|
||||||||||
| Non-GAAP operating expenses |
$ | (251,696) | $ | (172,676) | $ | (472,583) | $ | (320,988) | ||||||||
|
|
|
|
|
|
|
|
||||||||||
| Product development |
$ | (114,800) | $ | (78,126) | $ | (219,895) | $ | (146,708) | ||||||||
| Share-based compensation |
33,806 | 25,136 | 64,288 | 44,492 | ||||||||||||
| Depreciation and amortization |
5,974 | 3,436 | 11,447 | 7,148 | ||||||||||||
|
|
|
|
|
|
|
|
||||||||||
| Non-GAAP product development |
$ | (75,020) | $ | (49,554) | $ | (144,160) | $ | (95,068) | ||||||||
|
|
|
|
|
|
|
|
||||||||||
| Sales and marketing |
$ | (98,243) | $ | (59,916) | $ | (175,509) | $ | (109,816) | ||||||||
| Share-based compensation |
5,634 | 4,355 | 10,595 | 8,290 | ||||||||||||
| Depreciation and amortization |
952 | 98 | 1,561 | 175 | ||||||||||||
| Loss on sale of property equipment |
76 | 2 | 80 | 60 | ||||||||||||
|
|
|
|
|
|
|
|
||||||||||
| Non-GAAP sales and marketing |
$ | (91,581) | $ | (55,461) | $ | (163,273) | $ | (101,291) | ||||||||
|
|
|
|
|
|
|
|
||||||||||
| General and administrative |
$ | (82,772) | $ | (62,988) | $ | (158,273) | $ | (119,923) | ||||||||
| Share-based compensation |
12,649 | 10,084 | 23,999 | 18,463 | ||||||||||||
| Depreciation and amortization |
2,644 | 3,644 | 4,873 | 7,181 | ||||||||||||
| Gain on sale of property and equipment |
(3) | — | (105) | (58) | ||||||||||||
| Acquisition-related costs |
4,363 | — | 4,363 | — | ||||||||||||
|
|
|
|
|
|
|
|
||||||||||
| Non-GAAP general and administrative |
$ | (63,119) | $ | (49,260) | $ | (125,143) | $ | (94,337) | ||||||||
|
|
|
|
|
|
|
|
||||||||||
Depreciation and
Amortization by Function
UNAUDITED
In thousands
| THREE MONTHS ENDED | SIX MONTHS ENDED | |||||||||||||||
| Jun 30, 2018 | Jun 30, 2017 | Jun 30, 2018 | Jun 30, 2017 | |||||||||||||
| Cost of revenue |
$ | 2,086 | $ | 1,725 | $ | 3,666 | $ | 3,631 | ||||||||
| Product Development |
5,974 | 3,436 | 11,447 | 7,148 | ||||||||||||
| Sales and Marketing |
952 | 98 | 1,561 | 175 | ||||||||||||
| General and Administrative |
2,644 | 3,644 | 4,873 | 7,181 | ||||||||||||
| Amortization of acquired customer assets |
672 | 222 | 941 | 427 | ||||||||||||
|
|
|
|
|
|
|
|
||||||||||
| Total depreciation and amortization |
$ | 12,328 | $ | 9,125 | $ | 22,488 | $ | 18,562 | ||||||||
|
|
|
|
|
|
|
|
||||||||||
|
SQUARE Q2 2018 19 |
Square, Inc. Reports
- 03/10/2016 - 10-K
- 02/24/2017 - 10-K
- 02/27/2018 - 10-K
- 02/26/2020 - 10-K
- 02/23/2021 - 10-K
- 05/06/2016 - 10-Q
- 08/04/2016 - 10-Q
- 11/02/2016 - 10-Q
- 05/03/2017 - 10-Q
- 08/02/2017 - 10-Q
- 11/08/2017 - 10-Q
- 05/02/2018 - 10-Q
- 08/01/2018 - 10-Q
- 11/07/2018 - 10-Q
- 05/06/2020 - 10-Q
- 08/05/2020 - 10-Q
- 11/05/2020 - 10-Q
- 05/06/2021 - 10-Q
- 08/02/2021 - 10-Q
Also read
- Allete inc - 10-q, quarterly report
- Hawkins inc - 8-k, results of operations and financial condition financial statements and exhibits
- Key tronic corp - 8-k, departure of directors or certain officers; election of directors; appointment of certain officers: compensatory arrangements of certain officers
- Pbf logistics lp - 8-k, entry into a material definitive agreement creation of a direct financial obligation or an obligation under an off-balance sheet arrangement of a registrant unregistered sales of equity securities other events financial statements and exhibits
- Stamps.com inc - 8-k, results of operations and financial condition financial statements and exhibits