Attached files
| file | filename |
|---|---|
| EX-31.2 - CERTIFICATE OF PRINCIPAL FINANCIAL OFFICER PURSUANT TO SECTION 302 - Square, Inc. | exhibit312squareinc2016.htm |
| EX-32.1 - CERTIFICATE OF CEO AND CFO PURSUANT TO 18 U.S.C. SECTION 1350 - Square, Inc. | exhibit321squareinc2016.htm |
| EX-31.1 - CERTIFICATE OF PRINCIPAL EXECUTIVE OFFICER PURSUANT TO SECTION 302 - Square, Inc. | exhibit311squareinc2016.htm |
| EX-23.1 - CONSENT OF KPMG LLP - Square, Inc. | exhibit231squareinc2016.htm |
| EX-21.1 - LIST OF SUBSIDIARIES - Square, Inc. | exhibit211squareinc2016.htm |
| EX-10.13 - OFFER LETTER - Square, Inc. | exhibit1013squareinc2016.htm |
| EX-10.6 - OUTSIDE DIRECTOR COMPENSATION POLICY - Square, Inc. | exhibit106squareinc2016.htm |
UNITED STATES
SECURITIES AND EXCHANGE COMMISSION
Washington, D.C. 20549
FORM 10-K |
(Mark One) ý ANNUAL REPORT PURSUANT TO SECTION 13 OR 15(d) OF THE SECURITIES EXCHANGE ACT OF 1934 |
For the fiscal year ended December 31, 2016 OR |
o TRANSITION REPORT PURSUANT TO SECTION 13 OR 15(d) OF THE SECURITIES EXCHANGE ACT OF 1934 |
For the transition period from to |
Commission File Number 001-37622 |
SQUARE, INC. | ||
(Exact name of registrant as specified in its charter) | ||
Delaware | 80-0429876 | |
(State or other jurisdiction of incorporation or organization) | (I.R.S. Employer Identification Number) | |
1455 Market Street, Suite 600 San Francisco, CA 94103 |
(Address of principal executive offices, including zip code) |
(415) 375-3176 |
(Registrant's telephone number, including area code) |
Securities registered pursuant to Section 12(b) of the Act: | ||
Title of Each Class | Name of each exchange on which registered | |
Class A Common Stock, $0.0000001 par value per share | New York Stock Exchange | |
Securities registered pursuant to Section 12(g) of the Act: None |
Indicate by check mark if the registrant is a well-known seasoned issuer, as defined in Rule 405 of the Securities Act. YES ý NO o | |
Indicate by check mark if the registrant is not required to file reports pursuant to Section 13 or 15(d) of the Act. YES o NO ý | |
Indicate by check mark whether the registrant (1) has filed all reports required to be filed by Section 13 or 15(d) of the Securities Exchange Act of 1934 during the preceding 12 months (or for such shorter period that the registrant was required to file such reports), and (2) has been subject to such filing requirements for the past 90 days. YES ý NO o | |
Indicate by check mark whether the registrant has submitted electronically and posted on its corporate Web site, if any, every Interactive Data File required to be submitted and posted pursuant to Rule 405 of Regulation S-T (§ 232.405 of this chapter) during the preceding 12 months (or for such shorter period that the registrant was required to submit and post such files). YES ý NO o | |
Indicate by check mark if disclosure of delinquent filers pursuant to Item 405 of Regulation S-K (§ 229.405 of this chapter) is not contained herein, and will not be contained, to the best of registrant’s knowledge, in definitive proxy or information statements incorporated by reference in Part III of this Form 10-K or any amendment to this Form 10-K. o | |
Indicate by check mark whether the registrant is a large accelerated filer, an accelerated filer, a non‑accelerated filer, or a smaller reporting company. See the definitions of “large accelerated filer,” “accelerated filer” and “smaller reporting company” in Rule 12b‑2 of the Exchange Act. (Check one): | |
Large accelerated filer ý Non-accelerated filer o (Do not check if a smaller reporting company) | Accelerated filer o Smaller reporting company o |
Indicate by check mark whether the registrant is a shell company (as defined in Rule 12b-2 of the Act). YES o NO ý | |
The aggregate market value of the voting and non-voting common equity held by non-affiliates of the registrant, based on the closing price of a share of the registrant’s Class A common stock on June 30, 2016 as reported by the New York Stock Exchange on such date was approximately $1.4 billion. Shares of the registrant’s Class A common stock and Class B common stock held by each executive officer, director and holder of 5% or more of the outstanding Class A common stock and Class B common stock have been excluded in that such persons may be deemed to be affiliates. This calculation does not reflect a determination that certain persons are affiliates of the registrant for any other purpose.
As of February 17, 2017, the number of shares of the registrant’s Class A common stock outstanding was 208,288,497 and the number of shares of the registrant's Class B common stock outstanding was 158,902,579.
Portions of the registrant’s Definitive Proxy Statement relating to the Annual Meeting of Stockholders are incorporated by reference into Part III of this Annual Report on Form 10-K where indicated. Such Definitive Proxy Statement will be filed with the Securities and Exchange Commission within 120 days after the end of the registrant’s fiscal year ended December 31, 2016.
TABLE OF CONTENTS
Page No | ||
Item 1. | ||
Item 1A. | ||
Item 1B. | ||
Item 2. | ||
Item 3. | ||
Item 4. | ||
Item 5. | ||
Item 6. | ||
Item 7. | ||
Item 7A. | ||
Item 8. | ||
Item 9. | ||
Item 9A. | ||
Item 9B. | ||
Item 10. | ||
Item 11. | ||
Item 12. | ||
Item 13. | ||
Item 14. | ||
Item 15. | ||
SPECIAL NOTE REGARDING FORWARD-LOOKING STATEMENTS
This Annual Report on Form 10-K contains forward-looking statements within the meaning of Section 27A of the Securities Act of 1933, as amended, and Section 21E of the Securities Exchange Act of 1934, as amended, that involve substantial risks and uncertainties. Forward-looking statements generally relate to future events or our future financial or operating performance. In some cases, you can identify forward-looking statements because they contain words such as “may,” “will,” “appears,” “should,” “expects,” “plans,” “anticipates,” “could,” “intends,” “target,” “projects,” “contemplates,” “believes,” “estimates,” “predicts,” “potential,” or “continue,” or the negative of these words or other similar terms or expressions that concern our expectations, strategy, plans, or intentions. Forward-looking statements contained in this Annual Report on Form 10-K include, but are not limited to, statements about our future financial performance, our anticipated growth and growth strategies and our ability to effectively manage that growth, our ability to invest in and develop our products and services to operate with changing technology, our anticipated expansion and growth in Gross Payment Volume (GPV) and revenue, our plans for international expansion, our plans with respect to patents and other intellectual property, our expectations regarding litigation, and the sufficiency of our cash and cash equivalents and cash generated from operations to meet our working capital and capital expenditure requirements.
The outcome of the events described in these forward-looking statements is subject to risks, uncertainties, and other factors described in the section titled “Risk Factors” and elsewhere in this Annual Report on Form 10-K.
We undertake no obligation to update any forward-looking statements made in this Annual Report on Form 10-K to reflect events or circumstances after the date of this Annual Report on Form 10-K or to reflect new information or the occurrence of unanticipated events, except as required by law.
3
PART I
Item 1. BUSINESS
Our Business
We started Square in February 2009 to enable businesses (sellers) to accept card payments, an important capability that was previously inaccessible to many businesses. However, sellers also need innovative solutions to thrive, and we have since expanded to provide additional products and services to provide these businesses with access to the same tools as large businesses. This approach aligns with our purpose of economic empowerment, as everything we do should give sellers accessible, affordable tools to grow their businesses and participate in the economy.
Square is a cohesive commerce ecosystem that helps our sellers start, run, and grow their businesses. We combine sophisticated software with affordable hardware to enable sellers to turn mobile devices and computing devices into powerful payment and point-of-sale solutions. We have high seller acceptance rates and fast onboarding, while maintaining low risk and fraud losses as a result of our approach to risk management that emphasizes data science and machine learning. We focus on technology and design to create products and services that are cohesive, fast, self-serve, and dependable. These attributes differentiate us in a fragmented industry that forces sellers to stitch together hardware, software, and payments services from multiple vendors.
The foundation of our ecosystem is a full service, managed payments offering. Once a seller downloads the Square Point of Sale mobile app, they can quickly and easily take their first payment, because we can typically bring them onto our system in minutes. With our offering, a seller can accept payments in person via magnetic stripe (a swipe), EMV (Europay, MasterCard, and Visa) (a dip), or NFC (Near Field Communication) (a tap); or online via Square Invoices, Square Virtual Terminal, or the seller’s website. Once on our system, sellers gain access to technology and features such as reporting and analytics, next-day settlements, digital receipts, payment dispute management and chargeback protection, and Payment Card Industry (PCI) compliance. On the consumer (buyer) side, Square Cash offers individuals access to a fast, easy way to send and receive money electronically to and from individuals and businesses.
Our commerce ecosystem also includes powerful point-of-sale software and services that help sellers make informed business decisions through the use of analytics and reporting. As a result, sellers can manage orders, inventory, locations, employees, and payroll; engage and grow their sales with customers; and gain access to business loans. We monetize these features through either a per transaction fee, a subscription fee, or a service fee. Some of these advanced point-of-sale features are broadly applicable to our seller base and include Employee Management and Customer Engagement. With our Square Capital service, we facilitate the offering of loans to sellers based on their payment processing history, and the product is broadly applicable across our seller base. We have also extended our ecosystem to serve sellers with more specific needs. Our Build with Square developer platform (APIs) allows businesses with individualized needs to customize their business solutions while processing payments on Square and taking advantage of all the services in our ecosystem, including integration with third-party applications. In addition, certain verticals, such as service and retail sellers, benefit from specific features such as Invoices, Appointments, and Square Inventory. We also serve sellers through Caviar, a food ordering service that helps restaurants reach new customers and increase sales without additional overhead.
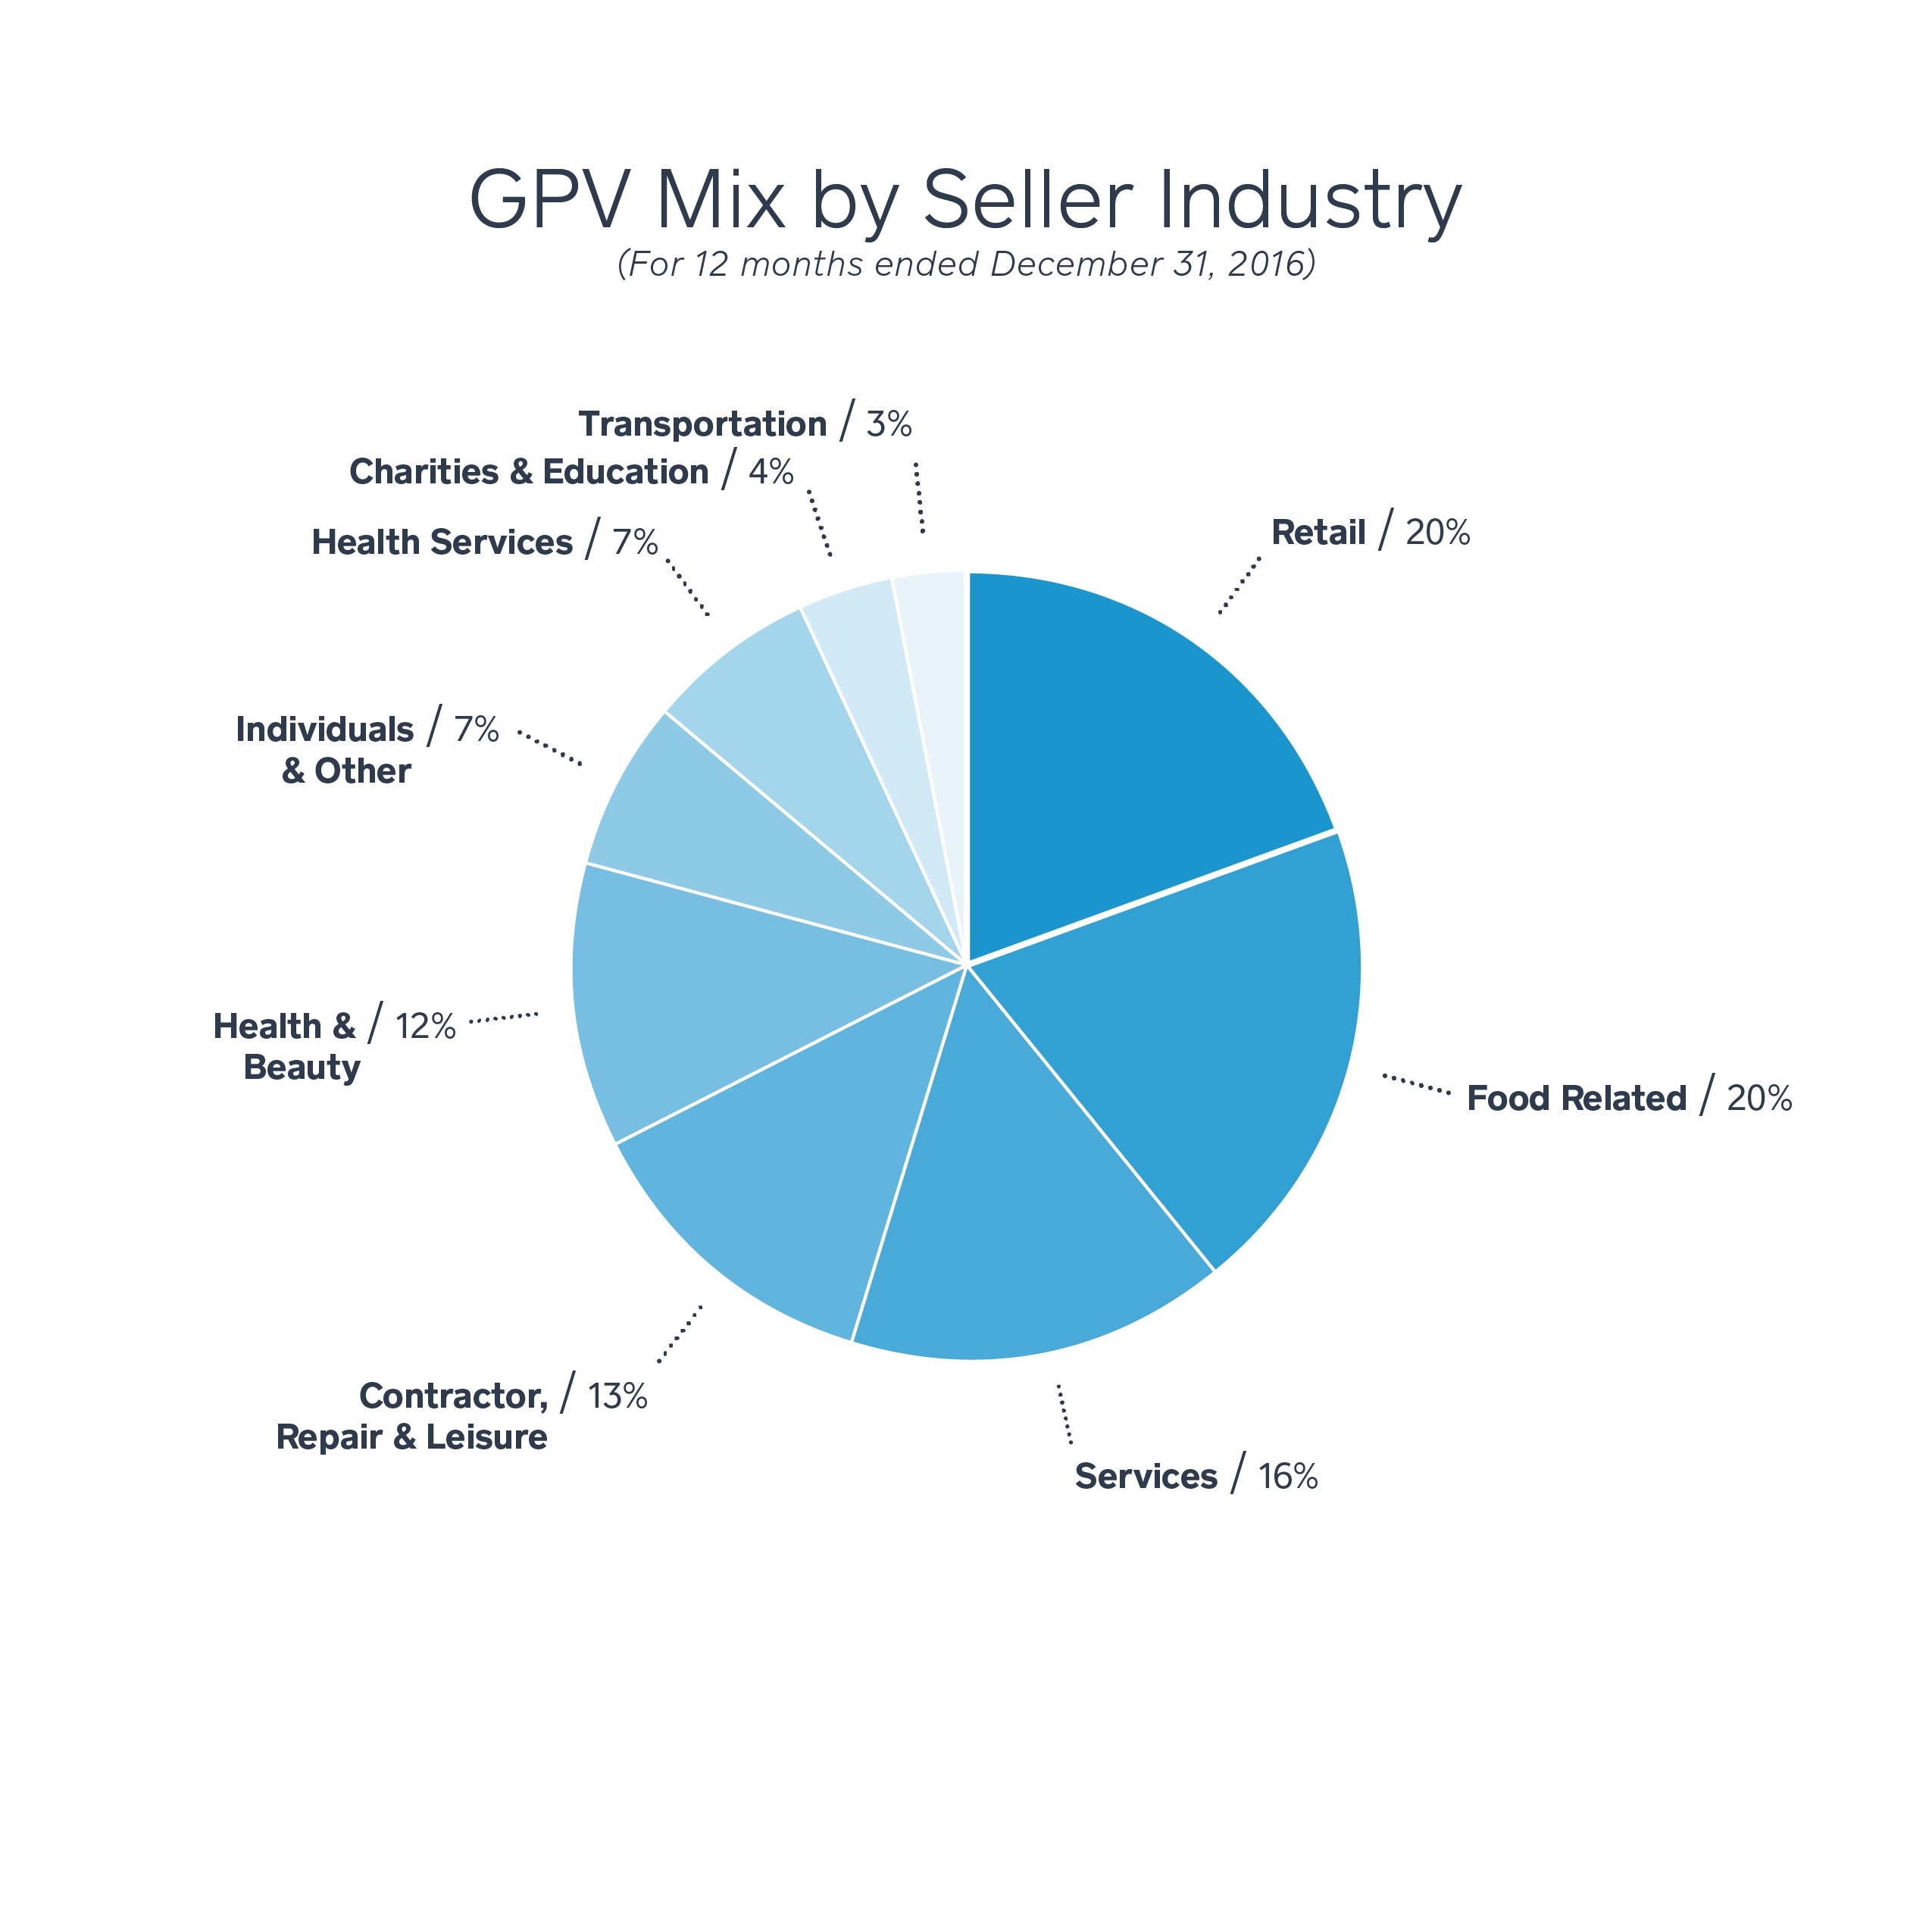
We have grown rapidly to serve millions of sellers that represent a diverse set of industries, including retail, services, and food-related businesses, and sizes, ranging from a single vendor at a farmers’ market to multi-location businesses. These sellers also span geographies including the United States, Canada, Japan, and Australia. We believe the diversity of our sellers underscores the accessibility and flexibility of our offerings. In the year ended December 31, 2016, we processed $49.7 billion of Gross Payment Volume (GPV), which was generated by 1 billion card payments from approximately 245 million payment cards. We processed $35.6 billion and $23.8 billion of GPV in 2015 and 2014, respectively.
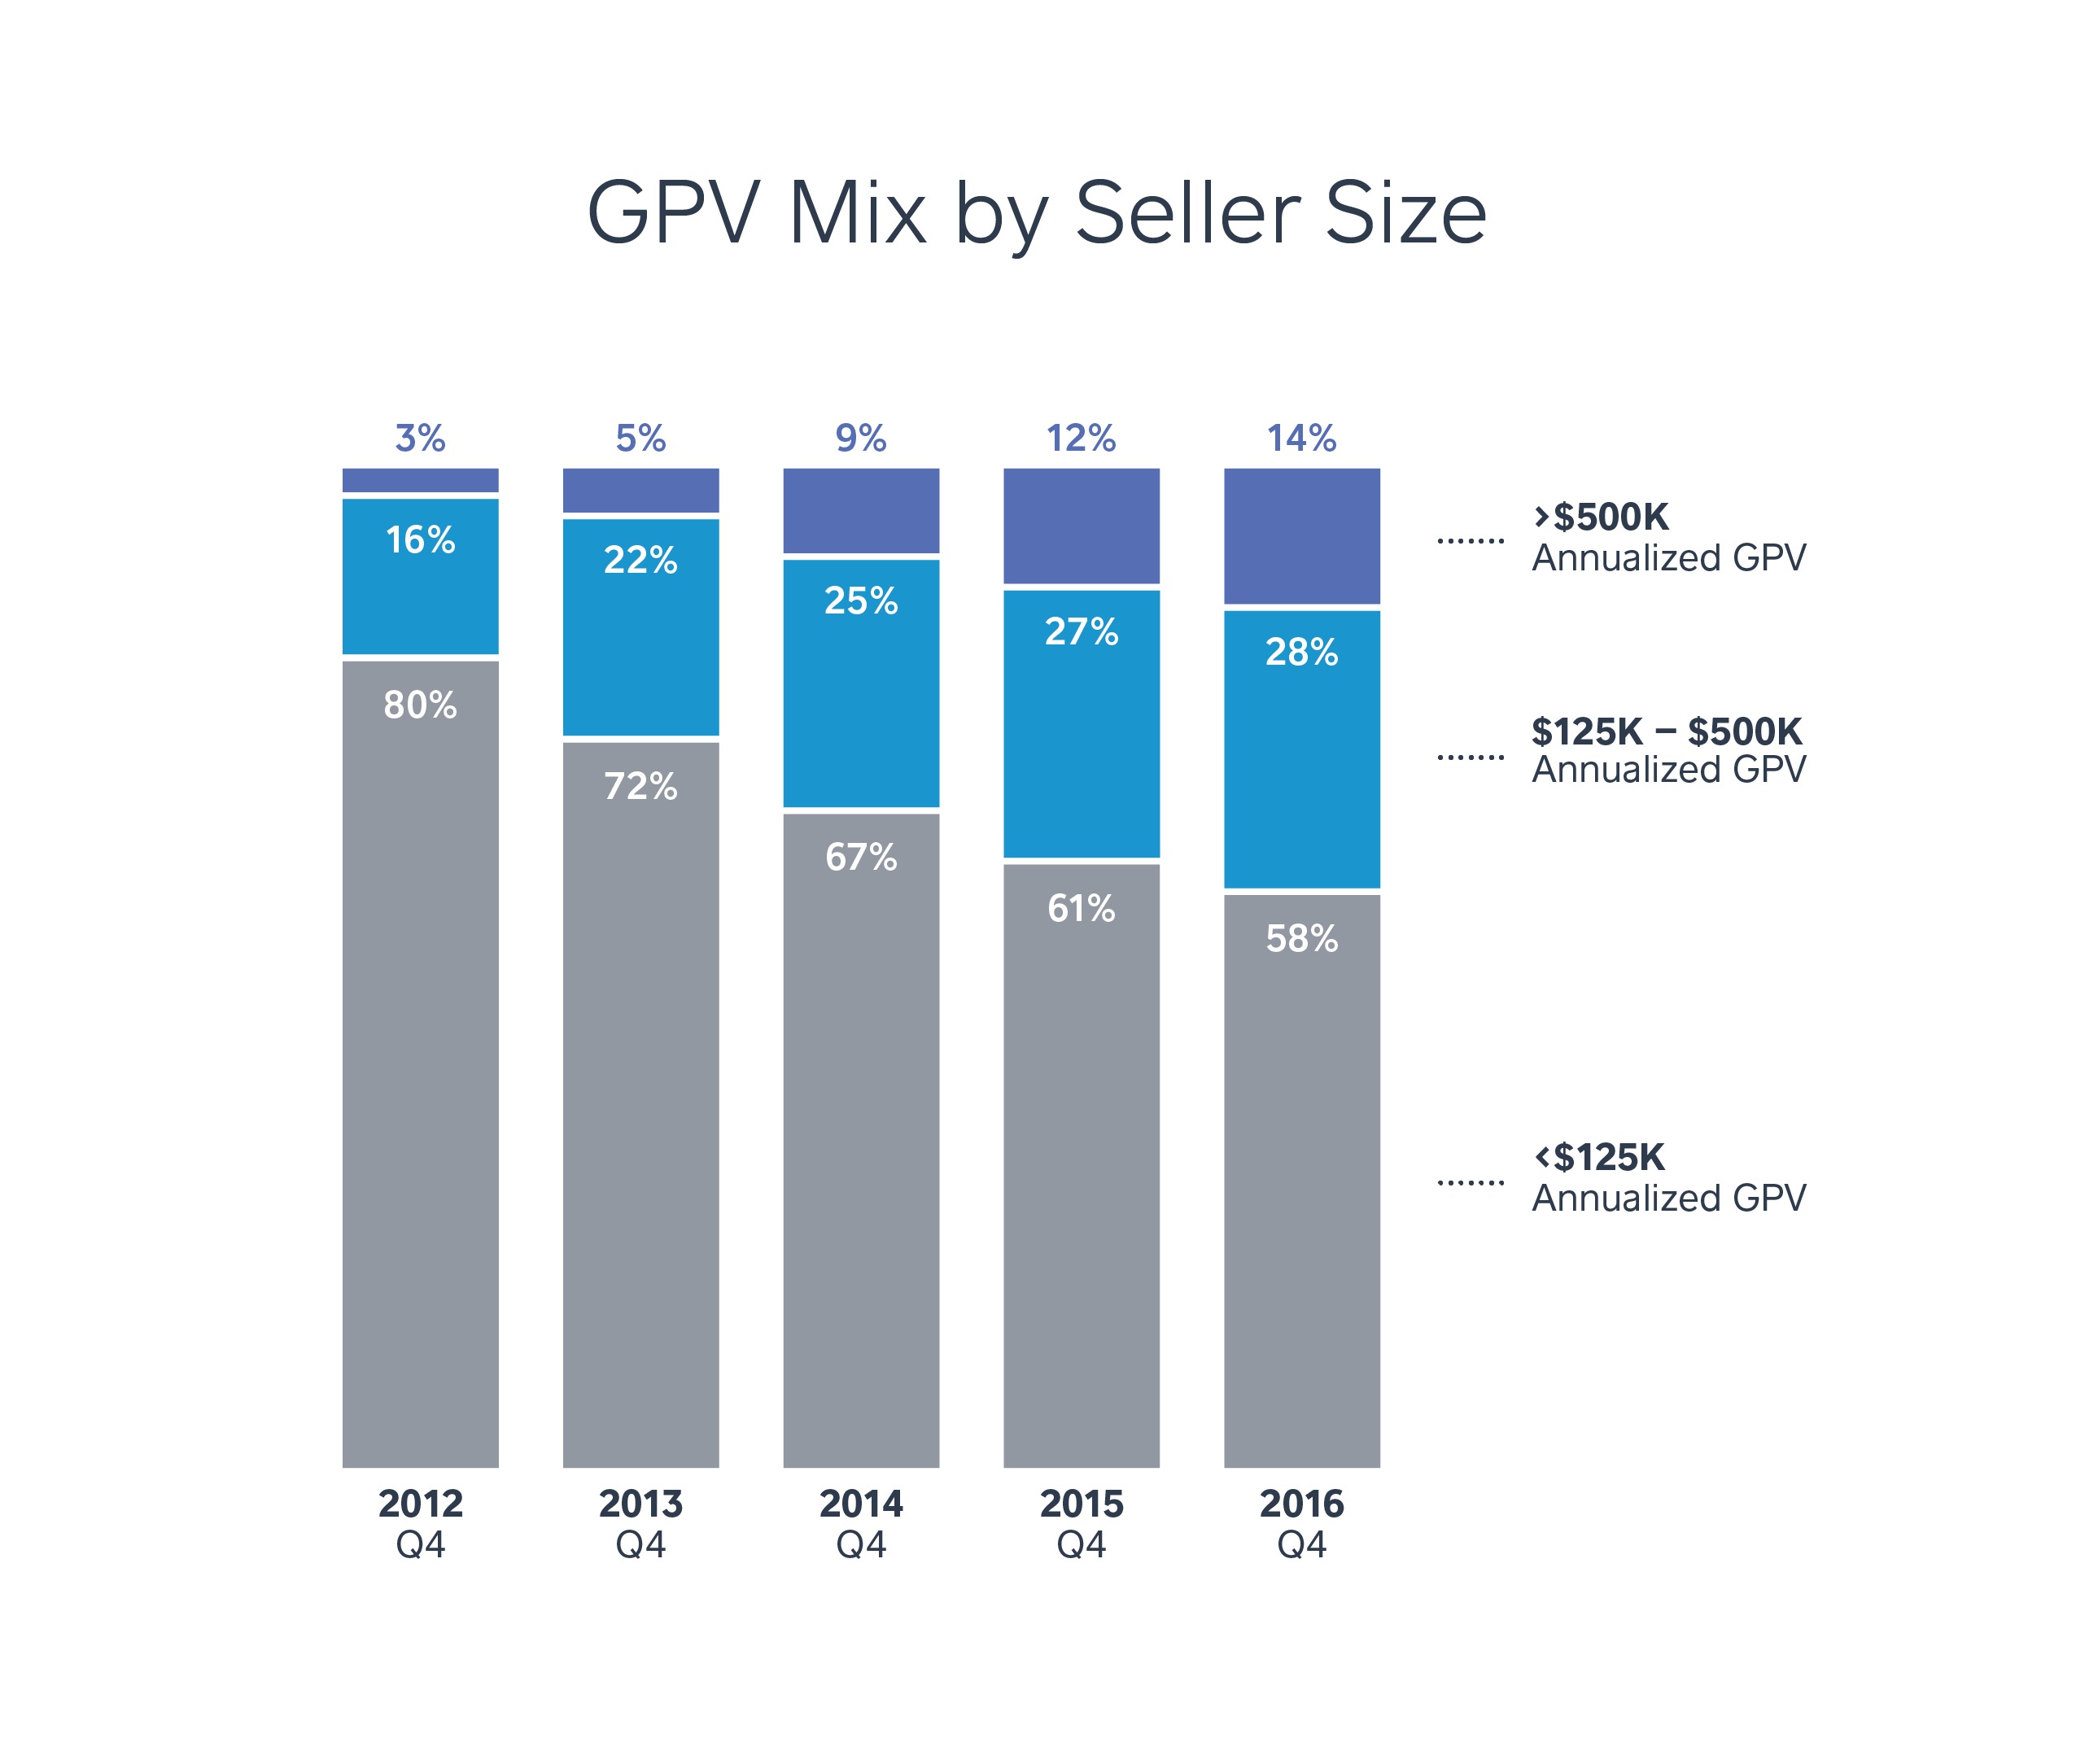
Our ability to add new sellers efficiently, and help them grow their business after they join our platform, has led to continued and sustained growth. Our existing sellers also represent a sizable opportunity to up-sell and cross-sell products and services with little incremental sales and marketing expense. Additionally, we are increasingly serving larger sellers, which we define as those that generate more than $125,000 in annualized GPV. GPV from larger sellers represented 42% of our GPV in the fourth quarter of 2016, an increase from 39% in the fourth quarter of 2015.
Year Ended December 31, | 2015 to 2016 | 2014 to 2015 | |||||||||||||||
2016 | 2015 | 2014 | % Change | % Change | |||||||||||||
Gross Payment Volume (GPV) (in millions) | $ | 49,683 | $ | 35,643 | $ | 23,780 | 39 | % | 50 | % | |||||||
Total net revenue | $ | 1,708,721 | $ | 1,267,118 | $ | 850,192 | 35 | % | 49 | % | |||||||
Adjusted Revenue | $ | 686,618 | $ | 452,168 | $ | 276,310 | 52 | % | 64 | % | |||||||
Net loss attributable to common stockholders | $ | (171,590 | ) | $ | (212,017 | ) | $ | (154,093 | ) | ||||||||
Adjusted EBITDA | $ | 44,887 | $ | (41,115 | ) | $ | (67,741 | ) | |||||||||
Net loss per share attributable to common stockholders: | |||||||||||||||||
Basic | $ | (0.50 | ) | $ | (1.24 | ) | $ | (1.08 | ) | ||||||||
Diluted | $ | (0.50 | ) | $ | (1.24 | ) | $ | (1.08 | ) | ||||||||
Adjusted Net Income (Loss) Per Share: | |||||||||||||||||
Basic | $ | 0.04 | $ | (0.39 | ) | $ | (0.62 | ) | |||||||||
Diluted | $ | 0.04 | $ | (0.39 | ) | $ | (0.62 | ) | |||||||||
Our Products and Services
Managed Payments Solutions
The foundation of our ecosystem is a full service, managed payments offering. As previously mentioned, sellers can onboard to Square in minutes, and once onboarded, a seller can accept payments in person via the swipe, dip, or tap of a card; online via Square Invoices, Square Virtual Terminal, or the seller’s website; or through Square Cash, our personal finance app. By paying one transparent transaction fee, sellers receive technology and features that allow them to manage the entire payment lifecycle including reporting and analytics, next-day settlements (or instant settlement for an additional transaction fee via Instant Deposit), digital receipts, payment dispute management and chargeback protection, and PCI compliance. Transaction-based revenue as a percentage of GPV was 2.93%, 2.95%, and 2.98% in the years ended December 31, 2016, 2015, and 2014, respectively.
In-person/card present (CP) payments
For in-person payments, our affordable, custom-designed hardware can process all card payment forms, including magnetic stripe, EMV chip, and NFC technology. Sellers can accept Visa, MasterCard, American Express, or Discover for one transaction fee. Our hardware includes the following products:
• | Magstripe reader: Our free magstripe reader enables swiped transactions of magnetic stripe cards by connecting with an iOS or Android smartphone or tablet. |
• | Contactless and chip reader: This reader accepts EMV chip cards and NFC payments, enabling acceptance via Apple Pay, Android Pay, and other mobile wallets. The reader connects wirelessly or via USB. |
• | Chip card reader: Our chip card reader accepts EMV chip cards and enables swiped transactions of magnetic stripe cards by connecting with an iOS or Android smartphone or tablet. |
• | Square Stand: This hardware transforms an iPad into a full point-of-sale terminal. It features an integrated magnetic stripe reader, provides power to a connected iPad, and can connect to the contactless and chip reader wirelessly or via USB. Square Stand also connects to various peripheral devices that brick-and-mortar businesses need, such as barcode scanners and receipt printers. |
5
Online/card not present (CNP) payments
Sellers can also accept online or card not present payments with Square by manually entering card information into the Square Point of Sale mobile app or into Square Virtual Terminal via a web browser. Additionally, Square Invoices allows a seller to collect payments securely by creating a custom digital invoice from Square Point of Sale or from Square Dashboard, our reporting and analytics tool, which is then emailed directly to the customer.
Square Cash
Square Cash is an easy-to-use personal finance app that allows anyone to send and receive money electronically. Individuals and businesses can sign up for a Square Cash account using just a debit card, bank account, or credit card and an email address or a phone number. Square Cash is free for individuals sending peer-to-peer payments with a debit card or bank account, or for a per transaction fee for all businesses and individuals sending peer-to-peer payments with a credit card. Individuals have multiple ways to access the money in their Square Cash account. Peer-to-peer payments users can deposit funds into their bank account within 1-3 business days for free, or instantly for a per transaction fee. Alternatively, users can store the money in Square Cash, which can be linked to a virtual Visa debit card that can be used for online purchases or in-person payments where Apple Pay is accepted.
Square Point of Sale
Square Point of Sale is our powerful point-of-sale software that can be downloaded to any iOS or Android device and is designed to get a seller (and their employees) up and running quickly. It consists of managed payments solutions and advanced software products, all of which are integrated with one another to provide both sellers and their buyers with a cohesive experience that is fast, self-serve, and dependable. Square Point of Sale also includes Square Dashboard, our cloud-based reporting and analytics tool that provides sellers with real-time data and insights about sales, items, customers, and employees. This enables sellers to make informed decisions about their business. We monetize these features through either a per transaction fee, a subscription fee, or a service fee.
Our advanced point-of-sale features are ideal for a seller with a more complex business or for a seller who has multiple employees and/or locations. Location and employee management allows a seller to track sales by location, device, or employee; customize employee permissions; and create employee timecards. Square Payroll empowers sellers to grow by making it easy to hire, onboard, and pay employees and the associated taxes. Square Point of Sale also provides customer engagement tools that help sellers grow their business through digital customer feedback, marketing, and loyalty programs. By linking customer data with point-of-sale and transaction data, we can offer targeted marketing campaigns and a closed-loop system that allows sellers to easily assess the return on investment of their marketing efforts.
Additionally, we continue to add features to Square Point of Sale to better meet the needs of specific industries, such as services, retail, and food-related sellers. Sellers in the services industry can enable their customers to easily schedule appointments with their preferred time, service, and staff member. Sellers can also send invoices to their customer’s email address, creating a seamless experience from booking to payment. And sellers in food-related industries, like bars and restaurants, can easily create, save, add to, split, and close tickets (with tip).
We recently launched Square for Retail, our first industry-specific point of sale that is purpose-built for retailers with sophisticated management needs. Square for Retail is an end-to-end solution that fully integrates with our managed payments solutions and hardware. It has a search-based user interface and fast barcode scanning; advanced inventory management that supports tens of thousands of items, cost of goods sold, purchase orders; and employee management and advanced clientèling capabilities that allow retail sellers to better understand their customers’ habits.
Developer platform
We have opened Square to reach sellers who want access to our ecosystem but also want flexibility in their solutions to meet their individualized business needs. Build with Square is our developer platform, consisting of various application program interfaces (APIs) that allow sellers and their developers to customize business solutions. Our Point-of-Sale API allows sellers to integrate any iOS or Android point of sale with Square to accept payments and access all other services in the ecosystem. This is particularly useful for sellers with highly-individualized point-of-sale needs. With our e-commerce API, sellers can integrate Square with their e-commerce website, giving them the ability to track, manage, and grow both their online and offline businesses in a single dashboard.
6
Build with Square also has APIs for sellers to integrate Square with business solutions such as item and inventory management, sales reporting and analytics, and employee management. Through the Square App Marketplace, sellers can also integrate Square with third-party apps, such as QuickBooks or BigCommerce, that create extensions to our point-of-sale functionality and other back office solutions, and enables sellers to integrate all of their business data.
Square Capital
Square Capital, through a partnership with a Utah-chartered, member FDIC industrial bank, facilitates loans to pre-qualified sellers based on real-time payment and point-of-sale data. These customized loan offers eliminate the lengthy (and often unsuccessful) loan application process for the seller, while facilitating prudent risk management. The terms are straightforward for sellers, and once approved, they get their funds quickly, often the next business day. Sellers can use these funds to make investments in their business, such as purchasing inventory or equipment, hiring additional employees, expanding their stores, or opening new locations.
Generally, loan repayment occurs automatically through a fixed percentage of every card transaction a seller takes. By simply running their business, sellers repay their loan within an average of nine months. We currently fund a majority of these loans from arrangements with institutional third-party investors who purchase these loans on a forward-flow basis. This funding significantly increases the speed with which we can scale Square Capital services and allows us to mitigate our balance sheet and liquidity risk.
Since its public launch in May 2014, Square Capital has facilitated over 200,000 loans and merchant cash advances (MCAs), representing $1.3 billion.
Caviar
Caviar is another service we offer that helps sellers grow and provides a differentiated way to service restaurants, a large target market for managed payments and point-of-sale solutions. This service makes it easy for restaurants to offer food delivery to their customers, enabling them to expand their sales and grow revenue without additional overhead. Individuals can order food from local restaurants through the Caviar website or mobile app, which is purpose-built to make delivery fast and easy. Caviar is currently available in many U.S. markets, including but not limited to New York, San Francisco, and Philadelphia, with thousands of partner restaurants. Caviar charges consumers a delivery and service fee per order. We also charge our partner restaurants a seller fee as a percentage of total food order value.
Our Sellers
Our sellers represent a diverse range of industries, including retail, services, and food-related businesses. We serve sellers of various sizes, ranging from a single vendor at a farmers’ market to multi-location businesses. These sellers also span geographies including the United States, Canada, Japan, and Australia, with further international expansion planned. We believe the diversity of our sellers underscores the accessibility and flexibility of our offerings.
We are increasingly serving larger sellers, which we define as sellers that generate more than $125,000 in annualized GPV. GPV from larger sellers represented 42% of total GPV in the fourth quarter of 2016, up from 39% in the fourth quarter of 2015 and 33% in the fourth quarter of 2014. For the year ended December 31, 2016, we had no customer who accounted for greater than 10% of our GPV or our net revenue.
7
The chart below shows the mix of our GPV by seller size and industry:
8
Sales and Marketing
We have a strong brand and continue to increase awareness of Square among sellers by enhancing our services and fostering rapid adoption through brand affinity, direct marketing, public relations, and strategic partnerships. Our Net Promoter Score (NPS) has averaged nearly 70 over the past four quarters, which is double the average score for banking providers. Our high NPS means our sellers recommend our services to others, strengthening our brand and helping to drive efficient customer acquisition.
Direct marketing, online and offline, has also been an effective customer acquisition channel. This includes online display advertising, online search engine optimization and marketing, social media, direct mail campaigns, seller referral programs, television advertising, and trade shows and events. Additionally, Square hardware products, such as our contactless and chip reader or Square Stand, are available at over 36,000 retail stores (including Apple, Amazon, Best Buy, Staples, Target, and Walgreens). Our direct sales and account management teams also contribute to the acquisition and support of larger sellers. In addition to direct channels, we work with third-party partners and developers who offer our solutions to their customers.
Our direct, ongoing interactions with our sellers help us tailor offerings to them, at scale, and in the context of their usage. We use various scalable communication channels, such as email marketing, in-app notifications and messaging, dashboard alerts, and Square Communities, our online forum for sellers, to increase the awareness and usage of our products and services with little incremental sales and marketing expense.
Product Development and Technology
We design our products and services to be cohesive, fast, self-serve, and dependable, and we organize our product teams accordingly, combining individuals from product management, development and engineering, data science, and design. Our products and services are mobile-first and platform-agnostic, and we are able to continuously optimize them because our hardware, software, and payments processing are integrated. We frequently update our software products and have a regular software release schedule with improvements deployed generally twice a month, ensuring our sellers get immediate access to the latest features. Our services are built on a scalable technology platform, and we place a strong emphasis on data analytics and machine learning to maximize the efficacy, efficiency, and scalability of our services. This enables us to capture and analyze over a billion transactions per year and automate risk assessment for more than 99.95% of all transactions. Our hardware is designed and developed in-house, and we contract with third-party manufacturers for production. Our product development expenses were $268.5 million, $199.6 million and $144.6 million for the years ended December 31, 2016, 2015, and 2014, respectively.
Transaction Processing Overview
Processing card transactions requires close coordination among a number of industry participants that provide the services and infrastructure required to enable such transactions. These participants consist of payment service providers, acquiring processors, card networks, and issuing banks. Within this landscape, Square serves as a payment service provider, acting as the touch point for the seller to the rest of the payment chain. The definitions and graphic below outline this payment chain and the typical flow of a Square transaction, along with the types of fees typically paid and received at each stage.
Payment Service Provider (PSP): Provider of the payment services that holds the direct relationship with the seller and facilitates the rest of the transaction on behalf of the seller. A PSP is also the merchant of record for the transaction. The merchant of record is liable for the settlement of transactions processed.
Acquiring Processor: Provider of the back-end technology that facilitates the flow of payment information through the Card Networks to the Issuing Bank. Our agreements with acquiring processors typically have terms of two to four years.
Card Networks (e.g. Visa, MasterCard): Provider of the infrastructure for card payment information to flow from the Acquiring Bank to the Acquiring Processor.
Issuing Bank: The financial institution that issues the buyer’s payment card.
Acquiring Bank: The financial institution associated with the Acquiring Processor.
9
1. | Once the buyer is ready to make a purchase, the seller inputs the transaction into the Square Point of Sale and presents the buyer with the amount owed. |
2. | For in-person transactions, the buyer pays by swiping or dipping their payment card, or by tapping their NFC-enabled payment card or mobile device on a Square Reader or Square Stand, which captures the buyer’s account information. For card not present transactions, card information is keyed in manually by either the buyer or seller into the Square Point of Sale app, Square Invoices, Square Virtual Terminal, or the seller's e-commerce website. |
3. | The Square Point of Sale sends the transaction information to Square, which acts as the PSP. |
4. | Square passes the transaction information to the Acquiring Processor via an internet connection. Square pays a small fixed fee per transaction to the Acquiring Processor. |
5. | The Acquiring Processor routes the transaction to the appropriate Card Network affiliated with the buyer’s card such as Visa, Mastercard, Discover, or American Express. Square pays a variety of fees to the Card Network, the most significant of which are assessment fees that are typically less than 0.15% of the transaction amount. |
10
6. | The Acquiring Processor then routes the transaction through the Card Network to the Issuing Bank, which authorizes or declines the transaction for the buyer’s payment card. |
7. | Upon authorization, the Issuing Bank sends a notification back through the Card Network to the Square Point of Sale to inform the seller that the transaction has been successfully authorized. |
8. | The Square Point of Sale sends a digital receipt for the transaction to the buyer, enabling a persistent communication channel between the seller and the buyer. For example, this is how the buyer can send feedback to the seller about the service provided. |
9. | The Issuing Bank then triggers a disbursement of funds to the Acquiring Bank through the Card Network for the transaction amount. Square will ultimately pay the Issuing Bank an interchange fee as a percentage of the amount of the transaction plus a fixed fee per transaction, which together average between 1.5% to 2.0% of the transaction amount. However, this percentage can vary significantly based on the card type, transaction type, and transaction size. |
10. | Square transfers the funds to the seller’s bank account, net of the fee charged by Square. Square provides sellers with fast access to funds, typically settling with them by the business day after the date of the transaction via Automated Clearing House (ACH) transfers, or the same day via its Instant Deposit service for an additional transaction fee. Square pays a very small fee for each ACH transfer. |
11. | The funds are settled from the Acquiring Bank to Square, typically in one to two business days after the date of the transaction. |
12. | At the end of the month, the Issuing Bank sends a statement to the buyer showing their monthly charges. The statement includes a reference to Square as the merchant of record on the billing statement as a prefix to the seller name (denoted as SQ). |
Our Competition
The markets in which we operate are competitive and evolving. Our competitors range from large, well-established vendors to smaller, earlier-stage companies.
We seek to differentiate ourselves from competitors primarily on the basis of our commerce ecosystem and our focus on building products and services that are cohesive, fast, self-serve, and dependable. With respect to each of these factors, we believe that we compare favorably to our competitors.
For payments and point-of-sale services, we compete primarily with traditional acquiring processors and payment processors who sell costly card terminal and point-of-sale systems, often tied to long-term contracts, through direct sales or Independent Sales Organization (ISO) channels. Many competitors offer payments and point-of-sale services that have features tailored to particular industries or business types but require sellers to stitch together technology from multiple hardware, software, and payments vendors.
Some sellers may elect to use individual point-of-sale solutions from other companies that overlap with certain functions and features that we provide, including:
• | Business software providers such as those that provide inventory management, analytics, customer management and marketing, e-commerce, and appointment solutions; |
• | Established or new alternative lenders; |
• | Delivery service providers; and |
• | Peer-to-peer payment providers. |
11
Intellectual Property
We seek to protect our intellectual property rights by relying on a combination of federal, state, and common law rights in the United States and other countries, as well as on contractual measures. It is our practice to enter into confidentiality, non-disclosure, and invention assignment agreements with our employees and contractors, and into confidentiality and non-disclosure agreements with other third parties, in order to limit access to, and disclosure and use of, our confidential information and proprietary technology. In addition to these contractual measures, we also rely on a combination of trademarks, trade dress, copyrights, registered domain names, trade secrets, and patent rights to help protect our brand and our other intellectual property.
We have developed a patent program and strategy to identify, apply for, and secure patents for innovative aspects of our products, services, and technologies where appropriate. As of December 31, 2016, we had 229 issued patents and 588 filed patent applications in the United States and in foreign jurisdictions relating to a variety of aspects of our technology. Our issued patents will expire between 2022 and 2035. We intend to file additional patent applications as we continue to innovate through our research and development efforts and to pursue additional patent protection to the extent we deem it beneficial and cost-effective.
We actively pursue registration of our trademarks, logos, service marks, trade dress, and domain names in the United States and in other jurisdictions. We are the registered holder of a variety of U.S. and international domain names that include the term “Square” and variations thereof.
From time to time, we also incorporate certain intellectual property licensed from third parties, including under certain open source licenses. Even if any such third-party technology did not continue to be available to us on commercially reasonable terms, we believe that alternative technologies would be available as needed in every case.
Government Regulation
Foreign and domestic laws and regulations apply to many key aspects of our business. Failure to comply with these requirements may result in, among other things, revocation of required licenses or registrations, loss of approved status, private litigation, regulatory or governmental investigations, administrative enforcement actions, sanctions, civil and criminal liability, and constraints on our ability to continue to operate.
Payments Regulation
Various laws and regulations govern the payments industry in the United States and globally. For example, certain jurisdictions in the United States require a license to offer money transmission services, such as our peer-to-peer payments product, Square Cash, and we maintain a license in each of those jurisdictions and comply with new license requirements as they arise. We are also registered as a “Money Services Business” with the U.S. Department of Treasury’s Financial Crimes Enforcement Network. These licenses and registrations subject us, among other things, to record-keeping requirements, reporting requirements, bonding requirements, limitations on the investment of customer funds, and inspection by state and federal regulatory agencies.
Outside the United States, we provide localized versions of some of our services to customers, including through various foreign subsidiaries. For example, in Canada, Japan, and Australia, Square Point of Sale is the sole payments service we offer. The activities of those non-U.S. entities are, or may be, supervised by regulatory authorities in the jurisdictions in which they operate. For instance, we are registered with the Australian Transaction Reports and Analysis Centre (AUSTRAC), as required by anti-money laundering rules, to provide payments services in Australia.
Our payments services may be or become subject to regulation by other authorities, and the laws and regulations applicable to the payments industry in any given jurisdiction are always subject to interpretation and change.
Consumer Financial Protection
The Consumer Financial Protection Bureau and other federal, local, state, and foreign regulatory agencies regulate financial products, including credit, deposit, and payments services, and other similar services. These agencies have broad consumer protection mandates, and they promulgate, interpret, and enforce rules and regulations that affect our business.
12
Anti-Money Laundering
We are subject to anti-money laundering (AML) laws and regulations in the United States and other jurisdictions. We have implemented an AML program designed to prevent our payments network from being used to facilitate money laundering, terrorist financing, and other illicit activity. Our program is also designed to prevent our network from being used to facilitate business in countries, or with persons or entities, included on designated lists promulgated by the U.S. Department of the Treasury’s Office of Foreign Assets Controls and equivalent foreign authorities. Our AML compliance program includes policies, procedures, reporting protocols, and internal controls, including the designation of an AML compliance officer, and is designed to address these legal and regulatory requirements and to assist in managing risk associated with money laundering and terrorist financing.
Protection and Use of Information
We collect and use a wide variety of information to help ensure the integrity of our services and to provide features and functionality to our customers. This aspect of our business, including the collection, use, and protection of the information we acquire from our own services as well as from third-party sources, is subject to laws and regulations in the United States and elsewhere. Accordingly, we publish our privacy policies and terms of service, which describe our practices concerning the use, transmission, and disclosure of information. As our business continues to expand in the United States and worldwide, and as laws and regulations continue to be passed and their interpretations continue to evolve, additional laws and regulations may become relevant to us.
Communications Regulation
We send texts, emails, and other communications in a variety of contexts, such as when providing digital receipts. Communications laws, including those promulgated by the Federal Communications Commission, apply to certain aspects of this activity in the United States and elsewhere.
Additional Developments
Various regulatory agencies in the United States and elsewhere continue to examine a wide variety of issues that could impact our business, including products liability, import and export compliance, accessibility for the disabled, insurance, marketing, privacy, and labor and employment matters. As our business continues to develop and expand, additional rules and regulations may become relevant. For example, if we choose to offer Square Payroll in more jurisdictions, additional regulations, including tax rules, will apply.
Our Employees
As of December 31, 2016, we had 1,853 full-time employees. We also engage temporary employees and consultants as needed to support our operations. None of our employees are either represented by a labor union or subject to a collective bargaining agreement. We have not experienced any work stoppages, and we consider our relations with our employees to be good.
Corporate Information
Square was incorporated in Delaware in June 2009. Our headquarters are located at 1455 Market Street, Suite 600, San Francisco, California 94103. Our telephone number is (415) 375-3176. Our website is located at www.squareup.com, and our investor relations website is located at www.squareup.com/about/investors. The information contained in, or accessible through, our website is not part of, and is not incorporated into, this Annual Report on Form 10-K.
We use various trademarks and trade names in our business, including “Square” and Square®, which we have registered in the United States and in various other countries. This Annual Report on Form 10-K also contains trademarks and trade names of other businesses that are the property of their respective holders. We have omitted the ® and ™ designations, as applicable, for the trademarks we name in this Annual Report on Form 10-K.
Available Information
13
Copies of our Annual Reports on Form 10-K, Quarterly Reports on Form 10-Q, Current Reports on Form 8-K, and amendments to these reports filed or furnished pursuant to Section 13(a) or 15(d) of the Securities Exchange Act of 1934, as amended (Exchange Act), are available, free of charge, on our investor relations website as soon as reasonably practicable after we file such material electronically with or furnish it to the Securities and Exchange Commission (SEC). The SEC also maintains a website that contains our SEC filings. The address of the site is www.sec.gov. Further, a copy of this Annual Report on Form 10-K is located at the SEC’s Public Reference Room at 100 F Street, NE, Washington, D.C. 20549. Information on the operation of the Public Reference Room can be obtained by calling the SEC at 1-800-SEC-0330.
We webcast our earnings calls and certain events we participate in or host with members of the investment community on our investor relations website. Additionally, we provide notifications of news or announcements regarding our financial performance, including SEC filings, investor events, press and earnings releases, and blogs as part of our investor relations website. We have used, and intend to continue to use, our investor relations website, as well as the Twitter accounts @Square and @SquareIR, as means of disclosing material non-public information and for complying with our disclosure obligations under Regulation FD. Further corporate governance information, including our board committee charters, code of business conduct and ethics and corporate governance guidelines, is also available on our investor relations website under the heading “Governance Documents.” The contents of our websites are not intended to be incorporated by reference into this Annual Report on Form 10-K or in any other report or document we file with the SEC, and any references to our websites are intended to be inactive textual references only.
14
Item 1A. RISK FACTORS
Investing in our securities involves a high degree of risk. You should carefully consider the risks and uncertainties described below, together with all of the other information in this Annual Report on Form 10-K, including the section titled “Management’s Discussion and Analysis of Financial Condition and Results of Operations” and our consolidated financial statements and related notes, before making any investment decision with respect to our securities. The risks and uncertainties described below may not be the only ones we face. If any of the risks actually occur, our business could be materially and adversely affected. In that event, the market price of our Class A common stock could decline, and you could lose part or all of your investment.
Risks Related to Our Business and Our Industry
Our business depends on a strong and trusted brand, and any failure to maintain, protect, and enhance our brand would hurt our business.
We have developed a strong and trusted brand that has contributed significantly to the success of our business. Our brand is predicated on the idea that sellers and buyers will trust us and find value in building and growing their businesses with our products and services. Maintaining, protecting, and enhancing our brand is critical to expanding our base of sellers, buyers, and other third-party partners, as well as increasing engagement with our products and services. This will depend largely on our ability to maintain trust, be a technology leader, and continue to provide high-quality and secure products and services. Any negative publicity about our industry or our company, the quality and reliability of our products and services, our risk management processes, changes to our products and services, our ability to effectively manage and resolve seller and buyer complaints, our privacy and security practices, litigation, regulatory activity, and the experience of sellers and buyers with our products or services, could adversely affect our reputation and the confidence in and use of our products and services. Harm to our brand can arise from many sources, including failure by us or our partners to satisfy expectations of service and quality; inadequate protection of sensitive information; compliance failures and claims; litigation and other claims; employee misconduct; and misconduct by our partners, service providers, or other counterparties. If we do not successfully maintain a strong and trusted brand, our business could be materially and adversely affected.
Our growth may not be sustainable and depends on our ability to retain existing sellers, attract new sellers, and increase sales to both new and existing sellers.
Our total net revenue grew from $850.2 million in 2014 to $1,267.1 million in 2015 and to $1,708.7 million in 2016. We expect our rate of revenue growth will decline, and it may decline more quickly than we expect for a variety of reasons, including the risks described in this Annual Report on Form 10-K. Our sellers and other users of our services have no obligation to continue to use our services, and we cannot assure you that they will. We generally do not have long-term contracts with our sellers, and the difficulty and costs associated with switching to a competitor may not be significant for many of our services. Our sellers’ payment processing activity with us may decrease for a variety of reasons, including sellers’ level of satisfaction with our products and services, the effectiveness of our support services, our pricing, the pricing and quality of competing products or services, the effects of global economic conditions, or reductions in our sellers’ customer spending levels. In addition, the growth of our business depends in part on existing sellers expanding their use of our products and services. If we are unable to encourage sellers to broaden their use of our services, our growth may slow or stop, and our business may be materially and adversely affected. The growth of our business also depends on our ability to attract new sellers, to encourage larger sellers to use our products and services, and to introduce successful new products and services. We have invested in new products and services, including Square Cash, Caviar, Instant Deposit, and Invoices and will continue to invest in new products and services, but if those products and services fail to be successful, our growth may slow or decline.
Our business has generated net losses, and we intend to continue to invest substantially in our business. Thus, we may not be able to achieve or maintain profitability.
We generated net losses of $171.6 million, $212.0 million, and $154.1 million for the years ended December 31, 2016, 2015 and 2014, respectively.
As of December 31, 2016, we had an accumulated deficit of $779.2 million. We intend to continue to make significant investments in our business, including with respect to our employee base; sales and marketing, including expenses relating to increased direct marketing efforts, referral programs, and free hardware and subsidized services; development of new products, services, and features; expansion of office space and other infrastructure; expansion of international operations; and general
15
administration, including legal, finance, and other compliance expenses related to being a public company. If the costs associated with acquiring and supporting new or larger sellers materially rise in the future, including the fees we pay to third parties to advertise our products and services, our expenses may rise significantly. In addition, increases in our seller base could cause us to incur increased losses because costs associated with new sellers are generally incurred up front, while revenue is recognized thereafter as sellers utilize our services. If we are unable to generate adequate revenue growth and manage our expenses, we may continue to incur significant losses and may not achieve or maintain profitability.
We frequently make decisions that may reduce our short-term operating results if we believe those decisions will improve the experiences of our sellers, their customers, and other users of our products and services, which we believe will improve our operating results over the long term. These decisions may not be consistent with the expectations of investors and may not produce the long-term benefits that we expect, in which case our business may be materially and adversely affected.
We, our sellers, our partners, and others who use our services obtain and process a large amount of sensitive data. Any real or perceived improper use of, disclosure of, or access to such data could harm our reputation as a trusted brand, as well as have a material and adverse effect on our business.
We, our sellers, and our partners, including third-party data centers that we use, obtain and process large amounts of sensitive data, including data related to our sellers, their customers, and their transactions. This is also true of other users of our services, such as Square Cash and Square Payroll. We face risks, including to our reputation as a trusted brand, in the handling and protection of this data, and these risks will increase as our business continues to expand. Our operations involve the storage and transmission of sensitive information of individuals using our services, including their names, addresses, social security numbers (or their foreign equivalents), payment card numbers and expiration dates, bank account information, and data regarding the performance of our sellers’ businesses. We also obtain sensitive information regarding our sellers’ customers, including their contact information, payment card numbers and expiration dates, and purchase histories. Additionally, certain of our products and services are subject to the Health Insurance Portability and Accountability Act of 1996 (and the rules and regulations thereunder, as amended, including with respect to the HITECH Act) (HIPAA), and therefore we are required to take measures to safeguard protected health information of our sellers and their customers. We have administrative, technical, and physical security measures in place, and we have policies and procedures in place to contractually require third parties to whom we transfer data to implement and maintain appropriate security measures. However, if our security measures or those of the previously mentioned third parties are inadequate or are breached as a result of third-party action, employee error, malfeasance, malware, phishing, hacking attacks, system error, trickery, or otherwise, and, as a result, someone obtains unauthorized access to sensitive information, including personally identifiable information or protected health information, on our systems or our partners’ systems, our reputation and business could be damaged. If the sensitive information is lost or improperly disclosed or threatened to be disclosed, we could incur significant liability and be subject to regulatory scrutiny and penalties, including costs associated with remediation. Under payment card rules and our contracts with our card processors, if there is a breach of payment card information that we store or that is stored by our sellers or other third parties with which we do business, we could be liable to the payment card issuing banks for their cost of issuing new cards and other related expenses. Additionally, if our own confidential business information were improperly disclosed, our business could be materially and adversely affected. A core aspect of our business is the reliability and security of our payments platform. Any perceived or actual breach of security could have a significant impact on our reputation as a trusted brand, cause us to lose existing sellers, prevent us from obtaining new sellers, require us to expend significant funds to remedy problems caused by breaches and to implement measures to prevent further breaches, and expose us to legal risk and potential liability including those resulting from governmental or regulatory investigations, class action litigation and costs associated with remediation, such as fraud monitoring. Any security breach at a company providing services to us, our sellers, or other users of our services could have similar effects.
Our risk management efforts may not be effective, which could expose us to losses and liability and otherwise harm our business.
We offer managed payments and other products and services to a large number of customers, and we are responsible for vetting and monitoring these customers and determining whether the transactions we process for them are legitimate. When our products and services are used to process illegitimate transactions, and we settle those funds to sellers and are unable to recover them, we suffer losses and liability. These types of illegitimate transactions can also expose us to governmental and regulatory sanctions as well as potentially prevent us from satisfying our contractual obligations to our third party partners, which may cause us to be in breach of our obligations. The highly automated nature of, and liquidity offered by, our payments services make us a target for illegal or improper uses, including fraudulent or illegal sales of goods or services, money laundering, and terrorist financing. Identity thieves and those committing fraud using stolen or fabricated credit card or bank account numbers, or other deceptive or malicious practices, potentially can steal significant amounts of money from businesses like ours. In
16
configuring our payments services, we face an inherent trade-off between security and customer convenience. Our risk management policies, procedures, techniques, and processes may not be sufficient to identify all of the risks to which we are exposed, to enable us to mitigate the risks we have identified, or to identify additional risks to which we may become subject in the future. As a greater number of larger sellers use our services, our exposure to material risk losses from a single seller, or from a small number of sellers, will increase. Our current business and anticipated domestic and international growth will continue to place significant demands on our risk management efforts, and we will need to continue developing and improving our existing risk management infrastructure, techniques, and processes. In addition, when we introduce new services, expand existing services, focus on new business types, or begin to operate in markets where we have a limited history of fraud loss, we may be less able to forecast and reserve accurately for those losses. Furthermore, if our risk management policies and processes contain errors or are otherwise ineffective, we may suffer large financial losses, we may be subject to civil and criminal liability, and our business may be materially and adversely affected.
We are currently, and will continue to be, exposed to risks associated with chargebacks and refunds in connection with payment card fraud or relating to the goods or services provided by our sellers. In the event that a billing dispute between a cardholder and a seller is not resolved in favor of the seller, including in situations where the seller engaged in fraud, the transaction is typically “charged back” to the seller and the purchase price is credited or otherwise refunded to the cardholder. If we are unable to collect chargebacks or refunds from the seller’s account, or if the seller refuses to or is unable to reimburse us for chargebacks or refunds due to closure, bankruptcy, or other reasons, we may bear the loss for the amounts paid to the cardholder. Since October 2015, businesses that cannot process EMV chip cards are held financially responsible for certain fraudulent transactions conducted using chip-enabled cards. This has shifted an increased amount of the risk for certain fraudulent transactions from the issuing banks to these sellers, which has resulted in our having to seek an increased level of reimbursement for chargebacks from our sellers that do not deploy EMV-compliant card readers. Not all of the readers we offer to merchants are EMV-compliant. Our financial results would be adversely affected to the extent sellers do not fully reimburse us for the related chargebacks. We do not collect and maintain reserves from our sellers to cover these potential losses, and for customer relations purposes we sometimes decline to seek reimbursement for certain chargebacks. The risk of chargebacks is typically greater with those of our sellers that promise future delivery of goods and services, which we allow on our service. If we are unable to maintain our losses from chargebacks at acceptable levels, the payment card networks could fine us, increase our transaction-based fees, or terminate our ability to process payment cards. Any increase in our transaction-based fees could damage our business, and if we were unable to accept payment cards, our business would be materially and adversely affected.
We derive substantially all of our revenue from managed payments services. Our efforts to expand our product portfolio and market reach may not succeed and may reduce our revenue growth.
We derive substantially all of our revenue from transaction-based fees we collect in connection with managed payments services. While we intend to continue to broaden the scope of products and services we offer, we may not be successful in deriving any significant revenue from these products and services. Failure to broaden the scope of products and services that are attractive may inhibit the growth of repeat business and harm our business, as well as increase the vulnerability of our core payments business to competitors offering a full suite of products and services. Furthermore, we may have limited or no experience in our newer markets. For example, we cannot assure you that any of our products or services outside of managed payments services will be as widely accepted or that they will continue to grow in revenue. These offerings may present new and difficult technological, operational, and other challenges, and if we experience service disruptions, failures, or other issues, our business may be materially and adversely affected. Our newer activities may not recoup our investments in a timely manner or at all. If any of this were to occur, it could damage our reputation, limit our growth, and materially and adversely affect our business.
Our success depends on our ability to develop products and services to address the rapidly evolving market for payments and point-of-sale, financial, and marketing services, and, if we are not able to implement successful enhancements and new features for our products and services, our business could be materially and adversely affected.
We expect that new services and technologies applicable to the industries in which we operate will continue to emerge and evolve. Rapid and significant technological changes continue to confront the industries in which we operate, including developments in e-commerce, mobile commerce, and proximity payment devices (including contactless payments via NFC technology). Other potential changes are on the horizon as well, such as developments in crypto-currencies and in tokenization, which replaces sensitive data (e.g., payment card information) with symbols (tokens) to keep the data safe in the event that it ends up in the wrong hands. Similarly, there is rapid innovation in the provision of other products and services to businesses, including in financial services and marketing services.
17
These new services and technologies may be superior to, impair, or render obsolete the products and services we currently offer or the technologies we currently use to provide them. Incorporating new technologies into our products and services may require substantial expenditures and take considerable time, and we may not be successful in realizing a return on these development efforts in a timely manner or at all. There can be no assurance that any new products or services we develop and offer to our sellers will achieve significant commercial acceptance. Our ability to develop new products and services may be inhibited by industry-wide standards, payment card networks, laws and regulations, resistance to change from buyers or sellers, or third parties’ intellectual property rights. Our success will depend on our ability to develop new technologies and to adapt to technological changes and evolving industry standards. If we are unable to provide enhancements and new features for our products and services or to develop new products and services that achieve market acceptance or that keep pace with rapid technological developments and evolving industry standards, our business would be materially and adversely affected.
The success of enhancements, new features, and products and services depends on several factors, including the timely completion, introduction, and market acceptance of the enhancements or new features or services. We often rely not only on our own initiatives and innovations, but also on third parties, including some of our competitors, for the development of and access to new technologies. Failure to accurately predict or to respond effectively to developments in our industry may significantly impair our business.
In addition, because our products and services are designed to operate with a variety of systems, infrastructures, and devices, we need to continuously modify and enhance our products and services to keep pace with changes in mobile, software, communication, and database technologies. We may not be successful in either developing these modifications and enhancements or in bringing them to market in a timely and cost-effective manner. Any failure of our products and services to continue to operate effectively with third-party infrastructures and technologies could reduce the demand for our products and services, result in dissatisfaction of our sellers or their customers, and materially and adversely affect our business.
Substantial and increasingly intense competition in our industry may harm our business.
We compete in markets characterized by vigorous competition, changing technology, changing seller and buyer needs, evolving industry standards, and frequent introductions of new products and services. We expect competition to intensify in the future as existing and new competitors introduce new services or enhance existing services. We compete against many companies to attract customers, and some of these companies have greater financial resources and substantially larger bases of customers than we do, which may provide them with significant competitive advantages. These companies may devote greater resources to the development, promotion, and sale of products and services, and they may offer lower prices or more effectively introduce their own innovative products and services that adversely impact our growth. Mergers and acquisitions by these companies may lead to even larger competitors with more resources. We also expect new entrants to offer competitive products and services. Certain sellers have long-standing exclusive, or nearly exclusive, relationships with our competitors to accept payment cards and other services that we offer. These relationships may make it difficult or cost-prohibitive for us to conduct material amounts of business with them. Competing services tied to established brands may engender greater confidence in the safety and efficacy of their services. If we are unable to differentiate ourselves from and successfully compete with our competitors, our business will be materially and adversely affected.
We may also face pricing pressures from competitors. Some potential competitors are able to offer lower prices to sellers for similar services by cross-subsidizing their payments services through other services they offer. Such competition may result in the need for us to alter the pricing we offer to our sellers and could reduce our gross profit. In addition, as we grow, sellers may demand more customized and favorable pricing from us, and competitive pressures may require us to agree to such pricing, further reducing our gross profit. We currently negotiate pricing discounts and other incentive arrangements with certain large sellers to increase acceptance and usage of our products and services. If we continue this practice and if an increasing proportion of our sellers are large sellers, we may have to increase the discounts or incentives we provide, which could also reduce our gross profit.
We are dependent on payment card networks and acquiring processors, and any changes to their rules or practices could harm our business.
Our business depends on our ability to accept credit and debit cards, and this ability is provided by the payment card networks, including Visa, MasterCard, American Express, and Discover. Other than American Express, we do not directly access the payment card networks that enable our acceptance of payment cards. As a result, we must rely on banks and acquiring processors to process transactions on our behalf. Our acquiring processor agreements have terms ranging from two to six years. Our three largest such agreements expire between the third quarter of 2017 and the first quarter of 2020, and two of these
18
agreements, including the one expiring in 2017, provide for automatic renewal. These banks and acquiring processors may fail or refuse to process transactions adequately, may breach their agreements with us, or may refuse to renew these agreements on commercially reasonable terms. They might also take actions that degrade the functionality of our services, impose additional costs or requirements on us, or give preferential treatment to competitive services, including their own services. If we are unsuccessful in establishing or maintaining mutually beneficial relationships with these payment card networks, banks, and acquiring processors, our business may be harmed.
The payment card networks and our acquiring processors require us to comply with payment card network operating rules, including special operating rules that apply to us as a “payment service provider” providing payment processing services to merchants. The payment card networks set these network rules and have discretion to interpret them and change them. Any changes to or interpretations of the network rules that are inconsistent with the way we or our acquiring processors currently operate may require us to make changes to our business that could be costly or difficult to implement. If we fail to make such changes or otherwise resolve the issue with the payment card networks, the networks could fine us or prohibit us from processing payment cards. In addition, violations of the network rules or any failure to maintain good relationships with the payment card networks could impact our ability to receive incentives from them, could increase our costs, or could otherwise harm our business. If we were unable to accept payment cards or were limited in our ability to do so, our business would be materially and adversely affected.
We are required to pay interchange fees and assessments to the payment card networks, as well as fees to our acquiring processors, to process transactions. From time to time, payment card networks have increased, and may increase in the future, the interchange fees and assessments that they charge for each transaction processed using their networks. In addition, our acquiring processors and payment card networks may refuse to renew our agreements with them on commercially reasonable terms or at all. Interchange fees or assessments are also subject to change from time to time due to government regulation. Because we generally charge our sellers a flat rate for our managed payments services, rather than passing through interchange fees and assessments to our sellers directly, any increase or decrease in interchange fees or assessments or in the fees we pay to our acquiring processors could make our pricing look less competitive, lead us to change our pricing model, or adversely affect our margins.
We could be, and in the past have been, subject to penalties from payment card networks if we fail to detect that sellers are engaging in activities that are illegal, contrary to the payment card network operating rules, or considered “high risk.” We must either prevent high-risk sellers from using our products and services or register such sellers with the payment card networks and conduct additional monitoring with respect to such sellers. Although the amount of these penalties has not been material to date, any additional penalties in the future could become material and could result in termination of our ability to accept payment cards or could require changes in our process for registering new sellers. This could materially and adversely affect our business.
Our quarterly results of operations and operating metrics fluctuate significantly and are unpredictable and subject to seasonality, which could result in the trading price of our Class A common stock being unpredictable or declining.
Our quarterly results of operations may vary significantly and are not necessarily an indication of future performance. These fluctuations may be due to a variety of factors, some of which are outside of our control and may not fully reflect the underlying performance of our business. Our limited operating history combined with the rapidly evolving markets in which we operate also contributes to these fluctuations. Fluctuations in quarterly results may materially and adversely affect the predictability of our business and the price of our Class A common stock.
Factors that may cause fluctuations in our quarterly financial results include our ability to attract and retain new customers; the timing, effectiveness, and costs of expansion and upgrades of our systems and infrastructure, as well as the success of those expansions and upgrades; the outcomes of legal proceedings and claims; our ability to maintain or increase revenue, gross margins, and operating margins; our ability to continue introducing new services and to continue convincing customers to adopt additional offerings; increases in and timing of expenses that we may incur to grow and expand our operations and to remain competitive; period-to-period volatility related to fraud and risk losses; system failures resulting in the inaccessibility of our products and services; changes in the regulatory environment, including with respect to security, privacy, or enforcement of laws and regulations by regulators, including fines, orders, or consent decrees; changes in global business or macroeconomic conditions; unusual weather conditions; general retail buying patterns; and the other risks described in this Annual Report on Form 10-K.
We depend on key management, as well as our experienced and capable employees, and any failure to attract, motivate, and retain our employees could harm our ability to maintain and grow our business.
19
Our future success is significantly dependent upon the continued service of our executives and other key employees. If we lose the services of any member of management or any key personnel, we may not be able to locate a suitable or qualified replacement, and we may incur additional expenses to recruit and train a replacement, which could severely disrupt our business and growth. Jack Dorsey, our co-founder, President, and Chief Executive Officer, also serves as Chief Executive Officer of Twitter, Inc. This may at times adversely affect his ability to devote time, attention, and effort to Square.
To maintain and grow our business, we will need to identify, hire, develop, motivate, and retain highly skilled employees. Identifying, recruiting, training, integrating, and retaining qualified individuals requires significant time, expense, and attention. In addition, from time to time, there may be changes in our management team that may be disruptive to our business. If our management team, including any new hires that we make, fails to work together effectively and to execute our plans and strategies on a timely basis, our business could be harmed. Competition for highly skilled personnel is intense, particularly in the San Francisco Bay Area where our headquarters are located. We may need to invest significant amounts of cash and equity to attract and retain new employees, and we may never realize returns on these investments. If we are not able to add and retain employees effectively, our ability to achieve our strategic objectives will be adversely affected, and our business and growth prospects will be harmed.
In addition, a number of employees, including many members of management, may be able to receive significant proceeds from sales of our equity in the public markets. As a result, it may be difficult for us to continue to retain and motivate these employees, and, if we are unable to do so, our business may be materially and adversely affected.
If we do not continue to improve our operational, financial and other internal controls and systems to manage growth effectively, our business could be harmed.
Our current business and anticipated growth will continue to place significant demands on our management and other resources. In order to manage our growth effectively, we must continue to strengthen our existing infrastructure and operational procedures, enhance our internal controls and reporting systems, and ensure we timely and accurately address issues as they arise. In particular, our continued growth will increase the challenges involved in:
improving and implementing existing and developing new internal administrative infrastructure, particularly our operational, financial, communications and other internal systems and procedures; | |
installing enhanced management information and control system; and | |
preserving our core values, strategies, and goals and effectively communicating these to our employees worldwide. | |
If we are not successful in developing and implementing the right processes and tools to manage our enterprise, our ability to compete successfully and achieve our business objectives could be impaired.
These efforts may require substantial financial expenditures, commitments of resources, developments of our processes, and other investments and innovations. As we grow, we may not be able to develop and launch new features for our products and services as quickly as a smaller, more efficient organization. If we do not successfully manage our growth, our business will suffer.
A deterioration of general macroeconomic conditions could materially and adversely affect our business and financial results.
Our performance is subject to economic conditions and their impact on levels of spending by businesses and their customers. Most of the sellers that use our services are small businesses, many of which are in the early stages of their development, and these businesses may be disproportionately adversely affected by economic downturns and may fail at a higher rate than larger or more established businesses. If spending by their customers declines, these businesses would experience reduced sales and process fewer payments with us or, if they cease to operate, stop using our products and services altogether. Small businesses frequently have limited budgets and limited access to capital, and they may choose to allocate their spending to items other than our financial or marketing services, especially in times of economic uncertainty or in recessions. In addition, if more of our sellers cease to operate, this may have an adverse impact not only on the growth of our payments services but also on our transaction and advance loss rates, and the success of our other services. For example, if sellers processing payments with us receive chargebacks after they cease to operate, we may incur additional losses. Additionally, the growth in the number of sellers qualifying for participation in the Square Capital program may slow, the receivables related to the Square Capital MCAs may
20
decline, or business loans may be paid more slowly, or not at all. Furthermore, our investment portfolio, which includes U.S. government and corporate securities, is subject to general credit, liquidity, market, and interest rate risks, which may be exacerbated by certain events that affect the global financial markets. If global credit and equity markets decline for extended periods, or if there is a downgrade of the securities within our portfolio, the investment portfolio may be adversely affected and we could determine that our investments have experienced an other-than-temporary decline in fair value, requiring impairment charges that could adversely affect our financial results. Thus, if general macroeconomic conditions deteriorate, our business and financial results could be materially and adversely affected.
If we are unable to maintain, promote, and grow our brand through effective marketing and communications strategies, our brand and business may be harmed.
We believe that maintaining and promoting our brand in a cost-effective manner is critical to achieving widespread acceptance of our products and services and to expanding our base of customers. Maintaining and promoting our brand will depend largely on our ability to continue to provide useful, reliable, and innovative products and services, which we may not do successfully. We may introduce, or make changes to, features, products, services, or terms of service that customers do not like, which may materially and adversely affect our brand. Our brand promotion activities may not generate customer awareness or increase revenue, and even if they do, any increase in revenue may not offset the expenses we incur in building our brand. If we fail to successfully promote and maintain our brand or if we incur excessive expenses in this effort, our business could be materially and adversely affected.
The introduction and promotion of new services, as well as the promotion of existing services, may be partly dependent on our visibility on third-party advertising platforms, such as Google, Twitter, or Facebook. Changes in the way these platforms operate or changes in their advertising prices or other terms could make the maintenance and promotion of our products and services and our brand more expensive or more difficult. If we are unable to market and promote our brand on third-party platforms effectively, our ability to acquire new sellers would be materially harmed.
We have received a significant amount of media coverage since our formation. We have also been from time to time in the past, and may in the future be, the target of incomplete, inaccurate, and misleading or false statements about our company, our business, and our products and services that could damage our brand and materially deter people from adopting our services. Negative publicity about our company or our management, including about our product quality and reliability, changes to our products and services, privacy and security practices, litigation, regulatory enforcement, and other actions, as well as the actions of our customers and other users of our services, even if inaccurate, could cause a loss of confidence in us. Our ability to respond to negative statements about us may be limited by legal prohibitions on permissible public communications by us during future periods.
Expanding our business globally could subject us to new challenges and risks.
We currently offer our services and products in multiple countries and plan to continue expanding our business further globally. Additional expansion, whether in our existing or new global markets, will require additional resources and controls, and offering our services in new geographic regions often requires substantial expenditures and takes considerable time, and we may not be successful enough in these new geographies to recoup our investments in a timely manner or at all. Such expansion could also subject our business to substantial risks, including:
difficulty in attracting a sufficient number of sellers; | |
failure to anticipate competitive conditions; | |
conformity with applicable business customs, including translation into foreign languages and associated expenses; | |
increased costs and difficulty in protecting intellectual property and sensitive data; | |
changes to the way we do business as compared with our current operations or a lack of acceptance of our products and services; | |
the ability to support and integrate with local third-party service providers; | |
21
competition with service providers or other entrenched market-players that have greater experience in the local markets than we do; | |
difficulties in staffing and managing foreign operations in an environment of diverse culture, laws and customs, challenges caused by distance, language, and cultural differences, and the increased travel, infrastructure and legal and compliance costs associated with global operations; | |
difficulties in recruiting and retaining qualified employees; | |
difficulty in gaining acceptance from industry self-regulatory bodies; | |
compliance with multiple, potentially conflicting and changing governmental laws and regulations, including with respect to data privacy and security; | |
compliance with U.S. and foreign anti-bribery laws; | |
potential tariffs, sanctions, or other trade barriers including fines; | |
exchange rate risk; | |
compliance with potentially conflicting and changing laws of taxing jurisdictions where we conduct business and applicable U.S. tax laws, the complexity and adverse consequences of such tax laws and potentially adverse tax consequences due to changes in such tax laws; and | |
regional economic and political instability. | |
As a result of these risks, our efforts to expand our global operations may not be successful, which could limit our ability to grow our business.
We rely on third parties and their systems for a variety of services, including the processing of transaction data and settlement of funds to us and our sellers, and these third parties’ failure to perform these services adequately could materially and adversely affect our business.
To provide our managed payments solution and other products and services, we rely on third parties that we do not control, such as the payment card networks, our acquiring processors, the payment card issuers, various financial institution partners (including those for Square Capital and Square Cash), systems like the Federal Reserve Automated Clearing House, and other partners. We rely on these third parties for a variety of services, including the transmission of transaction data, processing of chargebacks and refunds, settlement of funds to our sellers, and the provision information and other elements of our services. For example, we currently rely on three acquiring processors in the United States and two for each of Canada, Japan, and Australia. While we believe there are other acquiring processors that could meet our needs, adding or transitioning to new providers may significantly disrupt our business and increase our costs. In the event these third parties fail to provide these services adequately, including as a result of errors in their systems or events beyond their control, or refuse to provide these services on terms acceptable to us or at all, and we are not able to find suitable alternatives, our business may be materially and adversely affected.
Our services must integrate with a variety of operating systems, and the hardware that enables merchants to accept payment cards must interoperate with third-party mobile devices utilizing those operating systems. If we are unable to ensure that our services or hardware interoperate with such operating systems and devices, our business may be materially and adversely affected.
We are dependent on the ability of our products and services to integrate with a variety of operating systems, as well as web browsers that we do not control. Any changes in these systems that degrade the functionality of our products and services, impose additional costs or requirements on us, or give preferential treatment to competitive services, including their own services, could materially and adversely affect usage of our products and services. In addition, we rely on app marketplaces, such as the Apple App Store and Google Play, to drive downloads of our mobile app. Apple, Google, or other operators of app marketplaces regularly make changes to their marketplaces, and those changes may make access to our products and services more difficult. In the event that it is difficult for our sellers to access and use our products and services, our business may be materially and
22
adversely affected. Furthermore, Apple, Google, or other operators of app marketplaces regularly provide software updates, and such software updates may not operate effectively with our products and services, which may reduce the demand for our products and services, result in dissatisfaction by our sellers or their customers, and may materially and adversely affect our business.
In addition, our hardware interoperates with mobile devices developed by third parties. For example, the current version of our magstripe reader plugs into the audio jack of most smartphones and tablets. In September 2016, Apple introduced the iPhone 7, which does not have an audio jack, and instead Apple provided an adapter that can be inserted into a connectivity port. This change and other potential changes in the design of future mobile devices may limit the interoperability of our hardware with such devices and require modifications to our hardware. If we are unable to ensure that our hardware continues to interoperate effectively with such devices, if doing so is costly, or if existing merchants decide not to utilize additional parts necessary for interoperability, our business may be materially and adversely affected.
Many of our key components are procured from a single or limited number of suppliers. Thus, we are at risk of shortage, price increases, changes, delay, or discontinuation of key components, which could disrupt and materially and adversely affect our business.
Many of the key components used to manufacture our products, such as the custom parts of our magstripe reader, including its magnetic stripe-reading element, its plastic cover, and its application-specific integrated circuits, come from limited or single sources of supply, as do the plastic cover, connector, and security cage of our contactless and chip reader. In addition, in some cases, we rely only on one manufacturer to fabricate, test, and assemble our products. For example, a single manufacturer assembles our magstripe reader and our contactless and chip reader, as well as manufactures those products’ plastic parts with custom tools that we own but that they maintain on their premises. The term of the agreement with that manufacturer automatically renews for consecutive one-year periods unless either party provides notice of non-renewal. In general, our contract manufacturers fabricate or procure components on our behalf, subject to certain approved procedures or supplier lists, and we do not have firm commitments from all of these manufacturers to provide all components, or to provide them in quantities and on timelines that we may require. For example, pursuant to a development and supply agreement, a component supplier provides design, development, customization, and related services for components of the magnetic stripe-reading element in some of our products. The term of the agreement renews for successive two-year terms unless either party provides notice of non-renewal. Similarly, a component provider develops certain application-specific integrated circuits for our products pursuant to our designs and specifications. The term of our agreement with this provider renews for consecutive one-year periods unless either party provides notice of non-renewal.
Due to our reliance on the components or products produced by suppliers such as these, we are subject to the risk of shortages and long lead times in the supply of certain components or products. We are still in the process of identifying alternative manufacturers for the assembly of our products and for most of the single-sourced components used in our products. In the case of off-the-shelf components, we are subject to the risk that our suppliers may discontinue or modify them, or that the components may cease to be available on commercially reasonable terms. We have in the past experienced, and may in the future experience, component shortages or delays or other problems in product assembly, and the availability of these components or products may be difficult to predict. For example, our manufacturers may experience disruptions in their manufacturing operations due to equipment breakdowns, labor strikes or shortages, natural disasters, component or material shortages, cost increases, or other similar problems.
Additionally, various sources of supply-chain risk, including strikes or shutdowns at delivery ports or loss of or damage to our products while they are in transit or storage, intellectual property theft, losses due to tampering, or other similar problems could limit the supply of our products. In the event of a shortage or supply interruption from suppliers of these components, we may not be able to develop alternate sources quickly, cost-effectively, or at all. Any interruption or delay in manufacturing, component supply, any increases in component costs, or the inability to obtain these parts or components from alternate sources at acceptable prices and within a reasonable amount of time, would harm our ability to provide our products to sellers on a timely basis. This could harm our relationships with our sellers, prevent us from acquiring new sellers, and materially and adversely affect our business.
23
Our business could be harmed if we are unable to accurately forecast demand for our products and to adequately manage our product inventory.
We invest broadly in our business, and such investments are driven by our expectations of the future success of a product. Our products, such as the Square Reader, often require investments with long lead times. An inability to correctly forecast the success of a particular product could harm our business. We must forecast inventory needs and expenses and place orders sufficiently in advance with our third-party suppliers and contract manufacturers based on our estimates of future demand for particular products. Our ability to accurately forecast demand for our products could be affected by many factors, including an increase or decrease in demand for our products or for our competitors’ products, unanticipated changes in general market conditions, and the change in economic conditions.
If we underestimate demand for a particular product, our contract manufacturers and suppliers may not be able to deliver sufficient quantities of that product to meet our requirements, and we may experience a shortage of that product available for sale or distribution. The shortage of a popular product could materially and adversely affect our brand, our seller relationships, and the acquisition of additional sellers. If we overestimate demand for a particular product, we may experience excess inventory levels for that product and the excess inventory may become obsolete or out-of-date. Inventory levels in excess of demand may result in inventory write-downs or write-offs and the sale of excess inventory at further discounted prices, which could negatively impact our gross profit and our business.
Our products and services may not function as intended due to errors in our software, hardware, and systems, product defects, or due to security breaches or human error in administering these systems, which could materially and adversely affect our business.
Our software, hardware, and systems may contain undetected errors that could have a material adverse effect on our business, particularly to the extent such errors are not detected and remedied quickly. We have from time to time found defects in our customer-facing software and hardware, internal systems, and technical integrations with third-party systems, and new errors may be introduced in the future. We rely on a limited number of component and product suppliers located outside of the U.S. to manufacture our products. As a result, our direct control over production and distribution is limited and it is uncertain what effect such diminished control will have on the quality of our products. If there are defects in the manufacture of our hardware products, we may face negative publicity, government investigations, and litigation, and we may not be fully compensated by our suppliers for any financial or other liability that we suffer as a result.
In addition, we provide frequent incremental releases of product and service updates and functional enhancements, which increases the possibility of errors. The electronic payments products and services we provide are designed to process complex transactions and deliver reports and other information related to those transactions, all at high volumes and processing speeds. Since customers use our services for important aspects of their businesses, any errors, defects, third-party security breaches such as cyber-attacks or identify theft, malfeasance, disruptions in services, or other performance problems with our services could hurt our reputation and damage our customers’ businesses. Software and system errors, or human error, could delay or inhibit settlement of payments, result in oversettlement, cause reporting errors, or prevent us from collecting transaction-based fees, all of which have occurred in the past. Similarly, third-party security breaches such as cyber-attacks or identity theft could disrupt the proper functioning of our software products or services, cause errors, allow unauthorized access to sensitive, proprietary or confidential information of ours or our sellers, and other destructive outcomes. Moreover, third-party security breaches or errors in our hardware design or manufacture could cause product safety issues typical of consumer electronics devices. Such issues could lead to product recalls and inventory shortages, result in costly and time-consuming efforts to redesign and redistribute our products, give rise to regulatory inquiries and investigations, and result in lawsuits and other liabilities and losses, which could have a material and adverse effect on our business.
Additionally, electronic payment products and services, including ours, have been and could continue to be in the future, specifically targeted and penetrated or disrupted by hackers, and our data encryption may be unable to prevent unauthorized use. Because the techniques used to obtain unauthorized access to data, products and services, and disable, alter, degrade, or sabotage them, change frequently and may be difficult to detect or remediate for long periods of time, we and our customers may be unable to anticipate these techniques or implement adequate preventative measures to stop them. If we or our sellers are unable to anticipate or prevent these attacks, our sellers' businesses may be harmed, our reputation could be damaged, and we could incur significant liability.
Systems failures, interruptions, delays in service, catastrophic events, and resulting interruptions in the availability of our products or services, or those of our sellers, could harm our business and our brand, and subject us to substantial liability.
24
Our systems and those of our third-party data center facilities may experience service interruptions, denial-of-service and other cyber-attacks, human error, earthquakes, hurricanes, floods, fires, natural disasters, power losses, disruptions in telecommunications services, fraud, military or political conflicts, terrorist attacks and other geopolitical unrest, computer viruses, or other events. Our systems are also subject to break-ins, sabotage, and acts of vandalism. Some of our systems are not fully redundant, and our disaster-recovery planning is not sufficient for all eventualities. In addition, as a provider of payments solutions, we are subject to increased scrutiny by regulators that may require specific business continuity and disaster recovery plans and more rigorous testing of such plans. This increased scrutiny may be costly and time-consuming and may divert our resources from other business priorities.
We have experienced and will likely continue to experience denial-of-service attacks, system failures, and other events or conditions that interrupt the availability or reduce the speed or functionality of our products and services. These events have resulted and likely will result in loss of revenue. In addition, they could result in significant expense to repair or replace damaged equipment and remedy resultant data loss or corruption. A prolonged interruption in the availability or reduction in the speed or other functionality of our products or services could materially harm our reputation and business. Frequent or persistent interruptions in our products and services could cause sellers to believe that our products and services are unreliable, leading them to switch to our competitors or to avoid our products and services, and could permanently harm our reputation and business. Moreover, to the extent that any system failure or similar event results in damages to customers or their businesses, these customers could seek compensation from us for their losses, and those claims, even if unsuccessful, would likely be time-consuming and costly for us to address.
A significant natural disaster could have a material and adverse impact on our business. Our headquarters and certain of our data center facilities are located in the San Francisco Bay Area, a region known for seismic activity. Despite any precautions we may take, the occurrence of a natural disaster or other unanticipated problems at our headquarters or data centers could result in lengthy interruptions in our services or could result in related liabilities. We have implemented a disaster recovery program, which enables us to move production to a back-up data center in the event of a catastrophe.
Although this program is functional, it may prove to be inadequate, increasing the risk of interruptions in our services, which could have a material and adverse impact on our business. We do not maintain insurance sufficient to compensate us for the potentially significant losses that could result from disruptions to our services.
Significant natural or other disasters could also have a material and adverse impact on our sellers, which, in the aggregate, could in turn adversely affect our results of operations.
Square Capital is subject to additional risks relating to the availability of capital, seller receivables payments, availability and structure of its bank partnership and general macroeconomic conditions.
Square Capital, which includes our wholly owned subsidiary Square Capital, LLC, is subject to risks in addition to those described elsewhere in this Annual Report on Form 10-K. Maintaining and growing Square Capital is dependent on institutional third-party investors purchasing the loans originated by our bank partner. If such third parties fail to continue to purchase such loans or reduce the amount of future loans they purchase, then our bank partner may need to reduce originations, or we would need to fund the purchase of additional loans from our own resources. We then may have to reduce the scale of Square Capital, which could have a direct impact on our continued growth. If third parties reduce the price they are willing to pay for these loans or reduce the servicing fees they pay us in exchange for servicing the loans on their behalf, then the financial performance of Square Capital would be harmed.
Adverse changes in macroeconomic conditions could cause some Square sellers who utilize Square Capital to cease operating or to experience a decline in their payment processing volume, thereby rendering them unable to make payment on the receivables, unable to make repayment of loans and/or extend the repayment period beyond the contractual repayment terms on the loan. Sellers are contractually obligated to use Square as their only card payment processing service until the agreed-upon fixed amount of receivables or repayment of loans is made. To the extent a seller breaches this obligation, the seller would be liable for the balance of the receivables in respect of an MCA or an accelerated loan repayment, where Square Capital's recourse is to the business and not to any individual or other asset.
In addition, adverse changes in macroeconomic conditions could lead to a decrease in the number of sellers eligible for Square Capital facilitated loans and strain our ability to correctly identify such sellers on behalf of our bank partner or manage
25
the risk of non-payment or fraud as servicer of the loans. Similarly, if we fail to correctly predict or price the loans to sellers utilizing Square Capital, our business may be materially and adversely affected.
We have partnered with a Utah-chartered, member FDIC industrial bank to originate the loans. There has been, and may continue to be, regulatory interest in and/or litigation challenging partnered lending arrangements where a bank makes loans and then sells and assigns such loans to a non-bank entity that is engaged in assisting with the origination and servicing of the loan. If our bank partner ceases to partner with us, ceases to abide by the terms of our agreement with them, or cannot partner with us on commercially reasonable terms, and we are not able to find suitable alternatives and/or obtain licenses to make loans ourselves, Square Capital may need to enter into a new partnership with another qualified financial institution, or revert to the MCA model, both of which may be time-consuming and costly, and as a result Square Capital may be materially and adversely affected.
We intend to continue to explore other models and structures for Square Capital, including other forms of credit. Some of those models or structures may require, or be deemed to require, additional procedures, partnerships, licenses, or capabilities that we have not yet obtained or developed. Should we fail to expand and evolve Square Capital in this manner, or should these new models or structures, or new regulations or interpretations of existing regulations, impose requirements on us that are impractical or that we cannot satisfy, the future growth and success of Square Capital may be materially and adversely affected.
Our business is subject to extensive regulation and oversight in a variety of areas, all of which are subject to change and uncertain interpretation.
We are subject to a wide variety of local, state, federal, and international laws, regulations, and industry standards in the United States and in other countries in which we operate. These laws and regulations govern numerous areas that are important to our business, including consumer protection, privacy, fair lending, financial services, labor and employment, immigration, import and export practices, product labeling, competition, data protection, and marketing and communications practices, to name a few. Such laws and regulations are subject to changes and evolving interpretations and application, including by means of legislative changes and/or executive orders, and it can be difficult to predict how they may be applied to our business and the way we conduct our operations, particularly as we introduce new products and services and expand into new jurisdictions. Any perceived or actual breach of laws and regulations could result in investigations, regulatory inquiries, litigation, fines, or otherwise negatively impact our business. It is possible that these laws and regulations could be interpreted or applied in a manner that would prohibit, alter, or impair our existing or planned products and services; that could cause us to be subject to audits, inquiries, or investigations; that could result in fines, injunctive relief, or other penalties; or that could require costly, time-consuming, or otherwise burdensome compliance measures from us.
In particular, as we seek to build a trusted and secure platform for commerce, and as we expand our network of sellers and buyers and facilitate their transactions and interactions with one another, we will increasingly be subject to laws and regulations relating to the collection, use, retention, security, and transfer of information, including the personally identifiable information of our employees and sellers and their customers. As with the other laws and regulations noted above, these laws and regulations may change or be interpreted and applied differently over time and from jurisdiction to jurisdiction, and it is possible they will be interpreted and applied in ways that will materially and adversely affect our business. Moreover, we may not be able to respond quickly to regulatory, legislative and other developments, and these changes may in turn increase our cost of doing business. In addition, if our practices are not consistent or viewed as not consistent with changes in laws and regulations or new interpretations of existing laws and regulations, we may become subject to lawsuits, penalties, and other liabilities that did not previously apply.
We have incurred, and may continue to incur, significant expenses to comply with mandatory privacy and security standards and protocols imposed by law, regulation, industry standards or contractual obligations. We post on our website our privacy policies and practices concerning the collection, use, and disclosure of information. Any failure, real or perceived, by us to comply with our posted privacy policies or with any regulatory requirements or orders or other local, state, federal, or international privacy or consumer protection-related laws and regulations could cause sellers or their customers to reduce their use of our products and services and could materially and adversely affect our business.
Our business is subject to complex and evolving regulations and oversight related to our provision of payments services and other financial services.
The laws, rules, regulations, and licensing schemes that govern our business include or may in the future include those relating to banking, lending, deposit-taking, cross-border and domestic money transmission, foreign exchange, payments services
26
(such as payment processing and settlement services), consumer financial protection, anti-money laundering, escheatment, and compliance with the Payment Card Industry Data Security Standard, a set of requirements designed to ensure that all companies that process, store, or transmit payment card information maintain a secure environment to protect cardholder data. These laws, rules, and regulations are enforced by multiple authorities and governing bodies in the United States, including the Department of the Treasury, the Consumer Financial Protection Bureau, the Federal Deposit Insurance Corporation, and numerous state and local agencies. Outside of the United States, we are subject to additional laws, rules, and regulations related to the provision of payments and financial services, including those enforced by the Ministry of Economy, Trade, and Industry in Japan, and those enforced by the Australian Transaction Reports and Analysis Centre. As we expand into new jurisdictions, the number of foreign regulations and regulators governing our business will expand as well. Square Capital has shifted from offering MCAs to facilitating loans through a partnership with a Utah-chartered, member FDIC industrial bank. In this transition, additional state and federal lending requirements have become applicable. In addition, as our business continues to develop and expand, we may become subject to additional rules and regulations. Similarly, if we choose to offer Square Payroll in more jurisdictions, additional regulations, including tax rules, will apply.
Although we have a compliance program focused on applicable laws, rules, and regulations and are continually investing more in this program, we may still be subject to fines or other penalties in one or more jurisdictions levied by federal, state or local regulators, including state Attorneys General and private plaintiffs who may be acting as private attorneys general pursuant to various applicable federal, state and local laws, as well as those levied by foreign regulators. In addition to fines, penalties for failing to comply with applicable rules and regulations could include significant criminal and civil lawsuits, forfeiture of significant assets, increased licensure requirements, or other enforcement actions. We could also be required to make changes to our business practices or compliance programs as a result of regulatory scrutiny. In addition, any perceived or actual breach of compliance by us with respect to applicable laws, rules, and regulations could have a significant impact on our reputation as a trusted brand and could cause us to lose existing customers, prevent us from obtaining new customers, require us to expend significant funds to remedy problems caused by breaches and to avert further breaches, and expose us to legal risk and potential liability.
We have obtained licenses to operate as a money transmitter (or its equivalent) in the United States and in the states where this is required. As a licensed money transmitter, we are subject to obligations and restrictions with respect to the investment of customer funds, reporting requirements, bonding requirements, and inspection by state regulatory agencies concerning those aspects of our business considered money transmission. Evaluation of our compliance efforts, as well as the questions of whether and to what extent our products and services are considered money transmission, are matters of regulatory interpretation and could change over time. In the past, we have been subject to fines and other penalties by regulatory authorities due to their interpretations and applications to our business of their respective state money transmission laws. In the future, as a result of the regulations applicable to our business, we could be subject to investigations and resulting liability, including governmental fines, restrictions on our business, or other sanctions, and we could be forced to cease conducting certain aspects of our business with residents of certain jurisdictions, be forced to otherwise change our business practices in certain jurisdictions, or be required to obtain additional licenses or regulatory approvals. There can be no assurance that we will be able to obtain any such licenses, and, even if we were able to do so, there could be substantial costs and potential product changes involved in maintaining such licenses, which could have a material and adverse effect on our business.
We are subject to risks related to litigation, including intellectual property claims and regulatory disputes.
We may be, and have been, subject to claims, lawsuits (including class actions and individual lawsuits), government investigations, and other proceedings involving intellectual property, consumer protection, privacy, labor and employment, immigration, import and export practices, product labeling, competition, accessibility, securities, tax, marketing and communications practices, commercial disputes, and other matters. For example, we are involved in putative class action lawsuits concerning independent contractors in connection with our Caviar business, alleging that the couriers have been improperly denied reimbursement for business expenses due to their classification as independent contractors.
The number and significance of our legal disputes and inquiries have increased as we have grown larger, as our business has expanded in scope and geographic reach, and as our products and services have increased in complexity.
Becoming a public company has raised our public profile, which could result in increased litigation. In addition, some of the laws and regulations affecting the internet, mobile commerce, payment processing, business financing, and employment did not anticipate businesses like ours, and many of the laws and regulations affecting us have been enacted relatively recently. As a result, there is substantial uncertainty regarding the scope and application of many of the laws and regulations to which
27
we are subject, which increases the risk that we will be subject to claims alleging violations of those laws and regulations. We may also be accused of having, or be found to have, infringed or violated third-party intellectual property rights.
Regardless of the outcome, legal proceedings can have a material and adverse impact on us due to their costs, diversion of our resources, and other factors. Plaintiffs may seek, and we may become subject to, preliminary or provisional rulings in the course of litigation, including preliminary injunctions requiring us to cease some or all of our operations. We may decide to settle legal disputes on terms that are unfavorable to us. Furthermore, if any litigation to which we are a party is resolved adversely, we may be subject to an unfavorable judgment that we may not choose to appeal or that may not be reversed upon appeal. We may have to seek a license to continue practices found to be in violation of a third party’s rights. If we are required, or choose to enter into, royalty or licensing arrangements, such arrangements may not be available on reasonable terms or at all and may significantly increase our operating costs and expenses. As a result, we may also be required to develop or procure alternative non-infringing technology or discontinue use of technology, and doing so could require significant effort and expense or may not be feasible. In addition, the terms of any settlement or judgment in connection with any legal claims, lawsuits, or proceedings may require us to cease some or all of our operations or pay substantial amounts to the other party and could materially and adversely affect our business.
Our intellectual property rights are valuable, and any inability to protect them could reduce the value of our products, services, and brand.
Our trade secrets, trademarks, copyrights, patents, and other intellectual property rights are critical to our success. We rely on, and expect to continue to rely on, a combination of confidentiality, invention assignment, and license agreements with our employees, consultants, and third parties with whom we have relationships, as well as trademark, trade dress, domain name, copyright, trade secret, and patent rights, to protect our brand and other intellectual property rights. However, various events outside of our control may pose a threat to our intellectual property rights, as well as to our products and services. Effective protection of trademarks, copyrights, domain names, patent rights, and other intellectual property rights is expensive and difficult to maintain, both in terms of application and maintenance costs, as well as the costs of defending and enforcing those rights. The efforts we have taken to protect our intellectual property rights may not be sufficient or effective. Our intellectual property rights may be infringed, misappropriated, or challenged, which could result in them being narrowed in scope or declared invalid or unenforceable. Similarly, our reliance on unpatented proprietary information and technology, such as trade secrets and confidential information, depends in part on agreements we have in place with employees and third parties that place restrictions on the use and disclosure of this intellectual property. These agreements may be insufficient or may be breached, or we may not enter into sufficient agreements with such individuals in the first instance, in either case potentially resulting in the unauthorized use or disclosure of our trade secrets and other intellectual property, including to our competitors, which could cause us to lose any competitive advantage resulting from this intellectual property. Individuals not subject to invention assignment agreements may make adverse ownership claims to our current and future intellectual property. There can be no assurance that our intellectual property rights will be sufficient to protect against others offering products or services that are substantially similar to ours and that compete with our business.
As of December 31, 2016, we had 229 patents issued in the United States and abroad and 588 patent applications on file in the United States and abroad, though there can be no assurance that any or all of these applications will ultimately be issued as patents. We also pursue registration of copyrights, trademarks, and domain names in the United States and in certain jurisdictions outside of the United States, but doing so may not always be successful or cost-effective. In general, we may be unable or, in some instances, choose not to obtain legal protection for our intellectual property, and our existing and future intellectual property rights may not provide us with competitive advantages or distinguish our products and services from those of our competitors. The laws of some foreign countries do not protect our intellectual property rights to the same extent as the laws of the United States, and effective intellectual property protection and mechanisms may not be available in those jurisdictions. We may need to expend additional resources to defend our intellectual property in these countries, and the inability to do so could impair our business or adversely affect our international expansion. Our intellectual property rights may be contested, circumvented, or found unenforceable or invalid, and we may not be able to prevent third parties from infringing, diluting, or otherwise violating them.
Significant impairments of our intellectual property rights, and limitations on our ability to assert our intellectual property rights against others, could have a material and adverse effect on our business.
We may not be able to secure financing on favorable terms, or at all, to meet our future capital needs.
28
We have funded our operations since inception primarily through equity financings, bank credit facilities, and capital lease arrangements. We have just begun to generate sufficient cash to fund our ongoing operations, and there is no guarantee that we will be able to continue to do so in the future. In the future, we may require additional capital to respond to business opportunities, refinancing needs, challenges, regulatory surety bond requirements, acquisitions, or unforeseen circumstances and may decide to engage in equity or debt financings or enter into credit facilities for other reasons, and we may not be able to secure any such additional debt or equity financing or refinancing on favorable terms, in a timely manner, or at all. Any debt financing obtained by us in the future could also involve restrictive covenants relating to our capital-raising activities and other financial and operational matters, which may make it more difficult for us to obtain additional capital and to pursue business opportunities, including potential acquisitions. Our credit facility contains operating covenants, including customary limitations on the incurrence of certain indebtedness and liens, restrictions on certain inter-company transactions, and limitations on the amount of dividends and stock repurchases. Our ability to comply with these covenants may be affected by events beyond our control, and breaches of these covenants could result in a default under the credit facility and any future financial agreements into which we may enter. If not waived, defaults could cause our outstanding indebtedness under our credit facility and any future financing agreements that we may enter into to become immediately due and payable.
If we raise additional funds through further issuances of equity, convertible debt securities, or other securities convertible into equity, our existing stockholders could suffer significant dilution in their percentage ownership of our company, and any new equity securities we issue could have rights, preferences, and privileges senior to those of holders of our Class A common stock. If we are unable to obtain adequate financing or financing on terms satisfactory to us when we require it, our ability to continue to grow or support our business and to respond to business challenges could be significantly limited.
Any acquisitions, strategic investments, entries into new businesses, divestitures, and other transactions could fail to achieve strategic objectives, disrupt our ongoing operations, and harm our business.
In pursuing our business strategy, we routinely conduct discussions and evaluate opportunities for possible acquisitions, strategic investments, entries into new businesses, divestitures, and other transactions. We continue to seek to acquire or invest in businesses, apps, or technologies that we believe could complement or expand our products and services, enhance our technical capabilities, or otherwise offer growth opportunities. The identification, evaluation, and negotiation of potential acquisitions or divestitures may divert the attention of management and entail various expenses, whether or not such transactions are ultimately completed. We also have limited experience in acquiring other businesses. In addition to opportunity costs, these transactions involve large challenges and risks, whether or not such transactions are completed, including risks that:
the transaction may not advance our business strategy; | |
we may be unable to identify opportunities on terms acceptable to us; | |
we may not realize a satisfactory return or increase our revenue; | |
we may experience disruptions on our ongoing operations and divert management’s attention; | |
we may be unable to retain key personnel; | |
we may experience difficulty in integrating technologies, IT systems, accounting systems, culture, or personnel; | |
acquired businesses may not have adequate controls, processes and procedures to ensure compliance with laws and regulations, and our due diligence process may not identify compliance issues or other liabilities; | |
we may assume additional financial or legal exposure, including exposure that is known to us; | |
we may have difficulty entering new market segments; | |
we may be unable to retain the customers and partners of acquired businesses; | |
there may be unknown, underestimated, or undisclosed commitments or liabilities, including actual or threatened litigation; | |
29
there may be regulatory constraints, particularly competition regulations that may affect the extent to which we can maximize the value of our acquisitions or investments; and | |
acquisitions could result in dilutive issuances of equity securities or the incurrence of debt. | |
We may also choose to divest certain businesses or product lines that no longer fit with our strategic objectives. If we decide to sell assets or a business, we may have difficulty obtaining financing or selling on acceptable terms in a timely manner. Additionally, we may experience difficulty separating out portions of or entire businesses, incur potential loss of revenue or experience negative impact on margins. Such potential transactions may also delay achievement of our strategic objectives, cause us to incur additional expenses, potentially disrupt seller relationships, and expose us to unanticipated or ongoing obligations and liabilities.
Our reported financial results may be materially and adversely affected by changes in accounting principles generally accepted in the United States.
Generally accepted accounting principles in the United States are subject to interpretation by the Financial Accounting Standards Board (FASB), the SEC, and various bodies formed to promulgate and interpret appropriate accounting principles. A change in these principles or interpretations could have a significant effect on our reported financial results and could materially and adversely affect the transactions completed before the announcement of a change.
We may have exposure to greater-than-anticipated tax liabilities, which may materially and adversely affect our business.
We are subject to income taxes and non-income taxes in the United States and other countries in which we conduct business, and such laws and rates vary by jurisdiction. We are subject to review and audit by U.S. federal, state, local and foreign tax authorities. Such tax authorities may disagree with tax positions we take and if any such tax authority were to successfully challenge any such position, our financial results and operations could be materially and adversely affected. In addition, our future tax liability could be adversely affected by changes in tax laws, rates, and regulations. The determination of our worldwide provision for income and other taxes is highly complex and requires significant judgment, and there are many transactions and calculations where the ultimate tax determination is uncertain. Although we believe our estimates are reasonable, the amount ultimately payable may differ from amounts recorded in our financial statements and may materially affect our financial results in the period or periods for which such determination is made.
Risks Related to Ownership of Our Common Stock
The dual class structure of our common stock has the effect of concentrating voting control within our stockholders who held our stock prior to our initial public offering, including many of our employees and directors and their affiliates; this will limit or preclude your ability to influence corporate matters.
Our Class B common stock has ten votes per share, and our Class A common stock has one vote per share. Stockholders who hold shares of Class B common stock, including many of our executive officers, employees, and directors and their affiliates, held approximately 89.3% of the voting power of our combined outstanding capital stock as of December 31, 2016. Our executive officers and directors and their affiliates held approximately 60.8% of the voting power of our combined outstanding capital stock as of December 31, 2016. Because of the ten-to-one voting ratio between our Class B and Class A common stock, the holders of our Class B common stock collectively hold more than a majority of the combined voting power of our common stock, and therefore such holders are able to control all matters submitted to our stockholders for approval. When the shares of our Class B common stock represent less than 5% of the combined voting power of our Class A common stock and Class B common stock, the then-outstanding shares of Class B common stock will automatically convert into shares of Class A common stock.
Transfers by holders of Class B common stock will generally result in those shares converting to Class A common stock, subject to limited exceptions, such as certain transfers to entities, including certain charities and foundations, to the extent the transferor retains sole dispositive power and exclusive voting control with respect to the shares of Class B common stock. Such conversions of Class B common stock to Class A common stock upon transfer will have the effect, over time, of increasing the relative voting power of those holders of Class B common stock who retain their shares in the long term. If, for example, our stockholders who held our stock prior to our initial public offering retain a significant portion of their holdings of Class B
30
common stock for an extended period of time, they could, in the future, continue to control a majority of the combined voting power of our outstanding capital stock.
We will continue to incur significantly increased costs and devote substantial management time as a result of operating as a public company.
As a public company, we incur significant legal, financial, and other expenses that we did not incur as a private company. We are subject to the reporting requirements of the Exchange Act and are required to comply with the applicable requirements of the Sarbanes-Oxley Act and the Dodd-Frank Wall Street Reform and Consumer Protection Act, as well as the rules and regulations subsequently implemented by the SEC and the listing standards of the New York Stock Exchange, including changes in corporate governance practices and the establishment and maintenance of effective disclosure and financial controls. Continuing to comply with these requirements may increase our legal and financial compliance costs and may make some activities more time consuming and costly. In addition, our management and other personnel must divert attention from operational and other business matters to devote substantial time to these requirements. If we are unable to continue to meet these requirements, we may not be able to remain listed on the NYSE, which could result in potential loss of confidence by our sellers and employees, loss of institutional investor interest, fewer business development opportunities, class action or shareholder derivative lawsuits, depressed stock price, limited liquidity of our Class A common stock, and other material adverse consequences. Moreover, we could incur additional compensation costs in the event that we decide to pay cash compensation closer to that of other public technology companies, which would increase our general and administrative expenses and could materially and adversely affect our profitability.
If we are unable to maintain effective disclosure controls and internal controls over financial reporting, investors may lose confidence in the accuracy and completeness of our financial reports, and the market price of our Class A common stock may be materially and adversely affected.
We are continuing to develop and refine our disclosure controls and improve our internal controls over financial reporting. We have expended, and anticipate that we will continue to expend, significant resources in order to maintain and improve the effectiveness of our disclosure controls and procedures and internal control over financial reporting.
Our current controls and any new controls that we develop may become inadequate because of changes in conditions in our business. If we identify material weaknesses in our disclosure controls or internal control over financial reporting in the future, we will be unable to assert that our internal controls are effective. If we are unable to do so, or if our auditors are unable to attest to management’s report on the effectiveness of our internal controls, we could lose investor confidence in the accuracy and completeness of our financial reports, which could cause the price of our Class A common stock to decline. We have identified significant deficiencies in our internal control over financial reporting in the past and have taken steps to remediate such deficiencies. However, our efforts to remediate them may not be effective or prevent any future deficiency in our internal controls. We are required to disclose material changes made in our internal controls and procedures on a quarterly basis.
Any failure to maintain effective disclosure controls and internal control over financial reporting could have a material and adverse effect on our business and operating results, and cause a decline in the market price of our Class A common stock.
The market price of our Class A common stock has been and will likely continue to be volatile, and you could lose all or part of your investment.
The market price of our Class A common stock has been and may continue to be subject to wide fluctuations in response to various factors, some of which are beyond our control and may not be related to our operating performance. In addition to the factors discussed in this “Risk Factors” section and elsewhere in this Annual Report on Form 10-K, factors that could cause fluctuations in the market price of our Class A common stock include the following:
price and volume fluctuations in the overall stock market from time to time; | |
volatility in the market prices and trading volumes of companies in our industry or companies that investors consider comparable; | |
changes in operating performance and stock market valuations of other companies generally or of those in our industry in particular; | |
31
sales of shares of our common stock by us or our stockholders; | |
failure of securities analysts to maintain coverage and/or to provide accurate consensus results of us, changes in financial estimates by securities analysts who follow us, or our failure to meet these estimates or the expectations of investors; | |
the financial or other projections we may provide to the public, any changes in those projections, or our failure to meet those projections; | |
announcements by us or our competitors of new products or services; | |
public reaction to our press releases, other public announcements, and filings with the SEC; | |
rumors and market speculation involving us or other companies in our industry; | |
actual or anticipated changes in our results of operations; | |
changes in the regulatory environment; | |
actual or anticipated developments in our business, our competitors’ businesses, or the competitive landscape generally; | |
litigation involving us, our industry, or both, or investigations by regulators into our operations or those of our competitors; | |
announced or completed acquisitions of businesses or technologies by us or our competitors; | |
new laws or regulations or new interpretations of existing laws or regulations applicable to our business; | |
changes in accounting standards, policies, guidelines, interpretations, or principles; | |
any significant change in our management; and | |
general economic conditions and slow or negative growth of our markets. | |
In addition, in the past, following periods of volatility in the overall market and the market price of a particular company’s securities, securities class action litigation has often been instituted against these companies. This litigation, if instituted against us, could result in substantial costs and a diversion of our management’s attention and resources.
Anti-takeover provisions contained in our amended and restated certificate of incorporation, our amended and restated bylaws, and provisions of Delaware law, could impair a takeover attempt.
Our amended and restated certificate of incorporation, our amended and restated bylaws, and Delaware law contain provisions which could have the effect of rendering more difficult, delaying, or preventing an acquisition deemed undesirable by our board of directors and therefore depress the trading price of our Class A common stock.
Among other things, our amended and restated certificate of incorporation and amended and restated bylaws include provisions (i) creating a classified board of directors whose members serve staggered three-year terms; (ii) authorizing “blank check” preferred stock, which could be issued by our board of directors without stockholder approval and may contain voting, liquidation, dividend, and other rights superior to our common stock; (iii) limiting the ability of our stockholders to call special meetings; (iv) eliminating the ability of our stockholders to act by written consent without a meeting or to remove directors without cause; and (v) requiring advance notice of stockholder proposals for business to be conducted at meetings of our stockholders and for nominations of candidates for election to our board of directors. These provisions, alone or together, could delay or prevent hostile takeovers and changes in control or changes in our management.
As a Delaware corporation, we are also subject to provisions of Delaware law, including Section 203 of the Delaware General Corporation Law, which prevents certain stockholders holding more than 15% of our outstanding capital stock from
32
engaging in certain business combinations without the approval of our board of directors or the holders of at least two-thirds of our outstanding capital stock not held by such stockholder.
Any provision of our amended and restated certificate of incorporation, amended and restated bylaws, or Delaware law that has the effect of delaying or preventing a change in control could limit the opportunity for our stockholders to receive a premium for their shares of our capital stock and could also affect the price that some investors are willing to pay for our Class A common stock.
Our amended and restated bylaws provide that the Court of Chancery of the State of Delaware will be the sole and exclusive forum for substantially all disputes between us and our stockholders, which could limit our stockholders’ ability to obtain a favorable judicial forum for disputes with us or our directors, officers, or employees.
Our amended and restated bylaws provide that, unless we consent to the selection of an alternative forum, the Court of Chancery of the State of Delaware is the sole and exclusive forum for (i) any derivative action or proceeding brought on our behalf; (ii) any action asserting a claim of breach of fiduciary duty owed by any of our directors, officers, or other employees to us or to our stockholders; (iii) any action asserting a claim arising pursuant to the Delaware General Corporation Law; or (iv) any action asserting a claim governed by the internal affairs doctrine. The choice of forum provision may limit a stockholder’s ability to bring a claim in a judicial forum that it finds favorable for disputes with us or our directors, officers, or other employees, which may discourage such lawsuits against us and our directors, officers, and other employees. Alternatively, if a court were to find the choice of forum provision contained in our amended and restated bylaws to be inapplicable or unenforceable in an action, we may incur additional costs associated with resolving such action in other jurisdictions, which could have a material and adverse impact on our business.
If securities or industry analysts publish reports that are interpreted negatively by the investment community, publish negative research reports about our business, or cease coverage of our company or fail to regularly publish reports on us, our share price and trading volume could decline.
The trading market for our Class A common stock depends, to some extent, on the research and reports that securities or industry analysts publish about us, our business, our market, or our competitors. We do not have any control over these analysts or the information contained in their reports. If one or more analysts publish research reports that are interpreted negatively by the investment community, or have a negative tone regarding our business, financial or operating performance, industry or end-markets, our share price could decline. In addition, if a majority of these analysts cease coverage of our company or fail to regularly publish reports on us, we could lose visibility in the financial markets, which could cause our share price or trading volume to decline.
We do not intend to pay dividends for the foreseeable future.
We currently intend to retain any future earnings to finance the operation and expansion of our business, and we do not expect to declare or pay any dividends in the foreseeable future. As a result, you may only receive a return on your investment in our common stock if the trading price of our common stock increases. Investors seeking cash dividends should not purchase shares of our common stock.
Additional stock issuances could result in significant dilution to our stockholders.
We may issue additional equity securities to raise capital, make acquisitions, or for a variety of other purposes. Additional issuances of our stock may be made pursuant to the exercise or conversion of new or existing convertible debt securities, warrants, stock options, or other equity incentive awards to new and existing service providers. Any such issuances will result in dilution to existing holders of our stock. We rely on equity-based compensation as an important tool in recruiting and retaining employees. The amount of dilution due to equity-based compensation of our employees and other additional issuances could be substantial.
Item 1B. UNRESOLVED STAFF COMMENTS
None.
33
Item 2. PROPERTIES
Our corporate headquarters, which include product development, sales, marketing, and business operations, are located in San Francisco, California. It consists of 338,910 square feet of space under a lease that expires in 2023. We also lease 43,689 square feet in New York, New York for a product development, sales, and business operations office under a lease that expires in 2025. We have offices in several other locations and believe our facilities are sufficient for our current needs.
34
Item 3. LEGAL PROCEEDINGS
We are currently a party to, and may in the future be involved in, various litigation matters (including intellectual property litigation), legal claims, and government investigations.
We are involved in a class action lawsuit concerning independent contractors in connection with our Caviar business. On March 19, 2015, Jeffry Levin, on behalf of a putative nationwide class, filed a lawsuit in the United States District Court for the Northern District of California against our wholly owned subsidiary, Caviar, Inc., which, as amended, alleges that Caviar misclassified Mr. Levin and other similarly situated couriers as independent contractors and, in doing so, violated various provisions of the California Labor Code and California Business and Professions Code by requiring them to pay various business expenses that should have been borne by Caviar. The Court compelled arbitration of Mr. Levin’s individual claims on November 16, 2015 and dismissed the lawsuit in its entirety with prejudice on May 2, 2016. On June 1, 2016, Mr. Levin filed a Notice of Appeal of the Court’s order compelling arbitration with the United States Court of Appeals for the Ninth Circuit. Mr. Levin filed his opening appellate brief regarding the order compelling arbitration of his individual claims on October 7, 2016. We filed our answering brief on December 7, 2016, and Mr. Levin filed his reply on December 21, 2016. The parties now await notice of a hearing date from the Ninth Circuit. Mr. Levin also sought an award of penalties pursuant to the Labor Code Private Attorneys General Act of 2004 (PAGA). The parties stipulated that Mr. Levin would no longer pursue this PAGA claim but that it may instead be pursued by a different courier. Subsequently, couriers Nadezhda Rosen and La’Dell Brewster filed a new PAGA-only claim in California state court on November 7, 2016. Plaintiffs claim that Caviar misclassified its couriers as independent contractors resulting in numerous violations of the California Labor Code, pursuant to which plaintiffs seek statutory penalties for those violations. The parties have stipulated to extend the time for Caviar to respond to the complaint until March 17, 2017. In February 2017, we participated in a mediation with the parties in these Caviar misclassification suits to explore resolution of the matters at hand; however, an agreement on all the material terms has not been reached.
In addition, from time to time, we are involved in various other litigation matters and disputes arising in the ordinary course of business. We cannot at this time fairly estimate a reasonable range of exposure, if any, of the potential liability with respect to these other matters. While we do not believe, at this time, that any ultimate liability resulting from any of these other matters will have a material adverse effect on our results of operations, financial position, or liquidity, we cannot give any assurance regarding the ultimate outcome of these other matters, and their resolution could be material to our operating results for any particular period, depending on the level of income for the period.
35
Item 4. MINE SAFETY DISCLOSURES
Not applicable.
36
PART II
Item 5. MARKET FOR REGISTRANT’S COMMON EQUITY RELATED STOCKHOLDER MATTERS AND ISSUER PURCHASES OF EQUITY SECURITIES
Market Information for Common Stock
Our Class A common stock began trading on the New York Stock Exchange under the symbol “SQ” on November 19, 2015. Prior to that date, there was no public trading market for our Class A common stock. The following table sets forth the high and low sales price per share of our Class A common stock as reported on the New York Stock Exchange for the period indicated:
Year Ended December 31, 2016 | High | Low | ||||||
First Quarter | $ | 15.91 | $ | 8.06 | ||||
Second Quarter | $ | 15.87 | $ | 8.42 | ||||
Third Quarter | $ | 12.54 | $ | 8.78 | ||||
Fourth Quarter | $ | 14.82 | $ | 10.88 | ||||
Year Ended December 31, 2015 | ||||||||
Fourth Quarter (from November 19, 2015) | $ | 14.78 | $ | 9.00 | ||||
Holders of Record
As of February 17, 2017, there were 46 holders of record of our Class A common stock and 168 holders of record of our Class B common stock. Because many of our shares of Class A common stock are held by brokers and other institutions on behalf of stockholders, we are unable to estimate the total number of beneficial owners of our Class A common stock represented by these record holders.
Dividend Policy
We have never declared nor paid any cash dividends on our capital stock. We currently intend to retain all available funds and any future earnings for use in the operation of our business and do not expect to pay any dividends on our capital stock in the foreseeable future. Any future determination relating to our dividend policy will be at the discretion of our board of directors, subject to applicable laws, and will depend on our financial condition, results of operations, capital requirements, general business conditions, and other factors that our board of directors considers relevant.
Unregistered Sales of Equity Securities
None.
Issuer Purchases of Equity Securities
None.
Performance Graph
This performance graph shall not be deemed “soliciting material” or to be “filed” with the SEC for purposes of Section 18 of the Securities Exchange Act of 1934, as amended (Exchange Act), or otherwise subject to the liabilities under that Section, and shall not be deemed to be incorporated by reference into any filing of Square, Inc. under the Securities Act of 1933, as amended, or the Exchange Act.
The following graph compares the cumulative total return to stockholders on our common stock relative to the cumulative total returns of the Standard & Poor’s 500 Index, or S&P 500, and the S&P North American Technology Index. An investment of $100 (with reinvestment of all dividends) is assumed to have been made in our Class A common stock and in each index on November 19, 2015, the date our Class A common stock began trading on the NYSE, and its relative performance is tracked through December 31, 2016. The returns shown are based on historical results and are not intended to suggest future performance.
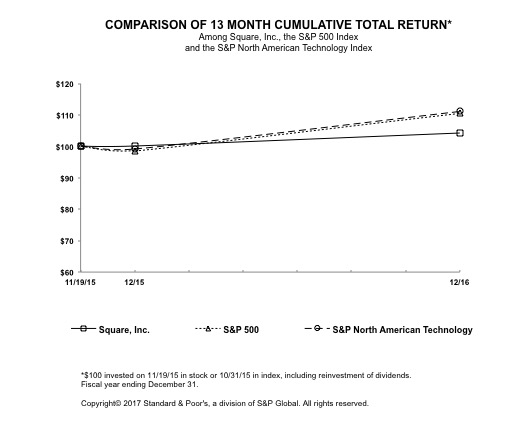
38
Company/Index | 11/19/2015 | 12/31/2015 | 12/31/2016 | ||||||
Square, Inc. | 100 | 100.15 | 104.28 | ||||||
S&P 500 | 100 | 98.72 | 110.52 | ||||||
S&P North American Technology | 100 | 99.20 | 111.15 | ||||||
Item 6. SELECTED FINANCIAL DATA
The following selected consolidated statement of operations data for the years ended December 31, 2016, 2015, and 2014, and the consolidated balance sheet data as of December 31, 2016, and 2015, have been derived from our audited consolidated financial statements and should be read in conjunction with the section titled “Management’s Discussion and Analysis of Financial Condition and Results of Operations” and our consolidated financial statements and related notes included elsewhere in this Annual Report on Form 10-K. The following selected consolidated statement of operations data for the years ended December 31, 2013, and 2012, and the consolidated balance sheet data as of December 31, 2014, and 2013, are derived from our audited consolidated financial statements which are not included in this Annual Report on Form 10-K.
39
Year Ended December 31, | |||||||||||||||||||
2016 | 2015 | 2014 | 2013 | 2012 | |||||||||||||||
(in thousands, except per share data) | |||||||||||||||||||
Consolidated Statement of Operations Data: | |||||||||||||||||||
Revenue: | |||||||||||||||||||
Transaction-based revenue | $ | 1,456,160 | $ | 1,050,445 | $ | 707,799 | $ | 433,737 | $ | 193,978 | |||||||||
Starbucks transaction-based revenue | 78,903 | 142,283 | 123,024 | 114,456 | 9,471 | ||||||||||||||
Subscription and services-based revenue | 129,351 | 58,013 | 12,046 | — | — | ||||||||||||||
Hardware revenue | 44,307 | 16,377 | 7,323 | 4,240 | — | ||||||||||||||
Total net revenue | 1,708,721 | 1,267,118 | 850,192 | 552,433 | 203,449 | ||||||||||||||
Cost of revenue: | |||||||||||||||||||
Transaction-based costs | 943,200 | 672,667 | 450,858 | 277,833 | 126,351 | ||||||||||||||
Starbucks transaction-based costs | 69,761 | 165,438 | 150,955 | 139,803 | 12,547 | ||||||||||||||
Subscription and services-based costs | 43,132 | 22,470 | 2,973 | — | — | ||||||||||||||
Hardware costs | 68,562 | 30,874 | 18,330 | 6,012 | — | ||||||||||||||
Amortization of acquired technology | 8,028 | 5,639 | 1,002 | — | — | ||||||||||||||
Total cost of revenue | 1,132,683 | 897,088 | 624,118 | 423,648 | 138,898 | ||||||||||||||
Gross profit | 576,038 | 370,030 | 226,074 | 128,785 | 64,551 | ||||||||||||||
Operating expenses: | — | ||||||||||||||||||
Product development | 268,537 | 199,638 | 144,637 | 82,864 | 46,568 | ||||||||||||||
Sales and marketing | 173,876 | 145,618 | 112,577 | 64,162 | 56,648 | ||||||||||||||
General and administrative | 251,993 | 143,466 | 94,220 | 68,942 | 36,184 | ||||||||||||||
Transaction, loan and advance losses | 51,235 | 54,009 | 24,081 | 15,329 | 10,512 | ||||||||||||||
Amortization of acquired customer assets | 850 | 1,757 | 1,050 | — | — | ||||||||||||||
Impairment of intangible assets | — | — | — | 2,430 | — | ||||||||||||||
Total operating expenses | 746,491 | 544,488 | 376,565 | 233,727 | 149,912 | ||||||||||||||
Operating loss | (170,453 | ) | (174,458 | ) | (150,491 | ) | (104,942 | ) | (85,361 | ) | |||||||||
Interest and other (income) expense, net | (780 | ) | 1,613 | 2,162 | (962 | ) | (162 | ) | |||||||||||
Loss before income tax | (169,673 | ) | (176,071 | ) | (152,653 | ) | (103,980 | ) | (85,199 | ) | |||||||||
Provision for income taxes | 1,917 | 3,746 | 1,440 | 513 | — | ||||||||||||||
Net loss | (171,590 | ) | (179,817 | ) | (154,093 | ) | (104,493 | ) | (85,199 | ) | |||||||||
Deemed dividend on Series E preferred stock | — | (32,200 | ) | — | — | — | |||||||||||||
Net loss attributable to common stockholders | $ | (171,590 | ) | $ | (212,017 | ) | $ | (154,093 | ) | $ | (104,493 | ) | $ | (85,199 | ) | ||||
Net loss per share attributable to common stockholders: | |||||||||||||||||||
Basic | $ | (0.50 | ) | $ | (1.24 | ) | $ | (1.08 | ) | $ | (0.82 | ) | $ | (0.71 | ) | ||||
Diluted | $ | (0.50 | ) | $ | (1.24 | ) | $ | (1.08 | ) | $ | (0.82 | ) | $ | (0.71 | ) | ||||
Weighted-average shares used to compute net loss per share attributable to common stockholders: | |||||||||||||||||||
Basic | 341,555 | 170,498 | 142,042 | 127,845 | 119,220 | ||||||||||||||
Diluted | 341,555 | 170,498 | 142,042 | 127,845 | 119,220 | ||||||||||||||
40
Operating expenses include share-based compensation expense as follows:
Year Ended December 31, | |||||||||||||||||||
2016 | 2015 | 2014 | 2013 | 2012 | |||||||||||||||
(in thousands) | |||||||||||||||||||
Product development | $ | 91,404 | $ | 54,738 | $ | 24,758 | $ | 8,820 | $ | 3,984 | |||||||||
Sales and marketing | 14,122 | 7,360 | 3,738 | 1,235 | 668 | ||||||||||||||
General and administrative | 33,260 | 20,194 | 7,604 | 4,603 | 3,462 | ||||||||||||||
Total share-based compensation | $ | 138,786 | $ | 82,292 | $ | 36,100 | $ | 14,658 | $ | 8,114 | |||||||||
December 31, | |||||||||||||||
2016 | 2015 | 2014 | 2013 | ||||||||||||
(in thousands) | |||||||||||||||
Consolidated Balance Sheet Data: | |||||||||||||||
Cash and cash equivalents | $ | 452,030 | $ | 461,329 | $ | 222,315 | $ | 166,176 | |||||||
Settlements receivable | 321,102 | 142,727 | 115,481 | 64,968 | |||||||||||
Working capital | 423,961 | 371,361 | 218,761 | 124,061 | |||||||||||
Total assets | 1,211,362 | 894,772 | 541,888 | 318,341 | |||||||||||
Customers payable | 388,058 | 215,365 | 145,663 | 95,794 | |||||||||||
Total stockholders' equity | 576,153 | 508,048 | 273,672 | 162,294 | |||||||||||
Key Operating Metrics and Non-GAAP Financial Measures
We collect and analyze operating and financial data to evaluate the health of our business, allocate our resources, and assess our performance. In addition to revenue, net income (loss), and other results under generally accepted accounting principles (GAAP), the following table sets forth key operating metrics and non-GAAP financial measures we use to evaluate our business. We believe these metrics and measures are useful to facilitate period-to-period comparisons of our business, and to facilitate comparisons of our performance to that of other payment processors. Each of these metrics and measures excludes the effect of our processing agreement with Starbucks. As of December 31, 2016, Starbucks has completed its previously announced transition to another payments solutions provider. As a result, we believe it is useful to exclude Starbucks activity to clearly show the impact Starbucks has had on our financial results historically, and to provide insight into the impact of the termination of the Starbucks agreement on our revenues going forward. Our agreements with other sellers generally provide both those sellers and us the unilateral right to terminate such agreements at any time, without fine or penalty. Furthermore, we generally do not enter into long-term contractual agreements with sellers.
Year Ended December 31, | |||||||||||||||||||
2016 | 2015 | 2014 | 2013 | 2012 | |||||||||||||||
(in thousands, except for GPV and per share data) | |||||||||||||||||||
Gross Payment Volume (GPV) (in millions) | $ | 49,683 | $ | 35,643 | $ | 23,780 | $ | 14,822 | $ | 6,518 | |||||||||
Adjusted Revenue | $ | 686,618 | $ | 452,168 | $ | 276,310 | $ | 160,144 | $ | 67,627 | |||||||||
Adjusted EBITDA | $ | 44,887 | $ | (41,115 | ) | $ | (67,741 | ) | $ | (51,530 | ) | $ | (70,579 | ) | |||||
Adjusted Net Income (Loss) Per Share: | |||||||||||||||||||
Basic | $ | 0.04 | $ | (0.39 | ) | $ | (0.62 | ) | $ | (0.46 | ) | $ | (0.62 | ) | |||||
Diluted | $ | 0.04 | $ | (0.39 | ) | $ | (0.62 | ) | $ | (0.46 | ) | $ | (0.62 | ) | |||||
Gross Payment Volume (GPV)
We define GPV as the total dollar amount of all card payments processed by sellers using Square, net of refunds. GPV excludes card payments processed for Starbucks. Additionally, GPV excludes non-revenue generating activity related to our Square Cash peer-to-peer payments service.
41
Adjusted Revenue
Adjusted Revenue is a non-GAAP financial measure that we define as our total net revenue less transaction-based costs, adjusted to eliminate the effect of activity with Starbucks. As described above, Starbucks completed its previously announced transition to another payments provider and has ceased using our payments solutions altogether, and we believe that providing Adjusted Revenue metrics that exclude the impact of our agreement with Starbucks is useful to investors.
We believe it is useful to subtract transaction-based costs from Adjusted Revenue as this is a primary metric used by management to measure our business performance, and it affords greater comparability to other payments solution providers. Substantially all of the transaction-based costs subtracted from Adjusted Revenue are interchange fees set by payment card networks and are paid to card issuers, with the remainder of such transaction costs consisting of assessment fees paid to payment card networks, fees paid to third-party payment processors, and bank settlement fees. While some payments solution providers present their revenue in a similar fashion to us, others present their revenue net of transaction-based costs because they pass through these costs directly to their sellers. Under our standard pricing model, we do not pass through these costs directly to our sellers.
Adjusted Revenue has limitations as a financial measure, should be considered as supplemental in nature, and is not meant as a substitute for the related financial information prepared in accordance with GAAP. These limitations include the following:
• | Adjusted Revenue is net of transaction-based costs, which is our largest cost of revenue item; and |
• | other companies, including companies in our industry, may calculate Adjusted Revenue differently from how we calculate this measure or not at all, which reduces its usefulness as a comparative measure. |
Because of these limitations, you should consider Adjusted Revenue alongside other financial performance measures, including total net revenue and our financial results presented in accordance with GAAP. The following table presents a reconciliation of total net revenue to Adjusted Revenue for each of the periods indicated:
Year Ended December 31, | |||||||||||||||||||
2016 | 2015 | 2014 | 2013 | 2012 | |||||||||||||||
(in thousands) | |||||||||||||||||||
Total net revenue | $ | 1,708,721 | $ | 1,267,118 | $ | 850,192 | $ | 552,433 | $ | 203,449 | |||||||||
Less: Starbucks transaction-based revenue | 78,903 | 142,283 | 123,024 | 114,456 | 9,471 | ||||||||||||||
Less: transaction-based costs | 943,200 | 672,667 | 450,858 | 277,833 | 126,351 | ||||||||||||||
Adjusted Revenue | $ | 686,618 | $ | 452,168 | $ | 276,310 | $ | 160,144 | $ | 67,627 | |||||||||
Adjusted EBITDA, Adjusted Net Income (Loss), and Adjusted Net Income (Loss) Per Share
Adjusted EBITDA, Adjusted Net Income (Loss), and Adjusted Net Income (Loss) Per Share are non-GAAP financial measures that represent our net income (loss) and net income (loss) per share, adjusted to eliminate the effect of Starbucks transactions and certain other items as described below. We have included these non-GAAP financial measures in this Annual Report on Form 10-K because they are key measures used by our management to evaluate our operating performance, generate future operating plans, and make strategic decisions, including those relating to operating expenses and the allocation of internal resources. Accordingly, we believe these measures provide useful information to investors and others in understanding and evaluating our operating results in the same manner as our management and board of directors. In addition, they provide useful measures for period-to-period comparisons of our business, as they remove the effect of certain non-cash items and certain variable charges.
• | We exclude Starbucks transaction-based revenue and Starbucks transaction-based costs. As described above, Starbucks completed its previously announced transition to another payments solution provider and has ceased using our payments solutions altogether, and we believe that providing non-GAAP financial measures that exclude the impact of our agreement with Starbucks is useful to investors. |
42
• | We believe it is useful to exclude non-cash charges, such as amortization of intangible assets, and share-based compensation expenses, from our non-GAAP financial measures because the amount of such expenses in any specific period may not directly correlate to the underlying performance of our business operations. |
• | We exclude the litigation settlement with Robert E. Morley described in Note 1 of the accompanying notes to our consolidated financial statements, gain or loss on the sale of property and equipment, and impairment of intangible assets from non-GAAP financial measures because we do not believe that these items are reflective of our ongoing business operations. |
In addition to the items above, Adjusted EBITDA as a non-GAAP financial measure also excludes depreciation, interest income and expense, other income and expense and provision or benefit from income taxes, as these items are not components of our core business operations.
Non-GAAP financial measures have limitations, should be considered as supplemental in nature and are not meant as a substitute for the related financial information prepared in accordance with GAAP. These limitations include the following:
• | share-based compensation expense has been, and will continue to be for the foreseeable future, a significant recurring expense in our business and an important part of our compensation strategy; |
• | the intangible assets being amortized may have to be replaced in the future, and the non-GAAP financial measures do not reflect cash capital expenditure requirements for such replacements or for new capital expenditures or other capital commitments; and |
• | non-GAAP measures do not reflect changes in, or cash requirements for, our working capital needs. |
In addition to the limitations above, Adjusted EBITDA as a non-GAAP financial measure does not reflect the effect of depreciation expense and related cash capital requirements, income taxes that may represent a reduction in cash available to us, and the effect of foreign currency exchange gains or losses which is included in other income and expense.
Other companies, including companies in our industry, may calculate the non-GAAP financial measures differently from how we calculate these measures or not at all, which reduces their usefulness as comparative measures.
Because of these limitations, you should consider the non-GAAP financial measures alongside other financial performance measures, including net loss and our other financial results presented in accordance with GAAP.
The following table presents a reconciliation of net loss to Adjusted EBITDA for each of the periods indicated (in thousands):
Year Ended December 31, | |||||||||||||||||||
2016 | 2015 | 2014 | 2013 | 2012 | |||||||||||||||
Net loss | $ | (171,590 | ) | $ | (179,817 | ) | $ | (154,093 | ) | $ | (104,493 | ) | $ | (85,199 | ) | ||||
Starbucks transaction-based revenue | (78,903 | ) | (142,283 | ) | (123,024 | ) | (114,456 | ) | (9,471 | ) | |||||||||
Starbucks transaction-based costs | 69,761 | 165,438 | 150,955 | 139,803 | 12,547 | ||||||||||||||
Share-based compensation expense | 138,786 | 82,292 | 36,100 | 14,658 | 8,114 | ||||||||||||||
Depreciation and amortization | 37,745 | 27,626 | 18,586 | 8,272 | 3,579 | ||||||||||||||
Litigation settlement expense | 48,000 | — | — | — | — | ||||||||||||||
Interest and other (income) expense, net | (780 | ) | 1,613 | 2,162 | (962 | ) | (162 | ) | |||||||||||
Provision for income taxes | 1,917 | 3,746 | 1,440 | 513 | — | ||||||||||||||
(Gain) loss on sale of property and equipment | (49 | ) | 270 | 133 | 2,705 | 13 | |||||||||||||
Impairment of intangible assets | — | — | — | 2,430 | — | ||||||||||||||
Adjusted EBITDA | $ | 44,887 | $ | (41,115 | ) | $ | (67,741 | ) | $ | (51,530 | ) | $ | (70,579 | ) | |||||
43
The following table presents a reconciliation of net loss to Adjusted Net Income (Loss) and Adjusted Net Income (Loss) Per Share for each of the periods indicated (in thousands, except per share data):
Year Ended December 31, | |||||||||||||||||||
2016 | 2015 | 2014 | 2013 | 2012 | |||||||||||||||
Net loss | $ | (171,590 | ) | $ | (179,817 | ) | $ | (154,093 | ) | $ | (104,493 | ) | $ | (85,199 | ) | ||||
Starbucks transaction-based revenue | (78,903 | ) | (142,283 | ) | (123,024 | ) | (114,456 | ) | (9,471 | ) | |||||||||
Starbucks transaction-based costs | 69,761 | 165,438 | 150,955 | 139,803 | 12,547 | ||||||||||||||
Share-based compensation expense | 138,786 | 82,292 | 36,100 | 14,658 | 8,114 | ||||||||||||||
Amortization of intangible assets | 9,013 | 7,503 | 2,133 | 54 | 54 | ||||||||||||||
Litigation settlement expense | 48,000 | — | — | — | — | ||||||||||||||
(Gain) loss on sale of property and equipment | (49 | ) | 270 | 133 | 2,705 | 13 | |||||||||||||
Impairment of intangible assets | — | — | — | 2,430 | — | ||||||||||||||
Adjusted Net Income (Loss) | $ | 15,018 | $ | (66,597 | ) | $ | (87,796 | ) | $ | (59,299 | ) | $ | (73,942 | ) | |||||
Adjusted Net Income (Loss) Per Share: | |||||||||||||||||||
Basic | $ | 0.04 | $ | (0.39 | ) | $ | (0.62 | ) | $ | (0.46 | ) | $ | (0.62 | ) | |||||
Diluted | $ | 0.04 | $ | (0.39 | ) | $ | (0.62 | ) | $ | (0.46 | ) | $ | (0.62 | ) | |||||
Weighted-average shares used to compute Adjusted Net Income (Loss) Per Share: | |||||||||||||||||||
Basic | 341,555 | 170,498 | 142,042 | 127,845 | 119,220 | ||||||||||||||
Diluted | 370,258 | 170,498 | 142,042 | 127,845 | 119,220 | ||||||||||||||
Basic Adjusted Net Income (Loss) Per Share is computed by dividing the Adjusted Net Income (Loss) by the weighted-average number of shares of common stock outstanding during the period.
Diluted Adjusted Net Income Per Share is computed by dividing Adjusted Net Income by the weighted-average number of shares of common stock outstanding, including all potentially dilutive shares.
Diluted Adjusted Net Loss Per Share is the same as Basic Adjusted Net Loss Per Share because the effects of potentially dilutive items were anti-dilutive given the Adjusted Net Loss position.
44
Item 7. MANAGEMENT'S DISCUSSION AND ANALYSIS OF FINANCIAL CONDITION AND RESULTS OF OPERATIONS
You should read the following discussion and analysis in conjunction with the information set forth under “Selected Financial Data” and our consolidated financial statements and related notes included elsewhere in this Annual Report on Form 10-K. The statements in this discussion regarding our expectations of our future performance; liquidity and capital resources; our plans, estimates, beliefs, and expectations that involve risks and uncertainties; and other non-historical statements in this discussion are forward-looking statements. These forward-looking statements are subject to numerous risks and uncertainties, including, but not limited to, the risks and uncertainties described under “Risk Factors” and elsewhere in this Annual Report on Form 10-K. Our actual results may differ materially from those contained in or implied by any forward-looking statements.
Overview
We started Square in February 2009 to enable businesses (sellers) to accept card payments, an important capability that was previously inaccessible to many businesses. However, sellers also need innovative solutions to thrive, and we have since expanded to provide additional products and services to provide these businesses with access to the same tools as large businesses. Square is a cohesive commerce ecosystem that combines sophisticated software with affordable hardware to enable sellers to turn mobile devices and computing devices into powerful payments and point-of-sale solutions. We focus on technology and design to create products and services that are cohesive, fast, self-serve, and dependable.
The foundation of our ecosystem is a full service, managed payments offering. With our offering, a seller can accept payments in person via magnetic stripe (a swipe), EMV (Europay, MasterCard, and Visa) (a dip), or NFC (Near Field Communication) (a tap); or online via Square Invoices, Square Virtual Terminal, or the seller’s website. Once on our system, sellers gain access to technology and features such as reporting and analytics, next-day settlements, digital receipts, payment dispute management and chargeback protection, and PCI compliance. On the consumer (buyer) side, Square Cash offers individuals access to a fast, easy way to send and receive money electronically to and from individuals and businesses. We monetize these features through a per transaction fee which we record as revenue upon authorization of a transaction by the seller's customer's bank. We recognize revenue net of refunds, which arise from reversals of transactions initiated by sellers.
Our commerce ecosystem also includes powerful point-of-sale software and services that help sellers make informed business decisions through the use of analytics and reporting. As a result, sellers can manage orders, inventory, locations, employees, and payroll; engage and grow their sales with customers; and gain access to business loans. Some of these advanced point-of-sale features are broadly applicable to our seller base and include Employee Management, and Customer Engagement. We monetize these features through either a per transaction fee, a subscription fee, or a service fee.
With Square Capital, we facilitate the offering of loans to sellers based on their payment processing history, and the product is broadly applicable across our seller base. We recognize revenue upon the sale of the loans to third-party investors or over time as the sellers pay down the outstanding amounts for the loans that we hold as available for sale. We also earn a servicing fee from third-party investors that we record as revenue as we provide the services.
We also serve sellers through Caviar, a food ordering service that helps restaurants reach new customers and increase sales without additional overhead. Caviar revenue consists of seller fees charged to restaurants, delivery fees, and service fees from consumers. All fees are recognized upon delivery of the food, net of refunds.
We also provide our sellers with contactless and chip readers, chip card readers, Square Stand, and third-party peripherals. We recognize revenue from the sale of this hardware net of returns upon delivery of the hardware to the end user.
We have grown rapidly to serve millions of sellers that represent a diverse set of industries, including retail, services, and food-related businesses, and sizes, ranging from a single vendor at a farmers’ market to multi-location businesses. These sellers also span geographies including the United States, Canada, Japan, and Australia.
45
Operating Metric Overview (in thousands, except for GPV, percentages and per share data)
Year Ended December 31, | 2015 to 2016 | 2014 to 2015 | |||||||||||||||
2016 | 2015 | 2014 | % Change | % Change | |||||||||||||
Gross Payment Volume (GPV) (in millions) | $ | 49,683 | $ | 35,643 | $ | 23,780 | 39 | % | 50 | % | |||||||
Total net revenue | $ | 1,708,721 | $ | 1,267,118 | $ | 850,192 | 35 | % | 49 | % | |||||||
Adjusted Revenue | $ | 686,618 | $ | 452,168 | $ | 276,310 | 52 | % | 64 | % | |||||||
Net loss attributable to common stockholders | $ | (171,590 | ) | $ | (212,017 | ) | $ | (154,093 | ) | ||||||||
Adjusted EBITDA | $ | 44,887 | $ | (41,115 | ) | $ | (67,741 | ) | |||||||||
Net loss per share attributable to common stockholders: | |||||||||||||||||
Basic | $ | (0.50 | ) | $ | (1.24 | ) | $ | (1.08 | ) | ||||||||
Diluted | $ | (0.50 | ) | $ | (1.24 | ) | $ | (1.08 | ) | ||||||||
Adjusted Net Income (Loss) Per Share: | |||||||||||||||||
Basic | $ | 0.04 | $ | (0.39 | ) | $ | (0.62 | ) | |||||||||
Diluted | $ | 0.04 | $ | (0.39 | ) | $ | (0.62 | ) | |||||||||
Components of Results of Operations
Changes to the Description of Revenue and Cost of Revenue Line Items
We have renamed some of the revenue and cost of revenues financial statement line items in our consolidated statements of operations to better describe how we monetize our product and service offerings. Accordingly, we have renamed the previously-presented transaction revenue and Starbucks transaction revenue as transaction-based revenue and Starbucks transaction-based revenue, respectively. We have also renamed software and data product revenue as subscription and services-based revenue. The products and services revenues included in the previously presented line items remain the same. We have similarly renamed the cost of revenues line items while the components of costs of revenues in the line items have remained the same.
Revenue
Transaction-based revenue. We charge our sellers a transaction fee for managed payments solutions that is generally calculated based on a percentage of the total transaction amount processed. We also selectively offer custom pricing for larger sellers.
Starbucks transaction-based revenue. Under our processing agreement with Starbucks, we charged a percentage of the total transaction amount for payments solutions we offered to certain Starbucks-owned stores in the United States. As of December 31, 2016, Starbucks has completed its previously announced transition to another payments solution provider and accordingly we do not expect revenue from Starbucks to recur in the future.
Subscription and services-based revenue. In addition to managed payments and point-of-sale services, we offer our sellers a range of paid services, with Square Capital and Caviar currently comprising the majority of our subscription and services-based revenue. Our other subscription and services-based products include Gift Cards, Square Appointments, Instant Deposit, Customer Engagement, Employee Management, Payroll, and other subscription and services-based products offered through our Square Marketplace.
Square Capital primarily facilitates loans to pre-qualified sellers. Previously we provided MCAs to sellers but we discontinued the MCAs in 2016 and are currently still servicing and collecting such MCAs in accordance with their terms. The loans have no stated coupon rate but the seller is charged by our bank partner a one-time origination fee based upon their risk rating, which is derived primarily from processing activity. Generally, a fixed percentage of the seller’s daily processing volume is withheld to repay the loan. Our intention is to continue selling loans to third-party investors for an upfront fee while being retained as the loan servicer. We record the net amounts we pay to the bank partner as the cost of the loans we purchase and
46
subsequently record any gain we make on the sale of these loans to third-party investors as a component of revenue. We record the ongoing servicing fee, which is a fixed percentage of each repayment, as revenue as the service is performed. We may retain some of the loans purchased from our bank partner on our balance sheet which we hold as available for sale. We recognize a portion of the excess of the expected seller repayments over the cost of the loan as revenue in proportion to the loan principal reduction for the time we own the loan. Selling the loans to investors provides us with funding and allows us to mitigate our balance sheet risk.
Revenue for Caviar, our food ordering service, is derived from seller fees, which are a percentage of total food order value, delivery fees, and service fees paid by the consumer based on total food order value.
Hardware revenue. Hardware revenue includes revenue from sales of contactless and chip readers, chip card readers, Square Stand, and third-party peripherals. Third-party peripherals include cash drawers, receipt printers, and barcode scanners, all of which can be integrated with Square Stand to provide a comprehensive point-of-sale solution. In the second quarter of 2015, we began selling our first chip card reader, and in the fourth quarter of 2015, we began selling our contactless and chip reader.
Cost of Revenue and Gross Margin
Transaction-based costs. Transaction-based costs consist primarily of interchange fees set by payment card networks and that are paid to the card-issuing financial institution, assessment fees paid to payment card networks, fees paid to third-party payment processors, and bank settlement fees.
Starbucks transaction-based costs. Starbucks transaction-based costs consist of the same components as our overall transaction-based costs.
Subscription and services-based costs. Subscription and services-based costs consist primarily of Caviar-related costs, which include payments to third-party couriers for deliveries and the costs of equipment provided to sellers. Cost of revenue for other subscription and services-based products consists primarily of the amortization related to the development of certain subscription and services-based products.
Hardware costs. Hardware costs consist primarily of product costs associated with contactless and chip readers, chip card readers, Square Stand, and third-party peripherals. Product costs include manufacturing-related overhead and personnel costs, certain royalties, packaging, and fulfillment costs. We currently offer our contactless and chip card readers at a price modestly below our manufacturing costs. For Square Stand, our manufacturing costs substantially exceed our revenue. However, we believe both Square Stand and contactless and chip readers are attractive offerings to many of our larger sellers, and, as a result, we intend to continue to offer each at prices less than our costs. In conjunction with the sale of contactless and chip readers, we will also begin to recognize additional costs related to the design and distribution of those units.
Amortization of acquired technology. These costs consist of amortization related to technologies acquired through acquisitions that have the capability of producing revenue.
Operating Expenses
Operating expenses consist of product development, sales and marketing, general and administrative expenses, transaction, loan and advance losses, and amortization of acquired customer assets. For product development and general and administrative expenses, the largest single component is personnel-related expenses, including salaries, commissions and bonuses, employee benefit costs, and share-based compensation. In the case of sales and marketing expenses, a significant portion is related to paid advertising expenses in addition to personnel-related expenses. Operating expenses also include allocated overhead costs for facilities, human resources, and IT.
Product development. Product development expenses currently represent the largest component of our operating expenses and consist primarily of expenses related to our engineering, data science, and design personnel; fees and supply costs related to maintenance and capacity expansion at third-party data center facilities; hardware related development and tooling costs; and fees for software licenses, consulting, legal, and other services that are directly related to growing and maintaining our portfolio of products and services. Additionally, product development expenses include the depreciation of product-related infrastructure and tools, including data center equipment, internally developed software, and computer equipment. We continue to focus our product development efforts on adding new features and apps, and on enhancing the functionality and ease of use
47
of our offerings. Our ability to realize returns on these investments is substantially dependent upon our ability to successfully address current and emerging requirements of sellers and buyers through the development and introduction of these new products and services. While we expect total product development expenses to increase as we invest further in engineering and design personnel, over time we also expect our product development expenses to decline as a percentage of total net revenue.
Sales and marketing. Sales and marketing expenses consist primarily of four components. The first component is comprised of costs incurred to acquire new sellers through various paid advertising channels, including online, mobile, email, direct mail, and direct response TV, all of which are expensed as incurred. The second component includes expenses related to our direct sales, account management, local and product marketing, retail and ecommerce, partnerships, and communications personnel. The third component includes the costs associated with the manufacturing and distribution of our magstripe reader, which is offered for free on our website and provided through various marketing events and distribution channels. New sellers who purchase a magstripe reader from one of our retail distribution partners are offered a rebate equal to the price paid. The cost to us of manufacturing and distributing magstripe readers are partially offset by amounts received from retail distribution partners. As our sellers transition to using our contactless and chip reader, we expect to distribute relatively fewer magstripe readers, thus reducing that component of our sales and marketing expenses. The fourth component includes costs associated with free Square Cash peer-to-peer transactions. While we expect sales and marketing expenses to increase as the scale of our business grows, over the long term we also expect sales and marketing expenses to decline as a percentage of total net revenue. Over the short term, however, sales and marketing expenses as a percentage of total net revenue may demonstrate variability based on the timing and magnitude of marketing and customer acquisition initiatives.
General and administrative. General and administrative expenses consist primarily of expenses related to our finance, legal, customer support, Caviar operations, risk operations, human resources, and administrative personnel. General and administrative expenses also include costs related to fees paid for professional services, including legal, tax, and accounting services. While we expect general and administrative expenses to increase in dollar amount to support our growth and costs of compliance associated with being a public company, over time we expect general and administrative expenses to decline as a percentage of total net revenue.
Transaction, loan and advance losses. We are exposed to transaction losses due to chargebacks as a result of fraud or uncollectibility. Examples of transaction losses include chargebacks for unauthorized credit card use and inability to collect on disputes between buyers and sellers over the delivery of goods or services. We base our reserve estimates on prior chargeback history and current period data points indicative of transaction loss. We reflect additions to the reserve in current operating results, while we make charges to the reserve when we incur losses.
The establishment of appropriate reserves is an inherently uncertain process, and ultimate losses may vary from the current estimates. We regularly update our reserve estimates as new facts become known and events occur that may affect the settlement or recovery of losses. For the period from January 1, 2014 through December 31, 2016, our transaction losses accounted for approximately 0.1% of GPV.
We are not exposed to losses for the Square Capital loans that are sold to third parties in accordance with our arrangements with them. These third-party arrangements cover a majority of the dollar value of loans purchased from our bank partner. We account for the Square Capital loans that we retain at the lower of cost or fair value. To determine the fair value of these loans, we utilize industry standard modeling, such as discounted cash flow models. To date the fair values of the loans have exceeded the cost and we have not had to write-down the value of the loans.
We are exposed to losses related to the uncollectibility of MCAs that we still carry on our books, and similar to the loss provisions for transaction losses, we have established loss provisions for uncollectible receivables. We have estimated the allowance based on prior default rates and seller-specific activity. During the first quarter of 2016, we fully transitioned from offering MCAs to loans. Activity includes updates to our provision estimates for historical balances and charge offs of certain MCA receivables based on payment inactivity.
Amortization of acquired customer assets. Amortization of acquired customer assets includes customer relationships, restaurant relationships, courier relationships, subscriber relationships, and partner relationships.
Interest and Other Income and Expense
Interest and other income and expense consists primarily of interest expense related to our revolving credit facility, interest expense on our capital lease financings, and interest income on cash balances. Other income and expense historically
48
consisted primarily of changes in the fair value of our customer warrant liability measurements and foreign currency-related gains and losses.
Provision for Income Taxes
The provision for income taxes consists primarily of local, state, federal, and foreign tax. Our effective tax rate fluctuates from period to period due to changes in the mix of income and losses in jurisdictions with a wide range of tax rates, the effect of acquisitions, changes resulting from the amount of recorded valuation allowance, permanent differences between U.S. generally accepted accounting principles and local tax laws, certain one-time items, and changes in tax contingencies.
Deemed Dividend on Series E Preferred Stock
For the year ended December 31, 2015, we issued 10,299,696 shares of our common stock to certain holders of Series E preferred stock in the form of a deemed stock dividend of $32.2 million. There were no similar occurrences in any other period presented.
49
Results of Operations
Revenue (in thousands, except for percentages)
Year Ended December 31, | 2015 to 2016 | 2014 to 2015 | |||||||||||||||
2016 | 2015 | 2014 | % Change | % Change | |||||||||||||
Transaction-based revenue | $ | 1,456,160 | $ | 1,050,445 | $ | 707,799 | 39 | % | 48 | % | |||||||
Starbucks transaction-based revenue | 78,903 | 142,283 | 123,024 | (45 | )% | 16 | % | ||||||||||
Subscription and services-based revenue | 129,351 | 58,013 | 12,046 | 123 | % | 382 | % | ||||||||||
Hardware revenue | 44,307 | 16,377 | 7,323 | 171 | % | 124 | % | ||||||||||
Total net revenue | $ | 1,708,721 | $ | 1,267,118 | $ | 850,192 | 35 | % | 49 | % | |||||||
Comparison of Years Ended December 31, 2016 and 2015
Total net revenue for the year ended December 31, 2016, increased by $441.6 million, or 35%, compared to the year ended December 31, 2015.
Transaction-based revenue for the year ended December 31, 2016, increased by $405.7 million, or 39%, compared to the year ended December 31, 2015. This increase was attributable to growth in GPV processed of $14.0 billion, or 39%, to $49.7 billion from $35.6 billion. We continue to benefit from positive dollar-based retention from our existing sellers, in addition to meaningful contributions from new sellers.
Starbucks transaction-based revenue for the year ended December 31, 2016, decreased by $63.4 million, or 45%, compared to the year ended December 31, 2015. Starbucks-related payment volume continued to decline throughout 2016 and during the fourth quarter of 2016, as Starbucks completed its previously announced transition to another payments solution provider. Accordingly, we do not expect revenue from Starbucks to recur in the future.
Subscription and services-based revenue for the year ended December 31, 2016 increased by $71.3 million, or 123%, compared to the year ended December 31, 2015. The increase was primarily driven by continued growth and expansion of Square Capital and Caviar, and to a lesser extent, the launch and expansion of new products and services, including Instant Deposit. During the year ended December 31, 2016 and 2015, Square Capital and Caviar were the largest contributors to subscription and services-based revenue. Subscription and services-based revenue grew to 8% of total net revenue in the year ended December 31, 2016, up from 5% in the year ended December 31, 2015.
Hardware revenue for the year ended December 31, 2016, increased by $27.9 million, or 171%, compared to the year ended December 31, 2015. The increase primarily reflected growth in shipments of our contactless and chip reader following its launch in the fourth quarter of 2015. To a lesser extent, we generated increased sales across all of our other paid hardware products, including Square Stand, our chip card reader, and third-party peripherals.
Comparison of Years Ended December 31, 2015 and 2014
Total net revenue for the year ended December 31, 2015, increased by $416.9 million, or 49%, compared to the year ended December 31, 2014.
Transaction-based revenue for the year ended December 31, 2015, increased by $342.6 million, or 48%, compared to the year ended December 31, 2014. This increase was attributable to growth in GPV processed of $11.9 billion, or 50%, to $35.6 billion from $23.8 billion.
Starbucks transaction-based revenue for the year ended December 31, 2015, increased by $19.3 million, or 16%, compared to the year ended December 31, 2014. Under an amended processing agreement that was effective October 1, 2015, Starbucks agreed to pay increased processing rates for as long as it continued to process transactions with us. In 2015, we continued to process a portion of Starbucks payments, generating transaction-based revenue at these increased rates.
Subscription and services-based revenue for the year ended December 31, 2015 increased by $46.0 million, or 382%, compared to the year ended December 31, 2014. The increase was driven by the launch and expansion of several new products and services in 2014 and 2015, in particular Square Capital, which remained the largest contributor to subscription and services-based revenue. The year ended December 31, 2015 also included a full twelve months of revenue contributions from Caviar,
50
which we acquired in August 2014. Subscription and services-based revenue grew to 5% of total net revenue in the year ended December 31, 2015, up from 1% in the year ended December 31, 2014.
Hardware revenue for the year ended December 31, 2015, increased by $9.1 million, or 124%, compared to the year ended December 31, 2014. The increase reflected growth in sales of Square Stand and third-party peripherals, as well as the launch of our chip card reader in the second quarter of 2015 and the launch of our contactless and chip reader in the fourth quarter of 2015.
Total Cost of Revenue (in thousands, except for percentages)
Year Ended December 31, | 2015 to 2016 | 2014 to 2015 | |||||||||||||||
2016 | 2015 | 2014 | % Change | % Change | |||||||||||||
Transaction-based costs | $ | 943,200 | $ | 672,667 | $ | 450,858 | 40 | % | 49 | % | |||||||
Starbucks transaction-based costs | 69,761 | 165,438 | 150,955 | (58 | )% | 10 | % | ||||||||||
Subscription and services-based costs | 43,132 | 22,470 | 2,973 | 92 | % | NM | |||||||||||
Hardware costs | 68,562 | 30,874 | 18,330 | 122 | % | 68 | % | ||||||||||
Amortization of acquired technology | 8,028 | 5,639 | 1,002 | 42 | % | NM | |||||||||||
Total cost of revenue | $ | 1,132,683 | $ | 897,088 | $ | 624,118 | 26 | % | 44 | % | |||||||
Comparison of Years Ended December 31, 2016 and 2015
Total cost of revenue for the year ended December 31, 2016, increased by $235.6 million, or 26%, compared to the year ended December 31, 2015.
Transaction-based costs for the year ended December 31, 2016, increased by $270.5 million, or 40%, compared to the year ended December 31, 2015. This increase was attributable to growth in GPV processed of $14.0 billion, or 39%, and is consistent with the growth in transaction-based revenue.
Starbucks transaction-based costs for the year ended December 31, 2016, decreased by $95.7 million, or 58%, compared to the year ended December 31, 2015. As noted above, Starbucks-related payment volume continued to decline throughout 2016, and during the fourth quarter of 2016, Starbucks completed its previously announced transition to another payments solution provider. Additionally, Starbucks transaction-based costs decreased by a greater percentage than Starbucks transaction-based revenue as a result of Starbucks' agreement to pay us increased processing rates effective October 1, 2015.
Subscription and services-based costs for the year ended December 31, 2016, increased by $20.7 million compared to the year ended December 31, 2015, primarily reflecting increased costs associated with the growth of Caviar. To a lesser extent, we also incurred increased amortization costs related to the development of certain subscription and services-based products.
Hardware costs for the year ended December 31, 2016, increased by $37.7 million, or 122%, compared to the year ended December 31, 2015. Hardware costs grew more slowly than hardware revenue mainly as a result of the growth in sales of our contactless and chip reader which have relatively better terms than Square Stand.
Amortization of acquired technology assets for the year ended December 31, 2016, increased by $2.4 million compared to the year ended December 31, 2015. The increase was primarily related to new technology assets obtained through acquisitions that occurred in 2015.
Comparison of Years Ended December 31, 2015 and 2014
Total cost of revenue for the year ended December 31, 2015, increased by $273.0 million, or 44%, compared to the year ended December 31, 2014.
Transaction-based costs for the year ended December 31, 2015, increased by $221.8 million, or 49%, compared to the year ended December 31, 2014. This increase was attributable to growth in GPV processed of $11.9 billion, or 50%, reflecting a decline in transaction-based costs as a percentage of GPV compared to the prior year period.
Starbucks transaction-based costs for the year ended December 31, 2015, increased by $14.5 million, or 10%, compared to the year ended December 31, 2014. As a result of Starbucks' agreement to pay us increased processing rates effective October 1,
51
2015, growth in Starbucks transaction-based revenue outpaced growth in Starbucks transaction-based costs beginning in the fourth quarter of 2015.
Subscription and services-based costs for the year ended December 31, 2015, increased by $19.5 million compared to the year ended December 31, 2014. The increase primarily reflects increased costs associated with Caviar, which we acquired in August 2014. To a lesser extent, we also incurred increased costs related to the growth in our Gift Cards product, as well as increased amortization costs related to the development of certain subscription and services-based products.
Hardware costs for the year ended December 31, 2015, increased by $12.5 million, or 68%, compared to the year ended December 31, 2014. The increase was attributable to increased sales of Square Stand and third-party peripherals, as well as the launch of our chip card reader in the second quarter of 2015, and the launch of our contactless and chip reader in the fourth quarter of 2015. For the year ended December 31, 2015, hardware costs grew more slowly than hardware revenue as a result of increased sales of third-party peripherals and the introduction of our contactless and chip reader.
Amortization of technology assets for the year ended December 31, 2015, increased by $4.6 million compared to the year ended December 31, 2014. The increase was related to new technology assets obtained through acquisitions that occurred in 2014 and 2015.
Product Development (in thousands, except for percentages)
Year Ended December 31, | 2015 to 2016 | 2014 to 2015 | |||||||||||||||
2016 | 2015 | 2014 | % Change | % Change | |||||||||||||
Product development | $ | 268,537 | $ | 199,638 | $ | 144,637 | 35 | % | 38 | % | |||||||
Percentage of total net revenue | 16 | % | 16 | % | 17 | % | |||||||||||
Product development expenses for the year ended December 31, 2016, increased by $68.9 million, or 35%, compared to the year ended December 31, 2015, due to the following:
• | the addition of personnel in our engineering, product, and design teams; and |
• | product development expenses included $91.4 million in share-based compensation expense, a $36.7 million increase compared to the prior year. |
Product development expenses for the year ended December 31, 2015, increased by $55.0 million, or 38%, compared to the year ended December 31, 2014, due to the following:
• | the addition of personnel in our engineering, product, and design teams, including those who joined as a result of acquisitions; and |
• | product development expenses included $54.7 million in share-based compensation expense, a $30.0 million increase compared to the prior year. |
Sales and Marketing (in thousands, except for percentages)
Year Ended December 31, | 2015 to 2016 | 2014 to 2015 | |||||||||||||||
2016 | 2015 | 2014 | % Change | % Change | |||||||||||||
Sales and marketing | $ | 173,876 | $ | 145,618 | $ | 112,577 | 19 | % | 29 | % | |||||||
Percentage of total net revenue | 10 | % | 11 | % | 13 | % | |||||||||||
Sales and marketing expenses for the year ended December 31, 2016, increased by $28.3 million, or 19%, compared to the year ended December 31, 2015, due to the following:
• | an increase in sales and marketing personnel to support growth in the business; |
• | sales and marketing expenses included $14.1 million in share-based compensation expense, a $6.8 million increase compared to the prior year; |
52
• | an increase of $4.7 million in costs associated with our Square Cash peer-to-peer transfer service; and |
• | paid marketing expenditures were stable compared to the prior year. |
Sales and marketing expenses for the year ended December 31, 2015, increased by $33.0 million, or 29%, compared to the year ended December 31, 2014, due to the following:
• | an increase in sales and marketing personnel; |
• | an increase of $18.0 million in costs associated with our Square Cash peer-to-peer payments service; |
• | an increase of $13.2 million in advertising costs primarily from increased direct mail, online, and mobile marketing campaigns during the period; |
• | sales and marketing expenses included $7.4 million in share-based compensation expense, a $3.6 million increase compared to the prior year; and |
• | offset in part by lower costs associated with distributing our magstripe readers. |
General and Administrative (in thousands, except for percentages)
Year Ended December 31, | 2015 to 2016 | 2014 to 2015 | |||||||||||||||
2016 | 2015 | 2014 | % Change | % Change | |||||||||||||
General and administrative | $ | 251,993 | $ | 143,466 | $ | 94,220 | 76 | % | 52 | % | |||||||
Percentage of total net revenue | 15 | % | 11 | % | 11 | % | |||||||||||
General and administrative expenses for the year ended December 31, 2016, increased by $108.5 million, or 76%, compared to the year ended December 31, 2015, due to the following:
• | the balance included $48.0 million of non-recurring expense related to the settlement of legal proceedings with Robert E. Morley, with no similar activity in the prior year; |
• | additions to our customer support, legal, compliance, risk, finance, Square Capital operations, and Caviar operations personnel that together will drive long-term operating efficiencies as our business scales; |
• | increased third-party legal, finance, consulting, and certain software license expenses primarily related to our first year of operations as a public company; and |
• | general and administrative expenses included $33.3 million in share-based compensation expense, a $13.1 million increase compared to the prior year. |
General and administrative expenses for the year ended December 31, 2015, increased by $49.2 million, or 52%, compared to the year ended December 31, 2014, due to the following:
• | additions to our customer support, risk operations, legal, compliance, and finance teams; |
• | increased third-party legal, finance, consulting, and certain software license expenses; and |
• | general and administrative expenses included $20.2 million in share-based compensation expense, a $12.6 million increase compared to the prior year. |
Transaction. Loan and Advance Losses (in thousands, except for percentages)
Year Ended December 31, | 2015 to 2016 | 2014 to 2015 | |||||||||||||||
2016 | 2015 | 2014 | % Change | % Change | |||||||||||||
Transaction, loan and advance losses | $ | 51,235 | $ | 54,009 | $ | 24,081 | (5 | )% | 124 | % | |||||||
53
Transaction, loan and advance losses for the year ended December 31, 2016, decreased by $2.8 million, or 5%, compared to the year ended December 31, 2015, due to better use of data science and improvements in our risk operations to mitigate exposure to transaction losses despite the growth in GPV during 2016, and due to the net effect of the following:
• | an $8.5 million charge recorded in the year ended December 31, 2015, comprised of a $4.4 million charge related to fraud loss from a single seller and an increase of $4.1 million loss provision made to reflect updates to our risk model; and |
• | an out of period adjustment of $5.5 million recorded in the year ended December 31, 2016, as a result of a correction to the calculation of our reserve for transaction losses. |
Transaction, loan and advance losses for the year ended December 31, 2015, increased by $29.9 million, or 124%, compared to the year ended December 31, 2014 due to the following:
• | an $8.5 million charge recorded in the year ended December 31, 2015, comprised of a $4.4 million accrual related to fraud loss from a single seller and an increase of $4.1 million loss provision made to reflect updates to our risk model; |
• | $3.8 million incremental provisions for MCAs; and |
• | increased GPV which resulted in the recording of a higher reserve. |
Amortization of Acquired Customer Assets (in thousands, except for percentages)
Year Ended December 31, | 2015 to 2016 | 2014 to 2015 | |||||||||||||||
2016 | 2015 | 2014 | % Change | % Change | |||||||||||||
Amortization of acquired customer assets | $ | 850 | $ | 1,757 | $ | 1,050 | (52 | )% | 67 | % | |||||||
Amortization of acquired customer assets for the year ended December 31, 2016, decreased by $0.9 million, or 52%, compared to the year ended December 31, 2015, as a result of certain customer assets reaching end of life.
Amortization of acquired customer assets for the year ended December 31, 2015, increased by $0.7 million, or 67%, compared to the year ended December 31, 2014, primarily reflecting the first full year of amortization related to our acquisition of Caviar in August 2014.
Interest and Other Income and Expense, net (in thousands, except for percentages)
Year Ended December 31, | 2015 to 2016 | 2014 to 2015 | |||||||||||||||
2016 | 2015 | 2014 | % Change | % Change | |||||||||||||
Interest and other (income) expense, net | $ | (780 | ) | $ | 1,613 | $ | 2,162 | (148 | )% | (25 | )% | ||||||
Interest and other (income) expense, net, for the year ended December 31, 2016, changed by $2.4 million, or 148%, compared to the year ended December 31, 2015, primarily driven by interest income earned on our investment in marketable securities offsetting interest expense and driven by fluctuations in foreign exchange rates.
Interest and other (income) expense, net, for the year ended December 31, 2015, increased by $0.5 million, or 25%, compared to the year ended December 31, 2014, driven primarily by the interest expense related to the draw on our revolving credit facility in June 2014, which was repaid in July 2015, and also as a result of a benefit from the remeasurement of our share-based instruments in 2015 with no similar occurrences in 2014, offset in part by foreign exchange rate losses. As of December 31, 2015, no amounts were outstanding under our revolving credit facility.
Provision for Income Taxes (in thousands, except for percentages)
Year Ended December 31, | 2015 to 2016 | 2014 to 2015 | |||||||||||||||
2016 | 2015 | 2014 | % Change | % Change | |||||||||||||
Provision for income taxes | $ | 1,917 | $ | 3,746 | $ | 1,440 | (49 | )% | 160 | % | |||||||
54
Provision for income taxes for the year ended December 31, 2016, decreased by $1.8 million compared to the year ended December 31, 2015, primarily related to the reduction in federal income tax expense.
Provision for income taxes for the year ended December 31, 2015, increased by $2.3 million compared to the year ended December 31, 2014, primarily due to a decrease in income tax benefit arising from acquisitions.
Deemed Dividend on Series E Preferred Stock (in thousands, except for percentages)
Year Ended December 31, | 2015 to 2016 | 2014 to 2015 | |||||||||||||
2016 | 2015 | 2014 | % Change | % Change | |||||||||||
Deemed dividend on Series E preferred stock | $ | — | $ | (32,200 | ) | $ | — | NM | NM | ||||||
For the year ended December 31, 2015, we issued 10,299,696 shares of our common stock to certain holders of Series E preferred stock, in the form of a deemed stock dividend of $32.2 million. There were no similar occurrences in any other period presented.
55
Quarterly Results of Operations
The following tables set forth selected unaudited quarterly statements of operations data for the last eight quarters. The information for each of these quarters has been prepared on the same basis as the audited annual financial statements included elsewhere in this Annual Report on Form 10-K and, in the opinion of management, includes all adjustments, which consist only of normal recurring adjustments, necessary for the fair presentation of the results of operations for these periods. This data should be read in conjunction with our audited consolidated financial statements and related notes included elsewhere in this Annual Report on Form 10-K. These quarterly operating results are not necessarily indicative of the results we may achieve in future periods.
Three Months Ended, | |||||||||||||||||||||||||||||||
Dec. 31, 2016 | Sep. 30, 2016 | Jun. 30, 2016 | Mar. 31, 2016 | Dec. 31, 2015 | Sep. 30, 2015 | Jun. 30, 2015 | Mar. 31, 2015 | ||||||||||||||||||||||||
(in thousands, except per share data) | |||||||||||||||||||||||||||||||
(unaudited) | |||||||||||||||||||||||||||||||
Revenue: | |||||||||||||||||||||||||||||||
Transaction-based revenue | $ | 402,496 | $ | 388,347 | $ | 364,864 | $ | 300,453 | $ | 298,516 | $ | 280,955 | $ | 259,864 | $ | 211,110 | |||||||||||||||
Starbucks transaction-based revenue | 34 | 7,164 | 32,867 | 38,838 | 47,084 | 32,332 | 33,630 | 29,237 | |||||||||||||||||||||||
Subscription and services-based revenue | 40,518 | 35,320 | 29,717 | 23,796 | 22,385 | 14,694 | 12,928 | 8,006 | |||||||||||||||||||||||
Hardware revenue | 8,869 | 8,171 | 11,085 | 16,182 | 6,375 | 4,207 | 3,591 | 2,204 | |||||||||||||||||||||||
Total net revenue | 451,917 | 439,002 | 438,533 | 379,269 | 374,360 | 332,188 | 310,013 | 250,557 | |||||||||||||||||||||||
Cost of revenue: | |||||||||||||||||||||||||||||||
Transaction-based costs | 260,006 | 254,061 | 234,857 | 194,276 | 192,730 | 182,007 | 165,823 | 132,107 | |||||||||||||||||||||||
Starbucks transaction-based costs | (49 | ) | 4,528 | 28,672 | 36,610 | 46,896 | 41,410 | 40,921 | 36,211 | ||||||||||||||||||||||
Subscription and services-based costs | 11,431 | 12,524 | 10,144 | 9,033 | 8,650 | 5,593 | 5,072 | 3,155 | |||||||||||||||||||||||
Hardware costs | 12,118 | 15,689 | 14,015 | 26,740 | 14,238 | 5,726 | 6,713 | 4,197 | |||||||||||||||||||||||
Amortization of acquired technology | 1,886 | 1,886 | 1,886 | 2,370 | 2,753 | 1,142 | 1,142 | 602 | |||||||||||||||||||||||
Total cost of revenue | 285,392 | 288,688 | 289,574 | 269,029 | 265,267 | 235,878 | 219,671 | 176,272 | |||||||||||||||||||||||
Gross profit | 166,525 | 150,314 | 148,959 | 110,240 | 109,093 | 96,310 | 90,342 | 74,285 | |||||||||||||||||||||||
Operating expenses: | |||||||||||||||||||||||||||||||
Product development | 64,889 | 70,418 | 68,638 | 64,592 | 59,186 | 55,020 | 45,887 | 39,545 | |||||||||||||||||||||||
Sales and marketing | 49,406 | 46,754 | 39,220 | 38,496 | 38,448 | 39,259 | 31,730 | 36,181 | |||||||||||||||||||||||
General and administrative | 53,027 | 52,075 | 50,784 | 96,107 | 45,723 | 37,820 | 31,804 | 28,119 | |||||||||||||||||||||||
Transaction, loan and advance losses | 13,034 | 12,885 | 17,455 | 7,861 | 13,169 | 16,005 | 8,513 | 16,322 | |||||||||||||||||||||||
Amortization of acquired customer assets | 147 | 164 | 222 | 317 | 384 | 423 | 482 | 468 | |||||||||||||||||||||||
Total operating expenses | 180,503 | 182,296 | 176,319 | 207,373 | 156,910 | 148,527 | 118,416 | 120,635 | |||||||||||||||||||||||
Operating loss | (13,978 | ) | (31,982 | ) | (27,360 | ) | (97,133 | ) | (47,817 | ) | (52,217 | ) | (28,074 | ) | (46,350 | ) | |||||||||||||||
Interest and other (income) expense, net | 153 | 111 | (327 | ) | (717 | ) | (772 | ) | 781 | 394 | 1,210 | ||||||||||||||||||||
Loss before income tax | (14,131 | ) | (32,093 | ) | (27,033 | ) | (96,416 | ) | (47,045 | ) | (52,998 | ) | (28,468 | ) | (47,560 | ) | |||||||||||||||
Provision for income taxes | 1,036 | 230 | 312 | 339 | 1,244 | 932 | 1,152 | 418 | |||||||||||||||||||||||
Net loss | (15,167 | ) | (32,323 | ) | (27,345 | ) | (96,755 | ) | (48,289 | ) | (53,930 | ) | (29,620 | ) | (47,978 | ) | |||||||||||||||
Deemed dividend on Series E preferred stock | — | — | — | — | (32,200 | ) | — | — | — | ||||||||||||||||||||||
Net loss attributable to common stockholders | $ | (15,167 | ) | $ | (32,323 | ) | $ | (27,345 | ) | $ | (96,755 | ) | $ | (80,489 | ) | $ | (53,930 | ) | $ | (29,620 | ) | $ | (47,978 | ) | |||||||
Net loss per share attributable to common stockholders: | |||||||||||||||||||||||||||||||
Basic | $ | (0.04 | ) | $ | (0.09 | ) | $ | (0.08 | ) | $ | (0.29 | ) | $ | (0.34 | ) | $ | (0.35 | ) | $ | (0.20 | ) | $ | (0.33 | ) | |||||||
Diluted | $ | (0.04 | ) | $ | (0.09 | ) | $ | (0.08 | ) | $ | (0.29 | ) | $ | (0.34 | ) | $ | (0.35 | ) | $ | (0.20 | ) | $ | (0.33 | ) | |||||||
Weighted-average shares used to compute net loss per share attributable to common stockholders: | |||||||||||||||||||||||||||||||
Basic | 356,343 | 343,893 | 334,488 | 331,324 | 234,548 | 152,334 | 149,253 | 145,069 | |||||||||||||||||||||||
Diluted | 356,343 | 343,893 | 334,488 | 331,324 | 234,548 | 152,334 | 149,253 | 145,069 | |||||||||||||||||||||||
56
Costs and expenses include share-based compensation expense as follows:
Three Months Ended, | |||||||||||||||||||||||||||||||
Dec. 31, 2016 | Sep. 30, 2016 | Jun. 30, 2016 | Mar. 31, 2016 | Dec. 31, 2015 | Sep. 30, 2015 | Jun. 30, 2015 | Mar. 31, 2015 | ||||||||||||||||||||||||
(in thousands) | |||||||||||||||||||||||||||||||
Share-Based Compensation | (unaudited) | ||||||||||||||||||||||||||||||
Product development | $ | 21,340 | $ | 23,949 | $ | 24,168 | $ | 21,947 | $ | 21,451 | $ | 13,938 | $ | 10,391 | $ | 8,958 | |||||||||||||||
Sales and marketing | 4,159 | 3,697 | 3,363 | 2,903 | 2,836 | 1,750 | 1,345 | 1,429 | |||||||||||||||||||||||
General and administrative | 8,388 | 9,133 | 9,391 | 6,348 | 8,519 | 5,105 | 3,496 | 3,074 | |||||||||||||||||||||||
Total share-based compensation | $ | 33,887 | $ | 36,779 | $ | 36,922 | $ | 31,198 | $ | 32,806 | $ | 20,793 | $ | 15,232 | $ | 13,461 | |||||||||||||||
The following table sets forth the key operating metrics and non-GAAP financial measures we use to evaluate our business for each of the periods indicated:
Three Months Ended, | |||||||||||||||||||||||||||||||
Dec. 31, 2016 | Sep. 30, 2016 | Jun. 30, 2016 | Mar. 31, 2016 | Dec. 31, 2015 | Sep. 30, 2015 | Jun. 30, 2015 | Mar. 31, 2015 | ||||||||||||||||||||||||
(in thousands, except for GPV and per share data) | |||||||||||||||||||||||||||||||
Key Operating Metrics and non-GAAP Financial Measures | (unaudited) | ||||||||||||||||||||||||||||||
GPV (in millions) | $ | 13,694 | $ | 13,248 | $ | 12,451 | $ | 10,290 | $ | 10,193 | $ | 9,540 | $ | 8,793 | $ | 7,117 | |||||||||||||||
Adjusted Revenue | $ | 191,877 | $ | 177,777 | $ | 170,809 | $ | 146,155 | $ | 134,546 | $ | 117,849 | $ | 110,560 | $ | 89,213 | |||||||||||||||
Adjusted EBITDA | $ | 29,793 | $ | 11,623 | $ | 12,554 | $ | (9,083 | ) | $ | (6,069 | ) | $ | (15,776 | ) | $ | 859 | $ | (20,129 | ) | |||||||||||
Adjusted Net Income (Loss) | $ | 20,766 | $ | 3,677 | $ | 5,685 | $ | (15,110 | ) | $ | (12,476 | ) | $ | (22,467 | ) | $ | (5,446 | ) | $ | (26,208 | ) | ||||||||||
Adjusted Net Income (Loss) Per Share Basic | $ | 0.06 | $ | 0.01 | $ | 0.02 | $ | (0.05 | ) | $ | (0.05 | ) | $ | (0.15 | ) | $ | (0.04 | ) | $ | (0.18 | ) | ||||||||||
Adjusted Net Income (Loss) Per Share Diluted | $ | 0.05 | $ | 0.01 | $ | 0.02 | $ | (0.05 | ) | $ | (0.05 | ) | $ | (0.15 | ) | $ | (0.04 | ) | $ | (0.18 | ) | ||||||||||
The following table presents a reconciliation of total net revenue to Adjusted Revenue for each of the periods indicated:
Three Months Ended, | |||||||||||||||||||||||||||||||
Dec. 31, 2016 | Sep. 30, 2016 | Jun. 30, 2016 | Mar. 31, 2016 | Dec. 31, 2015 | Sep. 30, 2015 | Jun. 30, 2015 | Mar. 31, 2015 | ||||||||||||||||||||||||
(in thousands) | |||||||||||||||||||||||||||||||
Adjusted Revenue Reconciliation | (unaudited) | ||||||||||||||||||||||||||||||
Total net revenue | $ | 451,917 | $ | 439,002 | $ | 438,533 | $ | 379,269 | $ | 374,360 | $ | 332,188 | $ | 310,013 | $ | 250,557 | |||||||||||||||
Less: Starbucks transaction-based revenue | 34 | 7,164 | 32,867 | 38,838 | 47,084 | 32,332 | 33,630 | 29,237 | |||||||||||||||||||||||
Less: Transaction-based costs | 260,006 | 254,061 | 234,857 | 194,276 | 192,730 | 182,007 | 165,823 | 132,107 | |||||||||||||||||||||||
Adjusted Revenue | $ | 191,877 | $ | 177,777 | $ | 170,809 | $ | 146,155 | $ | 134,546 | $ | 117,849 | $ | 110,560 | $ | 89,213 | |||||||||||||||
57
The following table presents a reconciliation of net loss to Adjusted EBITDA for each of the periods indicated:
Three Months Ended, | |||||||||||||||||||||||||||||||
Dec. 31, 2016 | Sep. 30, 2016 | Jun. 30, 2016 | Mar. 31, 2016 | Dec. 31, 2015 | Sep. 30, 2015 | Jun. 30, 2015 | Mar. 31, 2015 | ||||||||||||||||||||||||
(in thousands) | |||||||||||||||||||||||||||||||
Adjusted EBITDA Reconciliation | (unaudited) | ||||||||||||||||||||||||||||||
Net loss | $ | (15,167 | ) | $ | (32,323 | ) | $ | (27,345 | ) | $ | (96,755 | ) | $ | (48,289 | ) | $ | (53,930 | ) | $ | (29,620 | ) | $ | (47,978 | ) | |||||||
Starbucks transaction-based revenue | (34 | ) | (7,164 | ) | (32,867 | ) | (38,838 | ) | (47,084 | ) | (32,332 | ) | (33,630 | ) | (29,237 | ) | |||||||||||||||
Starbucks transaction-based costs | (49 | ) | 4,528 | 28,672 | 36,610 | 46,896 | 41,410 | 40,921 | 36,211 | ||||||||||||||||||||||
Share-based compensation expense | 33,887 | 36,779 | 36,922 | 31,198 | 32,806 | 20,793 | 15,232 | 13,461 | |||||||||||||||||||||||
Depreciation and amortization | 9,928 | 9,681 | 9,018 | 9,118 | 9,100 | 6,570 | 6,410 | 5,546 | |||||||||||||||||||||||
Litigation settlement (benefit) expense | — | — | (2,000 | ) | 50,000 | — | — | — | — | ||||||||||||||||||||||
Interest and other (income) expense, net | 153 | 111 | (327 | ) | (717 | ) | (772 | ) | 781 | 394 | 1,210 | ||||||||||||||||||||
Provision for income taxes | 1,036 | 230 | 312 | 339 | 1,244 | 932 | 1,152 | 418 | |||||||||||||||||||||||
Loss (gain) on sale of property and equipment | 39 | (219 | ) | 169 | (38 | ) | 30 | — | — | 240 | |||||||||||||||||||||
Adjusted EBITDA | $ | 29,793 | $ | 11,623 | $ | 12,554 | $ | (9,083 | ) | $ | (6,069 | ) | $ | (15,776 | ) | $ | 859 | $ | (20,129 | ) | |||||||||||
The following table presents a reconciliation of net loss to Adjusted Net Income (Loss) for each of the periods indicated:
Three Months Ended, | |||||||||||||||||||||||||||||||
Dec. 31, 2016 | Sep. 30, 2016 | Jun. 30, 2016 | Mar. 31, 2016 | Dec. 31, 2015 | Sep. 30, 2015 | Jun. 30, 2015 | Mar. 31, 2015 | ||||||||||||||||||||||||
(in thousands, except per share data) | |||||||||||||||||||||||||||||||
Adjusted Net Income (Loss) Reconciliation | (unaudited) | ||||||||||||||||||||||||||||||
Net loss | $ | (15,167 | ) | $ | (32,323 | ) | $ | (27,345 | ) | $ | (96,755 | ) | $ | (48,289 | ) | $ | (53,930 | ) | $ | (29,620 | ) | $ | (47,978 | ) | |||||||
Starbucks transaction-based revenue | (34 | ) | (7,164 | ) | (32,867 | ) | (38,838 | ) | (47,084 | ) | (32,332 | ) | (33,630 | ) | (29,237 | ) | |||||||||||||||
Starbucks transaction-based costs | (49 | ) | 4,528 | 28,672 | 36,610 | 46,896 | 41,410 | 40,921 | 36,211 | ||||||||||||||||||||||
Share-based compensation expense | 33,887 | 36,779 | 36,922 | 31,198 | 32,806 | 20,793 | 15,232 | 13,461 | |||||||||||||||||||||||
Amortization of intangible assets | 2,090 | 2,076 | 2,134 | 2,713 | 3,165 | 1,592 | 1,651 | 1,095 | |||||||||||||||||||||||
Litigation settlement (benefit) expense | — | — | (2,000 | ) | 50,000 | — | — | — | — | ||||||||||||||||||||||
Loss (gain) on sale of property and equipment | $ | 39 | $ | (219 | ) | $ | 169 | $ | (38 | ) | $ | 30 | $ | — | $ | — | $ | 240 | |||||||||||||
Adjusted Net Income (Loss) | $ | 20,766 | $ | 3,677 | $ | 5,685 | $ | (15,110 | ) | $ | (12,476 | ) | $ | (22,467 | ) | $ | (5,446 | ) | $ | (26,208 | ) | ||||||||||
Adjusted Net Income (Loss) Per Share: | |||||||||||||||||||||||||||||||
Basic | $ | 0.06 | $ | 0.01 | $ | 0.02 | $ | (0.05 | ) | $ | (0.05 | ) | $ | (0.15 | ) | $ | (0.04 | ) | $ | (0.18 | ) | ||||||||||
Diluted | $ | 0.05 | $ | 0.01 | $ | 0.02 | $ | (0.05 | ) | $ | (0.05 | ) | $ | (0.15 | ) | $ | (0.04 | ) | $ | (0.18 | ) | ||||||||||
Weighted-average shares used to compute Adjusted Net Income (Loss) Per Share: | |||||||||||||||||||||||||||||||
Basic | 356,343 | 343,893 | 334,488 | 331,324 | 234,548 | 152,334 | 149,253 | 145,069 | |||||||||||||||||||||||
Diluted | 382,531 | 370,746 | 365,731 | 331,324 | 234,548 | 152,334 | 149,253 | 145,069 | |||||||||||||||||||||||
Quarterly Trends
Transaction-based revenue is highly correlated with the level of GPV generated by sellers using our managed payments services. Historically our transaction-based revenue has been strongest in our fourth quarter and weakest in our first quarter, as our sellers typically generate additional GPV during the holiday season. We believe that this seasonality has affected and will continue to affect our quarterly results; however, to date its effect has been masked by our rapid growth. Starbucks transaction-based revenue continued to decline throughout 2016, and, during the fourth quarter of 2016, Starbucks completed its previously announced transition to another payments solution provider and accordingly we do not expect revenue from Starbucks to recur in the future.
Subscription and services-based revenue generally demonstrates less seasonality than transaction-based revenue. The sequential increase is primarily driven by continued growth and expansion of Square Capital and Caviar.
58
Hardware revenue generally demonstrates less seasonality than transaction-based revenue, with most fluctuations tied to periodic product launches, promotions, or other arrangements with our retail partners.
Changes in product development expenses primarily reflect the timing of additions of engineering, product, and design personnel. To a lesser extent, they also reflect the timing of fees and supply costs related to maintenance and capacity expansion at third-party data center facilities, development and tooling costs related to the design, testing, and shipping of our hardware products, and fees for software licenses, consulting, legal, and other services that are directly related to growing and maintaining our products and services.
Changes in sales and marketing expenses reflect the variable nature of the timing and magnitude of paid marketing and customer acquisition initiatives across our advertising channels. Changes in sales and marketing expenses are also affected by the timing of additions of direct sales, account management, local, product and paid marketing, retail and ecommerce, partnerships, and communications personnel. Additionally, sales and marketing expenses are affected by the timing and magnitude of costs related to our Square Cash peer-to-peer service and the total shipments of our magstripe readers in a given period, as they include the cost of manufacturing and distributing those readers.
Changes in general and administrative expenses primarily reflect the timing of additions of finance, legal, risk operations, human resources, and administrative personnel, as well as the timing of tax payments and reserves. They also reflect the timing of costs related to customer support personnel and systems, as well as fees paid for professional services, including legal and financial services. During the first quarter of 2016, general and administrative expenses included $50.0 million of non-recurring expense related to legal proceedings with Robert E. Morley, which was settled the following quarter, with no similar activity in the other periods presented.
59
Liquidity and Capital Resources
The following table summarizes our cash and cash equivalents, investments in marketable securities, and restricted cash (in thousands):
Year Ended December 31, | |||||||||||
2016 | 2015 | 2014 | |||||||||
Cash and cash equivalents | $ | 452,030 | $ | 461,329 | $ | 222,315 | |||||
Short-term investments | 59,901 | — | — | ||||||||
Long-term investments | 27,366 | — | — | ||||||||
Short-term restricted cash | 22,131 | 13,537 | 11,950 | ||||||||
Long-term restricted cash | 14,584 | 14,686 | 14,394 | ||||||||
The following table summarizes our cash flow activities (in thousands):
Year Ended December 31, | |||||||||||
2016 | 2015 | 2014 | |||||||||
Net cash (used in) provided by operating activities | $ | 23,131 | $ | 21,123 | $ | (112,379 | ) | ||||
Net cash used in investing activities: | (122,733 | ) | (45,096 | ) | (24,554 | ) | |||||
Net cash provided by financing activities | 90,741 | 264,763 | 194,152 | ||||||||
Effect of foreign exchange rate on cash and cash equivalents | (438 | ) | (1,776 | ) | (1,080 | ) | |||||
Net increase (decrease) in cash and cash equivalents | $ | (9,299 | ) | $ | 239,014 | $ | 56,139 | ||||
Our principal sources of liquidity are our cash, cash equivalents, and investments in marketable securities. As of December 31, 2016, we had $539.3 million of cash, cash equivalents, and investments in marketable securities, which were held primarily in cash deposits, money market funds, U.S. government and agency securities, commercial paper, and corporate bonds. We consider all highly liquid investments with an original maturity of three months or less when purchased to be cash equivalents. Our investments in marketable securities are classified as available-for-sale. In November 2015, we completed our initial public offering in which we received total net proceeds of $245.7 million after deducting underwriting discounts and commissions of $14.7 million and other offering expenses of $6.9 million. Prior to our initial public offering, our principal source of liquidity was private sales of convertible preferred stock with total cash proceeds to us of $544.9 million.
In addition, we have a revolving secured credit facility that matures in November 2020. To date, no funds have been drawn under the credit facility, with $375.0 million remaining available. Loans under the credit facility bear interest at our option of (i) a base rate based on the highest of the prime rate, the federal funds rate plus 0.50%, and an adjusted LIBOR rate for a one-month interest period, in each case plus a margin ranging from 0.00% to 1.00%, or (ii) an adjusted LIBOR rate plus a margin ranging from 1.00% to 2.00%. This margin is determined based on our total leverage ratio for the preceding four fiscal quarters. We are obligated to pay other customary fees for a credit facility of this size and type including an annual administrative agent fee of $0.1 million and an unused commitment fee of 0.15%.
Historically we funded a majority of our MCAs from arrangements with third-party investors to purchase the future receivables related to these advances. During the first quarter of 2016, we fully transitioned from offering MCAs to facilitating the offering of loans by our bank partner. We purchase these loans from our bank partner and sell a majority of them to third-party investors, only retaining a small portion on our balance sheet.
We believe that our existing cash and cash equivalents, marketable securities, and availability under our line of credit will be sufficient to meet our working capital needs and planned capital expenditures for at least the next 12 months. From time to time, we may seek to raise additional capital through equity, equity-linked, and debt financing arrangements. We cannot be assured that any additional financing will be available to us on acceptable terms or at all.
60
Short-term restricted cash of $22.1 million as of December 31, 2016 reflects pledged cash deposited into savings accounts at the financial institutions that process our sellers' payments transactions and as collateral pursuant to an agreement with the originating bank for the Company's loan product. We use the restricted cash to secure letters of credit with these financial institutions to provide collateral for liabilities arising from cash flow timing differences in the processing of these payments. We have recorded this amount as a current asset on our consolidated balance sheets given the short-term nature of these cash flow timing differences and that there is no minimum time frame during which the cash must remain restricted.
Long-term restricted cash of $14.6 million as of December 31, 2016 reflects cash deposited into money market accounts that is used as collateral pursuant to multi-year lease agreements entered into in 2012 and 2014 for our office buildings. The Company has recorded this amount as a non-current asset on the consolidated balance sheets as the terms extend beyond one year.
We experience significant day-to-day fluctuations in our cash and cash equivalents, settlements receivable, and customers payable, and hence working capital. These fluctuations are primarily due to:
• | Timing of period end. For periods that end on a weekend or a bank holiday, our cash and cash equivalents, settlements receivable, and customers payable amounts typically will be more than for periods ending on a weekday, as we settle to our sellers for payment processing activity on business days; and |
• | Fluctuations in daily GPV. When daily GPV increases, our cash and cash equivalents, settlements receivable, and customers payable amounts increase. Typically our cash, cash equivalents, settlements receivable, and customers payable balances at period end represent one to four days of receivables and disbursements to be made in the subsequent period. Customers payable and settlements receivable balances typically move in tandem, as pay-out and pay-in largely occur on the same business day. However, customers payable balances will be greater in amount than settlements receivable balances due to the fact that a subset of funds are held due to unlinked bank accounts, risk holds, and chargebacks. Holidays and day-of-week may also cause significant volatility in daily GPV amounts. |
Cash Flows from Operating Activities
Cash used in operating activities consisted of net loss adjusted for certain non-cash items including depreciation and amortization, share-based compensation expense, provision for transaction losses, provision for uncollectible MCAs, deferred income taxes, and gain (loss) on disposal of property and equipment, as well as the effect of changes in operating assets and liabilities, including working capital.
For the year ended December 31, 2016, cash provided by operating activities was $23.1 million, primarily as a result of a net loss of $171.6 million, offset by non-cash items consisting of share-based compensation expense of $138.8 million, provision for transaction losses of $50.8 million, depreciation and amortization of intangible assets of $37.7 million, and provision for uncollectible receivables related to MCAs of $1.2 million. Additional uses of cash were from changes in our operating assets and liabilities, including purchase of loans held for sale of $669.0 million, increases in settlements receivable of $178.4 million and other current assets of $15.0 million, and charge-offs and recoveries to accrued transaction losses of $47.9 million. This activity was offset in part by proceeds from sales and principal repayments of loans held for sale of $627.6 million, increases in customers payable of $172.4 million and other current liabilities of $44.1 million, and decreases in merchant cash advance receivable of $31.1 million.
For the year ended December 31, 2015, cash provided by operating activities was $21.1 million, primarily as a result of a net loss of $179.8 million, offset by non-cash items consisting of share-based compensation expense of $82.3 million, provision for transaction losses of $43.4 million, provision for uncollectible receivables related to MCAs of $6.2 million, and depreciation and amortization of intangible assets of $27.6 million. Additional cash provided from changes in our operating assets and liabilities, including increases in customers payable of $69.5 million, accrued expenses of $21.5 million, other current liabilities of $19.8 million, other liabilities of $11.1 million, and accounts payable of $7.8 million was partially offset by charge-offs and recoveries to accrued transaction losses of $34.7 million, and increases in settlements receivable of $27.4 million, merchant cash advance receivable of $13.4 million, and other current assets of $12.4 million.
For the year ended December 31, 2014, cash used by operating activities was $112.4 million, as a result of a net loss of $154.1 million, offset by non-cash items consisting of share-based compensation expense of $36.1 million, depreciation and amortization of intangible assets of $18.6 million, and provision for transaction losses of $18.5 million. Additional cash used by changes in our operating assets and liabilities, including increases in settlements receivable of $50.4 million, merchant cash
61
advance receivable of $31.7 million, charge-offs and recoveries to accrued transaction losses of $17.5 million, and other current assets of $14.3 million, were offset by increases in customers payable of $50.0 million, other liabilities of $23.3 million, and accrued expenses of $8.1 million.
Cash Flows from Investing Activities
Cash flows used in investing activities primarily relate to capital expenditures to support our growth, investments in marketable securities, changes in restricted cash, and business acquisitions.
For the year ended December 31, 2016, cash used in investing activities was $122.7 million as a result of the purchase of marketable securities of $164.8 million, offset in part by proceeds from maturities and sales of marketable securities of $77.4 million. Additional uses of cash were as a result of capital expenditures of $25.4 million, business acquisitions of $1.4 million, an increase of restricted cash of $8.5 million, and acquisition of intangible assets of $0.4 million, partially offset by proceeds from the sale of property and equipment of $0.3 million.
For the year ended December 31, 2015, cash used in investing activities was $45.1 million as a result of capital expenditures of $37.4 million, business acquisitions of $4.5 million, an increase of restricted cash of $1.9 million, and acquisition of intangible assets of $1.3 million.
For the year ended December 31, 2014, cash used in investing activities was $24.6 million as a result of capital expenditures of $28.8 million and an increase in restricted cash of $7.1 million, partially offset by business acquisitions net of cash acquired of $11.7 million from our acquisition of Caviar.
Cash Flows from Financing Activities
For the year ended December 31, 2016, cash provided by financing activities was $90.7 million as a result of proceeds from issuances of common stock from the exercise of options, warrants, and employee stock purchase plan of $96.4 million, offset by payments in offering costs related to our initial public offering of $5.5 million and payments on capital lease obligations of $0.2 million.
For the year ended December 31, 2015, cash provided by financing activities was $264.8 million as a result of proceeds from our initial public offering of $251.3 million, proceeds from our issuance of convertible preferred stock of $30.0 million, proceeds from the exercise of stock options of $13.8 million, and an excess tax benefit from share-based award activity of $1.1 million, offset by principal payments on debt of $30.0 million and payments of debt issuance costs of $1.4 million.
For the year ended December 31, 2014, cash provided by financing activities was $194.2 million as a result of proceeds from our issuance of convertible preferred stock of $148.7 million, proceeds from long-term debt under our revolving credit facility of $30.0 million, proceeds from the exercise of stock options of $14.1 million, and an excess tax benefit from share-based award activity of $1.3 million.
Contractual Obligations and Commitments
Our principal commitments consist of operating leases, capital leases, and purchase commitments. The following table summarizes our commitments to settle contractual obligations in cash as of December 31, 2016.
Payments due by period | |||||||||||||||||||
Total | Less than 1 year | 1 - 3 years | 3 - 5 years | More than 5 years | |||||||||||||||
(in thousands) | |||||||||||||||||||
Operating leases | 116,703 | 16,639 | 32,192 | 31,929 | 35,943 | ||||||||||||||
Capital leases | 1,882 | 694 | 1,187 | 1 | — | ||||||||||||||
Purchase commitments | 18,077 | 18,077 | — | — | — | ||||||||||||||
Total | $ | 136,662 | $ | 35,410 | $ | 33,379 | $ | 31,930 | $ | 35,943 | |||||||||
62
Lease Commitments
We have entered into various non-cancelable operating leases for certain offices with contractual lease periods expiring between 2017 and 2025. We recognized total rental expenses under operating leases of $11.3 million, $12.8 million, and $11.4 million during the years ended December 31, 2016, 2015, and 2014, respectively.
Purchase commitments
We had non-cancelable purchase obligations to hardware suppliers for $18.1 million for the year ended December 31, 2016.
Off-balance Sheet Arrangements
We do not have any off-balance sheet arrangements during the periods presented.
Critical Accounting Policies and Estimates
Our discussion and analysis of our financial condition and results of operations are based upon our financial statements, which have been prepared in accordance with GAAP. GAAP requires us to make certain estimates and judgments that affect the amounts reported in our financial statements. We base our estimates on historical experience, anticipated future trends, and other assumptions we believe to be reasonable under the circumstances. Because these accounting policies require significant judgment, our actual results may differ materially from our estimates.
We believe accounting policies and the assumptions and estimates associated with revenue recognition, accrued transaction losses, valuation of loans held for sale, business combinations, goodwill and intangible assets, income taxes, and share-based compensation to have the greatest potential effect on our consolidated financial statements. Therefore, we consider these to be our critical accounting policies and estimates. For further information on all of our significant accounting policies, see Note 1 of the accompanying notes to our consolidated financial statements.
Recent Accounting Pronouncements
See “Recent Accounting Pronouncements” in Note 1 of the accompanying notes to our consolidated financial statements.
ITEM 7A. QUANTITATIVE AND QUALITATIVE DISCLOSURES ABOUT MARKET RISK
We have operations both within the United States and globally, and we are exposed to market risks in the ordinary course of our business, including the effects of interest rate changes and foreign currency fluctuations. Information relating to quantitative and qualitative disclosures about these market risks is described below.
Interest Rate Sensitivity
Cash and cash equivalents and marketable securities as of December 31, 2016, were held primarily in cash deposits, money market funds, U.S. government and agency securities, commercial paper, and corporate bonds. The fair value of our cash, cash equivalents, and marketable securities would not be significantly affected by either an increase or decrease in interest rates due mainly to the short-term nature of a majority of these instruments. Additionally, we have the ability to hold these instruments until maturity if necessary to reduce our risk. Any future borrowings incurred under our credit facility would accrue interest at a floating rate based on a formula tied to certain market rates at the time of incurrence (as described above). A hypothetical 10% increase or decrease in interest rates would not have a material effect on our financial results.
Foreign Currency Risk
Most of our revenue is earned in U.S. dollars, and therefore our revenue is not currently subject to significant foreign currency risk. Our foreign operations are denominated in the currencies of the countries in which our operations are located, and may be subject to fluctuations due to changes in foreign currency exchange rates, particularly changes in the Japanese Yen, Canadian Dollar, and Australian Dollar. Fluctuations in foreign currency exchange rates may cause us to recognize transaction
63
gains and losses in our statement of operations. A 10% increase or decrease in current exchange rates would not have a material impact on our financial results.
64
Item 8. FINANCIAL STATEMENTS AND SUPPLEMENTARY DATA
SQUARE, INC.
INDEX TO THE CONSOLIDATED FINANCIAL STATEMENTS
Page No | |
The supplementary financial information required by this Item 8 is included in Part II, Item 7 under the caption "Quarterly Results of Operations," which is incorporated herein by reference.
65
REPORT OF INDEPENDENT REGISTERED PUBLIC ACCOUNTING FIRM
The Board of Directors and Stockholders
Square, Inc.:
We have audited the accompanying consolidated balance sheets of Square, Inc. and subsidiaries (the Company) as of December 31, 2016 and 2015, and the related consolidated statements of operations, comprehensive loss, stockholders’ equity, and cash flows for each of the years in the three-year period ended December 31, 2016. These consolidated financial statements are the responsibility of the Company’s management. Our responsibility is to express an opinion on these consolidated financial statements based on our audits.
We conducted our audits in accordance with the standards of the Public Company Accounting Oversight Board (United States). Those standards require that we plan and perform the audit to obtain reasonable assurance about whether the financial statements are free of material misstatement. An audit includes examining, on a test basis, evidence supporting the amounts and disclosures in the financial statements. An audit also includes assessing the accounting principles used and significant estimates made by management, as well as evaluating the overall financial statement presentation. We believe that our audits provide a reasonable basis for our opinion.
In our opinion, the consolidated financial statements referred to above present fairly, in all material respects, the financial position of Square, Inc. and subsidiaries as of December 31, 2016 and 2015, and the results of their operations and their cash flows for each of the years in the three‑year period ended December 31, 2016, in conformity with U.S. generally accepted accounting principles.
We also have audited, in accordance with the standards of the Public Company Accounting Oversight Board (United States), Square, Inc.’s internal control over financial reporting as of December 31, 2016, based on criteria established in Internal Control - Integrated Framework (2013) issued by the Committee of Sponsoring Organizations of the Treadway Commission (COSO), and our report dated February 24, 2017 expressed an unqualified opinion on the effectiveness of the Company’s internal control over financial reporting.
/s/ KPMG LLP
San Francisco, California
February 24, 2017
66
REPORT OF INDEPENDENT REGISTERED PUBLIC ACCOUNTING FIRM
The Board of Directors and Stockholders
Square, Inc.:
We have audited Square, Inc.’s (the Company) internal control over financial reporting as of December 31, 2016, based on criteria established in Internal Control - Integrated Framework (2013) issued by the Committee of Sponsoring Organizations of the Treadway Commission (COSO). Square, Inc.’s management is responsible for maintaining effective internal control over financial reporting and for its assessment of the effectiveness of internal control over financial reporting, included in the accompanying Management’s Report on Internal Control Over Financial Reporting (Item 9A). Our responsibility is to express an opinion on the Company’s internal control over financial reporting based on our audit.
We conducted our audit in accordance with the standards of the Public Company Accounting Oversight Board (United States). Those standards require that we plan and perform the audit to obtain reasonable assurance about whether effective internal control over financial reporting was maintained in all material respects. Our audit included obtaining an understanding of internal control over financial reporting, assessing the risk that a material weakness exists, and testing and evaluating the design and operating effectiveness of internal control based on the assessed risk. Our audit also included performing such other procedures as we considered necessary in the circumstances. We believe that our audit provides a reasonable basis for our opinion.
A company’s internal control over financial reporting is a process designed to provide reasonable assurance regarding the reliability of financial reporting and the preparation of financial statements for external purposes in accordance with generally accepted accounting principles. A company’s internal control over financial reporting includes those policies and procedures that (1) pertain to the maintenance of records that, in reasonable detail, accurately and fairly reflect the transactions and dispositions of the assets of the company; (2) provide reasonable assurance that transactions are recorded as necessary to permit preparation of financial statements in accordance with generally accepted accounting principles, and that receipts and expenditures of the company are being made only in accordance with authorizations of management and directors of the company; and (3) provide reasonable assurance regarding prevention or timely detection of unauthorized acquisition, use, or disposition of the company’s assets that could have a material effect on the financial statements.
Because of its inherent limitations, internal control over financial reporting may not prevent or detect misstatements. Also, projections of any evaluation of effectiveness to future periods are subject to the risk that controls may become inadequate because of changes in conditions, or that the degree of compliance with the policies or procedures may deteriorate.
In our opinion, Square, Inc. maintained, in all material respects, effective internal control over financial reporting as of December 31, 2016, based on criteria established in Internal Control - Integrated Framework (2013) issued by the Committee of Sponsoring Organizations of the Treadway Commission (COSO).
We also have audited, in accordance with the standards of the Public Company Accounting Oversight Board (United States), the consolidated balance sheets of Square, Inc. and subsidiaries as of December 31, 2016 and 2015, and the related consolidated statements of operations, comprehensive loss, stockholders’ equity, and cash flows for each of the years in the three-year period ended December 31, 2016, and our report dated February 24, 2017 expressed an unqualified opinion on those consolidated financial statements.
/s/ KPMG LLP
San Francisco, California
February 24, 2017
67
SQUARE, INC.
CONSOLIDATED BALANCE SHEETS
(In thousands, except share and per share data)
December 31, | |||||||
2016 | 2015 | ||||||
Assets | |||||||
Current assets: | |||||||
Cash and cash equivalents | $ | 452,030 | $ | 461,329 | |||
Short-term investments | 59,901 | — | |||||
Restricted cash | 22,131 | 13,537 | |||||
Settlements receivable | 321,102 | 142,727 | |||||
Customer funds held | 43,574 | 9,446 | |||||
Loans held for sale | 42,144 | 604 | |||||
Merchant cash advance receivable, net | 4,212 | 36,473 | |||||
Other current assets | 56,331 | 41,447 | |||||
Total current assets | 1,001,425 | 705,563 | |||||
Property and equipment, net | 88,328 | 87,222 | |||||
Goodwill | 57,173 | 56,699 | |||||
Acquired intangible assets, net | 19,292 | 26,776 | |||||
Long-term investments | 27,366 | — | |||||
Restricted cash | 14,584 | 14,686 | |||||
Other assets | 3,194 | 3,826 | |||||
Total assets | $ | 1,211,362 | $ | 894,772 | |||
Liabilities and Stockholders’ Equity | |||||||
Current liabilities: | |||||||
Accounts payable | $ | 12,602 | $ | 18,869 | |||
Customers payable | 388,058 | 215,365 | |||||
Customer funds obligation | 43,574 | 9,446 | |||||
Accrued transaction losses | 20,064 | 17,176 | |||||
Accrued expenses | 39,543 | 44,401 | |||||
Other current liabilities | 73,623 | 28,945 | |||||
Total current liabilities | 577,464 | 334,202 | |||||
Debt (Note 11) | — | — | |||||
Other liabilities | 57,745 | 52,522 | |||||
Total liabilities | 635,209 | 386,724 | |||||
Commitments and contingencies (Note 16) | |||||||
Stockholders’ equity: | |||||||
Preferred stock, $0.0000001 par value: 100,000,000 shares authorized at December 31, 2016 and December 31, 2015. None issued and outstanding at December 31, 2016 and December 31, 2015. | — | — | |||||
Class A common stock, $0.0000001 par value: 1,000,000,000 shares authorized at December 31, 2016 and December 31, 2015; 198,746,620 and 31,717,133 issued and outstanding at December 31, 2016 and December 31, 2015, respectively. | — | — | |||||
Class B common stock, $0.0000001 par value: 500,000,000 shares authorized at December 31, 2016 and December 31, 2015; 165,800,756 and 303,232,312 issued and outstanding at December 31, 2016 and December 31, 2015, respectively. | — | — | |||||
Additional paid-in capital | 1,357,381 | 1,116,882 | |||||
Accumulated other comprehensive loss | (1,989 | ) | (1,185 | ) | |||
Accumulated deficit | (779,239 | ) | (607,649 | ) | |||
Total stockholders’ equity | 576,153 | 508,048 | |||||
Total liabilities and stockholders’ equity | $ | 1,211,362 | $ | 894,772 | |||
See accompanying notes to consolidated financial statements.
68
SQUARE, INC.
CONSOLIDATED STATEMENTS OF OPERATIONS
(In thousands, except per share data)
Year Ended December 31, | |||||||||||
2016 | 2015 | 2014 | |||||||||
Revenue: | |||||||||||
Transaction-based revenue | $ | 1,456,160 | $ | 1,050,445 | $ | 707,799 | |||||
Starbucks transaction-based revenue | 78,903 | 142,283 | 123,024 | ||||||||
Subscription and services-based revenue | 129,351 | 58,013 | 12,046 | ||||||||
Hardware revenue | 44,307 | 16,377 | 7,323 | ||||||||
Total net revenue | 1,708,721 | 1,267,118 | 850,192 | ||||||||
Cost of revenue: | |||||||||||
Transaction-based costs | 943,200 | 672,667 | 450,858 | ||||||||
Starbucks transaction-based costs | 69,761 | 165,438 | 150,955 | ||||||||
Subscription and services-based costs | 43,132 | 22,470 | 2,973 | ||||||||
Hardware costs | 68,562 | 30,874 | 18,330 | ||||||||
Amortization of acquired technology | 8,028 | 5,639 | 1,002 | ||||||||
Total cost of revenue | 1,132,683 | 897,088 | 624,118 | ||||||||
Gross profit | 576,038 | 370,030 | 226,074 | ||||||||
Operating expenses: | |||||||||||
Product development | 268,537 | 199,638 | 144,637 | ||||||||
Sales and marketing | 173,876 | 145,618 | 112,577 | ||||||||
General and administrative | 251,993 | 143,466 | 94,220 | ||||||||
Transaction, loan and advance losses | 51,235 | 54,009 | 24,081 | ||||||||
Amortization of acquired customer assets | 850 | 1,757 | 1,050 | ||||||||
Total operating expenses | 746,491 | 544,488 | 376,565 | ||||||||
Operating loss | (170,453 | ) | (174,458 | ) | (150,491 | ) | |||||
Interest and other (income) expense, net | (780 | ) | 1,613 | 2,162 | |||||||
Loss before income tax | (169,673 | ) | (176,071 | ) | (152,653 | ) | |||||
Provision for income taxes | 1,917 | 3,746 | 1,440 | ||||||||
Net loss | (171,590 | ) | (179,817 | ) | (154,093 | ) | |||||
Deemed dividend on Series E preferred stock | — | (32,200 | ) | — | |||||||
Net loss attributable to common stockholders | $ | (171,590 | ) | $ | (212,017 | ) | $ | (154,093 | ) | ||
Net loss per share attributable to common stockholders: | |||||||||||
Basic | $ | (0.50 | ) | $ | (1.24 | ) | $ | (1.08 | ) | ||
Diluted | $ | (0.50 | ) | $ | (1.24 | ) | $ | (1.08 | ) | ||
Weighted-average shares used to compute net loss per share attributable to common stockholders: | |||||||||||
Basic | 341,555 | 170,498 | 142,042 | ||||||||
Diluted | 341,555 | 170,498 | 142,042 | ||||||||
See accompanying notes to consolidated financial statements.
69
SQUARE, INC.
CONSOLIDATED STATEMENTS OF COMPREHENSIVE LOSS
(In thousands)
Year Ended December 31, | |||||||||||
2016 | 2015 | 2014 | |||||||||
Net loss | $ | (171,590 | ) | $ | (179,817 | ) | $ | (154,093 | ) | ||
Net foreign currency translation adjustments | (716 | ) | (356 | ) | (114 | ) | |||||
Net unrealized loss on revaluation of intercompany loans | (11 | ) | (22 | ) | — | ||||||
Net unrealized loss on marketable securities | (77 | ) | — | — | |||||||
Total comprehensive loss | $ | (172,394 | ) | $ | (180,195 | ) | $ | (154,207 | ) | ||
See accompanying notes to consolidated financial statements.
70
SQUARE, INC.
CONSOLIDATED STATEMENTS OF STOCKHOLDERS' EQUITY
(In thousands, except for number of shares)
Convertible preferred stock | Class A and B common stock | Additional paid-in | Accumulated other comprehensive | Accumulated | Total stockholders’ | |||||||||||||||||||||||||
Shares | Amount | Shares | Amount | capital | loss | deficit | equity | |||||||||||||||||||||||
Balance at December 31, 2013 | 134,528,520 | $ | 366,197 | 138,017,900 | $ | — | $ | 38,329 | $ | (693 | ) | $ | (241,539 | ) | $ | 162,294 | ||||||||||||||
Net loss | — | — | — | — | — | — | (154,093 | ) | (154,093 | ) | ||||||||||||||||||||
Shares issued in connection with: | ||||||||||||||||||||||||||||||
Exercise of stock options | — | — | 9,403,147 | — | 8,685 | — | — | 8,685 | ||||||||||||||||||||||
Issuance of common stock in connection with business combinations | — | — | 8,384,156 | — | 59,576 | — | — | 59,576 | ||||||||||||||||||||||
Issuance of common stock | — | — | 24,220 | — | — | — | — | — | ||||||||||||||||||||||
Series E preferred stock financing | 9,700,289 | 148,748 | — | — | — | — | — | 148,748 | ||||||||||||||||||||||
Vesting of early exercised stock options | — | — | — | — | 11,128 | — | — | 11,128 | ||||||||||||||||||||||
Contribution of preferred stock | (8,976,000 | ) | — | — | — | — | — | — | — | |||||||||||||||||||||
Repurchase of common stock | — | — | (1,225,740 | ) | — | — | — | — | — | |||||||||||||||||||||
Change in other comprehensive loss | — | — | — | — | — | (114 | ) | — | (114 | ) | ||||||||||||||||||||
Share-based compensation | — | — | — | — | 36,100 | — | — | 36,100 | ||||||||||||||||||||||
Tax benefit from share-based award activity | — | — | — | — | 1,348 | — | — | 1,348 | ||||||||||||||||||||||
Balance at December 31, 2014 | 135,252,809 | $ | 514,945 | 154,603,683 | $ | — | $ | 155,166 | $ | (807 | ) | $ | (395,632 | ) | $ | 273,672 | ||||||||||||||
Net loss | — | — | — | — | — | — | (179,817 | ) | (179,817 | ) | ||||||||||||||||||||
Shares issued in connection with: | ||||||||||||||||||||||||||||||
Issuance of common stock upon initial public offering, net of issuance costs | — | — | 29,700,000 | 245,726 | — | — | 245,726 | |||||||||||||||||||||||
Series E preferred stock financing | 1,940,058 | 29,952 | — | — | — | — | — | 29,952 | ||||||||||||||||||||||
Conversion of Series A, B, C, D & E preferred stock upon initial public offering to common stock | (137,192,867 | ) | (544,897 | ) | 137,192,867 | 544,897 | — | — | — | |||||||||||||||||||||
Deemed dividend on Series E preferred stock | — | — | 10,299,696 | — | 32,200 | — | (32,200 | ) | — | |||||||||||||||||||||
Exercise of stock options | — | — | 5,544,785 | — | 14,766 | — | — | 14,766 | ||||||||||||||||||||||
Issuance of common stock related to acquisitions | — | — | 3,591,014 | — | 35,776 | — | — | 35,776 | ||||||||||||||||||||||
Issuance of common stock | — | — | 3,777 | — | — | — | — | — | ||||||||||||||||||||||
Vesting of early exercised stock options | — | — | — | — | 4,958 | — | — | 4,958 | ||||||||||||||||||||||
Contribution of common stock | — | — | (5,068,238 | ) | — | — | — | — | — | |||||||||||||||||||||
Repurchase of common stock | — | — | (918,139 | ) | — | — | — | — | — | |||||||||||||||||||||
Change in other comprehensive loss | — | — | — | — | — | (378 | ) | — | (378 | ) | ||||||||||||||||||||
Share-based compensation | — | — | — | — | 82,292 | — | — | 82,292 | ||||||||||||||||||||||
Tax benefit from share-based award activity | — | — | — | — | 1,101 | — | — | 1,101 | ||||||||||||||||||||||
Balance at December 31, 2015 | — | $ | — | 334,949,445 | $ | — | $ | 1,116,882 | $ | (1,185 | ) | $ | (607,649 | ) | $ | 508,048 | ||||||||||||||
Net loss | — | — | — | — | — | — | (171,590 | ) | (171,590 | ) | ||||||||||||||||||||
Shares issued in connection with: | ||||||||||||||||||||||||||||||
71
Convertible preferred stock | Class A and B common stock | Additional paid-in | Accumulated other comprehensive | Accumulated | Total stockholders’ | |||||||||||||||||||||||||
Shares | Amount | Shares | Amount | capital | loss | deficit | equity | |||||||||||||||||||||||
Exercise of stock options and warrants | — | — | 24,413,821 | — | 82,438 | — | — | 82,438 | ||||||||||||||||||||||
Purchases under employee stock purchase plan | — | — | 1,852,900 | — | 14,201 | — | — | 14,201 | ||||||||||||||||||||||
Vesting of RSUs | — | — | 3,392,726 | — | — | — | — | — | ||||||||||||||||||||||
Vesting of early exercised stock options | — | — | — | — | 2,313 | — | — | 2,313 | ||||||||||||||||||||||
Cancellation of shares related to business combinations | — | — | (228 | ) | — | — | — | — | — | |||||||||||||||||||||
Repurchase of common stock | — | — | (61,288 | ) | — | — | — | — | — | |||||||||||||||||||||
Change in other comprehensive loss | — | — | — | — | — | (804 | ) | — | (804 | ) | ||||||||||||||||||||
Share-based compensation | — | — | — | — | 141,547 | — | — | 141,547 | ||||||||||||||||||||||
Balance at December 31, 2016 | — | $ | — | 364,547,376 | $ | — | $ | 1,357,381 | $ | (1,989 | ) | $ | (779,239 | ) | $ | 576,153 | ||||||||||||||
See accompanying notes to consolidated financial statements.
72
SQUARE, INC.
CONSOLIDATED STATEMENTS OF CASH FLOWS
(In thousands)
Year Ended December 31, | |||||||||||
2016 | 2015 | 2014 | |||||||||
Cash flows from operating activities: | |||||||||||
Net loss | $ | (171,590 | ) | $ | (179,817 | ) | $ | (154,093 | ) | ||
Adjustments to reconcile net loss to net cash (used in) provided by operating activities: | |||||||||||
Depreciation and amortization | 37,745 | 27,626 | 18,586 | ||||||||
Share-based compensation | 138,786 | 82,292 | 36,100 | ||||||||
Excess tax benefit from share-based payment activity | — | (1,101 | ) | (1,348 | ) | ||||||
Provision for transaction losses | 50,819 | 43,379 | 18,478 | ||||||||
Provision for uncollectible receivables related to merchant cash advances | 1,159 | 6,240 | 2,431 | ||||||||
Deferred provision for income taxes | 58 | 26 | (2,664 | ) | |||||||
(Gain) loss on disposal of property and equipment | (49 | ) | 270 | 133 | |||||||
Changes in operating assets and liabilities: | |||||||||||
Settlements receivable | (178,405 | ) | (27,420 | ) | (50,361 | ) | |||||
Customer funds held | (34,128 | ) | (6,462 | ) | (2,985 | ) | |||||
Purchase of loans held for sale | (668,976 | ) | (816 | ) | — | ||||||
Proceeds from sales and principal payments of loans held for sale | 627,627 | 21 | — | ||||||||
Merchant cash advance receivable | 31,102 | (13,411 | ) | (31,733 | ) | ||||||
Other current assets | (14,986 | ) | (12,430 | ) | (14,323 | ) | |||||
Other assets | 631 | 1,220 | (636 | ) | |||||||
Accounts payable | (2,147 | ) | 7,831 | 179 | |||||||
Customers payable | 172,446 | 69,547 | 49,971 | ||||||||
Customer funds obligation | 34,128 | 6,462 | 2,985 | ||||||||
Charge-offs and recoveries to accrued transaction losses | (47,931 | ) | (34,655 | ) | (17,514 | ) | |||||
Accrued expenses | (409 | ) | 21,450 | 8,113 | |||||||
Other current liabilities | 44,102 | 19,760 | 3,007 | ||||||||
Other liabilities | 3,149 | 11,111 | 23,295 | ||||||||
Net cash (used in) provided by operating activities | 23,131 | 21,123 | (112,379 | ) | |||||||
Cash flows from investing activities: | |||||||||||
Purchase of marketable securities | (164,766 | ) | — | — | |||||||
Maturities of marketable securities | 43,200 | — | — | ||||||||
Sales of marketable securities | 34,222 | — | — | ||||||||
Purchase of property and equipment | (25,433 | ) | (37,432 | ) | (28,794 | ) | |||||
Proceeds from sale of property and equipment | 296 | — | — | ||||||||
Payment for acquisition of intangible assets | (400 | ) | (1,286 | ) | (400 | ) | |||||
Increases in restricted cash | (8,492 | ) | (1,878 | ) | (7,075 | ) | |||||
Business acquisitions (net of cash acquired) | (1,360 | ) | (4,500 | ) | 11,715 | ||||||
Net cash used in investing activities: | (122,733 | ) | (45,096 | ) | (24,554 | ) | |||||
Cash flows from financing activities: | |||||||||||
Proceeds from issuance of preferred stock, net | — | 29,952 | 148,748 | ||||||||
Proceeds from issuance of common stock upon initial public offering, net of offering costs | — | 251,257 | — | ||||||||
Payments of offering costs related to initial public offering | (5,530 | ) | — | — | |||||||
Proceeds from debt | — | — | 30,000 | ||||||||
Principal payments on debt | — | (30,000 | ) | — | |||||||
Payments of debt issuance costs | — | (1,387 | ) | — | |||||||
Principal payments on capital lease obligation | (168 | ) | — | — | |||||||
Proceeds from issuances of common stock from the exercise of options and employee stock purchase plan | 96,439 | 13,840 | 14,056 | ||||||||
Excess tax benefit from share-based payment award | — | 1,101 | 1,348 | ||||||||
Net cash provided by financing activities | 90,741 | 264,763 | 194,152 | ||||||||
Effect of foreign exchange rate on cash and cash equivalents | (438 | ) | (1,776 | ) | (1,080 | ) | |||||
73
Net increase (decrease) in cash and cash equivalents | (9,299 | ) | 239,014 | 56,139 | |||||||
Cash and cash equivalents, beginning of the year | 461,329 | 222,315 | 166,176 | ||||||||
Cash and cash equivalents, end of the year | $ | 452,030 | $ | 461,329 | $ | 222,315 | |||||
74
SQUARE, INC.
NOTES TO THE CONSOLIDATED FINANCIAL STATEMENTS
NOTE 1 - DESCRIPTION OF BUSINESS AND SUMMARY OF SIGNIFICANT ACCOUNTING POLICIES
Business
Square, Inc. (together with its subsidiaries, Square or the Company) is a cohesive commerce ecosystem that helps its sellers start, run, and grow their businesses – from managed payments solutions to point of sale, hardware to software, loans to payroll and more. Businesses and individuals can also use Square Cash, an easy way to send and receive money, as well as Caviar, a food ordering service for restaurants. Square was founded in 2009 and is headquartered in San Francisco, with offices in the United States, Canada, Japan, and Australia.
Out of Period Adjustments to Reserve for Transaction Losses
During the second quarter of the year ended December 31, 2016, the Company recorded an out of period adjustment of $6.0 million to transaction, loan and advance losses as a result of a correction to the calculation of its reserve for transaction losses. The adjustment was recorded to correct an understatement of transaction losses in prior periods. Of the total amount of this adjustment, $0.5 million is related to the three months ended March 31, 2016, and $2.6 million and $1.6 million is related to the years ended December 31, 2015 and 2014, respectively. The remaining $1.3 million is related to historical periods. The Company evaluated the error from a qualitative and quantitative perspective in accordance with the requirements of the Securities and Exchange Commission (SEC) Staff Accounting Bulletin No. 99, Materiality, (SAB 99) and concluded that such amounts were not material with respect to the operating loss or net loss for the current fiscal year or any previously reported consolidated financial statements. The correction of this error had no impact on the net cash flows from operations in any of the periods.
Immaterial Correction to Cash and Cash Equivalents
During the fourth quarter of 2016, the Company identified an error that impacted the consolidated balance sheet as of December 31, 2015, the consolidated statement of cash flows for the years ended December 31, 2015 and 2014, and in the unaudited condensed consolidated balance sheets and statements of cash flows as of and for the three months ended March 31, 2016, the six months ended June 30, 2016, and the nine months ended September 30, 2016, all related to the reported amounts of cash and cash equivalents. During these periods, the Company erroneously classified and reported certain customer funds as cash and cash equivalents instead of classifying these customer funds as a component of current assets. These customer funds represent cash balances stored by customers utilizing the Square Cash app that the customers can withdraw at a subsequent time or use to make transfers or payments, or customer cash that was in transit. The Company held these stored balances as short term deposits with a third-party bank.
The effect of correcting these errors was to decrease cash and cash equivalents at December 31, 2015 by $9.5 million and increase customer funds as a component of current assets of the same amount. These adjustments did not change current assets, total assets, or net loss.
The effect of the revisions within the consolidated statement of cash flows was to decrease the cash flows from operations and the change in cash and cash equivalents for the year ended December 31, 2015 by $6.5 million.
Management evaluated the materiality of the errors described above from a qualitative and quantitative perspective in accordance with the requirements of the SAB 99. Based on such evaluation, the Company has concluded that their correction would not be material to any individual prior period.
Changes to the Description of Revenue and Cost of Revenue Line Items
The Company has renamed some of the revenue and cost of revenues financial statement line items in its consolidated statements of operations to better describe how the Company monetizes its product offerings. Accordingly, the previously presented transaction revenue and Starbucks transaction revenue have been renamed transaction-based revenue and Starbucks transaction-based revenue, respectively, while software and data product revenue has been renamed subscription and services-based revenue. The products and services revenues included in the previously presented line items remains the same. The cost of revenues line items have similarly been renamed while the components of costs of revenues in the line items have remained the same.
75
Litigation Settlement
On June 8, 2016, a final, definitive settlement agreement (Settlement Agreement) was entered into by Robert E. Morley, REM Holdings 3, LLC, Jack Dorsey, Jim McKelvey, and the Company. The Settlement Agreement required an aggregate total payment of $50.0 million to plaintiffs, including meaningful contributions by Mr. Dorsey and Mr. McKelvey. The Company made a payment of $48.0 million to plaintiffs and met its obligations under the Settlement Agreement. This amount was classified within general and administrative expenses on the consolidated statements of operations for the year ended December 31, 2016. On June 17, 2016, the Court entered an Order dismissing the complaints in their entirety, with prejudice.
Basis of Presentation
The accompanying consolidated financial statements have been prepared in accordance with accounting principles generally accepted in the United States of America (U.S. GAAP) and include the accounts of the Company and its subsidiaries. All intercompany transactions and balances have been eliminated in consolidation.
Use of Estimates
The preparation of the Company’s consolidated financial statements in conformity with U.S. GAAP requires management to make estimates and assumptions that affect the reported amounts of assets, liabilities, revenue and expenses, as well as related disclosure of contingent assets and liabilities. Actual results could differ from the Company’s estimates. To the extent that there are material differences between these estimates and actual results, the Company’s financial condition or operating results will be materially affected. The Company bases its estimates on past experience and other assumptions that the Company believes are reasonable under the circumstances, and the Company evaluates these estimates on an ongoing basis.
Significant estimates, judgments, and assumptions in these consolidated financial statements include, but are not limited to, those related to revenue recognition, accrued transaction losses, valuation of loans held for sale, business combinations, goodwill and intangible assets, income taxes, and share-based compensation.
Revenue Recognition
The Company recognizes revenue when persuasive evidence of an arrangement exists, delivery of obligations to its customers has occurred, the related fees are fixed or determinable, and collectibility is reasonably assured. Revenue is generated from the following:
Transaction-based revenue and Starbucks transaction-based revenue
The Company charges its sellers a transaction fee for managed payments solutions that is generally calculated as a percentage of the total transaction amount processed. The Company selectively offers custom pricing for larger sellers. The Company had a processing agreement with Starbucks, for certain Starbucks-owned stores in the United States. As of December 31, 2016, Starbucks has completed its previously announced transition to another payments solution provider.
The Company recognizes the transaction fees a seller pays to the Company as revenue upon authorization of a transaction by the seller's customer's bank. Revenue is recognized net of refunds, which arise from reversals of transactions initiated by sellers. The Company acts as the merchant of record for its sellers and works directly with payment card networks and banks so that its sellers do not need to manage the complex systems, rules, and requirements of the payments industry. As the merchant of record, Square is liable for settlement of the transactions the Company processes for its sellers.
The gross transaction fees collected from sellers are recognized as revenue on a gross basis as the Company is the primary obligor to the seller and is responsible for processing the payment, has latitude in establishing pricing with respect to the sellers and other terms of service, has sole discretion in selecting the third party to perform the settlement, and assumes the credit risk for the transaction processed.
Subscription and services-based revenue
76
Subscription and services-based revenue primarily consists of revenue related to services provided through software offerings or deriving from the use of underlying data. Subscription and services-based revenue is primarily generated by Square Capital, Caviar, and other software as a service.
Square Capital facilitates a loan that is offered through a partnership with a Utah-chartered, member FDIC industrial bank that is generally repaid through withholding a percentage of the collections of the seller's receivables processed by the Company. During the first quarter of 2016, the Company fully transitioned from offering merchant cash advances (MCAs) to loans. The Company facilitates loans to sellers pre-qualified through an analysis of the aggregated data of the seller’s business which includes, but is not limited to, the seller’s historical processing volumes, transaction count, chargebacks, growth, and length of time as a Square customer. The loans are originated by a bank partner, from whom the Company purchases the loans obtaining all rights, title, and interest. The loans have no stated coupon rate but the seller is charged a one-time origination fee by the bank partner based upon their risk rating, which is derived primarily from processing activity. It is the Company’s intent to sell all of its rights, title, and interest in certain of these loans to third-party investors for an upfront fee when the loans are sold. The Company records the net amounts paid to the bank as the cost of the loans purchased and subsequently records a gain on sale of the loans to the third-party investors. The Company is retained by the third-party investors to service the loans and earns a servicing fee for facilitating the repayment of these receivables through its payments solutions. The Company recognizes the gain on sale of the loans to the investors as revenue upon transfer of title to investors. The Company records servicing revenue as servicing is delivered. For the loans which are not sold to third-party investors, the Company recognizes a portion of the expected seller repayments over the cost of the loans as revenue in proportion to the loan principal reduction.
Caviar is a courier order management app that facilitates food delivery services for restaurants. Caviar revenue consists of seller fees charged to restaurants, delivery fees, and service fees from consumers. All fees are recognized upon delivery of the food, net of refunds.
Software as a service provides the use of software on a stand-alone basis for a fee which is recognized ratably as service is provided.
Hardware revenue
Hardware revenue is generated from sales of contactless and chip readers, chip card readers, Square Stand, and third-party peripherals. Hardware revenue is recorded net of returns and is recognized upon delivery of hardware to the end customer. The Company considers delivery to have occurred once title and risk of loss has been transferred to the end customer. The Company records deferred revenue when it receives payments in advance of the delivery of products.
Cost of Revenue
Transaction-based costs and Starbucks transaction-based costs
Transaction-based costs and Starbucks transaction-based costs consist primarily of interchange fees set by payment card networks that are paid to the card-issuing financial institution, assessment fees paid to payment networks, fees paid to third-party payment card processors, and bank settlement fees. Contracts with third-party payment processors are typically for a term of two to four years.
Subscription and services-based costs
Subscription and services-based costs consist primarily of Caviar-related costs, which include payments to third-party couriers for deliveries and seller-facing equipment. Cost of revenue for other subscription and services-based costs consists primarily of the amortization related to the development of certain subscription and services-based products.
Hardware costs
Hardware costs consist of all product costs associated with contactless and chip readers, chip card readers, Square Stand, and third-party peripherals. Product costs include manufacturing-related overhead and personnel costs, certain royalties, packaging, and fulfillment costs.
77
Advertising Costs
Advertising costs are expensed as incurred and included in sales and marketing expense on the consolidated statements of operations. Total advertising costs for the years ended December 31, 2016, 2015, and 2014 were $58.3 million, $58.3 million, and $45.1 million, respectively.
Share-based Compensation
Share-based compensation expense relates to stock options, restricted stock units (RSUs), and purchases under the Company’s 2015 Employee Stock Purchase Plan (ESPP) which is measured based on the grant-date fair value. The Company estimates the fair value of stock options and employee stock purchase plan shares granted to employees on the date of grant using the Black-Scholes-Merton option valuation model. The fair value of RSUs is based on the market value of the Company's common stock on grant date. The Company recognizes compensation expense net of estimated forfeitures over the vesting period of the applicable award using the straight-line method. Forfeiture rates are estimated based on historical forfeitures of share-based awards and are adjusted to reflect changes in facts and circumstances, if any.
There are unvested restricted shares issued to employees of certain acquired companies. A portion of these awards is generally subject to continued post-acquisition employment, which is accounted for as post-acquisition share-based compensation expense. The shares are measured based on the grant-date fair value and recognized as compensation expense on a straight-line basis over the required service period.
Income Taxes
The Company reports income taxes under the asset and liability approach. Deferred tax assets and liabilities are recognized for the future tax consequences attributable to differences between the financial statement carrying amounts of existing assets and liabilities and their respective tax bases, as well as net operating loss and tax credit carryforwards. Deferred tax amounts are determined by using the enacted tax rates expected to be in effect when the temporary differences are expected to be recovered or settled. The effect on deferred tax assets and liabilities of a change in tax rates is recognized in income in the period that includes the enactment date. A valuation allowance reduces the deferred tax assets to the amount that is more likely than not to be realized.
The Company uses financial projections to support its net deferred tax assets, which contain significant assumptions and estimates of future operations. If such assumptions were to differ significantly from actual future results of operations, it may have a material impact on the Company’s ability to realize its deferred tax assets. At the end of each period, the Company assesses the ability to realize the deferred tax assets. If it is more likely than not that the Company would not realize the deferred tax assets, then the Company would establish a valuation allowance for all or a portion of the deferred tax assets.
The Company recognizes the effect of uncertain income tax positions only if those positions are more likely than not of being sustained. Recognized income tax positions are measured at the largest amount that has a greater than 50% likelihood of being realized. Changes in recognition or measurement are reflected in the period in which the change in judgment occurs. The Company records interest and penalties related to uncertain tax positions in the provision for income tax expense on the consolidated statements of operations.
Cash and Cash Equivalents and Restricted Cash
The Company considers all highly liquid investments, including money market funds, with an original maturity of three months or less when purchased to be cash equivalents.
As of December 31, 2016 and 2015, restricted cash of $22.1 million and $13.5 million, respectively, is related to pledged cash deposited into savings accounts at the financial institutions that process the Company's sellers' payment transactions and as collateral pursuant to an agreement with the originating bank for the Company's loan product. The Company uses the restricted cash to secure letters of credit with the financial institution to provide collateral for cash flow timing differences in the processing of these payments. The Company has recorded this amount as a current asset on the consolidated balance sheets due to the short-term nature of these cash flow timing differences and that there is no minimum time frame during which the cash must remain restricted.
78
As of December 31, 2016 and 2015, the remaining restricted cash of $14.6 million and $14.7 million, respectively, is primarily related to cash deposited into money market funds that is used as collateral pursuant to multi-year lease agreements entered into in 2012 and 2014 (Note 16). The Company has recorded this amount as a non-current asset on the consolidated balance sheets as the terms of the related leases extend beyond one year.
Concentration of Credit Risk
For the year ended December 31, 2016, the Company had no customer who accounted for greater than 10% of total net revenue. For the years ended December 31, 2015 and 2014, the Company had no customer other than Starbucks who accounted for greater than 10% of total net revenue. The Company terminated its relationship with Starbucks during the year ended December 31, 2016.
The Company had three third-party processors that represented approximately 52%, 35%, and 10% of settlements receivable as of December 31, 2016. The Company had three third-party processors that represented approximately 56%, 23%, and 16% of settlements receivable as of December 31, 2015.
Financial instruments that potentially subject the Company to concentrations of credit risk consist primarily of cash and cash equivalents, marketable securities, settlements receivables, customer funds held, merchant cash advance receivables, and loans held for sale. The associated risk of concentration for cash and cash equivalents is mitigated by banking with creditworthy institutions. At certain times, amounts on deposit exceed federal deposit insurance limits. The associated risk of concentration for marketable securities is mitigated by holding a diversified portfolio of highly rated investments. Settlements receivable are amounts due from well established payment processing companies and normally take one or two business days to settle which mitigates the associated risk of concentration. The associated risk of concentration for merchant cash advance receivables and loans held for sale is mitigated by ongoing credit evaluations of the Company’s customers.
Fair Value of Financial Instruments
The Company applies fair value accounting for all financial assets and liabilities and non-financial assets and liabilities that are recognized or disclosed at fair value in the financial statements on a recurring basis. Fair value accounting establishes a three-level hierarchy priority for disclosure of assets and liabilities recorded at fair value. The ordering of priority reflects the degree to which objective prices in external active markets are available to measure fair value. The classification of assets and liabilities within the hierarchy is based on whether the inputs to the valuation methodology used for measurement are observable or unobservable.
The Company utilizes valuation techniques that maximize the use of observable inputs and minimize the use of unobservable inputs to the extent possible. The Company determines fair value based on assumptions that market participants would use in pricing an asset or liability in the principal or most advantageous market. When considering market participant assumptions in fair value measurements, the following fair value hierarchy distinguishes between observable and unobservable inputs, which are categorized in one of the following levels:
• | Level 1 Inputs: Unadjusted quoted prices in active markets for identical assets or liabilities accessible to the reporting entity at the measurement date. |
• | Level 2 Inputs: Other than quoted prices included in Level 1 Inputs that are observable for the asset or liability, either directly or indirectly, for substantially the full term of the asset or liability. |
• | Level 3 Inputs: Unobservable inputs for the asset or liability used to measure fair value to the extent that observable inputs are not available, thereby allowing for situations in which there is little, if any, market activity for the asset or liability at measurement date. |
Loans Held for Sale
The Company facilitates the offering of loans by its bank partner to sellers pre-qualified through an analysis of the aggregated data of the seller’s business which includes, but is not limited to, the seller’s historical processing volumes, transaction count, chargebacks, growth, and length of time as a Square customer. The loans are originated by a bank partner, from whom the Company purchases the loans obtaining all rights, title, and interest. Loans are classified as held for sale upon purchase, as it is the Company’s intent to sell all of its rights, title, and interest in certain of these loans to third-party investors for an agreed-
79
upon purchase price when the loans are sold. A loan that is initially designated as held for sale may be reclassified to held for investment if and when the Company's intent for that loan changes. There have been no reclassifications made to date. Loans are recorded at the lower of cost or fair value. To determine the fair value of loans, the Company utilizes industry standard modeling, such as discounted cash flow models, to arrive at an estimate of fair value.
Settlements Receivable
Settlements receivable represents amounts due from third-party payment processors for customer transactions. Settlements receivable are typically received within one or two business days of the transaction date. No valuation allowances have been established, as funds are due from large, well-established financial institutions with no historical collections issue.
Provision for Uncollectible Receivables Related to MCAs
Merchant cash advance receivable, net, represents the aggregate amount of advances to merchants outstanding as of the balance sheet date, net of an allowance for potential uncollectible amounts. The Company estimates the allowance based on an assessment of various factors, including historical experience, merchants’ current processing volume, and other factors that may affect the merchants’ ability to generate future receivables. Additions to the allowance are reflected in current operating results, while charges against the allowance are made when charge-offs are recognized. The additions are classified within transaction and advance losses on the consolidated statements of operations. During the first quarter of 2016, the Company had fully transitioned from offering MCAs to loans. Activity subsequent to this transition relates primarily to updates to the Company's provision estimates for historical balances, write-offs or recoveries. The Company is not exposed to losses for the merchant cash advance receivables that are sold to third-party investors in accordance with the Company’s arrangements with them.
Customer Funds
Customer funds held represent cash stored by customers within the Square Cash App that the customers would later use to send money or make payments, or customer cash in transit. As of December 31, 2016 and 2015, the Company held these stored balances as short term deposits within a bank account. Customer funds obligation represents the Company's liability to the customers for the customer funds held.
Inventory
Inventory is comprised of contactless and chip readers, chip card readers, Square Stand, and third-party peripherals. Inventory is stated at the lower of cost (generally on a first-in, first-out basis) or market. Inventory that is obsolete or in excess of forecasted usage is written down to its estimated net realizable value based on assumptions about future demand and market conditions.
Deferred Magstripe Reader Costs
The Company capitalizes the cost of its magstripe readers, which are included in other current assets on the consolidated balance sheets. The amount capitalized represents the cost of the readers, including packaging and shipping costs, held on-hand by the Company as of each consolidated balance sheet date. Once the readers are shipped to a third-party distributor or an end-customer, they are recorded as marketing expense on the consolidated statements of operations.
Property and Equipment
Property and equipment are recorded at historical cost less accumulated depreciation, which is computed on a straight-line basis over the asset’s estimated useful life.
The estimated useful lives of property and equipment are described below:
Property and Equipment | Useful Life | |
Capitalized software | 18 months | |
Computer and data center equipment | Three years | |
Furniture and fixtures | Seven years | |
Leasehold improvements | Lesser of estimated useful life or remaining lease term | |
80
When assets are retired or otherwise disposed of, the cost and related accumulated depreciation are removed from their respective accounts, and any gain or loss on such sale or disposal is reflected in operating expenses.
Capitalized Software
The Company capitalizes certain cost incurred in developing internal-use software when capitalization requirements have been met. Costs prior to meeting the capitalization requirements are expensed as incurred. Capitalized costs are included in property and equipment, net, and amortized on a straight-lined basis over the estimated useful life of the software and included in product development costs or allocated to subscription and service-based costs on the consolidated statements of operations. The Company capitalized $7.9 million, $4.5 million and $6.4 million of internally developed software during the years ended December 31, 2016, 2015 and 2014, respectively, and recognized $7.1 million, $3.2 million and $2.7 million of amortization expense during the years ended December 31, 2016, 2015 and 2014, respectively.
Leases
The Company leases office space and equipment under non-cancellable capital and operating leases with various expiration dates. The Company records the total rent expense on a straight-line basis over the lease term.
When lease agreements provide allowances for leasehold improvements, the Company capitalizes the leasehold improvement assets and recognizes the related depreciation expense on a straight-line basis over the lesser of the lease term or the estimated useful life of the asset, and reduces rent expense on a straight-line basis over the term of the lease by the amount of the allowances provided. The Company classifies the cash payments for the leasehold improvements within investing activities while reimbursements from the landlords are classified within operating activities.
The Company records a liability for the estimated fair value for any asset retirement obligation (ARO) associated with its leases, with an offsetting asset. In the determination of the fair value of AROs, the Company uses various assumptions and judgments, including such factors as the existence of a legal obligation, estimated amounts and timing of settlements, and discount and inflation rates. The liability is subsequently accreted while the asset is depreciated. As of December 31, 2016, the Company had a liability for ARO, gross of accretion, of $3.2 million and an associated asset, net of depreciation, of $2.6 million.
Business Combinations
The purchase price of an acquisition is allocated to the tangible and intangible assets acquired and liabilities assumed based on their estimated fair values at the acquisition dates. The excess of total consideration over the fair values of the assets acquired and the liabilities assumed is recorded as goodwill. During the measurement period, which may be up to one year from the acquisition date, the Company may record adjustments to the assets acquired and liabilities assumed with the corresponding offset to goodwill. Upon the conclusion of the measurement period or final determination of the values of assets acquired or liabilities assumed, whichever comes first, any subsequent adjustments would be recorded on the consolidated statements of operations.
Long-Lived Assets, including Goodwill and Acquired Intangibles
The Company evaluates the recoverability of property and equipment and finite lived intangible assets for impairment whenever events or circumstances indicate that the carrying amounts of such assets may not be recoverable. Recoverability is measured by comparing the carrying amount of an asset or an asset group to estimate undiscounted future net cash flows expected to be generated. If the carrying amount of the long–lived asset or asset group is not recoverable on an undiscounted cash flow basis, an impairment is recognized to the extent that the carrying amount exceeds its fair value. Fair value is determined through various valuation techniques including discounted cash flow models, quoted market values, and third–part independent appraisals, as considered necessary. For the periods presented, the Company had recorded no impairment charges.
Goodwill represents the excess of the purchase price over the fair value of the net tangible and intangible assets acquired in a business combination. The Company performs a goodwill impairment test annually on December 31 and more frequently if events and circumstances indicate that the asset might be impaired. An impairment loss is recognized to the extent that the carrying amount exceeds the reporting unit’s fair value. The Company has the option to first assess qualitative factors to determine whether events or circumstances indicate that it is more likely than not that the fair value of a reporting unit is less than its
81
carrying amount and determine whether further action is needed. If, after assessing the totality of events or circumstances, the Company determines it is not more likely than not that the fair value of a reporting unit is less than its carrying amount, then performing the two-step impairment test is unnecessary. For the periods presented, the Company had recorded no impairment charges.
Acquired intangibles consist of acquired technology and customer relationships associated with various acquisitions. Acquired technology is amortized over its estimated useful life on a straight-line basis within cost of revenue. Customer relationships acquired are amortized on a straight-line basis over their estimated useful lives within operating expenses. The Company evaluates the remaining estimated useful life of its intangible assets being amortized on an ongoing basis to determine whether events and circumstances warrant a revision to the remaining period of amortization.
Customers Payable
Customers payable represents the transaction amounts, less revenue earned by the Company, owed to sellers. The payable amount comprises amounts owed to customers due to timing differences as we typically settle within one business day, amounts held by the Company in accordance with its risk management policies, and amounts held for customers who have not yet linked a bank account.
Accrued Transaction Losses
The Company establishes a reserve for estimated transaction losses due to chargebacks, which represent a potential loss due to disputes between a seller and their customer or due to a fraudulent transaction. The reserve is estimated based on available data as of the reporting date, including expectations of future chargebacks, and historical trends related to loss rates. Additions to the reserve are reflected in current operating results, while charges to the reserve are made when losses are recognized. These amounts are classified within transaction and advance losses on the consolidated statements of operations.
Recent Accounting Pronouncements
In May 2014, the Financial Accounting Standards Board (FASB) issued Accounting Standards Update (ASU) No. 2014-09, Revenue from Contracts with Customers, and issued subsequent amendments to the initial guidance within ASU 2015-04, ASU 2016-08, ASU 2016-10, ASU 2016-12, and ASU 2016-20. The new guidance will replace all current U.S. GAAP guidance on this topic and eliminate all industry specific guidance. The core principal of this new guidance is that revenue is recognized when promised goods or services are transferred to customers in an amount that reflects the consideration for which the Company expects to be entitled in exchange for those goods or services. This guidance is effective for financial statements issued for fiscal years beginning after December 15, 2017, and interim periods within those fiscal years, with early adoption permitted. The Company does not plan to early adopt the guidance. The guidance can be adopted either through the full retrospective approach which requires restatement of all periods presented or through a modified retrospective approach which requires a cumulative effect adjustment as of the date of adoption. The modified retrospective approach also requires additional disclosures of the impact of the new guidance to each of the financial statements line items and qualitative explanation of the significant changes between the reported results under the new revenue guidance and the previous revenue guidance. The Company plans to apply the modified retrospective approach in the year of adoption of this guidance and is currently assessing the impact that the adoption of the guidance would have on the consolidated financial statements and related disclosures. The Company is also assessing any financial reporting system changes that would be necessary to implement the new guidance.
In July 2015, the FASB issued ASU No. 2015-11, Simplifying the Measurement of Inventory, as part of its simplification initiative. The current guidance requires an entity to measure inventory at the lower of cost or market. Market could be replacement cost, net realizable value, or net realizable value less an approximately normal profit margin. Under the new guidance, inventory is measured at the lower of cost and net realizable value, which would eliminate the other two options that currently exist for market replacement cost and net realizable value less an approximately normal profit margin. The amendment is effective for financial statements issued for fiscal years beginning after December 15, 2016, and interim periods within those fiscal years, with early adoption permitted. The Company is currently evaluating the impact this new guidance may have on the consolidated financial statements.
In November 2015, the FASB issued ASU No. 2015-17, Balance Sheet Classification of Deferred Taxes. The new guidance eliminates the current requirement to present deferred tax assets and liabilities as current and noncurrent on the consolidated balance sheets. Instead, organizations will be required to classify all deferred tax assets and liabilities as noncurrent. This guidance is effective for financial statements issued for fiscal years beginning after December 15, 2016, and interim periods
82
within those fiscal years, with early adoption permitted. The Company early adopted this new guidance on a prospective basis as a change in accounting policy and therefore prior periods were not retrospectively adjusted.
In January 2016, the FASB issued ASU No. 2016-01, Recognition and Measurement of Financial Assets and Financial Liabilities. This guidance is intended to improve the recognition, measurement, presentation, and disclosure of financial instruments. This guidance is effective for financial statements issued for fiscal years beginning after December 15, 2017, and interim periods within those fiscal years, with early adoption permitted with certain restrictions. The Company is currently evaluating the impact this new guidance may have on the consolidated financial statements.
In February 2016, the FASB issued ASU No. 2016-02, Leases, which will require, among other items, lessees to recognize most leases as assets and liabilities on the balance sheet. Qualitative and quantitative disclosures will be enhanced to better understand the amount, timing and uncertainty of cash flows arising from leases. This guidance is effective for financial statements issued for fiscal years beginning after December 15, 2018, and interim periods within those fiscal years, with early adoption permitted. The Company does not plan to early adopt this guidance. The Company’s operating leases primarily comprise of office spaces, with the most significant leases relating to corporate headquarters in San Francisco and an office in New York. Based on the Company's initial assessment of its current leases and potential, the Company does not anticipate the adoption of this guidance to have a material impact on its operating results. The Company will continue to evaluate the impact of recording right to use assets and related liabilities on its consolidated balance sheets.
In March 2016, the FASB issued ASU No. 2016-04, Recognition of Breakage for Certain Prepaid Stored-Value Products. This guidance specifies how prepaid stored-value product liabilities should be derecognized, thereby eliminating the current and potential future diversity in practice. This guidance is effective for financial statements issued for fiscal years beginning after December 15, 2017, and interim periods within those fiscal years, with early adoption permitted. The Company is currently evaluating the impact this new guidance may have on the consolidated financial statements.
In March 2016, the FASB issued ASU No. 2016-09, Improvements to Employee Share-Based Payment Accounting,
which is intended to simplify several aspects of the accounting for share-based payment transactions, including the income tax consequences, classification of awards as either equity or liabilities, and classification on the statement of cash flows. This guidance is effective for financial statements issued for fiscal years beginning after December 15, 2016, and interim periods within those fiscal years, with early adoption permitted. The Company is currently evaluating the impact this new guidance may have on the consolidated financial statements.
In June 2016, the FASB issued ASU No. 2016-13, Measurement of Credit Losses on Financial Instruments, which requires measurement and recognition of expected credit losses for financial assets held. This guidance is effective for financial statements issued for fiscal years beginning after December 15, 2019, and interim periods within those fiscal years, with early adoption permitted. The Company is currently evaluating the impact this new guidance may have on the consolidated financial statements.
In August 2016, the FASB issued ASU No. 2016-15, Classification of Certain Cash Receipts and Cash Payments. This guidance addresses several specific cash flow issues with the objective of reducing the existing diversity in practice. This guidance is effective for financial statements issued for fiscal years beginning after December 15, 2017, and interim periods within those fiscal years, with early adoption permitted. The Company is currently evaluating the impact this new guidance may have on the consolidated financial statements.
In October 2016, the FASB issued ASU No. 2016-16, Intra-Entity Transfers of Assets Other Than Inventory, which amends existing guidance on the recognition of current and deferred income tax impacts for intra-entity asset transfers other than inventory. This standard is effective for annual periods beginning after December 15, 2017, and interim periods within those fiscal years, with early adoption permitted. The amendments in this guidance should be applied on a modified retrospective basis through a cumulative-effect adjustment directly to retained earnings as of the beginning of the period of adoption. The Company is currently evaluating the impact this new guidance may have on the consolidated financial statements.
In November 2016, the FASB issued ASU No. 2016-18, Restricted Cash, which provides guidance on the classification of restricted cash to be included with cash and cash equivalents when reconciling the beginning of period and end of period total amounts on the statement of cash flows. This standard is effective for annual periods beginning after December 15, 2017, and interim periods within those fiscal years, with early adoption permitted. For the years ended December 31, 2016, 2015 and 2014,
83
$36.7 million, $28.2 million and $26.3 million, respectively, of restricted cash would have been included in cash and cash equivalents in the consolidated statements of cash flows if this new guidance had been adopted as of the respective dates.
In December 2016, the FASB issued ASU No. 2016-19, Technical Corrections and Improvements. The amendments cover a wide range of topics in the Accounting Standards Codification, covering differences between original guidance and the Accounting Standards Codification, guidance clarification and reference corrections, simplification and minor improvements. Most of the amendments in this update do not require transition guidance and are effective upon issuance of this update. Early adoption is permitted for the amendments that require transition guidance. The Company is currently evaluating the impact this new update may have on the consolidated financial statements.
In January 2017, the FASB issued ASU No. 2017-01, Clarifying the Definition of a Business. The amendment seeks to clarify the definition of a business with the objective of adding guidance to assist entities with evaluating whether transactions should be accounted for as acquisitions (or disposals) of assets or businesses. The definition of a business affects many areas of accounting including acquisitions, disposals, goodwill and consolidation. This standard is effective for annual periods beginning after December 15, 2017, and interim periods within those fiscal years, with early adoption permitted. The amendments should be applied prospectively on or after the effective dates. The Company is currently evaluating the impact this new guidance may have on the consolidated financial statements.
In January 2017, the FASB issued ASU No. 2017-03, Amendments to SEC Paragraphs Pursuant to Staff Announcements. The amendment provides guidance to the Company in relation to the disclosure of the impact that ASU 2014-09, ASU 2016-02 and ASU 2016-13 will have on the Company’s financial statements when adopted. Specifically, registrants should consider additional qualitative disclosures if the impact of an issued but not yet adopted ASU is unknown or cannot be reasonably estimated and to include a description of the effect of the accounting policies that the registrant expects. The Company has implemented this guidance within its current disclosures.
In January 2017, the FASB issued ASU No. 2017-04, Simplifying the Test for Goodwill Impairment. This amendment modified the concept of impairment assessment from the condition that exists when the carrying amount of goodwill exceeds its implied fair value to the condition that exists when the carrying amount of a reporting unit exceeds its fair value. This standard should be adopted when the Company performs its annual or any interim goodwill impairment tests in fiscal years beginning after December 15, 2019, with early adoption permitted. The amendments should be applied on a prospective basis. The Company is currently evaluating the impact this new guidance may have on the consolidated financial statements.
84
NOTE 2 - FAIR VALUE OF FINANCIAL INSTRUMENTS
The Company’s financial assets and liabilities that are measured at fair value on a recurring basis are classified as follows (in thousands):
December 31, 2016 | December 31, 2015 | ||||||||||||||||||||||
Level 1 | Level 2 | Level 3 | Level 1 | Level 2 | Level 3 | ||||||||||||||||||
Cash and cash equivalents: | |||||||||||||||||||||||
Money market funds | $ | 207,168 | $ | — | $ | — | $ | 337,234 | $ | — | $ | — | |||||||||||
Commercial paper | — | 7,496 | — | — | — | — | |||||||||||||||||
Municipal securities | — | 1,000 | — | — | — | — | |||||||||||||||||
Short-term securities: | |||||||||||||||||||||||
U.S. agency securities | — | 9,055 | — | — | — | — | |||||||||||||||||
Corporate bonds | — | 6,980 | — | — | — | — | |||||||||||||||||
Commercial paper | — | 17,298 | — | — | — | — | |||||||||||||||||
Municipal securities | — | 8,028 | — | ||||||||||||||||||||
U.S. government securities | 18,540 | — | — | — | — | — | |||||||||||||||||
Long-term securities: | |||||||||||||||||||||||
U.S. agency securities | — | 3,502 | — | — | — | — | |||||||||||||||||
Corporate bonds | — | 12,914 | — | — | — | — | |||||||||||||||||
Municipal securities | — | 2,492 | — | — | — | — | |||||||||||||||||
U.S. government securities | 8,458 | — | — | — | — | — | |||||||||||||||||
Total | $ | 234,166 | $ | 68,765 | $ | — | $ | 337,234 | $ | — | $ | — | |||||||||||
The carrying amounts of certain financial instruments, including cash equivalents, settlements receivable, customer funds held, merchant cash advance receivable, accounts payable, customers payable, customer funds obligation, and settlements payable, approximate their fair values due to their short-term nature.
Loans held for sale are recorded at the lower of cost or fair value. To determine the fair value of loans, the Company utilizes industry-standard valuation modeling, such as discounted cash flow models, to arrive at an estimate of fair value.
A summary of loans disclosed at fair value on a recurring basis is as follows (in thousands):
December 31, 2016 | |||||||
Carrying Value | Fair Value (Level 3) | ||||||
Loans held for sale | $ | 42,144 | $ | 42,633 | |||
Total | $ | 42,144 | $ | 42,633 | |||
As of December 31, 2015, the difference between the fair value of loans and the carrying value was insignificant.
If applicable, the Company will recognize transfers into and out of levels within the fair value hierarchy at the end of the reporting period in which the actual event or change in circumstance occurs. During the years ended December 31, 2016, 2015 and 2014, the Company did not have any transfers between Level 2 or Level 3 assets.
NOTE 3 - INVESTMENTS
The Company determines the appropriate classification of its investments in marketable securities at the time of purchase and reevaluates such designation at each balance sheet date. The Company has classified and accounted for its marketable securities as available-for-sale.
85
The Company's short-term and long-term investments as of December 31, 2016 are as follows (in thousands):
Amortized Cost | Gross Unrealized Gains | Gross Unrealized Losses | Fair Value | ||||||||||||
Short-term securities: | |||||||||||||||
U.S. agency securities | $ | 9,048 | $ | 7 | $ | — | $ | 9,055 | |||||||
Corporate bonds | 17,318 | — | (20 | ) | 17,298 | ||||||||||
Commercial paper | 6,980 | — | — | 6,980 | |||||||||||
Municipal securities | 8,037 | — | (9 | ) | 8,028 | ||||||||||
U.S. government securities | 18,537 | 3 | — | 18,540 | |||||||||||
Total | $ | 59,920 | $ | 10 | $ | (29 | ) | $ | 59,901 | ||||||
Long-term securities: | |||||||||||||||
U.S. agency securities | $ | 3,502 | $ | — | $ | — | $ | 3,502 | |||||||
Corporate bonds | 12,939 | — | (25 | ) | 12,914 | ||||||||||
Municipal securities | 2,505 | — | (13 | ) | 2,492 | ||||||||||
U.S. government securities | 8,478 | — | (20 | ) | 8,458 | ||||||||||
Total | $ | 27,424 | $ | — | $ | (58 | ) | $ | 27,366 | ||||||
For the year ended December 31, 2016, gains or losses realized on the sale of investments were not material. Investments are reviewed periodically to identify possible other-than-temporary impairments. As the Company has the ability and intent to hold these investments with unrealized losses until a recovery of fair value, or for a reasonable period of time sufficient for the recovery of fair value, which may be maturity, the Company does not consider these investments to be other-than-temporarily impaired as of December 31, 2016.
The contractual maturities of the Company's short-term and long-term investments as of December 31, 2016 are as follows (in thousands):
Amortized Cost | Fair Value | ||||||
Due in one year or less | $ | 59,920 | $ | 59,901 | |||
Due in one to five years | 27,424 | 27,366 | |||||
Total | $ | 87,344 | $ | 87,267 | |||
NOTE 4 - MERCHANT CASH ADVANCE RECEIVABLE, NET
The following table summarizes the activities of the Company’s allowance for uncollectible receivables (in thousands):
Year Ended December 31, | Year Ended December 31, | ||||||
2016 | 2015 | ||||||
Allowance for uncollectible MCA receivables, beginning of the period | $ | 7,443 | $ | 2,431 | |||
Provision for uncollectible MCA receivables | 1,159 | 6,240 | |||||
MCA receivables charged off | (4,039 | ) | (1,228 | ) | |||
Allowance for uncollectible MCA receivables, end of the period | $ | 4,563 | $ | 7,443 | |||
86
During the first quarter of 2016, the Company had fully transitioned from offering MCAs to loans.
NOTE 5 - PROPERTY AND EQUIPMENT, NET
The following is a summary of property, equipment, and internally-developed software at cost, less accumulated depreciation and amortization (in thousands):
December 31, 2016 | December 31, 2015 | ||||||
Computer equipment | $ | 52,915 | $ | 43,531 | |||
Office furniture and equipment | 10,737 | 9,339 | |||||
Leasehold improvements | 73,366 | 65,298 | |||||
Capitalized software | 24,642 | 14,533 | |||||
Construction in process | — | 490 | |||||
Total | 161,660 | 133,191 | |||||
Less: Accumulated depreciation and amortization | (73,332 | ) | (45,969 | ) | |||
Property and equipment, net | $ | 88,328 | $ | 87,222 | |||
Depreciation and amortization expense on property and equipment was $28.7 million, $20.1 million, and $16.5 million, for the years ended December 31, 2016, 2015, and 2014, respectively.
NOTE 6 - ACQUISITIONS
Fiscal 2016
During the year ended December 31, 2016, the Company completed an acquisition for a total consideration of $1.6 million in cash. This acquisition was accounted for as a business combination. This method requires, among other things, that assets acquired and liabilities assumed be recognized at their fair values as of the acquisition date. Of the total purchase consideration, $1.1 million was allocated to acquired intangible assets and $0.5 million was allocated to goodwill. Intangible assets and goodwill generated from this acquisition is deductible for tax purposes. Goodwill is primarily attributable to expected synergies from future growth opportunities.
The results of operations from this acquisition have been consolidated with those of the Company as of the acquisition date. The acquisition's impact on revenue and net earnings for the year ended December 31, 2016 was not material. There was also no material impact on the Company’s revenue and net earnings on a pro forma basis for all periods presented.
Fiscal 2015
During the year ended December 31, 2015, the Company completed acquisitions for a total consideration of $32.0 million, consisting of 2,923,881 shares of common stock, options to purchase 26,173 shares of common stock, and $4.5 million in cash. These acquisitions were accounted for as business combinations. This method requires, among other things, that assets acquired and liabilities assumed be recognized at their fair values as of the acquisition date. Of the total purchase consideration of $32.0 million, $16.4 million has been allocated to goodwill, $14.9 million to acquired intangible assets, $0.8 million to property and equipment, and $0.2 million to deferred tax liabilities. Goodwill from these acquisitions is primarily attributable to expected synergies and cost reductions. $29.8 million of the intangible assets and goodwill generated from these acquisitions is deductible for tax purposes. Acquisition-related costs of $0.6 million were recognized in general and administrative expenses. Of the total purchase price, 355,284 shares of common stock and 22,818 options have been accounted for as post-combination compensation expense. As of December 31, 2016, 292,813 shares of the total share consideration remain withheld for indemnification purposes.
Additionally, the Company completed an acquisition of certain assets for a total purchase consideration of $9.5 million, consisting of 667,133 shares of common stock, and $1.0 million in cash. This transaction was accounted for as a purchase of assets, which consists of $9.0 million in intangible assets and $0.5 million of other assets.
87
Fiscal 2014
During the year ended December 31, 2014, the Company completed acquisitions for a total consideration of $59.6 million, consisting of 8,552,990 shares of common stock and options to purchase 168,834 shares of common stock. These acquisitions were accounted for as business combinations. This method requires, among other things, that assets acquired and liabilities assumed be recognized at their fair values as of the acquisition date. Of the total purchase consideration $39.7 million was allocated to goodwill, $11.4 million to acquired intangible assets, and $8.5 million to net tangible assets. Goodwill from these acquisitions was primarily attributable to expected synergies and cost reductions. None of the goodwill was deductible for tax. Acquisition-related costs of $0.5 million were recognized in general and administrative expenses. As of December 31, 2016, 1,291,979 shares of the total share consideration remain withheld for indemnification purposes.
88
NOTE 7 - GOODWILL
Goodwill is recorded when the consideration paid for an acquisition of a business exceeds the fair value of identifiable net tangible and intangible assets acquired.
The following table summarizes activities related to the carrying value of goodwill (in thousands):
Balance at December 31, 2014 | 40,267 | ||
Acquisitions completed during the year ended December 31, 2015 | $ | 16,432 | |
Balance at December 31, 2015 | $ | 56,699 | |
Acquisitions completed during the year ended December 31, 2016 | $ | 474 | |
Balance at December 31, 2016 | $ | 57,173 | |
The Company performed its annual goodwill impairment test as of December 31, 2016. The Company determined that the consolidated business is represented by a single reporting unit and concluded that it was more likely than not that the fair value of the reporting unit was greater than its carrying amount. As a result, the two-step goodwill impairment test was not required, and no impairments of goodwill were recognized during the year ended December 31, 2016.
NOTE 8 - ACQUIRED INTANGIBLE ASSETS
The following table presents the detail of acquired intangible assets as of the periods presented (in thousands):
Balance at December 31, 2016 | |||||||||||
Cost | Accumulated Amortization | Net | |||||||||
Patents | $ | 1,285 | $ | (454 | ) | $ | 831 | ||||
Technology Assets | 29,075 | (14,702 | ) | 14,373 | |||||||
Customer Assets | 7,745 | (3,657 | ) | 4,088 | |||||||
Total | $ | 38,105 | $ | (18,813 | ) | $ | 19,292 | ||||
Balance at December 31, 2015 | |||||||||||
Cost | Accumulated Amortization | Net | |||||||||
Patents | $ | 1,285 | $ | (348 | ) | $ | 937 | ||||
Technology Assets | 28,645 | (6,644 | ) | 22,001 | |||||||
Customer Assets | 6,645 | (2,807 | ) | 3,838 | |||||||
Total | $ | 36,575 | $ | (9,799 | ) | $ | 26,776 | ||||
The weighted average amortization periods for acquired patents, acquired technology, and customer intangible assets are approximately 13 years, 3 years, and 7 years, respectively.
Amortization expense associated with other intangible assets was $9.0 million, $7.5 million, and $2.1 million for the years ended December 31, 2016, 2015, and 2014, respectively.
89
The total estimated annual future amortization expense of these intangible assets as of December 31, 2016, are as follows (in thousands):
2017 | $ | 7,380 | ||
2018 | 5,881 | |||
2019 | 3,097 | |||
2020 | 1,140 | |||
2021 | 696 | |||
Thereafter | 1,098 | |||
Total | $ | 19,292 | ||
NOTE 9 - OTHER CONSOLIDATED BALANCE SHEET COMPONENTS (CURRENT)
Other Current Assets
The following table presents the detail of other current assets (in thousands):
December 31, 2016 | December 31, 2015 | ||||||
Inventory | $ | 13,724 | $ | 11,864 | |||
Accounts receivable | 6,191 | 4,808 | |||||
Prepaid expenses | 7,365 | 7,101 | |||||
Deferred magstripe reader costs | 3,911 | 4,018 | |||||
Tenant improvement reimbursement receivable | 1,189 | 1,788 | |||||
Deferred hardware costs | 4,546 | 1,709 | |||||
Processing costs receivable | 8,593 | 7,847 | |||||
Other | 10,812 | 2,312 | |||||
Total | $ | 56,331 | $ | 41,447 | |||
90
Accrued Expenses
The following table presents the detail of accrued expenses (in thousands):
December 31, 2016 | December 31, 2015 | ||||||
Accrued hardware costs | $ | 3,148 | $ | 11,622 | |||
Processing costs payable | 9,655 | 11,417 | |||||
Accrued professional fees | 5,788 | 7,642 | |||||
Accrued payroll | 5,799 | 2,660 | |||||
Accrued marketing | 3,972 | 2,443 | |||||
Other accrued liabilities | 11,181 | 8,617 | |||||
Total | $ | 39,543 | $ | 44,401 | |||
Other Current Liabilities
The following table presents the detail of other current liabilities (in thousands):
December 31, 2016 | December 31, 2015 | ||||||
Settlements payable | $ | 51,151 | $ | 13,105 | |||
Employee early exercised stock options | 674 | 2,141 | |||||
Accrued redemptions | 1,628 | 1,066 | |||||
Current portion of deferred rent | 2,862 | 2,393 | |||||
Deferred revenue | 5,407 | 6,623 | |||||
Other | 11,901 | 3,617 | |||||
Total | $ | 73,623 | $ | 28,945 | |||
NOTE 10 - OTHER CONSOLIDATED BALANCE SHEET COMPONENTS (NON-CURRENT)
Other Non-Current Assets
The following table presents the detail of other non-current assets (in thousands):
December 31, 2016 | December 31, 2015 | ||||||
Deposits | $ | 1,775 | $ | 1,993 | |||
Deferred tax assets | 306 | 188 | |||||
Other | 1,113 | 1,645 | |||||
Total | $ | 3,194 | $ | 3,826 | |||
91
Other Non-Current Liabilities
The following table presents the detail of other non-current liabilities (in thousands):
December 31, 2016 | December 31, 2015 | ||||||
Deferred rent | $ | 23,119 | $ | 25,543 | |||
Employee early exercised stock options | 66 | 1,128 | |||||
Deferred tax liabilities | 476 | 299 | |||||
Statutory liabilities | 29,497 | 25,492 | |||||
Other | 4,587 | 60 | |||||
Total | $ | 57,745 | $ | 52,522 | |||
NOTE 11 - DEBT
In November 2015, the Company entered into a revolving credit agreement with certain lenders, which extinguished the prior revolving credit agreement and provided for a $375.0 million revolving secured credit facility maturing in November 2020. This revolving credit agreement is secured by certain tangible and intangible assets.
Loans under the credit facility bear interest, at the Company’s option of (i) a base rate based on the highest of the prime rate, the federal funds rate plus 0.50% and an adjusted LIBOR rate for a one-month interest period in each case plus a margin ranging from 0.00% to 1.00%, or (ii) an adjusted LIBOR rate plus a margin ranging from 1.00% to 2.00%. This margin is determined based on the Company’s total leverage ratio for the preceding four fiscal quarters. The Company is obligated to pay other customary fees for a credit facility of this size and type including an annual administrative agent fee of $0.1 million and an unused commitment fee of 0.15%. To date no funds were drawn under the credit facility, with $375.0 million remaining available. The Company paid $0.6 million and $0.5 million in unused commitment fees during the years ended December 31, 2016 and 2015, respectively.
NOTE 12 - ACCRUED TRANSACTION LOSSES
The Company is exposed to transaction losses due to chargebacks as a result of fraud or uncollectibility.
The following table summarizes the activities of the Company’s reserve for transaction losses (in thousands):
Year Ended December 31, | |||||||||||
2016 | 2015 | 2014 | |||||||||
Accrued transaction losses, beginning of the year | $ | 17,176 | $ | 8,452 | $ | 7,488 | |||||
Provision for transaction losses | 50,819 | 43,379 | 18,478 | ||||||||
Charge-offs and recoveries to accrued transaction losses | (47,931 | ) | (34,655 | ) | (17,514 | ) | |||||
Accrued transaction losses, end of the year | $ | 20,064 | $ | 17,176 | $ | 8,452 | |||||
92
NOTE 13 - INCOME TAXES
The domestic and foreign components of loss before income taxes are as follows (in thousands):
Year Ended December 31, | |||||||||||
2016 | 2015 | 2014 | |||||||||
Domestic | $ | (145,499 | ) | $ | (157,229 | ) | $ | (139,675 | ) | ||
Foreign | (24,174 | ) | (18,842 | ) | (12,978 | ) | |||||
Loss before income taxes | $ | (169,673 | ) | $ | (176,071 | ) | $ | (152,653 | ) | ||
The components of the provision for income taxes are as follows (in thousands):
Year Ended December 31, | |||||||||||
2016 | 2015 | 2014 | |||||||||
Current: | |||||||||||
Federal | $ | 63 | $ | 1,662 | $ | 2,746 | |||||
State | 527 | 836 | 531 | ||||||||
Foreign | 1,269 | 1,222 | 827 | ||||||||
Total current provision for income taxes | 1,859 | 3,720 | 4,104 | ||||||||
Deferred: | |||||||||||
Federal | 173 | 67 | (2,503 | ) | |||||||
State | 18 | 11 | (161 | ) | |||||||
Foreign | (133 | ) | (52 | ) | — | ||||||
Total deferred provision for income taxes | 58 | 26 | (2,664 | ) | |||||||
Total provision for income taxes | $ | 1,917 | $ | 3,746 | $ | 1,440 | |||||
The following is a reconciliation of the statutory federal income tax rate to the Company's effective tax rate:
Balance at December 31, | ||||||||
2016 | 2015 | 2014 | ||||||
Tax at federal statutory rate | 34.0 | % | 34.0 | % | 34.0 | % | ||
State taxes, net of federal benefit | (0.1 | ) | (0.2 | ) | (0.1 | ) | ||
Foreign rate differential | (2.4 | ) | (1.8 | ) | (1.5 | ) | ||
Nondeductible expenses | (3.3 | ) | (3.3 | ) | (1.8 | ) | ||
Credits | 8.5 | 8.2 | 2.7 | |||||
Other items | (0.4 | ) | (0.4 | ) | 0.7 | |||
Change in valuation allowance | (37.4 | ) | (38.6 | ) | (35.0 | ) | ||
Total | (1.1 | )% | (2.1 | )% | (1.0 | )% | ||
93
The tax effects of temporary differences and related deferred tax assets and liabilities are as follows (in thousands):
Balance at December 31, | |||||||||||
2016 | 2015 | 2014 | |||||||||
Deferred tax assets: | |||||||||||
Capitalized costs | $ | 61,897 | $ | 67,051 | $ | 28,102 | |||||
Accrued expenses | 29,421 | 27,964 | 19,714 | ||||||||
Net operating loss carryforwards | 65,507 | 36,633 | 54,528 | ||||||||
Tax credit carryforwards | 38,927 | 25,349 | 11,662 | ||||||||
Property, equipment and intangible assets | 5,721 | — | — | ||||||||
Share-based compensation | 52,091 | 36,689 | 13,153 | ||||||||
Other | 1,640 | 1,469 | 542 | ||||||||
Total deferred tax assets | 255,204 | 195,155 | 127,701 | ||||||||
Valuation allowance | (254,898 | ) | (195,103 | ) | (125,368 | ) | |||||
Total deferred tax assets, net of valuation allowance | 306 | 52 | 2,333 | ||||||||
Deferred tax liabilities: | |||||||||||
Property, equipment and intangible assets | (476 | ) | (163 | ) | (2,333 | ) | |||||
Total deferred tax liabilities | (476 | ) | (163 | ) | (2,333 | ) | |||||
Net deferred tax liabilities | $ | (170 | ) | $ | (111 | ) | $ | — | |||
Realization of deferred tax assets is dependent upon the generation of future taxable income, the timing and amount of which are uncertain. Due to the history of losses generated in the U.S. and certain foreign jurisdictions, the Company believes that it is more likely than not that its deferred tax assets in these jurisdictions will not be realized as of December 31, 2016. Accordingly, the Company retained a full valuation allowance on its deferred tax assets in these jurisdictions. The amount of deferred tax assets considered realizable in future periods may change as management continues to reassess the underlying factors it uses in estimating future taxable income.
The valuation allowance increased by approximately $59.8 million, $69.7 million, and $50.5 million during the years ended December 31, 2016, 2015, and 2014, respectively.
As of December 31, 2016, the Company had $261.1 million of federal, $272.4 million of state, and $76.2 million of foreign net operating loss carryforwards, which will begin to expire in 2035 for federal and 2021 for state tax purposes. The foreign net operating loss carryforwards do not expire.
The benefit of stock options will only be recorded to stockholders’ equity when cash taxes payable is reduced. As of December 31, 2016, approximately $252.8 million of net operating loss is attributable to certain employee stock option deductions. This amount will be credited to stockholders’ equity when it is realized on the tax return.
As of December 31, 2016, the Company had $26.7 million of federal, $17.9 million of state, and $0.7 million of Canadian research credit carryforwards. The federal credit carryforward will begin to expire in 2029, the state credit carryforward has no expiration date, and the Canadian credit carryforward will begin to expire in 2035.
The Company also has a federal AMT credit carryforward of $2.6 million that has no expiration date and California Enterprise Zone credit carryforwards of $2.7 million, which will begin to expire in 2023.
Utilization of the net operating loss carryforwards and credits may be subject to annual limitations due to the ownership change limitations provided by the Internal Revenue Code of 1986, as amended, and similar state provisions. The annual limitations may result in the expiration of net operating losses and credits before they are able to be utilized. The Company does not expect any previous ownership changes, as defined under Section 382 and 383 of the Internal Revenue Code, to result in a limitation that will reduce the total amount of net operating loss carryforwards and credits that can be utilized.
94
As of December 31, 2016, the unrecognized tax benefit was $92.1 million, of which $2.8 million would impact the annual effective tax rate if recognized and the remainder of which would result in a corresponding adjustment to the valuation allowance.
A reconciliation of the beginning and ending amount of unrecognized tax benefit is presented below (in thousands):
Year Ended December 31, | |||||||||||
2016 | 2015 | 2014 | |||||||||
Balance at the beginning of the year | $ | 90,372 | $ | 78,031 | $ | 14,152 | |||||
Gross increases and decreases related to prior period tax positions | 5,190 | — | 26,690 | ||||||||
Gross increases and decreases related to current period tax positions | (3,428 | ) | 12,341 | 37,189 | |||||||
Balance at the end of the year | $ | 92,134 | $ | 90,372 | $ | 78,031 | |||||
The Company recognizes interest and penalties related to income tax matters as a component of income tax expense. As of December 31, 2016, there were no significant accrued interest and penalties related to uncertain tax positions. The Company does not believe that its unrecognized tax benefits will significantly change within the next 12 months.
The Company is subject to taxation in the United States and various state and foreign jurisdictions. The Company is currently under examination in Japan for tax year 2015, California for tax years 2013 and 2014, and New York State for tax years 2013, 2014, and 2015. The Company’s various tax years starting with 2009 to 2016 remain open in various taxing jurisdictions.
As of December 31, 2016, the Company has not provided deferred U.S. income taxes or foreign withholding taxes on temporary differences resulting from earnings for certain non-U.S. subsidiaries, which are permanently reinvested outside the U.S. Cumulative undistributed earnings for these non-U.S. subsidiaries as of December 31, 2016 are $3.9 million. It is not practicable to determine the income tax liability that might be incurred if these earnings were to be repatriated.
NOTE 14 - STOCKHOLDERS' EQUITY
Initial Public Offering
In November 2015, the Company completed its IPO in which it issued and sold 29,700,000 shares of Class A common stock at a public offering price of $9.00 per share. The total net proceeds received from the IPO were $245.7 million after deducting underwriting discounts and commissions of $14.7 million and other offering expenses of approximately $6.9 million.
Convertible Preferred Stock
As of December 31, 2016, the Company is authorized to issue 100,000,000 shares of preferred stock, with a $0.0000001 par value. No shares of preferred stock are outstanding as of December 31, 2016.
95
Deemed Dividend on Series E Preferred Stock
On November 24, 2015, upon the closing of the IPO, certain holders of Series E preferred stock were issued an incremental 10,299,696 shares of Class B common stock pursuant to the Company's Restated Certificate of Incorporation dated as of September 8, 2014, as amended (the 2014 Certificate). The 2014 Certificate allowed for an adjustment to the Series E original conversion price based on a prescribed formula upon the Company's IPO. The conversion of the Series E preferred stock resulted in a beneficial conversion feature, analogous to a deemed dividend. The beneficial conversion feature was calculated as the difference between fair value of the Company's common stock ultimately issued, based on the commitment date fair value of the Company's common stock, and the initial proceeds received for the Series E preferred stock. As a result, the Company recorded a one-time $32.2 million deemed stock dividend that resulted in an increase to net loss to arrive at net loss attributable to common stockholders.
Common Stock
The Company has authorized the issuance of Class A common stock and Class B common stock. Holders of the Company's Class A common stock and Class B common stock are entitled to dividends when, as and if, declared by the Company's board of directors, subject to the rights of the holders of all classes of stock outstanding having priority rights to dividends. As of December 31, 2016, the Company did not declare any dividends. Holders of shares of Class A common stock are entitled to one vote per share, while holders of shares of Class B common stock are entitled to ten votes per share. Shares of the Company's Class B common stock are convertible into an equivalent number of shares of its Class A common stock and generally convert into shares of its Class A common stock upon transfer. Class A common stock and Class B common stock are referred to as common stock throughout these Notes to the Consolidated Financial Statements, unless otherwise noted. The holders of Class A common stock and Class B common stock have no preemptive or other subscription rights and there are no redemption or sinking fund provisions with respect to such shares.
As of December 31, 2016, the Company was authorized to issue 1,000,000,000 shares of Class A common stock and 500,000,000 shares of Class B common stock, each with a par value of $0.0000001 per share. As of December 31, 2016, the Company had outstanding 198,746,620 shares of Class A common stock and 165,800,756 shares of Class B common stock, each with a par value of $0.0000001 per share.
Warrants
On August 7, 2012, the Company entered into a processing agreement with Starbucks and issued warrants to purchase 15,761,575 shares of common stock that would become exercisable if certain performance conditions, specified in the agreement as subsequently amended between 2012 and 2015, were achieved. In 2015, warrants to purchase 6,304,620 shares of common stock were canceled.
As of December 31, 2016, the Company had outstanding warrants to purchase an aggregate of 9,456,955 shares of its capital stock, with a weighted average exercise price of approximately $11.01 per share.
Stock Plans
The Company maintains two share-based employee compensation plans: the 2009 Stock Option Plan (2009 Plan) and the 2015 Equity Incentive Plan (2015 Plan). The 2015 Plan serves as the successor to its 2009 Plan. The 2015 Plan became effective as of November 17, 2015. Outstanding awards under the 2009 Plan continue to be subject to the terms and conditions of the 2009 Plan.
Under the 2015 Plan, shares of common stock are reserved for the issuance of incentive stock options (ISOs), non-statutory stock options (NSOs), restricted stock awards, RSUs, performance shares and stock bonuses to qualified employees, directors and consultants. The shares may be granted at a price per share not less than the fair market value at the date of grant. Initially, 30,000,000 shares were reserved under the 2015 Plan and any shares subject to options or other similar awards granted under the 2009 Plan that expire, are forfeited, are repurchased by the Company or otherwise terminate unexercised will become available under the 2015 Plan. The number of shares available for issuance under the 2015 Plan will be increased on the first day of each fiscal year, in an amount equal to the least of (i) 40,000,000 shares, (ii) 5% of the outstanding shares on the last day of the immediately preceding fiscal year, or (iii) such number of shares determined by the Company’s board of directors. As of December 31, 2016, the total number of options and RSUs outstanding under the 2015 Plan was 19,295,512 million shares, and 36,282,753 million shares were available for future issuance.
96
Under the 2009 Plan, shares of common stock are reserved for the issuance of ISOs or NSOs to eligible participants. The options may be granted at a price per share not less than the fair market value at the date of grant. Options granted generally vest over a four-year term from the date of grant, at a rate of 25% after one year, then monthly on a straight-line basis thereafter. Generally, options granted are exercisable for up to 10 years from the date of grant. The Plan allows for early exercise of employee stock options whereby the option holder is allowed to exercise prior to vesting. Any unvested shares are subject to repurchase by the Company at their original exercise prices. As of December 31, 2016, the total number of options and RSUs outstanding under the 2009 Plan was 69,409,441 million shares. No additional shares will be issued under 2009 Plan, effective November 17, 2015.
In January 2015, the Company’s Chief Executive Officer contributed 5,068,238 shares of common stock back to the Company for no consideration. The purpose of the contribution was to retire such shares in order to offset stock ownership dilution to existing investors in connection with future issuances under the 2009 Plan.
A summary of stock option activity for the year ended December 31, 2016 is as follows (in thousands, except share and per share data):
Number of stock options outstanding | Weighted average exercise price | Weighted average remaining contractual term (in years) | Aggregate intrinsic value | |||||||||
Balance at December 31, 2015 | 107,515,554 | $ | 6.99 | 7.87 | $ | 656,194 | ||||||
Granted | 1,767,320 | 13.49 | ||||||||||
Exercised | (24,328,414 | ) | 3.39 | |||||||||
Forfeited and canceled | (11,692,898 | ) | 10.98 | |||||||||
Balance at December 31, 2016 | 73,261,562 | $ | 7.70 | 7.28 | $ | 443,711 | ||||||
Options vested and expected to vest at | ||||||||||||
December 31, 2016 | 69,467,073 | $ | 7.51 | 6.95 | $ | 433,756 | ||||||
Options exercisable at | ||||||||||||
December 31, 2016 | 69,936,089 | $ | 7.54 | 7.19 | $ | 434,962 | ||||||
Aggregate intrinsic value represents the difference between the Company’s estimated fair value of its common stock and the exercise price of outstanding, “in-the-money” options. Aggregate intrinsic value for stock options exercised through December 31, 2016, 2015 and 2014 was $202.6 million, $49.8 million and $47.8 million, respectively.
The total weighted average grant-date fair value of options granted was $5.80, $5.87 and $3.84 per share for the years ended December 31, 2016, 2015 and 2014, respectively.
Restricted Stock Activity
The Company issues restricted stock units (RSUs) under the 2015 Plan, which typically vest over a term of four years. On December 18, 2015, the Company granted an aggregate of 1,854,145 RSUs, which vested within one year of their grant date.
97
Activity related to RSUs during the year ended December 31, 2016 is set forth below:
Number of RSUs | Weighted average grant date fair value | |||||
Unvested at December 31, 2015 | 3,632,765 | $ | 13.14 | |||
Granted | 17,060,055 | 12.08 | ||||
Vested | (3,392,726 | ) | 12.58 | |||
Forfeited | (1,856,703 | ) | 13.15 | |||
Unvested at December 31, 2016 | 15,443,391 | $ | 12.09 | |||
Employee Stock Purchase Plan
On November 17, 2015, the Company’s 2015 Employee Stock Purchase Plan (ESPP) became effective. The ESPP allows eligible employees to purchase shares of the Company’s common stock at a discount through payroll deductions of up to 15% of their eligible compensation, subject to any plan limitations. The ESPP provides for 12-month offering periods. The offering periods are scheduled to start on the first trading day on or after May 15 and November 15 of each year, except for the first offering period, which commenced on November 19, 2015 and ended on November 15, 2016. Each offering period includes two purchase periods, which begin on the first trading day on or after November 15 and May 15, and ending on the last trading day on or before May 15 and November 15, respectively. Employees are able to purchase shares at 85% of the lower of the fair market value of the Company’s common stock on the first trading day of the offering period or the last trading day of the purchase period. The number of shares available for sale under the ESPP will be increased annually on the first day of each fiscal year, equal to the least of (i) 8,400,000 million shares, (ii) 1% of the outstanding shares of the Company’s common stock as of the last day of the immediately preceding fiscal year, or (iii) such other amount as determined by the administrator.
As of December 31, 2016, 1,852,900 shares had been purchased under the ESPP and 5,696,594 shares were available for future issuance under the ESPP. The Company recorded $5.1 million and $0.7 million of share-based compensation expense related to the ESPP during the year ended December 31, 2016 and 2015, respectively.
Share-Based Compensation
The fair value of RSUs is based on the market value of the Company's common stock on grant date. The fair value of stock options and employee stock purchase plan shares granted to employees is estimated on the date of grant using the Black-Scholes-Merton option valuation model. This share-based compensation expense valuation model requires the Company to make assumptions and judgments regarding the variables used in the calculation. These variables include the expected term (weighted average period of time that the options granted are expected to be outstanding), the expected volatility of the Company’s stock, expected risk-free interest rate, expected dividends, and the estimated forfeitures of unvested stock options. To the extent actual forfeiture results differ from the estimates, the difference will be recorded as a cumulative adjustment in the period estimates are revised. The Company uses the simplified calculation of expected term, as the Company does not have sufficient historical data to use any other method to estimate expected term. Expected volatility is based on an average of the historical volatilities of the common stock of several entities with characteristics similar to those of the Company. The expected risk-free rate is based on the U.S. Treasury yield curve in effect at the time of grant for periods corresponding with the expected life of the option. Expected forfeitures are based on the Company’s historical experience. Share-based compensation expense is recorded net of estimated forfeitures on a straight-line basis over the requisite service period.
The fair value of stock options granted to non-employees, including consultants, is initially measured upon the date of grant and remeasured over the vesting period using the same methodology described above. These non-employees provide service to the Company on an ongoing basis, therefore, the performance commitment for each non-employee grant is not considered probable until the award is earned over time. The expected term for non-employee grants is the contractual term and share-based compensation expense is recognized on a straight-line basis over this term. Share-based compensation expense related to non-employees has not been material for any of the periods presented.
Effective August 31, 2015, the Company modified all of its nonstatutory stock option grants to extend the exercise term for terminated employees who have completed two years of service. During the year ended December 31, 2016 and 2015, share-based compensation expense includes $2.6 million and $3.3 million, respectively, related to the vested portion of the impacted
98
options as a result of the modification. The Company will incur an additional $4.2 million of share-based compensation expense over the remaining vesting periods of the impacted options.
The fair value of stock options was estimated using the following weighted-average assumptions:
Year Ended December 31, | ||||||||
2016 | 2015 | 2014 | ||||||
Fair value of common stock | $8.37 - $15.48 | $10.06 - $15.39 | $7.25 - $10.06 | |||||
Dividend yield | — | % | — | % | — | % | ||
Risk-free interest rate | 1.54 | % | 1.73 | % | 1.85 | % | ||
Expected volatility | 42.74 | % | 47.68 | % | 46.95 | % | ||
Expected term (years) | 6.08 | 6.02 | 6.06 | |||||
The following table summarizes the effects of share-based compensation on the Company's consolidated statements of operations (in thousands):
Year Ended December 31, | |||||||||||
2016 | 2015 | 2014 | |||||||||
Product development | $ | 91,404 | $ | 54,738 | $ | 24,758 | |||||
Sales and marketing | 14,122 | 7,360 | 3,738 | ||||||||
General and administrative | 33,260 | 20,194 | 7,604 | ||||||||
Total | $ | 138,786 | $ | 82,292 | $ | 36,100 | |||||
The Company capitalized $2.8 million of share-based compensation expense related to capitalized software during the year ended December 31, 2016. There was no similar activity during the year ended December 31, 2015 .
As of December 31, 2016, there was $257.6 million of total unrecognized compensation cost related to outstanding stock options and restricted stock awards that is expected to be recognized over a weighted average period of 2.82 years.
99
NOTE 15 - NET LOSS PER SHARE
Basic net loss per share is computed by dividing the net loss attributable to common stockholders by the weighted-average number of shares of common stock outstanding during the period. For the year ended December 31, 2015, net loss attributable to common stockholders includes the impact of the issuance of 10,299,696 shares of the Company's common stock to certain holders of Series E preferred stock, in the form of a deemed stock dividend of $32.2 million. Diluted loss per share is the same as basic loss per share for all years presented because the effects of potentially dilutive items were anti-dilutive given the Company’s net loss attributable to common stockholders.
The following table presents the calculation of basic and diluted net loss per share (in thousands, except per share data):
Year Ended December 31, | |||||||||||
2016 | 2015 | 2014 | |||||||||
Net loss | $ | (171,590 | ) | $ | (179,817 | ) | $ | (154,093 | ) | ||
Deemed dividend on Series E preferred stock | — | (32,200 | ) | — | |||||||
Net loss attributable to common stockholders | $ | (171,590 | ) | $ | (212,017 | ) | $ | (154,093 | ) | ||
Basic shares: | |||||||||||
Weighted-average common shares outstanding | 344,393 | 175,139 | 148,876 | ||||||||
Weighted-average unvested shares | (2,838 | ) | (4,641 | ) | (6,834 | ) | |||||
Weighted-average shares used to compute basic net loss per share | 341,555 | 170,498 | 142,042 | ||||||||
Diluted shares: | |||||||||||
Weighted-average shares used to compute diluted net loss per share | 341,555 | 170,498 | 142,042 | ||||||||
Loss per share attributable to common stockholders: | |||||||||||
Basic | $ | (0.50 | ) | $ | (1.24 | ) | $ | (1.08 | ) | ||
Diluted | $ | (0.50 | ) | $ | (1.24 | ) | $ | (1.08 | ) | ||
The following potential common shares were excluded from the calculation of diluted net loss per share attributable to common stockholders because their effect would have been anti-dilutive for the periods presented (in thousands):
Year Ended December 31, | ||||||||
2016 | 2015 | 2014 | ||||||
Stock options and restricted stock units | 88,705 | 111,148 | 87,471 | |||||
Common stock warrants | 9,457 | 9,544 | 15,762 | |||||
Preferred stock warrants | — | — | 87 | |||||
Convertible preferred stock | — | — | 135,253 | |||||
Unvested shares | 1,892 | 3,420 | 6,443 | |||||
Employee stock purchase plan | 216 | 172 | — | |||||
Total anti-dilutive securities | 100,270 | 124,284 | 245,016 | |||||
100
NOTE 16 - COMMITMENTS AND CONTINGENCIES
Operating and Capital Leases
The Company has entered into various non-cancelable operating leases for certain offices with contractual lease periods expiring between 2017 and 2025. The Company recognized total rental expenses under operating leases of $11.3 million, $12.8 million, and $11.4 million during the years ended December 31, 2016, 2015, and 2014, respectively.
Future minimum lease payments under non-cancelable operating leases (with initial or remaining lease terms in excess of one year) and future minimum capital lease payments as of December 31, 2016 are as follows (in thousands):
Capital | Operating | ||||||
Year: | |||||||
2017 | $ | 694 | $ | 16,639 | |||
2018 | 651 | 16,519 | |||||
2019 | 536 | 15,673 | |||||
2020 | 1 | 15,757 | |||||
2021 | — | 16,172 | |||||
Thereafter | — | 35,943 | |||||
Total | $ | 1,882 | $ | 116,703 | |||
Less amount representing interest | (4 | ) | |||||
Present value of capital lease obligations | 1,878 | ||||||
Less current portion of capital lease obligation | (691 | ) | |||||
Non-current portion of capital lease obligation | $ | 1,187 | |||||
The Company recognized sublease income of $3.1 million and $0.6 million during the years ended December 31, 2016 and 2015, respectively, under non-cancelable sublease arrangements expiring in 2018.
Litigation
The Company is currently a party to, and may in the future be involved in, various litigation matters (including intellectual property litigation), legal claims, and government investigations.
The Company is involved in a class action lawsuit concerning independent contractors in connection with the Company’s Caviar business. On March 19, 2015, Jeffry Levin, on behalf of a putative nationwide class, filed a lawsuit in the United States District Court for the Northern District of California against the Company’s wholly owned subsidiary, Caviar, Inc., which, as amended, alleges that Caviar misclassified Mr. Levin and other similarly situated couriers as independent contractors and, in doing so, violated various provisions of the California Labor Code and California Business and Professions Code by requiring them to pay various business expenses that should have been borne by Caviar. The Court compelled arbitration of Mr. Levin’s individual claims on November 16, 2015 and dismissed the lawsuit in its entirety with prejudice on May 2, 2016. On June 1, 2016, Mr. Levin filed a Notice of Appeal of the Court’s order compelling arbitration with the United States Court of Appeals for the Ninth Circuit. Mr. Levin filed his opening appellate brief regarding the order compelling arbitration of his individual claims on October 7, 2016. The Company filed its answering brief on December 7, 2016, and Mr. Levin filed his reply on December 21, 2016. The parties now await notice of a hearing date from the Ninth Circuit. Mr. Levin also sought an award of penalties pursuant to the Labor Code Private Attorneys General Act of 2004 (PAGA). The parties stipulated that Mr. Levin would no longer pursue this PAGA claim but that it may instead be pursued by a different courier. Subsequently, couriers Nadezhda Rosen and La’Dell Brewster filed a new PAGA-only claim in California state court on November 7, 2016. Plaintiffs claim that Caviar misclassified its couriers as independent contractors resulting in numerous violations of the California Labor Code, pursuant to which plaintiffs seek statutory penalties for those violations. The parties have stipulated to extend the time for Caviar to respond to the complaint until March 17, 2017. In February 2017, the Company participated in a mediation with the parties in these Caviar misclassification suits to explore resolution of the matters at hand; however, an agreement on all the material terms has not been reached.
101
In addition, from time to time, the Company is involved in various other litigation matters and disputes arising in the ordinary course of business. The Company cannot at this time fairly estimate a reasonable range of exposure, if any, of the potential liability with respect to these other matters. While the Company does not believe, at this time, that any ultimate liability resulting from any of these other matters will have a material adverse effect on the Company's results of operations, financial position, or liquidity, the Company cannot give any assurance regarding the ultimate outcome of these other matters, and their resolution could be material to the Company's operating results for any particular period, depending on the level of income for the period.
NOTE 17 - SEGMENT AND GEOGRAPHICAL INFORMATION
Operating segments are defined as components of an enterprise for which discrete financial information is available that is evaluated regularly by the chief operating decision maker (CODM) for purposes of allocating resources and evaluating financial performance. The Company’s CODM reviews financial information presented on a consolidated basis for purposes of allocating resources and evaluating financial performance. As such, the Company’s operations constitute a single operating segment and one reportable segment.
Revenue
Revenue by geography is based on the billing addresses of the merchants. The following table sets forth revenue by geographic area (in thousands):
Year Ended December 31, | |||||||||||
2016 | 2015 | 2014 | |||||||||
Revenue | |||||||||||
United States | $ | 1,643,852 | $ | 1,224,566 | $ | 825,578 | |||||
International | 64,869 | 42,552 | 24,614 | ||||||||
Total net revenue | $ | 1,708,721 | $ | 1,267,118 | $ | 850,192 | |||||
No individual country from the international markets contributed in excess of 10% of total revenue for the years ended December 31, 2016, 2015 and 2014.
Long-Lived Assets
The following table sets forth long-lived assets by geographic area (in thousands):
December 31, | |||||||
2016 | 2015 | ||||||
Long-lived assets | |||||||
United States | $ | 162,118 | $ | 168,583 | |||
International | 2,675 | 2,114 | |||||
Total long-lived assets | $ | 164,793 | $ | 170,697 | |||
102
NOTE 18 - SUPPLEMENTAL CASH FLOW INFORMATION
The supplemental disclosures of cash flow information consist of the following (in thousands):
Year Ended December 31, | |||||||||||
2016 | 2015 | 2014 | |||||||||
Supplemental Cash Flow Data: | |||||||||||
Cash paid for interest | $ | 570 | $ | 981 | $ | 940 | |||||
Cash paid for income taxes | 395 | 1,916 | 2,442 | ||||||||
Supplemental disclosures of non-cash investing and financing activities: | |||||||||||
Purchases of property and equipment in accounts payable and accrued expenses | 2,554 | 5,593 | — | ||||||||
Unpaid business acquisition purchase price | 240 | — | — | ||||||||
Conversion of Series A, B, C, D & E preferred stock upon initial public offering to common stock | — | 544,897 | — | ||||||||
Unpaid offering costs related to initial public offering | — | 5,530 | — | ||||||||
Deemed dividend on Series E preferred stock | — | 32,200 | — | ||||||||
Fair value of shares issued related to acquisitions | — | 35,776 | 59,576 | ||||||||
NOTE 19 - SUBSEQUENT EVENTS
On February 24, 2017, the Company and Starbucks entered into a Warrant Cancellation and Payment Agreement pursuant to which the Company is to pay Starbucks a cash consideration of approximately $54.8 million in return for the termination of the Warrant to Purchase Stock dated August 7, 2012, as amended, that provides for the right to purchase an aggregate of 9,456,955 shares of the Company’s common stock.
Item 9. CHANGES IN AND DISAGREEMENTS WITH ACCOUNTANTS ON ACCOUNTING AND FINANCIAL DISCLOSURE
None.
Item 9A. CONTROLS AND PROCEDURES
Evaluation of Disclosure Controls and Procedures
Our management, with the participation of our Chief Executive Officer and our Chief Financial Officer, has evaluated the effectiveness of our disclosure controls and procedures as of the end of the period covered by this Annual Report on Form 10-K. The term “disclosure controls and procedures,” as defined in Rules 13a-15(e) and 15d-15(e) under the Securities Exchange Act of 1934, as amended (the “Exchange Act”), means controls and other procedures of a company that are designed to ensure that information required to be disclosed by a company in the reports that it files or submits under the Exchange Act is recorded, processed, summarized and reported, within the time periods specified in the SEC’s rules and forms. Disclosure controls and procedures include, without limitation, controls and procedures designed to ensure that information required to be disclosed by a company in the reports that it files or submits under the Exchange Act is accumulated and communicated to the company’s management, including its principal executive and principal financial officers, or persons performing similar functions, as appropriate to allow timely decisions regarding required disclosure. Management recognizes that any controls and procedures, no matter how well designed and operated, can provide only reasonable assurance of achieving their objectives and management necessarily applies its judgment in evaluating the cost-benefit relationship of possible controls and procedures. Based on such evaluation, our Chief Executive Officer and Chief Financial Officer have concluded that, as of such date, our disclosure controls and procedures were effective at the reasonable assurance level.
Changes in Internal Control over Financial Reporting
103
There was no change in our internal control over financial reporting identified in connection with the evaluation required by Rule 13a-15(d) and 15d-15(d) of the Exchange Act that occurred during the quarter ended December 31, 2016 that has materially affected, or is reasonably likely to materially affect, our internal control over financial reporting.
Management's Report on Internal Control over Financial Reporting
Our management is responsible for establishing and maintaining adequate internal control over financial reporting (as defined in Rule 13a-15(f) under the Exchange Act). Our management conducted an assessment of the effectiveness of our internal control over financial reporting based on the criteria established in “Internal Control - Integrated Framework” (2013) issued by the Committee of Sponsoring Organizations of the Treadway Commission (COSO). Based on that assessment, our management has concluded that our internal control over financial reporting was effective as of December 31, 2016. The effectiveness of the Company’s internal control over financial reporting as of December 31, 2016 has been audited by KPMG LLP, an independent registered public accounting firm, as stated in their report which appears herein.
Item 9B. OTHER INFORMATION
None.
104
PART III
Item 10. DIRECTORS, EXECUTIVE OFFICERS AND CORPORATE GOVERNANCE
The information required by this item will be set forth in our definitive proxy statement to be filed with the Securities and Exchange Commission not later than 120 days after the end of our fiscal year ended December 31, 2016 in connection with our 2017 annual meeting of stockholders (the Proxy Statement), and is incorporated herein by reference.
Item 11. EXECUTIVE COMPENSATION
The information required by this item will be set forth in the Proxy Statement and is incorporated herein by reference.
Item 12. SECURITY OWNERSHIP OF CERTAIN BENEFICIAL OWNERS AND MANAGEMENT AND RELATED STOCKHOLDER MATTERS
The information required by this item will be set forth in the Proxy Statement and is incorporated herein by reference.
Item 13. CERTAIN RELATIONSHIPS AND RELATED TRANSACTIONS, AND DIRECTOR INDEPENDENCE
The information required by this item will be set forth in the Proxy Statement and is incorporated herein by reference.
Item 14. PRINCIPAL ACCOUNTING FEES AND SERVICES
The information required by this item will be set forth in the Proxy Statement and is incorporated herein by reference.
105
PART IV
Item 15. EXHIBITS, FINANCIAL STATEMENT SCHEDULES
(a) The following documents are filed as a part of this Annual Report on Form 10-K:
(1)Consolidated Financial Statements:
Our Consolidated Financial Statements are listed in the “Index to Consolidated Financial Statements” under Part II, Item 8 of this Annual Report on Form 10-K.
(2)Financial Statement Schedules:
Schedules not listed above have been omitted because the information required to be set forth therein is not applicable or is shown in the financial statements or notes herein.
(3)Exhibits
The documents listed in the Exhibit Index of this Annual Report on Form 10-K are incorporated by reference or are filed with this Annual Report on Form 10-K, in each case as indicated therein (numbered in accordance with Item 601 of Regulation S-K).
106
SIGNATURES
Pursuant to the requirements of Section 13 or 15(d) of the Securities Exchange Act of 1934, the registrant has duly caused this Annual Report on Form 10-K to be signed on its behalf by the undersigned, thereunto duly authorized.
Date: February 24, 2017
SQUARE, INC.
By: /s/ Jack Dorsey
Jack Dorsey
President, Chief Executive Officer, and Chairman
POWER OF ATTORNEY
Each person whose signature appears below hereby constitutes and appoints Jack Dorsey, Sarah Friar and Hillary Smith, and each of them, as his or her true and lawful attorney-in-fact and agent, with full power of substitution and resubstitution, for him or her and in his or her name, place and stead, in any and all capacities, to sign any and all amendments to this Annual Report on Form 10-K, and to file the same, with all exhibits thereto, and other documents in connection therewith, with the Securities and Exchange Commission, granting unto said attorneys-in-fact and agents, and each of them, full power and authority to do and perform each and every act and thing requisite and necessary to be done in connection therewith, as fully for all intents and purposes as he or she might or could do in person, hereby ratifying and confirming all that said attorneys-in-fact and agents, or any of them, or their, his or her substitutes, may lawfully do or cause to be done by virtue hereof.
Pursuant to the requirements of the Securities Exchange Act of 1934, this Annual Report on Form 10-K has been signed by the following persons on behalf of the registrant and in the capacities and on the dates indicated:
Signature | Title | Date |
/s/ Jack Dorsey Jack Dorsey | President, Chief Executive Officer, and Chairman(Principal Executive Officer) | February 24, 2017 |
/s/ Sarah Friar Sarah Friar | Chief Financial Officer (Principal Financial Officer) | February 24, 2017 |
/s/ Ajmere Dale Ajmere Dale | Chief Accounting Officer (Principal Accounting Officer) | February 24, 2017 |
/s/ Roelof Botha Roelof Botha | Director | February 24, 2017 |
/s/ Paul Deighton Paul Deighton | Director | February 24, 2017 |
/s/ Jim McKelvey Jim McKelvey | Director | February 24, 2017 |
/s/ Mary Meeker Mary Meeker | Director | February 24, 2017 |
/s/ Ruth Simmons Ruth Simmons | Director | February 24, 2017 |
/s/ Lawrence Summers Lawrence Summers | Director | February 24, 2017 |
/s/ David Viniar David Viniar | Director | February 24, 2017 |
EXHIBIT INDEX
Incorporated by Reference | ||||||
Exhibit Number | Description | Form | File No. | Exhibit | Filing Date | |
3.1 | Amended and Restated Certificate of Incorporation of the Registrant. | 8-K | 001-37622 | 3.1 | November 24, 2015 | |
3.2 | Amended and Restated Bylaws of the Registrant. | 8-K | 001-37622 | 3.2 | November 24, 2015 | |
4.1 | Form of Class A common stock certificate of the Registrant. | S-1/A | 333-207411 | 4.1 | November 6, 2015 | |
4.2 | Fifth Amended and Restated Investors’ Rights Agreement among the Registrant and certain holders of its capital stock, dated as of September 9, 2014. | S-1 | 333-207411 | 4.2 | October 14, 2015 | |
4.3 | Warrant to purchase shares of common stock issued to Starbucks Corporation, dated as of August 7, 2012, as amended on September 30, 2013. | S-1 | 333-207411 | 4.4 | October 14, 2015 | |
10.1+ | Form of Indemnification Agreement between the Registrant and each of its directors and executive officers. | S-1/A | 333-207411 | 10.1 | November 6, 2015 | |
10.2+ | Square, Inc. 2015 Equity Incentive Plan, as amended and restated, and related form agreements. | 10-Q | 001-37622 | 10.1 | August 4, 2016 | |
10.3+ | Square, Inc. 2015 Employee Stock Purchase Plan, as amended and restated, and related form agreements. | 10-K | 001-37622 | 10.3 | March 10, 2016 | |
10.4+ | Square, Inc. 2009 Stock Plan and related form agreements. | S-1 | 333-207411 | 10.4 | October 14, 2015 | |
10.5+ | Square, Inc. Executive Incentive Compensation Plan. | S-1 | 333-207411 | 10.5 | October 14, 2015 | |
10.6+ | Square, Inc. Outside Director Compensation Policy, as amended and restated. | |||||
10.7+ | Form of Change of Control and Severance Agreement between the Registrant and certain of its executive officers. | S-1 | 333-207411 | 10.7 | October 14, 2015 | |
10.8+ | Offer Letter between the Registrant and Jack Dorsey, dated as of March 7, 2016. | 10-K | 001-37622 | 10.8 | March 10, 2016 | |
10.9+ | Offer Letter between the Registrant and Sarah Friar, dated as of October 1, 2015. | S-1/A | 333-207411 | 10.9 | November 6, 2015 | |
10.10+ | Offer Letter between the Registrant and Dana R. Wagner, dated as of October 1, 2015. | S-1/A | 333-207411 | 10.10 | November 6, 2015 | |
10.11+ | Offer Letter between the Registrant and Françoise Brougher, dated as of October 1, 2015. | S-1/A | 333-207411 | 10.11 | November 6, 2015 | |
10.12+ | Offer Letter between the Registrant and Alyssa Henry, dated as of October 1, 2015. | S-1/A | 333-207411 | 10.12 | November 6, 2015 | |
10.13+ | Offer Letter between the Registrant and Hillary Smith, dated as of October 27, 2016. | |||||
10.14 | Office Lease by and between the Registrant and Hudson 1455 Market, LLC, dated as of October 17, 2012, as amended on March 22, 2013, January 22, 2014, and June 6, 2014. | S-1 | 333-207411 | 10.13 | October 14, 2015 | |
10.15 | Revolving Credit Agreement dated as of November 2, 2015 among the Registrant, the Lenders Party Thereto, and JPMorgan Chase Bank, N.A., as Administrative Agent. | S-1/A | 333-207411 | 10.14 | November 6, 2015 | |
10.16 | Commitment Letter dated October 30, 2015 by Goldman Sachs Lending Partners LLC. | S-1/A | 333-207411 | 10.14A | November 16, 2015 | |
10.17# | Master Development and Supply Agreement by and between the Registrant and TDK Corporation, dated as of October 1, 2013. | S-1 | 333-207411 | 10.15 | October 14, 2015 | |
10.18# | Master Manufacturing Agreement by and between the Registrant and Cheng Uei Precision Industry Co., Ltd., dated as of June 27, 2012. | S-1 | 333-207411 | 10.16 | October 14, 2015 | |
10.19# | ASIC Development and Supply Agreement by and between the Registrant, Semiconductor Components Industries, LLC (d/b/a ON Semiconductor) and ON Semiconductor Trading, Ltd., dated as of March 25, 2013. | S-1 | 333-207411 | 10.17 | October 14, 2015 | |
21.1 | List of subsidiaries of the Registrant. | |||||
23.1 | Consent of KPMG LLP, Independent Registered Public Accounting Firm. | |||||
31.1 | Certification of Chief Executive Officer pursuant to Exchange Act Rules 13a-14(a) and 15d-14(a), as adopted pursuant to Section 302 of the Sarbanes-Oxley Act of 2002. | |||||
31.2 | Certification of Chief Financial Officer pursuant to Exchange Act Rules 13a-14(a) and 15d-14(a), as adopted pursuant to Section 302 of the Sarbanes-Oxley Act of 2002. | |||||
108
32.1† | Certifications of Chief Executive Officer and Chief Financial Officer pursuant to 18 U.S.C. Section 1350, as adopted pursuant to Section 906 of the Sarbanes-Oxley Act of 2002. | |||||
101.INS | XBRL Instance Document. | |||||
101.SCH | XBRL Taxonomy Extension Schema Document. | |||||
101.CAL | XBRL Taxonomy Extension Calculation Linkbase Document. | |||||
101.DEF | XBRL Taxonomy Extension Definition Linkbase Document. | |||||
101.LAB | XBRL Taxonomy Extension Labels Linkbase Document. | |||||
101.PRE | XBRL Taxonomy Extension Presentation Linkbase Document. | |||||
____________________
+ | Indicates management contract or compensatory plan. |
# | The Registrant has omitted portions of the relevant exhibit and filed such exhibit separately with the Securities and Exchange Commission pursuant to a request for confidential treatment under Rule 406 of the Securities Act of 1933, as amended. |
† | The certifications attached as Exhibit 32.1 that accompany this Annual Report on Form 10-K are deemed furnished and not filed with the Securities and Exchange Commission and are not to be incorporated by reference into any filing of the Registrant under the Securities Act of 1933, as amended, or the Securities Exchange Act of 1934, as amended, whether made before or after the date of this Annual Report on Form 10-K, irrespective of any general incorporation language contained in such filing. |
109