Attached files
| file | filename |
|---|---|
| EX-99.1 - EXHIBIT 99.1 - Clearwater Paper Corp | a51846230_ex991.htm |
| 8-K - CLEARWATER PAPER CORP. 8-K - Clearwater Paper Corp | a51846230.htm |
Exhibit 99.2


CLEARWATER PAPER CORPORATIONSECOND QUARTER 2018SUPPLEMENTAL INFORMATION 08/01/18 LINDA MASSMANPRESIDENT, CHIEF EXECUTIVE OFFICER AND DIRECTORJOHN HERTZSENIOR VICE PRESIDENT FINANCE AND CHIEF FINANCIAL OFFICER
FORWARD-LOOKING STATEMENTS This presentation of supplemental information contains, in addition to historical information, certain forward-looking statements within the meaning of the Private Securities Litigation Reform Act of 1995, including statements regarding the costs, timing and benefits associated with strategic capital investments and operational improvements; financial models; estimated Q3 2018 net earnings, EBITDA, adjusted EBITDA, operating income, adjusted operating income, adjusted net earnings, net earnings per diluted common share, adjusted net earnings per diluted common share, net sales and adjusted operating margin; and Q3 2018 product pricing and sales mix, product volumes shipped, pulp, transportation and maintenance. These forward-looking statements are based on management’s current expectations, estimates, assumptions and projections that are subject to change. Our actual results of operations may differ materially from those expressed or implied by the forward-looking statements contained in this presentation. Important factors that could cause or contribute to such differences include the risks and uncertainties described from time to time in the company's public filings with the Securities and Exchange Commission, as well as the following: competitive pricing pressures for our products, including as a result of increased capacity as additional manufacturing facilities are operated by our competitors;the loss of, changes in prices in regards to, or a reduction in orders from, a significant customer;changes in customer product preferences and competitors' product offerings;our ability to successfully implement our operational efficiencies and cost savings strategies, including related capital projects and achieve the expected operational or financial results of those projects, including from the continuous digester at our Lewiston facility;our ability to execute on our expansion strategies, including on-time completion of our planned new tissue manufacturing operations in Shelby, North Carolina;customer acceptance and timing and quantity of purchases of our tissue products, including the existence of sufficient demand for and the quality of tissue produced by our expanded Shelby, North Carolina operations when they are completed;changes in the U.S. and international economies and in general economic conditions in the regions and industries in which we operate;labor disruptions;changes in transportation costs and disruptions in transportation services;changes in the cost and availability of wood fiber and wood pulp;manufacturing or operating disruptions, including IT system and IT system implementation failures, equipment malfunction and damage to our manufacturing facilities;changes in costs for and availability of packaging supplies, chemicals, energy and maintenance and repairs;cyclical industry conditions; changes in expenses and required contributions associated with our pension plans;environmental liabilities or expenditures;cyber-security risks;reliance on a limited number of third-party suppliers for raw materials;our inability to service our debt obligations;restrictions on our business from debt covenants and terms; andchanges in laws, regulations or industry standards affecting our business.Forward-looking statements contained in this presentation present management’s views only as of the date of this presentation. We undertake no obligation to publicly update forward-looking statements, whether as a result of new information, future events or otherwise. 2
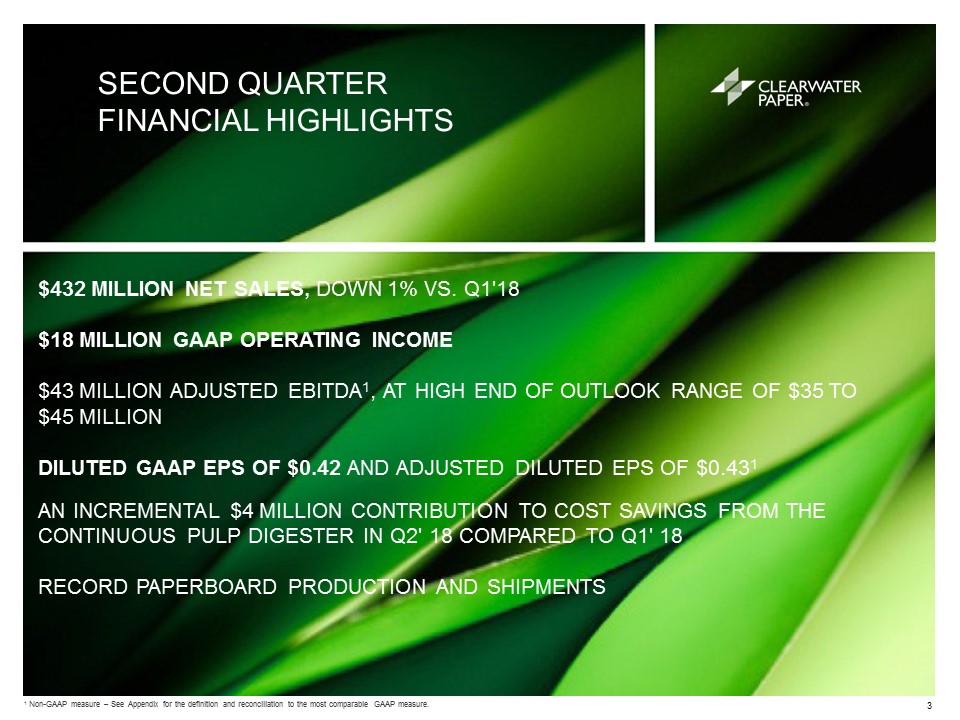
SECOND QUARTERFINANCIAL HIGHLIGHTS $432 MILLION NET SALES, DOWN 1% VS. Q1'18 $18 MILLION GAAP OPERATING INCOME$43 MILLION ADJUSTED EBITDA1, AT HIGH END OF OUTLOOK RANGE OF $35 TO $45 MILLION DILUTED GAAP EPS OF $0.42 AND ADJUSTED DILUTED EPS OF $0.431AN INCREMENTAL $4 MILLION CONTRIBUTION TO COST SAVINGS FROM THE CONTINUOUS PULP DIGESTER IN Q2' 18 COMPARED TO Q1' 18RECORD PAPERBOARD PRODUCTION AND SHIPMENTS 1 Non-GAAP measure – See Appendix for the definition and reconciliation to the most comparable GAAP measure. 3
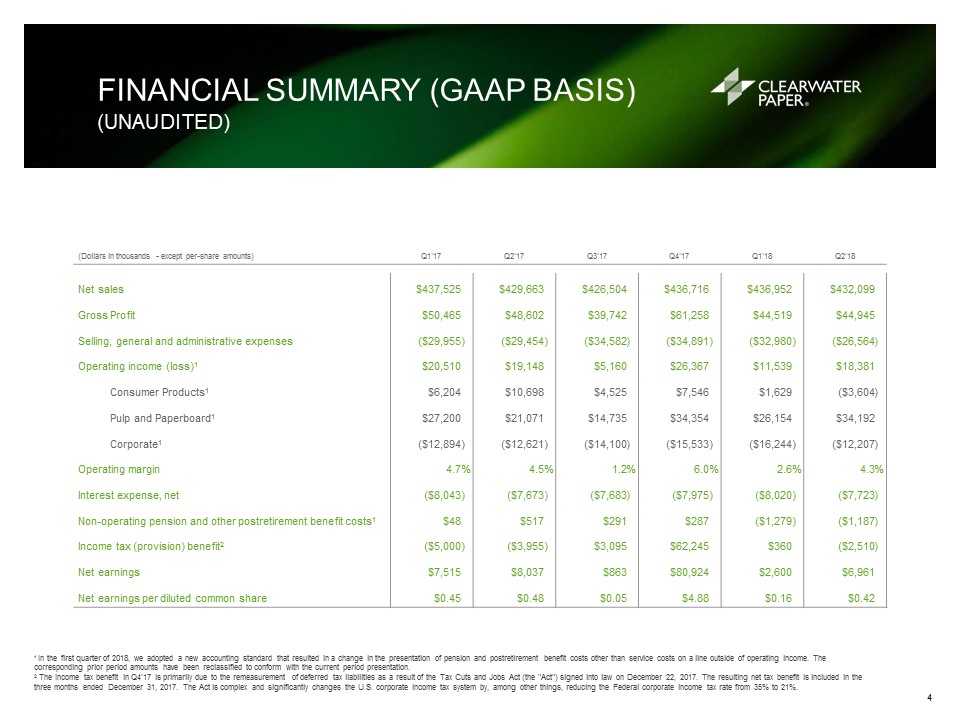
FINANCIAL SUMMARY (GAAP BASIS)(UNAUDITED) (Dollars in thousands - except per-share amounts) Q1'17 Q2'17 Q3'17 Q4'17 Q1'18 Q2'18 Net sales $437,525 $429,663 $426,504 $436,716 $436,952 $432,099 Gross Profit $50,465 $48,602 $39,742 $61,258 $44,519 $44,945 Selling, general and administrative expenses ($29,955 ) ($29,454 ) ($34,582 ) ($34,891 ) ($32,980 ) ($26,564 ) Operating income (loss)1 $20,510 $19,148 $5,160 $26,367 $11,539 $18,381 Consumer Products1 $6,204 $10,698 $4,525 $7,546 $1,629 ($3,604 ) Pulp and Paperboard1 $27,200 $21,071 $14,735 $34,354 $26,154 $34,192 Corporate1 ($12,894 ) ($12,621 ) ($14,100 ) ($15,533 ) ($16,244 ) ($12,207 ) Operating margin 4.7 % 4.5 % 1.2 % 6.0 % 2.6 % 4.3 % Interest expense, net ($8,043 ) ($7,673 ) ($7,683 ) ($7,975 ) ($8,020 ) ($7,723 ) Non-operating pension and other postretirement benefit costs1 $48 $517 $291 $287 ($1,279 ) ($1,187 ) Income tax (provision) benefit2 ($5,000 ) ($3,955 ) $3,095 $62,245 $360 ($2,510 ) Net earnings $7,515 $8,037 $863 $80,924 $2,600 $6,961 Net earnings per diluted common share $0.45 $0.48 $0.05 $4.88 $0.16 $0.42 4 1 In the first quarter of 2018, we adopted a new accounting standard that resulted in a change in the presentation of pension and postretirement benefit costs other than service costs on a line outside of operating income. The corresponding prior period amounts have been reclassified to conform with the current period presentation. 2 The Income tax benefit in Q4'17 is primarily due to the remeasurement of deferred tax liabilities as a result of the Tax Cuts and Jobs Act (the "Act") signed into law on December 22, 2017. The resulting net tax benefit is included in the three months ended December 31, 2017. The Act is complex and significantly changes the U.S. corporate income tax system by, among other things, reducing the Federal corporate income tax rate from 35% to 21%.
FINANCIAL SUMMARY (ADJUSTED BASIS)(UNAUDITED) 1 Non-GAAP measure - See Appendix for the definition and reconciliation to the most comparable GAAP measure. 2 Adjusted gross profit margin is defined as Adjusted gross profit divided by Net sales.3 In the first quarter of 2018, we adopted a new accounting standard that resulted in a change in the presentation of pension and postretirement benefit costs other than service costs on a line outside of operating income. The corresponding prior period amounts have been reclassified to conform with the current period presentation. 4 Adjusted operating margin is defined as Adjusted operating income divided by Net sales.5 The Income tax benefit in Q4'17 is primarily due to the remeasurement of deferred tax liabilities as a result of the Tax Cuts and Jobs Act (the "Act") signed into law on December 22, 2017. The resulting net tax benefit is included in the three months ended December 31, 2017. The Act is complex and significantly changes the U.S. corporate income tax system by, among other things, reducing the Federal corporate income tax rate from 35% to 21%.6 Adjusted EBITDA margin is defined as Adjusted EBITDA divided by Net sales.7 This information is based upon management’s current expectations and estimates, which are in part based on market and industry data. Many factors are outside the control of management, including particularly input costs for commodity products, and actual results may differ materially from the information set forth above. See “Forward-Looking Statements” on page 2.8 Debt leverage ratio is calculated as the net debt to rolling four quarter total adjusted EBITDA plus franchise taxes. (Dollars in thousands - except per-share amounts) Q1'17 Q2'17 Q3'17 Q4'17 Q1'18 Q2'18 Q3'18 Outlook7 Net sales $437,525 $429,663 $426,504 $436,716 $436,952 $432,099 0% - 1% Higher Adjusted gross profit1 $56,668 $49,820 $41,048 $61,675 $44,712 $45,768 Adjusted gross profit margin1,2 13.0 % 11.7 % 9.7 % 14.2 % 10.2 % 10.6 % Adjusted selling, general and administrative expenses1 ($31,290 ) ($30,832 ) ($29,158 ) ($29,941 ) ($28,778 ) ($27,171 ) Adjusted operating income (loss)1,3 $25,378 $18,988 $11,890 $31,734 $15,934 $18,597 Consumer Products3 $12,407 $11,916 $10,312 $11,513 $3,072 ($2,596 ) Pulp and Paperboard3 $27,200 $21,071 $14,735 $34,486 $26,445 $34,284 Corporate3 ($14,229 ) ($13,999 ) ($13,157 ) ($14,265 ) ($13,583 ) ($13,091 ) Adjusted operating margin1,4 5.8 % 4.4 % 2.8 % 7.3 % 3.6 % 4.3 % 3% - 5% Interest expense, net ($8,043 ) ($7,673 ) ($7,683 ) ($7,975 ) ($8,020 ) ($7,723 ) Non-operating pension and other postretirement benefit costs3 $48 $517 $291 $287 ($1,279 ) ($1,187 ) Adjusted income tax (provision) benefit1,5 ($6,655 ) ($3,902 ) $807 ($9,597 ) ($1,415 ) ($2,566 ) Adjusted net earnings1 $10,728 $7,930 $5,305 $14,449 $5,220 $7,121 Depreciation and amortization expense $27,557 $26,055 $25,856 $25,522 $25,167 $25,177 Adjusted EBITDA1 $49,320 $45,023 $37,621 $57,543 $39,822 $42,587 $40,000 - $46,000 Consumer Products3 $26,986 $27,671 $25,969 $25,913 $17,369 $11,624 Pulp and Paperboard3 $35,305 $29,427 $23,063 $44,171 $35,874 $43,645 Corporate3 ($12,971 ) ($12,075 ) ($11,411 ) ($12,541 ) ($13,421 ) ($12,682 ) Adjusted EBITDA margin1,6 11.3 % 10.5 % 8.8 % 13.2 % 9.1 % 9.9 % Adjusted net earnings per diluted common share1 $0.64 $0.48 $0.32 $0.87 $0.31 $0.43 Debt Leverage Ratio1,8 3.37 3.71 3.69 3.86 4.15 3.95 Cash flow from operations $45,538 $58,061 $48,577 $25,494 $30,853 $80,023 Capital Expenditures $41,804 $47,750 $49,269 $59,862 $49,747 $117,712 5
Q2’18 VS. Q1’18CONSOLIDATED ADJUSTED EBITDA1 BRIDGE 1 Non-GAAP measure – See Appendix for the definition and reconciliation to the most comparable GAAP measure. PRICE/MIX Unfavorable mix shift from converted cases to parent rolls, offset by higher paperboard pricing VOLUME Record paperboard shipments, partially offset by lower tissue converted case shipments as we work to recover converted case business PULP/WOOD FIBER Higher pulp and wood fiber prices, partially offset by pulp cost mitigation efforts TRANSPORTATION Higher freight costs due to higher line haul rates, partially offset by network optimization initiatives SG&A SG&A cost reduction initiative ADJ, EBITDA1(MILLIONS) 1 1 6
Q2’18 VS. Q2’17CONSOLIDATED ADJUSTED EBITDA1 BRIDGE 1 Non-GAAP measure – See Appendix for the definition and reconciliation to the most comparable GAAP measure. PRICE/MIX Lower pricing and product mix in tissue, partially offset by paperboard price increases VOLUME Record paperboard shipments, partially offset by lower tissue converted case shipments PULP/WOOD FIBER Higher pulp and wood fiber prices due to continued strong demand for market pulp and corrugate TRANSPORTATION Higher freight costs due to line haul rates and diesel prices coupled with higher service costs in tissue MAINTENANCE Absence of planned major outage SG&A SG&A cost reduction initiative ADJ, EBITDA1(MILLIONS) 1 1 7
1 Includes away-from-home (AFH), contract and parent roll tissue products. 2 Includes retail, AFH, and contract tissue case products.3 In the first quarter of 2018, we adopted a new accounting standard that resulted in a change in the presentation of pension and postretirement benefit costs other than service costs on a line outside of operating income. The corresponding prior period amounts have been reclassified to conform with the current period presentation.4 Non-GAAP measure – See Appendix for the definition and reconciliation to the most comparable GAAP measure. 5 Non-GAAP measure – Segment Adjusted EBITDA margin is defined as Segment Adjusted EBITDA divided by Segment net sales. KEY SEGMENT RESULTS -CONSUMER PRODUCTS(UNAUDITED) Q1'17 Q2'17 Q3'17 Q4'17 Q1'18 Q2'18 CONSUMER PRODUCTS CROSS-CYCLE FINANCIAL MODEL Shipments Retail (short tons) 78,686 77,714 77,544 75,123 80,971 73,070 Non-Retail (short tons)1 16,678 13,736 12,958 12,190 11,236 17,316 Total Tissue Tons 95,364 91,450 90,502 87,313 92,207 90,386 Converted Products (cases in thousands)2 13,123 12,709 12,727 12,662 13,262 12,027 Sales Price Retail ($/short ton) $2,772 $2,723 $2,754 $2,855 $2,715 $2,707 Non-Retail ($/short ton)1 $1,439 $1,454 $1,468 $1,480 $1,509 $1,372 Total Tissue ($/short ton) $2,539 $2,533 $2,574 $2,663 $2,568 $2,451 Segment net sales ($ in thousands) $242,423 $231,912 $232,916 $234,656 $238,842 $221,585 Segment GAAP operating income3 ($ in thousands) $6,204 $10,698 $4,525 $7,546 $1,629 ($3,604 ) Segment GAAP operating margin 2.6% 4.6% 1.9% 3.2% 0.7% (1.6)% Segment Adjusted EBITDA3,4 ($ in thousands) $26,986 $27,671 $25,969 $25,913 $17,369 $11,624 Segment Adjusted EBITDA margin5 11.1% 11.9% 11.1% 11.0% 7.3% 5.2% 17.0% 8
CLEARWATER PAPERTISSUE SHIPMENTSAND U.S. RETAIL TISSUE MARKET U.S. Retail Tissue Market Q2'18 ($) (MultiOutlet)1 CATEGORY PRIVATELABEL BRANDS TOTAL Total RetailTissue Share ($) 30 % 70 % 100 % % ChangeQ2’18 vs. Q1’18 1.4 % (1.4 )% — % 1 Data Source: IRI Worldwide data through July 1, 2018. CLW Q2'18 by Market Segment(% of Tons) CLW Q1'18 by Market Segment(% of Tons) Other Parent Rolls Parent Rolls AFH AFH Retail Retail 9
PRICE/MIX Weaker mix of converted case versus parent roll shipments as we work to recover converted case business VOLUME Lower converted case shipments PULP Price increases offset by pulp cost mitigation efforts TRANSPORTATION Network optimization initiatives, largely offset by higher freight costs due to line haul rates and diesel prices SG&A SG&A cost reduction initiative Q2'18 VS. Q1'18CONSUMER PRODUCTS ADJUSTED EBITDA1 BRIDGE 1 Non-GAAP measure – See Appendix for the definition and reconciliation to the most comparable GAAP measure. SEGMENT ADJ. EBITDA1(MILLIONS) 1 1 10
KEY SEGMENT RESULTS – PULP AND PAPERBOARD(UNAUDITED) 1 In the first quarter of 2018, we adopted a new accounting standard that resulted in a change in the presentation of pension and postretirement benefit costs other than service costs on a line outside of operating income. The corresponding prior period amounts have been reclassified to conform with the current period presentation.2 Non-GAAP measure – See Appendix for the definition and reconciliation to the most comparable GAAP measure.3 Non-GAAP measure – Segment Adjusted EBITDA margin is defined as Segment Adjusted EBITDA divided by Segment net sales. Q1'17 Q2'17 Q3'17 Q4'17 Q1'18 Q2'18 PULP ANDPAPERBOARDCROSS-CYCLEFINANCIAL MODEL Shipments Paperboard (short tons) 210,382 207,152 200,569 210,098 206,309 216,582 Sales Price Paperboard ($/short ton) $927 $955 $965 $962 $960 $972 Segment net sales ($ in thousands) $195,102 $197,751 $193,588 $202,060 $198,110 $210,514 Segment GAAP operating income1 ($ in thousands) $27,200 $21,071 $14,735 $34,354 $26,154 $34,192 Segment GAAP operating margin 13.9% 10.7% 7.6% 17.0% 13.2% 16.2% Segment Adjusted EBITDA1,2 ($ in thousands) $35,305 $29,427 $23,063 $44,171 $35,874 $43,645 Segment Adjusted EBITDA margin3 18.1% 14.9% 11.9% 21.9% 18.1% 20.7% 19.0% 11
CLEARWATER PAPERPAPERBOARD SHIPMENTS ANDU.S. PAPERBOARD MARKET U.S. Paperboard Production Q2'183 CATEGORY CLEARWATER PAPER OTHER Total Domestic SBS1 Market Share 14 % 86 % Folding 19 % 81 % Food Service2 23 % 77 % Liquid Packaging 3 % 97 % 1 Solid Bleached Sulfate.2 Food Service includes cup, plate, dish and tray products.3 Data Source: American Forest and Paper Association Solid Bleached Domestic Production – June YTD 2018. CLW Q2'18 by Market Segment(% of Tons) CLW Q1'18 by Market Segment(% of Tons) Folding Folding Liquid Pkg Liquid Pkg Food Service Food Service 12
PRICE/MIX Realization of announced price increase VOLUME Record paperboard shipments due to record production and strong demand PULP/WOOD FIBER Higher fiber costs at our Idaho facility due to strong demand for market pulp and corrugate TRANSPORTATION Higher freight costs due to line haul rates and diesel prices Q2’18 vs. Q1'18 PULP AND PAPERBOARD ADJUSTED EBITDA1 BRIDGE 1 Non-GAAP measure – See Appendix for the definition and reconciliation to the most comparable GAAP measure. SEGMENT ADJ. EBITDA1(MILLIONS) 1 1 13
CLEARWATER PAPER CROSS-CYCLE FINANCIAL MODEL 1 Non-GAAP measure – See Appendix for the definition and reconciliation to the most comparable GAAP measure. CLEARWATER PAPER CROSS-CYCLE FINANCIAL MODEL (Dollars in thousands) Q1'17 Q2'17 Q3'17 Q4'17 Q1'18 Q2'18 Net sales 100 % 100 % 100 % 100 % 100 % 100 % 100 % Adjusted gross profit margin1 13.0 % 11.7 % 9.7 % 14.2 % 10.2 % 10.6 % 17.0 % Adjusted SG&A expenses1 as % of net sales (7.2 %) (7.2 %) (6.8 %) (6.9 %) (6.6 %) (6.3 %) (6.0 %) Adjusted operating margin1 5.8 % 4.5 % 2.9 % 7.3 % 3.6 % 4.3 % 11.0 % Adjusted net earnings1 as % of net sales 2.5 % 1.8 % 1.2 % 2.5 % 1.2 % 1.6 % 5.0 % Adjusted EBITDA margin1 11.3 % 10.5 % 8.8 % 13.2 % 9.1 % 9.9 % 15.0 % 14
Q3’18 OUTLOOK1RECONCILIATION OF NON-GAAP FINANCIAL MEASURES (UNAUDITED) 1 This information is based upon management’s current expectations and estimates, which are in part based on market and industry data. Many factors are outside the control of management, including particularly input costs for commodity products, and actual results may differ materially from the information set forth above. See “Forward-Looking Statements” on page 2.2 EBITDA is a non-GAAP measure that management uses as a supplemental performance measure. The most directly comparable GAAP measure is net earnings (loss). EBITDA is net earnings adjusted for net interest expense, income taxes, and depreciation and amortization. It should not be considered as an alternative to net earnings computed under GAAP.3 Adjusted EBITDA excludes the impact of the items listed that we do not believe are indicative of our core operating performance. OUTLOOK THREE MONTHS ENDINGSEPTEMBER 30, 2018 RANGE OF ESTIMATE (Dollars in thousands) FROM TO Earnings before interest, income taxes, and depreciation & amortization (EBITDA)2: GAAP net earnings $5,100 $7,900 Interest expense, net 6,500 7,600 Income tax provision 1,800 2,800 Depreciation and amortization expense 24,700 25,800 EBITDA2 $38,100 $44,100 Directors' equity-based compensation expense 300 300 Reorganization expenses associated with SG&A cost control measures 1,200 1,200 Consumer Products reorganization related expenses 200 200 Other 200 200 Adjusted EBITDA3 $40,000 $46,000 15
Q3’18 OUTLOOK1RECONCILIATION OF NON-GAAPFINANCIAL MEASURES (UNAUDITED) 1 This information is based upon management’s current expectations and estimates, which are in part based on market and industry data. Many factors are outside the control of management, including particularly input costs for commodity products, and actual results may differ materially from the information set forth above. See “Forward-Looking Statements” on page 2.2 Adjusted operating income, Adjusted net earnings and Adjusted net earnings per diluted common share exclude the impact of the items listed that we do not believe are indicative of our core operating performance.3 All non-tax items are tax affected at a 26% annual rate.4 GAAP net earnings per diluted common share and Adjusted net earnings per diluted common share are calculated utilizing second quarter 2018 diluted average common shares outstanding of 16,555 (in thousands). OUTLOOK THREE MONTHS ENDINGSEPTEMBER 30, 2018 RANGE OF ESTIMATE (Dollars in thousands) FROM TO GAAP Operating Income $9,000 $25,500 Directors' equity-based compensation expense 300 300 Reorganization expenses associated with SG&A cost control measures 1,200 1,200 Consumer Products reorganization related expenses 200 200 Other 200 200 Adjusted operating income2 $10,900 $27,400 (Dollars in thousands) FROM TO GAAP net earnings $5,100 $7,900 Adjustments, after tax3: Directors' equity-based compensation expense 225 225 Reorganization expenses associated with SG&A cost control measures 900 900 Consumer Products reorganization related expenses 150 150 Other 150 150 Adjusted net earnings2 $6,525 $9,325 FROM TO GAAP net earnings per diluted common share4 $0.31 $0.48 Adjusted net earnings per diluted common share2,4 $0.39 $0.56 16
Q3'18 OUTLOOK1 0% - 1% Higher 3% - 5% $40M - $46M $0.39 - $0.56 NET SALES ADJUSTED OPERATING MARGIN2,3 ADJUSTED EBITDA2 ADJUSTED NET EARNINGS PER DILUTED COMMON SHARE2,4 1 This information is based upon management’s current expectations and estimates, which are in part based on market and industry data. Many factors are outside the control of management, including particularly input costs for commodity products, and actual results may differ materially from the information set forth above. See “Forward-Looking Statements” on page 2.2 Non-GAAP measure – See prior slides for the reconciliation to the most comparable GAAP measure.3 Adjusted operating margin is defined as net sales divided by adjusted operating income.4 Adjusted net earnings per diluted common share is calculated utilizing second quarter 2018 diluted average common shares outstanding of 16,555 (in thousands). 17
APPENDIX 18
ADJUSTED GROSS PROFIT& ADJUSTED SG&ARECONCILIATION OF NON-GAAPFINANCIAL MEASURES (UNAUDITED) 1 Gross profit is defined as net sales minus cost of sales.2 In the first quarter of 2018, we adopted a new accounting standard that resulted in a change in the presentation of pension and postretirement benefit costs other than service costs on a line outside of operating income. The corresponding prior period amounts have been reclassified to conform with the current period presentation. 3 Adjusted gross profit and Adjusted selling, general and administrative expenses exclude the impact of the items listed that we do not believe are indicative of our core operating performance. (Dollars in thousands) Q1'17 Q2'17 Q3'17 Q4'17 Q1'18 Q2'18 Gross profit1,2 $50,465 $48,602 $39,742 $61,258 $44,519 $44,945 Costs associated with Long Island facility closure 466 661 610 298 — — Costs associated with Oklahoma City facility closure 5,737 275 576 119 — — Write-off of assets as a result of Warehouse Automation project — 41 — — — — Accelerated depreciation of assets as a result of Warehouse Automation project — 241 120 — — — Reorganization expenses associated with SG&A cost control measures — — — — 193 31 Consumer Products reorganization related expenses — — — — — 792 Adjusted gross profit3 $56,668 $49,820 $41,048 $61,675 $44,712 $45,768 Selling, general and administrative expenses (SG&A)2 ($29,955 ) ($29,454 ) ($34,582 ) ($34,891 ) ($32,980 ) ($26,564 ) Directors' equity-based compensation (benefit) expense (1,450 ) (1,483 ) 463 (363 ) (709 ) (1,990 ) Costs associated with Oklahoma City facility closure — — 4,481 3,530 — — Manchester Industries acquisition related expenses 115 105 — — — — Reorganization expenses associated with SG&A cost control measures — — 480 1,783 4,911 1,045 Other — — — — — 338 Adjusted selling, general and administrative expenses2 ($31,290 ) ($30,832 ) ($29,158 ) ($29,941 ) ($28,778 ) ($27,171 ) 19
SEGMENT ADJUSTED OPERATING INCOME (LOSS)RECONCILIATION OF NON-GAAP FINANCIAL MEASURES (UNAUDITED) 1 In the first quarter of 2018, we adopted a new accounting standard that resulted in a change in the presentation of pension and postretirement benefit costs other than service costs on a line outside of operating income. The corresponding prior period amounts have been reclassified to conform with the current period presentation. 2 Adjusted operating income (loss) excludes the impact of the items listed that we do not believe are indicative of our core operating performance. (Dollars in thousands) Q1'17 Q2'17 Q3'17 Q4'17 Q1'18 Q2'18 Consumer Products Operating income1 $6,204 $10,698 $4,525 $7,546 $1,629 ($3,604 ) Costs associated with Long Island facility closure 466 661 610 298 — — Costs associated with Oklahoma City facility closure 5,737 275 5,057 3,649 — — Write-off of assets as a result of Warehouse Automation project — 41 — — — — Accelerated depreciation of assets as a result of Warehouse Automation project — 241 120 — — — Reorganization expenses associated with SG&A cost control measures — — — 20 1,443 216 Consumer Products reorganization related expenses — — — — — 792 Adjusted Consumer Products operating income2 $12,407 $11,916 $10,312 $11,513 $3,072 ($2,596 ) Pulp and Paperboard Operating Income1 $27,200 $21,071 $14,735 $34,354 $26,154 $34,192 Reorganization expenses associated with SG&A cost control measures — — — 132 291 92 Adjusted Pulp and Paperboard operating income2 $27,200 $21,071 $14,735 $34,486 $26,445 $34,284 Corporate Operating loss1 ($12,894 ) ($12,621 ) ($14,100 ) ($15,533 ) ($16,244 ) ($12,207 ) Directors' equity-based compensation (benefit) expense (1,450 ) (1,483 ) 463 (363 ) (709 ) (1,990 ) Manchester Industries acquisition related expenses 115 105 — — — — Reorganization expenses associated with SG&A cost control measures — — 480 1,631 3,370 768 Other — — — — — 338 Adjusted Corporate operating loss2 ($14,229 ) ($13,999 ) ($13,157 ) ($14,265 ) ($13,583 ) ($13,091 ) 20
ADJUSTED NET EARNINGS & ADJUSTED NET EARNINGS PER DILUTED COMMON SHARE RECONCILIATION OF NON-GAAP FINANCIAL MEASURES (UNAUDITED) 1 All non-tax items are tax effected at the expected annual rate for that period.2 Adjusted net earnings and Adjusted net earnings per diluted common share exclude the impact of the items listed that we do not believe are indicative of our core operating performance. 3 The federal tax rate change in Q4'17 is primarily due to the remeasurement of deferred tax liabilities as a result of the Tax Cuts and Jobs Act (the "Act") signed into law on December 22, 2017. The resulting net tax benefit is included in the three months ended December 31, 2017. The Act is complex and significantly changes the U.S. corporate income tax system by, among other things, reducing the Federal corporate income tax rate from 35% to 21%. (Dollars in thousands - except per-share amounts) Q1'17 Q2'17 Q3'17 Q4'17 Q1'18 Q2'18 GAAP net earnings $7,515 $8,037 $863 $80,924 $2,600 $6,961 Adjustments, after tax1: Directors' equity-based compensation (benefit) expense (957 ) (988 ) 306 (242 ) (532 ) (1,472 ) Costs associated with Long Island facility closure 308 440 402 199 — — Costs associated with Oklahoma City facility closure 3,786 183 3,338 2,434 — — Manchester Industries acquisition related expenses 76 70 — — — — Write-off of assets as a result of Warehouse Automation project — 27 — — — — Accelerated depreciation of assets as a result of Warehouse Automation project — 161 79 — — — Reorganization expenses associated with SG&A cost control measures — — 317 1,189 3,828 796 Federal tax rate change3 — — — (70,055 ) — — Impact of state tax rate changes — — — — (676 ) — Consumer Products reorganization related expenses — — — — — 586 Other — — — — — 250 Adjusted net earnings2 $10,728 $7,930 $5,305 $14,449 $5,220 $7,121 Net earnings per diluted common share $0.45 $0.48 $0.05 $4.88 $0.16 $0.42 Adjustments, after tax1: Directors' equity-based compensation (benefit) expense (0.06 ) (0.06 ) 0.02 (0.01 ) (0.03 ) (0.09 ) Costs associated with Long Island facility closure 0.02 0.03 0.02 0.01 — — Costs associated with Oklahoma City facility closure 0.23 0.01 0.20 0.15 — — Manchester Industries acquisition related expenses — 0.01 — — — — Write-off of assets as a result of Warehouse Automation project — — — — — — Accelerated depreciation of assets as a result of Warehouse Automation project — 0.01 0.01 — — — Reorganization expenses associated with SG&A cost control measures — — 0.02 0.07 0.22 0.04 Federal tax rate change3 — — — (4.23 ) — — Impact of state tax rate changes — — — — (0.04 ) — Consumer Products reorganization related expenses — — — — — 0.04 Other — — — — — 0.02 Adjusted net earnings per diluted common share2 $0.64 $0.48 $0.32 $0.87 $0.31 $0.43 21
ADJUSTED INCOME TAX PROVISION RECONCILIATION OF NON-GAAP FINANCIAL MEASURE (UNAUDITED) 1 Adjusted income tax provision excludes the impact of the items listed that we do not believe are indicative of our core operating performance.2The federal tax rate change in Q4'17 is primarily due to the remeasurement of deferred tax liabilities as a result of the Tax Cuts and Jobs Act (the "Act") signed into law on December 22, 2017. The resulting net tax benefit is included in the three months ended December 31, 2017. The Act is complex and significantly changes the U.S. corporate income tax system by, among other things, reducing the Federal corporate income tax rate from 35% to 21%. (Dollars in thousands) Q1'17 Q2'17 Q3'17 Q4'17 Q1'18 Q2'18 GAAP income tax (provision) benefit ($5,000 ) ($3,955 ) $3,095 $62,245 $360 ($2,510 ) Adjustments, tax impact: Directors' equity-based compensation benefit (expense) 493 495 (157 ) 121 177 518 Costs associated with Long Island facility closure (158 ) (221 ) (208 ) (99 ) — — Costs associated with Oklahoma City facility closure (1,951 ) (92 ) (1,719 ) (1,215 ) — — Manchester Industries acquisition related expenses (39 ) (35 ) — — — — Write-off of assets as a result of Warehouse Automation project — (14 ) — — — — Accelerated depreciation of assets as a result of Warehouse Automation project — (80 ) (41 ) — — — Reorganization expenses associated with SG&A cost control measures — — (163 ) (594 ) (1,276 ) (280 ) Federal tax rate change2 — — — (70,055 ) — — Impact of state tax rate changes — — — — (676 ) — Consumer Products reorganization related expenses — — — — — (206 ) Other — — — — — (88 ) Adjusted income tax (provision) benefit1 ($6,655 ) ($3,902 ) $807 ($9,597 ) ($1,415 ) ($2,566 ) 22
EBITDA & ADJUSTED EBITDA RECONCILIATION OF NON-GAAP FINANCIAL MEASURES (UNAUDITED) 1 EBITDA is a non-GAAP measure that management uses as a supplemental performance measure. The most directly comparable GAAP measure is net earnings. EBITDA is net earnings adjusted for net interest expense, income taxes, and depreciation and amortization. It should not be considered as an alternative to net earnings computed under GAAP.2 Adjusted EBITDA excludes the impact of the items listed that we do not believe are indicative of our core operating performance. (Dollars in thousands) Q1'17 Q2'17 Q3'17 Q4'17 Q1'18 Q2'18 Earnings before interest, income taxes, and depreciation & amortization (EBITDA)1 GAAP net earnings $7,515 $8,037 $863 $80,924 $2,600 $6,961 Interest expense, net 8,043 7,673 7,683 7,975 8,020 7,723 Income tax provision (benefit) 5,000 3,955 (3,095 ) (62,245 ) (360 ) 2,510 Depreciation and amortization expense 27,557 26,055 25,856 25,522 25,167 25,177 EBITDA1 $48,115 $45,720 $31,307 $52,176 $35,427 $42,371 Directors' equity-based compensation (benefit) expense (1,450 ) (1,483 ) 463 (363 ) (709 ) (1,990 ) Costs associated with Long Island facility closure 466 365 314 298 — — Costs associated with Oklahoma City facility closure 2,074 275 5,057 3,649 — — Manchester Industries acquisition related expenses 115 105 — — — — Write-off of assets as a result of Warehouse Automation project — 41 — — — — Reorganization expenses associated with SG&A cost control measures — — 480 1,783 5,104 1,076 Consumer Products reorganization related expenses — — — — — 792 Other — — — — — 338 Adjusted EBITDA2 $49,320 $45,023 $37,621 $57,543 $39,822 $42,587 23
SEGMENT EBITDA & ADJUSTED EBITDA RECONCILIATION OF NON-GAAPFINANCIAL MEASURES (UNAUDITED) 1 In the first quarter of 2018, we adopted a new accounting standard that resulted in a change in the presentation of pension and postretirement benefit costs other than service costs on a line outside of operating income. The corresponding prior period amounts have been reclassified to conform with the current period presentation. 2 Segment EBITDA is a non-GAAP measure that management uses as a supplemental performance measure. The most directly comparable GAAP measure is segment operating income (loss). Segment EBITDA is segment operating income (loss) adjusted for depreciation and amortization and non-operating pension and other postretirement benefit costs. It should not be considered as an alternative to segment operating income (loss) computed under GAAP. 3 Segment Adjusted EBITDA excludes the impact of the items listed that we do not believe are indicative of our core operating performance. (Dollars in thousands) Q1'17 Q2'17 Q3'17 Q4'17 Q1'18 Q2'18 Consumer Products Operating income1 $6,204 $10,698 $4,525 $7,546 $1,629 ($3,604 ) Depreciation and amortization expense 18,242 16,292 16,073 14,400 14,297 14,220 Segment EBITDA2 $24,446 $26,990 $20,598 $21,946 $15,926 $10,616 Costs associated with Long Island facility closure 466 365 314 298 — — Costs associated with Oklahoma City facility closure 2,074 275 5,057 3,649 — — Write-off of assets as a result of Warehouse Automation project — 41 — — — — Reorganization expenses associated with SG&A cost control measures — — — 20 1,443 216 Consumer Products reorganization related expenses — — — — — 792 Segment Adjusted EBITDA3 $26,986 $27,671 $25,969 $25,913 $17,369 $11,624 Pulp and Paperboard Operating income1 $27,200 $21,071 $14,735 $34,354 $26,154 $34,192 Depreciation and amortization expense 8,105 8,356 8,328 9,685 9,429 9,361 Segment EBITDA2 $35,305 $29,427 $23,063 $44,039 $35,583 $43,553 Reorganization expenses associated with SG&A cost control measures — — — 132 291 92 Segment Adjusted EBITDA3 $35,305 $29,427 $23,063 $44,171 $35,874 $43,645 Corporate Operating loss1 ($12,894 ) ($12,621 ) ($14,100 ) ($15,533 ) ($16,244 ) ($12,207 ) Depreciation and amortization expense 1,210 1,407 1,455 1,437 1,441 1,596 Non-operating pension and other postretirement benefit costs1 48 517 291 287 (1,279 ) (1,187 ) Corporate EBITDA2 ($11,636 ) ($10,697 ) ($12,354 ) ($13,809 ) ($16,082 ) ($11,798 ) Directors' equity-based compensation (benefit) expense (1,450 ) (1,483 ) 463 (363 ) (709 ) (1,990 ) Manchester Industries acquisition related expenses 115 105 — — — — Reorganization expenses associated with SG&A cost control measures — — 480 1,631 3,370 768 Other — — — — — 338 Corporate Adjusted EBITDA3 ($12,971 ) ($12,075 ) ($11,411 ) ($12,541 ) ($13,421 ) ($12,682 ) 24
FOR MORE INFORMATION:WWW.CLEARWATERPAPER.COM 25