Attached files
| file | filename |
|---|---|
| 8-K - FORM 8-K - COMMUNITY FINANCIAL CORP /MD/ | f8k_080118.htm |
Exhibit 99.1
1 Parent of: KBW Investor Conference July 2018
2 Certain statements contained in this communication may not be based on historical facts and are “forward - looking statements” within the meaning of Section 27 A of the Securities Act of 1933 , as amended, and Section 21 E of the Securities Exchange Act of 1934 , as amended . Forward - looking statements can generally be identified by the fact that they do not relate strictly to historical or current facts . They often include words like “believe,” “expect,” “anticipate,” “estimate” and “intend” or future or conditional verbs such as “will,” “would,” “should,” “could” or “may . ” Statements in this communication that are not strictly historical are forward - looking and are based upon current expectations that may differ materially from actual results . These forward - looking statements include, without limitation, those relating to The Community Financial Corporation’s and Community Bank of the Chesapeake’s future growth and management’s outlook or expectations for revenue, assets, asset quality, profitability, business prospects, net interest margin, non - interest revenue, allowance for loan losses, the level of credit losses from lending, liquidity levels, capital levels, or other future financial or business performance strategies or expectations, and any statements of the plans and objectives of management for future operations products or services ; plans and cost savings regarding branch closings or consolidation ; any statement of expectation or belief ; projections related to certain financial metrics ; and any statement of assumptions underlying the foregoing . These forward - looking statements express management’s current expectations or forecasts of future events, results and conditions, and by their nature are subject to and involve risks and uncertainties that could cause actual results to differ materially from those anticipated by the statements made herein . Factors that might cause actual results to differ materially from those made in such statements include, but are not limited to : the synergies and other expected financial benefits from County First acquisition may not be realized within the expected time frames ; costs or difficulties related to integration matters might be greater than expected ; changes in The Community Financial Corporation’s or Community Bank of the Chesapeake’s operating or expansion strategy ; availability of and costs associated with obtaining adequate and timely sources of liquidity ; the ability to maintain credit quality ; general economic trends ; changes in interest rates ; loss of deposits and loan demand to other financial institutions ; substantial changes in financial markets ; changes in real estate value and the real estate market ; regulatory changes ; the possibility of unforeseen events affecting the industry generally ; the uncertainties associated with newly developed or acquired operations ; the outcome of litigation that may arise ; market disruptions and other effects of terrorist activities ; and the matters described in “Item 1 A Risk Factors” in the Company’s Annual Report on Form 10 - K for the Year Ended December 31 , 2017 , and in its other reports and communications filed with the Securities and Exchange Commission (the “SEC”) . These forward - looking statements may also be subject to other risks and uncertainties, including those that we may discuss elsewhere in this communication or in our filings with the SEC, accessible on the SEC’s Web site at www . sec . gov . We undertake no obligation to update these forward - looking statements to reflect events or circumstances after the date hereof or to reflect the occurrence of unforeseen events, except as required under the rules and regulations of the SEC . You are cautioned not to place undue reliance on the forward - looking statements contained in this communication in that actual results could differ materially from those indicated in such forward - looking statements, due to a variety of factors . Any forward - looking statement speaks only as of the date of this communication, and we undertake no obligation to update these forward - looking statements to reflect events or circumstances that occur after the date of this communication . Annualized, pro forma, projected and estimated numbers are used for illustrative purpose only, are not forecasts, and may not reflect actual results . Forward Looking Information

3 Second Quarter 2018 Financial Update

4 Investment Highlights x More than 30 consecutive years of profitability x Increased Momentum: • Profitability • Loan and Deposit Growth • Asset Quality Improvement x Positioned in Demographically Attractive Markets x Strong Market Share Position in Core Market x Strong, Experienced Management Team The Community Financial Corporation Acquisition of County First Bank (January 2018) x Financially attractive x Achievable cost savings opportunities x Enhances positioning within attractive Southern Maryland markets x Acquisition of low cost, stable core deposit base x Comprehensive due diligence conducted x Low integration risk
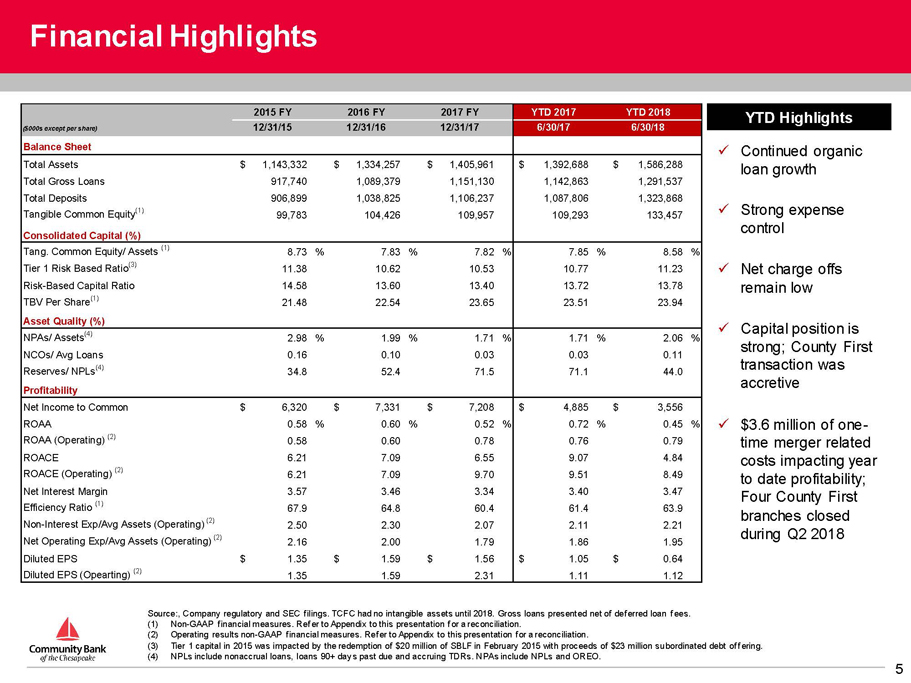
5 Financial Highlights Source:, Company regulatory and SEC filings. TCFC had no intangible assets until 2018. Gross loans presented net of deferred loa n fees. (1) Non - GAAP financial measures. Refer to Appendix to this presentation for a reconciliation. (2) Operating results non - GAAP financial measures. Refer to Appendix to this presentation for a reconciliation. (3) Tier 1 capital in 2015 was impacted by the redemption of $20 million of SBLF in February 2015 with proceeds of $23 million su bor dinated debt offering. (4) NPLs include nonaccrual loans, loans 90+ days past due and accruing TDRs. NPAs include NPLs and OREO. x Continued organic loan growth x Strong expense control x Net charge offs remain low x Capital position is strong; County First transaction was accretive x $3.6 million of one - time merger related costs impacting year to date profitability; Four County First branches closed during Q2 2018 YTD Highlights 2015 FY 2016 FY 2017 FY YTD 2017 YTD 2018 ($000s except per share) 12/31/15 12/31/16 12/31/17 6/30/17 6/30/18 Balance Sheet Total Assets 1,143,332$ 1,334,257$ 1,405,961$ 1,392,688$ 1,586,288$ Total Gross Loans 917,740 1,089,379 1,151,130 1,142,863 1,291,537 Total Deposits 906,899 1,038,825 1,106,237 1,087,806 1,323,868 Tangible Common Equity (1) 99,783 104,426 109,957 109,293 133,457 Consolidated Capital (%) Tang. Common Equity/ Assets (1) 8.73 % 7.83 % 7.82 % 7.85 % 8.58 % Tier 1 Risk Based Ratio (3) 11.38 10.62 10.53 10.77 11.23 Risk-Based Capital Ratio 14.58 13.60 13.40 13.72 13.78 TBV Per Share (1) 21.48 22.54 23.65 23.51 23.94 Asset Quality (%) NPAs/ Assets (4) 2.98 % 1.99 % 1.71 % 1.71 % 2.06 % NCOs/ Avg Loans 0.16 0.10 0.03 0.03 0.11 Reserves/ NPLs (4) 34.8 52.4 71.5 71.1 44.0 8034 8138 8540 10434 8,591.00 Profitability Net Income to Common 6,320$ 7,331$ 7,208$ 4,885$ 3,556$ ROAA 0.58 % 0.60 % 0.52 % 0.72 % 0.45 % ROAA (Operating) (2) 0.58 0.60 0.78 0.76 0.79 ROACE 6.21 7.09 6.55 9.07 4.84 ROACE (Operating) (2) 6.21 7.09 9.70 9.51 8.49 Net Interest Margin 3.57 3.46 3.34 3.40 3.47 Efficiency Ratio (1) 67.9 64.8 60.4 61.4 63.9 Non-Interest Exp/Avg Assets (Operating) (2) 2.50 2.30 2.07 2.11 2.21 Net Operating Exp/Avg Assets (Operating) (2) 2.16 2.00 1.79 1.86 1.95 Diluted EPS 1.35$ 1.59$ 1.56$ 1.05$ 0.64$ Diluted EPS (Opearting) (2) 1.35 1.59 2.31 1.11 1.12

6 Loan Composition Loan Composition (12/31/2017) Loan Composition (06/30/2018) Source: Management and company filings. Gross loans presented net of deferred loan fees. $1.2 Billion Yield: 4.45% Owner Occupied CRE was $316 million at 12/31/17 and $338 million at 06/30/2018 x CRE Regulatory concentrations reduced to 294% at June 30, 2018 from of 310% at December 31, 2017. Construction at 65% for both periods. x Commercial Bank Model – 83% and 81% commercial real estate, residential rentals and commercial & industrial loans as of June 30, 2018 and December 31, 2017. County First acquisition and 2018 organic growth has been predominantly commercial. Owner Occ. CRE and C&I , 33% Residential Rentals , 10% Commercial Real Estate , 38% Residential Construction , 2% Residential & Consumer , 17% $1.3 Billion Owner Occ. CRE and C&I , 32% Residential Rentals , 10% Commercial Real Estate , 41% Residential Construction , 2% Residential & Consumer , 16% Yield: 4.57%

7 Asset Quality Trends NPAs & 90+PD / Assets (1) Allowance for Loan Losses / Loans Allowance for Loan Losses / NPLs (2) NCOs / Avg. Loans Source: SNL Financial and company filings. Peers include 11 institutions headquartered in MD, VA or DC with assets between $7 50 million and $3.0 billion and are publicly traded on a major exchange. Excludes acquisition targets. Data as of 12/31/17. Peer data as of the most recently reported period. (1) Nonperforming Assets = Nonaccrual + accruing TDRs + 90 day past due + OREO. (2) Nonperforming Loans = Nonaccrual + accruing TDRs + 90 day past due. 2.60% 2.71% 2.98% 1.99% 1.71% 2.06% 2.17% 1.49% 1.83% 1.21% 1.00% 1.44% 0.00% 1.00% 2.00% 3.00% 4.00% 2013Y 2014Y 2015Y 2016Y 2017Y YTD TCFC TCFC Excl. TDRs Regional Peer Median 52.7% 82.6% 79.5% 117.7% 224.1% 74.0% 41.1% 36.1% 34.8% 52.4% 71.5% 44.0% 0% 50% 100% 150% 200% 250% 2013Y 2014Y 2015Y 2016Y 2017Y YTD TCFC Excl. TDRs TCFC Regional Peer Median 1.01% 0.97% 0.93% 0.91% 0.91% 0.83% 0.00% 0.50% 1.00% 1.50% 2.00% 2013Y 2014Y 2015Y 2016Y 2017Y YTD TCFC Regional Peer Median 0.14% 0.28% 0.16% 0.10% 0.03% 0.11% 0.00% 0.25% 0.50% 0.75% 1.00% 2013Y 2014Y 2015Y 2016Y 2017Y YTD TCFC Regional Peer Median
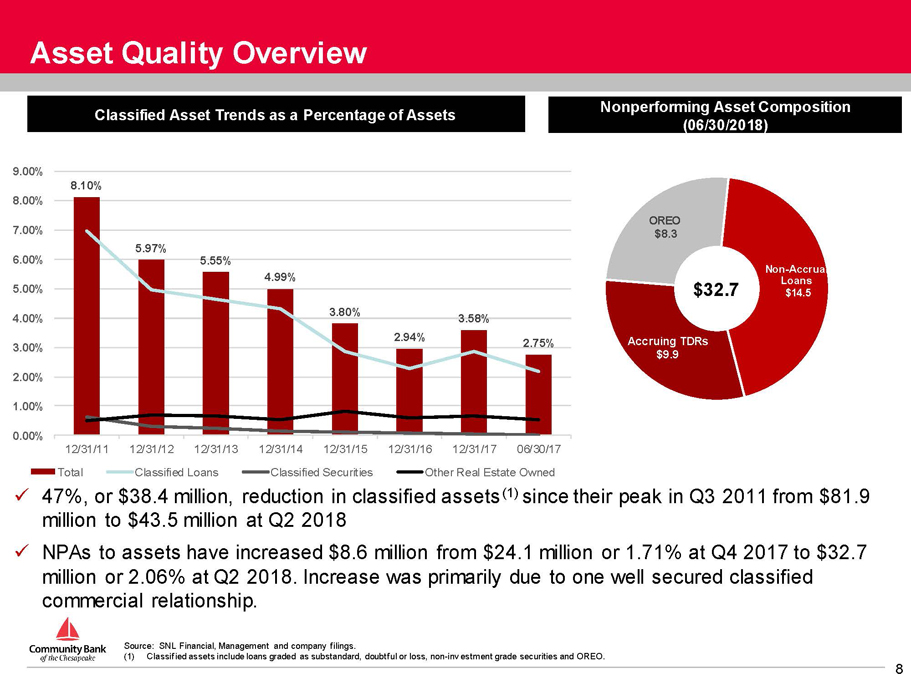
8 Asset Quality Overview Source: SNL Financial, Management and company filings. (1) Classified assets include loans graded as substandard, doubtful or loss, non - investment grade securities and OREO. Classified Asset Trends as a Percentage of Assets Nonperforming Asset Composition (06/30/2018) x 47%, or $38.4 million, reduction in classified assets (1) since their peak in Q3 2011 from $81.9 million to $43.5 million at Q2 2018 x NPAs to assets have increased $8.6 million from $24.1 million or 1.71% at Q4 2017 to $32.7 million or 2.06% at Q2 2018. Increase was primarily due to one well secured classified commercial relationship. $32.7 8.10% 5.97% 5.55% 4.99% 3.80% 2.94% 3.58% 2.75% 0.00% 1.00% 2.00% 3.00% 4.00% 5.00% 6.00% 7.00% 8.00% 9.00% 12/31/11 12/31/12 12/31/13 12/31/14 12/31/15 12/31/16 12/31/17 06/30/17 Total Classified Loans Classified Securities Other Real Estate Owned Non - Accrual Loans $14.5 Accruing TDRs $9.9 OREO $8.3

9 Expanding Market Share Position in Southern Maryland Source: SNL Financial. (1) Includes Calvert, Charles and Saint Mary’s Counties. Deposit market share data as of 6/30/17. (2) Includes only counties with overlap between TCFC and County First Bank; dollars in thousands. Median HH Income by County (2) Deposit Market Share – MD Markets (1) $93 $93 $113 $61 Charles Saint Mary's Calvert US Pro Forma Franchise Rank Institution (ST) Deposits in Market ($mm) Market Share (%) Pro Forma - TCFC 1,274 25.5 1 Community Financial Corp. 1,065 21.3 2 PNC Financial Services Group Inc. 1,005 20.1 3 Bank of America Corp. 986 19.7 4 Old Line Bancshares Inc. 501 10.0 5 BB&T Corp. 392 7.8 6 SunTrust Banks Inc. 390 7.8 7 M&T Bank Corp. 212 4.2 8 County First Bank 209 4.2 9 Capital One Financial Corp. 98 2.0 10 Wells Fargo & Co. 76 1.5 TCFC CUMD – La Plata – Retained (1) CUMD – Closed May 2018 (4)

10 Deposit Franchise Source: Management and company filings. Deposit Composition (12/31/2017) $1.3 Billion x At June 30, 2018 the Bank’s deposit funding consisted of approximately 66% transaction accounts compared to 59% at December 31, 2017. Time deposits have decreased as a percentage of funding and $5 million in current year. x Retail deposits have increased $266 million or 27% while brokered deposits have decreased $48 million since December 31, 2018. x Organic transaction deposit growth of $70 million in 2018 and the County First acquisition facilitated a reduction in wholesale funding (FHLB advances and brokered deposits) to 8.7% of assets at 06/30/2018 compered to 18.7% at 12/31/18. Deposit Composition (06/30/2018) $1.1 Billion IB Transaction 45% NIB Transaction 14% Time Deposits 41% IB Transaction 50% NIB Transaction 16% Time Deposits 34%

11 Deposit Franchise – Cost of Funds Cost of Funding Source: Management and company filings. x Success in increasing transaction deposits, including noninterest bearing deposits, has helped alleviate pressure on cost of funds in 2018. x 2018 acquisition of County First and paydown of wholesale funds decreased betas in first six months of 2018. 1.43% 1.05% 0.71% 0.56% 0.48% 0.48% 0.56% 0.68% 1.59% 1.21% 0.88% 0.74% 0.75% 0.73% 0.81% 0.89% 0.00% 0.20% 0.40% 0.60% 0.80% 1.00% 1.20% 1.40% 1.60% 1.80% 2011Y 2012Y 2013Y 2014Y 2015Y 2016Y 2017Y 2018YTD Cost of Deposits Cost of Funds

12 66.8% 66.6% 68.0% 64.8% 60.4% 63.9% 40.0% 50.0% 60.0% 70.0% 80.0% 2013Y 2014Y 2015Y 2016Y 2017Y YTD TCFC Regional Peer Median Focus on Efficiency & Expenses Efficiency Ratio Reported Noninterest Expense / Avg. Assets Source: SNL Financial and company filings. Data as of 6/30/18. Regional peers include 11 institutions headquartered in MD, VA or DC with assets between $750 million and $3.0 billion and ar e p ublicly traded on a major exchange. Excludes acquisition targets. Efficiency ratio is a non - GAAP financial measure; refer to Appendix to this presentation for a reconciliati on. x Historically maintained our efficiency ratio below peer institutions x Expense discipline continued through recent growth history, including expansion into Fredericksburg, VA and Anne Arundel County, MD markets x Review operating expense base for specific savings initiatives, including closure of underperforming branches x Expense control remains paramount through the integration of the County First acquisition x Cost savings from County First on target to be fully realized by Q4 2018. x Merger expenses below original estimates 2.13% 2.21% 2.56% 2.56% 2.60% 2.37% 2.19% 2.71% 0.00% 1.00% 2.00% 3.00% 4.00% 2013Y 2014Y 2015Y 2016Y 2017Y YTD TCFC ex. Merger TCFC Reported Regional Peer Median
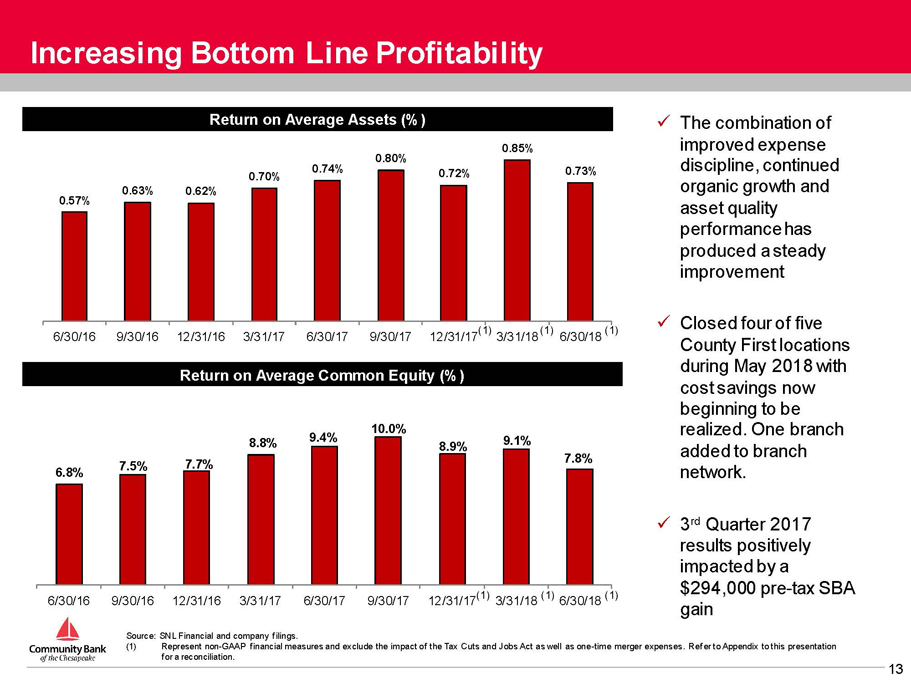
13 Increasing Bottom Line Profitability Return on Average Assets (%) Source: SNL Financial and company filings. (1) Represent non - GAAP financial measures and exclude the impact of the Tax Cuts and Jobs Act as well as one - time merger expense s. Refer to Appendix to this presentation for a reconciliation. x The combination of improved expense discipline, continued organic growth and asset quality performance has produced a steady improvement x Closed four of five County First locations during May 2018 with cost savings now beginning to be realized. One branch added to branch network. x 3 rd Quarter 2017 results positively impacted by a $294,000 pre - tax SBA gain Return on Average Common Equity (%) 0.57% 0.63% 0.62% 0.70% 0.74% 0.80% 0.72% 0.85% 0.73% 6/30/16 9/30/16 12/31/16 3/31/17 6/30/17 9/30/17 12/31/17 3/31/18 6/30/18 6.8% 7.5% 7.7% 8.8% 9.4% 10.0% 8.9% 9.1% 7.8% 6/30/16 9/30/16 12/31/16 3/31/17 6/30/17 9/30/17 12/31/17 3/31/18 6/30/18 (1) (1) (1) (1) (1) (1)

14 $10.02 $10.48 $10.98 $12.06 $13.09 $14.28 $16.79 $17.23 $17.43 $18.25 $18.32 $19.34 $19.52 $20.53 $21.48 $22.54 $23.65 $23.94 $- $5.00 $10.00 $15.00 $20.00 $25.00 $30.00 2001 2002 2003 2004 2005 2006 2007 2008 2009 2010 2011 2012 2013 2014 2015 2016 2017 6/30/2018 2001 2002 2003 2004 2005 2006 2007 2008 2009 2010 2011 2012 2013 2014 2015 2016 2017 6/30/2018 Consistent Shareholder Value Creation Source: SNL Financial and company filings. Note: Tangible book value per share is a non - GAAP financial measure. Refer to Appendix to this presentation for a reconciliation . In October 2013, the Company issued 1,591,300 shares of common stock at a price of $18.75 per share resulting in net proceeds of $27.4 million after commissions and related offering expenses. The additional shares outstanding impacted year to year comparability of per share book value amounts beginning with the year end ed December 31, 2013.

15 Appendix

16 Executive Leadership Team William J. Pasenelli x EVP and Chief Risk Officer x Joined in 2005 x Former EVP and Senior Loan Officer at Mercantile Southern Maryland Bank x President and Chief Executive Officer x Joined in 2000 x Former CFO of Acacia Federal Savings Bank (1987 - 2000) James M. Burke Todd L. Capitani x EVP and Chief Financial Officer x Joined in 2009 x Former Senior Finance Manager with Deloitte Consulting and CFO of Ruesch International, Inc. Christy M. Lombardi x EVP and Chief Administrative Officer x Joined in 1998 x Oversees human resources and shareholder relations Gregory Cockerham x EVP and Chief Lending Officer x Joined in 1988 x Former Executive with Maryland National Bank James F. Di Misa x EVP and Chief Operating Officer x Joined in 2005 x Former EVP at Mercantile Southern Maryland Bank
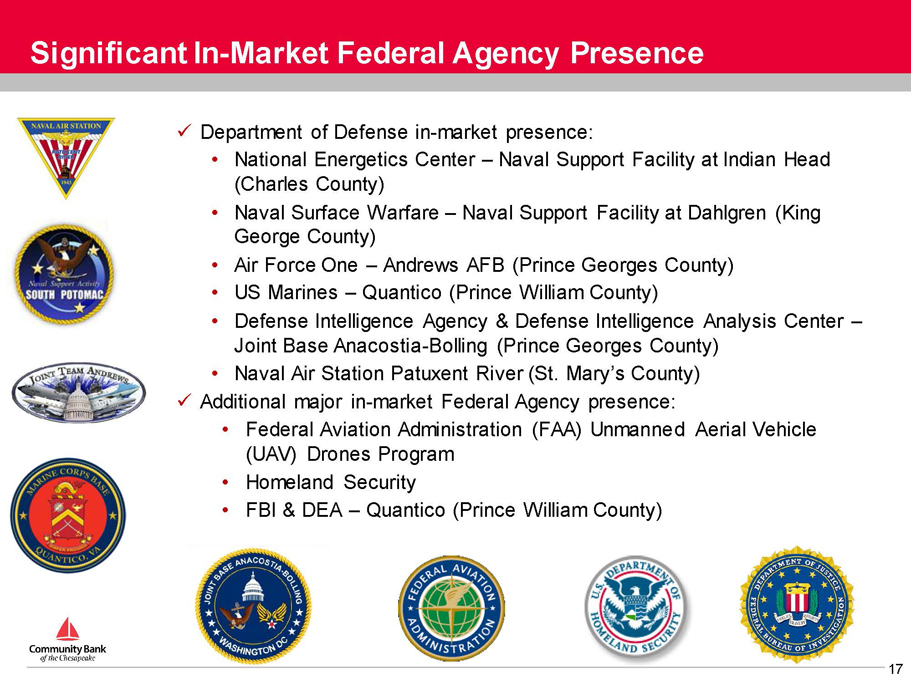
17 Significant In - Market Federal Agency Presence x Department of Defense in - market presence: • National Energetics Center – Naval Support Facility at Indian Head (Charles County) • Naval Surface Warfare – Naval Support Facility at Dahlgren (King George County) • Air Force One – Andrews AFB (Prince Georges County) • US Marines – Quantico (Prince William County) • Defense Intelligence Agency & Defense Intelligence Analysis Center – Joint Base Anacostia - Bolling (Prince Georges County) • Naval Air Station Patuxent River (St. Mary’s County) x Additional major in - market Federal Agency presence: • Federal Aviation Administration (FAA) Unmanned Aerial Vehicle (UAV) Drones Program • Homeland Security • FBI & DEA – Quantico (Prince William County)

18 Non - GAAP Reconciliation ‘‘Tangible book value per share’’ is defined as tangible stockholders’ equity less preferred equity and intangible assets divided by total common shares outstanding . We believe that this measure is important to many investors in the marketplace who are interested in changes from period to period in book value per common share exclusive of changes in intangible assets . Source: Management and company filings. Tangible Book Value Per Share & Tangible Common Equity / Tangible Assets (dollars in thousands, except share data) For the Years Ended 2000 2001 2002 2003 2004 2005 2006 2007 2008 2009 Stockholders' Equity 23,430$ 25,586$ 26,873$ 27,912$ 31,124$ 34,578$ 37,729$ 48,847$ 67,114$ 68,190$ Intangible Assets - - - - - - - - - - Preferred Equity - - - - - - - - (16,317) (16,317) Tangible Common Equity 23,430$ 25,586$ 26,873$ 27,912$ 31,124$ 34,578$ 37,729$ 48,847$ 50,797$ 51,873$ Shares Outstanding 2,624,670 2,554,218 2,564,252 2,542,314 2,580,444 2,641,487 2,642,288 2,909,974 2,947,759 2,976,041 Tangible Book Value per Share 8.93$ 10.02$ 10.48$ 10.98$ 12.06$ 13.09$ 14.28$ 16.79$ 17.23$ 17.43$ (dollars in thousands, except share data) For the Years Ended For the Period Ended 2010 2011 2012 2013 2014 2015 2016 2017 6/30/2017 6/30/2018 Stockholders' Equity 71,105$ 75,454$ 79,047$ 110,730$ 116,559$ 99,783$ 104,426$ 109,957$ 109,293$ 147,246$ Intangible Assets - - - - - - - - - (13,789) Preferred Equity (16,317) (20,000) (20,000) (20,000) (20,000) - - - - - Tangible Common Equity 54,788$ 55,454$ 59,047$ 90,730$ 96,559$ 99,783$ 104,426$ 109,957$ 109,293$ 133,457$ Total Assets 885,936$ 983,480$ 981,639$ 1,023,824$ 1,082,878$ 1,143,332$ 1,334,257$ 1,405,961$ 1,392,688$ 1,586,288$ Intangible Assets - - - - - - - - - (13,789) Tangible Assets 885,936$ 983,480$ 981,639$ 1,023,824$ 1,082,878$ 1,143,332$ 1,334,257$ 1,405,961$ 1,392,688$ 1,572,499$ Shares Outstanding 3,002,616 3,026,557 3,052,416 4,647,407 4,702,715 4,645,429 4,633,868 4,649,658 4,648,199 5,574,511 Tangible Book Value per Share 18.25$ 18.32$ 19.34$ 19.52$ 20.53$ 21.48$ 22.54$ 23.65$ 23.51$ 23.94$ Tangible Common Equity / Tang. Assets 6.18% 5.64% 6.02% 8.86% 8.92% 8.73% 7.83% 7.82% 7.85% 8.49%
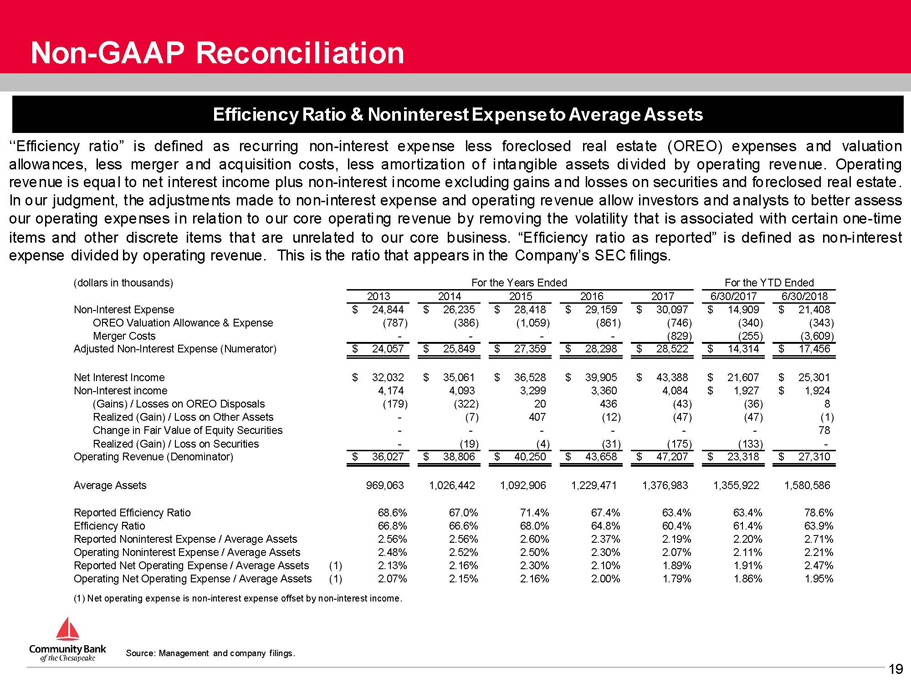
19 Efficiency Ratio & Noninterest Expense to Average Assets ‘‘Efficiency ratio” is defined as recurring non - interest expense less foreclosed real estate (OREO) expenses and valuation allowances, less merger and acquisition costs, less amortization of intangible assets divided by operating revenue . Operating revenue is equal to net interest income plus non - interest income excluding gains and losses on securities and foreclosed real estate . In our judgment, the adjustments made to non - interest expense and operating revenue allow investors and analysts to better assess our operating expenses in relation to our core operating revenue by removing the volatility that is associated with certain one - time items and other discrete items that are unrelated to our core business . “Efficiency ratio as reported” is defined as non - interest expense divided by operating revenue . This is the ratio that appears in the Company’s SEC filings . Source: Management and company filings. Non - GAAP Reconciliation (dollars in thousands) For the Years Ended For the YTD Ended 2013 2014 2015 2016 2017 6/30/2017 6/30/2018 Non-Interest Expense 24,844$ 26,235$ 28,418$ 29,159$ 30,097$ 14,909$ 21,408$ OREO Valuation Allowance & Expense (787) (386) (1,059) (861) (746) (340) (343) Merger Costs - - - - (829) (255) (3,609) Adjusted Non-Interest Expense (Numerator) 24,057$ 25,849$ 27,359$ 28,298$ 28,522$ 14,314$ 17,456$ Net Interest Income 32,032$ 35,061$ 36,528$ 39,905$ 43,388$ 21,607$ 25,301$ Non-Interest income 4,174 4,093 3,299 3,360 4,084 1,927$ 1,924$ (Gains) / Losses on OREO Disposals (179) (322) 20 436 (43) (36) 8 Realized (Gain) / Loss on Other Assets - (7) 407 (12) (47) (47) (1) Change in Fair Value of Equity Securities - - - - - - 78 Realized (Gain) / Loss on Securities - (19) (4) (31) (175) (133) - Operating Revenue (Denominator) 36,027$ 38,806$ 40,250$ 43,658$ 47,207$ 23,318$ 27,310$ Average Assets 969,063 1,026,442 1,092,906 1,229,471 1,376,983 1,355,922 1,580,586 Reported Efficiency Ratio 68.6% 67.0% 71.4% 67.4% 63.4% 63.4% 78.6% Efficiency Ratio 66.8% 66.6% 68.0% 64.8% 60.4% 61.4% 63.9% Reported Noninterest Expense / Average Assets 2.56% 2.56% 2.60% 2.37% 2.19% 2.20% 2.71% Operating Noninterest Expense / Average Assets 2.48% 2.52% 2.50% 2.30% 2.07% 2.11% 2.21% Reported Net Operating Expense / Average Assets (1) 2.13% 2.16% 2.30% 2.10% 1.89% 1.91% 2.47% Operating Net Operating Expense / Average Assets (1) 2.07% 2.15% 2.16% 2.00% 1.79% 1.86% 1.95% (1) Net operating expense is non-interest expense offset by non-interest income.
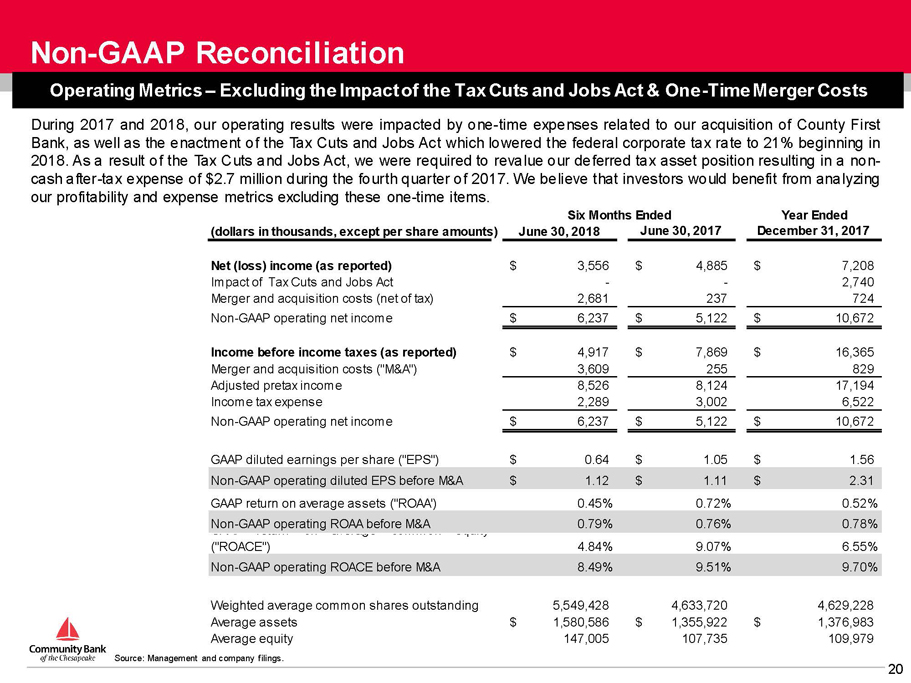
20 Operating Metrics – Excluding the Impact of the Tax Cuts and Jobs Act & One - Time Merger Costs During 2017 and 2018 , our operating results were impacted by one - time expenses related to our acquisition of County First Bank, as well as the enactment of the Tax Cuts and Jobs Act which lowered the federal corporate tax rate to 21 % beginning in 2018 . As a result of the Tax Cuts and Jobs Act, we were required to revalue our deferred tax asset position resulting in a non - cash after - tax expense of $ 2 . 7 million during the fourth quarter of 2017 . We believe that investors would benefit from analyzing our profitability and expense metrics excluding these one - time items . Source: Management and company filings. Non - GAAP Reconciliation Six Months Ended Year Ended (dollars in thousands, except per share amounts) June 30, 2018 June 30, 2017 December 31, 2017 Net (loss) income (as reported) 3,556$ 4,885$ 7,208$ Impact of Tax Cuts and Jobs Act - - 2,740 Merger and acquisition costs (net of tax) 2,681 237 724 Non-GAAP operating net income 6,237$ 5,122$ 10,672$ Income before income taxes (as reported) 4,917$ 7,869$ 16,365$ Merger and acquisition costs ("M&A") 3,609 255 829 Adjusted pretax income 8,526 8,124 17,194 Income tax expense 2,289 3,002 6,522 Non-GAAP operating net income 6,237$ 5,122$ 10,672$ GAAP diluted earnings per share ("EPS") 0.64$ 1.05$ 1.56$ Non-GAAP operating diluted EPS before M&A 1.12$ 1.11$ 2.31$ GAAP return on average assets ("ROAA') 0.45% 0.72% 0.52% Non-GAAP operating ROAA before M&A 0.79% 0.76% 0.78% GAAP return on average common equity ("ROACE") 4.84% 9.07% 6.55% Non-GAAP operating ROACE before M&A 8.49% 9.51% 9.70% Weighted average common shares outstanding 5,549,428 4,633,720 4,629,228 Average assets 1,580,586$ 1,355,922$ 1,376,983$ Average equity 147,005 107,735 109,979

21 Acquisition of County First Bank

22 Transaction Rationale Leverages Existing Presence in Southern Maryland Markets County First Improves Core Funding & Liquidity Profile Lower Integration Risk x All 5 County First branch locations were within 1.5 miles of an existing TCFC branch location. Four of five branches were closed. x Approximately $1.3 billion of combined deposits and #1 deposit market share position in Southern Maryland markets (Calvert, Charles and Saint Mary’s Counties) x County First added $200 million of high quality, low cost deposits x Nearly 85% non - time deposits; 33% noninterest bearing deposits x 19 bps cost of funds (quarter ended December 31, 2017) x Loan to deposit ratio of 72%; pro forma TCFC loan to deposit ratio reduced to 99% from 104% x Extensive due diligence conducted: ▪ Greater than 55% of the outstanding commercial portfolio ▪ 100% of nonperforming assets reviewed ▪ Management’s efforts supplemented by third party credit review experts x Familiarity with County First’s markets and customers x Significant and achievable opportunities for cost savings in the transaction Source: SNL Financial. County First data as of 12/31/17. Deposit market share data is as of 6/30/17.

23 County First Transaction Update x Legal merger closed on January 1, 2018 x Core conversion to TCFC systems completed on schedule in May 2018 x Four branch closings completed in May 2018. La Plata branch added to Company branch network. x Two of three branches held for sale were sold in May 2018 x Customer retention has been strong x Identified cost savings are on track and expected to be realized consistent with our modeling of the transaction x Merger expenses expected to be less than original modeling. Quarter 3 and Quarter 4 merger expenses expected to be minimal.
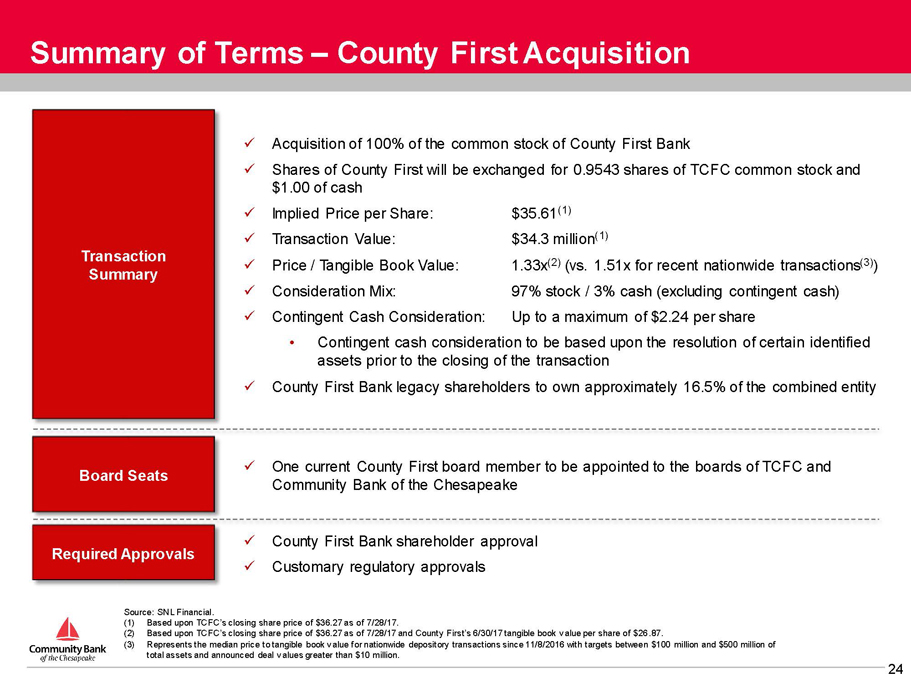
24 Summary of Terms – County First Acquisition Source: SNL Financial. (1) Based upon TCFC’s closing share price of $36.27 as of 7/28/17. (2) Based upon TCFC’s closing share price of $36.27 as of 7/28/17 and County First’s 6/30/17 tangible book value per share of $26 .87 . (3) Represents the median price to tangible book value for nationwide depository transactions since 11/8/2016 with targets betwee n $ 100 million and $500 million of total assets and announced deal values greater than $10 million. x Acquisition of 100% of the common stock of County First Bank x Shares of County First will be exchanged for 0.9543 shares of TCFC common stock and $1.00 of cash x Implied Price per Share: $35.61 (1) x Transaction Value: $34.3 million (1) x Price / Tangible Book Value: 1.33x (2) (vs. 1.51x for recent nationwide transactions (3) ) x Consideration Mix: 97% stock / 3% cash (excluding contingent cash) x Contingent Cash Consideration: Up to a maximum of $2.24 per share • Contingent cash consideration to be based upon the resolution of certain identified assets prior to the closing of the transaction x County First Bank legacy shareholders to own approximately 16.5% of the combined entity x One current County First board member to be appointed to the boards of TCFC and Community Bank of the Chesapeake x County First Bank shareholder approval x Customary regulatory approvals Transaction Summary Board Seats Required Approvals