Attached files
| file | filename |
|---|---|
| 8-K - HORIZON BANCORP INC /IN/ | hb_8k0731.htm |
Exhibit 99.1

A NASDAQ Global Select Traded Company - Symbol HBNC July 31, 2018

This presentation may contain forward-looking statements regarding the financial performance, business prospects, growth and operating strategies of Horizon Bancorp, Inc. and its affiliates (collectively, “Horizon”). For these statements, Horizon claims the protection of the safe harbor for forward-looking statements contained in the Private Securities Litigation Reform Act of 1995. Statements in the presentation materials should be considered in conjunction with the other information available about Horizon, including the information in the filings we make with the Securities and Exchange Commission. Forward-looking statements provide current expectations or forecasts of future events and are not guarantees of future performance. The forward-looking statements are based on management’s expectations and are subject to a number of risks and uncertainties. We have tried, wherever possible, to identify such statements by using words such as “anticipate,” “estimate,” “project,” “intend,” “plan,” “believe,” “will” and similar expressions in connection with any discussion of future operating or financial performance.Although management believes that the expectations reflected in such forward-looking statements are reasonable, actual results may differ materially from those expressed or implied in such statements. Risks and uncertainties that could cause actual results to differ materially include risk factors relating to the banking industry and the other factors detailed from time to time in Horizon’s reports filed with the Securities and Exchange Commission, including those described in Horizon’s Annual Report on Form 10-K. Undue reliance should not be placed on the forward-looking statements, which speak only as of the date hereof. Horizon does not undertake, and specifically disclaims any obligation, to publicly release the result of any revisions that may be made to update any forward-looking statement to reflect the events or circumstances after the date on which the forward-looking statement is made, or reflect the occurrence of unanticipated events, except to the extent required by law. Forward-Looking Statements

* Mark E. SecorEVP & Chief Financial Officer

Horizon is a Growth Story *

Indiana and Michigan… The Right Side of Chicago Illinois and Chicago-High Taxes & Cost of Living-Low Credit Rating-Unfriendly Business Environment

IndianaRanked 5th Best State for Business by Chief Executive Magazine in 2018 and 2017Ranked 2nd in Infrastructure, 4th in Business Friendliness, 5th in Cost of Doing Business, 10th in Cost of Living by CNBC’s Ranking of America’s Top States for Business 20182017 Budget Surplus and $1.78 Billion Reserve Fund, AAA Bond Rating, Corporate Tax Cuts scheduled through 2022MichiganRanked 27th Best State for Business by Chief Executive Magazine in 2018, up from 36th in 2017Ranked 4th in Cost of Living by CNBC’s Ranking of America’s Top States for Business 2018 * Indiana and MichiganGreat States to Conduct Business

Branches * Legacy Footprint 2007 Locations – 16Counties – 6 Indiana Ohio Illinois Michigan

BranchesLoan Production OfficesNew Branch in 2018 8 Growth Footprint 2018 Locations – 65Counties – 27 Michigan Illinois Indiana Ohio
BranchesLoan Production OfficesNew Branch in 2018 * Growth Footprint 2018 Locations – 65Counties – 27 Michigan Illinois Indiana Ohio
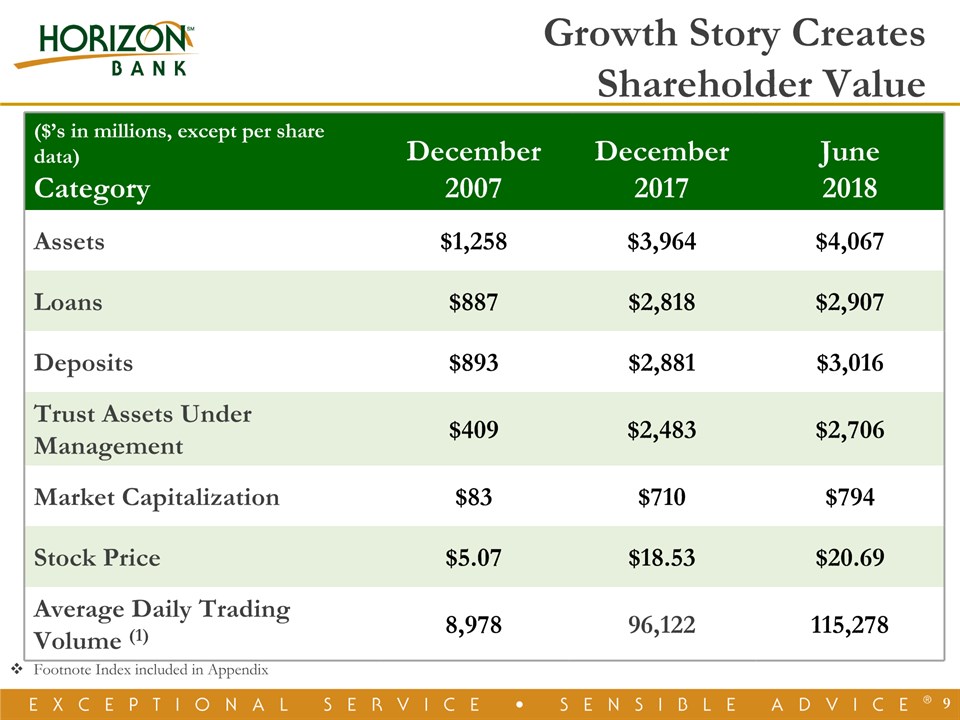
($’s in millions, except per share data)Category December2007 December2017 June2018 Assets $1,258 $3,964 $4,067 Loans $887 $2,818 $2,907 Deposits $893 $2,881 $3,016 Trust Assets Under Management $409 $2,483 $2,706 Market Capitalization $83 $710 $794 Stock Price $5.07 $18.53 $20.69 Average Daily Trading Volume (1) 8,978 96,122 115,278 * Growth Story Creates Shareholder Value Footnote Index included in Appendix

Positioned Well for the Future * Growth in Higher Yielding AssetsGood Core Deposits Growth

Retail BankingBusiness BankingMortgage BankingWealth Management Complementary Revenue Streams that are Counter-Cyclical to Varying Economic Cycles * Focus and Consistent Revenue Streams
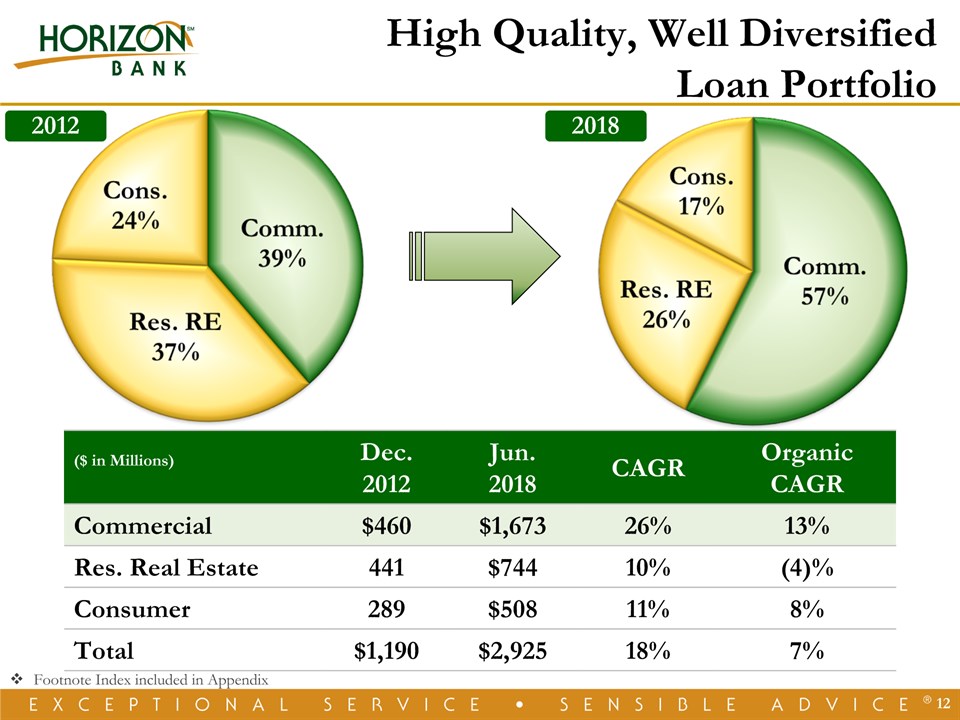
($ in Millions) Dec.2012 Jun.2018 CAGR OrganicCAGR Commercial $460 $1,673 26% 13% Res. Real Estate 441 $744 10% (4)% Consumer 289 $508 11% 8% Total $1,190 $2,925 18% 7% * High Quality, Well Diversified Loan Portfolio 2012 2018 Footnote Index included in Appendix

Managing Commercial Real Estate Concentration Risk December 31, 2017 * Percent of total commercial loans at June 30, 2018.

* Strong Core Deposit Mix 2012 ($ in Millions) Dec.2012 Jun.2018 CAGR OrganicCAGR Jun. 2018 YTD Cost Non-interest $209 $615 22% 11% 0.00% Interest 770 1,645 15% 2% 0.28% CDs 315 756 17% 1% 1.32% Total $1,294 $3,016 17% 4% 0.58% 2018 Footnote Index included in Appendix
Historical EarningsDemonstrates Ability to Execute *
Core Diluted EPS CAGR 8% * Robust Earnings Growth (2) (2) ($’s in millions) Footnote Index included in Appendix

Core Diluted EPS CAGR 8% 16 Robust Earnings Growth (2) (2) ($’s in millions) Footnote Index included in Appendix

17 Year-to-Date 2018 Record EPS EPS Growth 35% EPS Growth 11% ($’s in millions) (4) (4) Footnote Index included in Appendix
* Year-to-Date 2018 Record EPS EPS Growth 35% EPS Growth 11% ($’s in millions) (4) (4) Footnote Index included in Appendix

* GAAP Net Interest Margin and Core Net Interest Margin (5) Net Interest Margin Headwinds Offset by Efficiency Gains Footnote Index included in Appendix

* Operating LeverageResults in Efficiency Gains Footnote Index included in Appendix (6)
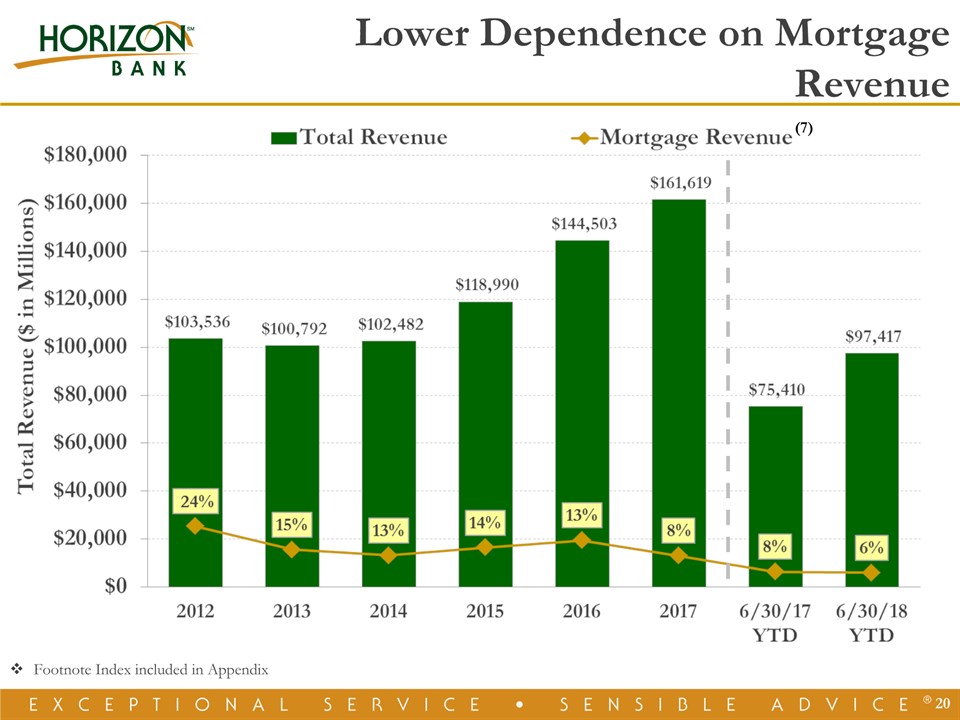
* Lower Dependence on Mortgage Revenue (7) Footnote Index included in Appendix

* Building Shareholder Value after Acquisitions Footnote Index included in Appendix

A Company on the Move Through Consistent Strategy & Execution *

A Company on the Move * OrganicExpans.(11) St. Joseph,S. Bend,Elkhart,Merrillville Kalamazoo Indianapolis Carmel Ft. Wayne,Grand Rapids Columbus,Noblesville,Holland M&A(13) Anchor Mtg.,Alliance American Trust Heartland 1st Mtg.,Summit,Peoples Farmers,LaPorte,CNB Bargersville,Lafayette,Wolverine (8) (9) (10) Footnote Index included in Appendix

Growth MarketsFuture Markets * GrandRapids/Holland AnnArbor NWOhio FortWayne Lafayette Kalamazoo SouthBend Warsaw Indianapolis NWIndiana Growth Opportunities Abound Michigan Indiana Ohio Illinois Great LakesBay SE Michigan

Considerable Market Share Opportunities * Footnote Index included in Appendix

* Number of Banks Headquartered in Indiana and Michigan (14) M&A Opportunities On average, 5% decline per year 9 24 13 9 10 9 14 13 17 8 16 Footnote Index included in Appendix
Historical Performance Illustrates Ability to ExecuteConsistent, Well Executed and Disciplined Business StrategyA Growth Story10-year asset and net income CAGR of 11% and 15%, respectivelyThirteen acquisitions and eleven market expansions since 2002Capacity to take additional market shareEarnings improvement through mass and scaleEntering the “Sweet-Spot” for Market Performance and Trading MultiplesAptitude, Skill and Desire to Continue Mergers and Acquisitions * Why Invest in HBNCInvestment Thesis

* Scale Drives Shareholder Value Footnote Index included in Appendix

Horizon Outperforms the MarketFor Total Shareholder Return * Horizon Bancorp: 5-Year Total Return Comparison Footnote Index included in Appendix

A NASDAQ Global Select Traded Company - Symbol HBNC

Appendix *

* Footnote Index Slide 9(1) Based on the daily trading volume for the years ended December 31, 2007 and 2017 and the six months ended June 30, 2018, respectively.Financial data in millions, except for stock price, as of December 31, 2007 and 2017 and June 30, 2018, respectively. Slide 12Financial data as of December 31, 2012 and June 30, 2018, respectively.Slide 14Financial data as of December 31, 2012 and June 30, 2018, respectively.Slide 16(2) Core net income and core diluted EPS exclude one-time merger expenses, gain on sale of securities, death benefit on bank owned life insurance, prepayment penalties on borrowings, gain on the remeasurement of equity interest in Lafayette Community Bancorp and tax reform bill impact. (See further in the Appendix for a reconciliation of these non-GAAP amounts to their GAAP counterparts.)(3) 2012 results benefited from a record level of mortgage loan production volume and mortgage warehouse loan balances.Slide 17(4) Core net income and core diluted EPS exclude one-time merger expenses, gain on sale of securities and death benefit on bank owned life insurance. (See further in the Appendix for a reconciliation of these non-GAAP amounts to their GAAP counterparts.)Slide 18(5) Core net interest margin excludes acquisition-related purchase accounting adjustments. (See further in the Appendix for a reconciliation of these non-GAAP amounts to their GAAP counterparts.)Slide 19(6) Adjusted efficiency ratio excludes prepayment penalties on borrowings, gain on sale of securities, death benefit on bank owned life insurance and gain on the remeasurement of equity interest in Lafayette Community Bancorp. (See further in the Appendix for a reconciliation of these non-GAAP amounts to their GAAP counterparts.)
* Footnote Index Slide 20(7) Mortgage Revenue is defined as interest and fee income from mortgage warehouse loans plus gain on sale of mortgage loans.Slide 21See further in the Appendix for a reconciliation of these non-GAAP amounts to their GAAP counterparts.Slide 23(8) Columbus, Ohio location closed February 2018.(9) Noblesville, Indiana loan production office opened during the second quarter of 2018. This location will be converted to a full-service location during the third quarter of 2018. (10) Holland, Michigan loan production office opened during the second quarter of 2018.Slide 25(11) All Key Markets are MSAs, except for Northwest Indiana which consists of Lake and Porter Counties.(12) Deposit Market Share as of June 30, 2017.(13) Large Institutions defined as total assets greater than or equal to $10.0 billion at June 30, 2017.Slide 26(14) Indiana and Michigan commercial banks, savings banks and savings & loan institutions as of December 31st of each respective year.Slide 28Financial data as of March 31, 2018; market data as of July 20, 2018. Nationwide publicly traded banks, excluding merger targets.

* Footnote Index Slide 29As of June 29, 2018. SNL U.S. Bank includes all Major Exchange Banks in SNL’s coverage universe.Slides 35-39 Use of Non-GAAP Financial Measures: Certain information set forth in the presentation materials refers to financial measures determined by methods other than in accordance with GAAP. Horizon believes that these non-GAAP financial measures are helpful to investors and provide a greater understanding of our business without giving effect to purchase accounting impacts and one-time acquisition and other non-recurring costs and non-core items. These measures are not necessarily comparable to similar measures that may be presented by other companies and should not be considered in isolation or as a substitute for the related GAAP measure.

* Non-GAAP Reconciliations

* Non-GAAP Reconciliations

* Non-GAAP Reconciliations

* Non-GAAP Reconciliations

* Non-GAAP Reconciliations