Attached files
| file | filename |
|---|---|
| EX-99.1 - EX-99.1 - MYERS INDUSTRIES INC | d582450dex991.htm |
| 8-K - FORM 8-K - MYERS INDUSTRIES INC | d582450d8k.htm |
 MYERS INDUSTRIES, INC.
Second Quarter 2018 Earnings Presentation
Exhibit 99.2 |
 SAFE
HARBOR
STATEMENT
& NON-GAAP MEASURES 2
Statements in this presentation concerning the Company’s goals, strategies
and expectations for business and financial results may be "forward-looking statements" within the meaning of the Private Securities Litigation Reform Act of 1995 and are based on current indicators and
expectations. Any statement that is not of historical fact may be
deemed “forward-looking”. Words such as “expect”, “believe”, “project”, “plan”, “anticipate”, “intend”, “objective”, “goal”, “view” and similar expressions identify forward-looking statements. These
statements are based on management’s current views and
assumptions of future events and financial performance and involve a number of
risks and uncertainties, many outside the Company’s control that could cause actual results to materially differ from those expressed or implied. You are cautioned not to put undue reliance on any forward-looking statement. We do not intend, and undertake no obligation, to update these forward-looking statements. Such risks include:
(1) Raw material availability, increases in raw material costs, or other production costs
(2) Risks associated with our strategic growth initiatives or the failure to achieve the anticipated benefits of such
initiatives (3)
Unanticipated downturn in business relationships with customers or their
purchases (4)
Competitive pressures on sales and pricing
(5) Changes in the markets for the Company’s business segments (6) Changes in trends and demands in the markets in which the Company competes
(7) Unexpected failures at our manufacturing facilities (8) Future economic and financial conditions in the United States and around the world
(9) Inability of the Company to meet future capital requirements (10) Claims, litigation and regulatory actions against the Company (11) Changes in laws and regulations affecting the Company (12) Other risks as detailed in the Company’s 10-K and other reports filed with the Securities Exchange Commission
Myers Industries, Inc. encourages investors to learn more about these risk
factors. A detailed explanation of these factors is available in the Company’s publicly filed quarterly and annual reports, which can be found online at www.myersindustries.com and at the SEC.gov web
site. The Company refers to certain non-GAAP financial
measures throughout this presentation. Adjusted EPS, adjusted income per diluted share from continuing operations, adjusted operating income, adjusted gross profit, adjusted EBITDA and free cash flow are non-GAAP financial
measures and are intended to serve as a supplement to results
provided in accordance with accounting principles generally accepted in the United States. The Company believes that such information provides an additional measurement and consistent historical comparison of the Company’s performance.
A reconciliation of the non-GAAP financial measures to the
most directly comparable GAAP measures is available in the appendix of this presentation. Statements in this presentation speak only as of the date made. |
 2018 Q2 OVERVIEW
Challenges Achievements - Distribution Segment continues to make progress, but at a slow rate » Year-over-year sales decline continued in Q2 » Equipment sales and MTS International made up ~50% of the decline » Daily sales run rate of domestic consumables increased in Q2 » Gross profit margin expanded year-over- year in Q2 as a result of the new pricing structure and a favorable product mix » MTS implementing sales force incentive programs » Focus on sales of high margin products and target market segments » MTS continues to fill open sales territories and onboard new sales reps Generated free cash flow of $13.3M or 9.4% of sales Strong commercial execution in Material Handling niche markets » New Consumer customer wins and share gains at Scepter » Market share gains and new customer win in Food & Beverage at Buckhorn » New Industrial customer win at Ameri-Kart Gross profit margin expanded to 34% due to pricing actions and benefits from manufacturing footprint realignment Reduced net debt by $102M through sale of common stock and strong free cash flow generation » Enables greater financial flexibility to make strategic investments 3 Results reflect continuing operations. See appendix for non-GAAP reconciliations. |
   Q2
FINANCIAL SUMMARY Operating
Highlights »
Net sales up 3.9%
» Material Handling up $7.1M (+7.4%) » Distribution down $1.8M (-4.5%) » Gross profit increased $9.7M (Adj. $5.8M) » Increased volume and price, partially offset by unfavorable mix and higher raw material costs » Price increases more than offsetting material cost increases » Savings from 2017 footprint realignment/restructuring initiatives and operating efficiencies in Material Handling » Adj. EBITDA up $2.4M to $19.9M, compared to $17.5M in Q2 2017 » GAAP EPS $0.26 compared to $0.08 in Q2 2017; adjusted EPS $0.27 compared to $0.18 in Q2 2017 GAAP Financial Highlights Non-GAAP Financial Highlights 4 Results reflect continuing operations. See appendix for non-GAAP reconciliations.
(In $ millions except EPS)
Q2 '18 V to PY Net Sales 140.6 $ 3.9% Gross Profit 48.0 25.3% Gross Profit Margin 34.1% +580 bps Op Income 13.1 119.7% Op Income Margin 9.3% +490 bps Diluted EPS 0.26 $ 225.0% (In $ millions except EPS) Q2 '18 V to PY Net Sales 140.6 $ 3.9% Adj Gross Profit 48.2 13.6% Gross Profit Margin 34.3% +290 bps Adj Op Income 13.4 30.2% Op Income Margin 9.5% +190 bps Adj EBITDA 19.9 13.4% EBITDA Margin 14.2% +120 bps Diluted Adjusted EPS 0.27 $ 50.0% |
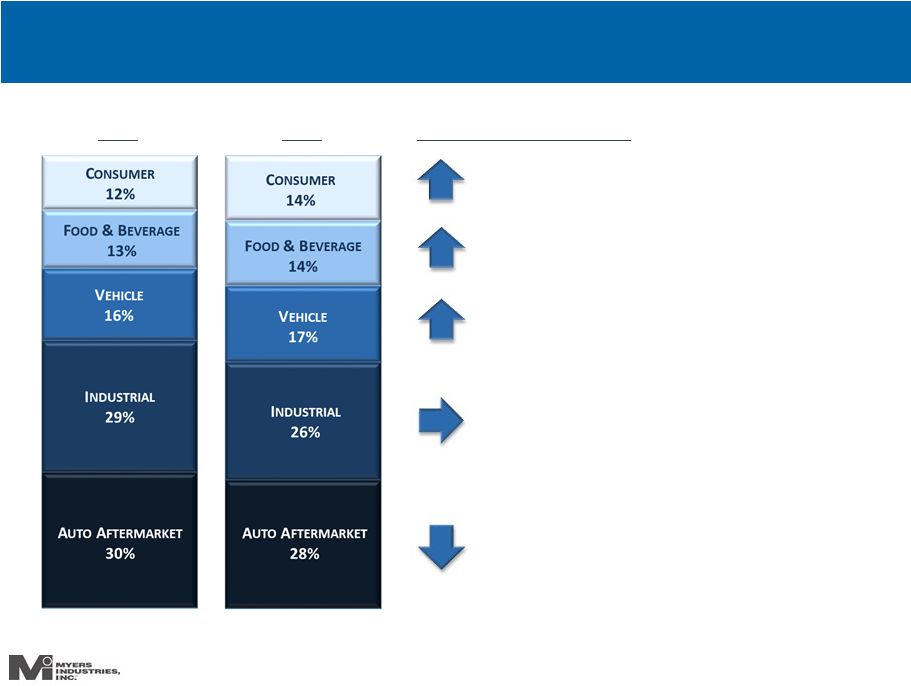
   Q2
SEGMENT RESULTS Material Handling Segment
Highlights »
Consumer up double-digits due to timing of orders, new customer
wins and market share gains
» Double-digit sales growth in Food & Beverage due to higher agriculture and food processing sales » Sales to the Vehicle end market grew double-digits driven by increased sales to the automotive OEM market » Higher volume offset by unfavorable mix; pricing actions more than offsetting raw material cost inflation » Adjusted EBITDA margin expanded 300 bps to 22.7% as a result of pricing initiatives, restructuring actions and operating efficiencies Material Handling Financial Highlights Distribution Financial Highlights 5 Results reflect continuing operations. See appendix for non-GAAP reconciliations. Distribution Segment Highlights » MTS net sales decreased year-over-year » Team continues to work to improve sales force effectiveness » Implementing sales rep incentives to drive increased sales of higher margin products and target market segments » New pricing structure and focus on selling higher margin products driving gross margin expansion » Adjusted EBITDA margin flat year-over-year » Impact of lower sales volume mostly offset by favorable price/mix and operational efficiencies (In $ millions) Q2 '18 V to PY Net Sales 103.1 $ 7.4% Op Income 17.3 121.7% Op Income Margin 16.8% +870 bps Adj Op Income 17.3 42.6% Adj Op Income Margin 16.8% +410 bps Adj EBITDA 23.4 24.0% Adj EBITDA Margin 22.7% +300 bps (In $ millions) Q2 '18 V to PY Net Sales 37.5 $ -4.5% Op Income 2.8 -7.9% Op Income Margin 7.4% -30 bps Adj Op Income 2.8 -7.9% Adj Op Income Margin 7.4% -30 bps Adj EBITDA 3.1 -5.8% Adj EBITDA Margin 8.2% -10 bps |
 BALANCE
SHEET
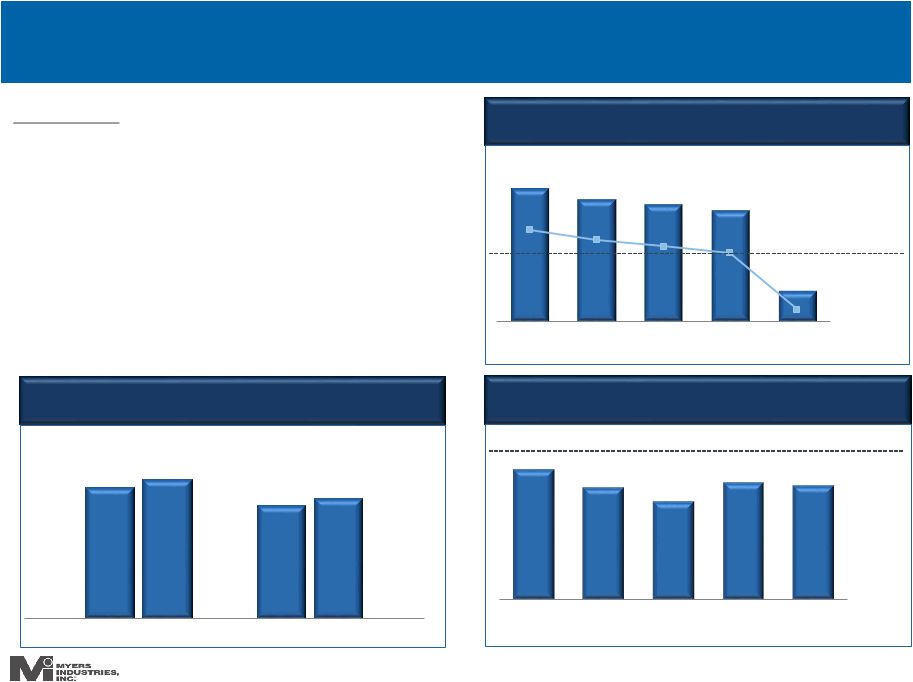
AND CASH FLOW 6 Q2 Highlights » Strong free cash flow generation of $13.3M; YTD free cash flow of $24.9M » Reduced net debt by $101.6M » Raised net proceeds of $79.5M through sale of common stock » Net debt-to-adjusted EBITDA declined to 0.6x » Working capital as a percentage of TTM sales at 5.8%, consistent with prior quarters and consistently below target of 9% Results reflect continuing operations. See appendix for non-GAAP reconciliations.
$168.3 $155.1 $148.5 $141.3 $39.7 2.7x 2.5x 2.3x 0.6x Q2 '17 Q3 '17 Q4 '17 Q1 '18 Q2 '18 TARGET <2x 3.0x Working Capital as a % of TTM Sales 8.5% 8.8% 9.3% 9.7% Operating Cash Flow Free Cash Flow (FCF) FCF TARGET >7% TARGET <9% Cash Flow ($M) and Cash Flow as % of Sales Net Debt ($M) and Net Debt to Adj. EBITDA Operating Cash Flow Free Cash Flow (FCF) FCF TARGET >7% $26.3 $27.2 $24.0 $24.9 YTD '17 YTD '18 YTD '18 6.6% 5.7% 5.0% 6.0% 5.8% Q2 '17 Q3 '17 Q4 '17 Q1 '18 Q2 '18 YTD '17 |
 2018 OUTLOOK
7 2016 2017 2018 Operating Framework Low single digits High single digits High single digits Flat Low single digits Expect increased demand from agriculture and food processing markets Anticipating growth in market share will be partially offset by 2017 unusual hurricane volume Strong RV market YTD, but pace slowing from growth to steady demand; seeing increased demand in automotive OEM market Industrial volume is expected to be flat as we finalize product simplification and 80/20 initiatives; growth potential available with new niche market wins Not expecting sales growth in second half to fully offset first half sales decline 2018 Full Year Outlook Re-affirmed |
 APPENDIX
|
 2018 KEY
ASSUMPTIONS
9 » Net sales: Up low-to-mid-single digits » Capital expenditures: $10 - $12 million » Net interest expense: $4 - $6 million » D&A: $26 - $28 million » Effective tax rate (normalized): ~25% |
 10 RECONCILIATION OF NON-GAAP MEASURES
MYERS INDUSTRIES, INC.
RECONCILIATION OF NON-GAAP FINANCIAL MEASURES
GROSS PROFIT, OPERATING INCOME AND EBITDA (UNAUDITED)
(Dollars in thousands)
Material Handling Distribution Segment Total Corporate & Other Total GAAP Net sales 103,130 $ 37,477 $ 140,607 $ (47) $ 140,560 $ GAAP Gross profit 47,991 — 47,991 Add: Restructuring expenses and other adjustments 170 — 170 Gross profit as adjusted 48,161 — 48,161 Gross profit margin as adjusted 34.3% n/a 34.3% GAAP Operating income 17,323 2,786 20,109 (6,998) 13,111 Add: Restructuring expenses and other adjustments (1) 170 — 170 — 170 Add: Asset impairments — — — 308 308 Less: Gain on sale of assets (208) — (208) — (208) Operating income as adjusted 17,285 2,786 20,071 (6,690) 13,381 Operating income margin as adjusted 16.8% 7.4% 14.3% n/a 9.5% Add: Depreciation and amortization 6,188 301 6,489 127 6,616 Less: Depreciation adjustments (66) — (66) — (66) EBITDA as adjusted 23,407 $ 3,087 $ 26,494 $ (6,563) $ 19,931 $ EBITDA margin 22.7% 8.2% 18.8% n/a 14.2% Quarter Ended June 30,2018 (1) Includes gross profit adjustments of $170 |
 11 RECONCILIATION OF NON-GAAP MEASURES
MYERS INDUSTRIES, INC.
RECONCILIATION OF NON-GAAP FINANCIAL MEASURES
GROSS PROFIT, OPERATING INCOME AND EBITDA (UNAUDITED)
(Dollars in thousands)
Material Handling Distribution Segment Total Corporate & Other Total GAAP Net sales 96,026 $ 39,258 $ 135,284 $ (32) $ 135,252 $ GAAP Gross profit 38,292 — 38,292 Add: Restructuring expenses and other adjustments 4,093 — 4,093 Gross profit as adjusted 42,385 — 42,385 Gross profit margin as adjusted 31.3% n/a 31.3% GAAP Operating income 7,814 3,025 10,839 (4,871) 5,968 Add: Restructuring expenses and other adjustments (1) 4,344 — 4,344 — 4,344 Add: Asset impairments 544 — 544 — 544 Less: Gain on sale of assets (578) — (578) — (578) Operating income as adjusted 12,124 3,025 15,149 (4,871) 10,278 Operating income margin as adjusted 12.6% 7.7% 11.2% n/a 7.6% Add: Depreciation and amortization 8,060 253 8,313 297 8,610 Less: Depreciation adjustments (1,312) — (1,312) — (1,312) EBITDA as adjusted 18,872 $ 3,278 $ 22,150 $ (4,574) $ 17,576 $ EBITDA margin 19.7% 8.3% 16.4% n/a 13.0% Quarter Ended June 30,2017 |
 12 RECONCILIATION OF NON-GAAP MEASURES
MYERS INDUSTRIES, INC.
RECONCILIATION OF NON-GAAP FINANCIAL MEASURES
INCOME AND EARNINGS PER DILUTED SHARE (UNAUDITED)
(Dollars in thousands, except per share data)
2018 2017 2018 2017 GAAP Operating income 13,111 $ 5,968 $ 25,133 $ 14,084 $ Add: Restructuring expenses and other adjustments 170 4,344 312 5,754 Add: Asset impairments 308 544 308 544 Less: Gain on sale of assets (208) (578) (873) (1,242) Operating income as adjusted 13,381 10,278 24,880 19,140 Less: Interest expense, net (1,313) (1,860) (2,952) (3,990) Income (loss) before taxes as adjusted 12,068 8,418 21,928 15,150 Less: Income tax expense (1) (3,017) (3,030) (5,482) (5,454) Income (loss) from continuing operations as adjusted 9,051 $ 5,388 $ 16,446 $ 9,696 $ Adjusted earnings (loss) per diluted share from continuing operations 0.27 $ 0.18 $ 0.51 $ 0.32 $ Quarter Ended June 30, Six Months Ended June 30, (1) Income taxes are calculated using the normalized effective tax rate for each year.
The rate used in 2018 was 25% and in 2017 was 36%.
|
 13 RECONCILIATION OF NON-GAAP MEASURES
MYERS INDUSTRIES, INC.
RECONCILIATION OF FREE CASH FLOW TO GAAP NET CASH PROVIDED BY
(USED FOR) OPERATING ACTIVITIES –
CONTINUING OPERATIONS
(UNAUDITED) (Dollars in thousands) YTD YTD QTD June 30, 2018 March 31, 2018 June 30, 2018 Net cash provided by (used for) operating activities 27,223 $ - 12,838 $ = 14,385 $
Capital expenditures
(2,318) - (1,206) = (1,112) Free cash flow 24,905 $ - 11,632 $ = 13,273 $
- continuing operations |
 14 RECONCILIATION OF NON-GAAP MEASURES
MYERS INDUSTRIES, INC.
RECONCILIATION OF NON-GAAP FINANCIAL MEASURES
ADJUSTED EBITDA (UNAUDITED)
(Dollars in thousands)
Q3 2016 Q4 2016 Q1 2017 Q2 2017 Q3 2017 Q4 2017 Q1 2018 Q2 2018 Income from continuing operations 580 $ (899) $ 3,458 $ 2,482 $ 3,083 $ 1,821 $ 7,755 $ 8,608 $ Add: income tax expense 549 195 2,528 1,626 1,880 (1,170) 2,628 3,190 Add: interest expense, net 2,194 2,122 2,130 1,860 1,838 1,464 1,639 1,313 Add: extinguishment of debt — — — — — 1,888 — — Add: depreciation 5,549 5,582 6,150 6,487 4,606 4,702 4,495 4,466 Add: amortization 2,433 2,417 2,422 2,122 2,178 2,164 2,070 2,149 EBITDA 11,305 9,417 16,688 14,577 13,585 10,869 18,587 19,726 Add: one-time adjustments (excludes depreciation adjustments) 897 996 128 2,999 (202) 1,663 (539) 205 EBITDA as adjusted 12,202 $ 10,413 $ 16,816 $ 17,576 $ 13,383 $ 12,532 $ 18,048 $ 19,931 $ TTM EBITDA as adjusted 57,007 $ 58,188 $ 60,307 $ 61,539 $ 63,894 $ Debt 170,114 $ 158,010 $ 151,036 $ 144,363 $ 78,654 $ Less: cash 1,778 2,917 2,520 3,015 38,940 Net debt 168,336 $ 155,093 $ 148,516 $ 141,348 $ 39,714 $ Net Debt to Adjusted EBITDA 3.0x 2.7x 2.5x 2.3x 0.6x |
 |