Attached files
| file | filename |
|---|---|
| 8-K - FORM 8-K - CB Financial Services, Inc. | f8k_073018.htm |
Exhibit 99.1

0 Investor Presentation KBW Community Bank Investor Conference August 2018
1 Statements contained in this investor presentation that are not historical facts may constitute forward - looking statements as that term is defined in the Private Securities Litigation Reform Act of 1995 (the “Act”) . Such forward - looking statements are subject to significant risks and uncertainties . CB Financial Services, Inc . (the “Company”) intends such forward - looking statements to be covered by the safe harbor provisions contained in the Act . The Company’s ability to predict results or the actual effect of future plans or strategies is inherently uncertain . Factors which could have a material adverse effect on the operations and future prospects of the Company and its subsidiaries include, but are not limited to, changes in market interest rates, general economic conditions, changes in federal and state regulation, actions by our competitors, loan delinquency rates, our ability to control costs and expenses, and other factors that are described in the Company’s periodic reports as filed with the Securities and Exchange Commission . These risks and uncertainties should be considered in evaluating forward - looking statements and undue reliance should not be placed on such statements . The Company assumes no obligation to update any forward - looking statement except as may be required by applicable law or regulation . Non - GAAP Financial Measures This presentation contains non - GAAP financial measures, which management believes may be helpful in understanding the Company's results of operations or financial position and comparing results over different periods . Non - GAAP measures eliminate the impact of certain items such as intangible assets (when calculating Tangible Book Value), OREO e xpenses and amortization of intangibles assets, and also one - time expenses such as merger costs and related data processing termination fees, legal costs, severance pay, accelerated depreciation expense and lease termination fees . Merger related charges represent expenses to either satisfy contractual obligations of acquired entities without any useful benefit to the Company or to convert and consolidate customer records onto the Company platforms . These costs are unique to each transaction based on the contracts in existence at the merger date . These disclosures should not be viewed as a substitute for operating results determined in accordance with GAAP, nor are they necessarily comparable to non - GAAP performance measures that may be presented by other banks and financial institutions . Please see the non - GAAP reconciliations table included in the Appendix to this investor presentation . Forward - Looking Statements

2 CB Financial Services Overview

3 Source: SNL Financial. Financial data as of 6/30/17. (1) Alpine is an S - Corporation. ROAA and ROAE tax - effected at an effective rate of 30%. (2) NPLs include nonaccrual loans and TDRs. NPAs include NPLs, OREO and loans 90+ days past due and still accruing interest. 3 117 year old community bank headquartered in Carmichaels, PA 24 branch locations in Southwestern PA and the Ohio River Valley plus a loan production office in northern Pittsburgh Regional economic drivers: financial services, technology, health care, education, energy Recent acquisition of First West Virginia enhances our low - cost core deposit base Franchise Summary (NASDAQ: CBFV) Branch Map Corporate Overview Financial Highlights (6/30/18) Source: SNL Financial and company documents. Note: MRQ = most recent quarter. YTD = year to date. Branch Northern LPO MRQ Balance Sheet ($M) MRQ Capital Assets $1,231.7 TCE / TA 8.56% Gross Loans $891.7 CET1 Ratio 12.4% Deposits $1,024.6 Total Capital Ratio 13.5% YTD Profitability MRQ Asset Quality NIM (FTE) 3.53% NPAs / Assets 0.66% ROAA 0.47% LLR / Loans 1.05% ROAE 4.77% LLR / NPLs 129.8% Efficiency Ratio 70.8% NCOs / Avg. Loans 0.06%

4 Commercial Banking Focus on new commercial business generation and sales culture 2018 YTD annualized organic CRE loan growth of approximately 45.6% Well positioned to serve the needs of small and medium sized businesses in the Marcellus and Utica Shale regions Diversified Business Mix Retail Banking & Wealth Management 24% of deposits are noninterest bearing Year over year (1) growth of 16.3% (organic) and 40.8% (including the merger) in NIB and NOW deposits Nearly 80% non - time deposits Excellent branch coverage of the Tri - State market Wealth management services linked strongly to Marcellus and Utica Shale Region footprint Mortgage Banking Active mortgage origination platform with dedicated mortgage originators 2018 YTD annualized organic residential real estate loan growth of approximately 6.8% Expand mortgage banking platform into the legacy First West Virginia franchise to increase origination volumes Insurance Brokerage Led by Rich Boyer, a 30+ year industry veteran Accounts for approximately 43% of fee income (2) Complementary to commercial and retail banking business Source: Company documents . (1) Represents the period from 6/30/17 through 6/30/18. Based on period end balance sheet data. (2) For the six months ended 6/30/18. Note: Fee income defined as noninterest income less net gain on sales of investments .

5 CBFV Legacy Southwestern PA Market Source: SNL Financial for all demographic data, the Pennsylvania Department of Labor and Industry and the Washington County, PA Chamber of Commerce. Summary statistics are deposit - weighted. Note: Deposit market share data as of 6/30/17 as adjusted for acquisitions to the extent discernable. (1) Source: The Economist: “A Summary of the Livability Ranking and Overview”, published August 2014. (2) Core operating area excludes Allegheny County . (3) Defined as the Pittsburgh, PA MSA plus Greene County, PA. (4) Mutual institution. (5) Estimated pro forma for recently announced or completed transactions. (6) Bank level assets as of the March 31, 2017 reporting period for all entities. Recent investments in technology industry by Google, Apple and Intel Healthcare (UPMC & Highmark) Financial services 36 colleges & universities produce a highly educated labor force “Most Livable Place in the Continental US” (1) Summary Statistics (Southwestern PA Franchise) Population of approximately 2.4 million 2018 median household i ncome of approximately $56,793 Projected h ousehold income growth (2018 - 2023) of 10.1% (vs. 9.6% in PA and 8.9% nationally) Over 98,000 total businesses located within the operating area (3) Major Employers in Core Operating Area (2) Pittsburgh MSA Economic Drivers Scarcity of Community Banks in Core Operating Area Operating Area (2) Deposit Market Total Bank Bank Share Assets ($000) (6) PNC Bank, NA 26.1% $368,067,095 Citizens Bank, NA 10.9% 122,428,671 First National Bank of PA 10.1% 31,452,008 S&T Bank 6.8% 6,988,297 First Commonwealth Bank (5) 6.1% 7,502,352 KeyBank National Association 5.7% 135,188,435 Washington Financial Bank (4) 5.2% 1,074,380 First Federal SLA of Greene Cty (4) 4.9% 905,356 Community Bank (5) 4.6% 1,315,300 Dollar Bank FSB (4) 2.7% 8,446,121

6 Regional Economic Developments Deposit Market Share – Wheeling, WV (1) First West Virginia Franchise Expansion into the Ohio River Valley Source: SNL Financial, bizjournals.com, wvmetronews.com. (1) Excludes banks with more than $25 billion in total assets . (2) Purchase announced in June 2017. (3) http://wvmetronews.com/2017/11/09/china - natural - gas - deal - begins - with - new - power - plants - in - harrison - and - brooke - counties/ Community Bank Rank Institution (ST) Deposits in Market ($mm) Market Share (%) 1 WesBanco Inc. (WV) 1,363 47.3 2 United Bankshares Inc. (WV) 418 14.5 3 Belmont SB (OH) 309 10.7 4 Main Street Finl Services Corp (WV) 304 10.5 5 204 7.1 6 United Bancorp Inc. (OH) 192 6.7 7 Powhatan Point Cmnty Bcshs Inc (OH) 47 1.6 8 United Community Finl Corp. (OH) 27 0.9 9 CNB Bancorp Inc. (OH) 15 0.5 10 Woodforest Financial Grp Inc. (TX) 3 0.1 Total 2,882 100.0 PTT Global Chemical has purchased 168 acres in Belmont County, OH as the potential future home of a proposed $5 billion ethane cracker plant (2) On 11/9/17 the WV Department of Commerce announced an agreement with China Energy to invest nearly $84 billion in projects throughout the state over the next 20 years (3 ) FWVB Proposed Cracker Plant

7 • Transaction closed April 30, 2018, in time for Russell 2000 reconstitution • Systems conversion occurred in May 2018 • Final credit mark of $1.35 million better than preliminary modelling of ~$2.5 million • Day - 1 tangible book value dilution to be better than preliminary estimate of ~12% • On schedule in realizing $3.0 million of identified c ost savings Delivering Economics • Significant pre - closing training efforts helped ensure a smooth customer transition post systems integration • Back - office infrastructure enhanced through the opening of our new operations and corporate centers in June 2017 and June 2018, respectively Team Oriented Integration • CBFV senior management has visited key First West Virginia loan and deposit customers in conjunction with Bill Petroplus to highlight continuity of relationships • Excellent customer responses given continuation of community banking philosophy and enhanced product suite • Hiring of Michael Moore as a business development officer in the OH River Valley supports the deployment of liquidity acquired in the transaction Organizational & Customer Buy - in Update on Integration of First West Virginia
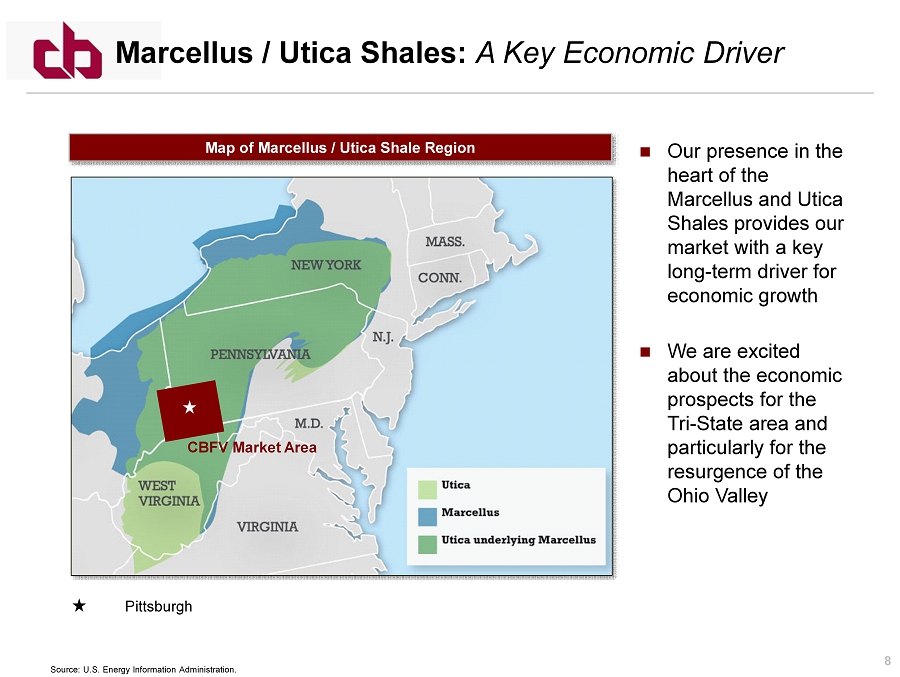
8 Marcellus / Utica Shales: A Key Economic Driver Source: U.S. Energy Information Administration. Map of Marcellus / Utica Shale Region CBFV Market Area Pittsburgh Our presence in the heart of the Marcellus and Utica Shales provides our market with a key long - term driver for economic growth We are excited about the economic prospects for the Tri - State area and particularly for the resurgence of the Ohio Valley

9 Marcellus / Utica Shales: A Key Economic Driver (1) Per US Geological Survey and Energy Information Administration estimates. Includes natural gas and oil reserves . (2) http://aongrc.nrcce.wvu.edu/wp - content/uploads/MASTER_Final_Report_8 - 29 - 2017.pdf Shell Cracker Plant PTT Global Chemical Cracker Plant Marcellus / Utica Shales: » Estimated recoverable reserves of approximately 400 trillion cubic feet equivalent (1) » Marcellus/Utica average daily production has grown from 3 billion cubic feet (BCF) in 2010 to more than 24 BCF today, forecasted to grow to as much as 40 BCF in the next 5 years (2) » 40% of Marcellus/Utica gas production comes from the Eastern Ohio, Northern WV and Southwestern PA markets served by CBFV (2 ) » Natural gas storage facilities could yield up to 100,000 permanent new jobs, and up to $2.9 billion in new federal, state and local tax revenue annually (2) Shell Cracker Plant : Located in Beaver County, PA, construction began in 2017, and is expected to create over 6,000 construction jobs and employ 600 people permanently PTT Global Cracker Plant: The proposed plant to be located in Dilles Bottom, OH, would employ thousands during construction and hundreds of permanent petrochemical jobs once the plant enters operation

10 Financial Performance

11 Source: Company documents and SNL Financial . (1) NPLs include nonaccrual loans, loans 90+ days past due and TDRs. NPAs include NPLs and OREO. (2) Non - GAAP financial metric. Please see the appendix to this presentation for non - GAAP reconciliations. (3) Represents the period from 6/30/17 through 6/30/18. Based on period end balance sheet data . Data is not pro forma for the acquisition of First West Virginia. Financial Highlights $1.3 billion in total assets pro forma for First West Virginia acquisition Y - o - Y organic loan growth as of June 30, 2018 of 16.9% (3) 9.0% Y - o - Y organic growth in noninterest bearing deposits through June 30, 2018 (3) Profitability impacted by $638,000 of one - time merger charges and various additional one - time charges Strong legacy deposit portfolio enhanced by more than $280 million of low cost funds from FWVB Strong asset quality metrics 2015 FY 2016 FY 2017 FY 2018 YTD ($000s except per share) 12/31/15 12/31/16 12/31/17 6/30/18 Balance Sheet Total Assets $830,677 $846,075 $934,486 $1,231,660 Total Loans HFI 683,354 681,897 744,392 891,690 Total Deposits 679,299 698,218 773,344 1,024,560 Tangible Common Equity (2) 77,590 80,697 85,019 102,783 Capital Ratios (%) Loans/ Deposits 100.6% 97.7% 96.3% 87.0% Tang. CE / Tang Assets (2) 9.45 9.64 9.18 8.56 Tier 1 Ratio 13.11 13.72 12.62 12.43 Risk-Based Capital Ratio 14.17 14.99 13.89 13.53 TBV Per Share (2) $19.01 $19.75 $20.76 $18.98 Asset Quality (%) (1) NPAs/ Assets 1.32% 1.02% 0.81% 0.66% NCOs/ Avg Loans 0.10 0.11 0.13 0.38 Reserves/ Nonaccrual Loans 102 178 224 229 Profitability Net Income $8,420 $7,580 $6,944 $2,452 ROAA 1.01% 0.91% 0.78% 0.47% ROAE 9.89 8.48 7.53 4.77 ROATCE (2) 11.7 9.9 8.7 6.2 Net Interest Margin 3.82 3.82 3.58 3.53 Efficiency Ratio (2) 61.4 65.0 67.2 70.8 Diluted EPS $2.07 $1.86 $1.69 $0.53

12 $29,060 $16,781 $7,601 $4,192 0% 10% 20% 30% 40% 50% 60% 70% 80% 90% 100% 2017Y 2018YTD Net Interest Income Fee Income Balanced Fee Revenue Mix With Opportunity For Continued Improvement Source: Company documents. Note: Fee income defined as noninterest income less net gain on sales of investments. Fee Revenue Mix – YTD 2018 Q2 fee income sources comprised approximately 18.5% of total revenue; overall fee income declined to 20% of revenue on a YTD basis as a result of the First West Virginia transaction Cross - sell efforts, particularly with respect to insurance and wealth management businesses are being implemented (but were not modeled into the transaction metrics) Acquisition of Beynon Insurance (announced July 30) will add to the growth of our Exchange Underwriters’ business Revenue Mix Comparison Deposit Fees & Sevice Charges 31% Insurance Commissions 43% BOLI Income 6% Other Noninterest Income 20% 2018 YTD Fee Income: $4.2 Million

13 Efficiency Ratio Source: SNL Financial and company documents. CBFV data is for the three months ended June 30, 2018. (1) Based upon annualized $3.0 million of estimated cost savings in the First West Virginia transaction. Improving Efficiency with FWVB Transaction Combination with First West Virginia is expected to contribute positively to overall efficiency & profitability Investments made via new hires in Pittsburgh and OH River Valley began to contribute to accelerating organic growth & core profitability in the 2 nd half of 2017 New operations and corporate centers to improve collaboration and efficiency through centralization of back office functions (31.4%) (5.6%) 82.8% 51.4% 74.2% 68.2% FWVB 3/31/18 Estimated Cost Saves (1) FWVB PF Cost Saves 3/31/18 CBFV 6/30/18 Impact of Est. $3M Cost Saves CBFV Pro Forma 6/30/18
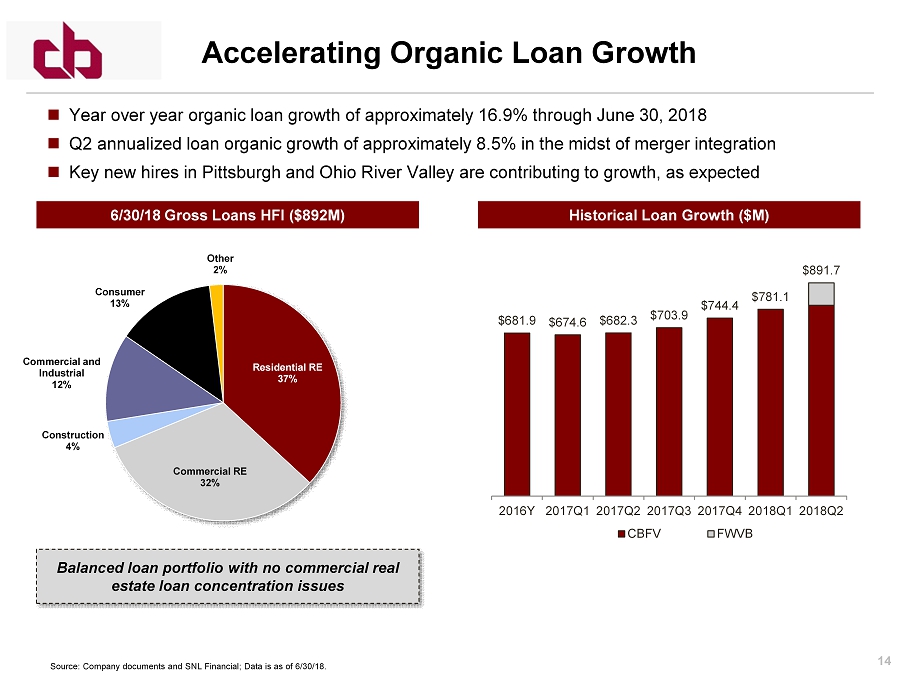
14 Accelerating Organic Loan Growth Source: Company documents and SNL Financial; Data is as of 6/30/18. Year over year organic loan growth of approximately 16.9% through June 30, 2018 Q2 annualized loan organic growth of approximately 8.5% in the midst of merger integration Key new hires in Pittsburgh and Ohio River Valley are contributing to growth, as expected 12/31/16 Gross Loans HFI ($682M) 12/3333333331/16 Gross Loans HFI ($682M) 6/30/18 Gross Loans HFI ($892M) Residential RE 37% Commercial RE 32% Construction 4% Commercial and Industrial 12% Consumer 13% Other 2% Historical Loan Growth ($M) $681.9 $674.6 $682.3 $703.9 $744.4 $781.1 $891.7 2016Y 2017Q1 2017Q2 2017Q3 2017Q4 2018Q1 2018Q2 CBFV FWVB Balanced loan portfolio with no commercial real estate loan concentration issues

15 Source: Company documents; Data is as of 6/30/18. (1) Represents the period from 6/30/17 through 6/30/18. Based on period end balance sheet data. Transaction with FWVB combines two stable, low cost deposit bases » 42 bps cost of total deposits for CBFV for the quarter ended March 31, 2018 » 23 bps cost of total deposits for FWVB for the quarter ended March 31, 2018 » 51 bps cost of total deposits for the quarter ended 6/30/18 on a combined basis Nearly 80% non - time deposits; 6% time deposits >$250,000 and brokered deposits 9.0% year over year (1) organic increase in noninterest bearing deposits through June 30, 2018 Pro forma for the FWVB transaction the loan to deposit ratio decreased from more than 100% at March 31, 2018 to approximately 87% at June 30, 2018 High Quality Deposit Base Demand 24.2% NOW 17.4% MMDA & Savings 37.7% Time Deposits <$250,000 14.8% Time Deposits >$250,000 5.6% Brokered Deposits 0.3% 6/30/18 Deposits ($1.0B)

16 Cost of Interest Bearing Deposits Source: SNL Financial and company documents. Fed Funds rates as of the period end as provided by SNL Financial. (1) Historical combined data represents the weighted average of CBFV and FWVB reported data. (2) Represents end of period federal funds rate as reported by SNL Financial. Combined Deposit Cost Profile Loan to deposit ratio of approximately 87% providing ample liquidity to fund improved loan growth opportunities 0.67% 0.46% 0.49% 0.49% 0.50% 0.51% 0.56% 0.29% 0.28% 0.27% 0.28% 0.28% 0.28% 0.00% 0.50% 1.00% 1.50% 2.00% 2.50% 2016Q4 2017Q1 2017Q2 2017Q3 2017Q4 2018Q1 2018Q2 CBFV Combined (1) CBFV FWVB Federal Funds (2) FWVB experienced negative standalone deposit beta from Q4 2016 through Q1 2018

17 Nonperforming Assets / Assets (1) Nonperforming Assets / Loans + OREO (1) NCOs / Avg. Loans Source: SNL Financial and company documents, Peers include all commercial banks and bank holding companies headquartered in Pennsylvania with assets $500 million to $2.0 billio n. Excludes mutual institutions and announced merger targets. (1) Non - Performing Assets = Nonaccrual + TDRs + 90 day past due and still accruing + OREO . Strong Asset Quality 0.86% 1.32% 1.02% 0.81% 0.60% 0.66% 0.00% 0.50% 1.00% 1.50% 2.00% 2014Y 2015Y 2016Y 2017Y 2018Q1 2018Q2 CBFV PA Peer Median 1.01% 1.58% 1.21% 0.99% 0.74% 0.91% 0.00% 0.50% 1.00% 1.50% 2.00% 2.50% 2014Y 2015Y 2016Y 2017Y 2018Q1 2018Q2 CBFV PA Peer Median 0.04% 0.10% 0.11% 0.13% 0.74% 0.06% 0.00% 0.20% 0.40% 0.60% 0.80% 1.00% 2014Y 2015Y 2016Y 2017Y 2018Q1 2018Q2 CBFV PA Peer Median

18 176% 102% 178% 224% 330% 229% 0% 100% 200% 300% 400% 2014Y 2015Y 2016Y 2017Y 2018Q1 2018Q2 CBFV PA Peer Median Allowance for Loan Losses / Nonaccrual Loans Allowance for Loan Losses / Loans Source: SNL Financial and company documents . Peers include all commercial banks and bank holding companies headquartered in Pennsylvania with assets $500 million to $2.0 billio n. Excludes mutual institutions and announced merger targets. Reserve Levels Support Capital Strength Conservative credit culture supported by low historical charge - off levels Credit marks from First West Virginia and FedFirst transactions provide additional reserve support Increase in net charge - offs in Q1 2018 was primarily related to three isolated C&I relationships which experienced approximately $1.2 million in NCOs during Q1 0.76% 0.95% 1.14% 1.18% 1.14% 1.05% 1.39% 1.43% 1.38% 1.28% 1.23% 1.27% 0.00% 0.40% 0.80% 1.20% 1.60% 2.00% 2014Y 2015Y 2016Y 2017Y 2018Q1 2018Q2 CBFV Credit Mark PA Peer Median

19 Conclusions
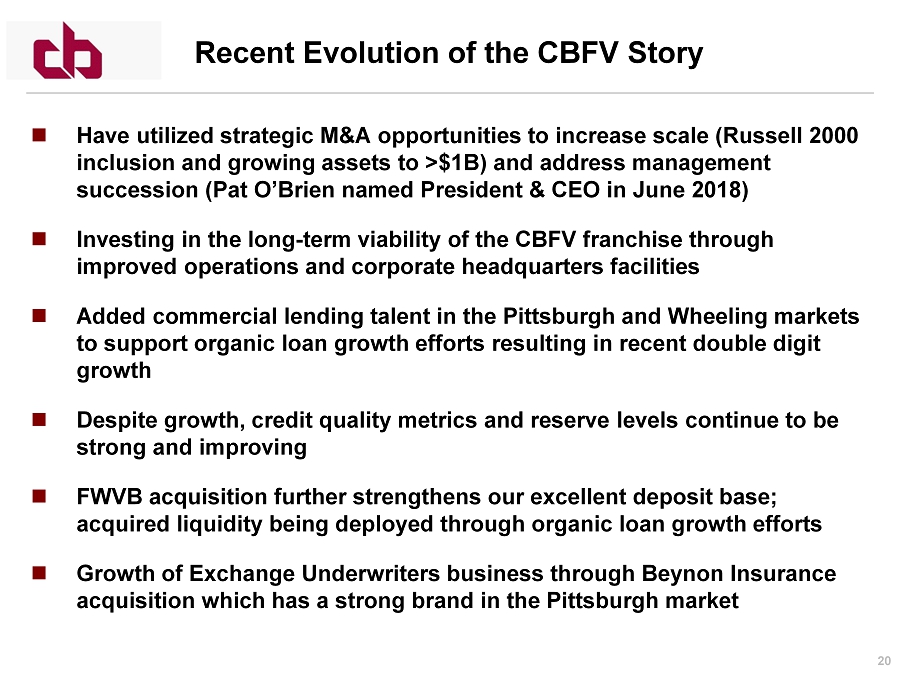
20 Have utilized strategic M&A opportunities to increase scale (Russell 2000 inclusion and growing assets to >$1B) and address management succession (Pat O’Brien named President & CEO in June 2018) Investing in the long - term viability of the CBFV franchise through improved operations and corporate headquarters facilities Added commercial lending talent in the Pittsburgh and Wheeling markets to support organic loan growth efforts resulting in recent double digit growth Despite growth, credit quality metrics and reserve levels continue to be strong and improving FWVB acquisition further strengthens our excellent deposit base; acquired liquidity being deployed through organic loan growth efforts Growth of Exchange Underwriters business through Beynon Insurance acquisition which has a strong brand in the Pittsburgh market Recent Evolution of the CBFV Story
21 Empower our experienced, high quality employees to provide superior customer service in all aspects of our business Create a service culture which builds full relationships with our customers Continue our track record of opportunistic growth in the Marcellus/Utica Shale Region Evolve toward more electronic/digital products and processes Maintain strong profitability while continuing to invest for the future Maintain and seek to increase our annual dividend of $0.88 per share Be the Community Bank of choice in the Marcellus/Utica Shale Region for residents and small and medium sized businesses Strategic Vision for CB Financial Services

22 Appendix

23 Key Senior Management Pat McCune Ralph Sommers Chairman Joined Community Bank in 1979 as EVP Became President in 1984 and President & CEO in 1988 Board member since 1983 and Chairman since 1999 President & CEO Responsible for new commercial business generation, sales culture and business line integration Former President, CEO & Director of FedFirst ; previously a Regional President of WSBC Director and Executive Consultant Vice Chairman and CEO through June 2018 Retired from day to day responsibilities in June 2018 Board member since 1992 and left law practice to become President in 1999 Kevin Lemley Executive Vice President and Chief Financial Officer Responsible for financial oversight and new SEC reporting requirements Joined CBFV in 2011; previously SVP and CFO of Centra Bank Pat O’Brien Rich Boyer Ralph Burchianti Executive Vice President and Chief Credit Officer Responsibilities include oversight of credit & underwriting policies for the combined organization Nearly 30 years of experience with CBFV Director & Senior Vice President – Insurance Operations Manages day to day operations of Exchange Underwriters and generates new business President of Exchange Underwriters since 1989

24 Non - GAAP Reconciliations TCE Ratio and Tangible Book Value Per Share Source: Company documents. Efficiency Ratio 6 Months (dollars in thousands, except share data) For the Years Ended Ended 2015 2016 2017 6/30/2018 GAAP Stockholders' Equity 86,896$ 89,469$ 93,256$ 133,806$ Intangible Assets (9,306) (8,772) (8,237) (31,023) Tangible Common Equity 77,590$ 80,697$ 85,019$ 102,783$ GAAP Total Assets 830,677$ 846,075$ 934,486$ 1,231,660$ Intangible Assets (9,306) (8,772) (8,237) (31,023) Tangible Assets 821,371$ 837,303$ 926,249$ 1,200,637$ Shares Outstanding 4,081,017 4,086,625 4,095,957 5,414,299 Tangible Book Value per Share 19.01$ 19.75$ 20.76$ 18.98$ Tangible Common Equity / Tang. Assets 9.45% 9.64% 9.18% 8.56% 6 Months 3 Months (dollars in thousands) For the Years Ended Ended Ended 2015 2016 2017 6/30/2018 6/30/2018 GAAP Non-Interest Expense 22,929$ 23,778$ 25,172$ 16,007$ 9,340$ OREO Income (Expense) 196 393 349 12 19 Amortization of Intangibles (535) (535) (535) (534) (400) Non-Recurring Merger Expense - - (356) (638) (614) Operating Non-Interest Expense (Numerator) 22,590$ 23,636$ 24,630$ 14,847$ 8,345$ GAAP Net Interest Income 29,202$ 29,148$ 29,060$ 16,781$ 9,173$ GAAP Non-Interest income 7,595 7,362 7,800 4,211 2,125 Realized (Gain) / Loss on Securities - (168) (199) - - Change in FV of Equity Securities - - - (19) (44) Operating Revenue (Denominator) 36,797$ 36,342$ 36,661$ 20,973$ 11,254$ Efficiency Ratio 61.4% 65.0% 67.2% 70.8% 74.2%

25 Non - GAAP Reconciliations Return on Average Tangible Common Equity (1) Source: Company documents. (1) Data for the six months ended 6/30/2018 has been annualized for comparability purposes. 6 Months (dollars in thousands) For the Years Ended Ended 2015 2016 2017 6/30/2018 GAAP Net Income 8,420$ 7,580$ 6,944$ 2,452$ Amortization of Intangibles (After Tax) 348 348 348 422 Adjusted Net Income (Numerator) 8,768$ 7,928$ 7,292$ 2,874$ Annualization Factor 1.000 1.000 1.000 2.017 GAAP Average Total Equity 85,162$ 89,351$ 92,263$ 103,755$ Average Intangibles (10,168) (8,989) (8,438) (10,216) Average Tangible Common Equity (Denominator) 74,994$ 80,040$ 83,504$ 93,539$ Return on Average Tangible Common Equity 11.7% 9.9% 8.7% 6.2%