Attached files
| file | filename |
|---|---|
| EX-32 - EX-32 - UNIVERSAL INSURANCE HOLDINGS, INC. | uve-ex32_7.htm |
| EX-31.2 - EX-31.2 - UNIVERSAL INSURANCE HOLDINGS, INC. | uve-ex312_8.htm |
| EX-31.1 - EX-31.1 - UNIVERSAL INSURANCE HOLDINGS, INC. | uve-ex311_6.htm |
| EX-15.1 - EX-15.1 - UNIVERSAL INSURANCE HOLDINGS, INC. | uve-ex151_9.htm |
UNITED STATES
SECURITIES AND EXCHANGE COMMISSION
WASHINGTON, D.C. 20549
FORM 10-Q
(Mark One)
|
☒ |
QUARTERLY REPORT PURSUANT TO SECTION 13 OR 15(d) OF THE SECURITIES EXCHANGE ACT OF 1934 |
For the quarterly period ended June 30, 2018
or
|
☐ |
TRANSITION REPORT PURSUANT TO SECTION 13 OR 15(d) OF THE SECURITIES EXCHANGE ACT OF 1934 |
For the transition period from to
Commission File Number 001-33251
UNIVERSAL INSURANCE HOLDINGS, INC.
(Exact name of registrant as specified in its charter)
|
Delaware |
|
65-0231984 |
|
(State or other jurisdiction of incorporation or organization) |
|
(I.R.S. Employer |
1110 W. Commercial Blvd., Fort Lauderdale, Florida 33309
(Address of principal executive offices)
(954) 958-1200
(Registrant’s telephone number, including area code)
Indicate by check mark whether the registrant (1) has filed all reports required to be filed by Section 13 or 15(d) of the Securities Exchange Act of 1934 during the preceding 12 months (or for such period that the registrant was required to file such reports), and (2) has been subject to such filing requirements for the past 90 days. Yes ☒ No ☐
Indicate by check mark whether the registrant has submitted electronically and posted on its corporate Web site, if any, every Interactive Data File required to be submitted and posted pursuant to Rule 405 of Regulation S-T (§232.405 of this chapter) during the preceding 12 months (or for such shorter period that the registrant was required to submit and post such files). Yes ☒ No ☐
Indicate by check mark whether the registrant is a large accelerated filer, an accelerated filer, a non-accelerated filer, a smaller reporting company, or an emerging growth company. See the definitions of “large accelerated filer,” “accelerated filer,” “smaller reporting company,” and “emerging growth company” in Rule 12b-2 of the Exchange Act.
|
Large accelerated filer |
|
☒ |
|
Accelerated filer |
|
☐ |
|
|
|
|
|
|||
|
Non-accelerated filer |
|
☐ (Do not check if a smaller reporting company) |
|
Smaller reporting company |
|
☐ |
|
|
|
|
|
|
|
|
|
|
|
|
|
Emerging growth company |
|
☐ |
If an emerging growth company, indicate by check mark if the registrant has elected not to use the extended transition period for complying with any new or revised financial accounting standards provided pursuant to Section 13(a) of the Exchange Act. ☐
Indicate by check mark whether the registrant is a shell company (as defined in Rule 12b-2 of the Exchange Act) Yes ☐ No ☒
Indicate the number of shares outstanding of each of the issuer’s classes of common stock, as of the latest practicable date: 34,872,073 shares of common stock, par value $0.01 per share, outstanding on July 23, 2018.
UNIVERSAL INSURANCE HOLDINGS, INC.
TABLE OF CONTENTS
PART I – FINANCIAL INFORMATION
|
|
|
|
|
Page No. |
|
|
|
|
|
|
|
Item 1. |
|
|
4 |
|
|
|
|
|
|
|
|
|
|
Condensed Consolidated Balance Sheets as of June 30, 2018 (unaudited) and December 31, 2017 |
|
4 |
|
|
|
|
|
|
|
|
|
|
5 |
|
|
|
|
|
|
|
|
|
|
|
5 |
|
|
|
|
|
|
|
|
|
|
|
6 |
|
|
|
|
|
|
|
|
|
|
Notes to Condensed Consolidated Financial Statements (unaudited) |
|
7 |
|
|
|
|
|
|
|
Item 2. |
|
Management’s Discussion and Analysis of Financial Condition and Results of Operations |
|
27 |
|
|
|
|
|
|
|
Item 3. |
|
|
47 |
|
|
|
|
|
|
|
|
Item 4. |
|
|
49 |
|
|
|
||||
|
|
|
|
|
|
|
Item 1. |
|
|
49 |
|
|
|
|
|
|
|
|
Item 1A. |
|
|
50 |
|
|
|
|
|
|
|
|
Item 2. |
|
|
50 |
|
|
|
|
|
|
|
|
Item 6. |
|
|
51 |
|
|
|
|
|
|
|
|
|
52 |
|||
2
REPORT OF INDEPENDENT REGISTERED PUBLIC ACCOUNTING FIRM
To The Board of Directors and Stockholders of
Universal Insurance Holdings, Inc. and Subsidiaries
Fort Lauderdale, Florida
We have reviewed the accompanying condensed consolidated balance sheet of Universal Insurance Holdings, Inc. and its wholly-owned subsidiaries (the “Company”) as of June 30, 2018 and the related condensed consolidated statements of income and comprehensive income for the three-month and six-month periods ended June 30, 2018 and 2017 and the related condensed consolidated statement of cash flows for the six-month periods ended June 30, 2018 and 2017. These interim financial statements are the responsibility of the Company’s management.
We conducted our review in accordance with the standards of the Public Company Accounting Oversight Board (United States). A review of interim financial information consists principally of applying analytical procedures and making inquiries of persons responsible for financial and accounting matters. It is substantially less in scope than an audit conducted in accordance with the standards of the Public Company Accounting Oversight Board (United States), the objective of which is the expression of an opinion regarding the financial statements taken as a whole. Accordingly, we do not express such an opinion.
Based on our review, we are not aware of any material modifications that should be made to the accompanying interim financial statements for them to be in conformity with accounting principles generally accepted in the United States of America.
We have previously audited, in accordance with the standards of the Public Company Accounting Oversight Board (United States), the consolidated balance sheet of Universal Insurance Holdings, Inc. and Subsidiaries as of December 31, 2017 and the related consolidated statements of income, comprehensive income, stockholders’ equity and cash flows for the year then ended (not presented herein) and we expressed an unqualified audit opinion on those consolidated financial statements in our report dated February 23, 2018. In our opinion, the information set forth in the accompanying consolidated balance sheet as of December 31, 2017, is fairly stated, in all material respects, in relation to the consolidated balance sheet from which it has been derived.
/s/ Plante & Moran, PLLC
Chicago, Illinois
July 27, 2018
3
PART I — FINANCIAL INFORMATION
UNIVERSAL INSURANCE HOLDINGS, INC. AND SUBSIDIARIES
CONDENSED CONSOLIDATED BALANCE SHEETS (unaudited)
(in thousands, except per share data)
|
|
As of |
|
|||||
|
|
June 30, |
|
|
December 31, |
|
||
|
|
2018 |
|
|
2017 |
|
||
|
|
(unaudited) |
|
|
|
|
|
|
|
ASSETS |
|
|
|
|
|
|
|
|
Available-for-sale debt securities |
$ |
656,762 |
|
|
$ |
639,334 |
|
|
Available-for-sale short-term investments |
|
— |
|
|
|
10,000 |
|
|
Equity securities |
|
70,866 |
|
|
|
62,215 |
|
|
Investment real estate, net |
|
19,539 |
|
|
|
18,474 |
|
|
Total invested assets |
|
747,167 |
|
|
|
730,023 |
|
|
|
|
|
|
|
|
|
|
|
Cash and cash equivalents |
|
311,088 |
|
|
|
213,486 |
|
|
Restricted cash and cash equivalents |
|
2,635 |
|
|
|
2,635 |
|
|
Prepaid reinsurance premiums |
|
310,618 |
|
|
|
132,806 |
|
|
Reinsurance recoverable |
|
117,851 |
|
|
|
182,405 |
|
|
Reinsurance receivable, net |
|
1,402 |
|
|
|
— |
|
|
Premium receivable, net |
|
67,186 |
|
|
|
56,500 |
|
|
Property and equipment, net |
|
34,792 |
|
|
|
32,866 |
|
|
Deferred policy acquisition costs |
|
88,756 |
|
|
|
73,059 |
|
|
Income taxes recoverable |
|
11,839 |
|
|
|
9,472 |
|
|
Deferred income tax asset, net |
|
177 |
|
|
|
9,286 |
|
|
Other assets |
|
17,766 |
|
|
|
12,461 |
|
|
Total assets |
$ |
1,711,277 |
|
|
$ |
1,454,999 |
|
|
LIABILITIES AND STOCKHOLDERS' EQUITY |
|
|
|
|
|
|
|
|
LIABILITIES: |
|
|
|
|
|
|
|
|
Unpaid losses and loss adjustment expenses |
$ |
151,916 |
|
|
$ |
248,425 |
|
|
Unearned premiums |
|
608,921 |
|
|
|
532,444 |
|
|
Advance premium |
|
38,230 |
|
|
|
26,216 |
|
|
Accounts payable |
|
2,778 |
|
|
|
2,866 |
|
|
Book overdraft |
|
2,982 |
|
|
|
36,715 |
|
|
Reinsurance payable, net |
|
341,912 |
|
|
|
110,381 |
|
|
Dividends payable |
|
5,638 |
|
|
|
— |
|
|
Other liabilities and accrued expenses |
|
54,695 |
|
|
|
45,096 |
|
|
Long-term debt |
|
12,132 |
|
|
|
12,868 |
|
|
Total liabilities |
|
1,219,204 |
|
|
|
1,015,011 |
|
|
|
|
|
|
|
|
|
|
|
Commitments and Contingencies (Note 12) |
|
|
|
|
|
|
|
|
|
|
|
|
|
|
|
|
|
STOCKHOLDERS' EQUITY: |
|
|
|
|
|
|
|
|
Cumulative convertible preferred stock, $.01 par value |
|
— |
|
|
|
— |
|
|
Authorized shares - 1,000 |
|
|
|
|
|
|
|
|
Issued shares - 10 and 10 |
|
|
|
|
|
|
|
|
Outstanding shares - 10 and 10 |
|
|
|
|
|
|
|
|
Minimum liquidation preference, $9.99 and $9.99 per share |
|
|
|
|
|
|
|
|
Common stock, $.01 par value |
|
463 |
|
|
|
458 |
|
|
Authorized shares - 55,000 |
|
|
|
|
|
|
|
|
Issued shares - 46,257 and 45,778 |
|
|
|
|
|
|
|
|
Outstanding shares - 34,872 and 34,735 |
|
|
|
|
|
|
|
|
Treasury shares, at cost - 11,385 and 11,043 |
|
(116,239 |
) |
|
|
(105,123 |
) |
|
Additional paid-in capital |
|
85,925 |
|
|
|
86,186 |
|
|
Accumulated other comprehensive income (loss), net of taxes |
|
(9,161 |
) |
|
|
(6,281 |
) |
|
Retained earnings |
|
531,085 |
|
|
|
464,748 |
|
|
Total stockholders' equity |
|
492,073 |
|
|
|
439,988 |
|
|
Total liabilities and stockholders' equity |
$ |
1,711,277 |
|
|
$ |
1,454,999 |
|
The accompanying notes to condensed consolidated financial statements are an integral part of these statements.
4
UNIVERSAL INSURANCE HOLDINGS, INC. AND SUBSIDIARIES
CONDENSED CONSOLIDATED STATEMENTS OF INCOME (unaudited)
(in thousands, except per share data)
|
|
Three Months Ended |
|
|
Six Months Ended |
|
|
||||||||||
|
|
June 30, |
|
|
June 30, |
|
|
||||||||||
|
|
2018 |
|
|
2017 |
|
|
2018 |
|
|
2017 |
|
|
||||
|
PREMIUMS EARNED AND OTHER REVENUES |
|
|
|
|
|
|
|
|
|
|
|
|
|
|
|
|
|
Direct premiums written |
$ |
342,781 |
|
|
$ |
296,191 |
|
|
$ |
612,765 |
|
|
$ |
541,606 |
|
|
|
Change in unearned premium |
|
(68,754 |
) |
|
|
(51,568 |
) |
|
|
(76,477 |
) |
|
|
(60,608 |
) |
|
|
Direct premium earned |
|
274,027 |
|
|
|
244,623 |
|
|
|
536,288 |
|
|
|
480,998 |
|
|
|
Ceded premium earned |
|
(81,755 |
) |
|
|
(75,614 |
) |
|
|
(161,439 |
) |
|
|
(150,430 |
) |
|
|
Premiums earned, net |
|
192,272 |
|
|
|
169,009 |
|
|
|
374,849 |
|
|
|
330,568 |
|
|
|
Net investment income (expense) |
|
5,786 |
|
|
|
3,223 |
|
|
|
10,571 |
|
|
|
5,927 |
|
|
|
Net realized gains (losses) on sale of securities |
|
145 |
|
|
|
1,710 |
|
|
|
(2,496 |
) |
|
|
1,647 |
|
|
|
Net change in unrealized gains (losses) of equity securities |
|
(1,521 |
) |
|
|
— |
|
|
|
(6,630 |
) |
|
|
— |
|
|
|
Commission revenue |
|
5,709 |
|
|
|
4,644 |
|
|
|
10,980 |
|
|
|
9,242 |
|
|
|
Policy fees |
|
5,764 |
|
|
|
5,250 |
|
|
|
10,539 |
|
|
|
9,733 |
|
|
|
Other revenue |
|
1,633 |
|
|
|
1,651 |
|
|
|
3,475 |
|
|
|
3,244 |
|
|
|
Total premiums earned and other revenues |
|
209,788 |
|
|
|
185,487 |
|
|
|
401,288 |
|
|
|
360,361 |
|
|
|
OPERATING COSTS AND EXPENSES |
|
|
|
|
|
|
|
|
|
|
|
|
|
|
|
|
|
Losses and loss adjustment expenses |
|
89,842 |
|
|
|
80,184 |
|
|
|
165,768 |
|
|
|
150,754 |
|
|
|
General and administrative expenses |
|
58,698 |
|
|
|
57,380 |
|
|
|
122,573 |
|
|
|
114,313 |
|
|
|
Total operating costs and expenses |
|
148,540 |
|
|
|
137,564 |
|
|
|
288,341 |
|
|
|
265,067 |
|
|
|
INCOME BEFORE INCOME TAXES |
|
61,248 |
|
|
|
47,923 |
|
|
|
112,947 |
|
|
|
95,294 |
|
|
|
Income tax expense |
|
15,164 |
|
|
|
18,547 |
|
|
|
26,808 |
|
|
|
34,719 |
|
|
|
NET INCOME |
$ |
46,084 |
|
|
$ |
29,376 |
|
|
$ |
86,139 |
|
|
$ |
60,575 |
|
|
|
Basic earnings per common share |
$ |
1.32 |
|
|
$ |
0.84 |
|
|
$ |
2.47 |
|
|
$ |
1.73 |
|
|
|
Weighted average common shares outstanding - Basic |
|
34,909 |
|
|
|
34,959 |
|
|
|
34,874 |
|
|
|
35,049 |
|
|
|
Diluted earnings per common share |
$ |
1.29 |
|
|
$ |
0.82 |
|
|
$ |
2.42 |
|
|
$ |
1.68 |
|
|
|
Weighted average common shares outstanding - Diluted |
|
35,589 |
|
|
|
35,958 |
|
|
|
35,636 |
|
|
|
36,061 |
|
|
|
Cash dividend declared per common share |
$ |
0.14 |
|
|
$ |
0.14 |
|
|
$ |
0.28 |
|
|
$ |
0.28 |
|
|
CONDENSED CONSOLIDATED STATEMENTS OF COMPREHENSIVE INCOME (unaudited)
|
|
Three Months Ended |
|
|
Six Months Ended |
|
|
||||||||||
|
|
June 30, |
|
|
June 30, |
|
|
||||||||||
|
|
2018 |
|
|
2017 |
|
|
2018 |
|
|
2017 |
|
|
||||
|
Net income |
$ |
46,084 |
|
|
$ |
29,376 |
|
|
$ |
86,139 |
|
|
$ |
60,575 |
|
|
|
Other comprehensive income (loss), net of taxes |
|
(1,849 |
) |
|
|
1,486 |
|
|
|
(5,899 |
) |
|
|
3,950 |
|
|
|
Comprehensive income |
$ |
44,235 |
|
|
$ |
30,862 |
|
|
$ |
80,240 |
|
|
$ |
64,525 |
|
|
The accompanying notes to condensed consolidated financial statements are an integral part of these statements.
5
UNIVERSAL INSURANCE HOLDINGS, INC. AND SUBSIDIARIES
CONDENSED CONSOLIDATED STATEMENTS OF CASH FLOWS (unaudited)
(in thousands)
|
|
|
|
|||||
|
|
Six Months Ended June 30, |
|
|||||
|
|
2018 |
|
|
2017 |
|
||
|
Cash flows from operating activities: |
|
|
|
|
|
|
|
|
Net cash provided by (used in) operating activities |
$ |
158,081 |
|
|
$ |
140,965 |
|
|
Cash flows from investing activities: |
|
|
|
|
|
|
|
|
Proceeds from sale of property and equipment |
|
17 |
|
|
|
15 |
|
|
Purchases of property and equipment |
|
(4,024 |
) |
|
|
(2,757 |
) |
|
Purchases of equity securities |
|
(19,106 |
) |
|
|
(13,275 |
) |
|
Purchases of available-for-sale debt securities |
|
(205,738 |
) |
|
|
(67,517 |
) |
|
Purchases of investment real estate, net |
|
(1,269 |
) |
|
|
(3,759 |
) |
|
Proceeds from sales of equity securities |
|
4,127 |
|
|
|
56,971 |
|
|
Proceeds from sales of available-for-sale debt securities |
|
119,222 |
|
|
|
6,507 |
|
|
Maturities of available-for-sale debt securities |
|
64,480 |
|
|
|
39,144 |
|
|
Maturities of available-for-sale short-term investments |
|
10,000 |
|
|
|
5,000 |
|
|
Net cash provided by (used in) investing activities |
|
(32,291 |
) |
|
|
20,329 |
|
|
Cash flows from financing activities: |
|
|
|
|
|
|
|
|
Preferred stock dividend |
|
(5 |
) |
|
|
(5 |
) |
|
Common stock dividend |
|
(9,821 |
) |
|
|
(9,803 |
) |
|
Issuance of common stock for stock option exercises |
|
73 |
|
|
|
— |
|
|
Purchase of treasury stock |
|
(11,116 |
) |
|
|
(8,919 |
) |
|
Payments related to tax withholding for share-based compensation |
|
(6,583 |
) |
|
|
(1,367 |
) |
|
Repayment of debt |
|
(736 |
) |
|
|
(1,435 |
) |
|
Net cash provided by (used in) financing activities |
|
(28,188 |
) |
|
|
(21,529 |
) |
|
Cash and cash equivalents, and restricted cash and cash equivalents: |
|
|
|
|
|
|
|
|
Net increase (decrease) during the period |
|
97,602 |
|
|
|
139,765 |
|
|
Balance, beginning of period |
|
216,121 |
|
|
|
108,365 |
|
|
Balance, end of period |
$ |
313,723 |
|
|
$ |
248,130 |
|
The following table summarizes our cash and cash equivalents and restricted cash and cash equivalents within the Condensed Consolidated Balance Sheets (in thousands):
|
|
|
|
|||||
|
|
June 30, 2018 |
|
|
December 31, 2017 |
|
||
|
Cash and cash equivalents |
$ |
311,088 |
|
|
$ |
213,486 |
|
|
Restricted cash and cash equivalents (1) |
|
2,635 |
|
|
|
2,635 |
|
|
Total cash and cash equivalents and restricted cash and cash equivalents |
$ |
313,723 |
|
|
$ |
216,121 |
|
|
(1) |
See “—Note 5 (Insurance Operations),” for a discussion of the nature of the restrictions for restricted cash and cash equivalents. |
The accompanying notes to condensed consolidated financial statements are an integral part of these statements.
6
UNIVERSAL INSURANCE HOLDINGS, INC. AND SUBSIDIARIES
NOTES TO CONDENSED CONSOLIDATED FINANCIAL STATEMENTS
(unaudited)
1. Nature of Operations and Basis of Presentation
Nature of Operations
Universal Insurance Holdings, Inc. (“UVE”) is a Delaware corporation incorporated in 1990. UVE with its wholly-owned subsidiaries (the “Company”) is a vertically integrated insurance holding company performing all aspects of insurance underwriting, distribution and claims. Through its wholly-owned insurance company subsidiaries, Universal Property & Casualty Insurance Company (“UPCIC”) and American Platinum Property and Casualty Insurance Company (“APPCIC”), together referred to as the “Insurance Entities,” the Company is principally engaged in the property and casualty insurance business offered primarily through its network of independent agents. Risk from catastrophic losses is managed through the use of reinsurance agreements. The Company’s primary product is residential homeowners’ insurance currently offered in seventeen states as of June 30, 2018, including Florida, which comprises the vast majority of the Company’s in-force policies. See “—Note 5 (Insurance Operations)” for more information regarding the Company’s insurance operations.
The Company generates revenues primarily from the collection of premiums and invests funds in excess of those retained for claims-paying obligations and insurance operations. Other significant sources of revenue include brokerage commissions collected from reinsurers on certain reinsurance programs placed by the Insurance Entities, policy fees collected from policyholders by our wholly-owned managing general agent subsidiary and payment plan fees charged to policyholders who choose to pay their premiums in installments.
Basis of Presentation
The Company has prepared the accompanying unaudited Condensed Consolidated Financial Statements (“Financial Statements”) in accordance with the rules and regulations of the United States Securities and Exchange Commission (“SEC”) for interim financial information. Accordingly, the Financial Statements do not include all of the information and footnotes required by United States Generally Accepted Accounting Principles (“U. S. GAAP”) for annual financial statements. Therefore, the Financial Statements should be read in conjunction with the audited Consolidated Financial Statements contained in the Company’s Annual Report on Form 10-K for the fiscal year ended December 31, 2017, filed with the SEC on February 23, 2018. The condensed consolidated balance sheet at December 31, 2017, was derived from audited financial statements, but does not include all disclosures required by U.S. GAAP. In the opinion of management, all adjustments (consisting of normal recurring adjustments) necessary for a fair presentation have been included in the Financial Statements. The results for interim periods do not necessarily indicate the results that may be expected for any other interim period or for the full year.
To conform to the current period presentation, certain amounts in the prior periods’ consolidated financial statements and notes have been reclassified. Such reclassifications were of an immaterial amount and had no effect on net income or stockholders’ equity.
The Financial Statements include the accounts of UVE and its wholly-owned subsidiaries. All material intercompany balances and transactions have been eliminated in consolidation.
Management must make estimates and assumptions that affect amounts reported in the Company’s Financial Statements and in disclosures of contingent assets and liabilities. Actual results could differ from those estimates.
7
2. Significant Accounting Policies
The Company reported Significant Accounting Policies in its Annual Report on Form 10-K for the year ended December 31, 2017. The following are new or revised disclosures or disclosures required on a quarterly basis.
Recently Adopted Accounting Pronouncements
In January 2016, the Financial Accounting Standards Board (“FASB”) revised U.S. GAAP with the issuance of Accounting Standards Update (“ASU”) 2016-01, Financial Instruments - Overall (Subtopic 825-10): Recognition and Measurement of Financial Assets and Financial Liabilities to improve the recognition and measurement of financial instruments. The new ASU requires certain investments in equity securities to be measured at fair value with changes in fair value reported in earnings and requires changes in instrument-specific credit risk for financial liabilities recorded at fair value under the fair value option to be reported in Other Comprehensive Income (“OCI”). The Company adopted this ASU effective January 1, 2018 using the modified retrospective transition method and recorded a cumulative effect adjustment of $3.6 million to the Condensed Consolidated Balance Sheets to reclassify unrealized losses on investments in equity securities to retained earnings from other comprehensive income. The adoption of this ASU also resulted in the recognition of the change in unrealized gains and losses for equity security investments as a separate component in the Condensed Consolidated Statements of Income during the three and six months ended June 30, 2018.
In August 2016, the FASB revised U.S. GAAP with the issuance of ASU 2016-15, Classification of Certain Cash Receipts and Cash Payments intended to reduce diversity in practice in how certain cash receipts and cash payments are presented and classified in the statement of cash flows. The new ASU applies to: 1) debt prepayment or debt extinguishment costs, 2) settlement of zero-coupon debt instruments, 3) contingent consideration payments made after business combination, 4) proceeds from the settlement of insurance claims, 5) proceeds from the settlement of corporate-owned life insurance policies, 6) distributions received from equity method investments, 7) beneficial interests in securitization transactions, and 8) separately identifiable cash flows and application of the predominance principle. Historically, the items outlined above have not been applicable to the Company. The Company adopted this ASU effective January 1, 2018 and the adoption did not have an impact on our Condensed Consolidated Statements of Cash Flows.
In November 2016, the FASB revised U.S. GAAP, Statement of Cash Flows (Topic 230): Restricted Cash with the issuance of the ASU 2016-18, to reduce diversity in the classification and presentation of changes in restricted cash in the statement of cash flows. The new ASU requires that the statement of cash flows explain the change during the period in the total of cash, cash equivalents, and amounts generally described as restricted cash or restricted cash equivalents. The Company is required to reconcile such total to amounts on the Condensed Consolidated Balance Sheets and disclose the nature of the restrictions. The Company adopted this ASU effective January 1, 2018, which only resulted in a change in the presentation of the Condensed Consolidated Statements of Cash Flows.
In February 2018, the FASB revised U.S. GAAP, Comprehensive Income (Topic 220), with the issuance of ASU 2018-02, Reclassification of Certain Tax Effects from Accumulated Other Comprehensive Income in response to the enactment of the Tax Cuts and Jobs Act of 2017 (the “Tax Act”) on December 22, 2017. The new ASU permits a company to reclassify the disproportionate income tax effects of the Tax Act on items within accumulated other comprehensive income (“AOCI”) to retained earnings and requires certain new disclosures. The Company adopted this guidance effective January 1, 2018 and made an election to reclassify the income tax effects of the Tax Act from AOCI to retained earnings. Retained earnings were reduced by approximately $0.6 million due to this reclassification. The reclassification represents the effect of the change in the U.S. federal corporate income tax rate on the gross deferred tax amounts and related valuation allowances at the date of enactment of the Tax Act related to items remaining in accumulated other comprehensive income. The Company follows an aggregate portfolio approach and considers that it had two portfolios, an available for sale debt equity portfolio and an available for sale equity portfolio, the disproportionate tax effects relating to the available for sale equity portfolio were included in the transition adjustment when adopting ASU 2016-01.
8
Securities Available for Sale
The following table provides the amortized cost and fair value of debt and short-term investment securities available for sale as of the dates presented (in thousands):
|
|
June 30, 2018 |
|
|||||||||||||
|
|
|
|
|
|
Gross |
|
|
Gross |
|
|
|
|
|
||
|
|
Amortized |
|
|
Unrealized |
|
|
Unrealized |
|
|
|
|
|
|||
|
|
Cost |
|
|
Gains |
|
|
Losses |
|
|
Fair Value |
|
||||
|
Debt Securities: |
|
|
|
|
|
|
|
|
|
|
|
|
|
|
|
|
U.S. government obligations and agencies |
$ |
59,086 |
|
|
$ |
— |
|
|
$ |
(1,374 |
) |
|
$ |
57,712 |
|
|
Corporate bonds |
|
339,730 |
|
|
|
424 |
|
|
|
(6,190 |
) |
|
|
333,964 |
|
|
Mortgage-backed and asset-backed securities |
|
242,492 |
|
|
|
31 |
|
|
|
(5,091 |
) |
|
|
237,432 |
|
|
Municipal bonds |
|
15,798 |
|
|
|
— |
|
|
|
(81 |
) |
|
|
15,717 |
|
|
Redeemable preferred stock |
|
11,762 |
|
|
|
318 |
|
|
|
(143 |
) |
|
|
11,937 |
|
|
Total |
$ |
668,868 |
|
|
$ |
773 |
|
|
$ |
(12,879 |
) |
|
$ |
656,762 |
|
|
|
December 31, 2017 |
|
|||||||||||||
|
|
|
|
|
|
Gross |
|
|
Gross |
|
|
|
|
|
||
|
|
Amortized |
|
|
Unrealized |
|
|
Unrealized |
|
|
|
|
|
|||
|
|
Cost |
|
|
Gains |
|
|
Losses |
|
|
Fair Value |
|
||||
|
Debt Securities: |
|
|
|
|
|
|
|
|
|
|
|
|
|
|
|
|
U.S. government obligations and agencies |
$ |
60,481 |
|
|
$ |
— |
|
|
$ |
(877 |
) |
|
$ |
59,604 |
|
|
Corporate bonds |
|
228,336 |
|
|
|
476 |
|
|
|
(1,308 |
) |
|
|
227,504 |
|
|
Mortgage-backed and asset-backed securities |
|
221,956 |
|
|
|
19 |
|
|
|
(2,523 |
) |
|
|
219,452 |
|
|
Municipal bonds |
|
120,883 |
|
|
|
599 |
|
|
|
(1,187 |
) |
|
|
120,295 |
|
|
Redeemable preferred stock |
|
12,059 |
|
|
|
485 |
|
|
|
(65 |
) |
|
|
12,479 |
|
|
Short-term investments |
|
10,000 |
|
|
|
— |
|
|
|
— |
|
|
|
10,000 |
|
|
Total |
$ |
653,715 |
|
|
$ |
1,579 |
|
|
$ |
(5,960 |
) |
|
$ |
649,334 |
|
The following table provides the credit quality of available-for-sale debt securities with contractual maturities as of the dates presented (dollars in thousands):
|
|
|
June 30, 2018 |
|
|
December 31, 2017 (1) |
|
||||||||||
|
|
|
|
|
|
|
% of Total |
|
|
|
|
|
|
% of Total |
|
||
|
Credit Ratings |
|
Fair Value |
|
|
Fair Value |
|
|
Fair Value |
|
|
Fair Value |
|
||||
|
AAA |
|
$ |
310,359 |
|
|
|
47.3 |
% |
|
$ |
317,313 |
|
|
|
48.9 |
% |
|
AA |
|
|
73,207 |
|
|
|
11.1 |
% |
|
|
129,573 |
|
|
|
20.0 |
% |
|
A |
|
|
182,479 |
|
|
|
27.8 |
% |
|
|
146,749 |
|
|
|
22.6 |
% |
|
BBB |
|
|
87,007 |
|
|
|
13.3 |
% |
|
|
51,020 |
|
|
|
7.8 |
% |
|
BB+ and Below |
|
|
114 |
|
|
|
0.0 |
% |
|
|
1,569 |
|
|
|
0.2 |
% |
|
No Rating Available |
|
|
3,596 |
|
|
|
0.5 |
% |
|
|
3,110 |
|
|
|
0.5 |
% |
|
Total |
|
$ |
656,762 |
|
|
|
100.0 |
% |
|
$ |
649,334 |
|
|
|
100.0 |
% |
|
|
(1) |
The credit ratings in the table above have been reclassified from the prior periods’ consolidated financial statements to conform to the current periods’ presentation. |
The table above includes credit quality ratings by Standard and Poor’s Rating Services, Inc., Moody’s Investors Service,
Inc. and Fitch Ratings, Inc. The Company modified the presentation of this table by presenting the highest rating of the three rating agencies for each investment position.
9
The following table summarizes the amortized cost and fair value of mortgage-backed and asset-backed securities as of the dates presented (in thousands):
|
|
|
|
|
|
|
|
|
|
|
|
|
|
|
|
|
|
|
|
|
June 30, 2018 |
|
|
December 31, 2017 |
|
||||||||||
|
|
|
Amortized |
|
|
|
|
|
|
Amortized |
|
|
|
|
|
||
|
|
|
Cost |
|
|
Fair Value |
|
|
Cost |
|
|
Fair Value |
|
||||
|
Mortgage-backed Securities: |
|
|
|
|
|
|
|
|
|
|
|
|
|
|
|
|
|
Agency |
|
$ |
140,252 |
|
|
$ |
137,247 |
|
|
$ |
118,014 |
|
|
$ |
116,014 |
|
|
Non-agency |
|
|
29,023 |
|
|
|
28,608 |
|
|
|
17,676 |
|
|
|
17,488 |
|
|
Asset-backed Securities: |
|
|
|
|
|
|
|
|
|
|
|
|
|
|
|
|
|
Auto loan receivables |
|
|
30,187 |
|
|
|
29,845 |
|
|
|
35,105 |
|
|
|
34,962 |
|
|
Credit card receivables |
|
|
16,258 |
|
|
|
16,074 |
|
|
|
38,844 |
|
|
|
38,719 |
|
|
Other receivables |
|
|
26,772 |
|
|
|
25,658 |
|
|
|
12,317 |
|
|
|
12,269 |
|
|
Total |
|
$ |
242,492 |
|
|
$ |
237,432 |
|
|
$ |
221,956 |
|
|
$ |
219,452 |
|
The following table summarizes the fair value and gross unrealized losses on available-for-sale debt securities, aggregated by major investment category and length of time that individual securities have been in a continuous unrealized loss position as of the dates presented (dollars in thousands):
|
|
June 30, 2018 |
|
|||||||||||||||||||||
|
|
Less Than 12 Months |
|
|
12 Months or Longer |
|
||||||||||||||||||
|
|
Number of |
|
|
|
|
|
|
Unrealized |
|
|
Number of |
|
|
|
|
|
|
Unrealized |
|
||||
|
|
Issues |
|
|
Fair Value |
|
|
Losses |
|
|
Issues |
|
|
Fair Value |
|
|
Losses |
|
||||||
|
Debt Securities: |
|
|
|
|
|
|
|
|
|
|
|
|
|
|
|
|
|
|
|
|
|
|
|
|
U.S. government obligations and agencies |
|
9 |
|
|
$ |
35,148 |
|
|
$ |
(608 |
) |
|
|
8 |
|
|
$ |
22,564 |
|
|
$ |
(766 |
) |
|
Corporate bonds |
|
346 |
|
|
|
266,868 |
|
|
|
(5,103 |
) |
|
|
33 |
|
|
|
31,018 |
|
|
|
(1,087 |
) |
|
Mortgage-backed and asset-backed securities |
|
100 |
|
|
|
135,607 |
|
|
|
(2,172 |
) |
|
|
61 |
|
|
|
84,444 |
|
|
|
(2,919 |
) |
|
Municipal bonds |
|
7 |
|
|
|
3,521 |
|
|
|
(81 |
) |
|
|
— |
|
|
|
— |
|
|
|
— |
|
|
Redeemable preferred stock |
|
66 |
|
|
|
3,808 |
|
|
|
(143 |
) |
|
|
— |
|
|
|
— |
|
|
|
— |
|
|
Total |
|
528 |
|
|
$ |
444,952 |
|
|
$ |
(8,107 |
) |
|
|
102 |
|
|
$ |
138,026 |
|
|
$ |
(4,772 |
) |
|
|
December 31, 2017 |
|
|||||||||||||||||||||
|
|
Less Than 12 Months |
|
|
12 Months or Longer |
|
||||||||||||||||||
|
|
Number of |
|
|
|
|
|
|
Unrealized |
|
|
Number of |
|
|
|
|
|
|
Unrealized |
|
||||
|
|
Issues |
|
|
Fair Value |
|
|
Losses |
|
|
Issues |
|
|
Fair Value |
|
|
Losses |
|
||||||
|
Debt Securities: |
|
|
|
|
|
|
|
|
|
|
|
|
|
|
|
|
|
|
|
|
|
|
|
|
U.S. government obligations and agencies |
|
7 |
|
|
$ |
35,464 |
|
|
$ |
(301 |
) |
|
|
9 |
|
|
$ |
24,140 |
|
|
$ |
(576 |
) |
|
Corporate bonds |
|
159 |
|
|
|
142,208 |
|
|
|
(792 |
) |
|
|
39 |
|
|
|
29,796 |
|
|
|
(516 |
) |
|
Mortgage-backed and asset-backed securities |
|
83 |
|
|
|
137,481 |
|
|
|
(955 |
) |
|
|
37 |
|
|
|
70,218 |
|
|
|
(1,568 |
) |
|
Municipal bonds |
|
36 |
|
|
|
28,265 |
|
|
|
(246 |
) |
|
|
30 |
|
|
|
48,370 |
|
|
|
(941 |
) |
|
Redeemable preferred stock |
|
21 |
|
|
|
2,464 |
|
|
|
(65 |
) |
|
|
— |
|
|
|
— |
|
|
|
— |
|
|
Total |
|
306 |
|
|
$ |
345,882 |
|
|
$ |
(2,359 |
) |
|
|
115 |
|
|
$ |
172,524 |
|
|
$ |
(3,601 |
) |
Evaluating Investments for Other Than Temporary Impairment (“OTTI”)
As of June 30, 2018, the Company held available-for-sale debt securities that were in an unrealized loss position as presented in the table above. For available-for-sale debt securities with significant declines in value, the Company performs quarterly fundamental credit analysis on a security-by-security basis, which includes consideration of credit quality and credit ratings, review of relevant industry analyst reports and other available market data. For available-for-sale debt securities, the Company considers whether it has the intent and ability to hold the available-for-sale debt securities for a period of time sufficient to recover its cost basis. Where the Company lacks the intent and ability to hold to recovery, or believes the recovery period is extended, the security’s decline in fair value is considered other than temporary and is recorded in earnings. Based on our analysis, our fixed income portfolio is of high quality and we believe that we will recover the amortized cost basis of our available-for-sale debt securities. We continually monitor the credit quality of our investments in available-for-sale debt securities to assess if it is probable that we will receive our contractual or estimated cash flows in the form of principal and interest. Additionally, the Company considers management’s intent and ability to
10
hold the available-for-sale debt securities until recovery and its credit analysis of the individual issuers of the securities. Based on this process and analysis, management has no reason to believe the unrealized losses of the available-for-sale debt securities as of June 30, 2018 are other than temporary.
The following table presents the amortized cost and fair value of investments with contractual maturities as of the date presented (in thousands):
|
|
June 30, 2018 |
|
|||||
|
|
Amortized Cost |
|
|
Fair Value |
|
||
|
Due in one year or less |
$ |
49,496 |
|
|
$ |
49,286 |
|
|
Due after one year through five years |
|
216,335 |
|
|
|
211,886 |
|
|
Due after five years through ten years |
|
124,206 |
|
|
|
121,788 |
|
|
Due after ten years |
|
24,577 |
|
|
|
24,433 |
|
|
Mortgage-backed and asset-backed securities |
|
242,492 |
|
|
|
237,432 |
|
|
Perpetual maturity securities |
|
11,762 |
|
|
|
11,937 |
|
|
Total |
$ |
668,868 |
|
|
$ |
656,762 |
|
Expected maturities may differ from contractual maturities because borrowers may have the right to call or prepay with or without penalty.
The following table provides certain information related to available-for-sale debt securities and equity securities during the periods presented (in thousands):
|
|
Three Months Ended |
|
|
Six Months Ended |
|
||||||||||
|
|
June 30, |
|
|
June 30, |
|
||||||||||
|
|
2018 |
|
|
2017 |
|
|
2018 |
|
|
2017 |
|
||||
|
Proceeds from sales and maturities (fair value): |
|
|
|
|
|
|
|
|
|
|
|
|
|
|
|
|
Available-for-sale debt securities |
$ |
68,875 |
|
|
$ |
30,822 |
|
|
$ |
193,702 |
|
|
$ |
50,651 |
|
|
Equity securities |
$ |
3,082 |
|
|
$ |
54,471 |
|
|
$ |
4,127 |
|
|
$ |
56,971 |
|
|
Gross realized gains on sale of securities: |
|
|
|
|
|
|
|
|
|
|
|
|
|
|
|
|
Available-for-sale debt securities |
$ |
10 |
|
|
$ |
28 |
|
|
$ |
317 |
|
|
$ |
28 |
|
|
Equity securities |
$ |
177 |
|
|
$ |
1,785 |
|
|
$ |
301 |
|
|
$ |
1,785 |
|
|
Gross realized losses on sale of securities: |
|
|
|
|
|
|
|
|
|
|
|
|
|
|
|
|
Available-for-sale debt securities |
$ |
(42 |
) |
|
$ |
(4 |
) |
|
$ |
(3,114 |
) |
|
$ |
(40 |
) |
|
Equity securities |
$ |
— |
|
|
$ |
(99 |
) |
|
$ |
— |
|
|
$ |
(126 |
) |
The following table presents the components of net investment income, comprised primarily of interest and dividends, for the periods presented (in thousands):
|
|
Three Months Ended |
|
|
Six Months Ended |
|
||||||||||
|
|
June 30, |
|
|
June 30, |
|
||||||||||
|
|
2018 |
|
|
2017 |
|
|
2018 |
|
|
2017 |
|
||||
|
Available-for-sale debt securities |
$ |
4,095 |
|
|
$ |
3,206 |
|
|
$ |
7,795 |
|
|
$ |
5,916 |
|
|
Equity securities |
|
711 |
|
|
|
338 |
|
|
|
1,294 |
|
|
|
720 |
|
|
Available-for-sale short-term investments |
|
56 |
|
|
|
7 |
|
|
|
145 |
|
|
|
22 |
|
|
Other (1) |
|
1,605 |
|
|
|
188 |
|
|
|
2,659 |
|
|
|
332 |
|
|
Total investment income |
|
6,467 |
|
|
|
3,739 |
|
|
|
11,893 |
|
|
|
6,990 |
|
|
Less: Investment expenses (2) |
|
(681 |
) |
|
|
(516 |
) |
|
|
(1,322 |
) |
|
|
(1,063 |
) |
|
Net investment (expense) income |
$ |
5,786 |
|
|
$ |
3,223 |
|
|
$ |
10,571 |
|
|
$ |
5,927 |
|
|
(1) |
Includes interest earned on cash and cash equivalents and restricted cash and cash equivalents. Also includes investment income earned on real estate investments. |
|
(2) |
Includes bank fees, investment accounting and advisory fees, and expenses associated with real estate investments. |
11
The following table presents the portion of unrealized gains and losses related to equity securities for the periods presented (in thousands):
|
|
Three Months Ended |
|
|
Six Months Ended |
|
||||||||||
|
|
June 30, |
|
|
June 30, |
|
||||||||||
|
|
2018 |
|
|
2017 |
|
|
2018 |
|
|
2017 |
|
||||
|
Net gains and (losses) recognized during the period on equity securities |
$ |
(1,344 |
) |
|
$ |
1,686 |
|
|
$ |
(6,329 |
) |
|
$ |
1,659 |
|
|
Less: Net (gains) and losses recognized during the period on equity securities sold during the period |
|
(177 |
) |
|
|
(1,686 |
) |
|
|
(301 |
) |
|
|
(1,659 |
) |
|
Unrealized gains and (losses) recognized during the reporting period on equity securities still held at the reporting period |
$ |
(1,521 |
) |
|
$ |
— |
|
|
$ |
(6,630 |
) |
|
$ |
— |
|
|
|
|
|
|
|
|
|
|
|
|
|
|
|
|
|
|
Investment Real Estate
Investment real estate consisted of the following as of the dates presented (in thousands):
|
|
June 30, 2018 |
|
|
December 31, 2017 |
|
||
|
Income Producing: |
|
|
|
|
|
|
|
|
Investment real estate (1) |
$ |
14,619 |
|
|
$ |
6,918 |
|
|
Less: Accumulated depreciation |
|
(664 |
) |
|
|
(460 |
) |
|
|
|
13,955 |
|
|
|
6,458 |
|
|
Non-Income Producing: |
|
|
|
|
|
|
|
|
Properties under development (1) |
|
5,584 |
|
|
|
12,016 |
|
|
Investment real estate, net |
$ |
19,539 |
|
|
$ |
18,474 |
|
(1) During the six months ended June 30, 2018, the Company transferred $7.4 million from properties under development to investment real estate.
Depreciation expense related to investment real estate for the periods presented (in thousands):
|
|
Three Months Ended |
|
|
Six Months Ended |
|
||||||||||
|
|
June 30, |
|
|
June 30, |
|
||||||||||
|
|
2018 |
|
|
2017 |
|
|
2018 |
|
|
2017 |
|
||||
|
Depreciation expense on investment real estate |
$ |
101 |
|
|
$ |
44 |
|
|
$ |
204 |
|
|
$ |
89 |
|
|
|
|
|
|
|
|
|
|
|
|
|
|
|
|
|
|
12
The Company seeks to reduce their risk of loss by reinsuring certain levels of risk in various areas of exposure with other insurance enterprises or reinsurers, generally as of the beginning of the hurricane season on June 1st of each year. The Company’s current reinsurance programs consist of catastrophe excess of loss reinsurance, subject to the terms and conditions of the applicable agreements. The Company is responsible for certain retained loss amounts before reinsurance attaches and insured losses related to catastrophes and other events that exceed coverage provided by their reinsurance programs. The Company remains responsible for the settlement of insured losses irrespective of whether any of their reinsurers fail to make payments otherwise due.
Amounts recoverable from reinsurers are estimated in a manner consistent with the terms of the reinsurance contracts. Reinsurance premiums, losses and loss adjustment expenses (“LAE”) are accounted for on a basis consistent with those used in accounting for the original policies issued and the terms of the reinsurance contracts.
To reduce credit risk for amounts due from reinsurers, the Insurance Entities seek to do business with financially sound reinsurance companies and regularly evaluate the financial strength of all reinsurers used.
The following table presents ratings from rating agencies and the unsecured amounts due from the Company’s reinsurers whose aggregate balance exceeded 3% of the Company’s stockholders’ equity as of the dates presented (in thousands):
|
|
|
Ratings as of June 30, 2018 |
|
Due from as of |
|
|||||||||
|
|
|
|
|
Standard |
|
|
|
|
|
|
|
|
|
|
|
|
|
|
|
and Poor's |
|
Moody's |
|
|
|
|
|
|
|
|
|
|
|
AM Best |
|
Rating |
|
Investors |
|
June 30, |
|
|
December 31, |
|
||
|
Reinsurer |
|
Company |
|
Services |
|
Service, Inc. |
|
2018 |
|
|
2017 |
|
||
|
Lloyd's of London Syndicate |
|
A |
|
A+ |
|
n/a |
|
$ |
33,966 |
|
|
$ |
— |
|
|
Allianz Risk Transfer |
|
A+ |
|
AA- |
|
n/a |
|
|
18,406 |
|
|
|
105,573 |
|
|
Florida Hurricane Catastrophe Fund (1) |
|
n/a |
|
n/a |
|
n/a |
|
|
— |
|
|
|
52,054 |
|
|
Renaissance Reinsurance Ltd |
|
n/a |
|
n/a |
|
n/a |
|
|
— |
|
|
|
22,545 |
|
|
Total (2) |
|
|
|
|
|
|
|
$ |
52,372 |
|
|
$ |
180,172 |
|
|
(1) |
No rating is available, because the fund is not rated. |
|
(2) |
Amounts represent prepaid reinsurance premiums, reinsurance receivables, net recoverables for paid and unpaid losses, including incurred but not reported reserves, loss adjustment expenses, and offsetting reinsurance payables. |
The Company’s reinsurance arrangements had the following effect on certain items in the Condensed Consolidated Statements of Income for the periods presented (in thousands):
|
|
Three Months Ended June 30, |
|
|||||||||||||||||||||
|
|
2018 |
|
|
2017 |
|
||||||||||||||||||
|
|
|
|
|
|
|
|
|
|
Losses and Loss |
|
|
|
|
|
|
|
|
|
|
Losses and Loss |
|
||
|
|
Premiums |
|
|
Premiums |
|
|
Adjustment |
|
|
Premiums |
|
|
Premiums |
|
|
Adjustment |
|
||||||
|
|
Written |
|
|
Earned |
|
|
Expenses |
|
|
Written |
|
|
Earned |
|
|
Expenses |
|
||||||
|
Direct |
$ |
342,781 |
|
|
$ |
274,027 |
|
|
$ |
246,622 |
|
|
$ |
296,191 |
|
|
$ |
244,623 |
|
|
$ |
85,656 |
|
|
Ceded |
|
(339,251 |
) |
|
|
(81,755 |
) |
|
|
(156,780 |
) |
|
|
(311,338 |
) |
|
|
(75,614 |
) |
|
|
(5,472 |
) |
|
Net |
$ |
3,530 |
|
|
$ |
192,272 |
|
|
$ |
89,842 |
|
|
$ |
(15,147 |
) |
|
$ |
169,009 |
|
|
$ |
80,184 |
|
|
|
Six Months Ended June 30, |
|
|||||||||||||||||||||
|
|
2018 |
|
|
2017 |
|
||||||||||||||||||
|
|
|
|
|
|
|
|
|
|
Losses and Loss |
|
|
|
|
|
|
|
|
|
|
Losses and Loss |
|
||
|
|
Premiums |
|
|
Premiums |
|
|
Adjustment |
|
|
Premiums |
|
|
Premiums |
|
|
Adjustment |
|
||||||
|
|
Written |
|
|
Earned |
|
|
Expenses |
|
|
Written |
|
|
Earned |
|
|
Expenses |
|
||||||
|
Direct |
$ |
612,765 |
|
|
$ |
536,288 |
|
|
$ |
323,261 |
|
|
$ |
541,606 |
|
|
$ |
480,998 |
|
|
$ |
156,439 |
|
|
Ceded |
|
(339,251 |
) |
|
|
(161,439 |
) |
|
|
(157,493 |
) |
|
|
(311,524 |
) |
|
|
(150,430 |
) |
|
|
(5,685 |
) |
|
Net |
$ |
273,514 |
|
|
$ |
374,849 |
|
|
$ |
165,768 |
|
|
$ |
230,082 |
|
|
$ |
330,568 |
|
|
$ |
150,754 |
|
13
The following prepaid reinsurance premiums and reinsurance recoverable and receivable are reflected in the Condensed Consolidated Balance Sheets as of the dates presented (in thousands):
|
|
June 30, |
|
|
December 31, |
|
||
|
|
2018 |
|
|
2017 |
|
||
|
Prepaid reinsurance premiums |
$ |
310,618 |
|
|
$ |
132,806 |
|
|
Reinsurance recoverable on paid losses and LAE |
$ |
21,002 |
|
|
$ |
— |
|
|
Reinsurance recoverable on unpaid losses and LAE |
|
96,849 |
|
|
|
182,405 |
|
|
Reinsurance receivable, net |
|
1,402 |
|
|
|
— |
|
|
Reinsurance recoverable and receivable |
$ |
119,253 |
|
|
$ |
182,405 |
|
14
Deferred Policy Acquisition Costs
The Company defers certain costs relating to written premium, called Deferred Policy Acquisition Costs (“DPAC”). DPAC is amortized over the effective period of the related insurance policies.
The following table presents the beginning and ending balances and the changes in DPAC for the periods presented (in thousands):
|
|
Three Months Ended |
|
|
Six Months Ended |
|
||||||||||
|
|
June 30, |
|
|
June 30, |
|
||||||||||
|
|
2018 |
|
|
2017 |
|
|
2018 |
|
|
2017 |
|
||||
|
DPAC, beginning of period |
$ |
78,007 |
|
|
$ |
66,524 |
|
|
$ |
73,059 |
|
|
$ |
64,912 |
|
|
Capitalized Costs |
|
50,430 |
|
|
|
39,898 |
|
|
|
92,369 |
|
|
|
73,654 |
|
|
Amortization of DPAC |
|
(39,681 |
) |
|
|
(32,831 |
) |
|
|
(76,672 |
) |
|
|
(64,975 |
) |
|
DPAC, end of period |
$ |
88,756 |
|
|
$ |
73,591 |
|
|
$ |
88,756 |
|
|
$ |
73,591 |
|
Regulatory Requirements and Restrictions
The Insurance Entities are subject to regulations and standards of the Florida Office of Insurance Regulation (“FLOIR”). UPCIC also is subject to regulations and standards of regulatory authorities in other states where it is licensed, although as a Florida-domiciled insurer, its principal regulatory authority is the FLOIR. These standards require the Insurance Entities to maintain specified levels of statutory capital and restrict the timing and amount of dividends and other distributions that may be paid by the Insurance Entities to the parent company. Except in the case of extraordinary dividends, these standards generally permit dividends to be paid from statutory unassigned surplus of the regulated subsidiary and are limited based on the regulated subsidiary’s level of statutory net income and statutory capital and surplus. The maximum dividend that may be paid by UPCIC and APPCIC to their immediate parent company, Universal Insurance Holding Company of Florida (“UVECF”), without prior regulatory approval is limited by the provisions of the Florida Insurance Code. These dividends are referred to as “ordinary dividends.” However, if the dividend, together with other dividends paid within the preceding twelve months, exceeds this statutory limit or is paid from sources other than earned surplus, the entire dividend is generally considered an “extraordinary dividend” and must receive prior regulatory approval.
In accordance with Florida Insurance Code, and based on the calculations performed by the Company as of December 31, 2017, UPCIC has the capacity to pay ordinary dividends of $36.2 million during 2018. APPCIC does not currently meet the earnings or surplus regulatory requirements to pay ordinary dividends during 2018. For the six months ended June 30, 2018, no dividends were paid from UPCIC or APPCIC to UVECF.
The Florida Insurance Code requires insurance companies to maintain capitalization equivalent to the greater of ten percent of the insurer’s total liabilities but not less than $10.0 million. The following table presents the amount of capital and surplus calculated in accordance with statutory accounting principles, which differ from U.S. GAAP, and an amount representing ten percent of total liabilities for both UPCIC and APPCIC as of the dates presented (in thousands):
|
|
June 30, |
|
|
December 31, |
|
||
|
|
2018 |
|
|
2017 |
|
||
|
Ten percent of total liabilities |
|
|
|
|
|
|
|
|
UPCIC |
$ |
86,454 |
|
|
$ |
72,633 |
|
|
APPCIC |
$ |
624 |
|
|
$ |
572 |
|
|
Statutory capital and surplus |
|
|
|
|
|
|
|
|
UPCIC |
$ |
340,933 |
|
|
$ |
307,686 |
|
|
APPCIC |
$ |
16,278 |
|
|
$ |
16,633 |
|
As of the dates in the table above, both UPCIC and APPCIC exceeded the minimum statutory capitalization requirement. UPCIC also met the capitalization requirements of the other states in which it is licensed as of June 30, 2018. UPCIC and APPCIC are also required to adhere to prescribed premium-to-capital surplus ratios and have met those requirements at such dates.
The following table summarizes combined net income for UPCIC and APPCIC determined in accordance with statutory accounting practices for the periods presented (in thousands):
|
|
Three Months Ended |
|
|
Six Months Ended |
|
||||||||||
|
|
June 30, |
|
|
June 30, |
|
||||||||||
|
|
2018 |
|
|
2017 |
|
|
2018 |
|
|
2017 |
|
||||
|
Combined net income |
$ |
29,244 |
|
|
$ |
31,433 |
|
|
$ |
43,722 |
|
|
$ |
43,194 |
|
15
The Insurance Entities are required by various state laws and regulations to maintain certain assets in depository accounts. The following table represents assets held by insurance regulators as of the dates presented (in thousands):
|
|
June 30, |
|
|
December 31, |
|
||
|
|
2018 |
|
|
2017 |
|
||
|
Restricted cash and cash equivalents |
$ |
2,635 |
|
|
$ |
2,635 |
|
|
Investments |
$ |
3,908 |
|
|
$ |
3,910 |
|
16
6. Liability for Unpaid Losses and Loss Adjustment Expenses
Set forth in the following table is the change in liability for unpaid losses and LAE for the periods presented (in thousands):
|
|
Three Months Ended |
|
|
Six Months Ended |
|
||||||||||
|
|
June 30, |
|
|
June 30, |
|
||||||||||
|
|
2018 |
|
|
2017 |
|
|
2018 |
|
|
2017 |
|
||||
|
Balance at beginning of period |
$ |
129,637 |
|
|
$ |
31,463 |
|
|
$ |
248,425 |
|
|
$ |
58,494 |
|
|
Less: Reinsurance (recoverable)/payable |
|
(70,351 |
) |
|
|
2,353 |
|
|
|
(182,405 |
) |
|
|
(106 |
) |
|
Net balance at beginning of period |
|
59,286 |
|
|
|
33,816 |
|
|
|
66,020 |
|
|
|
58,388 |
|
|
Incurred (recovered) related to: |
|
|
|
|
|
|
|
|
|
|
|
|
|
|
|
|
Current year |
|
87,532 |
|
|
|
79,075 |
|
|
|
163,502 |
|
|
|
149,549 |
|
|
Prior years |
|
2,310 |
|
|
|
1,109 |
|
|
|
2,266 |
|
|
|
1,205 |
|
|
Total incurred |
|
89,842 |
|
|
|
80,184 |
|
|
|
165,768 |
|
|
|
150,754 |
|
|
Paid related to: |
|
|
|
|
|
|
|
|
|
|
|
|
|
|
|
|
Current year |
|
50,572 |
|
|
|
62,141 |
|
|
|
67,979 |
|
|
|
85,031 |
|
|
Prior years |
|
43,373 |
|
|
|
30,607 |
|
|
|
108,626 |
|
|
|
102,859 |
|
|
Total paid |
|
93,945 |
|
|
|
92,748 |
|
|
|
176,605 |
|
|
|
187,890 |
|
|
Net balance at end of period |
|
55,183 |
|
|
|
21,252 |
|
|
|
55,183 |
|
|
|
21,252 |
|
|
Plus: Reinsurance recoverable/(payable) |
|
96,733 |
|
|
|
1,393 |
|
|
|
96,733 |
|
|
|
1,393 |
|
|
Balance at end of period |
$ |
151,916 |
|
|
$ |
22,645 |
|
|
$ |
151,916 |
|
|
$ |
22,645 |
|
The Company’s losses incurred for the three and six months ended June 20, 2018 include prior year net reserve development of $2.3 million which was principally caused by loss reserve development of $5.3 million on a direct basis ($2.6 million on a net basis) for the fourth quarter 2016 storm, Hurricane Matthew. Reserve strengthening on Hurricane Matthew is based on our revised estimate to settle the remaining 78 open claims. The three and six months ended June 30, 2017 included prior year loss reserve development of $6.6 million on a direct basis ($1.1 million on a net basis), also reflecting strengthening of reserves for the fourth quarter 2016 storm, Hurricane Matthew.
Also, during the second quarter in 2018, the Company increased its estimate of ultimate losses on the third quarter 2017 storm Hurricane Irma to $603.5 million for both Insurance Entities from $447.4 million recorded in the first quarter in 2018. The prior year development of $156.1 million in gross losses resulted in a net retention benefit of $0.3 million after cessions to the Company’s reinsurers. The increase in the ultimate loss and LAE for Hurricane Irma was the result of continuation of new reported claims and the aggressive nature of plaintiff attorneys on claims in Florida.
17
Long-term debt consists of the following as of the dates presented (in thousands):
|
|
June 30, |
|
|
December 31, |
|
||
|
|
2018 |
|
|
2017 |
|
||
|
Surplus note |
$ |
12,132 |
|
|
$ |
12,868 |
|
In 2006, UPCIC entered into a $25.0 million surplus note with the State Board of Administration of Florida (the “SBA”) under Florida’s Insurance Capital Build-Up Incentive Program (the “ICBUI”). The surplus note has a twenty-year term and accrues interest, adjusted quarterly based on the 10-year Constant Maturity Treasury Index.
UPCIC was in compliance with the terms of the surplus note as of June 30, 2018.
18
Common Stock
The following table summarizes the activity relating to shares of the Company’s common stock during the six months ended June 30, 2018 (in thousands):
|
|
Issued |
|
|
Treasury |
|
|
Outstanding |
|
|||
|
|
Shares |
|
|
Shares |
|
|
Shares |
|
|||
|
Balance, as of December 31, 2017 |
|
45,778 |
|
|
|
(11,043 |
) |
|
|
34,735 |
|
|
Shares repurchased |
|
— |
|
|
|
(342 |
) |
|
|
(342 |
) |
|
Vesting of performance share units |
|
127 |
|
|
|
— |
|
|
|
127 |
|
|
Stock option exercises |
|
1,156 |
|
|
|
— |
|
|
|
1,156 |
|
|
Restricted stock grants |
|
50 |
|
|
|
— |
|
|
|
50 |
|
|
Shares acquired through cashless exercise (1) |
|
— |
|
|
|
(854 |
) |
|
|
(854 |
) |
|
Shares cancelled |
|
(854 |
) |
|
|
854 |
|
|
|
— |
|
|
Balance, as of June 30, 2018 |
|
46,257 |
|
|
|
(11,385 |
) |
|
|
34,872 |
|
|
(1) |
All shares acquired represent shares tendered to cover the strike price for options and tax withholdings on the intrinsic value of options exercised or performance share units vested. These shares have been cancelled by the Company. |
In September 2017, UVE’s Board of Directors authorized a share repurchase program under which UVE may repurchase in the open market in compliance with Exchange Act Rule 10b-18, up to $20 million of the Company’s outstanding shares of common stock through December 31, 2018. During the six months ended June 30, 2018, UVE repurchased 342,749 shares, at an aggregate price of approximately $11.1 million, pursuant to such repurchase program.
Dividends
The following table summarizes the dividends declared and paid by the Company:
|
|
|
Dividend |
|
Shareholders |
|
Dividend |
|
Cash Dividend |
|
|
|
2018 |
|
Declared Date |
|
Record Date |
|
Payable Date |
|
Per Share Amount |
|
|
|
First Quarter |
|
January 22, 2018 |
|
February 28, 2018 |
|
March 12, 2018 |
|
$ |
0.14 |
|
|
Second Quarter |
|
April 12, 2018 |
|
April 27, 2018 |
|
May 4, 2018 |
|
$ |
0.14 |
|
|
Third Quarter |
|
May 29, 2018 |
|
July 2, 2018 |
|
July 16, 2018 |
|
$ |
0.16 |
|
19
During the three months ended June 30, 2018 and 2017, the Company recorded approximately $15.2 million and $18.5 million of income tax expense, respectively. The effective tax rate (“ETR”) for the three months ended June 30, 2018 was 24.8% compared to a 38.7% ETR for the same period in 2017.
During the six months ended June 30, 2018 and 2017, the Company recorded approximately $26.8 million and $34.7 million of income tax expense, respectively. The ETR for the six months ended June 30, 2018 was 23.7% compared to a 36.4% ETR for the same period in 2017.
In arriving at these rates, the Company considers a variety of factors including the forecasted full year pre-tax results, the U.S. federal tax rate, expected non-deductible expenses, and estimated state income taxes. The Company’s final ETR for the full year will be dependent on the level of pre-tax income, discrete items, the apportionment of taxable income among state tax jurisdictions and the extent of non-deductible expenses in relation to pre-tax income.
Income tax expense for the three months ended June 30, 2018 included a net credit for discrete items of $0.6 million primarily driven by the excess tax benefits resulting from stock-based compensation awards that were exercised during the second quarter of 2018, benefitting the current quarter’s ETR. For the second quarter of 2017, there were no discrete items.
Income tax expense for the six months ended June 30, 2018 included a net credit of $2.3 million primarily driven by the excess tax benefits resulting from stock-based compensation awards that had vested and/or were exercised during that period. The prior year’s discrete items for the six months ended June 30, 2017 were $0.8 million for excess tax benefits resulting from stock-based compensation awards that had vested and/or were exercised during that period, and a credit to income tax expense of $1.2 million resulting from anticipated recoveries of income taxes paid for the 2014-2015 tax years.
The Company's income tax provision for the current reporting period reflects an estimated annual ETR of 25.7%, calculated before the impact of discrete items. The statutory tax rate consists of a federal income tax rate of 21% and a state income tax rate, net of federal benefit, of 3.7%. The difference in the statutory tax rate, 24.7%, and the annual ETR, 25.7%, is largely attributable to the new tax law’s impact on Internal Revenue Code Section 162(m). The effect of reporting discrete items in the three months and six months ended June 30, 2018 amounts to an additional decrease to the annual ETR rate of 1.0% and 2.0%, respectively, resulting in a total estimated ETR of 24.8% and 23.7%, respectively.
The Company files its tax returns as prescribed by the tax laws of the jurisdictions in which it operates. The Company’s 2014 through 2016 tax years are still subject to examination by the Internal Revenue Service and various tax years remain open to examination in certain state jurisdictions. In February 2018, the Company received notification from the Internal Revenue Service with respect to an examination of the 2015 tax return. The Company is anticipating no adjustments from the examination which is expected to conclude in the third quarter of 2018.
20
Basic earnings per share (“EPS”) is based on the weighted average number of common shares outstanding for the period, excluding any dilutive common share equivalents. Diluted EPS reflects the potential dilution resulting from the exercises of stock options, vesting of restricted stock, vesting of performance share units, and conversion of preferred stock.
The following table reconciles the numerator (i.e., income) and denominator (i.e., shares) of the basic and diluted earnings per share computations for the periods presented (in thousands, except per share data):
|
|
Three Months Ended |
|
|
Six Months Ended |
|
||||||||||
|
|
June 30, |
|
|
June 30, |
|
||||||||||
|
|
2018 |
|
|
2017 |
|
|
2018 |
|
|
2017 |
|
||||
|
Numerator for EPS: |
|
|
|
|
|
|
|
|
|
|
|
|
|
|
|
|
Net income |
$ |
46,084 |
|
|
$ |
29,376 |
|
|
$ |
86,139 |
|
|
$ |
60,575 |
|
|
Less: Preferred stock dividends |
|
(2 |
) |
|
|
(2 |
) |
|
|
(5 |
) |
|
|
(5 |
) |
|
Income available to common stockholders |
$ |
46,082 |
|
|
$ |
29,374 |
|
|
$ |
86,134 |
|
|
$ |
60,570 |
|
|
Denominator for EPS: |
|
|
|
|
|
|
|
|
|
|
|
|
|
|
|
|
Weighted average common shares outstanding |
|
34,909 |
|
|
|
34,959 |
|
|
|
34,874 |
|
|
|
35,049 |
|
|
Plus: Assumed conversion of share-based compensation (1) |
|
655 |
|
|
|
974 |
|
|
|
737 |
|
|
|
987 |
|
|
Assumed conversion of preferred stock |
|
25 |
|
|
|
25 |
|
|
|
25 |
|
|
|
25 |
|
|
Weighted average diluted common shares outstanding |
|
35,589 |
|
|
|
35,958 |
|
|
|
35,636 |
|
|
|
36,061 |
|
|
Basic earnings per common share |
$ |
1.32 |
|
|
$ |
0.84 |
|
|
$ |
2.47 |
|
|
$ |
1.73 |
|
|
Diluted earnings per common share |
$ |
1.29 |
|
|
$ |
0.82 |
|
|
$ |
2.42 |
|
|
$ |
1.68 |
|
|
(1) |
Represents the dilutive effect of unvested restricted stock, unvested performance share units and unexercised stock options. |
21
11. Other Comprehensive Income (Loss)
The following table provides the components of other comprehensive income (loss) on a pre-tax and after-tax basis for the periods presented (in thousands):
|
|
Three Months Ended June 30, |
|
|||||||||||||||||||||
|
|
2018 |
|
|
2017 |
|
||||||||||||||||||
|
|
Pre-tax |
|
|
Tax |
|
|
After-tax |
|
|
Pre-tax |
|
|
Tax |
|
|
After-tax |
|
||||||
|
Net changes related to available-for-sale securities: |
|
|
|
|
|
|
|
|
|
|
|
|
|
|
|
|
|
|
|
|
|
|
|
|
Unrealized holding gains (losses) arising during the period |
$ |
(2,488 |
) |
|
$ |
(618 |
) |
|
$ |
(1,870 |
) |
|
$ |
4,116 |
|
|
$ |
1,574 |
|
|
$ |
2,542 |
|
|
Less: Reclassification adjustment for (gains) losses realized in net income |
|
32 |
|
|
|
11 |
|
|
|
21 |
|
|
|
(1,710 |
) |
|
|
(654 |
) |
|
|
(1,056 |
) |
|
Other comprehensive income (loss) |
|
(2,456 |
) |
|
|
(607 |
) |
|
|
(1,849 |
) |
|
|
2,406 |
|
|
|
920 |
|
|
|
1,486 |
|
|
Reclassification adjustments to retained earnings (1) |
|
— |
|
|
|
— |
|
|
|
— |
|
|
|
— |
|
|
|
— |
|
|
|
— |
|
|
Change in accumulated other comprehensive income (loss) |
$ |
(2,456 |
) |
|
$ |
(607 |
) |
|
$ |
(1,849 |
) |
|
$ |
2,406 |
|
|
$ |
920 |
|
|
$ |
1,486 |
|
|
|
|
|
|
|
|
|
|
|
|
|
|
|
|
|
|
|
|
|
|
|
|
|
|
|
|
Six Months Ended June 30, |
|
|||||||||||||||||||||
|
|
2018 |
|
|
2017 |
|
||||||||||||||||||
|
|
Pre-tax |
|
|
Tax |
|
|
After-tax |
|
|
Pre-tax |
|
|
Tax |
|
|
After-tax |
|
||||||
|
Net changes related to available-for-sale securities: |
|
|
|
|
|
|
|
|
|
|
|
|
|
|
|
|
|
|
|
|
|
|
|
|
Unrealized holding gains (losses) arising during the period |
$ |
(10,522 |
) |
|
$ |
(2,507 |
) |
|
$ |
(8,015 |
) |
|
$ |
8,041 |
|
|
$ |
3,074 |
|
|
$ |
4,967 |
|
|
Less: Reclassification adjustment for (gains) losses realized in net income |
|
2,797 |
|
|
|
681 |
|
|
|
2,116 |
|
|
|
(1,647 |
) |
|
|
(630 |
) |
|
|
(1,017 |
) |
|
Other comprehensive income (loss) |
|
(7,725 |
) |
|
|
(1,826 |
) |
|
|
(5,899 |
) |
|
|
6,394 |
|
|
|
2,444 |
|
|
|
3,950 |
|
|
Reclassification adjustments to retained earnings (1) |
|
5,830 |
|
|
|
2,811 |
|
|
|
3,019 |
|
|
|
— |
|
|
|
— |
|
|
|
— |
|
|
Change in accumulated other comprehensive income (loss) |
$ |
(1,895 |
) |
|
$ |
985 |
|
|
$ |
(2,880 |
) |
|
$ |
6,394 |
|
|
$ |
2,444 |
|
|
$ |
3,950 |
|
|
|
(1) |
This amount represents reclassifications to retained earnings associated with the disproportional income tax effects of the Tax Act on items within AOCI and Unrealized Losses in AOCI relating to Available for Sale equity security investments. See “—Note 2 — Significant Accounting Policies – Recently Adopted Accounting Pronouncements” for more information. |
The following table provides the reclassifications adjustment for gains (losses) out of accumulated other comprehensive income for the periods presented (in thousands):
|
|
|
|
|
|
|
|||||||||||||
|
|
|
Amount Reclassified from Accumulated |
|
|
|
|||||||||||||
|
|
|
Other Comprehensive Income (Loss) |
|
|
|
|||||||||||||
|
Details about Accumulated Other Comprehensive |
|
Three Months Ended June 30, |
|
|
Six Months Ended June 30, |
|
|
Affected Line Item in the Statement |
||||||||||
|
Income (Loss) Components |
|
2018 |
|
|
2017 |
|
|
2018 |
|
|
2017 |
|
|
Where Net Income is Presented |
||||
|
Unrealized gains (losses) on available-for-sale debt securities |
|
|
|
|
|
|
|
|
|
|
|
|
|
|
|
|
|
|
|
|
|
$ |
(32 |
) |
|
$ |
1,710 |
|
|
$ |
(2,797 |
) |
|
$ |
1,647 |
|
|
Net realized gains (losses) sale of securities |
|
|
|
|
11 |
|
|
|
(654 |
) |
|
|
681 |
|
|
|
(630 |
) |
|
Income taxes |
|
Total reclassification for the period |
|
$ |
(21 |
) |
|
$ |
1,056 |
|
|
$ |
(2,116 |
) |
|
$ |
1,017 |
|
|
Net of tax |
22
12. Commitments and Contingencies
Litigation
Lawsuits are filed against the Company from time to time. Many of these lawsuits involve claims under policies that we underwrite and reserve for as an insurer. We are also involved in various other legal proceedings and litigation unrelated to claims under our policies that arise in the ordinary course of business operations. Management believes that any liabilities that may arise as a result of these legal matters will not have a material adverse effect on our financial condition or results of operations. The Company contests liability and/or the amount of damages as appropriate in each pending matter.
In accordance with applicable accounting guidance, the Company establishes an accrued liability for legal matters when those matters present loss contingencies that are both probable and estimable.
Legal proceedings are subject to many uncertain factors that generally cannot be predicted with assurance, and the Company may be exposed to losses in excess of any amounts accrued. The Company currently estimates that the reasonably possible losses for legal proceedings, whether in excess of a related accrued liability or where there is no accrued liability, and for which the Company is able to estimate a possible loss, are immaterial. This represents management’s estimate of possible loss with respect to these matters and is based on currently available information. These estimates of possible loss do not represent our maximum loss exposure, and actual results may vary significantly from current estimates.
23
U.S. GAAP defines fair value as the price that would be received to sell an asset or paid to transfer a liability in an orderly transaction between market participants as of the measurement date. U.S. GAAP describes three approaches to measuring the fair value of assets and liabilities: the market approach, the income approach and the cost approach. Each approach includes multiple valuation techniques. U.S. GAAP does not prescribe which valuation technique should be used when measuring fair value, but does establish a fair value hierarchy that prioritizes the inputs used in applying the various techniques. Inputs broadly refer to the assumptions that market participants use to make pricing decisions, including assumptions about risk. Level 1 inputs are given the highest priority in the hierarchy while Level 3 inputs are given the lowest priority. Assets and liabilities carried at fair value are classified in one of the following three categories based on the nature of the inputs to the valuation technique used:
|
• |
Level 1 — Observable inputs that reflect unadjusted quoted prices for identical assets or liabilities in active markets as of the reporting date. Active markets are those in which transactions for the asset or liability occur in sufficient frequency and volume to provide pricing information on an ongoing basis. |
|
• |
Level 2 — Observable market-based inputs or unobservable inputs that are corroborated by market data. |
|
• |
Level 3 — Unobservable inputs that are not corroborated by market data. These inputs reflect management’s best estimate of fair value using its own assumptions about the assumptions a market participant would use in pricing the asset or liability. |
Summary of significant valuation techniques for assets measured at fair value on a recurring basis
Level 1
Common stock: Comprise actively traded, exchange-listed U.S. and international equity securities. Valuation is based on unadjusted quoted prices for identical assets in active markets that the Company can access.
Mutual funds: Comprise actively traded funds. Valuation is based on daily quoted net asset values for identical assets in active markets that the Company can access.
Level 2
U.S. government obligations and agencies: Comprise U.S. Treasury Bills or Notes or U.S. Treasury Inflation Protected Securities. The primary inputs to the valuation include quoted prices for identical assets in inactive markets or similar assets in active or inactive markets, contractual cash flows, benchmark yields and credit spreads.
Corporate bonds: Comprise investment-grade fixed income securities. The primary inputs to the valuation include quoted prices for identical assets in inactive markets or similar assets in active or inactive markets, contractual cash flows, benchmark yields and credit spreads.
Mortgage-backed and asset-backed securities: Comprise securities that are collateralized by mortgage obligations and other assets. The primary inputs to the valuation include quoted prices for identical assets in inactive markets or similar assets in active or inactive markets, contractual cash flows, benchmark yields, collateral performance and credit spreads.
Municipal bonds: Comprise fixed income securities issued by a state, municipality or county. The primary inputs to the valuation include quoted prices for identical assets in inactive markets or similar assets in active or inactive markets, contractual cash flows, benchmark yields and credit spreads.
Redeemable preferred stock: Comprise preferred stock securities that are redeemable. The primary inputs to the valuation include quoted prices for identical or similar assets in markets that are not active.
Short-term investments: Comprise investment securities subject to re-measurement with original maturities within one year but more than three months. The primary inputs to the valuation include quoted prices for identical or similar assets in markets that are not active.
As required by U.S. GAAP, assets and liabilities are classified in their entirety based on the lowest level of input that is significant to the fair value measurement. The Company’s assessment of the significance of a particular input to the fair value measurement requires judgment, and may affect the placement of the asset or liability within the fair value hierarchy levels.
24
The following tables set forth by level within the fair value hierarchy the Company’s assets that were measured at fair value on a recurring basis as of the dates presented (in thousands):
|
|
Fair Value Measurements |
|
|||||||||||||
|
|
June 30, 2018 |
|
|||||||||||||
|
|
Level 1 |
|
|
Level 2 |
|
|
Level 3 |
|
|
Total |
|
||||
|
Available-For-Sale Debt Securities: |
|
|
|
|
|
|
|
|
|
|
|
|
|
|
|
|
Fixed Maturities: |
|
|
|
|
|
|
|
|
|
|
|
|
|
|
|
|
U.S. government obligations and agencies |
$ |
— |
|
|
$ |
57,712 |
|
|
$ |
— |
|
|
$ |
57,712 |
|
|
Corporate bonds |
|
— |
|
|
|
333,964 |
|
|
|
— |
|
|
|
333,964 |
|
|
Mortgage-backed and asset-backed securities |
|
— |
|
|
|
237,432 |
|
|
|
— |
|
|
|
237,432 |
|
|
Municipal bonds |
|
— |
|
|
|
15,717 |
|
|
|
— |
|
|
|
15,717 |
|
|
Redeemable preferred stock |
|
— |
|
|
|
11,937 |
|
|
|
— |
|
|
|
11,937 |
|
|
Equity Securities: |
|
|
|
|
|
|
|
|
|
|
|
|
|
|
|
|
Common stock |
|
22,320 |
|
|
|
— |
|
|
|
— |
|
|
|
22,320 |
|
|
Mutual funds |
|
48,546 |
|
|
|
— |
|
|
|
— |
|
|
|
48,546 |
|
|
Total assets accounted for at fair value |
$ |
70,866 |
|
|
$ |
656,762 |
|
|
$ |
— |
|
|
$ |
727,628 |
|
|
|
Fair Value Measurements |
|
|||||||||||||
|
|
December 31, 2017 |
|
|||||||||||||
|
|
Level 1 |
|
|
Level 2 |
|
|
Level 3 |
|
|
Total |
|
||||
|
Available-For-Sale Debt Securities: |
|
|
|
|
|
|
|
|
|
|
|
|
|
|
|
|
Fixed Maturities: |
|
|
|
|
|
|
|
|
|
|
|
|
|
|
|
|
U.S. government obligations and agencies |
$ |
— |
|
|
$ |
59,604 |
|
|
$ |
— |
|
|
$ |
59,604 |
|
|
Corporate bonds |
|
— |
|
|
|
227,504 |
|
|
|
— |
|
|
|
227,504 |
|
|
Mortgage-backed and asset-backed securities |
|
— |
|
|
|
219,452 |
|
|
|
— |
|
|
|
219,452 |
|
|
Municipal bonds |
|
— |
|
|
|
120,295 |
|
|
|
— |
|
|
|
120,295 |
|
|
Redeemable preferred stock |
|
— |
|
|
|
12,479 |
|
|
|
— |
|
|
|
12,479 |
|
|
Equity Securities: |
|
|
|
|
|
|
|
|
|
|
|
|
|
|
|
|
Common stock |
|
18,811 |
|
|
|
— |
|
|
|
— |
|
|
|
18,811 |
|
|
Mutual funds |
|
43,404 |
|
|
|
— |
|
|
|
— |
|
|
|
43,404 |
|
|
Available-for-sale short-term investments |
|
— |
|
|
|
10,000 |
|
|
|
— |
|
|
|
10,000 |
|
|
Total assets accounted for at fair value |
$ |
62,215 |
|
|
$ |
649,334 |
|
|
$ |
— |
|
|
$ |
711,549 |
|
The Company utilizes third-party independent pricing services that provide a price quote for each available-for-sale debt security, equity security and available-for-sale short-term investment. Management reviews the methodology used by the pricing services. If management believes that the price used by the pricing service does not reflect an orderly transaction between participants, management will use an alternative valuation methodology. There were no adjustments made by the Company to the prices obtained from the independent pricing source for any available-for-sale debt securities, equity securities or available-for-sale short-term investments included in the tables above.
The following table summarizes the carrying value and estimated fair values of the Company’s financial instruments that are not carried at fair value as of the dates presented (in thousands):
|
|
June 30, 2018 |
|
|
December 31, 2017 |
|
||||||||||
|
|
|
|
|
|
(Level 3) |
|
|
|
|
|
|
(Level 3) |
|
||
|
|
|
|
|
|
Estimated Fair |
|
|
|
|
|
|
Estimated Fair |
|
||
|
|
Carrying Value |
|
|
Value |
|
|
Carrying Value |
|
|
Value |
|
||||
|
Liabilities (debt): |
|
|
|
|
|
|
|
|
|
|
|
|
|
|
|
|
Surplus note |
$ |
12,132 |
|
|
$ |
10,823 |
|
|
$ |
12,868 |
|
|
$ |
11,630 |
|
Level 3
Long-term debt: The fair value of the surplus note was determined by management from the expected cash flows discounted using the interest rate quoted by the holder. The SBA is the holder of the surplus note and the quoted interest rate is below prevailing rates quoted by private lending institutions. However, as the Company’s use of funds from the surplus note is limited by the terms of the agreement, the Company has determined the interest rate quoted by the SBA to be appropriate for purposes of establishing the fair value of the note.
25
The Company performed an evaluation of subsequent events through the date the Financial Statements were issued and determined there were no recognized or unrecognized subsequent events that would require an adjustment or additional disclosure in the Financial Statements as of June 30, 2018.
26
Item 2. Management’s Discussion and Analysis of Financial Condition and Results of Operations
Unless the context otherwise requires, all references to “we,” “us,” “our,” and “Company” refer to Universal Insurance Holdings, Inc. and its wholly-owned subsidiaries. You should read the following discussion together with our condensed consolidated financial statements (“Financial Statements”) and the related notes thereto included in Part I, Item 1 “Financial Statements.” Operating results for any one quarter are not necessarily indicative of results to be expected for any other quarter or for the year.
Forward-Looking Statements
In addition to historical information, the following discussion may contain “forward-looking statements” within the meaning of Section 27A of the Securities Act of 1933 and Section 21E of the Securities Exchange Act. Forward-looking statements are based on various factors and assumptions that include known and unknown risks and uncertainties, some of which are beyond our control and cannot be predicted or quantified. Certain statements made in this report reflect management’s expectations regarding future events, and the words “expect,” “estimate,” “anticipate,” “believe,” “intend,” “project,” “plan” and similar expressions and variations thereof, speak only as of the date the statement was made and are intended to identify forward-looking statements. Such statements may include, but not be limited to, projections of revenues, income or loss, expenses, plans, as well as assumptions relating to the foregoing. Future results could differ materially from those in the following discussion and those described in forward-looking statements as a result of the risks set forth below which are a summary of those set forth in our Annual Report on Form 10-K for the year ended December 31, 2017.
Risks Relating to our Business
|
|
• |
As a property and casualty insurer, we may face significant losses from catastrophes and severe weather events, |
|
|
• |
Actual claims incurred may exceed current reserves established for claims and may adversely affect our operating results and financial condition, |
|
|
• |
Our success depends in part on our ability to accurately and adequately price the risks we underwrite, |
|
|
• |
Unanticipated increases in the severity or frequency of claims may adversely affect our profitability and financial condition, |
|
|
• |
The failure of the risk mitigation strategies we utilize could have a material adverse effect on our financial condition or results of operations, |
|
|
• |
Because we rely on independent insurance agents, the loss of these independent agent relationships and the business they control or our ability to attract new independent agents could have an adverse impact on our business, |
|
|
• |
The inherent uncertainty of models and our reliance on such models as a tool to evaluate risk may have an adverse effect on our financial results, |
|
|
• |
Reinsurance may be unavailable in the future at current levels and prices, which may limit our ability to write new business or to adequately mitigate our exposure to loss, |
|
|
• |
Reinsurance subjects us to the credit risk of our reinsurers, which could have a material adverse effect on our operating results and financial condition, |
|
|
• |
Our financial condition and operating results and the financial condition and operating results of our Insurance Entities (as defined below) may be adversely affected by the cyclical nature of the property and casualty business, |
|
|
• |
Because we conduct the substantial majority of our business in Florida, our financial results depend on the regulatory, economic and weather conditions in Florida, |
|
|
• |
Changing climate conditions may adversely affect our financial condition, profitability or cash flows, |
|
|
• |
We have entered and in the future, may enter new markets, but there can be no assurance that our diversification and growth strategy will be effective, |
|
|
• |
Loss of key executives or our inability to otherwise attract and retain talent could affect our operations, |
|
|
• |
We could be adversely affected if our controls designed to ensure compliance with guidelines, policies and legal regulatory standards are not effective, |
|
|
• |
The failure of our claims department to effectively manage claims could adversely affect our insurance business, financial results and capital requirements, |
|
|
• |
Litigation or regulatory actions could have a material adverse impact on us, |
|
|
• |
Our future results are dependent in part on our ability to successfully operate in a highly competitive insurance industry, |
|
|
• |
A downgrade in our Financial Stability Rating® may have an adverse effect on our competitive position, the marketability of our product offerings, and our liquidity, operating results and financial condition, |
27
|
|
• |
Breaches of our information systems or denial of service on our website could have an adverse impact on our business and reputation, |
|
|
• |
We may not be able to effectively implement or adapt to changes in technology, and |
|
|
• |
Lack of effectiveness of exclusions and other loss limitation methods in the insurance policies we write could have a material adverse effect on our financial condition or our results of operations. |
Risks Relating to Investments
|
|
• |
We are subject to market risk, which could adversely affect investment income, and |
|
|
• |
Our overall financial performance is dependent in part on the returns on our investment portfolio, which could have a material adverse effect on our financial condition or results of operations or cause such results to be volatile. |
Risks Relating to the Insurance Industry
|
|
• |
We are subject to extensive regulation and potential further restrictive regulation may increase our operating costs and limit our growth and profitability, |
|
|
• |
UVE is a holding company and, consequently, its cash flow is dependent on dividends and other permissible payments from its subsidiaries, |
|
|
• |
Regulations limiting rate changes and requiring us to participate in loss sharing or assessments may decrease our profitability, |
|
|
• |
The amount of statutory capital and surplus that each of the Insurance Entities has and the amount of statutory capital and surplus it must hold can vary and are sensitive to a number of factors outside of our control, including market conditions and the regulatory environment and rules, and |
|
|
• |
Our Insurance Entities are subject to examination and actions by state insurance departments. |
Risks Relating to Debt Obligations
|
|
• |
Adverse capital and credit market conditions may significantly affect our ability to meet liquidity needs or our ability to obtain credit on acceptable terms. |
Risks Relating to Ownership of Our Common Stock
|
|
• |
The price of our common stock may fluctuate significantly, and you could lose all or part of your investment, |
|
|
• |
Any issuance of preferred stock could make it difficult for another company to acquire us or could otherwise adversely affect holders of our common stock, which could depress the price of our common stock, and |
|
|
• |
Future sales of our common stock may depress our stock price. |
The following Management’s Discussion and Analysis of Financial Condition and Results of Operations (“MD&A”) is intended to help the reader understand the results of operations and financial condition of Universal Insurance Holdings, Inc. and its wholly-owned consolidated subsidiaries. MD&A is provided as a supplement to, and should be read in conjunction with, our financial statements and accompanying notes in Item 1 above.
Overview
Universal Insurance Holdings, Inc. (“UVE,” and together with its wholly-owned subsidiaries, “we,” “our,” “us,” or “the Company”) is the largest private personal residential insurance company in Florida by direct written premium in-force, with approximately 10.3% market share as of March 31, 2018, according to the most recent data reported by the Florida Office of Insurance Regulation (“FLOIR”). We perform substantially all aspects of insurance underwriting, policy issuance, general administration and claims processing and settlement internally through our vertically integrated operations. Our wholly-owned licensed insurance subsidiaries, Universal Property & Casualty Insurance Company (“UPCIC”) and American Platinum Property and Casualty Insurance Company (“APPCIC” and together with UPCIC, the “Insurance Entities”), currently write personal residential insurance policies, predominantly in Florida with $529.5 million in direct written premium for the six months ended June 30, 2018. UPCIC also writes residential homeowners insurance policies in Alabama, Delaware, Georgia, Hawaii, Indiana, Maryland, Massachusetts, Michigan, Minnesota, New Hampshire, New Jersey, New York, North Carolina, Pennsylvania, South Carolina, and Virginia with $83.3 million in direct written premium for the six months ended June 30, 2018. UPCIC is also licensed to issue policies in Illinois, Iowa, and West Virginia. APPCIC also is currently writing Fire, Commercial Multi-Peril, and Other Liability lines of business in Florida. We believe that our longevity in the Florida market and our resulting depth of experience will enable us to continue to successfully grow our business in both hard and soft markets.
28
We generate revenues primarily from the collection of premiums. The nature of our business tends to be seasonal, reflecting consumer behaviors in connection with the Florida residential real estate market and the hurricane season. The amount of direct written premium tends to increase just prior to the second quarter of our fiscal year and tends to decrease approaching the fourth quarter. Other sources of revenue include: commissions paid by our reinsurers to our reinsurance intermediary subsidiary, Blue Atlantic Reinsurance, on reinsurance it places for the Insurance Entities; policy fees collected from policyholders by our managing general agent subsidiary, Universal Risk Advisors; earnings from claims handling on ceded claims by our subsidiary, Universal Adjusting Corporation (“UAC”); and financing fees charged to policyholders who choose to defer premium payments. We also generate income by investing our assets.
Over the past several years, we have grown our business both within Florida and elsewhere in the United States through our distribution network of approximately 9,200 licensed independent agents. Our goals are to profitably grow our business, invest in our vertically integrated structure, expand our independent agent network, and return value to shareholders. Some of our key strategies include increasing our policies in force in Florida through continued profitable and organic growth; expanding into other states to diversify our revenue and risk; optimizing our reinsurance program; and continuing to provide high quality service to our policyholders and reinsurers through our vertically integrated structure. We believe each of these strategies has contributed to an increase in earnings and earnings per share as well as an improvement in our overall financial condition. See “—Results of Operations” below for a discussion of our results for the three and six months ended June 30, 2018 compared to the same periods in 2017.
Our overall organic growth strategy emphasizes taking prudent measures to increase our footprint, grow our policy count and improve the quality of our business rather than merely increasing our market share. Our focus on long-term capital strength and organic growth allows us to be selective in the risks we accept. Our goal is to write risks that are priced adequately and meet our underwriting standards. We believe that our strategy of organically expanding our premium growth through our independent agent distribution network and through our unique direct-to-consumer online platform called Universal DirectSM (which enables homeowners to directly purchase, pay for and bind homeowners policies online without the need to directly interface with any intermediaries), streamlining claims management and balancing appropriate pricing with disciplined underwriting standards will maximize our profitable growth. We also intend to continue our expansion outside of Florida in markets that allow us to write profitable business and to diversify our revenue and risk. Upon entering new markets, we leverage our existing independent agent network to generate new local relationships and business, and we take the time to learn about each new market and any of its unique risks in order to carefully develop our own policy forms, rates and informed underwriting standards. Our expansion efforts differ from many of our competitors that have grown in recent years primarily through assumption of policies from Citizens Property Insurance Corporation, Florida’s statutory residual property insurance market and through mergers and acquisitions.
As a result of our organic growth strategy and initiatives, we have seen increases in policy count and insured value in all states for over three years. The percentage of our total insured value for states outside of Florida increased from 23.7% as of June 30, 2017 to 28.9% as of June 30, 2018. The following table provides direct written premium for Florida and other states for the three and six months ended June 30, 2018 and 2017 (dollars in thousands):
|
|
For the Three Months Ended |
|
|
|
|
|
|
|
|
|
|||||||||||||
|
|
June 30, 2018 |
|
|
June 30, 2017 |
|
|
Growth year over year |
|
|||||||||||||||
|
State |
Direct Written Premium |
|
|
% |
|
|
Direct Written Premium |
|
|
% |
|
|
$ |
|
|
% |
|
||||||
|
Florida |
$ |
295,337 |
|
|
|
86.2 |
% |
|
$ |
261,430 |
|
|
|
88.3 |
% |
|
$ |
33,907 |
|
|
|
13.0 |
% |
|
Other states |
|
47,444 |
|
|
|
13.8 |
% |
|
|
34,761 |
|
|
|
11.7 |
% |
|
|
12,683 |
|
|
|
36.5 |
% |
|
Total |
$ |
342,781 |
|
|
|
100.0 |
% |
|
$ |
296,191 |
|
|
|
100.0 |
% |
|
$ |
46,590 |
|
|
|
15.7 |
% |
|
|
|
|
|
|
|
|
|
|
|
|
|
|
|
|
|
|
|
|
|
|
|
|
|
|
|
For the Six Months Ended |
|
|
|
|
|
|
|
|
|
|||||||||||||
|
|
June 30, 2018 |
|
|
June 30, 2017 |
|
|
Growth year over year |
|
|||||||||||||||
|
State |
Direct Written Premium |
|
|
% |
|
|
Direct Written Premium |
|
|
% |
|
|
$ |
|
|
% |
|
||||||
|
Florida |
$ |
529,515 |
|
|
|
86.4 |
% |
|
$ |
479,868 |
|
|
|
88.6 |
% |
|
$ |
49,647 |
|
|
|
10.3 |
% |
|
Other states |
|
83,250 |
|
|
|
13.6 |
% |
|
|
61,738 |
|
|
|
11.4 |
% |
|
|
21,512 |
|
|
|
34.8 |
% |
|
Total |
$ |
612,765 |
|
|
|
100.0 |
% |
|
$ |
541,606 |
|
|
|
100.0 |
% |
|
$ |
71,159 |
|
|
|
13.1 |
% |
29
Second-Quarter 2018 Highlights
|
|
• |
Gross direct written premiums overall grew by $46.6 million, or 15.7%, to $342.8 million compared to the second quarter in 2017. |
|
|
• |
Total direct written premium rate of growth improved from 8.9% in 2017 to 15.7% in 2018, quarter over quarter. |
|
|
• |
Net earned premiums grew by $23.3 million, or 13.8%, to $192.3 million compared to the second quarter in 2017. |
|
|
• |
Total revenues increased by $24.3 million, or 13.1%, to $209.8 million compared to the second quarter in 2017. |
|
|
• |
Loss ratio improved from 47.4% as of the end of the second quarter in 2017 to 46.7% as of the end of the second quarter in 2018. |
|
|
• |
Expense ratio improved from 33.9% as of the end of the second quarter in 2017 to 30.4% as of the end of the second quarter in 2018. |
|
|
• |
UAC generated $8.4 million of estimated pretax profits principally from the handling of Hurricane Irma claims. |
|
|
• |
Primarily as a result of the Tax Cuts and Jobs Act of 2017 (“Tax Act”), our effective tax rate decreased from 38.7% in 2017 to 24.8% in 2018. |
|
|
• |
Completed negotiation and execution of contracts representing our 2018 – 2019 reinsurance program. |
|
|
• |
Declared and paid dividends of $0.14 per share during the second quarter in 2018 and declared dividends of $0.16 per share payable in the third quarter in 2018. |
|
|
• |
Repurchased 250,000 shares during the quarter at an aggregate cost of $8.4 million pursuant to the Company’s 2018 share repurchase program. |
|
|
• |
Wrote our first policy in New Hampshire. |
UPCIC’s 2018-2019 Reinsurance Program
Third-Party Reinsurance
Our annual reinsurance program, which is segmented into layers of coverage, as is industry practice, protects us against excess property catastrophe losses. Our 2018-2019 reinsurance program includes the mandatory coverage required by law to be placed with the Florida Hurricane Catastrophe Fund (“FHCF”), in which we have elected to participate at 90%, the highest level, and also includes private reinsurance below, alongside and above the FHCF layer. In placing our 2018-2019 reinsurance program, we obtained multiple years of coverage for an additional portion of the program. We believe this multi-year arrangement will allow us to capitalize on favorable pricing and contract terms and conditions and allow us to mitigate uncertainty with respect to the price of future reinsurance coverage, one of our largest costs.
The total cost of UPCIC’s private catastrophe reinsurance program for all states as described below, effective June 1, 2018 through May 31, 2019, is $175.30 million. In addition, UPCIC has purchased reinstatement premium protection as described below, the cost of which is $14.97 million. The largest private participants in UPCIC’s reinsurance program include leading reinsurance companies and providers such as Nephila Capital, Everest Re, RenaissanceRe, Chubb Tempest Re and Lloyd’s of London syndicates.
UPCIC’s Retention
UPCIC has a net retention of $35 million per catastrophe event for losses incurred, in all states, up to a first event loss of $3.00 billion. UPCIC also purchases a separate underlying catastrophe program to further reduce its retention for all losses occurring in any state other than Florida (the “Other States Reinsurance Program”). UPCIC retains only $5 million under its Other States Reinsurance Program in the first event, $3 million in the second event and only $1 million under its Other States Reinsurance Program for the third through fifth events. These retention amounts are gross of any potential tax benefit we would receive in paying such losses.
First Layer
Immediately above UPCIC’s net retention, we have reinsurance coverage from third-party reinsurers for up to four separate catastrophic events, for all states. Specifically, we have purchased reinsurance coverage for the first and third catastrophic events, and each such coverage allows for one reinstatement upon the payment of reinstatement premiums, which would cover the second and fourth catastrophic events. This coverage has been obtained from four contracts as follows:
|
|
• |
59% of $76 million in excess of $35 million provides coverage for the 2018-2019 period; |
|
|
• |
20% of $55 million in excess of $35 million provides coverage on a multi-year basis through May 31, 2021; |
|
|
• |
21% of $55 million in excess of $35 million provides coverage for the 2018-2019 period; and |
|
|
• |
100% of $76 million in excess of $35 million and in excess of $152 million otherwise recoverable (from the first and second events) provides the third and fourth event coverage for the 2018-2019 period. |
30
For the first three contracts above, to the extent that all of our coverage or a portion thereof is exhausted in a catastrophic event and reinstatement premium is due, we have purchased reinstatement premium protection to pay the required premium necessary for the reinstatement of these coverages. All of these contracts extend coverage to all states.
Second Layer
Above the first layers, for losses exceeding $90 million and $111 million, we have purchased a second layer of coverage for losses up to $445 million – in other words, for the next $355 or $334 million of losses. This coverage has been obtained from three contracts as follows:
|
|
• |
58% of $355 million in excess of $90 million provides coverage on a multi-year basis through May 31, 2020; |
|
|
• |
19.5% of $334 million in excess of $111 million provides coverage on a multi-year basis through May 31, 2021; and |
|
|
• |
22.5% of $334 million in excess of $111 million provides coverage for the 2018-2019 period. |
In these layers, to the extent that all of our coverage or a portion thereof is exhausted in a catastrophic event and reinstatement premium is due, we have purchased reinstatement premium protection to pay the required premium necessary for the reinstatement of these coverages. All of these contracts extend coverage to all states.
Third Layer
Above the first and second layers, we have purchased a third layer of coverage for losses up to $529 million – in other words, for the next $84 million of losses. This coverage was obtained from two contracts as follows:
|
|
• |
65% of $84 million in excess of $445 million provides coverage on a multi-year basis through May 31, 2021; and |
|
|
• |
35% of $84 million in excess of $445 million provides coverage for the 2018-2019 period. |
In these layers, to the extent that all of our coverage or a portion thereof is exhausted in a catastrophic event and reinstatement premium is due, we have purchased reinstatement premium protection to pay the required premium necessary for the reinstatement of these coverages. Both of these contracts extend coverage to all states.
Fourth Layer
Above the first, second and third layers, we have purchased a fourth layer of coverage for losses up to $635 million – in other words, for the next $106 million of losses. This coverage was obtained from two contracts as follows:
|
|
• |
65% of $106 million in excess of $529 million provides coverage for the 2018-2019 period; and |
|
|
• |
35% of $106 million in excess of $529 million provides coverage for the 2018-2019 period. |
In these layers, to the extent that all of our coverage or a portion thereof is exhausted in a catastrophic event and reinstatement premium is due, we have purchased reinstatement premium protection to pay the required premium necessary for the reinstatement of these coverages. Both of these contracts extend coverage to all states.
Fifth Layer
Above the first, second, third and fourth layers, we have purchased a fifth layer of coverage for losses up to $680 million – in other words, for the next $45 million of losses. This coverage was obtained from two contracts as follows:
|
|
• |
65% of $45 million in excess of $635 million provides coverage on a multi-year basis through May 31, 2021; and |
|
|
• |
35% of $45 million in excess of $635 million provides coverage for the 2018-2019 period. |
In these layers, to the extent that all of our coverage or a portion thereof is exhausted in a catastrophic event and reinstatement premium is due, we have purchased reinstatement premium protection to pay the required premium necessary for the reinstatement of these coverages. Both of these contracts extend coverage to all states.
Sixth and Seventh Layers
In the sixth and seventh layers, we have purchased reinsurance for $218 million of coverage in excess of $680 million in losses incurred by us (net of the FHCF layer), and $140 million of coverage in excess of $898 million (net of the FHCF layer), respectively, for a total of $1.0 billion of coverage (net of the FHCF layer) by third-party reinsurers. In these layers, to the extent that all of our coverage or a portion thereof is exhausted in a catastrophic event and reinstatement premium is due, we have purchased reinstatement premium protection to pay the required premium necessary for the reinstatement of these coverages. Both of these contracts extend coverage to all states.
31
UPCIC structures its reinsurance coverage into layers and utilizes a cascading feature such that the second, third, fourth, fifth, sixth and seventh reinsurance layers all attach at $111 million. Any layers above the $111 million attachment point are excess of loss over the immediately preceding layer. If the aggregate limit of the preceding layer is exhausted, the next layer cascades down in its place for future events. This means that, unless losses exhaust the top layer of our coverage, we are exposed to only $35 million in losses, pre-tax, per catastrophe for each of the first four events. In addition to tax benefits that could reduce our ultimate loss, we anticipate that certain fees paid to our subsidiary service providers by our Insurance Entities and, indirectly, our reinsurers, would also increase during an active hurricane season.
Other States Reinsurance Program
The total cost of UPCIC’s private catastrophe reinsurance program for other states as described below, effective June 1, 2018 through May 31, 2019, is $9.74 million. In addition, UPCIC has purchased reinstatement premium protection as described below, the cost of which is $2.25 million.
Effective June 1, 2018 through June 1, 2019, under an excess catastrophe contract specifically covering risks located outside the state of Florida and intended to further reduce UPCIC’s $35 million net retention, as noted above, UPCIC has obtained catastrophe coverage of $30 million in excess of $5 million covering certain loss occurrences, including hurricanes, in states outside of Florida. This catastrophe coverage has a second full limit available with additional premium calculated pro rata as to amount and 100% as to time, as applicable. For this catastrophe coverage, which is placed in three layers, to the extent that all of our coverage or a portion thereof is exhausted in a catastrophic event and reinstatement premium is due, we have purchased reinstatement premium protection to pay the required premium necessary for the reinstatement of this coverage. All catastrophe layers are placed with a cascading feature so that all capacity could be made available in excess of $5 million under certain loss scenarios. Further, UPCIC purchased subsequent catastrophe event excess of loss reinsurance specifically covering risks outside of Florida to cover certain levels of loss through five catastrophe events including hurricanes. Specifically, UPCIC obtained catastrophe coverage that covers 100% of $4,000,000 excess of $1,000,000 in excess of $6,000,000 otherwise recoverable. This coverage has two and a half free reinstatements and a total of $14,000,000 of coverage available to UPCIC.
In certain circumstances involving a first catastrophic event impacting both Florida and other states, UPCIC’s retention could result in pre-tax net liability as low as $5,000,000 – the $35 million net retention under the all states reinsurance program could be offset by as much as $30 million in coverage under the Other States Reinsurance Program – or 1.5% of UPCIC’s statutory policyholders’ surplus as of June 30, 2018.
FHCF
UPCIC’s third-party reinsurance program supplements the FHCF coverage we are required to purchase every year. The limit and retention of the FHCF coverage we receive each year is subject to upward or downward adjustment based on, among other things, submitted exposures to the FHCF by all participants. As of June 1, 2018, we estimate our FHCF coverage includes a maximum provisional limit of 90% of $2.18 billion, or $1.96 billion, in excess of $680 million. The estimated premium that UPCIC plans to cede to the FHCF for the 2018 hurricane season is $128.3 million.
Coverage purchased from third-party reinsurers, as described above, adjusts to provide coverage for certain losses not otherwise covered by the FHCF. The FHCF coverage cannot be reinstated once exhausted, but it does provide coverage for multiple events. The FHCF coverage extends only to losses to our Florida portfolio due to a land falling hurricane.
The third-party reinsurance we purchase for UPCIC is therefore net of FHCF recovery. When our FHCF and third-party reinsurance coverages are taken together, UPCIC has reinsurance coverage of up to $3.00 billion for the first event, as illustrated by the graphic below. Should a catastrophic event occur, we would retain up to $35 million pre-tax for each catastrophic event, and would also be responsible for any additional losses that exceed our top layer of coverage.
32
All States 1st Event
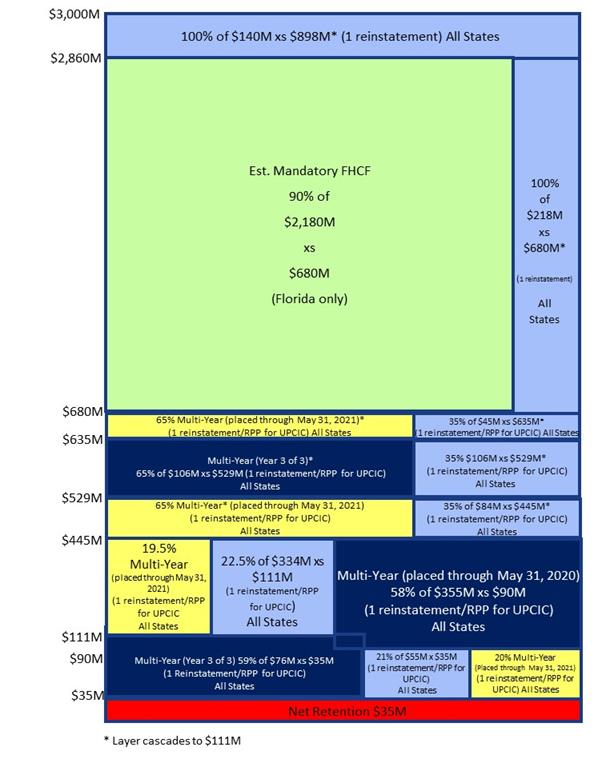
33
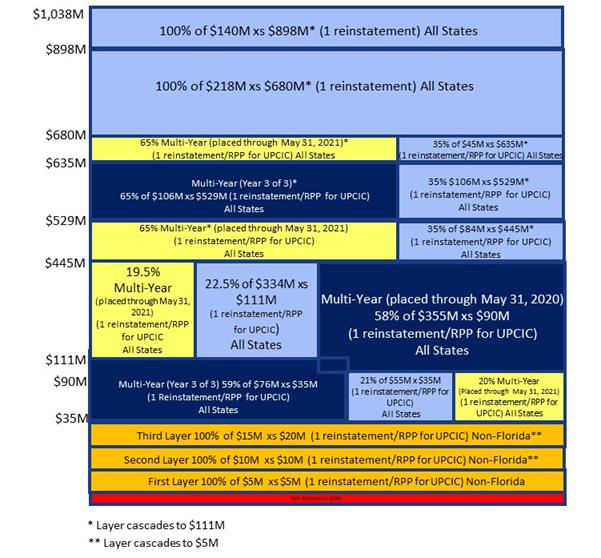
APPCIC’s 2018-2019 Reinsurance Program
Third-Party Reinsurance
The total cost of APPCIC’s private catastrophe and multiple line excess reinsurance program, effective June 1, 2018 through May 31, 2019, is $2.27 million. In addition, APPCIC has purchased reinstatement premium protection as described below, the cost of which is $103,950. The largest private participants in APPCIC’s reinsurance program include leading reinsurance companies such as Everest Re, Chubb Tempest Re, Hiscox, Hannover Ruck, and Lloyd’s of London syndicates.
APPCIC’s Retention
APPCIC has a net retention of $2 million for all losses per catastrophe event for losses incurred up to a first event loss of $36.2 million. This retention amount is gross of any potential tax benefit we would receive in paying such losses.
First Layer
Immediately above APPCIC’s net retention we have $4.2 million of reinsurance coverage from third-party reinsurers. Specifically, we have purchased reinsurance coverage for the first event, and such coverage allows for one reinstatement upon the payment of reinstatement premiums, which would cover the second and potentially more catastrophic events. We have purchased reinstatement premium protection to pay the required premium necessary for the initial reinstatement of this coverage for a second catastrophic event.
34
Second, Third and Fourth Layers
In the second, third and fourth layers, we have purchased reinsurance for $2.0 million of coverage in excess of $6.2 million in losses incurred by us (net of the FHCF layer), $5 million of coverage in excess of $8.2 million in losses incurred by us (net of the FHCF layer), and $5 million of coverage in excess of $13.2 million in losses incurred by us (net of the FHCF layer), respectively.
APPCIC structures its reinsurance coverage into layers and utilizes a cascading feature such that the second, third and fourth reinsurance layers all attach at $2 million. Any layers above the $2 million attachment point are excess of loss over the immediately preceding layer. If the aggregate limit of the preceding layer is exhausted, the next layer cascades down in its place for future events. This means that, unless losses exhaust the top layer of our coverage, we are only exposed to $2 million in losses, pre-tax, per catastrophe for each of the first two events. In addition to tax benefits that could reduce our ultimate loss, we anticipate that certain fees paid to our subsidiary service providers by our Insurance Entities and, indirectly, our reinsurers would also increase during an active hurricane season.
FHCF
APPCIC’s third-party reinsurance program is used to supplement the FHCF reinsurance we are required to purchase every year. The limit and retention of the FHCF coverage we receive each year is subject to upward or downward adjustment based on, among other things, submitted exposures to the FHCF by all participants. As of June 1, 2018, we estimate our FHCF coverage includes a maximum provisional limit of 90% of $20 million, or $18 million, in excess of $6.2 million. The estimated premium that APPCIC plans to cede to the FHCF for the 2018 hurricane season is $1.2 million. Factoring in our estimated coverage under the FHCF, we purchase coverage alongside our FHCF coverage from third-party reinsurers as described above, which adjusts to provide coverage for certain losses not otherwise covered by the FHCF. The FHCF coverage cannot be reinstated once exhausted, but it does provide coverage for multiple events. The FHCF coverage extends only to losses to our portfolio impacted by a land falling hurricane.
The third-party reinsurance we purchase for APPCIC is therefore net of FHCF recovery. When our FHCF and third-party reinsurance coverages are taken together, APPCIC has reinsurance coverage of up to $36.2 million, as illustrated by the graphic below. Should a catastrophic event occur, we would retain $2 million pre-tax for each catastrophic event, and would also be responsible for any additional losses that exceed our top layer of coverage.
35
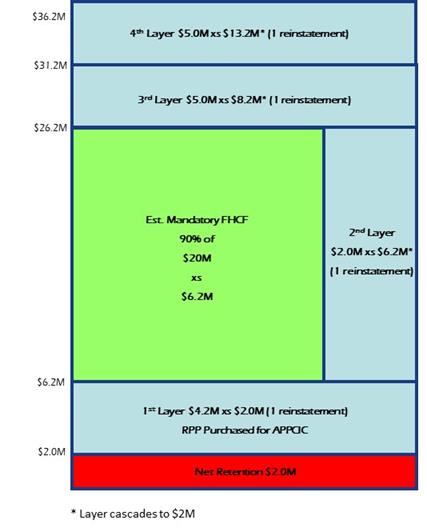
Multiple Line Excess of Loss
APPCIC also purchases extensive multiple line excess per risk reinsurance with various reinsurers due to the high valued risks it insures in both the personal residential and commercial multiple peril lines of business. Under this multiple line excess per risk contract, APPCIC has coverage of $8.5 million in excess of $500 thousand ultimate net loss for each risk and each property loss, and $1 million in excess of $0.3 million for each casualty loss. A $19.5 million aggregate limit applies to the term of the contract for property related losses and a $2.0 million aggregate limit applies to the term of the contract for casualty-related losses. This contract also contains a profit sharing feature available to APPCIC if the contract meets specific performance measures.
Results of Operations — Three Months Ended June 30, 2018 Compared to Three Months Ended June 30, 2017
Net income was $46.1 million, an increase of $16.7 million, or 56.9%, for the three months ended June 30, 2018, compared to $29.4 million for the three months ended June 30, 2017. The increase is the result of double digit revenue growth, continued underwriting profitability, and a reduced effective tax rate. Diluted earnings per common share increased by $0.47 to $1.29 for the three months ended June 30, 2018, compared to $0.82 per share for the three months ended June 30, 2017, reflecting the increase in net income and a slight reduction in our weighted average diluted common shares outstanding. A detailed discussion of our results of operations follows the table below.
36
|
|
(in thousands) |
|
|
|
|
|
|
|
|
|
|||||
|
|
Three Months Ended |
|
|
|
|
|
|
|
|
|
|||||
|
|
June 30, |
|
|
Change |
|
||||||||||
|
|
2018 |
|
|
2017 |
|
|
$ |
|
|
% |
|
||||
|
PREMIUMS EARNED AND OTHER REVENUES |
|
|
|
|
|
|
|
|
|
|
|
|
|
|
|
|
Direct premiums written |
$ |
342,781 |
|
|
$ |
296,191 |
|
|
$ |
46,590 |
|
|
|
15.7 |
% |
|
Change in unearned premium |
|
(68,754 |
) |
|
|
(51,568 |
) |
|
|
(17,186 |
) |
|
|
33.3 |
% |
|
Direct premium earned |
|
274,027 |
|
|
|
244,623 |
|
|
|
29,404 |
|
|
|
12.0 |
% |
|
Ceded premium earned |
|
(81,755 |
) |
|
|
(75,614 |
) |
|
|
(6,141 |
) |
|
|
8.1 |
% |
|
Premiums earned, net |
|
192,272 |
|
|
|
169,009 |
|
|
|
23,263 |
|
|
|
13.8 |
% |
|
Net investment income (expense) |
|
5,786 |
|
|
|
3,223 |
|
|
|
2,563 |
|
|
|
79.5 |
% |
|
Net realized gains (losses) on sale of securities |
|
145 |
|
|
|
1,710 |
|
|
|
(1,565 |
) |
|
NM |
|
|
|
Net change in unrealized gains (losses) of equity securities |
|
(1,521 |
) |
|
|
— |
|
|
|
(1,521 |
) |
|
NM |
|
|
|
Commission revenue |
|
5,709 |
|
|
|
4,644 |
|
|
|
1,065 |
|
|
|
22.9 |
% |
|
Policy fees |
|
5,764 |
|
|
|
5,250 |
|
|
|
514 |
|
|
|
9.8 |
% |
|
Other revenue |
|
1,633 |
|
|
|
1,651 |
|
|
|
(18 |
) |
|
|
-1.1 |
% |
|
Total premiums earned and other revenues |
|
209,788 |
|
|
|
185,487 |
|
|
|
24,301 |
|
|
|
13.1 |
% |
|
OPERATING COSTS AND EXPENSES |
|
|
|
|
|
|
|
|
|
|
|
|
|
|
|
|
Losses and loss adjustment expenses |
|
89,842 |
|
|
|
80,184 |
|
|
|
9,658 |
|
|
|
12.0 |
% |
|
General and administrative expenses |
|
58,698 |
|
|
|
57,380 |
|
|
|
1,318 |
|
|
|
2.3 |
% |
|
Total operating costs and expenses |
|
148,540 |
|
|
|
137,564 |
|
|
|
10,976 |
|
|
|
8.0 |
% |
|
INCOME BEFORE INCOME TAXES |
|
61,248 |
|
|
|
47,923 |
|
|
|
13,325 |
|
|
|
27.8 |
% |
|
Income tax expense |
|
15,164 |
|
|
|
18,547 |
|
|
|
(3,383 |
) |
|
|
-18.2 |
% |
|
NET INCOME |
$ |
46,084 |
|
|
$ |
29,376 |
|
|
$ |
16,708 |
|
|
|
56.9 |
% |
|
Other comprehensive income (loss), net of taxes |
|
(1,849 |
) |
|
|
1,486 |
|
|
|
(3,335 |
) |
|
NM |
|
|
|
COMPREHENSIVE INCOME |
$ |
44,235 |
|
|
$ |
30,862 |
|
|
$ |
13,373 |
|
|
|
43.3 |
% |
|
DILUTED EARNINGS PER SHARE DATA: |
|
|
|
|
|
|
|
|
|
|
|
|
|
|
|
|
Diluted earnings per common share |
$ |
1.29 |
|
|
$ |
0.82 |
|
|
$ |
0.47 |
|
|
|
57.3 |
% |
|
Weighted average diluted common shares outstanding |
|
35,589 |
|
|
|
35,958 |
|
|
|
(369 |
) |
|
|
-1.0 |
% |
NM – Not Meaningful
Direct premiums written increased by $46.6 million, or 15.7%, for the quarter ended June 30, 2018, driven by growth within our Florida business of $33.9 million, or 13.0%, as compared to the prior period, and growth in our Other States business of $12.7 million, or 36.5%, as compared to the prior period. Florida growth was driven by growth in policy count as well as the impact of an average statewide rate increase of 3.4%, which was approved in early December and effective for new business beginning on December 7, 2017 and for renewal business beginning on January 26, 2018. Geographic expansion efforts in our Other States business continued to add to overall premium levels, and we are now actively writing policies in 16 states other than our home state of Florida. We commenced operations and wrote our first policy in New Hampshire in early April 2018.
Direct premium earned increased by $29.4 million, or 12.0%, for the quarter ended June 30, 2018, reflecting the earning of premiums written over the past 12 months and any changes in rates or policy count during that time.
Ceded premium earned increased by $6.1 million, or 8.1%, for the quarter ended June 30, 2018, reflecting an increase in total insured value covered by our reinsurance program and the coverage terms of the reinsurance agreements in effect during the treaty periods which begin on June 1 of each year and extend through May 31 of the following year. Ceded premium earned as a percent of direct premiums earned was 29.8% for the three months ended June 30, 2018 compared to 30.9% for the three months ended June 30, 2017.
Premiums earned, net grew by 13.8%, or $23.3 million, to $192.3 million for the three months ended June 30, 2018, reflecting the increase in direct premium earned discussed above.
Net investment income was $5.8 million for the three months ended June 30, 2018, compared to $3.2 million for the same period in 2017. The increase in net investment income of $2.6 million is primarily the result of an increase in investment income from our available-for-sale debt securities, which grew as a result of growth in total invested assets, favorable market trends and actions taken to increase yield while maintaining high credit quality. Also contributing to the increase in investment income is a higher level of return from our cash and cash equivalents due to actions taken to optimize treasury management coupled with an increase in interest rates on short-term investments. Total invested assets were $747.2 million with an average credit rating of AA- during the three months ended June 30, 2018 compared to $634.9 million with an average credit rating of AA- for the same period in 2017.
37
We sell investment securities from our investment portfolio of securities, including equity securities and available for sale debt securities, from time to time when opportunities arise or circumstances could result in greater losses or lower yields if held. We sold investment securities available for sale and equity securities during the three months ended June 30, 2018, generating net realized gain of $0.1 million compared to net realized gain of $1.7 million for the three months ended June 30, 2017.
In the second quarter of 2018, the net change in unrealized gains (losses) of equity securities was a loss of $1.5 million, driven by a decline in value of our equity securities portfolio. We highlight that this line item was added during the quarter ended March 31, 2018 because of the adoption of new accounting guidance for equity securities. See “Note 2 - Significant Accounting Policies – Recently Adopted Accounting Pronouncements” for more information. The comparable change in unrealized gains (losses) within our equity portfolio for the prior period in 2017 was $0.6 million of pretax losses, which was not included in net income in the prior period, but was included in other comprehensive income (loss), which is presented net of taxes.
Commission revenue is comprised principally of brokerage commissions we earn from reinsurers on reinsurance placed for the Insurance Entities. For the three months ended June 30, 2018, commission revenue was $5.7 million, compared to $4.6 million for the three months ended June 30, 2017. The increase in commission revenue of $1.1 million, or 22.9%, for the three months ended June 30, 2018 compared to the three months ended June 30, 2017 was primarily the result of $873 thousand of reinstatement commissions received by Blue Atlantic Reinsurance Corporation during the second quarter of 2018.
Policy fees for the three months ended June 30, 2018, were $5.8 million compared to $5.3 million for the same period in 2017. The increase of $514 thousand, or 9.8%, was the result of an increase in the number of new and renewal policies written during the three months ended June 30, 2018 compared to the same period in 2017.
Other revenue, which represents revenue from premium financing and other miscellaneous income, was $1.6 million for the three months ended June 30, 2018 compared to $1.7 million for the same period in 2017.
Losses and LAE, net of reinsurance, were $89.8 million for the three months ended June 30, 2018, compared to $80.2 million during the same period in 2017 as follows (dollars in thousands):
|
|
Three Months Ended June 30, 2018 |
|
|||||||||||||||||||||
|
|
Direct |
|
|
Loss Ratio |
|
|
Ceded |
|
|
Loss Ratio |
|
|
Net |
|
|
Loss Ratio |
|
||||||
|
Premiums earned |
$ |
274,027 |
|
|
|
|
|
|
$ |
81,755 |
|
|
|
|
|
|
$ |
192,272 |
|
|
|
|
|
|
|
|
|
|
|
|
|
|
|
|
|
|
|
|
|
|
|
|
|
|
|
|
|
|
|
Loss and loss adjustment expenses: |
|
|
|
|
|
|
|
|
|
|
|
|
|
|
|
|
|
|
|
|
|
|
|
|
Weather events* |
$ |
5,000 |
|
|
|
1.8 |
% |
|
$ |
— |
|
|
|
— |
|
|
$ |
5,000 |
|
|
|
2.6 |
% |
|
Prior year adverse/(favorable) reserve development |
|
161,400 |
|
|
|
58.9 |
% |
|
|
159,090 |
|
|
|
194.6 |
% |
|
|
2,310 |
|
|
|
1.2 |
% |
|
All other losses and loss adjustment expenses |
|
80,222 |
|
|
|
29.3 |
% |
|
|
(2,310 |
) |
|
|
(2.8 |
%) |
|
|
82,532 |
|
|
|
42.9 |
% |
|
Total losses and loss adjustment expenses |
$ |
246,622 |
|
|
|
90.0 |
% |
|
$ |
156,780 |
|
|
|
191.8 |
% |
|
$ |
89,842 |
|
|
|
46.7 |
% |
|
|
Three Months Ended June 30, 2017 |
|
|||||||||||||||||||||
|
Direct |
|
|
Loss Ratio |
|
|
Ceded |
|
|
Loss Ratio |
|
|
Net |
|
|
Loss Ratio |
|
|||||||
|
Premiums earned |
$ |
244,623 |
|
|
|
|
|
|
$ |
75,614 |
|
|
|
|
|
|
$ |
169,009 |
|
|
|
|
|
|
|
|
|
|
|
|
|
|
|
|
|
|
|
|
|
|
|
|
|
|
|
|
|
|
|
Loss and loss adjustment expenses: |
|
|
|
|
|
|
|
|
|
|
|
|
|
|
|
|
|
|
|
|
|
|
|
|
Weather events* |
$ |
6,000 |
|
|
|
2.5 |
% |
|
$ |
— |
|
|
|
— |
|
|
$ |
6,000 |
|
|
|
3.6 |
% |
|
Prior year adverse/(favorable) reserve development |
|
6,581 |
|
|
|
2.7 |
% |
|
|
5,472 |
|
|
|
7.2 |
% |
|
|
1,109 |
|
|
|
0.7 |
% |
|
All other losses and loss adjustment expenses |
|
73,075 |
|
|
|
29.9 |
% |
|
|
— |
|
|
|
— |
|
|
|
73,075 |
|
|
|
43.2 |
% |
|
Total losses and loss adjustment expenses |
$ |
85,656 |
|
|
|
35.1 |
% |
|
$ |
5,472 |
|
|
|
7.2 |
% |
|
$ |
80,184 |
|
|
|
47.4 |
% |
*Includes only weather events beyond those expected.
See “Item 1 — Note 6 (Liability for Unpaid Losses and Loss Adjustment Expenses)” for change in liability for unpaid losses and LAE.
For the quarter ended June 30, 2018, we experienced $5.0 million of weather events beyond expectations (on both a direct and net basis), related to the eruption of the Kilauea volcano in Hawaii and several other meaningful weather-related events that occurred in
38
2018. This compares to losses and LAE (on both a direct and net basis) of $6.0 million from weather events beyond those expected for the quarter ended June 30, 2017, which was the result of an increase to our underlying core loss ratio in 2017 to reflect an increase of unexpected weather-related losses.
During the second quarter in 2018, the Company increased its estimate of ultimate losses on Hurricane Irma to $603.5 million for both the Insurance Entities from $447.4 million recorded in the first quarter in 2018. The prior year development of $156.1 million in gross losses resulted in a net retention benefit of $0.3 million after cessions to the Company’s reinsurers. The increase in the ultimate loss and LAE for Hurricane Irma was the result of a continuation of new reported claims and the aggressive nature of plaintiff attorneys on claims in Florida.
Also, the Company recorded prior year loss reserve development of $5.3 million on a direct basis ($2.6 million on a net basis) for the quarter ended June 30, 2018, reflecting strengthening of reserves for the fourth quarter 2016 storm, Hurricane Matthew. Reserve strengthening on Hurricane Matthew is based on our revised estimate to settle the remaining 78 open claims. The three months ending June 30, 2017 included prior period loss reserve development of $6.6 million on a direct basis ($1.1 million on a net basis), also reflecting strengthening of reserves for the fourth quarter 2016 storm, Hurricane Matthew.
All other net losses and LAE were $82.5 million for the three months ended June 30, 2018, compared to $73.1 million during the same period in 2017. Our service company subsidiaries, particularly UAC, generated additional revenues servicing Hurricane Irma claims and during the second quarter ended June 30, 2018 generated $8.4 million of earnings which reduced amounts recorded as losses and LAE this quarter. This had a favorable effect on our underlying loss and LAE ratio of approximately 3.4 percentage points on a direct basis (or 5.0 percentage points on a net basis). The Company’s underlying loss and LAE ratio reflects continued geographic expansion into states outside of Florida where non-catastrophe loss ratios are generally higher than in Florida, as well as claims trends inside of Florida including the growth in claim costs and challenges faced when policyholders assign their policy benefits to third parties and including the increased litigation arising from these claims.
General and administrative expenses were $58.7 million for the three months ended June 30, 2018, compared to $57.4 million during the same period in 2017 as follows (dollars in thousands):
|
|
Three Months Ended |
|
|
|
|
|
|
|
|
|
|||||||||||||
|
|
June 30, |
|
|
Change |
|
||||||||||||||||||
|
|
2018 |
|
|
2017 |
|
|
$ |
|
|
% |
|
||||||||||||
|
|
$ |
|
|
Ratio |
|
|
$ |
|
|
Ratio |
|
|
|
|
|
|
|
|
|
||||
|
Premiums earned, net |
$ |
192,272 |
|
|
|
|
|
|
$ |
169,009 |
|
|
|
|
|
|
$ |
23,263 |
|
|
|
13.8 |
% |
|
General and administrative expenses: |
|
|
|
|
|
|
|
|
|
|
|
|
|
|
|
|
|
|
|
|
|
|
|
|
Policy acquisition costs |
|
33,545 |
|
|
|
17.4 |
% |
|
|
33,022 |
|
|
|
19.5 |
% |
|
|
523 |
|
|
|
1.6 |
% |
|
Other operating costs |
|
25,063 |
|
|
|
13.0 |
% |
|
|
24,272 |
|
|
|
14.4 |
% |
|
|
791 |
|
|
|
3.3 |
% |
|
Interest expense |
|
90 |
|
|
|
— |
|
|
|
86 |
|
|
|
— |
|
|
|
4 |
|
|
|
4.7 |
% |
|
Total general and administrative expenses (1) |
$ |
58,698 |
|
|
|
30.4 |
% |
|
$ |
57,380 |
|
|
|
33.9 |
% |
|
$ |
1,318 |
|
|
|
2.3 |
% |
|
|
(1) |
Total general and administrative expense ratio does not include interest expense. |
The increase in general and administrative expenses of $1.3 million was primarily the result of modest increases in both policy acquisition costs and other operating costs, which increased by $0.5 million and $0.8 million, respectively, as compared to the prior year’s quarter. General and administrative expenses for the quarter ended June 30, 2018 included a $6.5 million benefit (included within policy acquisition costs) related to a settlement of prior year premium tax audits with the Florida Department of Revenue, which reduced the expense ratio by 3.4 percentage points. Our underlying policy acquisition costs continued to be driven by increased premium volume and continued geographic expansion into states that typically have higher commission rates as compared to Florida. Overall, the expense ratio (general and administrative expenses as a percentage of net earned premiums) benefited from economies of scale as general and administrative expenses did not increase at the same rate as revenues. As a result of the above items, the expense ratio decreased to 30.4% for the three months ended June 30, 2018 compared to 33.9% for the same period in 2017.
Income tax expense decreased by $3.4 million, or 18.2%, for the three months ended June 30, 2018, when compared with the three months ended June 30, 2017. Our effective tax rate decreased to 24.8% for the three months ended June 30, 2018, as compared to 38.7% for the three months ended June 30, 2017. The decrease in both income tax expense and our effective tax rate is primarily the result of the enactment of the Tax Act. The second quarter of 2018 included a net credit to income tax expense of $0.6 million primarily driven by the excess tax benefits resulting from stock-based awards that vested and/or were exercised during the second quarter, thereby benefitting the quarter’s effective tax rate by 1.0 percentage points. See “Item 1 – Note 9 (Income Taxes)” for an explanation of the change in our effective tax rates.
39
Other comprehensive loss, net of taxes for the three months ended June 30, 2018 was $1.8 million compared to other comprehensive income of $1.5 million for the same period in 2017. See “Item 1 — Note 11 (Other Comprehensive Income (Loss))” for additional information about the amounts comprising other comprehensive income and loss for these periods.
Results of Operations — Six Months Ended June 30, 2018 Compared to Six Months Ended June 30, 2017
Net income was $86.1 million, an increase of $25.6 million, or 42.2%, for the six months ended June 30, 2018, compared to $60.6 million for the six months ended June 30, 2017. The increase is the result of double digit revenue growth, continued underwriting profitability, and a reduced effective tax rate. Diluted earnings per common share increased by $0.74 to $2.42 for the six months ended June 30, 2018, compared to $1.68 per share for the six months ended June 30, 2017, reflecting the increase in net income and a slight reduction in our weighted average diluted common shares outstanding. A detailed discussion of our results of operations follows the table below.
|
|
(in thousands) |
|
|
|
|
|
|
|
|
|
|||||
|
|
Six Months Ended |
|
|
|
|
|
|
|
|
|
|||||
|
|
June 30, |
|
|
Change |
|
||||||||||
|
|
2018 |
|
|
2017 |
|
|
$ |
|
|
% |
|
||||
|
PREMIUMS EARNED AND OTHER REVENUES |
|
|
|
|
|
|
|
|
|
|
|
|
|
|
|
|
Direct premiums written |
$ |
612,765 |
|
|
$ |
541,606 |
|
|
$ |
71,159 |
|
|
|
13.1 |
% |
|
Change in unearned premium |
|
(76,477 |
) |
|
|
(60,608 |
) |
|
|
(15,869 |
) |
|
|
26.2 |
% |
|
Direct premium earned |
|
536,288 |
|
|
|
480,998 |
|
|
|
55,290 |
|
|
|
11.5 |
% |
|
Ceded premium earned |
|
(161,439 |
) |
|
|
(150,430 |
) |
|
|
(11,009 |
) |
|
|
7.3 |
% |
|
Premiums earned, net |
|
374,849 |
|
|
|
330,568 |
|
|
|
44,281 |
|
|
|
13.4 |
% |
|
Net investment income (expense) |
|
10,571 |
|
|
|
5,927 |
|
|
|
4,644 |
|
|
|
78.4 |
% |
|
Net realized gains (losses) on sale of securities |
|
(2,496 |
) |
|
|
1,647 |
|
|
|
(4,143 |
) |
|
NM |
|
|
|
Net change in unrealized gains (losses) of equity securities |
|
(6,630 |
) |
|
|
— |
|
|
|
(6,630 |
) |
|
NM |
|
|
|
Commission revenue |
|
10,980 |
|
|
|
9,242 |
|
|
|
1,738 |
|
|
|
18.8 |
% |
|
Policy fees |
|
10,539 |
|
|
|
9,733 |
|
|
|
806 |
|
|
|
8.3 |
% |
|
Other revenue |
|
3,475 |
|
|
|
3,244 |
|
|
|
231 |
|
|
|
7.1 |
% |
|
Total premiums earned and other revenues |
|
401,288 |
|
|
|
360,361 |
|
|
|
40,927 |
|
|
|
11.4 |
% |
|
OPERATING COSTS AND EXPENSES |
|
|
|
|
|
|
|
|
|
|
|
|
|
|
|
|
Losses and loss adjustment expenses |
|
165,768 |
|
|
|
150,754 |
|
|
|
15,014 |
|
|
|
10.0 |
% |
|
General and administrative expenses |
|
122,573 |
|
|
|
114,313 |
|
|
|
8,260 |
|
|
|
7.2 |
% |
|
Total operating costs and expenses |
|
288,341 |
|
|
|
265,067 |
|
|
|
23,274 |
|
|
|
8.8 |
% |
|
INCOME BEFORE INCOME TAXES |
|
112,947 |
|
|
|
95,294 |
|
|
|
17,653 |
|
|
|
18.5 |
% |
|
Income tax expense |
|
26,808 |
|
|
|
34,719 |
|
|
|
(7,911 |
) |
|
|
-22.8 |
% |
|
NET INCOME |
$ |
86,139 |
|
|
$ |
60,575 |
|
|
$ |
25,564 |
|
|
|
42.2 |
% |
|
Other comprehensive income (loss), net of taxes |
|
(5,899 |
) |
|
|
3,950 |
|
|
|
(9,849 |
) |
|
NM |
|
|
|
COMPREHENSIVE INCOME |
$ |
80,240 |
|
|
$ |
64,525 |
|
|
$ |
15,715 |
|
|
|
24.4 |
% |
|
DILUTED EARNINGS PER SHARE DATA: |
|
|
|
|
|
|
|
|
|
|
|
|
|
|
|
|
Diluted earnings per common share |
$ |
2.42 |
|
|
$ |
1.68 |
|
|
$ |
0.74 |
|
|
|
44.0 |
% |
|
Weighted average diluted common shares outstanding |
|
35,636 |
|
|
|
36,061 |
|
|
|
(425 |
) |
|
|
-1.2 |
% |
NM – Not Meaningful
Direct premiums written increased by $71.2 million, or 13.1%, for the six months ended June 30, 2018, driven by growth within our Florida business of $49.6 million, or 10.3%, as compared to the prior period, and growth in our Other States business of $21.5 million, or 34.8%, as compared to the prior period. Florida growth was driven by growth in policy count as well as the impact of an average statewide rate increase of 3.4%, which was approved in early December and effective for new business beginning on December 7, 2017 and for renewal business beginning on January 26, 2018. Geographic expansion efforts in our Other States business continued to add to overall premium levels, and we are now actively writing policies in 16 states other than our home state of Florida. We commenced operations and wrote our first policy in New Hampshire in early April 2018.
Direct premium earned increased by $55.3 million, or 11.5%, for the six months ended June 30, 2018, reflecting the earning of premiums written over the past 12 months and any changes in rates or policy count during that time.
Ceded premium earned increased by $11.0 million, or 7.3%, for the six months ended June 30, 2018, reflecting an increase in total insured value covered by our reinsurance program and the coverage terms of the reinsurance agreements in effect during the treaty
40
periods which begin on June 1 of each year and extend through May 31 of the following year. Ceded premium earned as a percent of direct premiums earned was 30.1% for the six months ended June 30, 2018 compared to 31.3% for the six months ended June 30, 2017.
Premiums earned, net grew by 13.4%, or $44.3 million, to $374.8 million for the six months ended June 30, 2018, reflecting the increase in direct earned premiums discussed above.
Net investment income was $10.6 million for the six months ended June 30, 2018, compared to $5.9 million for the same six-month period in 2017. The increase in net investment income of $4.6 million is primarily the result of an increase in investment income from our available-for-sale debt securities, which grew as a result of growth in total invested assets, favorable market trends and actions taken to increase yield while maintaining high credit quality. Also contributing to the increase in investment income is a higher level of return from our cash and cash equivalents due to actions taken to optimize treasury management coupled with an increase in interest rates on short-term investments. Total invested assets were $747.2 million with an average credit rating of AA- during the six months ended June 30, 2018 compared to $634.9 million with an average credit rating of AA- for the same period in 2017.
We sell investment securities from our investment portfolio including, equity securities and available for sale debt securities, from time to time when opportunities arise or circumstances could result in greater losses or lower yields if held. We sold investment securities available for sale and equity securities during the six months ended June 30, 2018, generating net realized losses of $2.5 million compared to net realized gains of $1.6 million for the six months ended June 30, 2017. The investment securities sold during the six months ended June 30, 2018 were comprised primarily of municipal securities, which were liquidated in light of their diminished after-tax returns following the enactment of the Tax Act.
During the first six months in 2018, the net change in unrealized gains (losses) of equity securities, was a loss of $6.6 million, driven by a decline in value of our equity securities portfolio. We highlight that this line item was added during the six months ended June 30, 2018, because of the adoption of new accounting guidance for equity securities. See “Note 2 - Significant Accounting Policies – Recently Adopted Accounting Pronouncements” for more information. The comparable change in unrealized gains (losses) within our equity portfolio for the prior period in 2017 was $1.1 million of pretax gains, which was not included in net income in the prior period, but was included in other comprehensive income (loss), which is presented net of taxes.
Commission revenue is comprised principally of brokerage commissions we earn from reinsurers on reinsurance placed for the Insurance Entities. For the six months ended June 30, 2018, commission revenue was $11.0 million, compared to $9.2 million for the six months ended June 30, 2017. The increase in commission revenue of $1.7 million, or 18.8%, for the six months ended June 30, 2018 compared to the six months ended June 30, 2017 was primarily the result of $1.4 million of reinstatement commissions received by Blue Atlantic Reinsurance Corporation during the first six months ended of 2018.
Policy fees for the six months ended June 30, 2018, were $10.5 million compared to $9.7 million for the same period in 2017. The increase of $0.8 million, or 8.3%, was the result of an increase in the number of new and renewal policies written during the six months ended June 30, 2018 compared to the same period in 2017.
Other revenue, which represents revenue from premium financing and other miscellaneous income, was $3.5 million for the six months ended June 30, 2018 compared to $3.2 million for the same period in 2017.
Losses and LAE, net of reinsurance were $165.8 million for the six months ended June 30, 2018, compared to $150.8 million during the same period in 2017 as follows (dollars in thousands):
|
|
Six Months Ended June 30, 2018 |
|
|||||||||||||||||||||
|
|
Direct |
|
|
Loss Ratio |
|
|
Ceded |
|
|
Loss Ratio |
|
|
Net |
|
|
Loss Ratio |
|
||||||
|
Premiums earned |
$ |
536,288 |
|
|
|
|
|
|
$ |
161,439 |
|
|
|
|
|
|
$ |
374,849 |
|
|
|
|
|
|
|
|
|
|
|
|
|
|
|
|
|
|
|
|
|
|
|
|
|
|
|
|
|
|
|
Loss and loss adjustment expenses: |
|
|
|
|
|
|
|
|
|
|
|
|
|
|
|
|
|
|
|
|
|
|
|
|
Weather events* |
$ |
5,000 |
|
|
|
0.9 |
% |
|
$ |
— |
|
|
|
— |
|
|
$ |
5,000 |
|
|
|
1.3 |
% |
|
Prior year adverse/(favorable) reserve development |
|
162,050 |
|
|
|
30.2 |
% |
|
|
159,784 |
|
|
|
99.0 |
% |
|
|
2,266 |
|
|
|
0.6 |
% |
|
All other losses and loss adjustment expenses |
|
156,211 |
|
|
|
29.1 |
% |
|
|
(2,291 |
) |
|
|
(1.4 |
%) |
|
|
158,502 |
|
|
|
42.3 |
% |
|
Total losses and loss adjustment expenses |
$ |
323,261 |
|
|
|
60.2 |
% |
|
$ |
157,493 |
|
|
|
97.6 |
% |
|
$ |
165,768 |
|
|
|
44.2 |
% |
41
|
|
Six Months Ended June 30, 2017 |
|
|||||||||||||||||||||
|
|
Direct |
|
|
Loss Ratio |
|
|
Ceded |
|
|
Loss Ratio |
|
|
Net |
|
|
Loss Ratio |
|
||||||
|
Premiums earned |
$ |
480,998 |
|
|
|
|
|
|
$ |
150,430 |
|
|
|
|
|
|
$ |
330,568 |
|
|
|
|
|
|
|
|
|
|
|
|
|
|
|
|
|
|
|
|
|
|
|
|
|
|
|
|
|
|
|
Loss and loss adjustment expenses: |
|
|
|
|
|
|
|
|
|
|
|
|
|
|
|
|
|
|
|
|
|
|
|
|
Weather events* |
$ |
9,000 |
|
|
|
1.9 |
% |
|
$ |
— |
|
|
|
— |
|
|
$ |
9,000 |
|
|
|
2.7 |
% |
|
Prior year adverse/(favorable) reserve development |
|
6,890 |
|
|
|
1.4 |
% |
|
|
5,685 |
|
|
|
3.8 |
% |
|
|
1,205 |
|
|
|
0.4 |
% |
|
All other losses and loss adjustment expenses |
|
140,549 |
|
|
|
29.2 |
% |
|
|
— |
|
|
|
— |
|
|
|
140,549 |
|
|
|
42.5 |
% |
|
Total losses and loss adjustment expenses |
$ |
156,439 |
|
|
|
32.5 |
% |
|
$ |
5,685 |
|
|
|
3.8 |
% |
|
$ |
150,754 |
|
|
|
45.6 |
% |
* Includes only weather events beyond those expected.
See “Item 1 — Note 6 (Liability for Unpaid Losses and Loss Adjustment Expenses)” for change in liability for unpaid losses and LAE.
For the six months ended June 30, 2018, we experienced $5.0 million of weather events beyond expectations (on both a direct and net basis), related to the eruption of the Kilauea volcano in Hawaii and several other meaningful weather-related events that occurred in 2018. This compares to losses and LAE (on both a direct and net basis) of $9.0 million from weather events beyond those expected for the six months ended June 30, 2017, including an increase to our underlying core loss ratio in 2017 to reflect an increase of unexpected weather-related losses.
During the second quarter in 2018, the Company increased its estimate of ultimate losses on Hurricane Irma to $603.5 million for both Insurance Entities from $446.7 million recorded in 2017. The prior year development of $156.8 million in gross losses resulted in a net retention benefit of $0.3 million after cessions to the Company’s reinsurers. The increase in the ultimate loss and LAE for Hurricane Irma was the result of a continuation of new reported claims and the aggressive nature of plaintiff attorneys on claims in Florida.
Also, the Company recorded prior year loss reserve development of $5.3 million on a direct basis, $2.6 million on a net basis, for the six months ended June 30, 2018, reflecting strengthening of reserves for the fourth quarter 2016 storm, Hurricane Matthew. Reserve strengthening on Hurricane Matthew is based on our revised estimate to settle the remaining 78 open claims. The six months ended June 30, 2017 included prior period loss reserve development of $6.9 million on a direct basis ($1.2 million on a net basis), also primarily reflecting strengthening of reserves for the fourth quarter 2016 storm, Hurricane Matthew.
All other net losses and LAE were $158.5 million for the six months ended June 30, 2018, compared to $140.5 million during the same period in 2017. Our service company subsidiaries, particularly UAC, generated additional revenues servicing Hurricane Irma claims and during the six months ended June 30, 2018 generated $18.9 million of earnings which reduced amounts recorded as losses and LAE in 2018. This had a favorable effect on our underlying loss and LAE ratio of approximately 3.5 percentage points on a direct basis (or 5.0 percentage points on a net basis). The Company’s underlying loss and LAE ratio reflects continued geographic expansion into states outside of Florida where non-catastrophe loss ratios are generally higher than in Florida, as well as the marketplace dynamics inside of Florida including challenges faced when policyholders assign their policy benefits to third parties including the increased litigation from these claims.
General and administrative expenses were $122.6 million for the six months ended June 30, 2018, compared to $114.3 million during the same period in 2017 as follows (dollars in thousands):
|
|
Six Months Ended |
|
|
|
|
|
|
|
|
|
|||||||||||||
|
|
June 30, |
|
|
Change |
|
||||||||||||||||||
|
|
2018 |
|
|
2017 |
|
|
$ |
|
|
% |
|
||||||||||||
|
|
$ |
|
|
Ratio |
|
|
$ |
|
|
Ratio |
|
|
|
|
|
|
|
|
|
||||
|
Premiums earned, net |
$ |
374,849 |
|
|
|
|
|
|
$ |
330,568 |
|
|
|
|
|
|
$ |
44,281 |
|
|
|
13.4 |
% |
|
General and administrative expenses: |
|
|
|
|
|
|
|
|
|
|
|
|
|
|
|
|
|
|
|
|
|
|
|
|
Policy acquisition costs |
|
71,588 |
|
|
|
19.1 |
% |
|
|
65,450 |
|
|
|
19.8 |
% |
|
|
6,138 |
|
|
|
9.4 |
% |
|
Other operating costs |
|
50,816 |
|
|
|
13.6 |
% |
|
|
48,674 |
|
|
|
14.7 |
% |
|
|
2,142 |
|
|
|
4.4 |
% |
|
Interest expense |
|
169 |
|
|
|
— |
|
|
|
189 |
|
|
|
— |
|
|
|
(20 |
) |
|
|
(10.6 |
%) |
|
Total general and administrative expenses (1) |
$ |
122,573 |
|
|
|
32.7 |
% |
|
$ |
114,313 |
|
|
|
34.5 |
% |
|
$ |
8,260 |
|
|
|
7.2 |
% |
|
|
(1) |
Total general and administrative expense ratio does not include interest expense. |
42
The increase in general and administrative expenses of $8.3 million was primarily the result of increases in policy acquisition costs of $6.1 million, which were driven by increased premium volume and continued geographic expansion into states that have higher typical commission rates compared to our home state of Florida, and to a lesser extent due to an increase in other operating costs of $2.1 million. General and administrative expenses for the six months ended June 30, 2018 included a $6.5 million benefit (included within policy acquisition costs) related to a settlement of prior year premium tax audits with the Florida Department of Revenue, which reduced the expense ratio by 1.7 percentage points. Our underlying policy acquisition costs continued to be driven by increased premium volume and continued geographic expansion into states where the comparable commission rates are higher than Florida. Overall, the expense ratio (general and administrative expenses as a percentage of net earned premiums) benefited from economies of scale as general and administrative expenses did not increase at the same rate as revenues. As a result of the above items, the expense ratio decreased to 32.7% for the six months ended June 30, 2018 compared to 34.5% for the same period in 2017.
Income tax expense decreased by $7.9 million, or 22.8%, for the six months ended June 30, 2018, when compared with the six months ended June 30, 2017. Our effective tax rate decreased to 23.7% for the six months ended June 30, 2018, as compared to 36.4% for the six months ended June 30, 2017. The decrease in both income tax expense and our effective tax rate is primarily the result of the enactment of the Tax Act. The six months ended June 30, 2018 included a net credit to income tax expense of $2.3 million primarily driven by excess tax benefits resulting from stock-based awards that vested and/or were exercised during the six months ended June 30, 2018, thereby benefitting the six month ended June 30, 2018 effective tax rate by 2.0 percentage points. Discrete items for the six months ended June 30, 2017 included $0.8 million of excess tax benefit benefits resulting from stock-based awards that had vested and/or were exercised during that period and a credit to income tax expense of $1.2 million resulting from anticipated recoveries of income taxes paid from 2014 and 2015, thereby benefitting the six months ended June 30, 2017 effective tax rate by 1.9 percentage points. See “Item 1 – Note 9 (Income Taxes)” for an explanation of the change in our effective tax rates.
Other comprehensive loss, net of taxes for the six months ended June 30, 2018 was $5.9 million compared to other comprehensive income of $4.0 million for the same period in 2017. See “Item 1 — Note 11 (Other Comprehensive Income (Loss))” for additional information about the amounts comprising other comprehensive income and loss for these periods.
43
Analysis of Financial Condition—As of June 30, 2018 Compared to December 31, 2017
We believe that cash flows generated from operations will be sufficient to meet our working capital requirements for at least the next twelve months. Our policy is to invest amounts considered to be in excess of current working capital requirements.
The following table summarizes, by type, the carrying values of investments as of the dates presented (in thousands):
|
|
|
As of |
|
|||||
|
|
|
June 30, |
|
|
December 31, |
|
||
|
Type of Investment |
|
2018 |
|
|
2017 |
|
||
|
Available-for-sale debt securities |
|
$ |
656,762 |
|
|
$ |
639,334 |
|
|
Available-for-sale short-term investments |
|
|
— |
|
|
|
10,000 |
|
|
Equity securities |
|
|
70,866 |
|
|
|
62,215 |
|
|
Investment real estate, net |
|
|
19,539 |
|
|
|
18,474 |
|
|
Total |
|
$ |
747,167 |
|
|
$ |
730,023 |
|
See “Item 1 —Condensed Consolidated Statements of Cash Flows” for explanations of changes in investments.
Prepaid reinsurance premiums represent the portion of unearned ceded written premiums that will be earned pro-rata over the coverage period of our reinsurance program, which runs from June 1 to May 31 of the following year. The increase of $177.8 million to $310.6 million as of June 30, 2018 was due to additional ceded written premium of $338.9 million recorded this quarter for the reinsurance costs relating to our new 2018-2019 catastrophe reinsurance program beginning June 1, 2018 less amortization recorded during the period.
Reinsurance recoverable represents the estimated amount of losses and loss adjustment expenses that are recoverable from reinsurers. The decrease of $64.6 million to $117.9 million as of June 30, 2018 was primarily due to the settlement of amounts due from reinsurers for claims ceded to reinsurers relating to Hurricane Irma and to a lesser extent Hurricane Matthew.
Premiums receivable, net represents amounts receivable from policyholders. The increase in premiums receivable, net of $10.7 million to $67.2 million as of June 30, 2018 relates to both the growth in and seasonality of the Company’s business.
Deferred income tax assets and liabilities represent temporary differences between U.S. GAAP and the tax basis of the Company's assets and liabilities. During the six months ended June 30, 2018, deferred tax assets decreased by $9.1 million to $0.2 million, primarily due to an increase in deferred policy acquisition costs and an increase in ceded unearned premiums.
Deferred policy acquisition costs increased by $15.7 million to $88.8 million as of June 30, 2018, which is in line with the underlying premium growth. See “Item 1 — Note 5 (Insurance Operations)” for a roll-forward in the balance of our deferred policy acquisition costs.
Income taxes recoverable increased by $2.4 million to $11.8 million as of June 30, 2018, from $9.5 million as of December 31, 2017. The increase represents amounts due from taxing jurisdictions within one year and when income tax payments exceed income tax liabilities. Income taxes recoverable as of June 30, 2018 were $11.8 million, which represents amounts recoverable or to be applied to future periods for federal and state income taxes.
See “Item 1 — Note 6 (Liability for Unpaid Losses and Loss Adjustment Expenses)” for a roll-forward in the balance of our unpaid losses and loss adjustment expenses. Unpaid losses and loss adjustment expenses decreased by $96.5 million to $151.9 million as of June 30, 2018. The reduction in unpaid losses and loss adjustment expenses was principally due to the settlement of Hurricane Irma claims that were unpaid as of December 31, 2017, offset from losses incurred from weather related activity and other claims in 2018. Unpaid losses and loss adjustment expenses are net of estimated subrogation recoveries. The Company is continuing its initiatives to expedite claims payments including the ability of our mobile claims teams to rapidly settle certain claims, which we refer to as “Fast Track,” and pursuing the anticipated benefits from subrogation collections.
Unearned premiums represent the portion of direct written premium that will be earned pro rata in the future. The increase of $76.5 million to $608.9 million as of June 30, 2018 reflects both organic growth and seasonality of our business as described under “– Overview”.
Advance premium represents premium payments made by policyholders ahead of the effective date of the policies. The increase of $12.0 million to $38.2 million as of June 30, 2018 reflects both organic growth and seasonality of our business as described under “– Overview”.
44
Book overdrafts represent outstanding checks or drafts in excess of cash on deposit and are examined to determine if a legal right of offset exists for accounts within the same banking institution at each balance sheet date. The Company maintains a short-term cash investment sweep to maximize investment returns on cash balances. Due to sweep activities, certain outstanding items are recorded as book overdrafts which totaled $3.0 million as of June 30, 2018 compared to $36.7 million as of December 31, 2017. The decrease of $33.7 million is the result of higher cash balances available for offset as of June 30, 2018 and to a lesser amount less outstanding items as of June 30, 2018 compared to December 31, 2017 due to lower Hurricane Irma drafts outstanding.
Reinsurance payable, net represents the unpaid ceded written premiums owed to reinsurers in connection with the renewal of the Company’s 2018-2019 catastrophe reinsurance program on June 1, 2018, unpaid reinstatement premiums and cash advances received from reinsurers in connection with Hurricane Irma’s anticipated recoveries. The balance increased by $231.5 million to $341.9 million as of June 30, 2018 as a result of the above items. Ceded premiums for the 2018-2019 catastrophe reinsurance program are paid in installments over the June 1 to May 31 policy term.
Capital resources, net increased by $51.3 million and includes increases in stockholders’ equity of $52.0 million, offset by reduction in long-term debt of $0.7 million. The increases in stockholders’ equity was principally the result of $86.1 million of 2018 net income and $4.7 million of stock-based compensation, offset by $11.1 million in treasury stock purchases, and $15.4 million in dividends to shareholders. The reduction in long-term debt was the result of principal payments on debt during 2018. See “– Liquidity and Capital Resources” and “Item 1 – Note 8 (Stockholders’ Equity)” for explanation of changes in treasury stock.
Liquidity and Capital Resources
Liquidity
Liquidity is a measure of a company’s ability to generate sufficient cash flows to meet its short and long-term obligations. Funds generated from operations have been sufficient to meet our liquidity requirements and we expect that, in the future, funds from operations will continue to meet such requirements.
The balance of cash and cash equivalents as of June 30, 2018 was $311.1 million compared to $213.5 million at December 31, 2017. See “Item 1 — Condensed Consolidated Statements of Cash Flows” for a reconciliation of the balance of cash and cash equivalents between June 30, 2018 and December 31, 2017. The increase in cash and cash equivalents was driven by cash flows generated from operating activities in excess of those used for investing and financing activities. The Company maintains a short-term investment cash sweep to maximize investment returns on cash balances. Due to the sweep activities, certain outstanding items were recorded as “Book Overdraft” in the Consolidated Financial Statements. Cash and cash equivalents balances are available to settle book overdrafts, pay expenses and pay claims.
The balance of restricted cash and cash equivalents as of June 30, 2018 and December 31, 2017 includes cash equivalents on deposit with regulatory agencies in the various states in which our Insurance Entities do business.
Liquidity for UVE and its non-insurance subsidiaries is required to cover the payment of general operating expenses, dividends to shareholders (if and when authorized and declared by our Board of Directors), payment for the possible repurchase of our common stock (if and when authorized by our Board of Directors), payment of income taxes, and interest and principal payments on outstanding debt obligations, if any. The declaration and payment of future dividends by UVE to its shareholders, and any future repurchases of UVE common stock, will be at the discretion of our Board of Directors and will depend upon many factors, including our operating results, financial condition, debt covenants and any regulatory constraints. Principal sources of liquidity for UVE and its non-insurance subsidiaries include revenues generated from fees paid by the Insurance Entities to affiliated companies for policy administration, inspections and claims adjusting services. Additional sources of liquidity include brokerage commissions earned on reinsurance contracts and policy fees. UVE also maintains certain other investments, which are a source of ongoing interest and dividend income and would generate funds upon sale. As discussed in “Item 1 – Note 5 (Insurance Operations),” there are limitations on the dividends the Insurance Entities may pay to their immediate parent company, Universal Insurance Holding Company of Florida (“UVECF”).
The maximum amount of dividends that can be paid by Florida insurance companies without prior approval of the Commissioner of the FLOIR is subject to restrictions as referenced in “Item I – Note 5 – Insurance Operations.” During the six months ended June 30, 2018, the Insurance Entities did not pay dividends to UVECF. During 2017 UPCIC paid a $30 million dividend to UVECF.
Liquidity for the Insurance Entities is primarily required to cover payments for reinsurance premiums, claims payments including potential payments of catastrophe losses (offset by recovery of any reimbursement amounts under our reinsurance agreements), fees paid to affiliates for managing general agency services, inspections and claims adjusting services, agent commissions, premiums and income taxes, regulatory assessments, general operating expenses, and interest and principal payments on debt obligations. The principal source of liquidity for the Insurance Entities consists of the revenue generated from the collection of net premiums, interest and dividend income from the investment portfolio, the collection of reinsurance recoverable, and financing fees.
45
Our insurance operations provide liquidity in that premiums are generally received months or even years before losses are paid under the policies written. In the event of catastrophic events, many of the Company’s reinsurance agreements provide for “cash advance” whereby reinsurers advance or prepay amounts to the Company, providing liquidity, which the Company utilizes in the claim settlement process. In addition, the Insurance Entities maintain substantial investments in highly liquid, marketable securities, which would generate funds upon sale.
The Insurance Entities are responsible for losses related to catastrophic events in excess of coverage provided by the Insurance Entities’ reinsurance programs or retentions before the Company’s reinsurance protection commences. Also, the Insurance Entities are responsible for all other losses that otherwise may not be covered by the reinsurance programs and any amounts arising in the event of a reinsurer default. Losses or a reinsurer default may have a material adverse effect on either of the Insurance Entities or our business, financial condition, results of operations and liquidity.
Capital Resources
Capital resources provide protection for policyholders, furnish the financial strength to support the business of underwriting insurance risks, and facilitate continued business growth. The following table provides our stockholder equity, total long-term debt, total capital, debt-to-equity capital ratio and debt-to-equity ratio for the periods presented (dollars in thousands):
|
|
|
As of |
|
|||||
|
|
|
June 30, |
|
|
December 31, |
|
||
|
|
|
2018 |
|
|
2017 |
|
||
|
Stockholders' equity |
|
$ |
492,073 |
|
|
$ |
439,988 |
|
|
Total long-term debt |
|
|
12,132 |
|
|
|
12,868 |
|
|
Total capital |
|
$ |
504,205 |
|
|
$ |
452,856 |
|
|
|
|
|
|
|
|
|
|
|
|
Debt-to-total capital ratio |
|
|
2.4 |
% |
|
|
2.8 |
% |
|
Debt-to-equity ratio |
|
|
2.5 |
% |
|
|
2.9 |
% |
As described in our Form 10-K for the year ended December 31, 2017, UPCIC entered into a surplus note with the State Board of Administration of Florida under Florida’s Insurance Capital Build-Up Incentive Program on November 9, 2006. The surplus note has a twenty-year term, with quarterly payments of principal and interest that accrue per the terms of the note agreement. At June 30, 2018, UPCIC was in compliance with the terms of the surplus note. Total adjusted capital surplus, which includes the surplus note, was in excess of regulatory requirements for both UPCIC and APPCIC.
On September 5, 2017, our Board of Directors authorized the repurchase of up to $20 million of the Company’s outstanding common stock through December 31, 2018. The Company may repurchase shares from time to time at its discretion, based on ongoing assessments of the capital needs of the Company, the market price of its common stock and general market conditions. The Company will fund the share repurchase program with cash from operations.
During the six months ended June 30, 2018, we repurchased an aggregate of 342,749 shares of UVE’s common stock in the open market at an aggregate cost of $11.1 million. Also, see “Part II, Item 2 — Unregistered Sales of Equity Securities and Use of Proceeds” for share repurchase activity during the three months ended June 30, 2018.
Cash Dividends
The following table summarizes the dividends declared by the Company:
|
|
|
Dividend |
|
Shareholders |
|
Dividend |
|
Cash Dividend |
|
|
|
2018 |
|
Declared Date |
|
Record Date |
|
Payable Date |
|
Per Share Amount |
|
|
|
First Quarter |
|
January 22, 2018 |
|
February 28, 2018 |
|
March 12, 2018 |
|
$ |
0.14 |
|
|
Second Quarter |
|
April 12, 2018 |
|
April 27, 2018 |
|
May 4, 2018 |
|
$ |
0.14 |
|
|
Third Quarter |
|
May 29, 2018 |
|
July 2, 2018 |
|
July 16, 2018 |
|
$ |
0.16 |
|
46
The following table represents our contractual obligations for which cash flows are fixed or determinable as of June 30, 2018 (in thousands):
|
|
|
|
|
|
Less than |
|
|
|
|
|
|
|
|
|
|
Over |
|
||
|
|
Total |
|
|
1 year |
|
|
1-3 years |
|
|
3-5 years |
|
|
5 years |
|
|||||
|
Unpaid losses and LAE, direct (1) |
$ |
151,916 |
|
|
$ |
77,477 |
|
|
$ |
43,904 |
|
|
$ |
23,851 |
|
|
$ |
6,684 |
|
|
Long-term debt |
|
13,561 |
|
|
|
1,347 |
|
|
|
5,160 |
|
|
|
3,237 |
|
|
|
3,817 |
|
|
Total contractual obligations |
$ |
165,477 |
|
|
$ |
78,824 |
|
|
$ |
49,064 |
|
|
$ |
27,088 |
|
|
$ |
10,501 |
|
|
(1) |
There are generally no notional or stated amounts related to unpaid losses and LAE. Both the amounts and timing of future loss and LAE payments are estimates and subject to the inherent variability of legal and market conditions affecting the obligations and make the timing of cash outflows uncertain. The ultimate amount and timing of unpaid losses and LAE could differ materially from the amounts in the table above. Further, the unpaid losses and LAE do not represent all the obligations that will arise under the contracts, but rather only the estimated liability incurred through June 30, 2018. |
Critical Accounting Policies and Estimates
Other than as disclosed in “Item 1 — Note 2 (Significant Accounting Policies),” there have been no material changes during the period covered by this Quarterly Report on Form 10-Q to Critical Accounting Policies and Estimates previously disclosed in Part II, Item 7, “Management’s Discussion and Analysis of Financial Condition and Results of Operations” included in our Annual Report on Form 10-K for the year ended December 31, 2017.
Recent Accounting Pronouncements Not Yet Adopted
In June 2016, the Financial Accounting Standards Board (“FASB”) revised U.S. GAAP with the issuance of Accounting Standards Update (“ASU”) 2016-13, Financial Instruments -Credit Losses (Topic 326) that introduces a new process for recognizing credit losses on financial instruments based on an estimate of current expected credit losses. The new ASU will apply to: 1) loans, accounts receivable, trade receivables, and other financial assets measured at amortized cost, 2) loan commitments and certain other off-balance sheet credit exposures, 3) debt securities and other financial assets measured at fair value through other comprehensive income, and 4) beneficial interests in securitized financial assets. The ASU changes the current practice of recording a permanent write down, (other than temporary impairment), for probable credit losses, which is more restrictive than the new ASU requirement that would estimate credit losses, then recorded through a temporary allowance account that can be re-measured as estimated credit losses change. The ASU further limited estimated credit losses relating to available for sale securities to the amount which fair value is below amortized cost. The ASU is effective for fiscal years beginning after December 15, 2019, including interim periods within those fiscal years. We are currently evaluating the impact that this standard will have on our consolidated financial statements.
In March 2017, FASB revised U.S. GAAP with the issuance of ASU 2017-08, Receivables – Nonrefundable Fees and Other Costs to amend the amortization period for certain purchased callable debt securities held at a premium. Current U.S. GAAP excludes certain callable debt securities from consideration of early repayment of principal even if the holder is certain that the call will be exercised. The new ASU shortens the amortization period of certain purchased callable debt securities to the earliest call date. The ASU is effective for fiscal years beginning after December 15, 2018, including interim periods within those fiscal years. Early adoption is permitted. Under the current U.S. GAAP, you could consider the call dates and estimate if you had a large number of similar securities and you were basing your judgment on actual experience. Our service provider (who processes the accounting for our investment transactions) has many similar securities on their system and can make that type of determination. As a result, we currently account for the amortization under the proposed ASU and there will be no impact to our results of operations, financial position or liquidity.
Item 3. Quantitative and Qualitative Disclosures about Market Risk
Market risk is the potential for economic losses due to adverse changes in fair value of available-for-sale debt securities, available-for-sale short-term investments and equity securities (“Financial Instruments”) and investment real estate. We carry all of our Financial Instruments at market value and investment real estate at net book value in our statement of financial condition. Our investment portfolio as of June 30, 2018 is comprised of available-for-sale debt securities and equities securities, which expose us to changes in interest rates and equity prices.
The primary objectives of the investment portfolio are the preservation of capital and providing adequate liquidity for claims payments and other cash needs. The portfolio’s secondary investment objective is to provide a total rate of return with an emphasis on investment income. None of our investments in risk-sensitive Financial Instruments were entered into for trading purposes.
See “Item 1 – Note 3 (Investments)” for more information about our Financial Instruments.
47
Interest rate risk is the sensitivity of a fixed-rate Financial Instrument to changes in interest rates. Generally, when interest rates rise, the fair value of our fixed-rate Financial Instruments declines.
The following table provides information about our fixed income Financial Instruments, which are sensitive to changes in interest rates. The table presents cash flows of principal amounts and related weighted average interest rates by expected maturity dates for Financial Instruments available for sale as of the dates presented (in thousands):
|
|
June 30, 2018 |
|
|||||||||||||||||||||||||||||||||
|
|
Amortized Cost |
|
|
Fair Value |
|
||||||||||||||||||||||||||||||
|
|
2018 |
|
|
2019 |
|
|
2020 |
|
|
2021 |
|
|
2022 |
|
|
Thereafter |
|
|
Other (1) |
|
|
Total |
|
|
Total |
|
|||||||||
|
Fixed income Financial Instruments |
$ |
12,530 |
|
|
$ |
77,593 |
|
|
$ |
54,579 |
|
|
$ |
66,940 |
|
|
$ |
23,587 |
|
|
$ |
179,385 |
|
|
$ |
254,254 |
|
|
$ |
668,868 |
|
|
$ |
656,762 |
|
|
Weighted average interest rate |
|
1.81 |
% |
|
|
1.76 |
% |
|
|
2.04 |
% |
|
|
2.15 |
% |
|
|
2.46 |
% |
|
|
3.53 |
% |
|
|
3.22 |
% |
|
|
2.88 |
% |
|
|
2.88 |
% |
|
|
|
|
|
|
|
|
|
|
|
|
|
|
|
|
|
|
|
|
|
|
|
|
|
|
|
|
|
|
|
|
|
|
|
|
|
|
|
December 31, 2017 |
|
|||||||||||||||||||||||||||||||||
|
|
Amortized Cost |
|
|
Fair Value |
|
||||||||||||||||||||||||||||||
|
|
2018 |
|
|
2019 |
|
|
2020 |
|
|
2021 |
|
|
2022 |
|
|
Thereafter |
|
|
Other (1) |
|
|
Total |
|
|
Total |
|
|||||||||
|
Fixed income Financial Instruments |
$ |
51,846 |
|
|
$ |
85,309 |
|
|
$ |
61,215 |
|
|
$ |
60,968 |
|
|
$ |
27,832 |
|
|
$ |
132,530 |
|
|
$ |
234,015 |
|
|
$ |
653,715 |
|
|
$ |
649,334 |
|
|
Weighted average interest rate |
|
1.87 |
% |
|
|
1.82 |
% |
|
|
2.18 |
% |
|
|
2.16 |
% |
|
|
2.76 |
% |
|
|
4.02 |
% |
|
|
3.08 |
% |
|
|
2.83 |
% |
|
|
2.83 |
% |
|
(1) |
Comprised of mortgage-backed and asset-backed securities which have multiple maturity dates, and perpetual maturity securities, and are presented separately for the purposes of this table. |
The tables above represent average contract rates that differ from the book yield of the available-for-sale debt securities. The fixed income Financial Instruments in our available for sale portfolio are comprised of United States government and agency securities, corporate bonds, municipal bonds, redeemable preferred stock, mortgage-backed and asset-backed securities and certificates of deposit. Duration is a measure of interest rate sensitivity expressed as a number of years. The weighted average duration of the fixed income Financial Instruments in our available for sale portfolio at June 30, 2018 was 2.8 years.
To a lesser extent, we also have exposure to interest on our debt obligation which is in the form of a surplus note. The surplus note accrues interest at an adjustable rate based on the 10-year Constant Maturity Treasury rate.
Equity Price Risk
Equity price risk is the potential for loss in fair value of Financial Instruments in common stock and mutual funds from adverse changes in the prices of those Financial Instruments.
The following table provides information about the Financial Instruments in our investment portfolio subject to price risk as of the dates presented (in thousands):
|
|
June 30, 2018 |
|
|
December 31, 2017 |
|
||||||||||
|
|
Fair Value |
|
|
Percent |
|
|
Fair Value |
|
|
Percent |
|
||||
|
Equity Securities: |
|
|
|
|
|
|
|
|
|
|
|
|
|
|
|
|
Common stock |
$ |
22,320 |
|
|
|
31.5 |
% |
|
$ |
18,811 |
|
|
|
30.2 |
% |
|
Mutual funds |
|
48,546 |
|
|
|
68.5 |
% |
|
|
43,404 |
|
|
|
69.8 |
% |
|
Total equity securities |
$ |
70,866 |
|
|
|
100.0 |
% |
|
$ |
62,215 |
|
|
|
100.0 |
% |
A hypothetical decrease of 20% in the market prices of each of the equity securities held at June 30, 2018 and December 31, 2017 would have resulted in a decrease of $14.2 million and $12.4 million, respectively, in the fair value of those securities.
48
Item 4. Controls and Procedures
Evaluation of Disclosure Controls and Procedures
The Company carried out an evaluation under the supervision and with the participation of the Company’s management, including the Company’s Chief Executive Officer and Chief Financial Officer, of the effectiveness of the design and operation of the Company’s disclosure controls and procedures pursuant to Rule 13a-15 under the Securities Exchange Act of 1934 as of the end of the period covered by this report. Based on that evaluation, the Company’s Chief Executive Officer and Chief Financial Officer have concluded that disclosure controls and procedures were effective as of June 30, 2018, to ensure that information required to be disclosed by the Company in its reports that it files or submits under the Securities Exchange Act of 1934 is recorded, processed, summarized and reported within the time periods specified in the SEC’s rules and forms and that information required to be disclosed by the Company in the reports that it files or submits under the Securities Exchange Act of 1934 is accumulated and communicated to the Company’s management, including its principal executive and principal financial officers as appropriate, to allow timely decisions regarding required disclosure.
Changes in Internal Control Over Financial Reporting
There was no change in the Company’s internal controls over financial reporting that occurred during the period covered by this report that has materially affected, or is reasonably likely to materially affect, the Company’s internal control over financial reporting.
Lawsuits are filed against the Company from time to time. Many of these lawsuits involve claims under policies that we underwrite and reserve for as an insurer. We are also involved in various other legal proceedings and litigation unrelated to claims under our policies that arise in the ordinary course of business operations. Management believes that any liabilities that may arise as a result of these legal matters will not have a material adverse effect on our financial condition or results of operations. The Company contests liability and/or the amount of damages as appropriate in each pending matter.
In accordance with applicable accounting guidance, the Company establishes an accrued liability for legal matters when those matters present loss contingencies that are both probable and estimable.
Legal proceedings are subject to many uncertain factors that generally cannot be predicted with assurance, and the Company may be exposed to losses in excess of any amounts accrued. The Company currently estimates that the reasonably possible losses for legal proceedings, whether in excess of a related accrued liability or where there is no accrued liability, and for which the Company is able to estimate a possible loss, are immaterial. This represents management’s estimate of possible loss with respect to these matters and is based on currently available information. These estimates of possible loss do not represent our maximum loss exposure, and actual results may vary significantly from current estimates.
49
There have been no material changes during the period covered by this Quarterly Report on Form 10-Q to the risk factors previously disclosed in Part I, Item 1A, “Risk Factors,” included in the Company’s Annual Report on Form 10-K for the year ended December 31, 2017.
Item 2. Unregistered Sales of Equity Securities and Use of Proceeds
The table below presents our purchases of UVE common stock during the three months ended June 30, 2018.
|
|
|
|
|
|
|
|
|
|
Total Number of |
|
|
Maximum Number |
|
||
|
|
|
|
|
|
|
|
|
|
Shares Purchased |
|
|
of Shares That |
|
||
|
|
|
|
|
|
|
|
|
|
As Part of |
|
|
May Yet be |
|
||
|
|
|
|
|
|
|
|
|
|
Publicly |
|
|
Purchased Under |
|
||
|
|
Total Number of |
|
|
Average Price |
|
|
Announced |
|
|
the Plans or |
|
||||
|
|
Shares Purchased |
|
|
Paid per Share (1) |
|
|
Plans or Programs |
|
|
Programs (2) |
|
||||
|
4/1/18 - 4/30/18 |
|
40,000 |
|
|
$ |
32.91 |
|
|
|
40,000 |
|
|
|
— |
|
|
5/1/18 - 5/31/18 |
|
200,000 |
|
|
$ |
33.46 |
|
|
|
200,000 |
|
|
|
— |
|
|
6/1/18 - 6/30/18 |
|
10,000 |
|
|
$ |
35.41 |
|
|
|
10,000 |
|
|
|
247,436 |
|
|
Total |
|
250,000 |
|
|
$ |
33.45 |
|
|
|
250,000 |
|
|
|
247,436 |
|
|
(1) |
Average price paid per share does not reflect brokerage commissions paid to acquire shares in open market transactions. |
|
(2) |
Number of shares was calculated using a closing price at June 29, 2018 of $35.10 per share. |
We may repurchase shares from time to time at our discretion, based on ongoing assessments of our capital needs, the market price of our common stock and general market conditions. The Company will fund the share repurchase program with cash from operations.
In September 2017, our Board of Directors approved a share repurchase program authorizing us to purchase up to $20 million of our outstanding common stock in the open market in compliance with Rule 10b-18 under the Securities Exchange Act of 1934, as amended, through December 31, 2018.
Since September 2017, we repurchased 350,941 shares of our common stock pursuant to this program through June 30, 2018 at an aggregate cost of approximately $11.3 million.
50
|
Exhibit No. |
|
Exhibit |
|
|
|
|
|
15.1 |
|
|
|
|
|
|
|
31.1 |
|
Certification of Chief Executive Officer Pursuant to Section 302 of the Sarbanes-Oxley Act of 2002 |
|
|
|
|
|
31.2 |
|
Certification of Chief Financial Officer Pursuant to Section 302 of the Sarbanes-Oxley Act of 2002 |
|
|
|
|
|
32 |
|
|
|
|
|
|
|
101.INS-XBRL |
|
Instance Document |
|
|
|
|
|
101.SCH-XBRL |
|
Taxonomy Extension Schema Document |
|
|
|
|
|
101.CAL-XBRL |
|
Taxonomy Extension Calculation Linkbase Document |
|
|
|
|
|
101.DEF-XBRL |
|
Taxonomy Extension Definition Linkbase Document |
|
|
|
|
|
101.LAB-XBRL |
|
Taxonomy Extension Label Linkbase Document |
|
|
|
|
|
101.PRE-XBRL |
|
Taxonomy Extension Presentation Linkbase Document |
51
Pursuant to the requirements of the Securities Exchange Act of 1934, the registrant has duly caused this report to be signed on its behalf by the undersigned, thereunto duly authorized.
|
|
|
|
|
|
UNIVERSAL INSURANCE HOLDINGS, INC. |
|
|
|
|
|
|
|
|
Date: July 27, 2018 |
|
|
|
|
/s/ Sean P. Downes |
|
|
|
|
|
|
Sean P. Downes, Chief Executive Officer and Principal Executive Officer |
|
|
|
|
|
|
|
|
Date: July 27, 2018 |
|
|
|
|
/s/ Frank C. Wilcox |
|
|
|
|
|
|
Frank C. Wilcox, Chief Financial Officer and Principal Accounting Officer |
52