Attached files
| file | filename |
|---|---|
| EX-99.2 - EXHIBIT 99.2 - PACIFIC MERCANTILE BANCORP | ex992pmbcinvestordeckprjul.htm |
| 8-K - 8-K - PACIFIC MERCANTILE BANCORP | pmbcinvestordeckjuly20188k.htm |
J u l y 2 0 1 8 I N V E S TO R P R E S E N TAT I O N

FORWARD LOOKING STATEMENTS This presentation contains statements regarding our expectations, beliefs and views about our future financial performance and our business, trends and expectations regarding the markets in which we operate, and our future plans. Those statements constitute “forward-looking statements” within the meaning of Section 27A of the Securities Act of 1933, as amended, and Section 21E of the Securities Exchange Act of 1934, as amended, can be identified by the fact that they do not relate strictly to historical or current facts. Often, they include words such as “believe,” “expect,” “anticipate,” “intend,” “plan,” “estimate,” “project,” or words of similar meaning, or future or conditional verbs such as “will,” “would,” “should,” “could,” or “may”. Forward-looking statements are based on current information available to us and our assumptions about future events over which we do not have control. Moreover, our business and our markets are subject to a number of risks and uncertainties which could cause our actual financial performance in the future, and the future performance of our markets (which can affect both our financial performance and the market prices of our shares), to differ, possibly materially, from our expectations as set forth in the forward-looking statements contained in this presentation. In addition to the risk of incurring loan losses, which is an inherent risk of the banking business, these risks and uncertainties include, but are not limited to, the following: the risk that the economic recovery in the United States, which is still relatively fragile, will be adversely affected by domestic or international economic conditions, which could cause us to incur additional loan losses and adversely affect our results of operations in the future; the risk that our results of operations in the future will continue to be adversely affected by our exit from the wholesale residential mortgage lending business and the risk that our commercial banking business will not generate the additional revenues needed to fully offset the decline in our mortgage banking revenues within the next two to three years; the risk that our interest margins and, therefore, our net interest income will be adversely affected by changes in prevailing interest rates; the risk that we will not succeed in further reducing our remaining nonperforming assets, in which event we would face the prospect of further loan charge-offs and write-downs of other real estate owned and would continue to incur expenses associated with the management and disposition of those assets; the risk that we will not be able to manage our interest rate risks effectively, in which event our operating results could be harmed; the prospect that government regulation of banking and other financial services organizations will increase, causing our costs of doing business to increase and restricting our ability to take advantage of business and growth opportunities. Additional information regarding these and other risks and uncertainties to which our business is subject are contained in our Annual Report on Form 10-K for the year ended December 31, 2017 which is on file with the SEC as well as subsequent Quarterly Reports on Form 10-Q that we file with the SEC. Due to these and other risks and uncertainties to which our business is subject, you are cautioned not to place undue reliance on the forward-looking statements contained in this news release, which speak only as of its date, or to make predictions about our future financial performance based solely on our historical financial performance. We disclaim any obligation to update or revise any of the forward-looking statements as a result of new information, future events or otherwise, except as may be required by law. 2
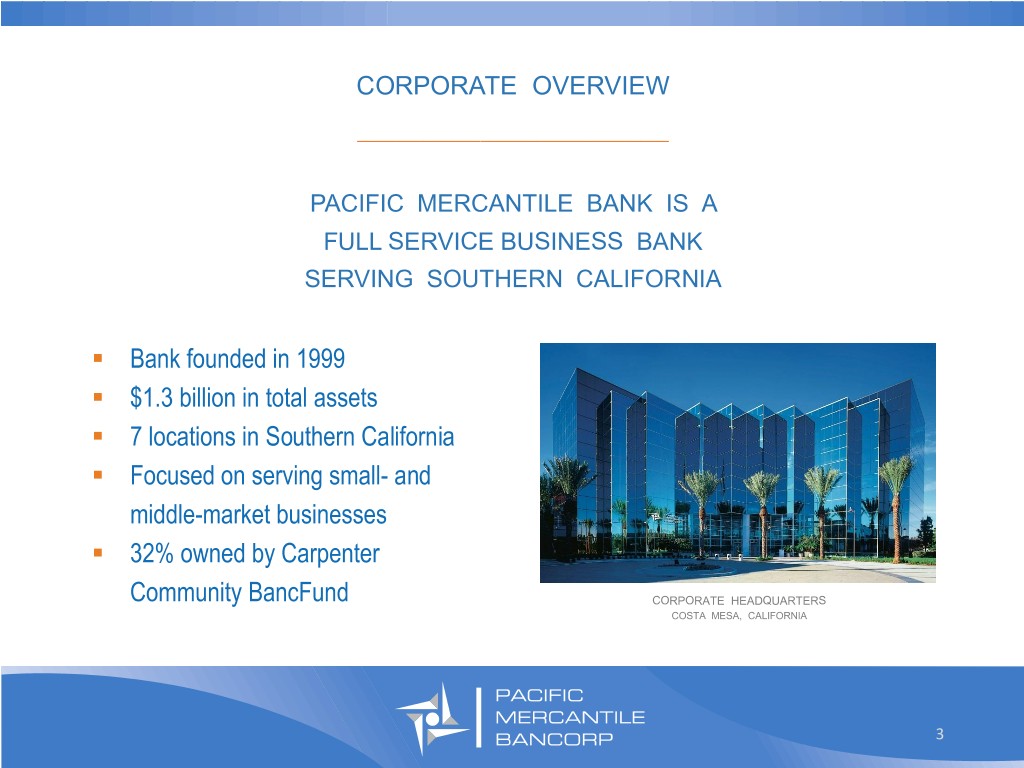
CORPORATE OVERVIEW _________________________________ PACIFIC MERCANTILE BANK IS A FULL SERVICE BUSINESS BANK SERVING SOUTHERN CALIFORNIA . Bank founded in 1999 . $1.3 billion in total assets . 7 locations in Southern California . Focused on serving small- and middle-market businesses . 32% owned by Carpenter Community BancFund CORPORATE HEADQUARTERS COSTA MESA, CALIFORNIA 3

OFFICE LOCATIONS _________________________________ NEWPORT BEACH CENTURY CITY IRVINE SPECTRUM COSTA MESA LA HABRA ONTARIO SAN DIEGO 4

MARKET POSITIONING _________________________________ Differentiating Strategy to Target Business Clients “We Help Companies Succeed” Small- to Medium- Horizon Service/Products Sized Businesses Analytics • Customized Commercial • Need for financial Loans guidance • Financial analysis • Asset Based Lending • Limited internal • Business planning • Owner Occupied RE financial sophistication • Modeling and • Treasury Management • Limited outside forecasting • Value driven pricing advisory support • Balance sheet management Approximately 70% of new relationships being brought into the Bank are C&I operating companies 5
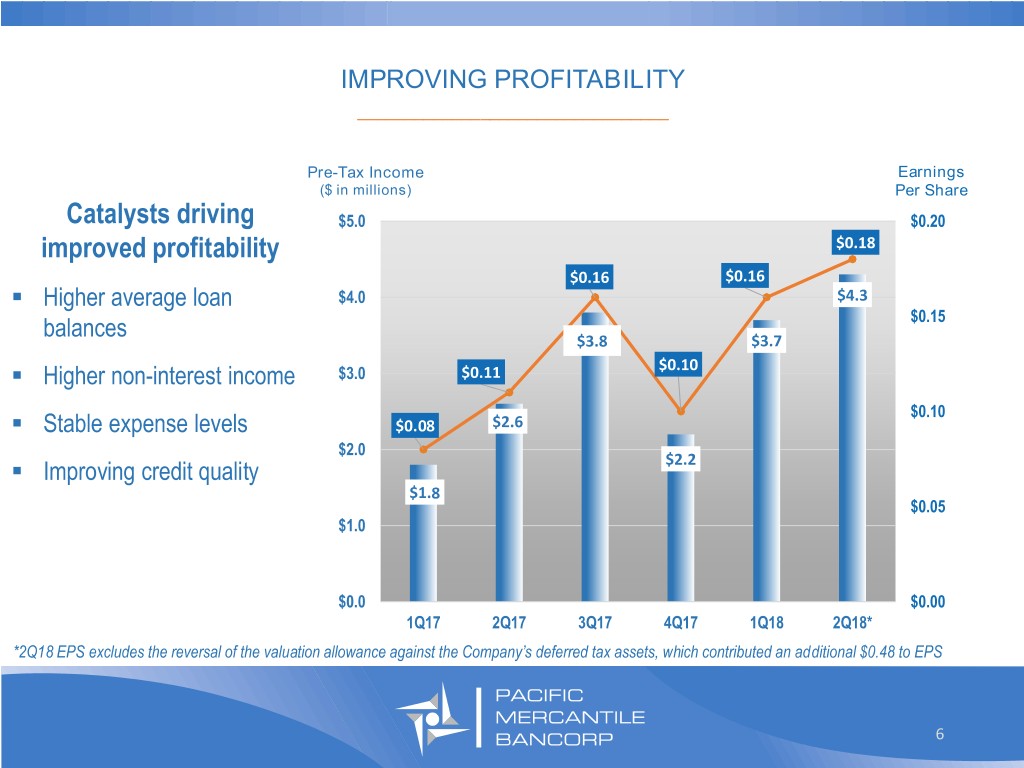
IMPROVING PROFITABILITY _________________________________ Pre-Tax Income Earnings ($ in millions) Per Share Catalysts driving $5.0 $0.20 improved profitability $0.18 $0.16 $0.16 . Higher average loan $4.0 $4.3 balances $0.15 $3.8 $3.7 . Higher non-interest income $3.0 $0.11 $0.10 . $0.10 Stable expense levels $0.08 $2.6 $2.0 . Improving credit quality $2.2 $1.8 $0.05 $1.0 $0.0 $0.00 1Q17 2Q17 3Q17 4Q17 1Q18 2Q18* *2Q18 EPS excludes the reversal of the valuation allowance against the Company’s deferred tax assets, which contributed an additional $0.48 to EPS 6
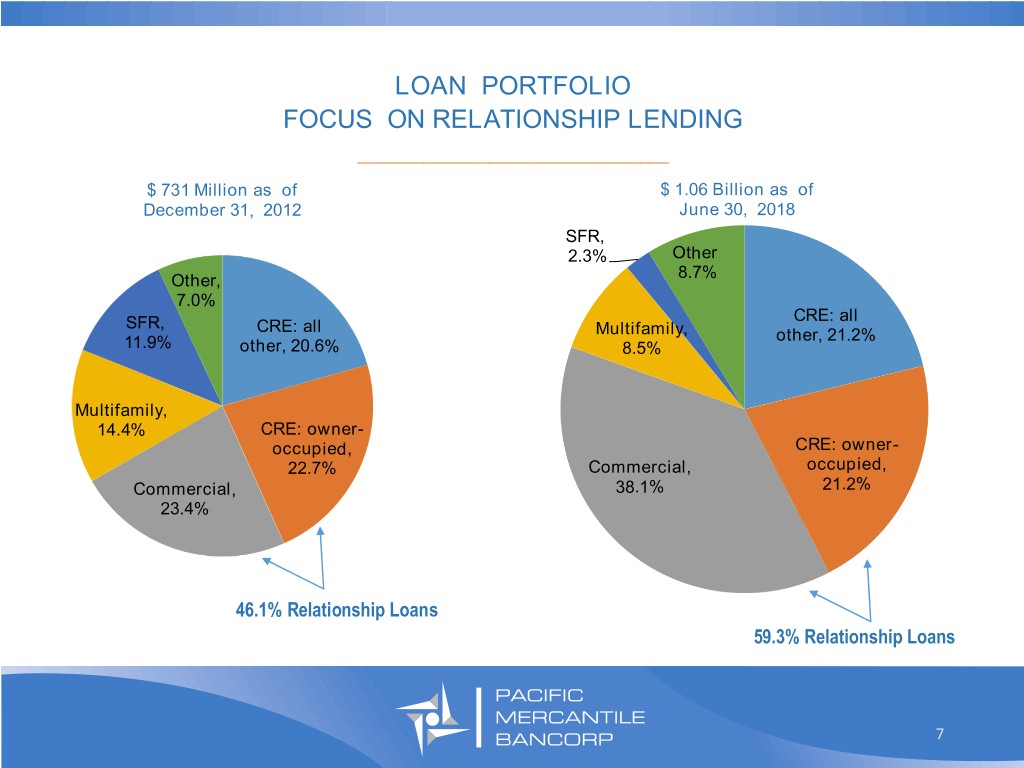
LOAN PORTFOLIO FOCUS ON RELATIONSHIP LENDING _________________________________ $ 731 Million as of $ 1.06 Billion as of December 31, 2012 June 30, 2018 SFR, 2.3% Other Other, 8.7% 7.0% CRE: all SFR, CRE: all Multifamily, other, 21.2% 11.9% other, 20.6% 8.5% Multifamily, 14.4% CRE: owner- occupied, CRE: owner- 22.7% Commercial, occupied, Commercial, 38.1% 21.2% 23.4% 46.1% Relationship Loans 59.3% Relationship Loans 7

LOAN PRODUCTION TRENDS _________________________________ . Branch repositioning strategy has put more of the staff in business development roles . Better sales execution and leveraging the competitive advantages of Horizon Analytics . Growth in core portfolios (C&I and owner-occupied CRE) offset by runoff in non-core portfolios New Loan C&I Total Loans Outstanding Commitments Line Utilization ($ in millions) ($ in millions) $200.0 80% $1,100 12.5% Loan Growth 75% in 2017 $150.0 70% $1,064 $122.4 64.1% $1,060 63.2% 62.9% 65% $1,059 59.3% 59.4% $100.0 60% $1,050 $80.0 $1,042 $1,040 $70.6 $60.1 55% $50.0 $32.6 50% 45% $0.0 40% $1,000 2Q17 3Q17 4Q17 1Q18 2Q18 6/30/17 9/30/17 12/31/17 3/31/18 6/30/18 8

C&I Driving Loan Growth _________________________________ . Focus on operating companies driving growth in C&I loan portfolio . Intentional run-off of investor-owned CRE, multi-family and construction loans impacting total loan growth Total C&I Loans Outstanding All Other Loans Outstanding ($ in millions) ($ in millions) $450 $700 10.2% C&I Loan Growth $676 $676 Over Past 12 Months $403 $670 $664 $400 $394 $396 $656 $650 $366 $364 $350 $300 $600 6/30/17 9/30/17 12/31/17 3/31/18 6/30/18 6/30/17 9/30/17 12/31/17 3/31/18 6/30/18 9

ASSET QUALITY _________________________________ . Complete overhaul of credit administration in the first half of 2016 . New CCO implemented improved loan monitoring and underwriting standards . Comprehensive credit review resulted in significant credit downgrades in 3Q16 . Substantial reduction in problem assets in 2017-2018 Classified Assets Total Non-Performing Loans ($ in millions) ($ in millions) $40.0 $25 $22.4 $31.6 $20 $30.0 $15 $20.6 $19.1 $20.0 $10.3 $14.8 $12.9 $10 $6.4 $6.8 $10.0 $5.3 $5 $0.0 $0 6/30/17 9/30/17 12/31/17 3/31/18 6/30/18 6/30/17 9/30/17 12/31/17 3/31/18 6/30/18 10

DEPOSIT COMPOSITION FOCUSED ON CORE DEPOSITS _________________________________ Core Deposits as a Percentage of Total Deposits $1.17 Billion as of June 30, 2018 80.0% 74.2% 75.0% 73.0% 68.6% 68.3% 70.0% Certificates of Deposit Non-interest 65.0% bearing 60.6% 27.0% 29.4% 60.0% 55.0% 51.5% Interest 50.0% checking Savings/Money 5.3% 45.0% 43.1% Market 38.3% 40.0% 12/31/12 12/31/13 12/31/14 12/31/15 12/31/16 12/31/17 6/30/18 11

WELL POSITIONED FOR HIGHER INTEREST RATES _________________________________ Earnings Sensitivity: Change in NII ($ in millions) . $25 Fed looking to raise rates by 50-100 basis points in $20.0 2018 $20 Year 1 Year 2 . Conservative asset $14.9 $16.0 sensitive position reflects $15 loan portfolio consisting $12.0 of short duration C&I and $9.8 RE loans $10 . $8.0 High proportion of DDA $4.8 and core deposit funding $5 $4.0 $0 Base +100 bps +200 bps +300 bps +400 bps 12
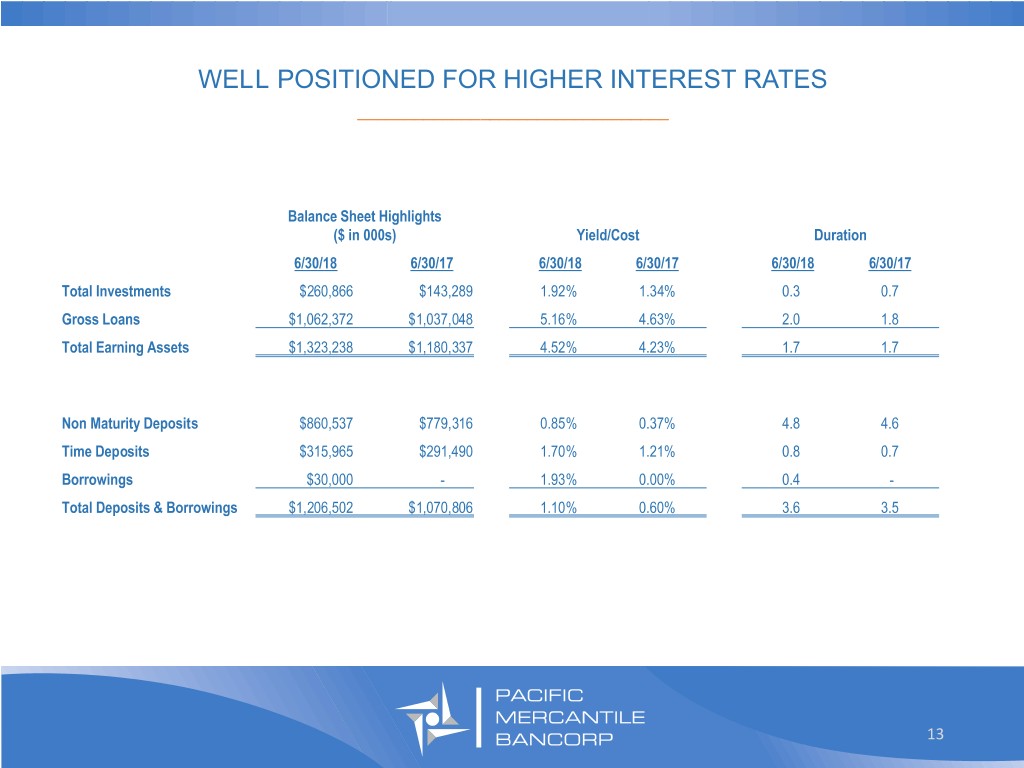
WELL POSITIONED FOR HIGHER INTEREST RATES _________________________________ Balance Sheet Highlights ($ in 000s) Yield/Cost Duration 6/30/18 6/30/17 6/30/18 6/30/17 6/30/18 6/30/17 Total Investments $260,866 $143,289 1.92% 1.34% 0.3 0.7 Gross Loans $1,062,372 $1,037,048 5.16% 4.63% 2.0 1.8 Total Earning Assets $1,323,238 $1,180,337 4.52% 4.23% 1.7 1.7 Non Maturity Deposits $860,537 $779,316 0.85% 0.37% 4.8 4.6 Time Deposits $315,965 $291,490 1.70% 1.21% 0.8 0.7 Borrowings $30,000 - 1.93% 0.00% 0.4 - Total Deposits & Borrowings $1,206,502 $1,070,806 1.10% 0.60% 3.6 3.5 13

Improving Operating Leverage _________________________________ Efficiency Ratio 100% 97.5% 94.7% 90% 1H18 vs. 1H17 . Revenue up 17.3% . Non-interest expense up 1.9% 80% 78.5% 72.0% 70% 68.5% 60% 2015 2016 2017 1Q18 2Q18 14
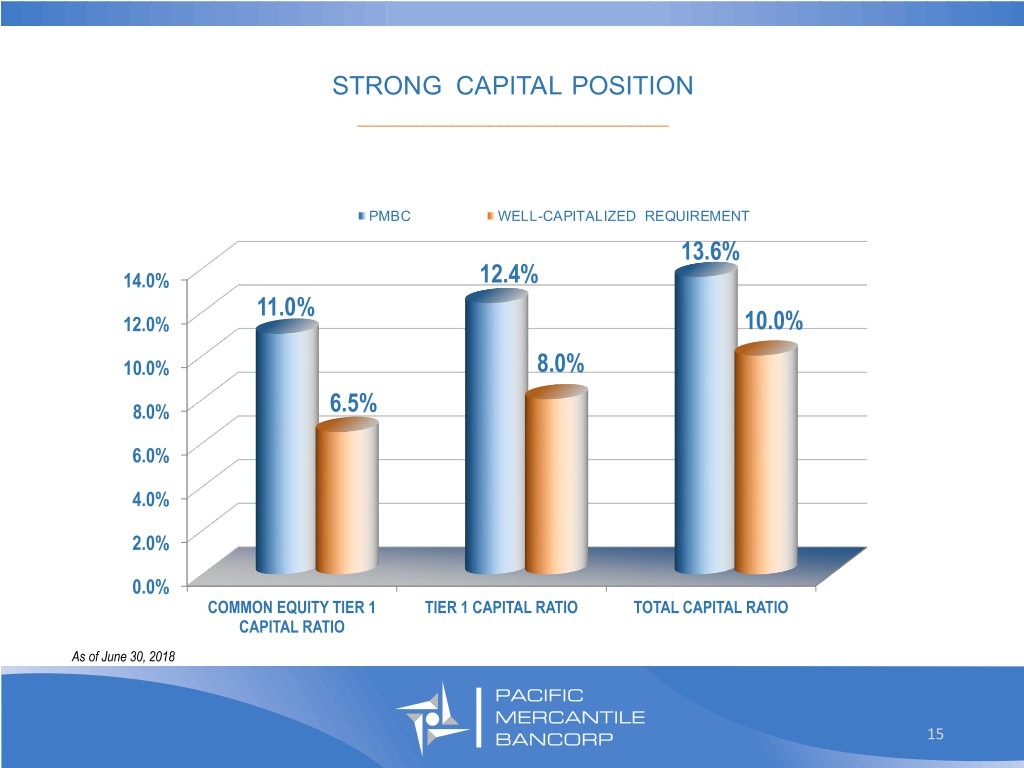
STRONG CAPITAL POSITION _________________________________ PMBC WELL-CAPITALIZED REQUIREMENT 13.6% 14.0% 12.4% 11.0% 12.0% 10.0% 10.0% 8.0% 8.0% 6.5% 6.0% 4.0% 2.0% 0.0% COMMON EQUITY TIER 1 TIER 1 CAPITAL RATIO TOTAL CAPITAL RATIO CAPITAL RATIO As of June 30, 2018 15

OUTLOOK _________________________________ Continued strong commercial loan growth . Runoff from non-core loan portfolios will impact total loan growth Enhancing focus on core deposit gathering . Targeting improvement in deposit mix and reduced cost of funds Increasing net interest margin . Well positioned to benefit from rising interest rates Higher non-interest income . New business clients using more treasury management products Modest expense growth . Continued improvement in efficiency ratio Stable credit quality with manageable credit costs Leading to steady increase in profitability 16

I n v e s t o r R e l a t i o n s : C u r t C h r i s t i a n s s e n ( 7 1 4 ) 4 3 8 - 2 5 3 1 C u r t . c h r i s t i a n s s e n @ p m b a n k . c o m 17
