Attached files
| file | filename |
|---|---|
| 8-K - 8-K - KKR & Co. Inc. | q218earningsreleasewrapper.htm |
KKR & Co. Inc. Reports Second Quarter 2018 Results
__________________________________________________________________________________________________________________________________________________________________________
NEW YORK, July 26, 2018 - KKR & Co. Inc. (NYSE: KKR) today reported its second quarter 2018 results.
GAAP net income (loss) attributable to KKR & Co. L.P. common unitholders was $680.4 million and $850.5 million, respectively, for the quarter and six months ended June 30, 2018. On a diluted basis, net income (loss) per common unit was $1.24 and $1.57, respectively, for the quarter and six months ended June 30, 2018. GAAP KKR & Co. L.P. Capital - Common Unitholders equity was $7.9 billion (1) as of June 30, 2018, or $15.09 per outstanding common unit.
After-tax Distributable Earnings(2) and After-tax Distributable Earnings Per Share(3) were $404.7 million and $0.49, respectively, for the quarter ended June 30, 2018. After-tax Distributable Earnings and After-tax Distributable Earnings Per Share were $640.4 million and $0.77, respectively, for the six months ended June 30, 2018.
Highlights
• | KKR’s conversion from a limited partnership to a corporation (the "Conversion") became effective July 1, 2018. |
• | After-tax Distributable Earnings per share were $0.49 for the quarter ended June 30, 2018 compared to $0.29 for the quarter ended March 31, 2018 and $0.34 for the quarter ended June 30, 2017. |
• | As of June 30, 2018, Assets Under Management were $191 billion, up 29% compared to June 30, 2017, as organic new capital raised totaled $40 billion over the past twelve months. |
• | The previously announced FS Investments transaction closed on April 9, 2018. Together with Corporate Capital Trust (NYSE: CCT), our business development company ("BDC") platform has over $17 billion in combined assets under management. |
• | Book value was $12.9 billion as of June 30, 2018 or $15.59 per outstanding adjusted share. |
___________________________
“On July 1st, we completed our conversion from a partnership to a corporation. We believe this decision, designed to simplify our structure and broaden our investor base, together with continued strong performance, increases our ability to generate significant long-term equity value for all of our shareholders,” said Henry R. Kravis and George R. Roberts, Co-Chairmen and Co-Chief Executive Officers of KKR. “In terms of our results, operating fundamentals across the firm remain strong evidenced by the 29% growth in our Assets Under Management and 15% growth in our Book Value per Share over the last 12 months.”
Note: Certain financial measures, including After-tax distributable earnings, book value, adjusted shares and outstanding adjusted shares, are not presented in accordance with accounting principles generally accepted in the United States of America (“GAAP”). See information that follows for a reconciliation of such measures to financial results prepared in accordance with GAAP.
GAAP financial results as of and for the quarter and six months ended June 30, 2018 reflect KKR as a limited partnership and not a corporation, since the Conversion became effective on July 1, 2018. All other measures, including non-GAAP financial measures and operating measures, are presented using shares of Class A common stock of KKR & Co. Inc.
(1) GAAP KKR & Co. L.P Capital - Common Unitholders equity represents only that portion of the business held by KKR & Co. L.P. and does not include the economic interests that are held by KKR Holdings L.P. Our reportable segment is presented prior to giving effect to the allocation of ownership interests between KKR & Co. L.P. and KKR Holdings L.P. and as such represents the business in total.
(2) Given the extraordinary nature of the Conversion, the quarter and six months ended June 30, 2018 excludes approximately $729.4 million of losses on certain investments which were realized in the second quarter in advance of the Conversion.
(3) Represents per weighted average adjusted shares eligible for distribution.
Page 1
GAAP RESULTS COMMENTARY
Net Income (Loss) Attributable to KKR & Co. L.P. Common Unitholders was $680.4 million for the quarter ended June 30, 2018, compared to $405.6 million for the quarter ended June 30, 2017. Net Income (Loss) Attributable to KKR & Co. L.P. Common Unitholders was $850.5 million for the six months ended June 30, 2018, compared to $665.0 million for the six months ended June 30, 2017.
Revenues for the quarter and six months ended June 30, 2018 were $971.6 million and $1,444.2 million, respectively, compared to $1,015.8 million and $1,783.6 million for the comparable periods of 2017. The decrease for both periods was primarily due to a lower level of capital allocation-based income. The lower level of capital allocation-based income was primarily due to a lower level of net appreciation in our private equity portfolio as compared to the comparable prior periods.
Expenses were $675.1 million for the quarter ended June 30, 2018, compared to $629.7 million for the quarter ended June 30, 2017. The increase was primarily due to an increase in operating expenses. Expenses were $1,111.7 million for the six months ended June 30, 2018, compared to $1,169.7 million for the six months ended June 30, 2017. The decrease was primarily due to a lower level of compensation reflecting a lower level of revenues.
Total investment income (loss) for the quarter and six months ended June 30, 2018 was $1,330.8 million and $1,915.3 million, respectively, compared to $501.0 million and $1,111.7 million for the comparable periods of 2017. The increase for both periods was primarily due to a higher level of net gains in our investment portfolio and higher interest income as compared to the prior periods.
SEGMENT RESULTS COMMENTARY
AFTER-TAX DISTRIBUTABLE EARNINGS
After-tax Distributable Earnings were $404.7 million for the quarter ended June 30, 2018, compared with $276.9 million in the comparable prior period. After-tax Distributable Earnings were $640.4 million for the six months ended June 30, 2018, compared with $573.5 million in the comparable prior period. The increase in both periods was primarily due to (i) an increase in management fees as described below, (ii) an increase in realized performance income primarily due to a higher level of realized carried interest on our private equity investments and a higher level of incentive fees relating to our BDCs and (iii) an increase in net realized gains at our Principal Activities business line, reflecting higher net realizations in our private equity and credit strategies. These increases were partially offset by an increase in compensation reflecting a higher level of total segment revenues in the current periods.
ASSETS UNDER MANAGEMENT
AUM was $191.3 billion as of June 30, 2018, up $14.9 billion, compared to AUM of $176.4 billion as of March 31, 2018. The increase was primarily driven by the closing of the FS Investments transaction, new capital raised in our leveraged credit and infrastructure strategies and an increase in the value of our private equity portfolio. These increases were partially offset by distributions to limited partners of our private equity funds arising from realizations and distributions made in our Public Markets business line.
FEE PAYING ASSETS UNDER MANAGEMENT
FPAUM was $138.8 billion as of June 30, 2018, up $19.1 billion, compared to FPAUM of $119.7 billion as of March 31, 2018. The increase was primarily driven by the closing of the FS Investments transaction, new capital raised in our leveraged credit strategy and our third flagship infrastructure fund entering its investment period. These increases were partially offset by distributions to limited partners of our private equity funds arising from realizations and distributions made in our Public Markets business line.
MANAGEMENT FEES
Management Fees were $261.5 million for the quarter ended June 30, 2018, compared with $229.6 million in the comparable prior period. Management Fees were $513.0 million for the six months ended June 30, 2018, compared to $437.9 million in the comparable prior period. The increase in both periods reflects an overall higher level of FPAUM in each of the Private Markets and Public Markets business lines.
BOOK VALUE PER SHARE
Book Value Per Share was $15.59 as of June 30, 2018, up 15%, compared with $13.50 as of June 30, 2017. The increase was primarily attributable to appreciation in the value of our investment portfolio as well as after-tax distributable earnings, net of distributions to public equity holders, over the last twelve months as of June 30, 2018.
Page 2
DIVIDENDS AND OTHER
A dividend of $0.17 per share of Class A common stock has been declared for the second quarter of 2018, which will be paid on August 21, 2018 to holders of record of Class A common stock as of the close of business on August 6, 2018. Following the Conversion, KKR expects to pay its Class A common stockholders an annualized dividend of $0.50 per share of Class A common stock, or a quarterly dividend of $0.125 per share of Class A common stock.
A dividend of $0.421875 per share of Series A Preferred Stock has been declared and set aside for payment on September 15, 2018 to holders of record of Series A Preferred Stock as of the close of business on September 1, 2018. A dividend of $0.406250 per share of Series B Preferred Stock has been declared and set aside for payment on September 15, 2018 to holders of record of Series B Preferred Stock as of the close of business on September 1, 2018.
Holders of our common or preferred units during the period of January 1, 2018 through June 30, 2018 will receive a final Schedule K-1 for such period (delivery expected in March 2019). Schedule K-1s will not be issued for periods subsequent to June 30, 2018, and dividends received by holders of our common and preferred stock after such date will be reported on Form 1099-DIV.
The declaration and payment of any future dividends on preferred or common stock will be subject to the discretion of the board of directors of KKR & Co. Inc. based on a number of factors, including KKR’s future financial performance and other considerations that the board deems relevant, and compliance with the terms of KKR & Co. Inc.'s certificate of incorporation and applicable law. There can be no assurance that future dividends will be made as intended or at all or that any particular dividend policy for Class A common stock will be maintained. There is no guarantee that the distributions we made to former unitholders will be sufficient to satisfy payment of their tax liabilities as limited partners of KKR for the six months ended June 30, 2018.
On May 3, 2018, KKR increased the available amount under its repurchase program to $500 million, which may be used for the repurchase of its Class A common stock, and the retirement of equity awards issued pursuant to the Amended and Restated KKR & Co. Inc. 2010 Equity Incentive Plan (and any successor equity plan thereto). From March 31, 2018 to July 18, 2018, KKR spent approximately $64 million to repurchase 2.7 million shares at an average price of $23.70 per share and retired equity awards representing 2.6 million shares for approximately $53 million. Collectively, approximately $713 million has been spent since October 27, 2015, representing a total of 45.4 million shares, to either repurchase shares or retire equity awards. As of July 18, 2018, approximately $436 million is available under the repurchase program.
CONFERENCE CALL
A conference call to discuss KKR's financial results will be held on Thursday, July 26, 2018 at 10:00 a.m. ET. The conference call may be accessed by dialing (877) 303-2917 (U.S. callers) or +1 (253) 237-1135 (non-U.S. callers); a pass code is not required. Additionally, the conference call will be broadcast live over the Internet and may be accessed through the Investor Center section of KKR's website at http://ir.kkr.com/kkr_ir/kkr_events.cfm. A replay of the live broadcast will be available on KKR's website or by dialing (855) 859-2056 (U.S. callers) or +1 (404) 537-3406 (non-U.S. callers), pass code 8593647, beginning approximately two hours after the broadcast.
A slide presentation containing supplemental commentary about KKR's financial results for the fiscal quarter ended June 30, 2018 may be accessed through the Investor Center of the KKR website at http://ir.kkr.com/kkr_ir/kkr_events.cfm. The presentation will be referenced on the conference call discussed above.
From time to time, KKR may use its website as a channel of distribution of material company information. Financial and other important information regarding KKR is routinely posted and accessible on the Investor Center for KKR & Co. Inc. at http://ir.kkr.com/kkr_ir/kkr_events.cfm. In addition, you may automatically receive email alerts and other information about KKR by enrolling your email address at the “Email Alerts” area of the Investor Center on the website.
ABOUT KKR
KKR is a leading global investment firm that manages multiple alternative asset classes, including private equity, energy, infrastructure, real estate and credit, with strategic manager partnerships that manage hedge funds. KKR aims to generate attractive investment returns for its fund investors by following a patient and disciplined investment approach, employing world-class people, and driving growth and value creation with KKR portfolio companies. KKR invests its own capital alongside the capital it manages for fund investors and provides financing solutions and investment opportunities through its capital markets business. References to KKR’s investments may include the activities of its sponsored funds. For additional information about KKR & Co. Inc. (NYSE: KKR), please visit KKR's website at www.kkr.com and on Twitter @KKR_Co.
Page 3
FORWARD-LOOKING STATEMENTS
This release contains certain forward-looking statements. Forward-looking statements relate to expectations, estimates, beliefs, projections, future plans and strategies, anticipated events or trends and similar expressions concerning matters that are not historical facts, including the statements with respect to the declaration and payment of dividends in future quarters and the timing, manner and volume of repurchase of Class A common stock pursuant to its repurchase program. The forward-looking statements are based on KKR’s beliefs, assumptions and expectations, taking into account all information currently available to it. These beliefs, assumptions and expectations can change as a result of many possible events or factors, not all of which are known to KKR or are within its control. If a change occurs, KKR’s business, financial condition, liquidity and results of operations, including but not limited to AUM, FPAUM, after-tax distributable earnings, capital invested, syndicated capital, uncalled commitments, cash and short-term investments, fee related earnings, fee and yield segment EBITDA, core interest expense and book value, may vary materially from those expressed in the forward-looking statements. The following factors, among others, could cause actual results to vary from the forward-looking statements: whether KKR realizes all or any of the anticipated benefits from converting to a corporation and the timing of realizing such benefits; whether there are increased or unforeseen costs associated with the conversion, including any adverse change in tax law; the volatility of the capital markets; failure to realize the benefits of or changes in KKR’s business strategies including the ability to realize the anticipated synergies from acquisitions, strategic partnerships or other transactions; availability, terms and deployment of capital; availability of qualified personnel and expense of recruiting and retaining such personnel; changes in the asset management industry, interest rates or the general economy; underperformance of KKR's investments and decreased ability to raise funds; and the degree and nature of KKR’s competition. All forward-looking statements speak only as of the date hereof. KKR does not undertake any obligation to update any forward-looking statements to reflect circumstances or events that occur after the date on which such statements were made except as required by law. In addition, KKR’s business strategy is focused on the long term and financial results are subject to significant volatility. Additional information about factors affecting KKR is available in KKR & Co. Inc.’s Annual Report on Form 10-K for the fiscal year ended December 31, 2017, filed with the SEC on February 23, 2018, quarterly reports on Form 10-Q for subsequent quarters and other filings with the SEC, which are available at www.sec.gov.
___________________________
CONTACT INFORMATION
Investor Relations:
Craig Larson
Tel: +1-877-610-4910 (U.S.) / +1-212-230-9410
investor-relations@kkr.com
Media:
Kristi Huller
Tel: +1-212-750-8300
media@kkr.com
Page 4
KKR | ||||||||||||||||
CONDENSED CONSOLIDATED STATEMENTS OF OPERATIONS (GAAP BASIS - UNAUDITED) | ||||||||||||||||
(Amounts in thousands, except common unit and per common unit amounts) | ||||||||||||||||
Quarter Ended | Six Months Ended | |||||||||||||||
June 30, 2018 | June 30, 2017 | June 30, 2018 | June 30, 2017 | |||||||||||||
Revenues | ||||||||||||||||
Fees and Other | $ | 413,846 | $ | 380,785 | $ | 808,240 | $ | 760,964 | ||||||||
Capital Allocation-Based Income (1) | 557,774 | 635,015 | 635,986 | 1,022,591 | ||||||||||||
Total Revenues | 971,620 | 1,015,800 | 1,444,226 | 1,783,555 | ||||||||||||
Expenses | ||||||||||||||||
Compensation and Benefits | 472,500 | 462,841 | 770,636 | 865,804 | ||||||||||||
Occupancy and Related Charges | 15,322 | 14,032 | 29,537 | 28,883 | ||||||||||||
General, Administrative and Other | 187,228 | 152,855 | 311,478 | 275,055 | ||||||||||||
Total Expenses | 675,050 | 629,728 | 1,111,651 | 1,169,742 | ||||||||||||
Investment Income (Loss) | ||||||||||||||||
Net Gains (Losses) from Investment Activities | 1,116,587 | 334,416 | 1,589,387 | 841,061 | ||||||||||||
Dividend Income | 66,344 | 69,446 | 99,408 | 79,370 | ||||||||||||
Interest Income | 351,705 | 295,718 | 649,961 | 576,698 | ||||||||||||
Interest Expense | (203,850 | ) | (198,590 | ) | (423,440 | ) | (385,444 | ) | ||||||||
Total Investment Income (Loss) | 1,330,786 | 500,990 | 1,915,316 | 1,111,685 | ||||||||||||
Income (Loss) Before Taxes | 1,627,356 | 887,062 | 2,247,891 | 1,725,498 | ||||||||||||
Income Tax (Benefit) | 60,960 | 18,538 | 78,601 | 59,080 | ||||||||||||
Net Income (Loss) | 1,566,396 | 868,524 | 2,169,290 | 1,666,418 | ||||||||||||
Net Income (Loss) Attributable to Redeemable Noncontrolling Interests | (18,016 | ) | 22,387 | 7,658 | 43,320 | |||||||||||
Net Income (Loss) Attributable to Noncontrolling Interests | 895,690 | 432,150 | 1,294,467 | 941,427 | ||||||||||||
Net Income (Loss) Attributable to KKR & Co. L.P. | 688,722 | 413,987 | 867,165 | 681,671 | ||||||||||||
Net Income (Loss) Attributable to Series A Preferred Unitholders | 5,822 | 5,822 | 11,644 | 11,644 | ||||||||||||
Net Income (Loss) Attributable to Series B Preferred Unitholders | 2,519 | 2,519 | 5,038 | 5,038 | ||||||||||||
Net Income (Loss) Attributable to KKR & Co. L.P. Common Unitholders | $ | 680,381 | $ | 405,646 | $ | 850,483 | $ | 664,989 | ||||||||
Net Income (Loss) Attributable to KKR & Co. L.P. Per Common Unit | ||||||||||||||||
Basic | $ | 1.33 | $ | 0.87 | $ | 1.71 | $ | 1.45 | ||||||||
Diluted (2) | $ | 1.24 | $ | 0.81 | $ | 1.57 | $ | 1.33 | ||||||||
Weighted Average Common Units Outstanding | ||||||||||||||||
Basic | 510,586,631 | 466,170,025 | 499,208,944 | 459,967,395 | ||||||||||||
Diluted (2) | 548,745,498 | 501,177,423 | 542,367,320 | 498,943,294 | ||||||||||||
KKR | ||||||||
CONDENSED CONSOLIDATED STATEMENTS OF FINANCIAL CONDITION (GAAP BASIS - UNAUDITED) | ||||||||
(Amounts in thousands, except per common unit amounts) | ||||||||
As of | ||||||||
June 30, 2018 | December 31, 2017 | |||||||
Assets | ||||||||
Cash and Cash Equivalents | $ | 2,065,172 | $ | 1,876,687 | ||||
Investments | 42,622,545 | 39,013,934 | ||||||
Other Assets | 3,884,947 | 4,944,098 | ||||||
Total Assets | 48,572,664 | 45,834,719 | ||||||
Liabilities and Equity | ||||||||
Debt Obligations | 19,972,383 | 21,193,859 | ||||||
Other Liabilities | 4,313,091 | 3,978,060 | ||||||
Total Liabilities | 24,285,474 | 25,171,919 | ||||||
Redeemable Noncontrolling Interests | 962,147 | 610,540 | ||||||
Equity | ||||||||
Series A Preferred Units | 332,988 | 332,988 | ||||||
Series B Preferred Units | 149,566 | 149,566 | ||||||
KKR & Co. L.P. Capital - Common Unitholders | 7,909,830 | 6,703,382 | ||||||
Noncontrolling Interests | 14,932,659 | 12,866,324 | ||||||
Total Equity | 23,325,043 | 20,052,260 | ||||||
Total Liabilities and Equity | $ | 48,572,664 | $ | 45,834,719 | ||||
KKR & Co. L.P. Capital Per Outstanding Common Unit - Basic | $ | 15.09 | $ | 13.79 | ||||
(1) Capital allocation-based income is earned from those arrangements whereby KKR serves as general partner and includes income from KKR's capital interest as well as "carried interest" which entitles KKR to a disproportionate allocation of investment income from investment funds' limited partners. Prior to January 1, 2018, to the extent an investment fund was not consolidated, KKR accounted for carried interest within Fees and Other separately from its capital interest, which was included in Net Gains (Losses) from Investment Activities in the statements of operations. Effective January 1, 2018, the carried interest component of the general partner interest and the capital interest KKR holds in its investment funds as the general partner are accounted for as a single unit of account and reported in Capital Allocation-Based Income within Revenues in the statements of operations. This change in accounting has been applied on a full retrospective basis.
(2) KKR Holdings L.P. units have been excluded from the calculation of diluted earnings per common unit since the exchange of these units would not dilute KKR’s respective ownership interests in the KKR Group Partnerships.
Page 5
KKR | ||||||||||||||||||||
SEGMENT RESULTS AND OTHER SELECTED FINANCIAL INFORMATION (UNAUDITED) (1) | ||||||||||||||||||||
(Amounts in thousands, except share and per share amounts) | ||||||||||||||||||||
Quarter Ended | Six Months Ended | |||||||||||||||||||
June 30, 2018 | March 31, 2018 | June 30, 2017 | June 30, 2018 | June 30, 2017 | ||||||||||||||||
Segment Revenues | ||||||||||||||||||||
Fees and Other, Net | ||||||||||||||||||||
Management Fees | $ | 261,450 | $ | 251,585 | $ | 229,569 | $ | 513,035 | $ | 437,853 | ||||||||||
Transaction Fees | 163,925 | 156,845 | 156,465 | 320,770 | 399,500 | |||||||||||||||
Monitoring Fees | 25,394 | 17,530 | 30,510 | 42,924 | 43,730 | |||||||||||||||
Fee Credits | (53,021 | ) | (43,774 | ) | (51,384 | ) | (96,795 | ) | (140,401 | ) | ||||||||||
Total Fees and Other, Net | 397,748 | 382,186 | 365,160 | 779,934 | 740,682 | |||||||||||||||
Realized Performance Income (Loss) | ||||||||||||||||||||
Carried Interest | 342,089 | 202,555 | 264,668 | 544,644 | 470,872 | |||||||||||||||
Incentive Fees | 17,651 | 16,407 | 2,624 | 34,058 | 4,310 | |||||||||||||||
Total Realized Performance Income (Loss) | 359,740 | 218,962 | 267,292 | 578,702 | 475,182 | |||||||||||||||
Realized Investment Income (Loss) | ||||||||||||||||||||
Net Realized Gains (Losses) (2) | 97,480 | 7,875 | 7,180 | 105,355 | 86,631 | |||||||||||||||
Interest Income and Dividends | 71,228 | 72,577 | 67,836 | 143,805 | 124,718 | |||||||||||||||
Total Realized Investment Income (Loss) | 168,708 | 80,452 | 75,016 | 249,160 | 211,349 | |||||||||||||||
Total Segment Revenues | 926,196 | 681,600 | 707,468 | 1,607,796 | 1,427,213 | |||||||||||||||
Segment Expenses | ||||||||||||||||||||
Compensation and Benefits (3) | 368,562 | 300,480 | 292,415 | 669,042 | 569,860 | |||||||||||||||
Occupancy and Related Charges | 14,665 | 13,583 | 13,407 | 28,248 | 27,776 | |||||||||||||||
Other Operating Expenses (4) | 63,561 | 57,905 | 53,069 | 121,466 | 106,567 | |||||||||||||||
Total Segment Expenses | 446,788 | 371,968 | 358,891 | 818,756 | 704,203 | |||||||||||||||
Segment Operating Earnings | 479,408 | 309,632 | 348,577 | 789,040 | 723,010 | |||||||||||||||
Interest Expense | 45,474 | 50,192 | 47,026 | 95,666 | 88,735 | |||||||||||||||
Preferred Dividends | 8,341 | 8,341 | 8,341 | 16,682 | 16,682 | |||||||||||||||
Income (Loss) Attributable to Noncontrolling Interests | 1,082 | 1,203 | 1,180 | 2,285 | 2,764 | |||||||||||||||
Income Taxes Paid | 19,820 | 14,168 | 15,084 | 33,988 | 41,359 | |||||||||||||||
After-tax Distributable Earnings | $ | 404,691 | $ | 235,728 | $ | 276,946 | $ | 640,419 | $ | 573,470 | ||||||||||
Per Adjusted Share Eligible for Distribution | $ | 0.49 | $ | 0.29 | $ | 0.34 | $ | 0.77 | $ | 0.70 | ||||||||||
Weighted Average Adjusted Shares Eligible for Distribution | 831,103,486 | 824,442,002 | 816,759,609 | 827,791,146 | 813,765,465 | |||||||||||||||
Assets Under Management | $ | 191,265,400 | $ | 176,355,700 | $ | 148,483,000 | $ | 191,265,400 | $ | 148,483,000 | ||||||||||
Fee Paying Assets Under Management | $ | 138,841,100 | $ | 119,658,100 | $ | 112,646,200 | $ | 138,841,100 | $ | 112,646,200 | ||||||||||
Capital Invested and Syndicated Capital | $ | 4,825,700 | $ | 4,287,600 | $ | 5,369,400 | $ | 9,113,300 | $ | 11,928,500 | ||||||||||
Uncalled Commitments | $ | 57,417,400 | $ | 58,843,900 | $ | 42,551,600 | $ | 57,417,400 | $ | 42,551,600 | ||||||||||
Fee Related Earnings (5) | $ | 230,871 | $ | 211,631 | $ | 203,133 | $ | 442,502 | $ | 424,548 | ||||||||||
Note: See "Information on Key Segment & Other Measures" for more information about certain non-GAAP financial measures and Exhibit A for a reconciliation of such measures to the financial results presented in accordance with GAAP.
(1) See Exhibit A for reconciliations of (i) Net Income (Loss) attributable to KKR & Co. L.P. common unitholders (GAAP basis) to After-tax Distributable Earnings, (ii) Total GAAP Revenues to Total Segment Revenues and (iii) Total GAAP Expenses to Total Segment Expenses. See reconciliation of GAAP Common Units Outstanding to Adjusted Shares Eligible for Distribution in the information that follows.
(2) Given the extraordinary nature of the Conversion, the quarter and six months ended June 30, 2018 excludes approximately $729.4 million of losses on certain investments which were realized in the second quarter in advance of the Conversion.
(3) Includes equity-based compensation of $58,198, $67,796, and $44,976 for the quarters ended June 30, 2018, March 31, 2018, and June 30, 2017, respectively, and $125,994 and $94,919 for the six months ended June 30, 2018 and June 30, 2017, respectively.
(4) For the quarter and six months ended June 30, 2018, excludes approximately $11.5 million of non-recurring costs in connection with the Conversion.
(5) Fee related earnings is calculated as KKR’s total Fees and Other multiplied by KKR’s segment operating margin. For purposes of the fee related earnings calculation, segment operating margin is calculated as Segment Operating Earnings, excluding equity-based compensation, divided by total segment revenues.
Page 6
KKR | ||||||||||||||||||||
SCHEDULE OF SEGMENT REVENUES AND OTHER SELECTED FINANCIAL INFORMATION (UNAUDITED) | ||||||||||||||||||||
(Amounts in thousands) | ||||||||||||||||||||
PRIVATE MARKETS BUSINESS LINE | ||||||||||||||||||||
Quarter Ended | Six Months Ended | |||||||||||||||||||
June 30, 2018 | March 31, 2018 | June 30, 2017 | June 30, 2018 | June 30, 2017 | ||||||||||||||||
Fees and Other, Net | ||||||||||||||||||||
Management Fees | $ | 156,295 | $ | 158,190 | $ | 142,253 | $ | 314,485 | $ | 265,765 | ||||||||||
Transaction Fees | 48,567 | 46,689 | 37,252 | 95,256 | 155,134 | |||||||||||||||
Monitoring Fees | 25,394 | 17,530 | 30,510 | 42,924 | 43,730 | |||||||||||||||
Fee Credits | (43,249 | ) | (41,343 | ) | (31,750 | ) | (84,592 | ) | (117,400 | ) | ||||||||||
Total Fees and Other, Net | 187,007 | 181,066 | 178,265 | 368,073 | 347,229 | |||||||||||||||
Realized Performance Income (Loss) | ||||||||||||||||||||
Carried Interest | 342,089 | 202,555 | 264,668 | 544,644 | 470,872 | |||||||||||||||
Incentive Fees | — | — | — | — | — | |||||||||||||||
Total Realized Performance Income (Loss) | $ | 342,089 | $ | 202,555 | $ | 264,668 | $ | 544,644 | $ | 470,872 | ||||||||||
Assets Under Management | $ | 102,391,900 | $ | 102,240,200 | $ | 84,984,000 | $ | 102,391,900 | $ | 84,984,000 | ||||||||||
Fee Paying Assets Under Management | $ | 66,295,700 | $ | 61,506,200 | $ | 62,008,900 | $ | 66,295,700 | $ | 62,008,900 | ||||||||||
Capital Invested | $ | 2,632,100 | $ | 2,366,700 | $ | 3,623,300 | $ | 4,998,800 | $ | 8,107,500 | ||||||||||
Uncalled Commitments | $ | 48,555,500 | $ | 50,300,500 | $ | 35,792,900 | $ | 48,555,500 | $ | 35,792,900 | ||||||||||
PUBLIC MARKETS BUSINESS LINE | ||||||||||||||||||||
Quarter Ended | Six Months Ended | |||||||||||||||||||
June 30, 2018 | March 31, 2018 | June 30, 2017 | June 30, 2018 | June 30, 2017 | ||||||||||||||||
Fees and Other, Net | ||||||||||||||||||||
Management Fees | $ | 105,155 | $ | 93,395 | $ | 87,316 | $ | 198,550 | $ | 172,088 | ||||||||||
Transaction Fees | 10,673 | 2,558 | 25,515 | 13,231 | 29,571 | |||||||||||||||
Fee Credits | (9,772 | ) | (2,431 | ) | (19,634 | ) | (12,203 | ) | (23,001 | ) | ||||||||||
Total Fees and Other, Net | 106,056 | 93,522 | 93,197 | 199,578 | 178,658 | |||||||||||||||
Realized Performance Income (Loss) | ||||||||||||||||||||
Carried Interest | — | — | — | — | — | |||||||||||||||
Incentive Fees | 17,651 | 16,407 | 2,624 | 34,058 | 4,310 | |||||||||||||||
Total Realized Performance Income (Loss) | $ | 17,651 | $ | 16,407 | $ | 2,624 | $ | 34,058 | $ | 4,310 | ||||||||||
Assets Under Management | $ | 88,873,500 | $ | 74,115,500 | $ | 63,499,000 | $ | 88,873,500 | $ | 63,499,000 | ||||||||||
Fee Paying Assets Under Management | $ | 72,545,400 | $ | 58,151,900 | $ | 50,637,300 | $ | 72,545,400 | $ | 50,637,300 | ||||||||||
Capital Invested | $ | 1,955,200 | $ | 1,367,900 | $ | 1,293,100 | $ | 3,323,100 | $ | 2,186,700 | ||||||||||
Uncalled Commitments | $ | 8,861,900 | $ | 8,543,400 | $ | 6,758,700 | $ | 8,861,900 | $ | 6,758,700 | ||||||||||
CAPITAL MARKETS BUSINESS LINE | ||||||||||||||||||||
Quarter Ended | Six Months Ended | |||||||||||||||||||
June 30, 2018 | March 31, 2018 | June 30, 2017 | June 30, 2018 | June 30, 2017 | ||||||||||||||||
Transaction Fees | $ | 104,685 | $ | 107,598 | $ | 93,698 | $ | 212,283 | $ | 214,795 | ||||||||||
Syndicated Capital | $ | 238,400 | $ | 553,000 | $ | 453,000 | $ | 791,400 | $ | 1,634,300 | ||||||||||
PRINCIPAL ACTIVITIES BUSINESS LINE | ||||||||||||||||||||
Quarter Ended | Six Months Ended | |||||||||||||||||||
June 30, 2018 | March 31, 2018 | June 30, 2017 | June 30, 2018 | June 30, 2017 | ||||||||||||||||
Realized Investment Income (Loss) | ||||||||||||||||||||
Net Realized Gains (Losses) | $ | 97,480 | $ | 7,875 | $ | 7,180 | 105,355 | 86,631 | ||||||||||||
Interest Income and Dividends | 71,228 | 72,577 | 67,836 | 143,805 | 124,718 | |||||||||||||||
Total Realized Investment Income (Loss) | $ | 168,708 | $ | 80,452 | $ | 75,016 | $ | 249,160 | $ | 211,349 | ||||||||||
Page 7
KKR | ||||||||||||
SEGMENT BALANCE SHEET (UNAUDITED) | ||||||||||||
(Amounts in thousands, except per Outstanding Adjusted Share amounts) | ||||||||||||
As of | ||||||||||||
June 30, 2018 | December 31, 2017 | |||||||||||
Cash and Short-term Investments | $ | 2,765,646 | $ | 3,214,794 | ||||||||
Investments | 9,763,985 | (1) | 8,488,606 | |||||||||
Unrealized Carried Interest | 1,691,112 | (2) | 1,620,401 | (2) | ||||||||
Other Assets | 3,094,715 | 2,276,286 | ||||||||||
Corporate Real Estate | 161,225 | 161,225 | ||||||||||
Total Assets | $ | 17,476,683 | $ | 15,761,312 | ||||||||
Debt Obligations - KKR (ex-KFN) | $ | 2,364,293 | $ | 2,000,000 | ||||||||
Debt Obligations - KFN | 948,517 | 764,767 | ||||||||||
Preferred Shares - KFN | — | 373,750 | ||||||||||
Other Liabilities | 727,854 | 426,699 | ||||||||||
Total Liabilities | 4,040,664 | 3,565,216 | ||||||||||
Noncontrolling Interests | 22,737 | 22,187 | ||||||||||
Preferred Stock | 500,000 | 500,000 | ||||||||||
Book Value | $ | 12,913,282 | $ | 11,673,909 | ||||||||
Book Value Per Outstanding Adjusted Share | $ | 15.59 | $ | 14.20 | ||||||||
Note: As of June 30, 2018, KKR had a $1.0 billion revolving credit facility, which was undrawn. In addition, KKR has $1.3 billion in revolving credit facilities for use in its capital markets business, which were undrawn as of June 30, 2018.
(1) See schedule of investments that follows on the next page.
(2) The following table provides unrealized carried interest by business line:
As of | ||||||||||||
June 30, 2018 | December 31, 2017 | |||||||||||
Private Markets Business Line | $ | 1,526,892 | $ | 1,480,142 | ||||||||
Public Markets Business Line | 164,220 | 140,259 | ||||||||||
Total | $ | 1,691,112 | $ | 1,620,401 | ||||||||
Page 8
KKR |
SEGMENT SCHEDULE OF INVESTMENTS (UNAUDITED)(1) |
(Amounts in thousands, except percentage amounts) |
As of June 30, 2018 | ||||
Investments | Fair Value | |||
Private Equity Co-Investments and Other Equity | $ | 3,816,309 | ||
Private Equity Funds | 1,560,011 | |||
Private Equity Total | 5,376,320 | |||
Energy | 702,443 | |||
Real Estate | 818,991 | |||
Infrastructure | 419,945 | |||
Real Assets Total | 1,941,379 | |||
Special Situations | 771,338 | |||
Direct Lending | 113,039 | |||
Mezzanine | 28,252 | |||
Alternative Credit Total | 912,629 | |||
CLOs | 637,068 | |||
Other Leveraged Credit | 161,522 | |||
Specialty Finance | 209,021 | |||
Credit Total | 1,920,240 | |||
Other | 526,046 | |||
Total Investments | $ | 9,763,985 | ||
As of June 30, 2018 | |||||||
Significant Investments: (3) | Fair Value | Fair Value as a % of Total Investments | |||||
First Data Corporation | $ | 1,477,777 | 15.1 | % | |||
USI, Inc. | 550,112 | 5.6 | % | ||||
KKR Real Estate Finance Trust Inc. | 321,425 | 3.3 | % | ||||
Heartland Dental | 302,255 | 3.1 | % | ||||
PetVet | 267,507 | 2.7 | % | ||||
Total Significant Investments | 2,919,076 | 29.8 | % | ||||
Other Investments | 6,844,909 | 70.2 | % | ||||
Total Investments | $ | 9,763,985 | 100.0 | % | |||
(1) Investments is a term used solely for purposes of financial presentation of a portion of KKR’s balance sheet and includes majority ownership of subsidiaries that operate KKR’s asset management and broker-dealer businesses, including the general partner interests of KKR’s investment funds.
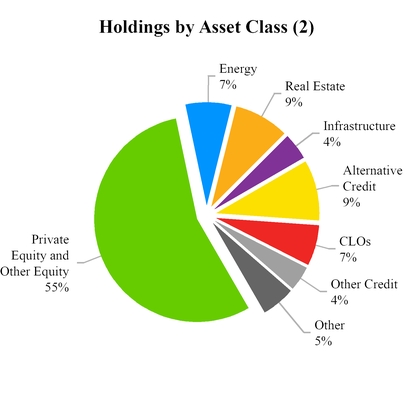
(2) This presentation includes our capital commitments to our funds. Private Equity and Other Equity includes KKR private equity funds, co-investments alongside such KKR sponsored private equity funds, core private equity co-investments and other opportunistic investments. However, equity investments in other asset classes, such as real estate, alternative credit and energy appear in these other asset classes. Other Credit consists of other leveraged credit and specialty finance strategies.
(3) The significant investments include the top five investments (other than investments expected to be syndicated or transferred in connection with new fundraising) based on their fair values as of June 30, 2018. The fair value figures include the co-investment and the limited partner and/or general partner interests held by KKR in the underlying investment, if applicable.
Page 9
KKR | ||||||||||||
ASSETS UNDER MANAGEMENT (UNAUDITED) | ||||||||||||
(Amounts in thousands) | ||||||||||||
Private Markets Business Line | Public Markets Business Line | Total | ||||||||||
Quarter Ended June 30, 2018 | ||||||||||||
March 31, 2018 | $ | 102,240,200 | $ | 74,115,500 | $ | 176,355,700 | ||||||
New Capital Raised | 1,354,600 | 4,584,700 | 5,939,300 | |||||||||
Acquisitions | — | 13,189,100 | (1) | 13,189,100 | ||||||||
Distributions and Other | (4,150,400 | ) | (6) | (2,644,500 | ) | (2) | (6,794,900 | ) | ||||
Change in Value | 2,947,500 | (371,300 | ) | 2,576,200 | ||||||||
June 30, 2018 | $ | 102,391,900 | $ | 88,873,500 | $ | 191,265,400 | ||||||
Six Months Ended June 30, 2018 | ||||||||||||
December 31, 2017 | $ | 97,527,100 | $ | 70,943,500 | $ | 168,470,600 | ||||||
New Capital Raised | 7,903,300 | 8,684,800 | 16,588,100 | |||||||||
Acquisitions | — | 13,189,100 | (1) | 13,189,100 | ||||||||
Distributions and Other | (6,402,500 | ) | (6) | (4,438,700 | ) | (3) | (10,841,200 | ) | ||||
Change in Value | 3,364,000 | 494,800 | 3,858,800 | |||||||||
June 30, 2018 | $ | 102,391,900 | $ | 88,873,500 | $ | 191,265,400 | ||||||
Trailing Twelve Months Ended June 30, 2018 | ||||||||||||
June 30, 2017 | $ | 84,984,000 | $ | 63,499,000 | $ | 148,483,000 | ||||||
New Capital Raised | 22,278,400 | 17,689,700 | 39,968,100 | |||||||||
Acquisitions | — | 14,983,900 | (4) | 14,983,900 | ||||||||
Distributions and Other | (13,537,200 | ) | (6) | (9,210,700 | ) | (5) | (22,747,900 | ) | ||||
Change in Value | 8,666,700 | 1,911,600 | 10,578,300 | |||||||||
June 30, 2018 | $ | 102,391,900 | $ | 88,873,500 | $ | 191,265,400 | ||||||
(1) Represents AUM managed by FS Investments in connection with the completion of the FS Investments transaction.
(2) Includes $1,319.5 million of redemptions by fund investors.
(3) Includes $2,283.6 million of redemptions by fund investors.
(4) Includes (i) KKR's incremental pro rata portion of AUM of $1,794.8 million managed by Marshall Wace LLP due to an additional 5% interest acquired by KKR on November 30, 2017 and (ii) AUM managed by FS Investments of $13,189.1 million in connection with the completion of the FS Investments transaction.
(5) Includes $4,466.6 million of redemptions by fund investors.
(6) Includes $812.0 million of expired commitments that are no longer eligible to be called.
Page 10
KKR | ||||||||||||
FEE PAYING ASSETS UNDER MANAGEMENT (UNAUDITED) | ||||||||||||
(Amounts in thousands) | ||||||||||||
Private Markets Business Line | Public Markets Business Line | Total | ||||||||||
Quarter Ended June 30, 2018 | ||||||||||||
March 31, 2018 | $ | 61,506,200 | $ | 58,151,900 | $ | 119,658,100 | ||||||
New Capital Raised | 7,997,800 | 4,542,500 | 12,540,300 | |||||||||
Acquisitions | — | 13,189,100 | (1) | 13,189,100 | ||||||||
Distributions | (2,060,300 | ) | (2,759,800 | ) | (2) | (4,820,100 | ) | |||||
Net Changes in Fee Base of Certain Funds (3) | (1,040,300 | ) | — | (1,040,300 | ) | |||||||
Change in Value | (107,700 | ) | (578,300 | ) | (686,000 | ) | ||||||
June 30, 2018 | $ | 66,295,700 | $ | 72,545,400 | $ | 138,841,100 | ||||||
Six Months Ended June 30, 2018 | ||||||||||||
December 31, 2017 | $ | 61,678,600 | $ | 55,758,900 | $ | 117,437,500 | ||||||
New Capital Raised | 8,573,600 | 7,957,500 | 16,531,100 | |||||||||
Acquisitions | — | 13,189,100 | (1) | 13,189,100 | ||||||||
Distributions | (3,093,500 | ) | (4,434,400 | ) | (4) | (7,527,900 | ) | |||||
Net Changes in Fee Base of Certain Funds (3) | (1,040,300 | ) | — | (1,040,300 | ) | |||||||
Change in Value | 177,300 | 74,300 | 251,600 | |||||||||
June 30, 2018 | $ | 66,295,700 | $ | 72,545,400 | $ | 138,841,100 | ||||||
Trailing Twelve Months Ended June 30, 2018 | ||||||||||||
June 30, 2017 | $ | 62,008,900 | $ | 50,637,300 | $ | 112,646,200 | ||||||
New Capital Raised | 11,992,100 | 15,325,600 | 27,317,700 | |||||||||
Acquisitions | — | 14,983,900 | (5) | 14,983,900 | ||||||||
Distributions | (7,483,200 | ) | (9,586,900 | ) | (6) | (17,070,100 | ) | |||||
Net Changes in Fee Base of Certain Funds (3) | (1,040,300 | ) | — | (1,040,300 | ) | |||||||
Change in Value | 818,200 | 1,185,500 | 2,003,700 | |||||||||
June 30, 2018 | $ | 66,295,700 | $ | 72,545,400 | $ | 138,841,100 | ||||||
(1) Represents FPAUM managed by FS Investments in connection with the completion of the FS Investments transaction.
(2) Includes $1,319.5 million of redemptions by fund investors.
(3) Represents the impact of certain funds entering their post-investment period.
(4) Includes $2,283.6 million of redemptions by fund investors.
(5) Includes (i) KKR's incremental pro rata portion of FPAUM of $1,794.8 million managed by Marshall Wace LLP due to an additional 5% interest acquired by KKR on November 30, 2017 and (ii) FPAUM managed by FS Investments of $13,189.1 million in connection with the completion of the FS Investments transaction.
(6) Includes $4,466.6 million of redemptions by fund investors.
Page 11
KKR | |||||||||||||||||||||
INVESTMENT VEHICLE SUMMARY (1) (UNAUDITED) | |||||||||||||||||||||
As of June 30, 2018 | |||||||||||||||||||||
(Amounts in millions, except percentages) | |||||||||||||||||||||
Investment Period | |||||||||||||||||||||
Start Date | End Date | Commitment | Uncalled Commitments | Percentage Committed by General Partner | Invested | Realized | Remaining Cost | Remaining Fair Value | |||||||||||||
Private Markets Business Line | |||||||||||||||||||||
Private Equity | |||||||||||||||||||||
Asian Fund III (1) | 4/2017 | 4/2023 | $ | 9,000.0 | $ | 8,373.6 | 5.6% | $ | 626.4 | $ | — | $ | 626.4 | $ | 584.3 | ||||||
Americas Fund XII (1) | 1/2017 | 1/2023 | 13,500.0 | 11,607.1 | 6.0% | 1,892.9 | — | 1,892.9 | 2,095.6 | ||||||||||||
Health Care Strategic Growth (1) | 12/2016 | 12/2021 | 1,331.0 | 1,284.2 | 11.3% | 46.8 | — | 46.8 | 91.9 | ||||||||||||
Next Generation Technology Growth (1) | 3/2016 | 3/2021 | 658.9 | 328.6 | 22.5% | 330.3 | — | 330.3 | 524.3 | ||||||||||||
European Fund IV (1) | 12/2014 | 12/2020 | 3,539.2 | 1,339.6 | 5.6% | 2,276.2 | 454.9 | 2,058.4 | 3,087.5 | ||||||||||||
Asian Fund II (1) | 4/2013 | 4/2017 | 5,825.0 | 770.2 | 1.3% | 6,056.0 | 2,230.5 | 4,637.8 | 6,892.6 | ||||||||||||
North America Fund XI (1) | 9/2012 | 1/2017 | 8,718.4 | 874.2 | 2.9% | 9,274.4 | 6,523.4 | 6,166.1 | 11,546.7 | ||||||||||||
China Growth Fund | 11/2010 | 11/2016 | 1,010.0 | — | 1.0% | 1,010.0 | 637.8 | 630.5 | 671.7 | ||||||||||||
European Fund III | 3/2008 | 3/2014 | 6,167.6 | 237.6 | 4.6% | 5,327.4 | 8,368.0 | 1,212.6 | 2,439.0 | ||||||||||||
Asian Fund | 7/2007 | 4/2013 | 3,983.3 | — | 2.5% | 3,945.9 | 8,409.6 | 239.2 | 256.8 | ||||||||||||
2006 Fund | 9/2006 | 9/2012 | 17,642.2 | 337.7 | 2.1% | 17,304.5 | 28,460.7 | 4,159.0 | 6,135.9 | ||||||||||||
European Fund II | 11/2005 | 10/2008 | 5,750.8 | — | 2.1% | 5,750.8 | 8,469.8 | — | 57.7 | ||||||||||||
Millennium Fund | 12/2002 | 12/2008 | 6,000.0 | — | 2.5% | 6,000.0 | 13,938.7 | 232.5 | 195.1 | ||||||||||||
Total Private Equity | 83,126.4 | 25,152.8 | 59,841.6 | 77,493.4 | 22,232.5 | 34,579.1 | |||||||||||||||
Co-Investment Vehicles and Other (1) | Various | Various | 6,546.5 | 1,797.2 | Various | 4,945.3 | 3,148.4 | 3,385.2 | 4,906.6 | ||||||||||||
Total Private Equity | 89,672.9 | 26,950.0 | 64,786.9 | 80,641.8 | 25,617.7 | 39,485.7 | |||||||||||||||
Real Assets | |||||||||||||||||||||
Energy Income and Growth Fund (1) | 9/2013 | 6/2018 | 1,974.2 | 59.3 | 12.9% | 1,958.2 | 395.1 | 1,627.6 | 1,846.5 | ||||||||||||
Natural Resources Fund | Various | Various | 887.4 | 2.6 | Various | 884.8 | 115.9 | 201.5 | 156.9 | ||||||||||||
Global Energy Opportunities (1) | Various | Various | 979.2 | 345.5 | Various | 463.0 | 62.4 | 345.7 | 347.7 | ||||||||||||
Global Infrastructure Investors (1) | 9/2011 | 10/2014 | 1,040.2 | 42.4 | 4.8% | 1,029.3 | 876.1 | 616.9 | 834.6 | ||||||||||||
Global Infrastructure Investors II (1) | 10/2014 | 6/2018 | 3,044.3 | 674.5 | 4.1% | 2,591.4 | 257.0 | 2,360.9 | 2,824.7 | ||||||||||||
Global Infrastructure Investors III (1) | 6/2018 | 6/2024 | 6,961.2 | 6,961.2 | 3.9% | — | — | — | — | ||||||||||||
Real Estate Partners Americas (1) | 5/2013 | 5/2017 | 1,229.1 | 352.8 | 16.3% | 1,004.1 | 904.1 | 514.2 | 551.3 | ||||||||||||
Real Estate Partners Americas II (1) | 5/2017 | 12/2020 | 1,921.2 | 1,748.5 | 7.8% | 172.7 | — | 172.7 | 207.8 | ||||||||||||
Real Estate Partners Europe (1) | 9/2015 | 6/2020 | 720.1 | 501.1 | 9.2% | 225.1 | 19.1 | 213.0 | 264.9 | ||||||||||||
Real Estate Credit Opportunity Partners (1) | 2/2017 | 2/2019 | 1,130.0 | 508.5 | 4.4% | 621.5 | 27.6 | 621.5 | 634.2 | ||||||||||||
Co-Investment Vehicles and Other | Various | Various | 1,781.9 | 387.4 | Various | 1,394.5 | 623.1 | 1,391.2 | 1,704.0 | ||||||||||||
Real Assets | 21,668.8 | 11,583.8 | 10,344.6 | 3,280.4 | 8,065.2 | 9,372.6 | |||||||||||||||
Core Investment Vehicles (1) | Various | Various | 9,500.0 | 6,954.6 | 36.8% | 2,545.4 | — | 2,545.4 | 2,714.2 | ||||||||||||
Unallocated Commitments (2) | 3,067.1 | 3,067.1 | Various | — | — | — | — | ||||||||||||||
Private Markets Total | 123,908.8 | 48,555.5 | 77,676.9 | 83,922.2 | 36,228.3 | 51,572.5 | |||||||||||||||
Public Markets Business Line(3) | |||||||||||||||||||||
Special Situations Fund | 12/2012 | 1/2016 | 2,274.3 | 29.6 | 11.6% | 2,244.7 | 1,140.7 | 1,554.0 | 1,736.5 | ||||||||||||
Special Situations Fund II | 12/2014 | 3/2019 | 3,316.8 | 1,603.4 | 9.0% | 1,713.4 | — | 1,713.4 | 1,865.7 | ||||||||||||
Mezzanine Partners | 3/2010 | 3/2015 | 1,022.8 | 108.9 | 4.4% | 913.9 | 1,057.2 | 259.4 | 301.3 | ||||||||||||
Private Credit Opportunities Partners II | 12/2015 | 12/2020 | 2,245.1 | 1,607.7 | 2.2% | 637.4 | 9.5 | 637.4 | 656.2 | ||||||||||||
Lending Partners | 12/2011 | 12/2014 | 460.2 | 54.9 | 15.2% | 405.3 | 420.0 | 140.5 | 94.9 | ||||||||||||
Lending Partners II | 6/2014 | 6/2017 | 1,335.9 | 156.8 | 3.7% | 1,179.1 | 668.3 | 870.4 | 833.9 | ||||||||||||
Lending Partners III | 4/2017 | (4) | 963.8 | 768.8 | 2.7% | 195.0 | — | 195.0 | 226.4 | ||||||||||||
Lending Partners Europe | 3/2015 | 3/2019 | 847.6 | 333.6 | 5.0% | 514.0 | 61.0 | 514.0 | 511.1 | ||||||||||||
Other Alternative Credit Vehicles | Various | Various | 7,775.5 | 3,748.2 | Various | 4,027.3 | 2,401.3 | 2,896.3 | 3,076.5 | ||||||||||||
Unallocated Commitments (2) | Various | Various | 450.0 | 450.0 | Various | — | — | — | — | ||||||||||||
Public Markets Total | 20,692.0 | 8,861.9 | 11,830.1 | 5,758.0 | 8,780.4 | 9,302.5 | |||||||||||||||
Total Eligible To Receive Carried Interest | $ | 144,600.8 | $ | 57,417.4 | $ | 89,507.0 | $ | 89,680.2 | $ | 45,008.7 | $ | 60,875.0 | |||||||||
(1) The “Invested” and “Realized” columns include the amounts of any realized investments that restored the unused capital commitments of the fund investors, if any.
(2) Represents unallocated commitments from our strategic investor partnerships.
(3) The "Commitment" and "Uncalled Commitments" columns include income that is eligible to be reinvested if permitted under the terms of the investment vehicle agreements.
(4) Three years from final closing date.
Page 12
KKR | ||||||||||||
INVESTMENT VEHICLE SUMMARY (UNAUDITED) (CONTINUED) | ||||||||||||
As of June 30, 2018 | ||||||||||||
(Amounts in millions) | ||||||||||||
Uncalled Commitments | Remaining Fair Value | Total | ||||||||||
Carried Interest Eligible | $ | 57,417.4 | $ | 60,875.0 | $ | 118,292.4 | ||||||
Incentive Fee Eligible | ||||||||||||
Hedge Funds (1) | — | 15,698.4 | 15,698.4 | |||||||||
BDCs | — | 17,257.9 | 17,257.9 | |||||||||
KKR Real Estate Finance Trust Inc. | — | 1,064.0 | 1,064.0 | |||||||||
Other | — | 2,658.8 | 2,658.8 | |||||||||
Total Carried Interest and Incentive Fee Eligible | 57,417.4 | 97,554.1 | 154,971.5 | |||||||||
Collateralized Loan Obligations (CLOs) | — | 12,133.0 | 12,133.0 | |||||||||
Leveraged Credit / Hedge Funds (1) / Other | — | 24,160.9 | 24,160.9 | |||||||||
Total Assets Under Management | $ | 57,417.4 | $ | 133,848.0 | $ | 191,265.4 | ||||||
(1) Hedge Funds represent KKR's pro rata portion of AUM of our strategic manager partnerships, which consist of minority stakes in hedge fund managers. Total AUM for Hedge Funds is $28,136.1 million, of which $15,698.4 million is incentive fee eligible. | ||||||||||||
KKR’s PORTION OF TOTAL UNCALLED COMMITMENTS TO ITS INVESTMENT FUNDS | ||||||||||
(Amounts in thousands) | ||||||||||
As of | ||||||||||
June 30, 2018 | December 31, 2017 | |||||||||
Private Markets | $ | 4,918,200 | $ | 5,345,500 | ||||||
Public Markets | 341,100 | 351,500 | ||||||||
Total | $ | 5,259,300 | $ | 5,697,000 | ||||||
Page 13
KKR | |||||||||
WEIGHTED AVERAGE COMMON UNITS OUTSTANDING AND ADJUSTED SHARES ELIGIBLE FOR DISTRIBUTION | |||||||||
The following table provides a reconciliation of KKR's Weighted Average GAAP Common Units Outstanding to Weighted Average Adjusted Shares and Weighted Average Adjusted Shares Eligible for Distribution: | |||||||||
Quarter Ended | |||||||||
June 30, 2018 | March 31, 2018 | June 30, 2017 | |||||||
Weighted Average GAAP Common Units Outstanding - Basic | 510,586,631 | 487,704,838 | 466,170,025 | ||||||
Adjustments: | |||||||||
Weighted Average Unvested Common Units and Other Securities (1) | 38,158,867 | 48,213,436 | 35,007,398 | ||||||
Weighted Average GAAP Common Units Outstanding - Diluted | 548,745,498 | 535,918,274 | 501,177,423 | ||||||
Adjustments: | |||||||||
Weighted Average KKR Holdings Units (2) | 319,040,229 | 335,016,218 | 346,473,324 | ||||||
Weighted Average Adjusted Shares | 867,785,727 | 870,934,492 | 847,650,747 | ||||||
Adjustments: | |||||||||
Weighted Average Unvested Common Units | (36,682,241 | ) | (46,492,490 | ) | (30,891,138 | ) | |||
Weighted Average Adjusted Shares Eligible for Distribution | 831,103,486 | 824,442,002 | 816,759,609 | ||||||
Six Months Ended | |||||||||
June 30, 2018 | June 30, 2017 | ||||||||
Weighted Average GAAP Common Units Outstanding - Basic | 499,208,944 | 459,967,395 | |||||||
Adjustments: | |||||||||
Weighted Average Unvested Common Units and Other Securities (1) | 43,158,376 | 38,975,899 | |||||||
Weighted Average GAAP Common Units Outstanding - Diluted | 542,367,320 | 498,943,294 | |||||||
Adjustments: | |||||||||
Weighted Average KKR Holdings Units (2) | 326,984,091 | 349,513,066 | |||||||
Weighted Average Adjusted Shares | 869,351,411 | 848,456,360 | |||||||
Adjustments: | |||||||||
Weighted Average Unvested Common Units | (41,560,265 | ) | (34,690,895 | ) | |||||
Weighted Average Adjusted Shares Eligible for Distribution | 827,791,146 | 813,765,465 | |||||||
The following table provides a reconciliation of KKR's GAAP Common Units Outstanding to Adjusted Shares, Adjusted Shares Eligible for Distribution and Outstanding Adjusted Shares: | |||||||||
As of | |||||||||
June 30, 2018 | December 31, 2017 | ||||||||
GAAP Common Units Outstanding - Basic | 524,341,874 | 486,174,736 | |||||||
Unvested Common Units and Other Securities (1) | 37,669,004 | 48,774,597 | |||||||
GAAP Common Units Outstanding - Diluted | 562,010,878 | 534,949,333 | |||||||
Adjustments: | |||||||||
KKR Holdings Units (2) | 304,107,762 | 335,971,334 | |||||||
Adjusted Shares | 866,118,640 | 870,920,667 | |||||||
Adjustments: | |||||||||
Unvested Common Units | (36,267,204 | ) | (46,475,176 | ) | |||||
Adjusted Shares Eligible for Distribution | 829,851,436 | 824,445,491 | |||||||
Adjustments: | |||||||||
Vested Other Securities | (1,401,800 | ) | (2,299,421 | ) | |||||
Outstanding Adjusted Shares | 828,449,636 | 822,146,070 | |||||||
(1) Represents unvested equity awards granted under the Equity Incentive Plan and vested other securities that are exchangeable into shares of Class A common stock. The issuance of shares of Class A common stock pursuant to such equity awards dilutes KKR common stockholders and KKR Holdings pro rata in accordance with their respective percentage interests in the KKR business.
(2) Shares that may be issued by KKR & Co. Inc. upon exchange of units in KKR Holdings L.P. for KKR Class A common stock.
Page 14
KKR
INFORMATION ON KEY SEGMENT & OTHER MEASURES (UNAUDITED)
KKR's segment reporting is presented prior to giving effect to the allocation of income (loss) between KKR & Co. Inc. and KKR Holdings L.P. and as such represent the business in total. In addition, KKR's segment reporting is presented without giving effect to the consolidation of the investment funds and collateralized financing entities that KKR manages as well as other consolidated entities that are not subsidiaries of KKR & Co. Inc. Effective with the quarter ended June 30, 2018, we are reporting as a single segment, which is consistent with KKR’s internal management reporting to its chief operating decision makers.
KKR discloses the following financial measures in this earnings release that are calculated and presented using methodologies other than in accordance with GAAP. We believe that providing these performance measures on a supplemental basis to our GAAP results is helpful to stockholders in assessing the overall performance of KKR’s business. These financial measures should not be considered as a substitute for similar financial measures calculated in accordance with GAAP. We caution readers that these non-GAAP financial measures may differ from the calculations of other investment managers, and as a result, may not be comparable to similar measures presented by other investment managers. Reconciliations of these non-GAAP financial measures to the most directly comparable financial measures calculated and presented in accordance with GAAP are included in Exhibit A.
Adjusted shares are used as a measure of the total common equity ownership of KKR that is held by KKR & Co. Inc. (including equity awards issued under the Amended and Restated KKR & Co. Inc. 2010 Equity Incentive Plan (the "Equity Incentive Plan"), but excluding preferred stock), KKR Holdings and other holders of securities exchangeable into Class A common stock of KKR & Co. Inc. and represent the fully diluted share count of Class A common stock using the if-converted method. We believe this measure is useful to stockholders as it provides an indication of the total common equity ownership of KKR as if all outstanding KKR Holdings units, equity awards issued under the Equity Incentive Plan and other exchangeable securities had been exchanged for Class A common stock of KKR & Co. Inc. The Series A and Series B Preferred Stock are not exchangeable for Class A common stock of KKR & Co. Inc.
Adjusted shares eligible for distribution represents the portion of total adjusted shares that are eligible to receive a distribution. We believe this measure is useful to stockholders as it provides insight into the calculation of amounts available for distribution on a per share basis. Weighted average adjusted shares eligible for distribution is used in the calculation of after-tax distributable earnings per share.
After-tax distributable earnings is a measure of KKR’s earnings on a segment basis excluding mark-to-market gains (losses). Starting with the second quarter of 2018, it is defined as the amount of realized earnings of KKR after deducting equity-based compensation that would be available for distribution to Class A common stockholders for a given reporting period. We believe that after-tax distributable earnings is useful to stockholders as it aligns KKR’s net realization performance with the manner in which KKR receives its revenues and determines compensation of its employees. After-tax distributable earnings does not represent and is not used to calculate actual dividends under KKR’s dividend policy. Historically equity-based compensation expense relating to the Equity Incentive Plan was not reflected in our calculation of after-tax distributable earnings. Under KKR’s current segment presentation, equity-based compensation expense is included in after-tax distributable earnings as a component of compensation expense in order to reflect the dilutive nature of these non-cash equity-based awards. KKR revised the definition of after-tax distributable earnings because KKR believes it currently reflects how management evaluates KKR’s business. For comparability, After-tax distributable earnings for the comparable prior periods have been calculated using this new definition.
Assets under management ("AUM") represent the assets managed or advised by KKR from which KKR is entitled to receive fees or a carried interest (either currently or upon deployment of capital), general partner capital, and assets managed or advised by strategic BDC partnership and strategic manager partnerships in which KKR holds a minority ownership interest. We believe this measure is useful to stockholders as it provides additional insight into the capital raising activities of KKR and its strategic manager partnerships and the overall activity in their investment funds and other managed capital. KKR calculates the amount of AUM as of any date as the sum of: (i) the fair value of the investments of KKR's investment funds; (ii) uncalled capital commitments from these funds, including uncalled capital commitments from which KKR is currently not earning management fees or carried interest; (iii) the fair value of investments in KKR's co-investment vehicles; (iv) the par value of outstanding CLOs (excluding CLOs wholly-owned by KKR); (v) KKR's pro rata portion of the AUM of strategic manager partnerships in which KKR holds a minority ownership interest, (vi) all of AUM of the strategic BDC partnership with FS Investments, and (vii) the fair value of other assets managed by KKR. The pro rata portion of the AUM of strategic manager partnerships is calculated based on KKR’s percentage ownership interest in such entities multiplied by such entity’s respective AUM. KKR's definition of AUM is not based on any definition of AUM that may be set forth in the agreements governing the investment funds, vehicles or accounts that it manages or calculated pursuant to any regulatory definitions.
Book value is a measure of the net assets of KKR’s reportable segment and is used by management primarily in assessing the unrealized value of KKR’s investments and other assets, including carried interest. We believe this measure is useful to stockholders as it provides additional insight into the assets and liabilities of KKR excluding the assets and liabilities that are allocated to noncontrolling interest holders and to the holders of the Series A and Series B Preferred stock.
Page 15
Capital invested is the aggregate amount of capital invested by (i) KKR’s investment funds, (ii) KKR's Principal Activities business line as a co-investment, if any, alongside KKR’s investment funds, and (iii) KKR's Principal Activities business line in connection with a syndication transaction conducted by KKR's Capital Markets business line, if any. Capital invested is used as a measure of investment activity at KKR during a given period. We believe this measure is useful to stockholders as it provides a measure of capital deployment across KKR’s business lines. Capital invested includes investments made using investment financing arrangements like credit facilities, as applicable. Capital invested excludes (i) investments in certain leveraged credit strategies, (ii) capital invested by KKR’s Principal Activities business line that is not a co-investment alongside KKR’s investment funds, and (iii) capital invested by KKR’s Principal Activities business line that is not invested in connection with a syndication transaction by KKR’s Capital Markets business line. Capital syndicated by KKR's Capital Markets business line to third parties other than KKR’s investment funds or Principal Activities business line is not included in capital invested. See also syndicated capital.
Cash and short-term investments represent cash and liquid short-term investments in high-grade, short-duration cash management strategies used by KKR to generate additional yield on our excess liquidity and is used by management in evaluating KKR’s liquidity position. We believe this measure is useful to stockholders as it provides additional insight into KKR’s available liquidity.
Fee paying AUM ("FPAUM") represents only the AUM from which KKR receives management fees. We believe this measure is useful to stockholders as it provides additional insight into the capital base upon which KKR earns management fees. FPAUM is the sum of all of the individual fee bases that are used to calculate KKR's and its strategic manager and BDC partnership management fees and differs from AUM in the following respects: (i) assets and commitments from which KKR does not receive a management fee are excluded (e.g., assets and commitments with respect to which it receives only carried interest or is otherwise not currently receiving a management fee) and (ii) certain assets, primarily in its private equity funds, are reflected based on capital commitments and invested capital as opposed to fair value because fees are not impacted by changes in the fair value of underlying investments.
Fee related earnings is a supplemental measure of earnings of KKR on a segment basis before performance income and investment income. KKR believes this measure may be useful to stockholders as it provides additional insight into the profitability of KKR’s fee generating management companies and capital markets businesses. Starting with the second quarter of 2018, fee related earnings is calculated as KKR’s total Fees and Other multiplied by KKR’s segment operating margin. For purposes of the fee related earnings calculation, segment operating margin is calculated as Segment Operating Earnings, before equity-based compensation, divided by total segment revenues. Historically, fee related earnings was calculated as operating earnings of KKR on a segment basis before performance income, related performance income compensation and investment income. KKR revised the definition of fee related earnings to provide supplemental information about fees generated from KKR’s management companies and capital markets business because KKR believes it provides increased transparency on KKR’s underlying financial results to the stockholders. Fee related earnings for the comparable prior periods have been calculated using this new definition.
Income taxes paid represents the implied current income tax provision that has been calculated assuming that all current taxable income is allocated to KKR & Co. Inc., which would occur following an exchange of all KKR Holdings units for Class A common stock of KKR & Co. Inc. The assumptions and methodology used to calculate the implied current income tax provision are consistent with those used in calculating the current tax provision for KKR & Co. Inc. under GAAP. The implied current income tax provision does not give effect to any tax savings or deductions that may result from the exchange of KKR Holdings units. KKR's segment balance sheet excludes the net impact of KKR's implied income tax provision and its tax provision under GAAP.
Outstanding adjusted shares represents the portion of total adjusted shares that would receive assets of KKR if it were to be liquidated as of a particular date. Outstanding adjusted shares is used to calculate book value per outstanding adjusted share, which we believe is useful to stockholders as it provides a measure of net assets of KKR’s reportable segment on a per share basis.
Segment operating earnings represents segment earnings before interest expense, preferred dividends, income attributable to noncontrolling interests and income taxes paid. We believe segment operating earnings is useful to stockholders as it provides a supplemental measure of our operating performance without taking into account items that we do not believe relate directly to operations.
Syndicated capital is generally the aggregate amount of capital in transactions originated by KKR and its investment funds and carry-yielding co-investment vehicles, which has been distributed to third parties in exchange for a fee. It does not include (i) capital invested in such transactions by KKR investment funds and carry-yielding co-investment vehicles, which is instead reported in capital invested, (ii) debt capital that is arranged as part of the acquisition financing of transactions originated by KKR investment funds and (iii) debt capital that is either underwritten or arranged on a best efforts basis. Syndicated capital is used as a measure of investment activity for KKR during a given period, and we believe that this measure is useful to stockholders as it provides additional insight into levels of syndication activity in KKR's Capital Markets business line and across KKR's investment platform.
Uncalled commitments are used as a measure of unfunded capital commitments that KKR’s investment funds and carry-paying co-investment vehicles have received from partners to contribute capital to fund future investments. We believe this measure is useful to stockholders as it provides additional insight into the amount of capital that is available to KKR’s investment funds to make future investments. Uncalled commitments are not reduced for investments completed using fund-level investment financing arrangements.
Page 16
KKR | ||||||||||||
EXHIBIT A | ||||||||||||
RECONCILIATION OF NET INCOME (LOSS) ATTRIBUTABLE TO KKR & CO. L.P. PER COMMON UNIT - BASIC (GAAP BASIS) | ||||||||||||
TO AFTER TAX DISTRIBUTABLE EARNINGS PER ADJUSTED SHARE ELIGIBLE FOR DISTRIBUTION AND SEGMENT EBITDA (UNAUDITED) | ||||||||||||
(Amounts in thousands, except common unit and per common unit amounts) | ||||||||||||
Quarter Ended | ||||||||||||
June 30, 2018 | March 31, 2018 | June 30, 2017 | ||||||||||
Net Income (Loss) Attributable to KKR & Co. L.P. Per Common Unit - Basic | $ | 1.33 | $ | 0.36 | $ | 0.87 | ||||||
Weighted Average Common Units Outstanding - Basic | 510,586,631 | 487,704,838 | 466,170,025 | |||||||||
Net Income (Loss) Available to KKR & Co. L.P. Common Unitholders | $ | 680,381 | $ | 173,204 | $ | 405,646 | ||||||
Less: Excess of carrying value over consideration transferred on redemption of KFN 7.375% Series A LLC Preferred Shares | — | 3,102 | — | |||||||||
Net Income (Loss) Attributable to KKR & Co. L.P. Common Unitholders | $ | 680,381 | $ | 170,102 | $ | 405,646 | ||||||
Add: Net Income (Loss) Attributable to Noncontrolling Interests held by KKR Holdings L.P. | 449,859 | 121,002 | 305,280 | |||||||||
Add: Equity-based and Other Compensation - KKR Holdings L.P. | 29,247 | 32,695 | 42,964 | |||||||||
Add: Amortization of Intangibles and Other, net | (50,643 | ) | 47,709 | 4,524 | ||||||||
Add: One-time Non-recurring Costs (1) | 11,501 | — | — | |||||||||
Add: Realized Losses on Certain Investments (2) | 729,425 | — | — | |||||||||
Deduct: Unrealized Carried Interest | 163,442 | (111,732 | ) | 296,719 | ||||||||
Deduct: Net Unrealized Gains (Losses) | 1,389,869 | 207,862 | 307,977 | |||||||||
Add: Unrealized Performance Income Compensation | 67,092 | (43,123 | ) | 119,774 | ||||||||
Add: Income Tax Provision | 60,960 | 17,641 | 18,538 | |||||||||
Deduct: Income Taxes Paid | 19,820 | 14,168 | 15,084 | |||||||||
After-tax Distributable Earnings | $ | 404,691 | $ | 235,728 | $ | 276,946 | ||||||
Weighted Average Adjusted Shares Eligible for Distribution | 831,103,486 | 824,442,002 | 816,759,609 | |||||||||
After-tax Distributable Earnings Per Adjusted Share Eligible for Distribution | $ | 0.49 | $ | 0.29 | $ | 0.34 | ||||||
After-tax Distributable Earnings | $ | 404,691 | $ | 235,728 | $ | 276,946 | ||||||
Add: Equity-based Compensation (Equity Incentive Plan) | 58,198 | 67,796 | 44,976 | |||||||||
Add: Income (Loss) Attributable to Segment Noncontrolling Interests | 1,082 | 1,203 | 1,180 | |||||||||
Add: Segment Income Taxes Paid | 19,820 | 14,168 | 15,084 | |||||||||
Add: Preferred Dividends | 8,341 | 8,341 | 8,341 | |||||||||
Add: Core Interest Expense (3) | 32,308 | 31,443 | 30,642 | |||||||||
Add: Depreciation and Amortization | 3,775 | 3,709 | 3,864 | |||||||||
Segment EBITDA (4) | $ | 528,215 | $ | 362,388 | $ | 381,033 | ||||||
(1) Represents non-recurring costs in connection with the Conversion.
(2) Represents losses on certain investments which were realized in the second quarter in advance of the Conversion.
(3) Core interest expense may be used by certain debt investors as an alternative measurement of interest expense incurred by KKR on a segment basis and excludes interest expense related to debt obligations from investment financing arrangements related to certain of KKR’s investment funds, investment vehicles and principal investments and also excludes interest expense incurred by KFN. The financing arrangements excluded from core interest expense are not direct obligations of the general partners of KKR’s private equity funds or its management companies, and in the case of debt obligations of KFN, are non-recourse to KKR beyond the assets of KFN. KKR believes this measure is useful to stockholders as it provides an indication of the amount of interest expense borne by KKR excluding interest expense that is allocated to KKR’s investment funds, other noncontrolling interest holders and KFN. Additionally, we believe this measure is useful for analyzing KKR’s ability to service its debt obligations other than the debt obligations of KFN.
(4) Segment EBITDA may be useful in evaluating KKR's ability to service its debt and provides insight into the amount of KKR’s distributable earnings before the impact of interest expense, taxes, depreciation and amortization, equity-based compensation, preferred distributions and segment noncontrolling interests.
Page 17
KKR | ||||||||||
EXHIBIT A (CONTINUED) | ||||||||||
RECONCILIATION OF NET INCOME (LOSS) ATTRIBUTABLE TO KKR & CO. L.P. PER COMMON UNIT - BASIC (GAAP BASIS) | ||||||||||
TO AFTER TAX DISTRIBUTABLE EARNINGS PER ADJUSTED SHARE ELIGIBLE FOR DISTRIBUTION AND SEGMENT EBITDA (UNAUDITED) | ||||||||||
(Amounts in thousands, except common unit and per common unit amounts) | ||||||||||
Six Months Ended | ||||||||||
June 30, 2018 | June 30, 2017 | |||||||||
Net Income (Loss) Attributable to KKR & Co. L.P. Per Common Unit - Basic | $ | 1.71 | $ | 1.45 | ||||||
Weighted Average Common Units Outstanding - Basic | 499,208,944 | 459,967,395 | ||||||||
Net Income (Loss) Available to KKR & Co. L.P. Common Unitholders | $ | 853,585 | $ | 664,989 | ||||||
Less: Excess of carrying value over consideration transferred on redemption of KFN 7.375% Series A LLC Preferred Shares | 3,102 | — | ||||||||
Net Income (Loss) Attributable to KKR & Co. L.P. Common Unitholders | $ | 850,483 | $ | 664,989 | ||||||
Add: Net Income (Loss) Attributable to Noncontrolling Interests held by KKR Holdings L.P. | 570,861 | 521,712 | ||||||||
Add: Equity-based and Other Compensation - KKR Holdings L.P. | 61,942 | 104,057 | ||||||||
Add: Amortization of Intangibles and Other, net | (2,934 | ) | 37,361 | |||||||
Add: One-time Non-recurring Costs (1) | 11,501 | — | ||||||||
Add: Realized Losses on Certain Investments (2) | 729,425 | — | ||||||||
Deduct: Unrealized Carried Interest | 51,710 | 437,345 | ||||||||
Deduct: Net Unrealized Gains (Losses) | 1,597,731 | 512,013 | ||||||||
Add: Unrealized Performance Income Compensation | 23,969 | 176,988 | ||||||||
Add: Income Tax Provision | 78,601 | 59,080 | ||||||||
Deduct: Income Taxes Paid | 33,988 | 41,359 | ||||||||
After-tax Distributable Earnings | $ | 640,419 | $ | 573,470 | ||||||
Weighted Average Adjusted Shares Eligible for Distribution | 827,791,146 | 813,765,465 | ||||||||
After-tax Distributable Earnings Per Adjusted Share Eligible for Distribution | $ | 0.77 | $ | 0.70 | ||||||
After-tax Distributable Earnings | $ | 640,419 | $ | 573,470 | ||||||
Add: Equity-based Compensation (Equity Incentive Plan) | 125,994 | 94,919 | ||||||||
Add: Income (Loss) Attributable to Segment Noncontrolling Interests | 2,285 | 2,764 | ||||||||
Add: Segment Income Taxes Paid | 33,988 | 41,359 | ||||||||
Add: Preferred Dividends | 16,682 | 16,682 | ||||||||
Add: Core Interest Expense | 63,751 | 59,804 | ||||||||
Add: Depreciation and Amortization | 7,484 | 8,041 | ||||||||
Segment EBITDA | $ | 890,603 | $ | 797,039 | ||||||
(1) Represents non-recurring costs in connection with the Conversion.
(2) Represents losses on certain investments which were realized in the second quarter in advance of the Conversion.
Page 18
KKR | ||||||||||||
EXHIBIT A (CONTINUED) | ||||||||||||
RECONCILIATION OF TOTAL GAAP REVENUES TO TOTAL SEGMENT REVENUES (UNAUDITED) | ||||||||||||
(Amounts in thousands) | ||||||||||||
Quarter Ended | ||||||||||||
June 30, 2018 | March 31, 2018 | June 30, 2017 | ||||||||||
Total GAAP Revenues | $ | 971,620 | $ | 472,606 | $ | 1,015,800 | ||||||
Add: Management Fees - Consolidated Funds and Other | 101,431 | 64,596 | 54,072 | |||||||||
Deduct: Fee Credits - Consolidated Funds | 18,174 | 14,721 | 2,707 | |||||||||
Deduct: Capital Allocation-Based Income (GAAP) | 557,774 | 78,212 | 635,015 | |||||||||
Add: Segment Realized Carried Interest | 342,089 | 202,555 | 264,668 | |||||||||
Add: Segment Realized Investment Income (Loss) | 168,708 | 80,452 | 75,016 | |||||||||
Deduct: Revenue Earned by Other Consolidated Entities | 31,128 | 25,465 | 28,290 | |||||||||
Deduct: Expense Reimbursements | 50,576 | 20,211 | 36,076 | |||||||||
Total Segment Revenues | $ | 926,196 | $ | 681,600 | $ | 707,468 | ||||||
Six Months Ended | ||||||||||||
June 30, 2018 | June 30, 2017 | |||||||||||
Total GAAP Revenues | $ | 1,444,226 | $ | 1,783,555 | ||||||||
Add: Management Fees - Consolidated Funds and Other | 166,027 | 101,964 | ||||||||||
Deduct: Fee Credits - Consolidated Funds | 32,895 | 3,646 | ||||||||||
Deduct: Capital Allocation-Based Income (GAAP) | 635,986 | 1,022,591 | ||||||||||
Add: Segment Realized Carried Interest | 544,644 | 470,872 | ||||||||||
Add: Segment Realized Investment Income (Loss) | 249,160 | 211,349 | ||||||||||
Deduct: Revenue Earned by Other Consolidated Entities | 56,593 | 54,665 | ||||||||||
Deduct: Expense Reimbursements | 70,787 | 59,625 | ||||||||||
Total Segment Revenues | $ | 1,607,796 | $ | 1,427,213 | ||||||||
RECONCILIATION OF TOTAL GAAP EXPENSES TO TOTAL SEGMENT EXPENSES (UNAUDITED) | ||||||||||||
(Amounts in thousands) | ||||||||||||
Quarter Ended | ||||||||||||
June 30, 2018 | March 31, 2018 | June 30, 2017 | ||||||||||
Total GAAP Expenses | $ | 675,050 | $ | 436,601 | $ | 629,728 | ||||||
Deduct: Equity-based and Other Compensation - KKR Holdings L.P. | 29,247 | 32,695 | 42,964 | |||||||||
Deduct: Segment Unrealized Performance Income Compensation | 67,092 | (43,123 | ) | 119,774 | ||||||||
Deduct: Amortization of Intangibles | 1,317 | 5,030 | 5,062 | |||||||||
Deduct: Reimbursable Expenses | 56,312 | 26,093 | 43,438 | |||||||||
Deduct: Operating Expenses relating to Other Consolidated Entities | 53,114 | 44,309 | 44,093 | |||||||||
Deduct: One-time Non-recurring Costs (1) | 11,501 | — | — | |||||||||
Add: Other | (9,679 | ) | 371 | (15,506 | ) | |||||||
Total Segment Expenses | $ | 446,788 | $ | 371,968 | $ | 358,891 | ||||||
Six Months Ended | ||||||||||||
June 30, 2018 | June 30, 2017 | |||||||||||
Total GAAP Expenses | $ | 1,111,651 | $ | 1,169,742 | ||||||||
Deduct: Equity-based and Other Compensation - KKR Holdings L.P. | 61,942 | 104,057 | ||||||||||
Deduct: Segment Unrealized Performance Income Compensation | 23,969 | 176,988 | ||||||||||
Deduct: Amortization of Intangibles | 6,347 | 11,428 | ||||||||||
Deduct: Reimbursable Expenses | 82,405 | 72,237 | ||||||||||
Deduct: Operating Expenses relating to Other Consolidated Entities | 97,423 | 77,873 | ||||||||||
Deduct: One-time Non-recurring Costs (1) | 11,501 | — | ||||||||||
Add: Other | (9,308 | ) | (22,956 | ) | ||||||||
Total Segment Expenses | $ | 818,756 | $ | 704,203 | ||||||||
(1) Represents non-recurring costs in connection with the Conversion.
Page 19
KKR | |||||||||||||||||||||||
EXHIBIT A (CONTINUED) | |||||||||||||||||||||||
RECONCILIATION OF CONDENSED CONSOLIDATED STATEMENTS OF FINANCIAL CONDITION (GAAP BASIS) | |||||||||||||||||||||||
TO SEGMENT BALANCE SHEET (UNAUDITED) | |||||||||||||||||||||||
June 30, 2018 | |||||||||||||||||||||||
(Amounts in thousands) | |||||||||||||||||||||||
CONDENSED CONSOLIDATED STATEMENT OF FINANCIAL CONDITION (GAAP BASIS) | 1 | 2 | 3 | 4 | 5 | SEGMENT BALANCE SHEET | |||||||||||||||||
Assets | |||||||||||||||||||||||
Cash and Cash Equivalents | $ | 2,065,172 | — | — | 708,157 | — | (7,683 | ) | $ | 2,765,646 | Cash and Short-term Investments | ||||||||||||
Investments | 42,622,545 | (29,924,613 | ) | (1,242,835 | ) | (1,691,112 | ) | — | — | 9,763,985 | Investments | ||||||||||||
— | — | 1,691,112 | — | — | 1,691,112 | Unrealized Carried Interest | |||||||||||||||||
Other Assets | 3,884,947 | 222,750 | — | (869,382 | ) | — | (143,600 | ) | 3,094,715 | Other Assets | |||||||||||||
— | — | 161,225 | — | — | 161,225 | Corporate Real Estate | |||||||||||||||||
Total Assets | $ | 48,572,664 | (29,701,863 | ) | (1,242,835 | ) | — | — | (151,283 | ) | $ | 17,476,683 | |||||||||||
Liabilities and Equity | |||||||||||||||||||||||
Debt Obligations | 19,972,383 | (16,659,573 | ) | — | (948,517 | ) | — | — | 2,364,293 | Debt Obligations - KKR (ex-KFN) | |||||||||||||
— | — | 948,517 | — | — | 948,517 | Debt Obligations - KFN | |||||||||||||||||
Other Liabilities | 4,313,091 | (2,219,130 | ) | (1,242,835 | ) | — | — | (123,272 | ) | 727,854 | Other Liabilities | ||||||||||||
Total Liabilities | 24,285,474 | (18,878,703 | ) | (1,242,835 | ) | — | — | (123,272 | ) | 4,040,664 | |||||||||||||
Redeemable Noncontrolling Interests | 962,147 | (962,147 | ) | — | — | — | — | ||||||||||||||||
Equity | |||||||||||||||||||||||
Series A Preferred Units | 332,988 | — | — | (332,988 | ) | — | — | ||||||||||||||||
Series B Preferred Units | 149,566 | — | — | (149,566 | ) | — | — | ||||||||||||||||
KKR & Co. L.P. Capital - Common Unitholders | 7,909,830 | 196,032 | — | (17,446 | ) | 4,852,877 | (28,011 | ) | 12,913,282 | Book Value | |||||||||||||
Noncontrolling Interests | 14,932,659 | (10,057,045 | ) | — | — | (4,852,877 | ) | — | 22,737 | Noncontrolling Interests | |||||||||||||
— | — | 500,000 | — | — | 500,000 | Preferred Stock | |||||||||||||||||
Total Liabilities and Equity | $ | 48,572,664 | (29,701,863 | ) | (1,242,835 | ) | — | — | (151,283 | ) | $ | 17,476,683 | |||||||||||
1 | IMPACT OF CONSOLIDATION OF INVESTMENT VEHICLES AND OTHER ENTITIES | ||||||||||||||||||||||
2 | CARRY POOL RECLASSIFICATION | ||||||||||||||||||||||
3 | OTHER RECLASSIFICATIONS | ||||||||||||||||||||||
4 | NONCONTROLLING INTERESTS HELD BY KKR HOLDINGS L.P. AND OTHER | ||||||||||||||||||||||
5 | EQUITY IMPACT OF KKR MANAGEMENT HOLDINGS CORP. | ||||||||||||||||||||||
Page 20
KKR | |||||||||||||||||||||||
EXHIBIT A (CONTINUED) | |||||||||||||||||||||||
RECONCILIATION OF CONDENSED CONSOLIDATED STATEMENTS OF FINANCIAL CONDITION (GAAP BASIS) | |||||||||||||||||||||||
TO SEGMENT BALANCE SHEET (UNAUDITED) | |||||||||||||||||||||||
DECEMBER 31, 2017 | |||||||||||||||||||||||
(Amounts in thousands) | |||||||||||||||||||||||
CONDENSED CONSOLIDATED STATEMENT OF FINANCIAL CONDITION (GAAP BASIS) | 1 | 2 | 3 | 4 | 5 | SEGMENT BALANCE SHEET | |||||||||||||||||
Assets | |||||||||||||||||||||||
Cash and Cash Equivalents | $ | 1,876,687 | — | — | 1,338,107 | — | — | $ | 3,214,794 | Cash and Short-term Investments | |||||||||||||
Investments | 39,013,934 | (27,684,368 | ) | (1,220,559 | ) | (1,620,401 | ) | — | — | 8,488,606 | Investments | ||||||||||||
— | — | 1,620,401 | — | — | 1,620,401 | Unrealized Carried Interest | |||||||||||||||||
Other Assets | 4,944,098 | (974,710 | ) | — | (1,499,332 | ) | — | (193,770 | ) | 2,276,286 | Other Assets | ||||||||||||
— | — | 161,225 | — | — | 161,225 | Corporate Real Estate | |||||||||||||||||
Total Assets | $ | 45,834,719 | (28,659,078 | ) | (1,220,559 | ) | — | — | (193,770 | ) | $ | 15,761,312 | |||||||||||
Liabilities and Equity | |||||||||||||||||||||||
Debt Obligations | 21,193,859 | (18,429,092 | ) | — | (764,767 | ) | — | — | 2,000,000 | Debt Obligations - KKR (ex-KFN) | |||||||||||||
— | — | 764,767 | — | — | 764,767 | Debt Obligations - KFN | |||||||||||||||||
— | — | 373,750 | — | — | 373,750 | Preferred Shares - KFN | |||||||||||||||||
Other Liabilities | 3,978,060 | (2,207,518 | ) | (1,220,559 | ) | — | — | (123,284 | ) | 426,699 | Other Liabilities | ||||||||||||
Total Liabilities | 25,171,919 | (20,636,610 | ) | (1,220,559 | ) | 373,750 | — | (123,284 | ) | 3,565,216 | |||||||||||||
Redeemable Noncontrolling Interests | 610,540 | (610,540 | ) | — | — | — | — | ||||||||||||||||
Equity | |||||||||||||||||||||||
Series A Preferred Units | 332,988 | — | — | (332,988 | ) | — | — | ||||||||||||||||
Series B Preferred Units | 149,566 | — | — | (149,566 | ) | — | — | ||||||||||||||||
KKR & Co. L.P. Capital - Common Unitholders | 6,703,382 | 214,188 | — | (17,446 | ) | 4,844,271 | (70,486 | ) | 11,673,909 | Book Value | |||||||||||||
Noncontrolling Interests | 12,866,324 | (7,626,116 | ) | — | (373,750 | ) | (4,844,271 | ) | — | 22,187 | Noncontrolling Interests | ||||||||||||
— | — | 500,000 | — | — | 500,000 | Preferred Stock | |||||||||||||||||
Total Liabilities and Equity | $ | 45,834,719 | (28,659,078 | ) | (1,220,559 | ) | — | — | (193,770 | ) | $ | 15,761,312 | |||||||||||
1 | IMPACT OF CONSOLIDATION OF INVESTMENT VEHICLES AND OTHER ENTITIES | ||||||||||||||||||||||
2 | CARRY POOL RECLASSIFICATION | ||||||||||||||||||||||
3 | OTHER RECLASSIFICATIONS | ||||||||||||||||||||||
4 | NONCONTROLLING INTERESTS HELD BY KKR HOLDINGS L.P. AND OTHER | ||||||||||||||||||||||
5 | EQUITY IMPACT OF KKR MANAGEMENT HOLDINGS CORP. | ||||||||||||||||||||||
Page 21