Attached files
| file | filename |
|---|---|
| EX-99.1 - EXHIBIT 99.1 - GAIN Capital Holdings, Inc. | ex9916-30x18earningsrelease.htm |
| 8-K - 8-K - GAIN Capital Holdings, Inc. | form8-kq22018earnings.htm |

Q2 and First Half 2018 Results July 2018 1

SAFE HARBOR STATEMENT Forward Looking Statements In addition to historical information, this earnings presentation contains "forward-looking" statements that reflect management's expectations for the future. A variety of important factors could cause results to differ materially from such statements. These factors are noted throughout GAIN Capital's annual report on Form 10-K for the year ended December 31, 2017, as filed with the Securities and Exchange Commission on March 14, 2018, and include, but are not limited to, the actions of both current and potential new competitors, fluctuations in market trading volumes, financial market volatility, evolving industry regulations, errors or malfunctions in GAIN Capital’s systems or technology, rapid changes in technology, effects of inflation, customer trading patterns, the success of our products and service offerings, our ability to continue to innovate and meet the demands of our customers for new or enhanced products, our ability to successfully integrate assets and companies we have acquired, our ability to effectively compete, changes in tax policy or accounting rules, fluctuations in foreign exchange rates and commodity prices, adverse changes or volatility in interest rates, as well as general economic, business, credit and financial market conditions, internationally or nationally, and our ability to continue paying a quarterly dividend in light of future financial performance and financing needs. The forward-looking statements included herein represent GAIN Capital’s views as of the date of this release. GAIN Capital undertakes no obligation to revise or update publicly any forward-looking statement for any reason unless required by law. Non-GAAP Financial Measures This presentation contains various non-GAAP financial measures, including adjusted EBITDA, adjusted net income, and adjusted EPS. These non-GAAP financial measures have certain limitations, including that they do not have a standardized meaning and, therefore, our definitions may be different from similar non-GAAP financial measures used by other companies and/ or analysts. Thus, it may be more difficult to compare our financial performance to that of other companies. We believe our reporting of these non-GAAP financial measures assists investors in evaluating our historical and expected operating performance. However, because these are not measures of financial performance calculated in accordance with GAAP, such measures should be considered in addition to, but not as a substitute for, other measures of our financial performance reported in accordance with GAAP, such as net income. See the Appendix for a reconciliation of the non-GAAP financial measures used herein to the most directly comparable GAAP measure. 2

SECOND QUARTER AND FIRST HALF 2018 REVIEW • Completed sale of GTX business to Deutsche Börse Group via its FX unit, 360T – Purchase price of $100 million, with net proceeds for GAIN of approximately $85 million • Q2 2018 net revenue from continuing operations decreased 7% year-over-year to $84.2 million, compared to $90.6 million in Q2 2017 – First half 2018 net revenue from continuing operations1 increased 29% year-over-year to $182.5 million, compared to $141.8 million in the first half of 2017 • Q2 2018 net income from continuing operations of $6.8 million, compared to $13.5 million in Q2 2017 – First half 2018 net income from continuing operations of $18.7 million, compared to $(4.9) million in the first half of 2017 • Q2 2018 adjusted EBITDA from continuing operations of $19.0 million, compared to $25.7 million in Q2 2017; Adjusted EBITDA margin of 23% – First half 2018 adjusted EBITDA from continuing operations of $50.8 million , compared to $11.0 million in first half 2017; Adjusted EBITDA margin of 28% 1 Continuing Operations includes financial information from the Company excluding results from the Institutional business. See slides 26 and 27 for a quarterly reconciliation of total company to continuing operations 3

2018 AND BEYOND – STRATEGIC PRIORITIES Deliver Organic Growth Increase Operational Excellence Reduce Revenue Volatility • Focus on direct business, • Increase automation and reduce • Increase efficiency of revenue leveraging brand assets & service costs capture existing global footprint • Simplify technology “stack” • Implement AI-driven hedging • Significantly increase marketing • Automation of operational program spend to drive growth in direct processes • Decrease cost of hedging clients • Rationalize and refocus brands • Further optimize trade flow from • Enhance products and services • Optimize insource vs. outsource indirect business • Optimize client onboarding 4

DELIVERING ORGANIC GROWTH - FOCUS ON DIRECT BUSINESS Focusing on our direct customers will lead to margin expansion and increased client engagement 2 New Direct Accounts Trailing 3-Month Active Accounts New Direct Accounts increased 8% y/y and decreased (21)% q/q 1.4 100,000 1.2 25,000 80,000 1.0 20,000 60,000 0.8 40,000 0.6 15,000 20,000 0.4 Q2'16 Q3'16 Q4'16 Q1'17 Q2'17 Q3'17 Q4'17 Q1'18 Q2'18 10,000 1 5,000 Direct Indirect FXCM GVIX Q2'16 Q3'16 Q4'16 Q1'17 Q2'17 Q3'17 Q4'17 Q1'18 Q2'18 Volume Mix Direct Volume per Active3 Year-over-year direct volume growth Increased 11% y/y and decreased (14)% q/q 10 Q2' 17 Q2' 18 ) s 8 n o i l l Indirect Indirect i 6 M 31% 25% ( $ 4 Direct Direct 69% 75% 2 Q2'16 Q3'16 Q4'16 Q1'17 Q2'17 Q3'17 Q4'17 Q1'18 Q2'18 1. GVIX, GAIN’s volatility indicator, is a metric calculated daily by volume weighting the 5-Day % average true ranges (ATR) of 6 of our major products (Dax, EUR/USD, GBP/USD, USD/JPY, Dow and Gold). The volume weights are based on the relative monthly volumes across these 6 markets. 2. New direct accounts are defined as organically acquired clients that opened an account during the corresponding period. By definition this figure will exclude the FXCM clients that were inorganically acquired in February 2017. 3. Includes FXCM. 5

INCREASING MARKETING SPEND TO ACCELERATE ORGANIC GROWTH • Highly efficient marketing spend at current levels – Typical payback period of 3-6 months – IRR of >400% in all markets based on 3-year Customer LTVs • Opportunities identified to increase marketing spend across majority of GAIN's regional markets – Leveraging 2017 investments in customer segmentation and LTV modeling, marketing technology and analytics, global affiliate program, and digital marketing talent to ramp spend efficiently • Marketing investments have improved our media targeting abilities, expanded our available marketing channels, enabled automated prospect nurturing and early identification of high-value clients • Real-time tracking and reporting is in place to support rapid optimization and serves as an ongoing ROI measurement • Expect H2'18 spend to be approximately $18 million, an increase of 50% compared to $12.4 million in H1'18 • Increased investment aimed to drive a material increase in new accounts during H2'18 and into 2019 6

DELIVERING ORGANIC GROWTH THROUGH PRODUCT INNOVATION Continue to invest in new products and services: • New web trading platform launching in August, following successful UK Beta program • Ongoing enhancements to mobile apps – Represent about 57% of customer volume • Expanded crypto offering in place and now available to partners1 – Well-positioned for renewed client demand • Upgrading existing Metatrader offering to include support for MT5, a popular trading platform in APAC markets • Global service enhancements for high value clients, including expanded Premium Account package and bespoke Professional Client offering for UK/EU • Direct Market Access (DMA) initiative, Prime of Prime agency execution for high volume FX traders – Scheduled to launch in US market in Q3 1. Where permitted by regulation. 7

REDUCING REVENUE VOLATILITY • Began implementing new AI-driven hedging model in $160 late Q1 to reduce variability in quarterly RPM $140 • Early days, but some encouraging results: $120 $107 – Increasing correlation between revenue and $106 $100 volume $100 – Reduced standard deviation of daily P&L by 11%1 $80 2 $62 – Improved Sharpe ratio by 20% $60 $40 • Q2 RPM of $106 in line with the prior quarter – RPM for TTM of $100 $20 $0 • Rolling out initially for FX as Phase 1 of a multi-phase Q2 16 Q3 16 Q4 16 Q1 17 Q2 17 Q3 17 Q4 17 Q1 18 Q2 18 plan which will extend throughout 2018 and into 2019 Quarterly Trailing 12 Months 1. Q218 compared to the trailing twelve months to March 2018 across all asset classes 8 2. The Sharpe ratio is a measure of risk v return, the higher the ratio the better the return per unit of risk. Calculated as daily revenue / standard deviation of revenue.

GTX TRANSACTION INCREASES FINANCIAL AND OPERATIONAL FLEXIBILITY • Following the completion of the sale of GAIN’s GTX ECN business to Deutsche Börse Group for $100 million, the Company received approximately $85 million, net of taxes and transaction-related expenses and fees • GAIN intends to use the approximately $85 million of net proceeds to: – Invest in organic growth – Increase active share repurchase program – Maintain additional flexibility for M&A opportunities 9
REGULATORY UPDATE • ESMA and FCA regulatory changes in the provision of CFDs, which will apply to retail clients in the UK and EU, will go into effect on August 1st – Clients classified as "professional" will not be subject to the new leverage rules ▪ Continued to expect revenue impact in 2018 to be immaterial – As a result of the new ESMA/FCA rules, GetGo is being withdrawn from the UK/EU market ▪ GetGo to be launched in other jurisdictions and signals technology to be included in our core trading platforms – New regulations expected to decrease the number of providers operating in the UK/EU ▪ With our strong brands we are confident we can win market share 10

Financial Review 11

KEY FINANCIAL RESULTS & OPERATING METRICS 3 Months Ended June 30, First Half $ Change 2018 2017 2018 2017 Q2 First Half As Reported Net Revenue $ 84.2 $ 90.6 $ 182.5 $ 141.8 $ (6.4) $ 40.7 Operating Expenses (65.2) (64.9) (131.7) (130.8) (0.3) (0.9) Adjusted EBITDA(1) $ 19.0 $ 25.7 $ 50.8 $ 11.0 $ (6.7) $ 39.8 Adjusted EBITDA Margin % 23% 28% 28% 8% (5 pts) 20 pts Net Income/(Loss) from Continuing Operations $ 6.8 $ 13.5 $ 18.7 $ (4.9) $ (6.7) $ 23.6 Adjusted Net Income/(Loss)(1) $ 4.4 $ 11.3 $ 18.4 $ (7.4) $ (6.9) $ 25.8 Net Income from Discontinued Operations $ 60.6 $ 0.6 $ 65.0 $ 0.2 $ 60.0 $ 64.8 Combined Adjusted Net Income/(Loss) $ 5.6 $ 11.8 $ 20.9 $ (6.8) $ (6.2) $ 27.7 GAAP Diluted EPS from continuing and discontinued operations $ 1.47 $ 0.31 $ 1.81 $ (0.08) $ 1.16 $ 1.89 Adjusted Diluted EPS(1) $ 0.10 $ 0.24 $ 0.40 $ (0.15) $ (0.14) $ 0.55 Combined Adjusted Diluted EPS(1) $ 0.12 $ 0.25 $ 0.46 $ (0.14) $ (0.13) $ 0.60 Operating Metrics(2) Retail OTC ADV (bns) $ 10.6 $ 9.9 $ 11.5 $ 9.7 $ 0.7 $ 1.8 Institutional ADV (bns) $ 17.3 $ 13.2 $ 17.3 $ 14.1 $ 4.1 $ 3.2 ECN 15.0 11.0 14.9 11.3 $ 4.0 $ 3.6 Swap Dealer 2.3 2.2 2.4 2.8 $ 0.1 $ (0.4) Avg. Daily Futures Contracts 32,401 26,272 33,871 29,726 $ 6,129 $ 4,145 Note: Dollars in millions, except per share data. Columns may not add due to rounding. (1) This is a non-GAAP financial measure. Please see the appendix to this presentation for a reconciliation to the corresponding GAAP financial measure. 12 (2) Definitions for operating metrics are available in the appendix to this presentation.

OPERATING SEGMENT RESULTS: RETAIL Retail Financial & Operating Results • H1'18 ADV increased 19% year-over-year to $11.5 3 Months Ended June 30, First Half billion 2018 2017 2018 2017 TTM 6/30/18 – Q2 ADV increased 7% year-over-year to $10.6 Trading Revenue $72.1 $79.1 $156.3 $118.0 $269.4 billion Other Retail Revenue 2.4 1.5 3.9 2.7 7.6 Total Revenue $74.5 $80.6 $160.2 $120.7 $276.9 • H1'18 RPM of $106, of 12% vs H1'17 RPM of $93 – Q2 RPM of $106 was in line with Q1 2018 Employee Comp & Ben 13.6 14.4 29.1 27.7 53.6 Marketing 6.5 7.2 12.2 16.1 25.9 • H1'18 total retail revenue increased 33% year-over- Referral Fees 7.0 9.8 14.7 22.1 32.3 year 1 Other Operating Exp. 18.3 15.2 36.0 28.6 65.3 – Q2 total retail revenue decreased 8% year- Segment Profit $29.1 $33.9 $68.2 $26.0 $99.7 over-year % Margin 39% 42% 43% 22% 36% • H1'18 profit margin improved to 43%, outpacing the Operating Metrics TTM average of 36% ADV (bns) $10.6 $9.9 $11.5 $9.7 $10.4 12 Month Trailing Active OTC Accounts 130,018 134,120 130,018 134,120 130,018 Client Assets $711.4 $732.9 $711.4 $732.9 $711.4 • Referral fees decreased both on an absolute and PnL/mm $106 $122 $106 $93 $100 per million basis Note: Dollars in millions, except where noted otherwise. Columns may not add due to rounding. 13

OPERATING SEGMENT RESULTS: FUTURES Futures Financial & Operating Results 3 Months Ended June First Half 2018 2017 2018 2017 TTM 6/30/18 Revenue $ 12.1 $ 10.0 $ 23.6 $ 21.0 $ 42.9 • Futures average daily contracts increased 23% to Employee Comp & Ben 2.9 2.5 5.4 5.0 9.7 32,401 during Q2, and approximately 10% above Marketing 0.2 0.2 0.4 0.5 0.7 TTM Referral Fees 3.4 3.5 7.2 7.6 13.5 Other Operating Exp. 3.6 3.2 7.3 7.0 13.3 • Q2 profit margin improved to 17%, up from 6% in Segment Profit $2.1 $ 0.6 $ 3.3 $ 0.9 $ 5.6 Q2 2017 % Margin 17 % 6 % 14 % 4 % 13 % – H1'18 profit margin improved to 14%, up Operating Metrics Avg. Daily Contracts 32,401 26,272 33,871 29,726 29,386 from 4% in H1'17 12 Month Trailing Active Futures 7,881 7,885 7,881 7,885 7,881 Client Assets $ 209 $ 214.4 $ 209 $ 214.4 $ 209 Revenue/Contract $ 5.84 $ 5.80 $ 5.57 $ 5.65 $ 5.82 Note: Dollars in millions, except where noted otherwise. Columns may not add due to rounding. 14

UPDATE ON FORECAST GLOBAL TAX RATE • Following the completed sale of the GTX business on June 29th, 2018, GAIN has updated its tax rate assumptions for full year 2018: – Excluding the GTX business, expect tax rate for the full year to be approximately 27%-28% – Including GTX results for the first half of 2018 and one-off costs related to the sale of the business, expect full year 2018 tax rate to be approximately 14% • Increase in forecast global tax rate for the ongoing business is due to – Improved H1 profits versus previous guidance – Sale of GTX, based in Bermuda with 0% Corporate tax rate 15

STRONG LIQUIDITY POSITION Total liquidity of $344 million at the end of Q2 2018 Required Liquidity • 43% improvement over Q1 2018 Reserves • 154% improvement over Q2 2017, supported by the implementation of $50 million credit revolver and the sale of GTX Ten acquisitions since IPO in 2010 Strategic Acquisitions Well positioned for future opportunities Total Liquidity: $344 million1 Quarterly dividend of $0.06 per share approved ▪ Record date: September 11, 2018 Quarterly Dividends ▪ Payment date: September 18, 2018 Repurchased 518,816 shares at an average share price of $7.85 during Q2 2018 Buyback Program Approximately $30 million authorized and remaining for additional repurchases 1. Includes $50 million credit revolver. Liquidity table available in appendix to this presentation. 16

POSITIONED TO DELIVER LONG-TERM VALUE Proven Leader in a Large, Attractive and Growing Market Highly Diverse and Scalable Business Model Multiple Levers to Drive Growth and Operational Efficiency Risk Management Controls Limit Market Volatility Headwinds Strong Financial and Credit Profile 17

Appendix 18
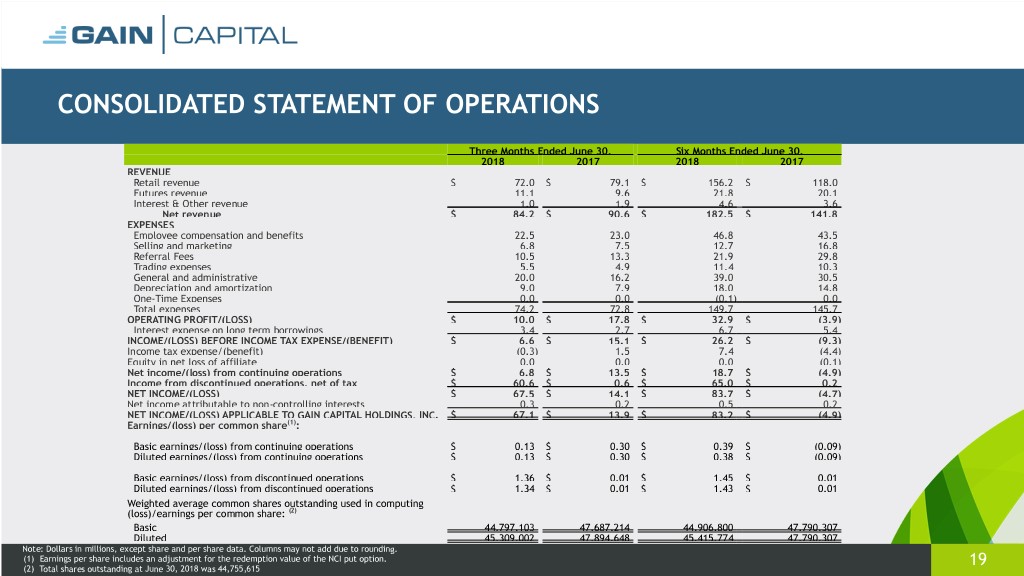
CONSOLIDATED STATEMENT OF OPERATIONS Three Months Ended June 30, Six Months Ended June 30, 2018 2017 2018 2017 REVENUE Retail revenue $ 72.0 $ 79.1 $ 156.2 $ 118.0 Futures revenue 11.1 9.6 21.8 20.1 Interest & Other revenue 1.0 1.9 4.6 3.6 Net revenue $ 84.2 $ 90.6 $ 182.5 $ 141.8 EXPENSES Employee compensation and benefits 22.5 23.0 46.8 43.5 Selling and marketing 6.8 7.5 12.7 16.8 Referral Fees 10.5 13.3 21.9 29.8 Trading expenses 5.5 4.9 11.4 10.3 General and administrative 20.0 16.2 39.0 30.5 Depreciation and amortization 9.0 7.9 18.0 14.8 One-Time Expenses 0.0 0.0 (0.1) 0.0 Total expenses 74.2 72.8 149.7 145.7 OPERATING PROFIT/(LOSS) $ 10.0 $ 17.8 $ 32.9 $ (3.9) Interest expense on long term borrowings 3.4 2.7 6.7 5.4 INCOME/(LOSS) BEFORE INCOME TAX EXPENSE/(BENEFIT) $ 6.6 $ 15.1 $ 26.2 $ (9.3) Income tax expense/(benefit) (0.3) 1.5 7.4 (4.4) Equity in net loss of affiliate 0.0 0.0 0.0 (0.1) Net income/(loss) from continuing operations $ 6.8 $ 13.5 $ 18.7 $ (4.9) Income from discontinued operations, net of tax $ 60.6 $ 0.6 $ 65.0 $ 0.2 NET INCOME/(LOSS) $ 67.5 $ 14.1 $ 83.7 $ (4.7) Net income attributable to non-controlling interests 0.3 0.2 0.5 0.2 NET INCOME/(LOSS) APPLICABLE TO GAIN CAPITAL HOLDINGS, INC. $ 67.1 $ 13.9 $ 83.2 $ (4.9) Earnings/(loss) per common share(1): Basic earnings/(loss) from continuing operations $ 0.13 $ 0.30 $ 0.39 $ (0.09) Diluted earnings/(loss) from continuing operations $ 0.13 $ 0.30 $ 0.38 $ (0.09) Basic earnings/(loss) from discontinued operations $ 1.36 $ 0.01 $ 1.45 $ 0.01 Diluted earnings/(loss) from discontinued operations $ 1.34 $ 0.01 $ 1.43 $ 0.01 Weighted average common shares outstanding used in computing (loss)/earnings per common share: (2) Basic 44,797,103 47,687,214 44,906,800 47,790,307 Diluted 45,309,002 47,894,648 45,415,774 47,790,307 Note: Dollars in millions, except share and per share data. Columns may not add due to rounding. (1) Earnings per share includes an adjustment for the redemption value of the NCI put option. 19 (2) Total shares outstanding at June 30, 2018 was 44,755,615

CONSOLIDATED BALANCE SHEET As of 6/30/2018 12/31/2017 ASSETS: Cash and cash equivalents $ 360.3 $ 209.7 Cash and securities held for customers 920.4 978.8 Receivables from brokers 52.3 78.5 Property and equipment - net of accumulated depreciation 36.5 40.7 Intangible assets, net 40.1 62.0 Goodwill 28.2 33.0 Other assets 36.7 45.9 Total assets $ 1,474.5 $ 1,448.6 LIABILITIES AND SHAREHOLDERS' EQUITY: Payables to customers $ 920.4 $ 978.8 Payables to brokers 3.0 2.8 Accrued compensation & benefits 10.6 10.1 Accrued expenses and other liabilities 39.7 33.9 Income tax payable 10.2 0.6 Convertible senior notes 135.3 132.2 Total liabilities $ 1,119.2 $ 1,158.5 Non-controlling interest $ 2.6 $ 4.4 Shareholders' Equity 352.8 285.7 Total liabilities and shareholders' equity $ 1,474.5 $ 1,448.6 Note: Dollars in millions. Columns may not add due to rounding. 20

LIQUIDITY As of 6/30/2018 3/31/2018 12/31/2017 9/30/2017 6/30/2017 Cash and cash equivalents $ 360.3 $ 239.7 $ 209.7 $ 225.6 $ 193.1 Receivable from brokers (1) 52.3 72.0 78.5 56.0 80.7 Revolving credit facility (undrawn) 50.0 50.0 50.0 50.0 0.0 Net operating cash 462.6 361.7 338.2 331.6 273.8 Less: Regulatory capital requirements/charges (2) (108.9) (114.6) (112.9) (127.5) (138.0) Less: Payables to brokers (3.0) 0.0 (2.8) 0.0 0.0 Less: Convertible senior notes due 2018 (6.4) (6.4) (6.4) 0.0 0.0 Liquidity $ 344.3 $ 240.7 $ 216.1 $ 204.1 $ 135.8 Regulatory Capital Requirements/Charges US $ 37.1 $ 36.1 $ 37.4 $ 37.1 $ 36.2 UK 67.1 73.7 70.5 85.4 97.2 Other jurisdictions 4.7 4.8 5.0 5.0 4.6 Total Regulatory Capital Requirements/Charges (2) $ 108.9 $ 114.6 $ 112.9 $ 127.5 $ 138.0 Note: Dollars in millions. Columns may not add due to rounding. (1) Reflects cash that would be received from brokers following the close-out of all open positions. 21 (2) Relates to regulatory capital requirements or capital charges, depending upon regulatory jurisdiction.

ADJUSTED EBITDA & MARGIN RECONCILIATION Continuing Operations Total Company 3 Months Ended June 30, First Half 3 Months Ended June 30, First Half 2018 2017 2018 2017 2018 2017 2018 2017 Net Revenue $ 84.2 $ 90.6 $ 182.5 $ 141.8 $ 92.2 $ 98.1 $ 199.0 $ 157.6 Net Income/(Loss) 67.1 13.9 83.2 (4.9) 67.1 13.9 83.2 (4.9) Net Income/(Loss) Margin % 80% 15% 46% (3)% 73% 14% 42% (3)% Net Income/(Loss) $ 67.1 $ 13.9 $ 83.2 $ (4.9) $ 67.1 $ 13.9 $ 83.2 $ (4.9) Depreciation & amortization 5.3 4.1 10.7 7.9 5.4 4.3 11.1 8.4 Purchase intangible amortization 3.6 3.8 7.3 6.9 4.0 4.4 8.2 8.0 Interest expense on long term borrowings 3.4 2.7 6.7 5.4 3.4 2.7 6.7 5.4 Income tax (benefit)/expense (0.3) 1.5 7.4 (4.4) 9.5 1.0 13.2 (3.9) Restructuring 0.0 0.0 0.0 0.0 0.2 0.0 0.2 0.0 Equity in net loss of affiliate 0.0 0.0 0.0 0.1 0.0 0.0 0.0 0.1 Net income attributable to non-controlling interest 0.3 0.2 0.5 0.2 0.3 0.2 0.5 0.2 Discontinued operations(2) (60.6) (0.6) (65.0) (0.2) (69.6) 0.0 (69.6) 0.0 Adjusted EBITDA $ 19.0 $ 25.7 $ 50.8 $ 11.0 $ 20.5 $ 26.5 $ 53.6 $ 13.1 Adjusted EBITDA Margin %(1) 23% 28% 28% 8 % 22% 27% 27% 8 % Note: Dollars in millions. Columns may not add due to rounding. (1) Adjusted EBITDA margin is calculated as adjusted EBITDA divided by net revenue. 22 (2) Discontinued operations amounts shown under continuing operations represent income from discontinued operations; discontinued operations amounts shown under total company represent gain on sale of GTX.
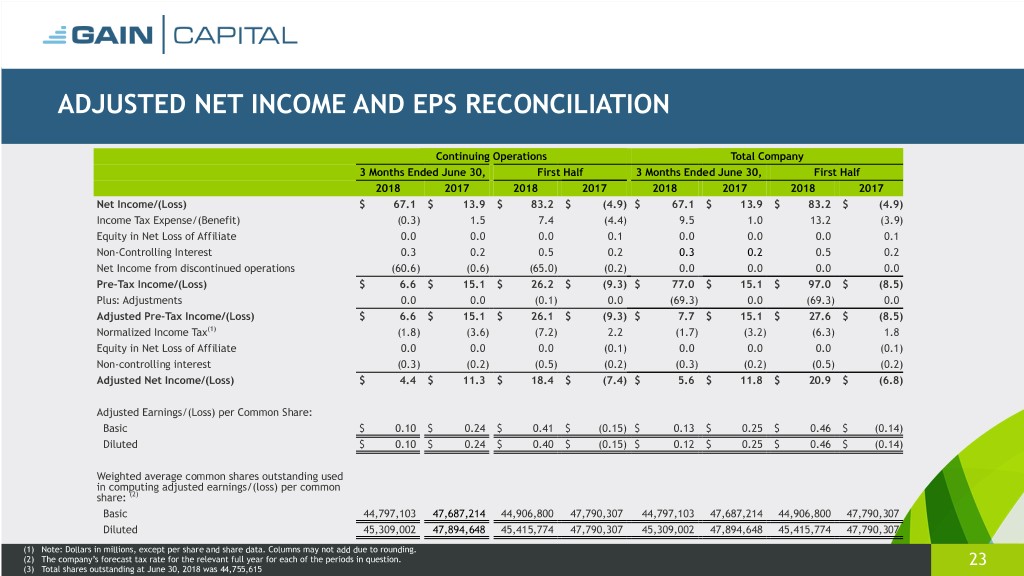
ADJUSTED NET INCOME AND EPS RECONCILIATION Continuing Operations Total Company 3 Months Ended June 30, First Half 3 Months Ended June 30, First Half 2018 2017 2018 2017 2018 2017 2018 2017 Net Income/(Loss) $ 67.1 $ 13.9 $ 83.2 $ (4.9) $ 67.1 $ 13.9 $ 83.2 $ (4.9) Income Tax Expense/(Benefit) (0.3) 1.5 7.4 (4.4) 9.5 1.0 13.2 (3.9) Equity in Net Loss of Affiliate 0.0 0.0 0.0 0.1 0.0 0.0 0.0 0.1 Non-Controlling Interest 0.3 0.2 0.5 0.2 0.3 0.2 0.5 0.2 Net Income from discontinued operations (60.6) (0.6) (65.0) (0.2) 0.0 0.0 0.0 0.0 Pre-Tax Income/(Loss) $ 6.6 $ 15.1 $ 26.2 $ (9.3) $ 77.0 $ 15.1 $ 97.0 $ (8.5) Plus: Adjustments 0.0 0.0 (0.1) 0.0 (69.3) 0.0 (69.3) 0.0 Adjusted Pre-Tax Income/(Loss) $ 6.6 $ 15.1 $ 26.1 $ (9.3) $ 7.7 $ 15.1 $ 27.6 $ (8.5) Normalized Income Tax(1) (1.8) (3.6) (7.2) 2.2 (1.7) (3.2) (6.3) 1.8 Equity in Net Loss of Affiliate 0.0 0.0 0.0 (0.1) 0.0 0.0 0.0 (0.1) Non-controlling interest (0.3) (0.2) (0.5) (0.2) (0.3) (0.2) (0.5) (0.2) Adjusted Net Income/(Loss) $ 4.4 $ 11.3 $ 18.4 $ (7.4) $ 5.6 $ 11.8 $ 20.9 $ (6.8) Adjusted Earnings/(Loss) per Common Share: Basic $ 0.10 $ 0.24 $ 0.41 $ (0.15) $ 0.13 $ 0.25 $ 0.46 $ (0.14) Diluted $ 0.10 $ 0.24 $ 0.40 $ (0.15) $ 0.12 $ 0.25 $ 0.46 $ (0.14) Weighted average common shares outstanding used in computing adjusted earnings/(loss) per common share: (2) Basic 44,797,103 47,687,214 44,906,800 47,790,307 44,797,103 47,687,214 44,906,800 47,790,307 Diluted 45,309,002 47,894,648 45,415,774 47,790,307 45,309,002 47,894,648 45,415,774 47,790,307 (1) Note: Dollars in millions, except per share and share data. Columns may not add due to rounding. (2) The company’s forecast tax rate for the relevant full year for each of the periods in question. 23 (3) Total shares outstanding at June 30, 2018 was 44,755,615

EPS COMPUTATION 3 Months Ended June 30, First Half 2018 2017 2018 2017 Net income/(loss) from continuing operations $ 6.5 $ 13.4 $ 18.2 $ (5.2) Adjustment(1) $ (0.5) $ 0.9 $ (0.9) $ 1.0 Net income/(loss) available to GAIN common shareholders from continuing $ 6.0 $ 14.3 $ 17.4 $ (4.2) operations Net income from discontinued operations $ 60.6 $ 0.6 $ 65.0 $ 0.2 Earnings/(Loss) per common share Basic earnings/(loss) from continuing operations $ 0.13 $ 0.30 $ 0.39 $ (0.09) Basic earnings/(loss) from discontinued operations $ 1.36 $ 0.01 $ 1.45 $ 0.01 Basic earnings/(loss) combined 1.49 0.31 1.84 (0.08) Diluted earnings/(loss) from continuing operations $ 0.13 $ 0.30 $ 0.38 $ (0.09) Diluted earnings/(loss) from discontinued operations $ 1.34 $ 0.01 $ 1.43 $ 0.01 Diluted earnings/(loss) combined 1.47 0.31 1.81 (0.08) Weighted average common shares outstanding used in computing earnings/ (loss) per common share: (2) Basic 44,797,103 47,687,214 44,906,800 47,790,307 Diluted 45,309,002 47,894,648 45,415,774 47,790,307 Note: Dollars in millions, except per share and share data. Columns may not add due to rounding. (1) The adjustment relates to the Company's redeemable non-controlling interests. An increase to the carrying value reduces earnings available to the Company's shareholders. A decrease to the carrying value increases earnings available to the Company's shareholders. 24 (2) Total shares outstanding at June 30, 2018 was 44,755,615

RECONCILIATION OF SEGMENT PROFIT TO INCOME BEFORE INCOME TAX EXPENSE 3 Months Ended June 30, First Half 2018 2017 2018 2017 Retail segment $29.1 $33.9 $68.2 $26.0 Futures segment 2.1 0.6 3.3 0.9 Corporate and other (12.2) (8.8) (20.7) (16.0) Segment profit $19.0 $25.7 $50.8 $11.0 Depreciation and amortization $5.3 $4.1 $10.7 $7.9 Purchased intangible amortization 3.6 3.8 7.3 6.9 Restructuring expenses 0.0 0.0 0.0 0.0 Impairment of investment 0.0 0.0 (0.1) 0.0 Operating profit/(loss) $10.0 $17.8 $32.9 ($3.9) Interest expense on long term borrowings 3.4 2.7 6.7 5.4 Income/(Loss) before income tax expense/(benefit) $6.6 $15.1 $26.2 ($9.3) Note: Dollars in millions. Columns may not add due to rounding. 25
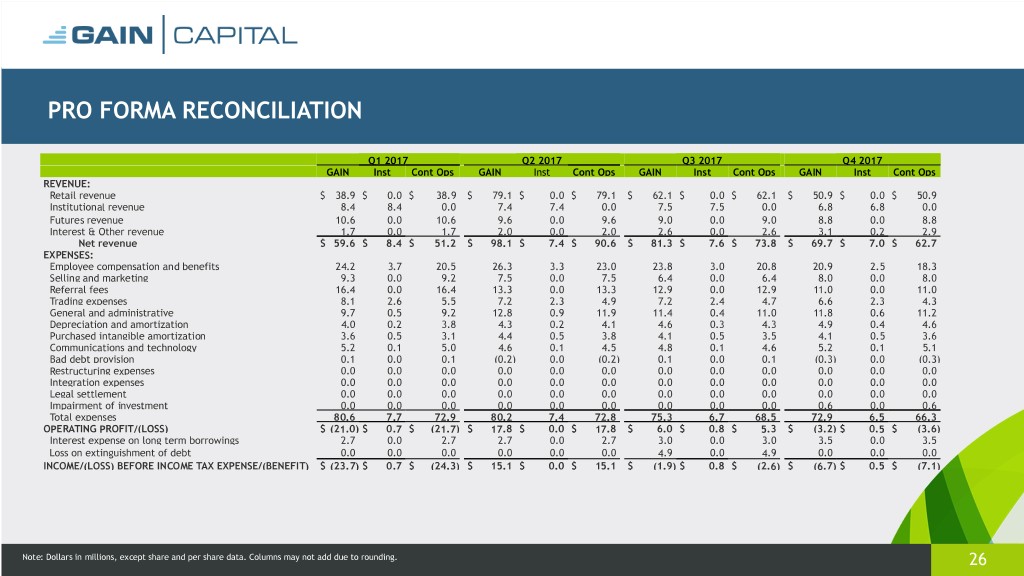
PRO FORMA RECONCILIATION Q1 2017 Q2 2017 Q3 2017 Q4 2017 GAIN Inst Cont Ops GAIN Inst Cont Ops GAIN Inst Cont Ops GAIN Inst Cont Ops REVENUE: Retail revenue $ 38.9 $ 0.0 $ 38.9 $ 79.1 $ 0.0 $ 79.1 $ 62.1 $ 0.0 $ 62.1 $ 50.9 $ 0.0 $ 50.9 Institutional revenue 8.4 8.4 0.0 7.4 7.4 0.0 7.5 7.5 0.0 6.8 6.8 0.0 Futures revenue 10.6 0.0 10.6 9.6 0.0 9.6 9.0 0.0 9.0 8.8 0.0 8.8 Interest & Other revenue 1.7 0.0 1.7 2.0 0.0 2.0 2.6 0.0 2.6 3.1 0.2 2.9 Net revenue $ 59.6 $ 8.4 $ 51.2 $ 98.1 $ 7.4 $ 90.6 $ 81.3 $ 7.6 $ 73.8 $ 69.7 $ 7.0 $ 62.7 EXPENSES: Employee compensation and benefits 24.2 3.7 20.5 26.3 3.3 23.0 23.8 3.0 20.8 20.9 2.5 18.3 Selling and marketing 9.3 0.0 9.2 7.5 0.0 7.5 6.4 0.0 6.4 8.0 0.0 8.0 Referral fees 16.4 0.0 16.4 13.3 0.0 13.3 12.9 0.0 12.9 11.0 0.0 11.0 Trading expenses 8.1 2.6 5.5 7.2 2.3 4.9 7.2 2.4 4.7 6.6 2.3 4.3 General and administrative 9.7 0.5 9.2 12.8 0.9 11.9 11.4 0.4 11.0 11.8 0.6 11.2 Depreciation and amortization 4.0 0.2 3.8 4.3 0.2 4.1 4.6 0.3 4.3 4.9 0.4 4.6 Purchased intangible amortization 3.6 0.5 3.1 4.4 0.5 3.8 4.1 0.5 3.5 4.1 0.5 3.6 Communications and technology 5.2 0.1 5.0 4.6 0.1 4.5 4.8 0.1 4.6 5.2 0.1 5.1 Bad debt provision 0.1 0.0 0.1 (0.2) 0.0 (0.2) 0.1 0.0 0.1 (0.3) 0.0 (0.3) Restructuring expenses 0.0 0.0 0.0 0.0 0.0 0.0 0.0 0.0 0.0 0.0 0.0 0.0 Integration expenses 0.0 0.0 0.0 0.0 0.0 0.0 0.0 0.0 0.0 0.0 0.0 0.0 Legal settlement 0.0 0.0 0.0 0.0 0.0 0.0 0.0 0.0 0.0 0.0 0.0 0.0 Impairment of investment 0.0 0.0 0.0 0.0 0.0 0.0 0.0 0.0 0.0 0.6 0.0 0.6 Total expenses 80.6 7.7 72.9 80.2 7.4 72.8 75.3 6.7 68.5 72.9 6.5 66.3 OPERATING PROFIT/(LOSS) $ (21.0) $ 0.7 $ (21.7) $ 17.8 $ 0.0 $ 17.8 $ 6.0 $ 0.8 $ 5.3 $ (3.2) $ 0.5 $ (3.6) Interest expense on long term borrowings 2.7 0.0 2.7 2.7 0.0 2.7 3.0 0.0 3.0 3.5 0.0 3.5 Loss on extinguishment of debt 0.0 0.0 0.0 0.0 0.0 0.0 4.9 0.0 4.9 0.0 0.0 0.0 INCOME/(LOSS) BEFORE INCOME TAX EXPENSE/(BENEFIT) $ (23.7) $ 0.7 $ (24.3) $ 15.1 $ 0.0 $ 15.1 $ (1.9) $ 0.8 $ (2.6) $ (6.7) $ 0.5 $ (7.1) Note: Dollars in millions, except share and per share data. Columns may not add due to rounding. 26

PRO FORMA RECONCILIATION Q1 2018 Q2 2018 GAIN Inst Cont Ops GAIN Inst Cont Ops REVENUE: Retail revenue $ 84.1 $ 0.0 $ 84.1 $ 72.0 $ 0.0 $ 72.0 Institutional revenue 8.5 8.5 0.0 7.9 7.9 0.0 Futures revenue 10.6 0.0 10.6 11.1 0.0 11.1 Interest & Other revenue 3.6 0.0 3.6 1.1 0.1 1.0 Net revenue $ 106.9 $ 8.5 $ 98.5 $ 92.2 $ 8.0 $ 84.2 EXPENSES: Employee compensation and benefits 27.8 3.4 24.3 24.9 2.5 22.5 Selling and marketing 6.0 0.1 6.0 6.8 0.0 6.8 Referral fees 11.9 0.5 11.4 11.0 0.5 10.5 Trading expenses 8.5 2.7 5.8 8.3 2.8 5.5 General and administrative 13.0 0.5 12.5 14.8 0.5 14.2 Depreciation and amortization 5.7 0.3 5.4 5.4 0.1 5.3 Purchased intangible amortization 4.2 0.5 3.7 4.0 0.4 3.6 Communications and technology 5.5 0.1 5.4 5.6 0.1 5.5 Bad debt provision 1.1 0.0 1.1 0.3 0.0 0.3 Restructuring expenses 0.0 0.0 0.0 0.2 0.2 0.0 Integration expenses 0.0 0.0 0.0 0.0 0.0 0.0 Legal settlement 0.0 0.0 0.0 0.0 0.0 0.0 Impairment of investment (0.1) 0.0 (0.1) 0.0 0.0 0.0 Total expenses 83.6 8.1 75.4 81.3 7.1 74.2 OPERATING PROFIT/(LOSS) $ 23.3 $ 0.4 $ 22.9 $ 10.9 $ 0.9 $ 10.0 Interest expense on long term borrowings 3.3 0.0 3.3 3.4 0.0 3.4 Loss on extinguishment of debt 0.0 0.0 0.0 0.0 0.0 0.0 INCOME/(LOSS) BEFORE INCOME TAX EXPENSE/(BENEFIT) $ 20.0 $ 0.4 $ 19.6 $ 7.5 $ 0.9 $ 6.6 Note: Dollars in millions, except share and per share data. Columns may not add due to rounding. 27

DISCONTINUED OPERATIONS Three Months Ended June Six Months Ended June 30, 2018 30, 2017 2018 2017 REVENUE: Institutional revenue 7.9 7.4 16.4 15.8 Other revenue 0.0 0.0 0.0 0.0 Total non-interest revenue 7.9 7.4 16.4 15.8 Interest revenue 0.1 0.0 0.1 0.0 Total net interest revenue 0.1 0.0 0.1 0.0 Net revenue $ 8.0 $ 7.5 $ 16.5 $ 15.9 EXPENSES: Employee compensation and benefits $ 2.5 $ 3.3 $ 5.9 $ 7.0 Selling and marketing 0.0 0.0 0.1 0.0 Referral fees 0.5 0.0 1.0 0.0 Trading expenses 2.8 2.3 5.4 4.9 General and administrative 0.5 0.9 1.1 1.4 Depreciation and amortization 0.1 0.2 0.4 0.4 Purchased intangible amortization 0.4 0.5 0.9 1.1 Communications and technology 0.1 0.1 0.3 0.2 Restructuring expenses 0.2 0.0 0.2 0.0 Total operating expense 7.1 7.4 15.2 15.1 OPERATING PROFIT/(LOSS) 0.9 0.0 1.2 0.8 Gain on sale of discontinued operations 69.6 0.0 69.6 0.0 INCOME/(LOSS) BEFORE INCOME TAX EXPENSE/ 70.4 0.0 70.8 0.8 (BENEFIT) Income tax expense/(benefit) 9.8 (0.5) 5.8 0.5 NET INCOME/(LOSS) FROM DISCONTINUED OPERATIONS 60.6 0.6 65.0 0.2 Note: Dollars in millions, except share and per share data. Columns may not add due to rounding. 28

RETAIL REVENUE PER MILLION $160 $140 $120 $107 $106 $100 $100 $80 $62 $60 $40 $20 $0 Q2 16 Q3 16 Q4 16 Q1 17 Q2 17 Q3 17 Q4 17 Q1 18 Q2 18 Quarterly Trailing 12 Months 29

OPERATING SEGMENT RESULTS: CORPORATE & OTHER Corporate & Other Financial & Operating Results 3 Months Ended June 30, First Half 2018 2017 2018 2017 TTM 6/30/18 Revenue/(loss) $ (2.4) $ 0.0 $ (1.3) $ 0.1 $ (1.6) Employee Comp & Ben 6.0 6.1 12.4 10.7 21.3 Marketing 0.1 0.1 0.1 0.1 0.4 Other Operating Exp. 3.7 2.6 7.0 5.3 11.9 Loss $ (12.2) $ (8.8) $ (20.7) $ (16.0) $ (35.2) Note: Dollars in millions, except where noted otherwise. Columns may not add due to rounding. 30
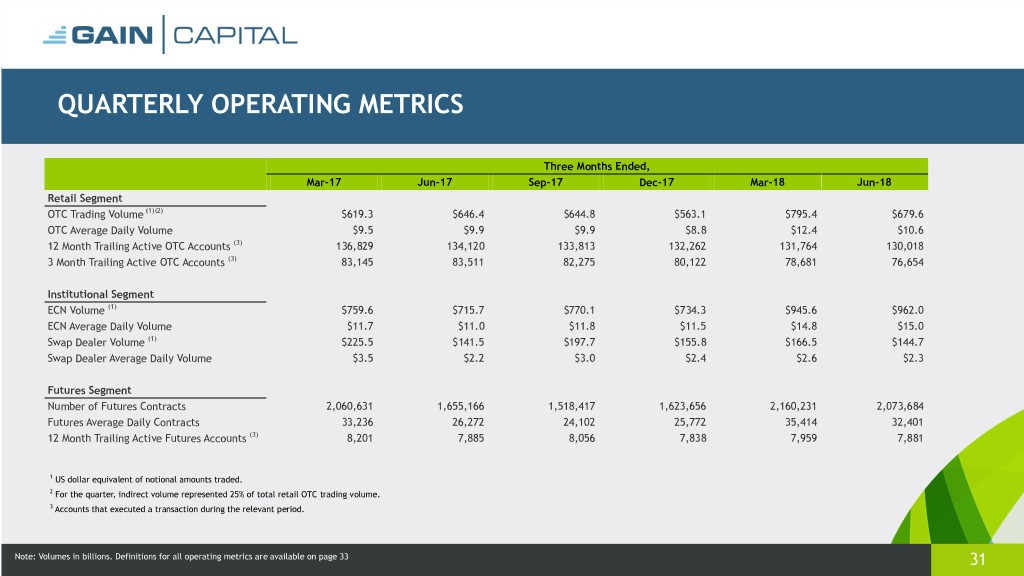
QUARTERLY OPERATING METRICS Three Months Ended, Mar-17 Jun-17 Sep-17 Dec-17 Mar-18 Jun-18 Retail Segment OTC Trading Volume (1)(2) $619.3 $646.4 $644.8 $563.1 $795.4 $679.6 OTC Average Daily Volume $9.5 $9.9 $9.9 $8.8 $12.4 $10.6 12 Month Trailing Active OTC Accounts (3) 136,829 134,120 133,813 132,262 131,764 130,018 3 Month Trailing Active OTC Accounts (3) 83,145 83,511 82,275 80,122 78,681 76,654 Institutional Segment ECN Volume (1) $759.6 $715.7 $770.1 $734.3 $945.6 $962.0 ECN Average Daily Volume $11.7 $11.0 $11.8 $11.5 $14.8 $15.0 Swap Dealer Volume (1) $225.5 $141.5 $197.7 $155.8 $166.5 $144.7 Swap Dealer Average Daily Volume $3.5 $2.2 $3.0 $2.4 $2.6 $2.3 Futures Segment Number of Futures Contracts 2,060,631 1,655,166 1,518,417 1,623,656 2,160,231 2,073,684 Futures Average Daily Contracts 33,236 26,272 24,102 25,772 35,414 32,401 12 Month Trailing Active Futures Accounts (3) 8,201 7,885 8,056 7,838 7,959 7,881 1 US dollar equivalent of notional amounts traded. 2 For the quarter, indirect volume represented 25% of total retail OTC trading volume. 3 Accounts that executed a transaction during the relevant period. Note: Volumes in billions. Definitions for all operating metrics are available on page 33 31
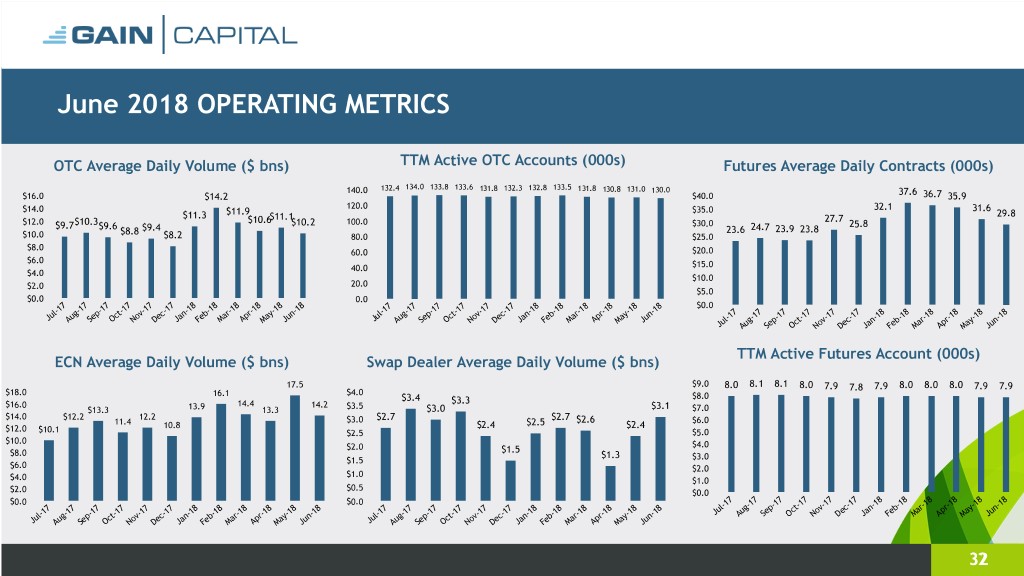
June 2018 OPERATING METRICS OTC Average Daily Volume ($ bns) TTM Active OTC Accounts (000s) Futures Average Daily Contracts (000s) 134.0 140.0 132.4 133.8 133.6 131.8 132.3 132.8 133.5 131.8 130.8 131.0 130.0 37.6 $16.0 $14.2 $40.0 36.7 35.9 120.0 32.1 31.6 $14.0 $11.9 $35.0 29.8 $11.3 $10.6$11.1 27.7 $12.0 $9.7$10.3$9.6 $10.2 100.0 $30.0 25.8 $8.8 $9.4 23.6 24.7 23.9 23.8 $10.0 $8.2 80.0 $25.0 $8.0 60.0 $20.0 $6.0 40.0 $15.0 $4.0 $10.0 $2.0 20.0 $5.0 $0.0 0.0 7 7 7 7 7 7 8 8 8 8 8 8 $0.0 1 1 1 1 1 1 1 1 1 1 1 1 17 17 17 17 17 17 18 18 18 18 18 18 l- - - t- - - - - r- r- - - l- - - - - - - - - - - - 7 7 7 7 7 7 8 8 8 8 8 8 u ug p c ov ec an b a p ay n u g p ct v c n b ar pr y n 1 1 1 1 1 1 1 1 1 1 1 1 J A Se O N D J Fe M A Ju J u e O o e Ja e A a Ju l- g- - t- v- c- - - r- r- y- - M A S N D F M M u u ep c o e an eb a p a un J A S O N D J F M A M J TTM Active Futures Account (000s) ECN Average Daily Volume ($ bns) Swap Dealer Average Daily Volume ($ bns) 17.5 $9.0 8.0 8.1 8.1 8.0 7.9 7.8 7.9 8.0 8.0 8.0 7.9 7.9 $18.0 $4.0 16.1 $3.4 $8.0 $16.0 14.4 14.2 $3.3 $13.3 13.9 13.3 $3.5 $3.0 $3.1 $7.0 $14.0 $12.2 12.2 $2.7 $2.7 11.4 $3.0 $2.5 $2.6 $6.0 $12.0 10.8 $2.4 $2.4 $10.1 $2.5 $5.0 $10.0 $4.0 $2.0 $1.5 $8.0 $1.3 $1.5 $3.0 $6.0 $2.0 $1.0 $4.0 $1.0 $0.5 $2.0 $0.0 $0.0 $0.0 7 7 7 7 7 7 8 8 8 8 8 8 -1 -1 -1 -1 -1 -1 -1 -1 -1 -1 -1 -1 7 7 7 7 7 7 8 8 8 8 8 8 7 7 7 7 7 7 8 8 8 8 8 8 l g p t v c n b r r y n 1 1 1 1 1 1 1 1 1 1 1 1 1 1 1 1 1 1 1 1 1 1 1 1 Ju u e c o e a e a p a u l- g- - t- v- c- - - r- r- y- - l- g- - t- v- c- - - r- r- y- - A S O N D J F M A M J u u ep c o e an eb a p a un u u ep c o e an eb a p a un J A S O N D J F M A M J J A S O N D J F M A M J 32

DEFINITION OF METRICS • Active Accounts: Accounts that executed a transaction during the period • Trading Volume: Represents the U.S. dollar equivalent of notional amounts traded • Customer Assets: Represents amounts due to clients, including customer deposits and unrealized gains or losses arising from open positions 33
