Attached files
| file | filename |
|---|---|
| EX-99.1 - EX-99.1 - DRIL-QUIP INC | d550702dex991.htm |
| 8-K - FORM 8-K - DRIL-QUIP INC | d550702d8k.htm |
2nd Quarter 2018 Supplemental Earnings Information Exhibit 99.2
Cautionary Statement Forward-Looking Statements The information furnished in this presentation contains “forward-looking statements” within the meaning of the federal securities laws. Forward-looking statements include goals, projections, estimates, expectations, market outlook, forecasts, plans and objectives, including revenue and other projections, acquisition opportunities, forecasted backlog, forecasted demand, liquidity, cost savings, and share repurchases and are based on assumptions, estimates and risk analysis made by management of Dril-Quip in light of its experience and perception of historical trends, current conditions, expected future developments and other factors. No assurance can be given that actual future results will not differ materially from those contained in the forward-looking statements in this presentation. Although Dril-Quip believes that all such statements contained in this presentation are based on reasonable assumptions, there are numerous variables of an unpredictable nature or outside of Dril-Quip’s control that could affect Dril-Quip’s future results and the value of its shares. Each investor must assess and bear the risk of uncertainty inherent in the forward-looking statements contained in this presentation. Please refer to Dril-Quip’s filings with the SEC for additional discussion of risks and uncertainties that may affect Dril-Quip’s actual future results. Dril-Quip undertakes no obligation to update the forward-looking statements contained herein. Use of Non-GAAP Financial Measures We provide Adjusted net income, Adjusted diluted EPS, and Adjusted EBITDA to evaluate and compare more effectively the results of our operations period over period and identify operating trends by removing the effect of our capital structure from our operating structure. We calculate Free Cash Flow as net cash provided by operating activities less net cash used in the purchase of property, plant, and equipment. These measurements are used in concert with net income and net cash provided by operating activities, respectively, which measure actual cash generated in the period. We believe that these non-GAAP measures are supplemental measurement tools used by analysts and investors to help evaluate overall operating performance, ability to pursue and service possible debt opportunities and make future capital expenditures. These metrics do not represent funds available for our discretionary use and are not intended to represent or to be used as a substitute for net income or net cash provided by operating activities, as measured under U.S. generally accepted accounting principles. The items excluded from Adjusted net income, Adjusted EBITDA and Free Cash Flow, but included in the calculation of reported net income and net cash provided by operating activities, as applicable, are significant components of the consolidated statements of income and must be considered in performing a comprehensive assessment of overall financial performance. Our calculation of Adjusted EBITDA, Adjusted Net Income, Adjusted Diluted EPS and Free Cash Flow may not be consistent with calculations used by other companies. Reconciliations of these non-GAAP measures to the most directly comparable GAAP measure can be found on slides 16 – 17. dril-quip.com | NYSE: DRQ
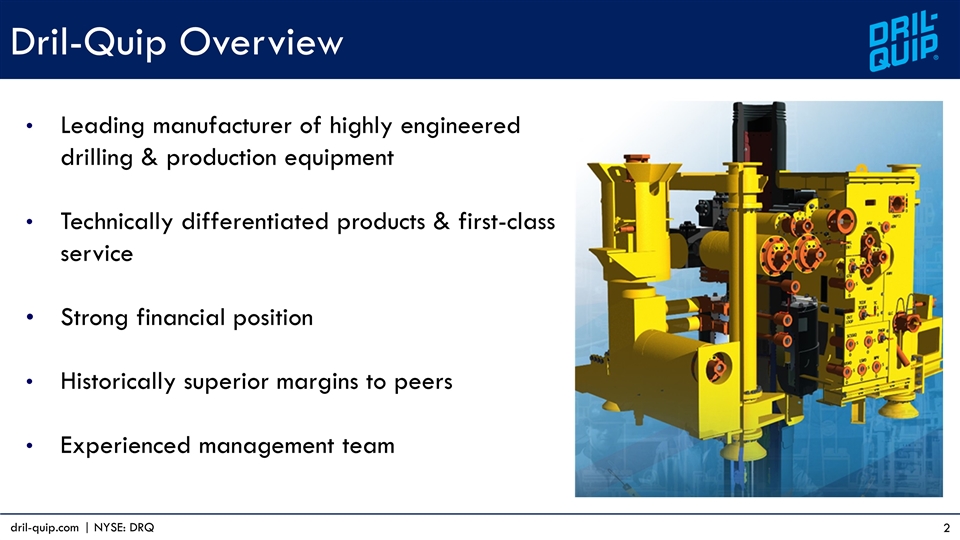
Dril-Quip Overview Leading manufacturer of highly engineered drilling & production equipment Technically differentiated products & first-class service Strong financial position Historically superior margins to peers Experienced management team dril-quip.com | NYSE: DRQ
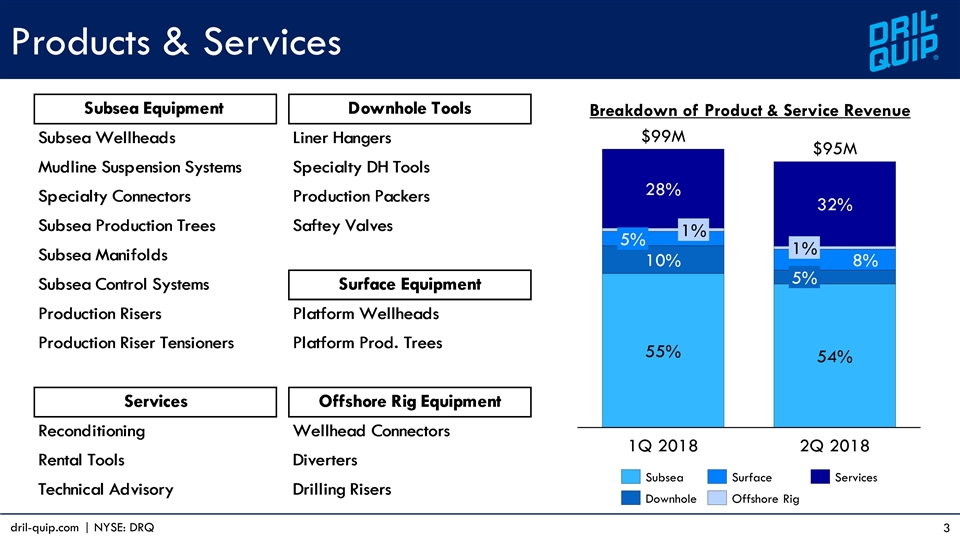
Products & Services dril-quip.com | NYSE: DRQ $M $M Breakdown of Product & Service Revenue Subsea Equipment Downhole Tools Subsea Wellheads Liner Hangers Mudline Suspension Systems Specialty DH Tools Specialty Connectors Production Packers Subsea Production Trees Saftey Valves Subsea Manifolds Subsea Control Systems Surface Equipment Production Risers Platform Wellheads Production Riser Tensioners Platform Prod. Trees Services Offshore Rig Equipment Reconditioning Wellhead Connectors Rental Tools Diverters Technical Advisory Drilling Risers
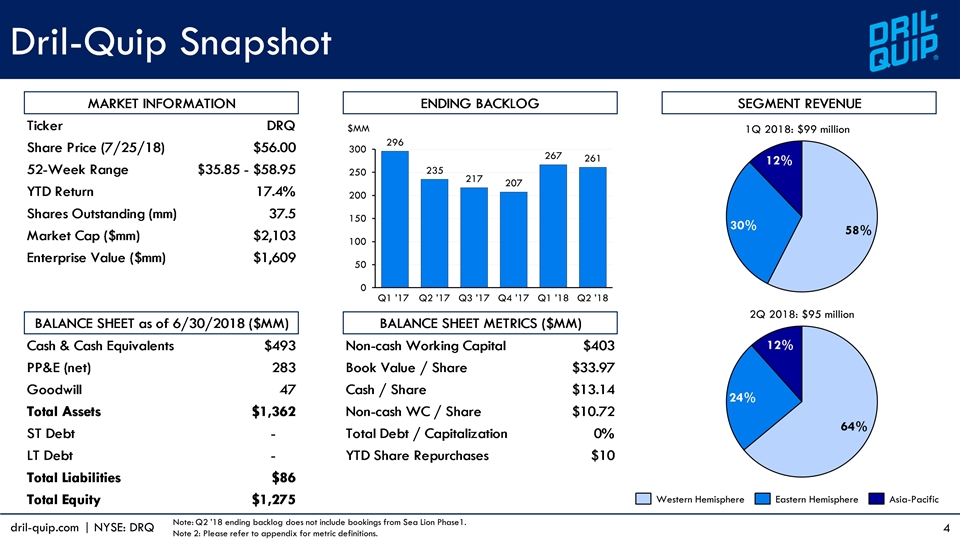
Dril-Quip Snapshot 1Q 2018: $99 million 2Q 2018: $95 million $MM Note: Q2 ’18 ending backlog does not include bookings from Sea Lion Phase1. Note 2: Please refer to appendix for metric definitions. dril-quip.com | NYSE: DRQ
Q2 2018 Highlights Generated $94.9 million of revenue, down 4% sequentially Net loss of $3.0 million, or $0.08 loss per diluted share, including gains of $0.16 per share Adjusted net loss of $8.8 million excluding gains, or $0.24 loss per diluted share Net cash provided by operating activities of $12.1 million Cash on hand of $493.4 million as of June 30, 2018 Completed $9.8 million in common stock repurchases Maintained clean balance sheet with no debt as of June 30, 2018 Signed LOI with Premier Oil to provide subsea production systems for Sea Lion Phase 1 Targeting $40 - $50 million of annualized cost reductions by fourth quarter of 2019 dril-quip.com | NYSE: DRQ
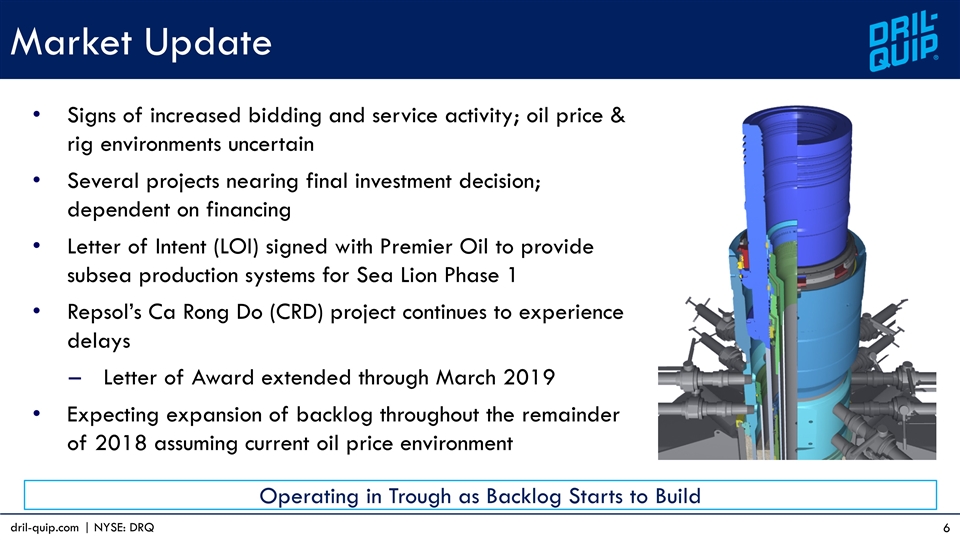
Market Update Signs of increased bidding and service activity; oil price & rig environments uncertain Several projects nearing final investment decision; dependent on financing Letter of Intent (LOI) signed with Premier Oil to provide subsea production systems for Sea Lion Phase 1 Repsol’s Ca Rong Do (CRD) project continues to experience delays Letter of Award extended through March 2019 Expecting expansion of backlog throughout the remainder of 2018 assuming current oil price environment Operating in Trough as Backlog Starts to Build dril-quip.com | NYSE: DRQ
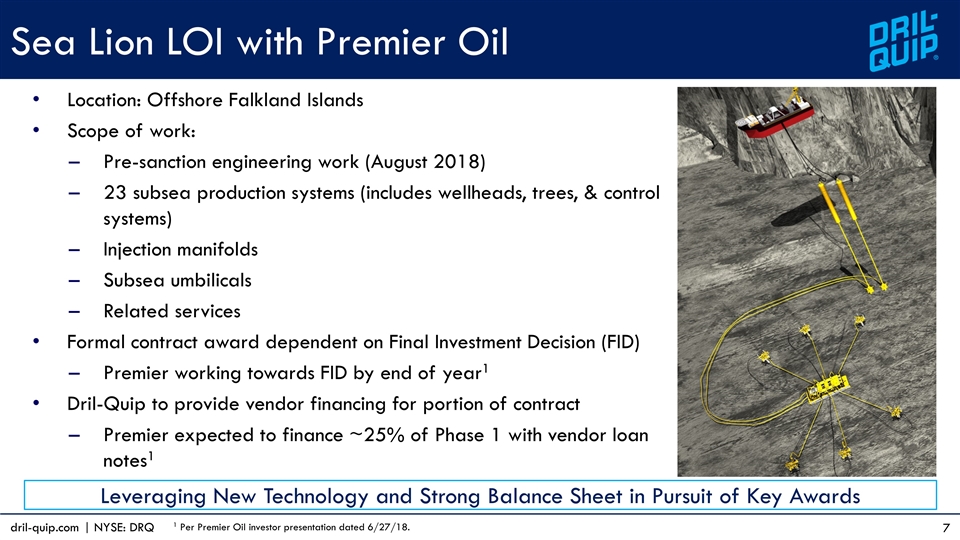
Sea Lion LOI with Premier Oil Location: Offshore Falkland Islands Scope of work: Pre-sanction engineering work (August 2018) 23 subsea production systems (includes wellheads, trees, & control systems) Injection manifolds Subsea umbilicals Related services Formal contract award dependent on Final Investment Decision (FID) Premier working towards FID by end of year1 Dril-Quip to provide vendor financing for portion of contract Premier expected to finance ~25% of Phase 1 with vendor loan notes1 Leveraging New Technology and Strong Balance Sheet in Pursuit of Key Awards 1 Per Premier Oil investor presentation dated 6/27/18. dril-quip.com | NYSE: DRQ
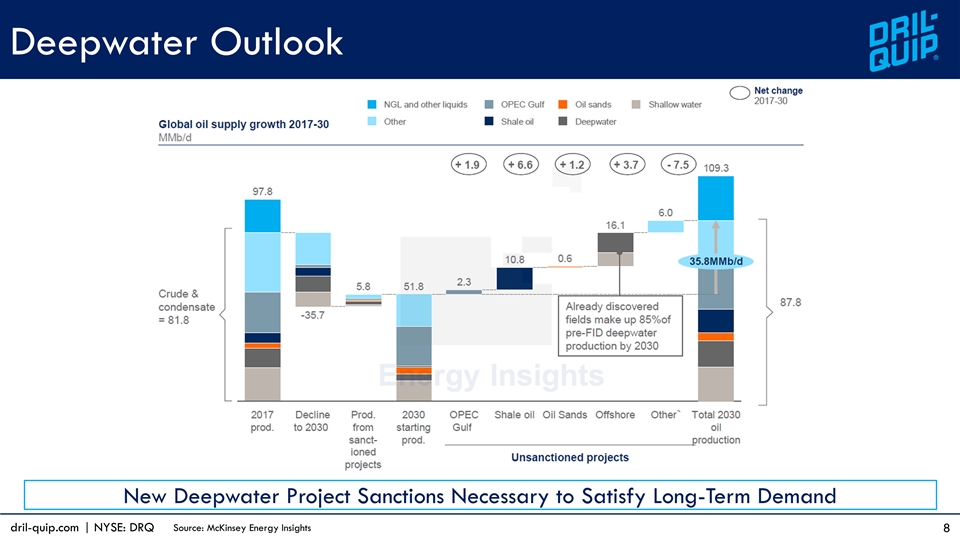
Deepwater Outlook New Deepwater Project Sanctions Necessary to Satisfy Long-Term Demand Source: McKinsey Energy Insights dril-quip.com | NYSE: DRQ
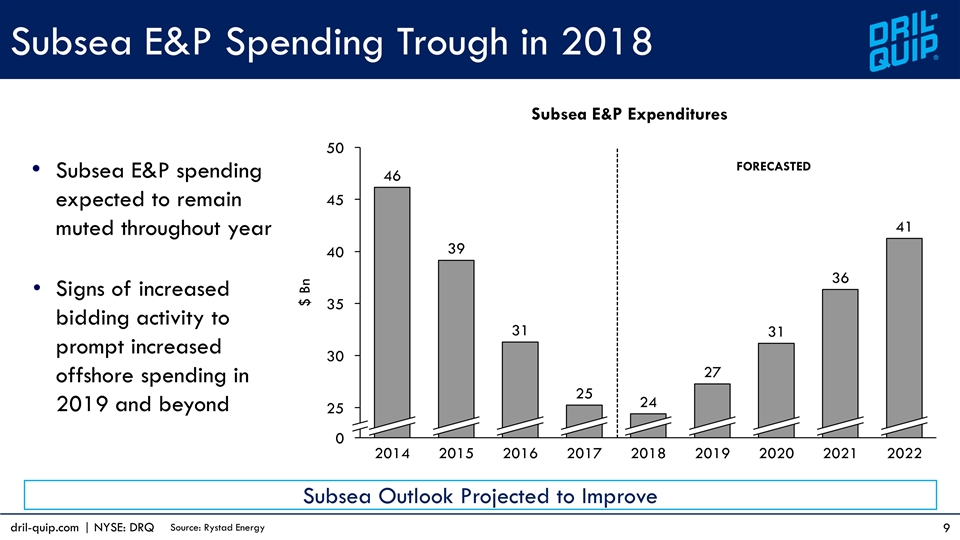
dril-quip.com | NYSE: DRQ Subsea E&P spending expected to remain muted throughout year Signs of increased bidding activity to prompt increased offshore spending in 2019 and beyond Subsea E&P Spending Trough in 2018 Subsea Outlook Projected to Improve Subsea E&P Expenditures Source: Rystad Energy FORECASTED $ Bn
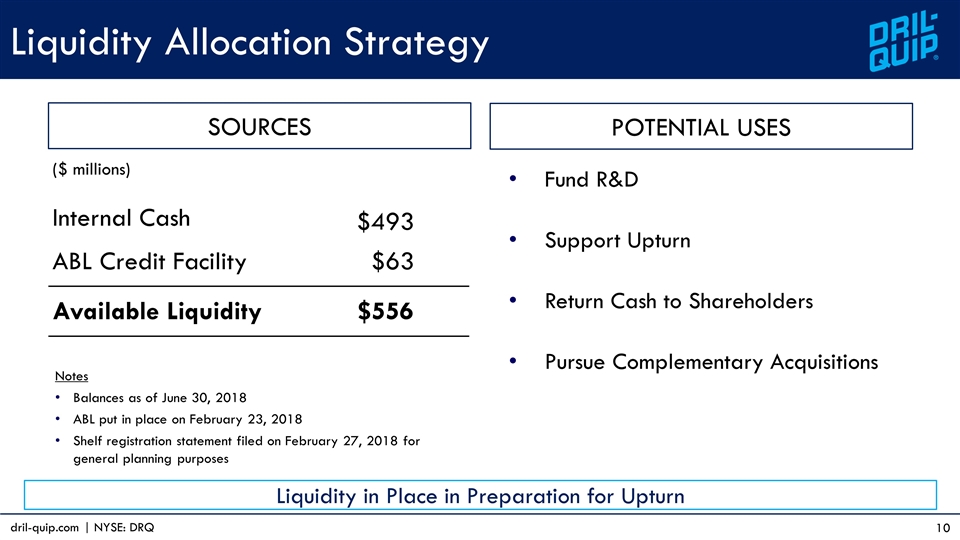
Liquidity Allocation Strategy Liquidity in Place in Preparation for Upturn ($ millions) Internal Cash $493 ABL Credit Facility $63 Available Liquidity $556 Notes Balances as of June 30, 2018 ABL put in place on February 23, 2018 Shelf registration statement filed on February 27, 2018 for general planning purposes SOURCES POTENTIAL USES Fund R&D Support Upturn Return Cash to Shareholders Pursue Complementary Acquisitions dril-quip.com | NYSE: DRQ
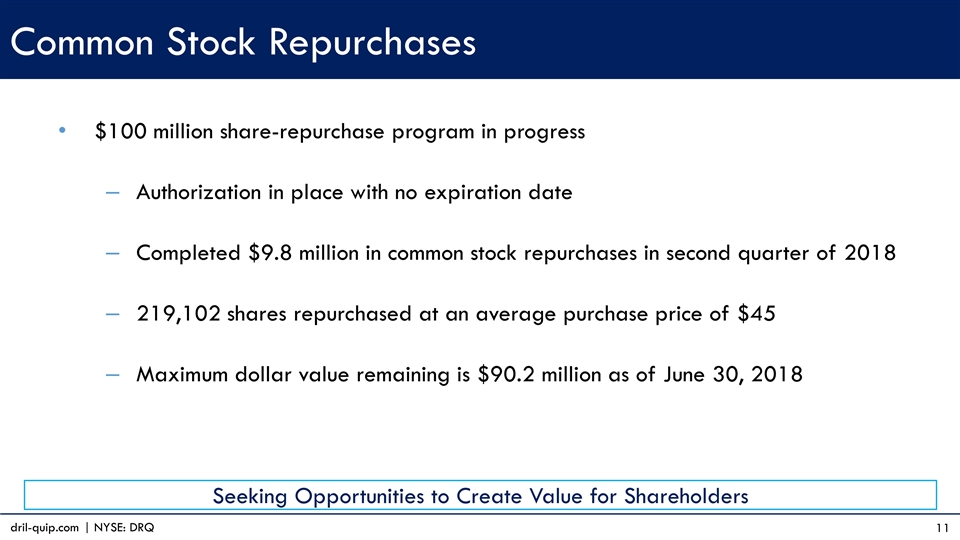
Common Stock Repurchases $100 million share-repurchase program in progress Authorization in place with no expiration date Completed $9.8 million in common stock repurchases in second quarter of 2018 219,102 shares repurchased at an average purchase price of $45 Maximum dollar value remaining is $90.2 million as of June 30, 2018 dril-quip.com | NYSE: DRQ Seeking Opportunities to Create Value for Shareholders
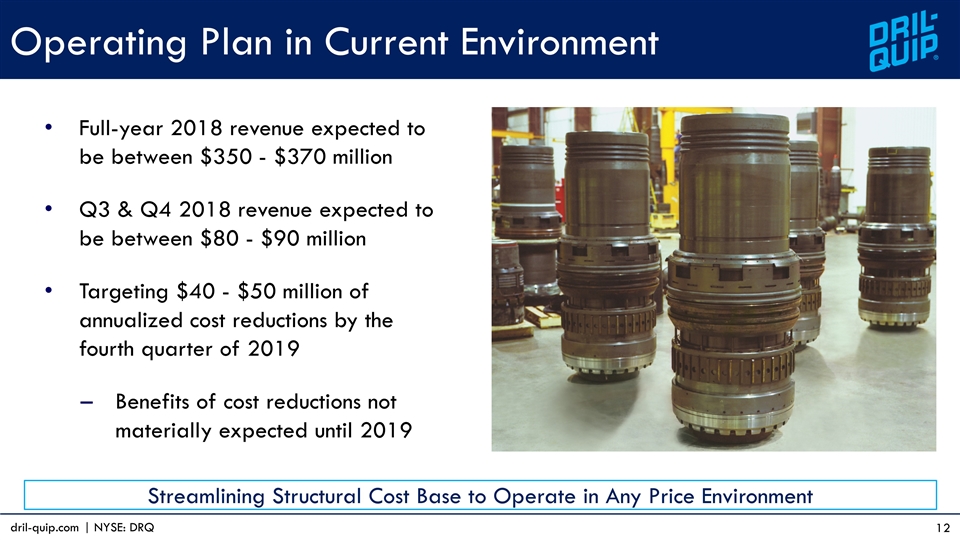
Operating Plan in Current Environment Full-year 2018 revenue expected to be between $350 - $370 million Q3 & Q4 2018 revenue expected to be between $80 - $90 million Targeting $40 - $50 million of annualized cost reductions by the fourth quarter of 2019 Benefits of cost reductions not materially expected until 2019 Streamlining Structural Cost Base to Operate in Any Price Environment dril-quip.com | NYSE: DRQ
APPENDIX
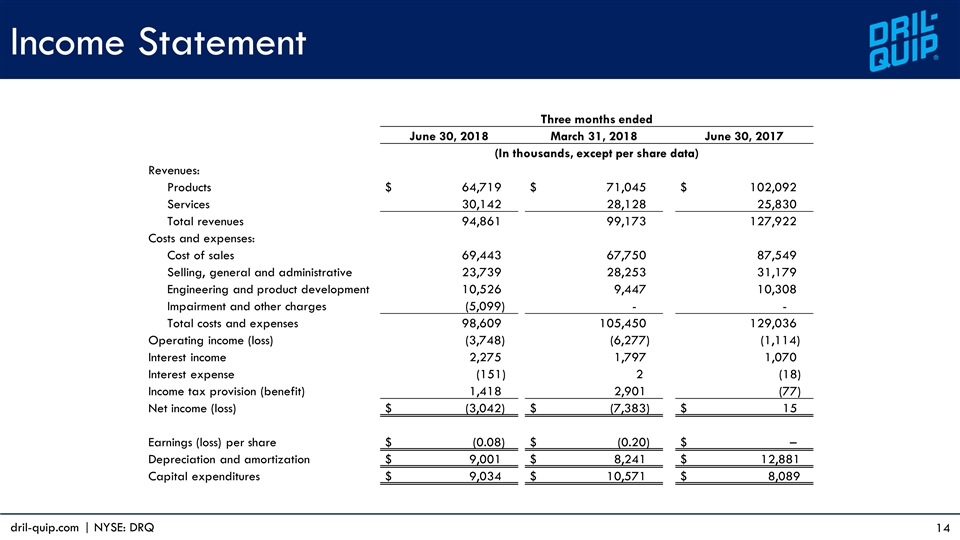
Income Statement Three months ended June 30, 2018 March 31, 2018 June 30, 2017 (In thousands, except per share data) Revenues: Products $ 64,719 $ 71,045 $ 102,092 Services 30,142 28,128 25,830 Total revenues 94,861 99,173 127,922 Costs and expenses: Cost of sales 69,443 67,750 87,549 Selling, general and administrative 23,739 28,253 31,179 Engineering and product development 10,526 9,447 10,308 Impairment and other charges (5,099) - - Total costs and expenses 98,609 105,450 129,036 Operating income (loss) (3,748) (6,277) (1,114) Interest income 2,275 1,797 1,070 Interest expense (151) 2 (18) Income tax provision (benefit) 1,418 2,901 (77) Net income (loss) $ (3,042) $ (7,383) $ 15 Earnings (loss) per share $ (0.08) $ (0.20) $ – Depreciation and amortization $ 9,001 $ 8,241 $ 12,881 Capital expenditures $ 9,034 $ 10,571 $ 8,089 dril-quip.com | NYSE: DRQ
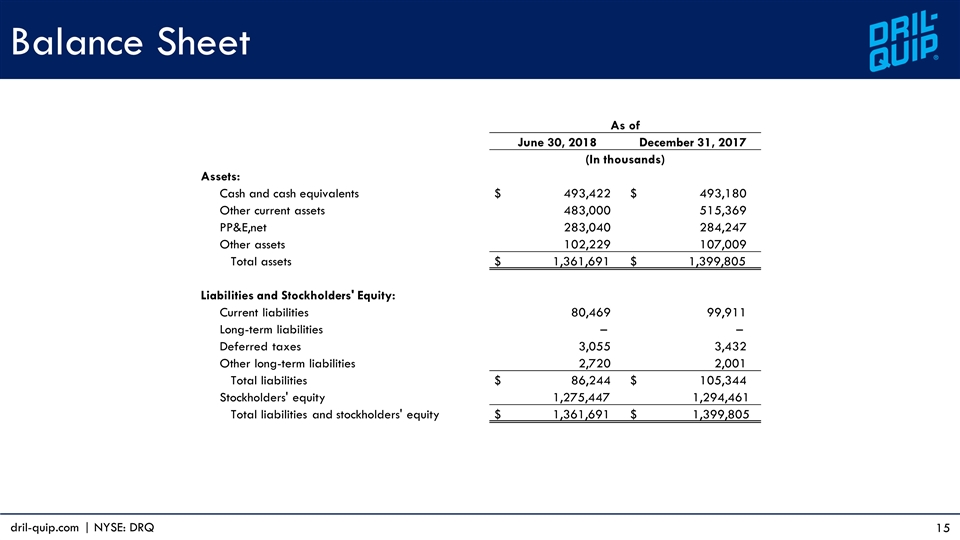
Balance Sheet As of June 30, 2018 December 31, 2017 (In thousands) Assets: Cash and cash equivalents $ 493,422 $ 493,180 Other current assets 483,000 515,369 PP&E,net 283,040 284,247 Other assets 102,229 107,009 Total assets $ 1,361,691 $ 1,399,805 Liabilities and Stockholders' Equity: Current liabilities 80,469 99,911 Long-term liabilities – – Deferred taxes 3,055 3,432 Other long-term liabilities 2,720 2,001 Total liabilities $ 86,244 $ 105,344 Stockholders' equity 1,275,447 1,294,461 Total liabilities and stockholders' equity $ 1,361,691 $ 1,399,805 dril-quip.com | NYSE: DRQ
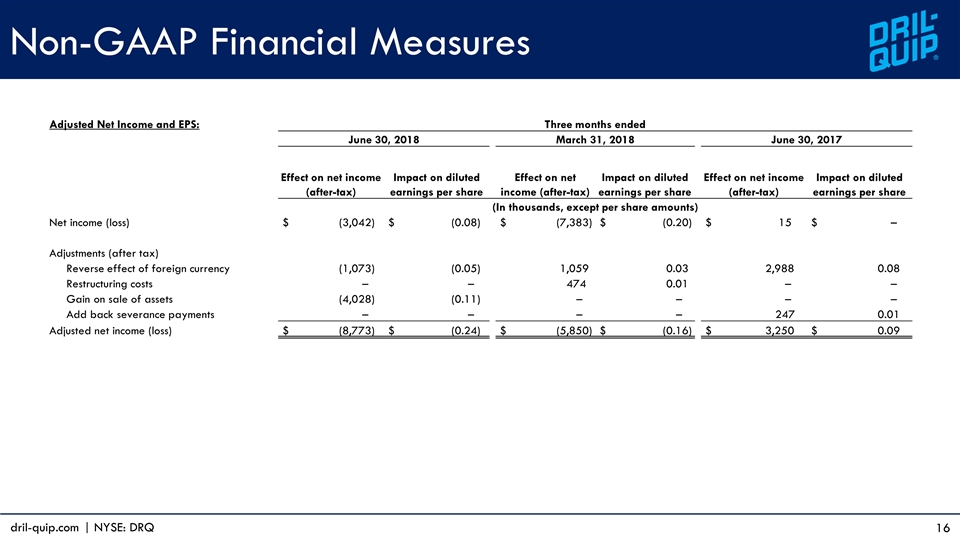
Non-GAAP Financial Measures Adjusted Net Income and EPS: Three months ended June 30, 2018 March 31, 2018 June 30, 2017 Effect on net income (after-tax) Impact on diluted earnings per share Effect on net income (after-tax) Impact on diluted earnings per share Effect on net income (after-tax) Impact on diluted earnings per share (In thousands, except per share amounts) Net income (loss) $ (3,042) $ (0.08) $ (7,383) $ (0.20) $ 15 $ – Adjustments (after tax) Reverse effect of foreign currency (1,073) (0.05) 1,059 0.03 2,988 0.08 Restructuring costs – – 474 0.01 – – Gain on sale of assets (4,028) (0.11) – – – – Add back severance payments – – – – 247 0.01 Adjusted net income (loss) $ (8,773) $ (0.24) $ (5,850) $ (0.16) $ 3,250 $ 0.09 dril-quip.com | NYSE: DRQ
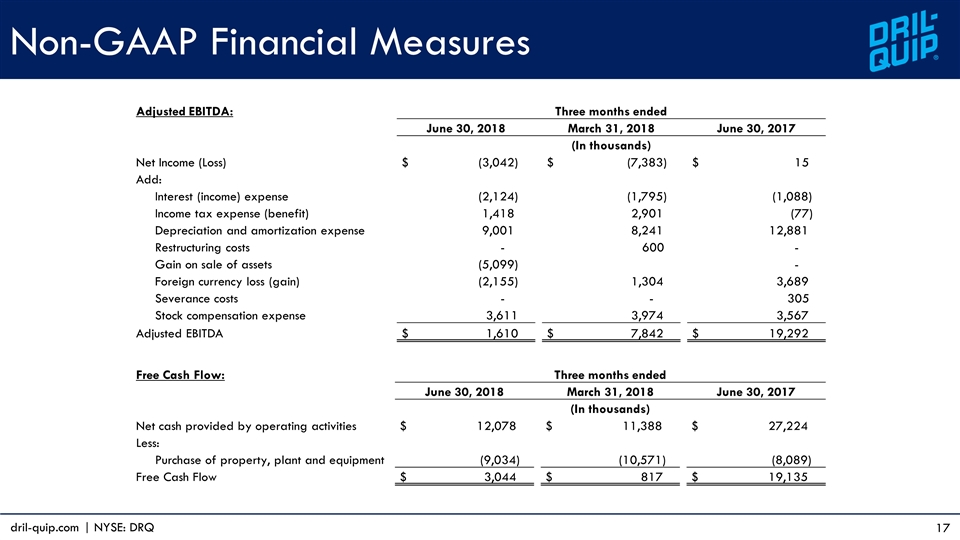
Non-GAAP Financial Measures Adjusted EBITDA: Three months ended June 30, 2018 March 31, 2018 June 30, 2017 (In thousands) Net Income (Loss) $ (3,042) $ (7,383) $ 15 Add: Interest (income) expense (2,124) (1,795) (1,088) Income tax expense (benefit) 1,418 2,901 (77) Depreciation and amortization expense 9,001 8,241 12,881 Restructuring costs - 600 - Gain on sale of assets (5,099) - Foreign currency loss (gain) (2,155) 1,304 3,689 Severance costs - - 305 Stock compensation expense 3,611 3,974 3,567 Adjusted EBITDA $ 1,610 $ 7,842 $ 19,292 Free Cash Flow: Three months ended June 30, 2018 March 31, 2018 June 30, 2017 (In thousands) Net cash provided by operating activities $ 12,078 $ 11,388 $ 27,224 Less: Purchase of property, plant and equipment (9,034) (10,571) (8,089) Free Cash Flow $ 3,044 $ 817 $ 19,135 dril-quip.com | NYSE: DRQ
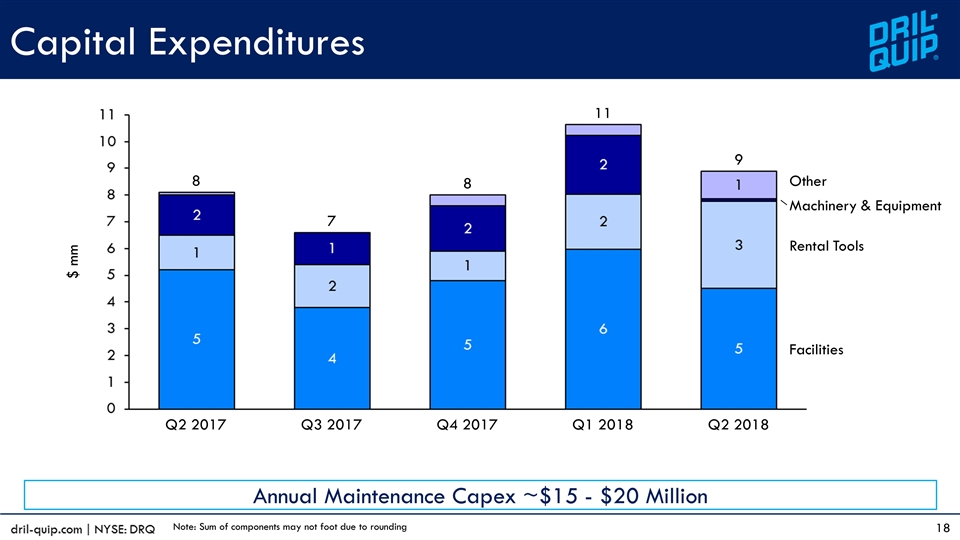
Capital Expenditures Annual Maintenance Capex ~$15 - $20 Million $ mm Note: Sum of components may not foot due to rounding
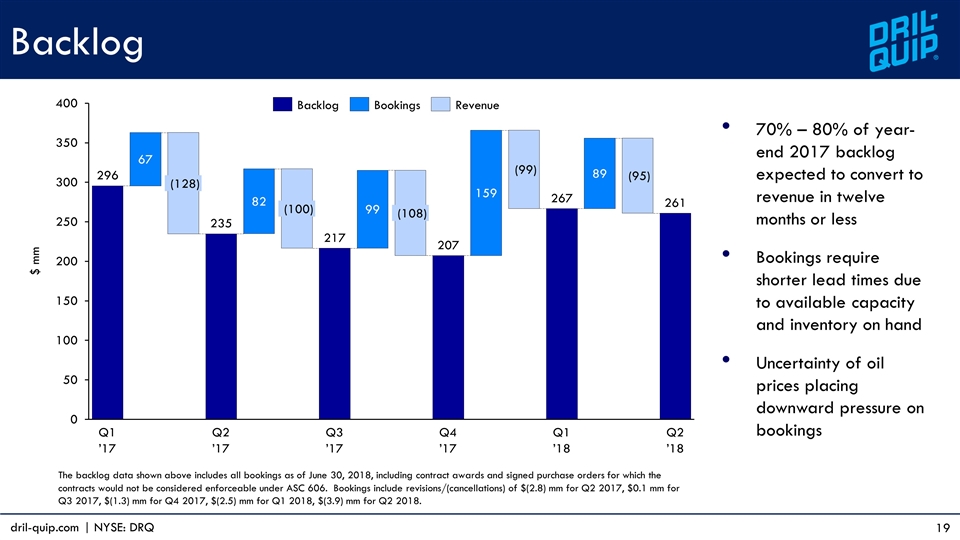
Backlog 70% – 80% of year-end 2017 backlog expected to convert to revenue in twelve months or less Bookings require shorter lead times due to available capacity and inventory on hand Uncertainty of oil prices placing downward pressure on bookings The backlog data shown above includes all bookings as of June 30, 2018, including contract awards and signed purchase orders for which the contracts would not be considered enforceable under ASC 606. Bookings include revisions/(cancellations) of $(2.8) mm for Q2 2017, $0.1 mm for Q3 2017, $(1.3) mm for Q4 2017, $(2.5) mm for Q1 2018, $(3.9) mm for Q2 2018. $ mm dril-quip.com | NYSE: DRQ
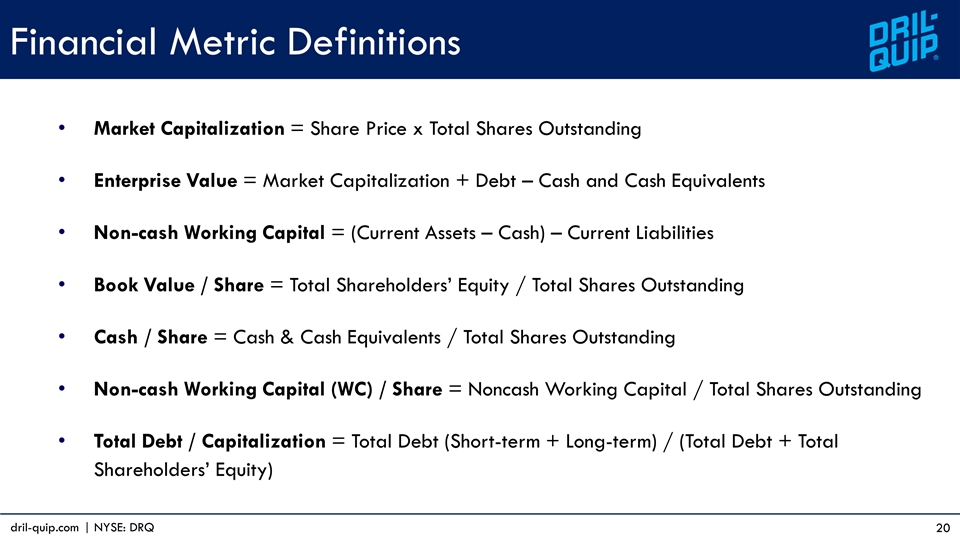
Market Capitalization = Share Price x Total Shares Outstanding Enterprise Value = Market Capitalization + Debt – Cash and Cash Equivalents Non-cash Working Capital = (Current Assets – Cash) – Current Liabilities Book Value / Share = Total Shareholders’ Equity / Total Shares Outstanding Cash / Share = Cash & Cash Equivalents / Total Shares Outstanding Non-cash Working Capital (WC) / Share = Noncash Working Capital / Total Shares Outstanding Total Debt / Capitalization = Total Debt (Short-term + Long-term) / (Total Debt + Total Shareholders’ Equity) Financial Metric Definitions dril-quip.com | NYSE: DRQ
