Attached files
| file | filename |
|---|---|
| EX-99.1 - EX-99.1 - BANC OF CALIFORNIA, INC. | d582337dex991.htm |
| 8-K - 8-K - BANC OF CALIFORNIA, INC. | d582337d8k.htm |
 July 26, 2018
2018 Second Quarter Earnings
Investor Presentation
Exhibit 99.2 |
| 1 1 When used in this presentation and in documents filed with or furnished to the Securities and Exchange Commission (the “SEC”),
in press releases or other public stockholder communications, or
in oral statements made with the approval of an authorized executive officer, the words or phrases “believe,” “will,” “should,” “will likely result,” “are expected to,”
“will continue,” “is anticipated,” “estimate,”
“project,” “plans,” or similar expressions are intended to identify “forward-looking statements” within the meaning of the Private Securities Litigation Reform Act of 1995. You are cautioned not to place undue reliance on any forward-looking statements, which speak
only as of the date made. These statements may relate to
future financial performance, strategic plans or objectives,
revenue, expense or earnings projections, or other financial items of Banc of California Inc. and its affiliates (“BANC,” the “Company,” “we,” “us” or “our”). By their nature, these statements are subject to numerous
uncertainties that could cause actual results to differ
materially from those anticipated in the statements.
Factors that could cause actual results to differ materially from the results
anticipated or projected include, but are not limited to, the following: (i) a pending investigation by the SEC may result in adverse findings, reputational damage, the imposition of sanctions, increased costs and other negative consequences; (ii)
management time and resources may be diverted to address the
pending SEC investigation as well as any related litigation, litigation initiated by stockholders and other litigation; (iii) the costs and effects of litigation, including settlements
and judgments; (iv) our performance may be adversely affected by the management
transition we have recently undergone; (v) the risk that the savings we actually realize from our recently announced reduction in force and planned reduction in use of third party advisors will be less than anticipated and
the risk that the costs associated with the reduction in force
will be greater than anticipated; (vi) risks that the
Company’s merger and acquisition transactions may disrupt current plans and operations and lead to difficulties in customer and employee retention, risks that the costs, fees, expenses and charges related to these transactions could be significantly higher than anticipated
and risks that the expected revenues, cost savings, synergies and
other benefits of these transactions might not be realized to the extent anticipated, within the anticipated timetables, or at all; (vii) risks that funds obtained from capital raising activities will not be utilized efficiently or effectively; (viii) a worsening of current economic conditions, as well as turmoil
in the financial markets; (ix) the credit risks of lending
activities, which may be affected by deterioration in real estate markets and
the financial condition of borrowers, may lead to increased loan and lease delinquencies, losses and nonperforming assets in our loan and lease portfolio, and may result in our allowance for loan and lease losses not being adequate to
cover actual losses and require us to materially increase our
loan and lease loss reserves; (x) the quality and composition of our securities portfolio; (xi) changes in general economic conditions, either nationally or in our market areas, or changes in financial markets; (xii) continuation of or changes in the historically low short-term interest rate environment, changes
in the levels of general interest rates, volatility in the
interest rate environment, the relative differences between
short- and long-term interest rates, deposit interest
rates, our net interest margin and funding sources; (xiii)
fluctuations in the demand for loans and leases, the number of
unsold homes and other properties and fluctuations in commercial and residential real estate values in our market area; (xiv) our ability to develop and maintain a strong core deposit base or other low cost funding sources necessary to fund our activities; (xv) results of
examinations of us by regulatory authorities and the possibility
that any such regulatory authority may, among other things, limit our business activities, require us to change our business mix, increase our allowance for loan and lease losses, write-down asset values or increase our capital levels, or affect our ability to borrow funds or maintain or increase deposits, any
of which could adversely affect our liquidity and earnings; (xvi)
legislative or regulatory changes that adversely affect our business, including, without limitation, changes in tax laws and policies and changes in regulatory capital or other rules, as
well as additional regulatory burdens that result from our growth to over $10
billion in total assets; (xvii) our ability to control operating costs and expenses; (xviii) staffing fluctuations in response to product demand or the implementation of corporate strategies that affect our work force and potential associated charges;
(xix) errors in estimates of the fair values of certain of our
assets and liabilities, which may result in significant changes in valuation; (xx) the network and computer systems on which we depend could fail or experience a security breach; (xxi) our ability to attract and retain key members of our senior management team; (xxii) increased competitive pressures among financial
services companies; (xxiii) changes in consumer spending,
borrowing and saving habits; (xxiv) adverse changes in the securities markets; (xxv) earthquake, fire or other natural disasters affecting the condition of real estate collateral; (xxvi) the availability of resources to address changes in laws, rules or regulations or to respond to regulatory actions; (xxvii)
inability of key third-party providers to perform their
obligations to us; (xxviii) changes in accounting policies and practices, as
may be adopted by the financial institution regulatory agencies or the Financial Accounting Standards Board or their application to our business or final audit adjustments, including additional guidance and interpretation on accounting issues and
details of the implementation of new accounting methods; (xxix)
share price volatility and reputational risks, related to, among other things, speculative trading and certain traders shorting our common shares and attempting to generate negative publicity about us; (xxx) war or terrorist activities; and (xxxi) other economic, competitive, governmental, regulatory, and
technological factors affecting our operations, pricing, products
and services and the other risks described from time to time in other documents that we file with or furnish to the SEC. You should not place undue reliance on forward-looking statements, and we undertake no obligation to update any such statements to reflect circumstances or events that occur after
the date on which the forward-looking statement is
made. Forward-looking Statements
|
 2 2 Strong Organic Loan Growth Continuation of Balance Sheet Re-Mix Disciplined Expense Management Held for investment loans grew by $105 million, or 2% QoQ (6% annualized) – Gross loan commitment originations of $765 million at an average production yield of 5.05%
Sold $204 million of performing SFR/MF loans to manage interest rate
risk Second
quarter noninterest expense totaled $62.6 million Non-recurring expenses of $6.4 million including $1.5 million of net legal and professional fees, a
$0.4 million legal settlement expense, $0.5 million charge to write off
certain software models related to DFAST, and $4.0 million
restructure expense associated with the reduction in force
executed on June 26th
Credit and Capital Net charge-offs totaled $738,000, including $372,000 related to performing loan sale
NPAs /Assets of 0.22% and ALLL / Loans increased to 0.81%, up from 0.71% a year ago Total delinquencies (delinquent non-PCI loans to total non-PCI loans) declined to 0.38%
from 0.63% at the end of the prior quarter
Common Equity Tier 1 ratio of 9.90%
Second Quarter 2018 Highlights
Further Progress Towards a Core Commercial Bank Platform
Managing Talent Hired Jim Hazboun as Chief Human Resources Officer Promoted Jason Pendergist to Head of Commercial Banking Reduced securities by $127 million for the quarter, driven by a net decline in collateralized
loan obligation securities (“CLOs”) from sale and call activity
totaling $74 million and the sale of $41 million of commercial
mortgage-backed securities (“CMBS”) Reduced FHLB
advances by $100 million due to improved core deposit growth
1 Held for investment Core deposit balances increased by $357 million, and brokered deposit balances declined
by $332 million
Stabilization of
Core Deposits 1 1 |
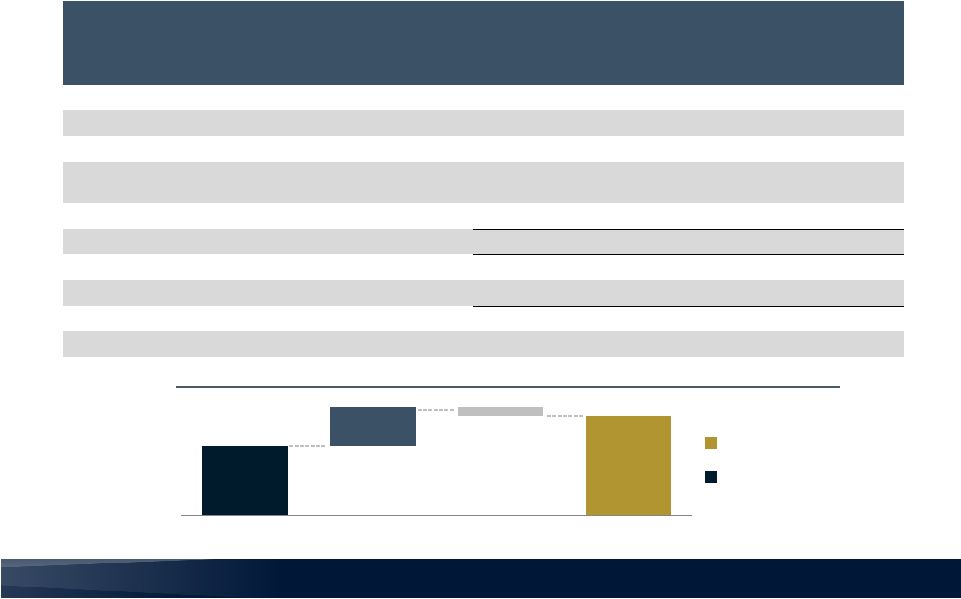
 3 3 1 Dollars in millions Total Assets $10,319 ($127) $10,329 $12 $105 1Q18 Cash and Other Securities HFI Loans 2Q18 Strategic Asset Re-Mix Continues Re-Mix of Balance Sheet Toward Core HFI Loans Through Reduced Securities
Q2 Strategic Balance Sheet Re-Mix Activities
1 2 Securities declined by $127 million, including: - Sale of $41 million of CMBS - CLO net runoff of $74 million Increased overall HFI loans by $105 million, or 2% from the prior quarter 1 2 1 |
 4 4 BANC Strategic Roadmap: Scorecard Building Core Earnings Power for Sustainable Growth and Returns Over the Long Term
Strategy Components
Tracking Guideposts 1st Half 2018 Results Build Core Deposits Core Deposit Balance Growth Core deposits increased $413 million In Q1, completed the run-off of $207 million of legacy high-rate, high volatility deposits Brokered deposits declined $363 million Amplify Lending Annual Net Loan Growth Loan Originations Securities / Assets (%) HFI loan growth of $377 million, or 11% annualized $1.63 billion of gross loan commitment originations Securities / assets of 22%, down from 25% at YE Normalize Expenses Noninterest Expenses / Average Assets NIE 1 / average assets of 2.21%, down from 2.33% at Q4’17 Continuing to invest in sales and originations while driving efficiencies in support area Creating Stockholder Value ROAA ROATCE Aligned Incentive Plan 0.46% 4.18% 2018 Annual Incentive Plan targets published: Core deposit growth, ROAA, loan growth, adjusted efficiency ratio (%). Additional gating criteria for CET1 ratio (%) and non-performing assets (%). 1 Operating expenses, non-GAAP measure, see reconciliation on slide 8.
2 Non-GAAP measure, see reconciliation on slide 19. 2 1 |
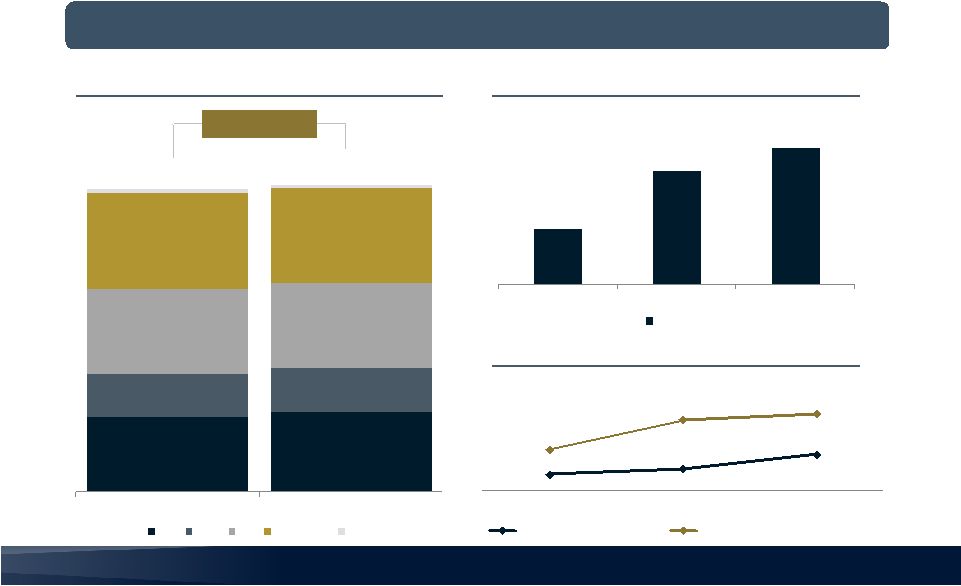
 5 5 1 Dollars in millions 2 Core deposits defined as non-brokered deposits Deposit Composition 1 $5,630 $5,685 $6,043 $207 $1,456 $1,425 $1,093 $7,293 $7,110 $7,136 77% 80% 85% 4Q17 1Q18 2Q18 Change 2Q18 vs. 1Q18 $332 $357 Build Core Deposits: Stabilized Core Deposit
Base Core Deposits Increased by $357 Million in the Quarter,
While Brokered Declined by $332 Million BANC
Brokered Institutional Bank (IB) Run-off Core Deposits Core Deposits (% of Deposits) 2 |
 6 6 1 Dollars in millions 2 Includes Construction 3 Gross loan commitment originations YTD gross loan production 3 of $1.63 billion at 5.01% average production yield Loans Held for Investment 1 Loans Held for Investment 1 $7,036 1Q18 2Q18 C&I CRE² MF Residential Other 25% 14% 28% 32% +2% Q/Q $6,659 $6,931 $7,036 4Q17 1Q18 2Q18 Period End Amplify Lending: Growing Loan Balances
Loan Production Efforts Driving Higher Loan Balances
B ANC
4.42% 4.48% 4.63% 4.68% 4.99% 5.05% 4Q17 1Q18 2Q18 Portfolio Loan Yields New Production Loan Yields Loan Production Yields Above Loan Portfolio Yields 1% 26% 14% 28% 31% 1% $6,931 |
 7 7 $6.7 $7.0 $2.5 $2.3 $0.5 $0.4 $9.7 $9.7 1Q18 2Q18 Loans (HFI) Securities Other Net Interest Margin Stabilized Benefiting from Re-mix of Securities to Loans and Wholesale Funding to Core Deposits
Net Interest Margin Components
3.88% 3.92% 4.04% 4.00% 4.12% 4.35% 3.19% 3.09% 3.15% 3.01% 2.98% 3.01% 0.64% 0.73% 0.80% 0.87% 0.96% 1.15% 1Q17 2Q17 3Q17 4Q17 1Q18 2Q18 Earning Asset Yield Net Interest Margin Cost of Deposits Interest Earning Assets 1 1 Average, dollars in billions 2 Includes loans held for sale and other interest-earning assets
3 Dollars in millions, consolidated operations $105.4 $(0.1) $98.9 $1.5 $5.1 1Q18 Securities, HFS, & Other Residential Mortgage - HFI Commercial Loans 2Q18 Interest Income 3 2 |
 8 8 1 Loss on investments in alternative energy partnerships create tax credits to offset expense incurred.
2
Continuing operations operating expense less non-recurring
adjustments. Non-GAAP measure: Reconciliation table above.
3 Continuing operations noninterest expense excluding loss on investments in alternative energy partnerships, annualized, over average
consolidated assets. Non-Recurring Adjustments to Continuing
Operations Expenses ($ in
millions) Noninterest Expense - Continuing Operations Q2 non- recurring adjustments Q2 Operating Expense 2 Salaries and employee benefits $ 29.4 $ 29.4 Occupancy and equipment 7.9 7.9 Professional fees 6.3 $ (1.5) 4.8 Data processing 1.7 1.7 Advertising 2.9 2.9 Regulatory assessments 2.2 2.2 Provision (reversal) for loan repurchases (0.2) (0.2) Amortization of intangible assets 0.8 0.8 Restructuring expense 4.0 (4.0) 0.0 All other expense 5.8 (0.9) 4.9 Total Noninterest Expense (ex-loss on investments in alternative energy partnerships) $ 60.7 $ (6.4) $ 54.3 Loss on investments in alternative energy partnerships¹ $ 1.8 Total Noninterest Expense (reported) $ 62.5 Normalize Expenses: Leveraging Expenses
Efficiently Simplifying Operating Model and Delivering
Operational Efficiencies BA
NC 2.12% 2.45% 2.33% 2.37% 4Q17 1Q18 2Q18 2Q18 Operating Long-Term Target <2.00% NIE / Average Assets 3 |
 9 9 ($ in millions) Continuing Operations (reported) Q2 adjustments 1 Q2 Operating Earnings from Continuing Operations 2 Normalized Tax Rate at 20% 2 Net interest income $ 72.8 $ 72.8 Provision for loan and lease losses 2.7 2.7 Total noninterest income 8.1 (2.4) 4 5.7 Total noninterest expense (ex-loss on investments in alternative energy partnerships) $ 60.7 $ (6.4) $ 54.3 Loss on investments in alternative energy partnerships³ 1.8 (1.8) --- Total noninterest expense 62.5 (8.2) 54.3 Pre-tax income $ 15.6 $ 5.8 $ 21.5 Income tax expense³
1.8 2.5 4.3 Net income $ 13.9 $ 3.3 $ 17.2 Diluted earnings per total common share $ 0.16 $0.23 1 Includes non-recurring items, loss on investments in alternative energy partnerships, and income tax expense required to reach
a normalized rate of 20%.
2 Non-GAAP measure: Reconciliation table above. 3 Loss on investments in alternative energy partnerships create tax credits to offset expense incurred. 4
Includes $0.3 million benefit from security sales and a $2.1 million legal settlement. Focusing on Core, Sustainable Returns Q2 Including Non-Recurring Items Shown Below $0.16 $0.23 $0.09 2Q18 Reported Adjustments Tax rate normalized at 20% 2Q18 Adjusted Diluted EPS – Continuing Operations Reported Adjusted for non-recurring items ($0.02) |
 10 10 Financial Metric Long-Term Strategic Operating Targets 1st Half 2018 Plan Tracking Comments Growth / Balance Sheet: - Loan Growth (HFI)¹ Mid-Teens +11% Loan sales temporarily slowed growth - Deposit Growth (ex-brokered) 2 Low-to-Mid Teens +15% Early Innings of Deposit & Treasury Management Build Out - Securities / Total Assets 15% - 20% 22% Trending Toward Target Operating Metrics: - NIM 3.00% – 3.20% 3.00% Improved earning asset pricing Core deposits better priced than wholesale funding - NIE 3 / Average Assets <2.00% 2.21% Trending Toward Target - Tax Rate 20 – 25% --- Expect FY 2018 Tax Rate Normalization in the 2nd Half Returns: - ROAA 1%+ 0.46% - ROATCE 4 12%+ 4.18% 1 Annualized 2 Annualized ex-brokered, ex-IB run off deposits 3 Continuing operations noninterest expenses excluding loss on investments in alternative energy partnerships, annualized, over average consolidated assets. See page 8 for Non-GAAP reconciliation. 4 Non –GAAP measure, see page 19 for reconciliation.
Creating Stockholder Value: Strategic Target Tracking Focused on Building Core Earnings Power for Sustainable Growth and Returns Over the Long Term
BAN C |
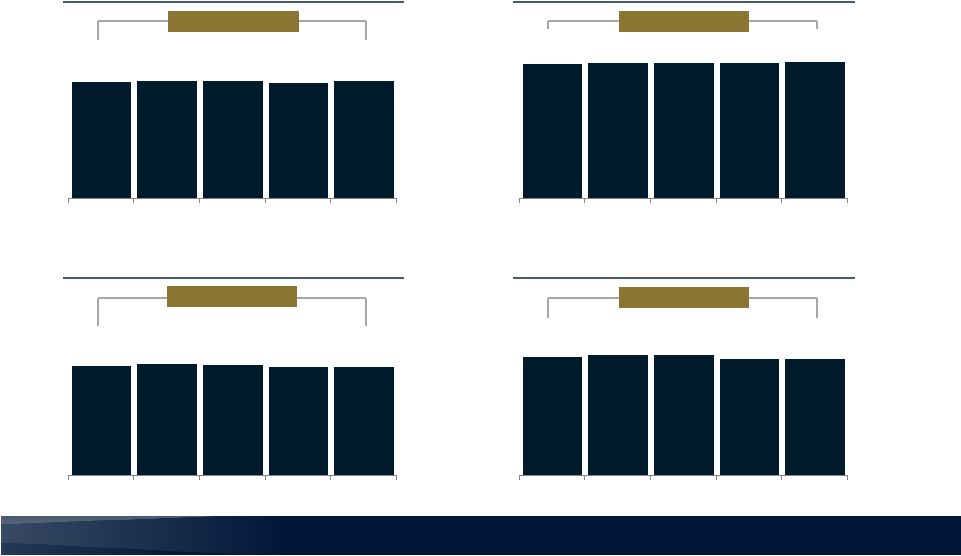
 11 11 1.2% 1.6% 2.1% 2.2% 2.3% 2Q17 3Q17 4Q17 1Q18 2Q18 $12.3 $16.0 $21.2 $22.2 $23.0 0.12% 0.16% 0.21% 0.22% 0.22% 2Q17 3Q17 4Q17 1Q18 2Q18 NPAs NPAs/Assets Nonperforming Assets 1 Asset Quality Remains Strong and Stable Disciplined Credit Culture Continues to Drive Strong Asset Quality 1 Dollars in millions, held for investment NPAs / Equity ALLL and NPL Coverage 0.71% 0.72% 0.74% 0.79% 0.81% 468% 367% 255% 258% 254% 2Q17 3Q17 4Q17 1Q18 2Q18 ALLL/Total Loans ALLL/NPLs Total Delinquent Loans / Total Loans 0.38% 0.52% 0.50% 0.63% 0.63% 2Q17 3Q17 4Q17 1Q18 2Q18 |
 12 12 Tangible Equity / Tangible Assets 1 9.3% 9.5% 9.4% 9.2% 9.2% 2Q17 3Q17 4Q17 1Q18 2Q18 -1% Solid Capital Ratios Exceeding Basel III Guidelines Tier 1 Risk-Based Capital Ratio Supported by $269 Million of Preferred Equity
Common Equity Tier 1 Ratio (CET1)
9.8% 9.9% 9.9% 9.8% 9.9% 2Q17 3Q17 4Q17 1Q18 2Q18 +1% Tangible Common Equity / Tangible Assets 1 6.7% 6.8% 6.8% 6.6% 6.6% 2Q17 3Q17 4Q17 1Q18 2Q18 -2% Tier 1 Risk-Based Capital Ratio 13.7% 13.8% 13.8% 13.7% 13.8% 2Q17 3Q17 4Q17 1Q18 2Q18 +1% 1 Non-GAAP measure. Reconciliation on slide 19. |
 13 13 Appendix |
 14 14 Securities Portfolio Yield Benefiting from CLO Quarterly Rate Reset 1 Dollars in millions 2 Based on book value balances of rated securities, data at June 30, 2018 3 Dollars in billions Securities Portfolio Detail 1 Security Type Book Value 1Q18 Book Value 2Q18 Q2 Change Fair Value 2Q18 Book Yield 2Q18 Duration 2Q18 Gov’t & Agency (Agency MBS) $ 495 $ 486 ($ 9) $ 458 2.55% 7.18 CLOs 1,744 1,677 (67) 1,680 4.17% 0.12 CMBS 201 161 (40) 158 3.79% 6.13 Other 1 1 --- 1 n/m n/m Total Securities 2,441 2,325 (116) 2,297 3.81% 2.01 Portfolio Profile 2 AAA / AA 99% A 1% Credit Rating $3.0 $2.8 $2.7 $2.5 $2.3 3.34% 3.46% 3.46% 3.47% 3.78% 2Q17 3Q17 4Q17 1Q18 2Q18 Average Balance Yield Portfolio Average Balances and Yields 3 Agency 21% CLOs 72% CMBS 7% Composition |
 15 15 1 All figures from Continuing Operations unless noted; dollars in millions unless noted per share or percentage.
2
Consolidated operations; Efficiency ratio adjusted for including the
pre-tax effect of investments in alternative energy partnerships . 3 Excluding loss on investments in alternative energy partnerships . 4 Non-GAAP measure.
Reconciliation within table above. 5 Non-GAAP measure. Reconciliation on slide 17. ($ in millions) 1 2Q18 1Q18 4Q17 3Q17 2Q17 Total Assets 2 $ 10,319 $ 10,329 $ 10,328 $ 10,280 $ 10,366 Securities 2,297 2,425 2,575 2,756 2,915 Loans Held for Investment 7,036 6,931 6,659 6,227 5,956 Deposits 7,136 7,110 7,293 7,404 8,045 Net Interest Income 72.8 71.4 73.2 75.0 75.5 Provision for Loan and Lease Losses 2.7 19.5 5.1 3.6 2.5 Non Interest Income 8.1 8.6 5.7 18.4 5.7 Noninterest Expense 3,4 60.7 59.8 62.4 67.3 66.6 Loss on Investments in Alternative Energy Partnerships 1.8 n/m 4.0 8.3 9.8 Noninterest Expense – Reported 62.5 59.8 66.4 75.7 76.3 Net Income 13.9 7.1 10.9 18.1 15.1 Diluted Earnings Per Share $ 0.16 $ 0.03 $ 0.11 $ 0.25 $ 0.20 Return on Average Assets 2 0.58% 0.34% 0.44% 0.67% 0.46% Efficiency Ratio 2,5 73.5% 65.7% 75.5% 72.5% 80.5% Preferred Equity Class / Series CUSIP Issue Date Amount Out ($000) Dividend Rate / Coupon (%) First Callable Date Preferred Equity: Non-Cumulative, Perpetual E 05990K874 2/8/2016 125,000 7.00% 3/15/2021 Preferred Equity: Non-Cumulative, Perpetual D 05990K882 4/8/2015 115,000 7.375% 6/15/2020 Preferred Equity: Non-Cumulative, Perpetual C 05990K403 6/12/2013 40,250 8.00% 9/15/2018 Total Preferred Equity $ 280,250 BANC Fast Facts & Preferred Equity Capital Structure |
| 16 16 This presentation contains certain financial measures determined by methods other than in accordance with U.S. generally
accepted accounting principles (GAAP). These measures include noninterest
expense from continuing operations, operating expense from
continuing operations, and diluted earnings per share from continuing operations, adjusted for non-recurring items, each excluding loss on investments in alternative energy partnerships and the latter two also reflecting adjustments for
non- recurring items. Management believes that these
particular measures provide useful supplemental information in understanding our core operating performance. These measures should not be viewed as substitutes for measures determined in accordance
with GAAP, nor are they necessarily comparable to non-GAAP
measures that may be presented by other companies. Reconciliations of these measures to measures determined in accordance with GAAP are contained on slides 8, 9 and 17 of this presentation.
Non-GAAP measures in this presentation also include tangible
equity to tangible assets, tangible common equity to tangible assets, return on average tangible common equity, and adjusted efficiency ratio including the pre-tax effect of investments in alternative
energy partnerships. These particular measures are used by
management in its analysis of the Company's capital strength and the
performance of the Company’s businesses. Banking and financial institution
regulators also exclude goodwill and other intangible assets from
total stockholders' equity when assessing the capital adequacy of a financial institution. Management believes the presentation of these measures excluding the impact of these items provides useful supplemental information that is
essential to
a proper understanding of the capital and financial strength of the Company and the performance of its businesses. These measures
should not be viewed as substitutes for results determined in
accordance with GAAP, nor are they necessarily comparable to non- GAAP measures that may be presented by other companies. Reconciliations of these measures to measures determined in
accordance with GAAP are contained on slides 17-19 of this
presentation. Non-GAAP Financial Information
|
 17 17 (in thousands) 2Q18 1Q18 4Q17 3Q17 2Q17 Noninterest expense $ 62,554 $ 59,812 $ 66,424 $ 79,008 $ 98,216 Gain (loss) on investments in alternative energy partnerships, net (1,808) 34 (3,995) (8,348) (9,761) Adjusted noninterest expense $ 60,746 $ 59,846 $ 62,429 $ 70,660 $ 88,455 Net interest income $ 72,953 $ 71,624 $ 73,246 $ 75,953 $ 78,296 Noninterest income 9,168 10,452 6,429 18,827 19,817 Total revenue 82,121 82,076 79,675 94,780 98,113 Tax credit from investments in alternative energy partnerships 1,912 7,323 4,908 8,777 15,681 Deferred tax expense on investments in alternative energy partnerships (211) (769) (859) (1,536) (2,744) Tax effect on tax credit and deferred tax expense 631 2,422 3,004 3,804 8,584 Gain (loss) on investments in alternative energy partnerships, net (1,808) 34 (3,995) (8,348) (9,761) Total pre-tax adjustments for investments in alternative energy partnerships 524 9,010 3,058 2,697 11,760 Adjusted total revenue $ 82,645 $ 91,086 $ 82,733 $ 97,477 $ 109,873 Efficiency ratio 76.17% 72.87% 83.37% 83.36% 100.10% Adjusted efficiency ratio including the pre-tax effect of investments in alternative energy partnerships 73.50% 65.70% 75.46% 72.49% 80.51% Effective tax rate utilized for calculating tax effect on tax credit and deferred tax expense 27.07% 26.98% 42.59% 34.44% 39.89% Non-GAAP Reconciliation Adjusted Efficiency Ratio Including the Pre-tax Effect of Investments in Alternative Energy Partnerships
|
 18 18 (in thousands) 2Q18 1Q18 4Q17 3Q17 2Q17 Tangible common equity to tangible assets ratio Total assets $ 10,319,280 $ 10,329,319 $ 10,327,852 $ 10,280,028 $ 10,365,768 Less goodwill (37,144) (37,144) (37,144) (37,144) (37,144) Less other intangible assets (7,683) (8,510) (9,353) (10,219) (11,135) Tangible assets $ 10,274,453 $ 10,283,665 $ 10,281,355 $ 10,232,665 $ 10,317,489 Total stockholders’ equity $ 988,688 $ 993,756 $ 1,012,308 $ 1,013,908 $ 1,006,292 Less goodwill (37,144) (37,144) (37,144) (37,144) (37,144) Less other intangible assets (7,683) (8,510) (9,353) (10,219) (11,135) Tangible equity 943,861 948,102 965,811 966,545 958,013 Less preferred stock (269,071) (269,071) (269,071) (269,071) (269,071) Tangible common equity $ 674,790 $ 679,031 $ 696,740 $ 697,474 $ 688,942 Tangible equity to tangible assets 9.19% 9.22% 9.39% 9.45% 9.29% Tangible common equity to tangible assets 6.57% 6.60% 6.78% 6.82% 6.68% Non-GAAP Reconciliation Tangible Common Equity to Tangible Assets and Tangible Equity to Tangible Assets |
 19 19 (in thousands) 1st Half 18 2Q18 1Q18 4Q17 3Q17 2Q17 Return on Tangible Common Equity Average total stockholders’ equity $ 1,010,355 $ 1,000,856 $ 1,019,961 $ 1,014,368 $ 1,005,462 $ 1,014,267 Less average preferred stock (269,071) (269,071) (269,071) (269,071) (269,071) (269,071) Less average goodwill (37,144) (37,144) (37,144) (37,144) (37,144) (37,144) Less average other intangible assets (8,539) (8,110) (8,972) (9,788) (10,760) (11,808) Average tangible common equity $ 695,601 $ 686,531 $ 704,774 $ 698,365 $ 688,487 $ 696,244 Net income $ 23,338 $ 14,780 $ 8,558 $ 11,302 $ 16,949 $ 12,257 Less preferred stock dividends (10,226) (5,113) (5,113) (5,113) (5,112) (5,113) Add amortization of intangible assets 1,670 827 843 866 916 1,056 f intangible assets --- --- --- --- --- --- assets (351) (174) (177) (303) (321) (370) $ 14,431 $ 10,320 $ 4,111 $ 6,752 $ 12,432 $ 7,830 Return on average equity 4.66% 5.92% 3.40% 4.42% 6.69% 4.85% Return on average tangible common equity 4.18% 6.03% 2.37% 3.84% 7.16% 4.51% Effective tax rate utilized for calculating tax effect on amortization and impairment of intangible assets 21.00% 21.00% 21.00% 35.00% 35.00% 35.00% Non-GAAP Reconciliation Return on Average Tangible Common Equity |