Attached files
| file | filename |
|---|---|
| EX-99.1 - EXHIBIT 99.1 - Extended Stay America, Inc. | exhibit991-earningsrelease.htm |
| 8-K - 8-K - Extended Stay America, Inc. | stay-8xkannouncingq22018fo.htm |

Q2 2018 Earnings Summary July 25, 2018 Extended Stay America, Inc. ESH Hospitality, Inc.

important disclosure information This presentation contains forward-looking statements within the meaning of the federal securities laws. Forward looking statements involve known and unknown risks, uncertainties and other factors that may cause Extended Stay America, Inc.’s (the “Corporation”) and ESH Hospitality, Inc.’s (“ESH REIT,” and together with the Corporation, the “Company”) actual results or performance to differ from those projected in the forward-looking statements, possibly materially. For a description of factors that may cause the Company’s actual results or performance to differ from projected results or performance implied by forward- looking statements, please review the information under the headings “Cautionary Note Regarding Forward-Looking Statements” and “Risk Factors” included in the Company’s combined annual report on Form 10-K filed with the Securities and Exchange Commission (“SEC”) on February 27, 2018 and other documents of the Company on file with or furnished to the SEC. Any forward- looking statements made in this presentation are qualified by these cautionary statements, and there can be no assurance that the actual results or developments anticipated by the Company will be realized or, even if substantially realized, will have the expected consequences to, or effects on, the Company, its business or operations. Except as required by law, the Company undertakes no obligation to update publicly or revise any forward-looking statement, whether as a result of new information, future developments or otherwise. We caution you that actual results may differ materially from what is expressed, implied or forecasted by the Company’s forward-looking statements. This presentation includes certain non-GAAP financial measures, including Hotel Operating Profit, Hotel Operating Margin, EBITDA, Adjusted EBITDA, Funds from Operations (“FFO”), Adjusted Funds From Operations (“Adjusted FFO”), Adjusted FFO per diluted Paired Share, Paired Share Income, Adjusted Paired Share Income and Adjusted Paired Share Income per diluted Paired Share. These non-GAAP financial measures should be considered only as supplemental to, and not as superior to, financial measures prepared in accordance with U.S. GAAP. Please refer to the Appendix of this presentation for a reconciliation of these non-GAAP financial measures to the most directly comparable financial measures prepared in accordance with U.S. GAAP, and to the Company’s combined annual report on Form 10-K filed with the SEC on February 27, 2018 for definitions of these non-GAAP measures. 2

Q2 2018 Operating Results & Financial Highlights comparable system-wide revenue per available net income (in millions)1 room (“RevPAR”) $65.6 $53.04 $53.91 $49.7 Q2 2017 Q2 2018 Q2 2017 Q2 2018 hotel operating margin2 adjusted FFO per diluted Paired Share1,2 56.7% 56.4% $0.58 $0.53 Q2 2017 Q2 2018 Q2 2017 Q2 2018 adjusted EBITDA (in millions) 1,2 adjusted Paired Share income per diluted Paired Share1,2 $0.35 $172.8 $0.31 $167.3 Q2 2017 Q2 2018 Q2 2017 Q2 2018 1Net Income, Adjusted EBITDA, Adjusted FFO per diluted Paired Share and Adjusted Paired Shared Income per diluted Paired Share were affected by lost contribution from 4 hotels sold in May 2017, 1 hotel sold in December 2017 and 26 hotels sold in 1Q 2018. 2See Appendix for Hotel Operating Margin, Adjusted FFO per diluted Paired Share, Adjusted EBITDA and Adjusted Paired Share Income per diluted Paired Share reconciliations. 3

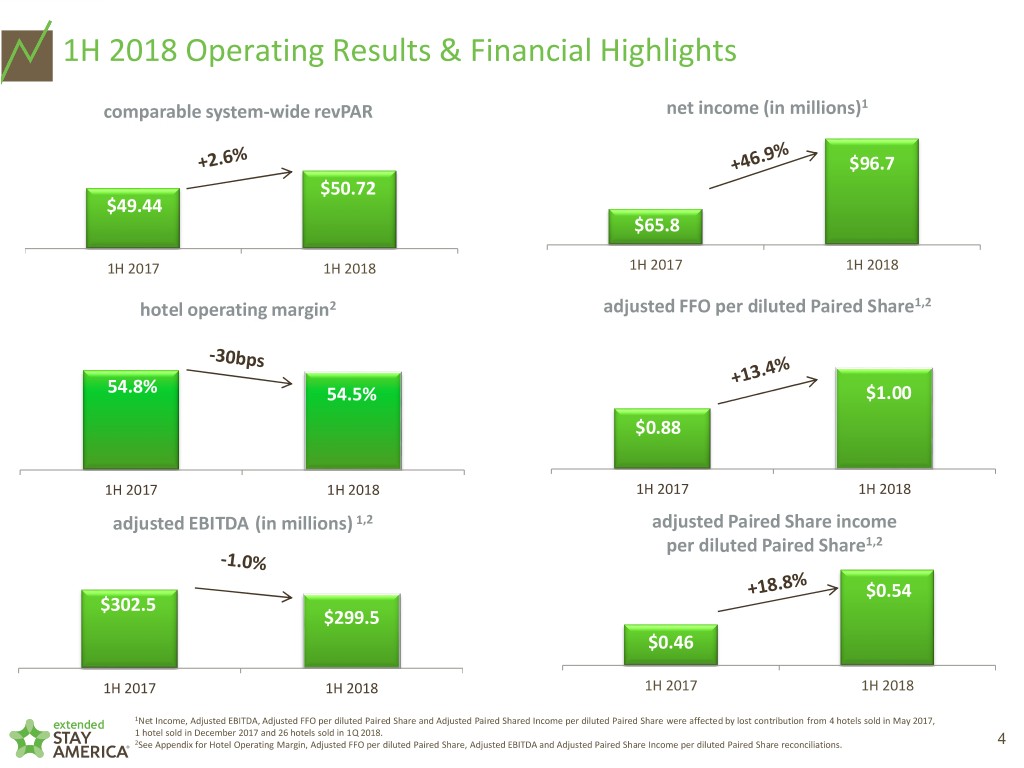
1H 2018 Operating Results & Financial Highlights comparable system-wide revPAR net income (in millions)1 $96.7 $50.72 $49.44 $65.8 1H 2017 1H 2018 1H 2017 1H 2018 hotel operating margin2 adjusted FFO per diluted Paired Share1,2 54.8% 54.5% $1.00 $0.88 1H 2017 1H 2018 1H 2017 1H 2018 adjusted EBITDA (in millions) 1,2 adjusted Paired Share income per diluted Paired Share1,2 $0.54 $302.5 $299.5 $0.46 1H 2017 1H 2018 1H 2017 1H 2018 1Net Income, Adjusted EBITDA, Adjusted FFO per diluted Paired Share and Adjusted Paired Shared Income per diluted Paired Share were affected by lost contribution from 4 hotels sold in May 2017, 1 hotel sold in December 2017 and 26 hotels sold in 1Q 2018. 2See Appendix for Hotel Operating Margin, Adjusted FFO per diluted Paired Share, Adjusted EBITDA and Adjusted Paired Share Income per diluted Paired Share reconciliations. 4

Quarterly Distribution and Select Balance Sheet Amounts quarterly distribution cash balance (in millions)2 per Paired Share1 +4.8% $0.22 $249.0 $227.4 $0.21 Q2 2017 Q2 2018 Q1 2018 Q2 2018 adjusted net debt / TTM adjusted EBITDA ratio3 debt outstanding (in millions)4 $2,528 $2,525 3.8X 3.7X Q1 2018 Q2 2018 Q1 2018 Q2 2018 ¹ Distribution dates of August 29, 2017 and August 23, 2018. 2 Includes restricted and unrestricted cash. 3 Net debt calculation is (gross debt – total restricted and unrestricted cash) divided by TTM Adjusted EBITDA on a 598 hotel basis for Q1 2018 and a 599 hotel basis for Q2 2018. 5 4 Gross debt outstanding (excludes discounts and deferred financing costs).

Asset Disposition Update ~150 ~150 ~75 77 31 30 46 4 5 Timing 2Q17 4Q17 1Q18 1Q18 2H18 FCF Multiple3 ~17.5x ~16x ~16x ~19.5x Gross $61 $16 $114 $45 Proceeds4 million million million million 1 Under three purchase and sale agreements to sell in total 46 hotels. Subject to customary due diligence, the Company expects to complete these transactions in 2018 or early 2019, 2 Expected number of hotel assets sold between 2019 and 2021. The actual number of hotels sold may differ. 3 Free Cash Flow Multiple (“FCF”) is equal to the gross proceeds / (TTM adjusted EBITDA – pro forma maintenance and renovation capex). 6 4 Gross proceeds before transaction expense. Three Wall gross transaction includes $1.9 million in franchise application fees.

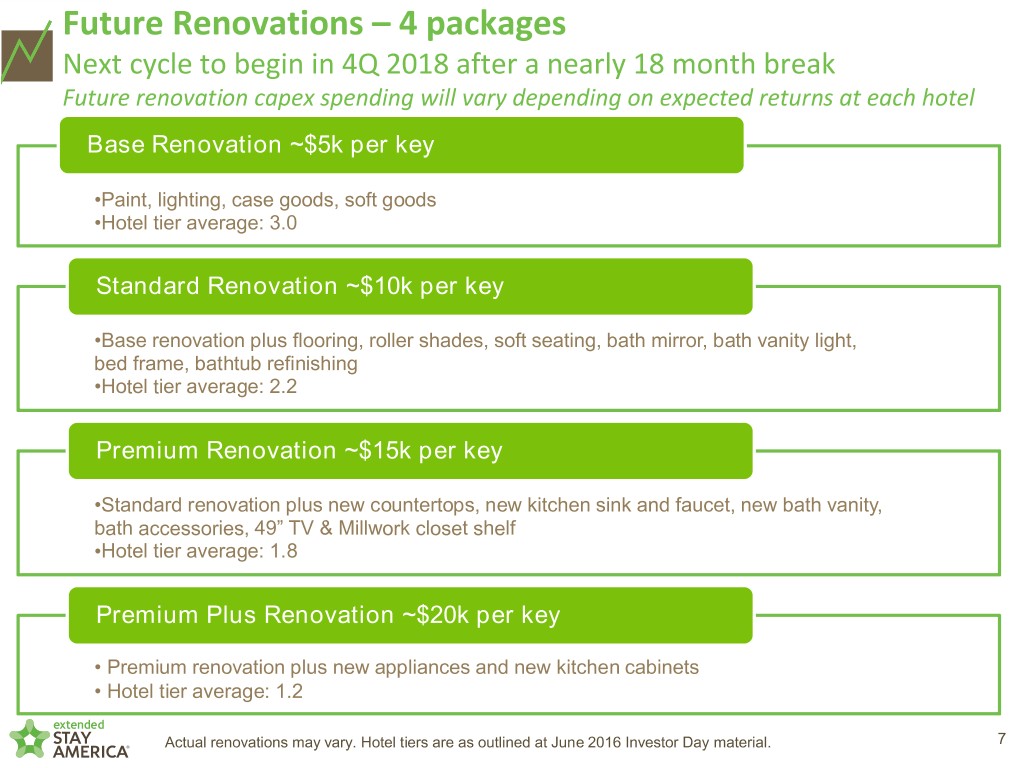
Future Renovations – 4 packages Next cycle to begin in 4Q 2018 after a nearly 18 month break Future renovation capex spending will vary depending on expected returns at each hotel Base Renovation ~$5k per key •Paint, lighting, case goods, soft goods •Hotel tier average: 3.0 Standard Renovation ~$10k per key •Base renovation plus flooring, roller shades, soft seating, bath mirror, bath vanity light, bed frame, bathtub refinishing •Hotel tier average: 2.2 Premium Renovation ~$15k per key •Standard renovation plus new countertops, new kitchen sink and faucet, new bath vanity, bath accessories, 49” TV & Millwork closet shelf •Hotel tier average: 1.8 Premium Plus Renovation ~$20k per key • Premium renovation plus new appliances and new kitchen cabinets • Hotel tier average: 1.2 Actual renovations may vary. Hotel tiers are as outlined at June 2016 Investor Day material. 7

ESA Pipeline Update Company Owned Pipeline & Recently Opened as of June 30, 2018 Under Option Pre-Development Under Construction Total Pipeline Opened YTD # Hotels # Rooms # Hotels # Rooms # Hotels # Rooms # Hotels # Rooms # Hotels # Rooms 11 1,367 4 504 0 0 15 1,871 1 115 Third Party Pipeline as of June 30, 2018 Commitments Applications Executed Total Pipeline Opened YTD # Hotels # Rooms # Hotels # Rooms # Hotels # Rooms # Hotels # Rooms # Hotels # Rooms 15 1,860 4 496 0 0 19 2,356 0 0 Definitions Under Option Locations with a signed purchase and sale agreement Pre-Development Land purchased, permitting and/or site work Under Construction Hotel is under construction Commitments Signed commitment to build a certain number of hotels Applications Submitted a franchise application with deposit Executed Application approved, various stages of pre-development and under construction 8

Q2 2018 Results, Q3 2018 Guidance1 and Full Year 2018 Guidance1 (in millions, except %) Q2 2018 Guidance Q2 2018 Actual RevPAR % D2 1.0% to 3.0% 1.6% Adjusted EBITDA $164 to $170 $167.3 1 (in millions, except %) Q3 2018 Guidance RevPAR % D2 1.0% to 3.0% Adjusted EBITDA $170 $176 4 (in millions, except %) 2018 Guidance Prior Outlook RevPAR % D2 1.0% to 2.75% 1.0% to 3.0% Net income $194 $208 $188 $207 Adjusted EBITDA3 $595 $610 $600 $620 Depreciation and amortization $213 $213 $220 $220 Net interest expense $130 $130 $130 $130 Effective tax rate 16.5% 17.0% 16.0% 17.0% Adjusted Paired Share income $1.07 $1.15 $1.04 $1.14 per diluted Paired Share Expected capital returns $260 $300 $260 $300 Capital expenditures $205 $235 $205 $235 1 Guidance for Q3 2018 and full year 2018 is as of July 25, 2018. 2 RevPAR % D shown on a comparable system-wide basis. 3 Estimated lost contribution of approximately $18 million related to 5 hotel assets sold in 2017, and 26 hotel assets sold in early 2018 for the full year 2018. 4 Prior guidance from April 26, 2018 9

appendix

STATISTICS FOR THE 46 HOTELS UNDER CONTRACT TO BE SOLD (Unaudited) Q3 2017 Q4 2017 Q1 2018 Q2 2018 Total Expected Dispositions (46) Number of hotels 46 46 46 46 Number of rooms 4,778 4,778 4,778 4,778 Occupancy 70.0% 60.7% 62.6% 70.6% ADR $ 51.53 $ 51.98 $ 50.53 $ 51.78 RevPAR $ 36.05 $ 31.57 $ 31.62 $ 36.58 11

COMPANY-OWNED HOTEL REVENUES AND EXPENSES FOR THE 46 HOTELS UNDER CONTRACT FOR DISPOSITION (In thousands) (Unaudited) Total Expected Dispositions (46) Q3 2017 Q4 2017 Q1 2018 Q2 2018 Room revenues $ 15,846 $ 13,876 $ 13,597 $ 15,907 Other hotel revenues 312 293 298 346 Total hotel revenues 16,157 14,169 13,896 16,253 Hotel operating expenses 9,292 8,477 8,665 9,391 Hotel operating expenses includes loss (gain) on disposal of assets of: 96 58 (6) 23 12

NON-GAAP RECONCILIATION OF NET INCOME TO HOTEL OPERATING PROFIT AND HOTEL OPERATING MARGIN FOR THE THREE AND SIX MONTHS ENDED JUNE 30, 2018 AND 2017 (In thousands) (Unaudited) Three Months Ended Six Months Ended June 30, June 30, 2018 2017 Variance 2018 2017 Variance $ 65,570 $ 49,725 31.9% Net income $ 96,665 $ 65,788 46.9% 14,407 15,943 (9.6)% Income tax expense 20,204 20,426 (1.1)% 32,425 31,701 2.3% Interest expense, net 64,065 65,307 (1.9)% 102 1,073 (90.5)% Other non-operating expense (income) 299 (148) 302.0% (457) (2,055) (77.8)% Other income (462) (2,056) (77.5)% - 1,897 n/a (Gain) loss on sale of hotel properties (38,082) 1,897 2,107.5% - 7,934 n/a Impairment of long-lived assets 43,600 20,357 114.2% 53,499 57,804 (7.4)% Depreciation and amortization 107,514 115,475 (6.9)% 24,264 25,430 (4.6)% General and administrative expenses 49,485 51,737 (4.4)% (824) 2,548 132.3% (Gain) loss on disposal of assets (1) 668 6,018 (88.9)% (1,424) - n/a Franchise and management fees (2,047) - n/a $ 187,562 $ 192,000 (2.3)% Hotel Operating Profit $ 341,909 $ 344,801 (0.8)% $ 326,948 $ 332,608 (1.7)% Room revenues $ 617,158 $ 618,416 (0.2)% 5,492 5,755 (4.6)% Other hotel revenues 10,767 10,938 (1.6)% $ 332,440 $ 338,363 (1.8)% Total room and other hotel revenues $ 627,925 $ 629,354 (0.2)% 56.4% 56.7% (30) bps Hotel Operating Margin 54.5% 54.8% (30) bps (1) Included in hotel operating expenses in the unaudited condensed consolidated statements of operations. 13

NON-GAAP RECONCILIATION OF NET INCOME TO EBITDA AND ADJUSTED EBITDA FOR THE THREE AND SIX MONTHS ENDED JUNE 30, 2018 AND 2017 (In thousands) (Unaudited) Three Months Ended Six Months Ended June 30, June 30, 2018 2017 2018 2017 $ 65,570 $ 49,725 Net income $ 96,665 $ 65,788 32,425 31,701 Interest expense, net 64,065 65,307 14,407 15,943 Income tax expense 20,204 20,426 53,499 57,804 Depreciation and amortization 107,514 115,475 165,901 155,173 EBITDA 288,448 266,996 1,785 3,646 Equity-based compensation 4,188 6,329 102 (1) 1,073 (2) Other non-operating expense (income) 299 (3) (148) (4) - 7,934 Impairment of long-lived assets 43,600 20,357 - 1,897 (Gain) loss on sale of hotel properties (38,082) 1,897 (451) (5) 3,125 (6) Other (income) expense 1,048 (7) 7,019 (8) $ 167,337 $ 172,848 Adjusted EBITDA $ 299,501 $ 302,450 (1) Includes foreign currency transaction loss of approximately $0.1 million. (2) Includes loss related to interest rate swap of approximately $1.5 million and foreign currency transaction gain of approximately $0.4 million. (3) Includes foreign currency transaction loss of approximately $0.3 million. (4) Includes foreign currency transaction gain of approximately $0.4 million and loss related to interest rate swap of approximately $0.3 million. (5) Includes gain on disposal of assets of approximately $0.8 million and acquisition costs of approximately $0.3 million incurred in connection with the purchase of one hotel. (6) Includes loss on disposal of assets of approximately $2.5 million and costs incurred in connection with secondary offerings of approximately $0.6 million. (7) Includes loss on disposal of assets of approximately $0.7 million and acquisition costs of approximately $0.3 million incurred in connection with the purchase of one hotel. (8) Includes loss on disposal of assets of approximately $6.0 million and costs incurred in connection with secondary offerings of approximately $1.0 million. 14

NON-GAAP RECONCILIATION OF NET INCOME ATTRIBUTABLE TO EXTENDED STAY AMERICA, INC. COMMON SHAREHOLDERS TO FUNDS FROM OPERATIONS, ADJUSTED FUNDS FROM OPERATIONS AND ADJUSTED FUNDS FROM OPERATIONS PER DILUTED PAIRED SHARE FOR THE THREE AND SIX MONTHS ENDED JUNE 30, 2018 AND 2017 (In thousands, except per share and per Paired Share data) (Unaudited) Three Months Ended Six Months Ended June 30, June 30, 2018 2017 2018 2017 Net income per Extended Stay America, Inc. common share - $ 0.34 $ 0.27 $ 0.42 $ 0.39 diluted Net income attributable to Extended Stay America, Inc. common $ 65,056 $ 51,775 $ 79,908 $ 74,876 shareholders Noncontrolling interests attributable to Class B 510 (2,054) 16,749 (9,096) common shares of ESH REIT 52,233 56,649 Real estate depreciation and amortization 104,981 113,182 - 7,934 Impairment of long-lived assets 43,600 20,357 - 1,897 (Gain) loss on sale of hotel properties (38,082) 1,897 Tax effect of adjustments to net income attributable to Extended (8,880) (15,423) (18,605) (31,697) Stay America, Inc. common shareholders 108,919 100,778 Funds from Operations 188,551 169,519 1,184 - Debt modification and extinguishment costs 1,621 1,168 - 1,495 Loss on interest rate swap - 253 (201) (347) Tax effect of adjustments to Funds from Operations (274) (330) $ 109,902 $ 101,926 Adjusted Funds from Operations $ 189,898 $ 170,610 Adjusted Funds from Operations $ 0.58 $ 0.53 per Paired Share – diluted $ 1.00 $ 0.88 Weighted average Paired Shares 190,183 193,944 outstanding – diluted 190,709 194,372 15

NON-GAAP RECONCILIATION OF NET INCOME ATTRIBUTABLE TO EXTENDED STAY AMERICA, INC. COMMON SHAREHOLDERS TO PAIRED SHARE INCOME, ADJUSTED PAIRED SHARE INCOME AND ADJUSTED PAIRED SHARE INCOME PER DILUTED PAIRED SHARE FOR THE THREE AND SIX MONTHS ENDED JUNE 30, 2018 AND 2017 (In thousands, except per share and per Paired Share data) (Unaudited) Three Months Ended Six Months Ended June 30, June 30, 2018 2017 2018 2017 Net income per Extended Stay America, Inc. common share - $ 0.34 $ 0.27 $ 0.42 $ 0.39 diluted Net income attributable to Extended Stay America, Inc. common $ 65,056 $ 51,775 shareholders $ 79,908 $ 74,876 Noncontrolling interests attributable to Class B 510 (2,054) common shares of ESH REIT 16,749 (9,096) 65,566 49,721 Paired Share Income 96,657 65,780 1,184 - Debt modification and extinguishment costs 1,621 1,168 102 (1) 1,073 (2) Other non-operating expense (income) 299 (3) (148) (4) - 7,934 Impairment of long-lived assets 43,600 20,357 - 1,897 (Gain) loss on sale of hotel properties (38,082) 1,897 (451) (5) 3,125 (6) Other (income) expense 1,048 (7) 7,019 (8) (142) (3,255) Tax effect of adjustments to Paired Share Income (1,419) (7,093) $ 66,259 $ 60,495 Adjusted Paired Share Income $ 103,724 $ 88,980 $ 0.35 $ 0.31 Adjusted Paired Share Income per Paired Share – diluted $ 0.54 $ 0.46 190,183 193,944 Weighted average Paired Shares outstanding – diluted 190,709 194,372 (1) Includes foreign currency transaction loss of approximately $0.1 million. (2) Includes loss related to interest rate swap of approximately $1.5 million and foreign currency transaction gain of approximately $0.4 million. (3) Includes foreign currency transaction loss of approximately $0.3 million. (4) Includes foreign currency transaction gain of approximately $0.4 million and loss related to interest rate swap of approximately $0.3 million. (5) Includes gain on disposal of assets of approximately $0.8 million and acquisition costs of approximately $0.3 million incurred in connection with the purchase of one hotel. (6) Includes loss on disposal of assets of approximately $2.5 million and costs incurred in connection with secondary offerings of approximately $0.6 million. (7) Includes loss on disposal of assets of approximately $0.7 million and acquisition costs of approximately $0.3 million incurred in connection with the purchase of one hotel. (8) Includes loss on disposal of assets of approximately $6.0 million and costs incurred in connection with secondary offerings of approximately $1.0 million. 16

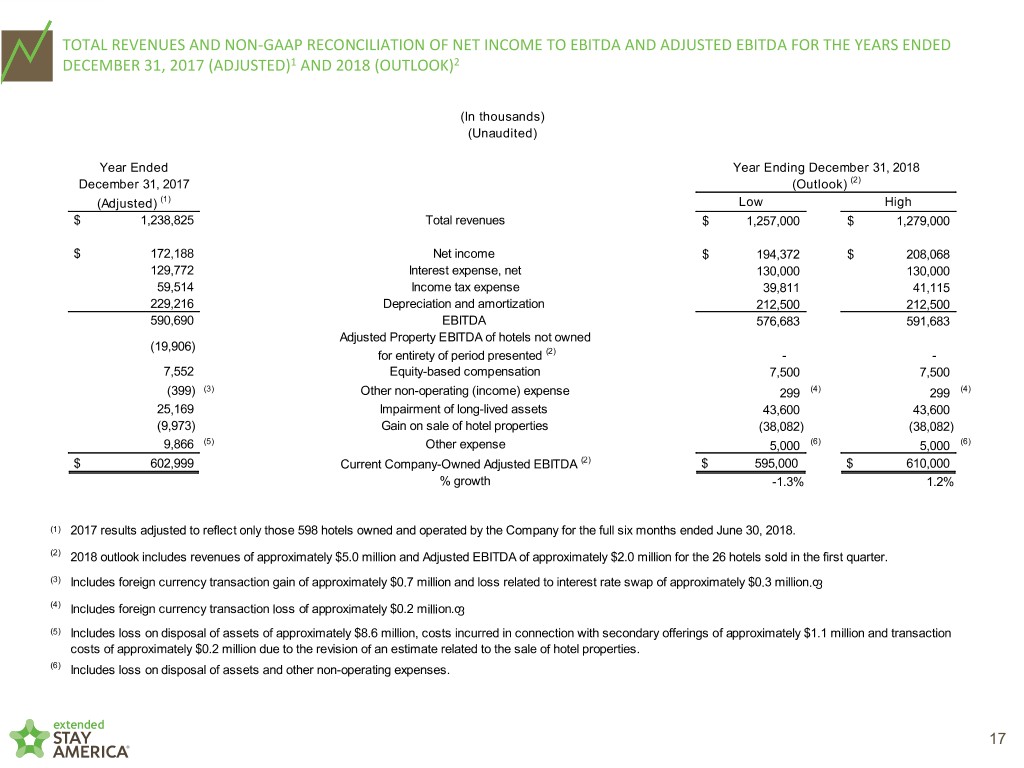
TOTAL REVENUES AND NON-GAAP RECONCILIATION OF NET INCOME TO EBITDA AND ADJUSTED EBITDA FOR THE YEARS ENDED DECEMBER 31, 2017 (ADJUSTED)1 AND 2018 (OUTLOOK)2 (In thousands) (Unaudited) Year Ended Year Ending December 31, 2018 December 31, 2017 (Outlook) (2) (Adjusted) (1) Low High $ 1,238,825 Total revenues $ 1,257,000 $ 1,279,000 $ 172,188 Net income $ 194,372 $ 208,068 129,772 Interest expense, net 130,000 130,000 59,514 Income tax expense 39,811 41,115 229,216 Depreciation and amortization 212,500 212,500 590,690 EBITDA 576,683 591,683 Adjusted Property EBITDA of hotels not owned (19,906) for entirety of period presented (2) - - 7,552 Equity-based compensation 7,500 7,500 (399) (3) Other non-operating (income) expense 299 (4) 299 (4) 25,169 Impairment of long-lived assets 43,600 43,600 (9,973) Gain on sale of hotel properties (38,082) (38,082) 9,866 (5) Other expense 5,000 (6) 5,000 (6) $ 602,999 Current Company-Owned Adjusted EBITDA (2) $ 595,000 $ 610,000 % growth -1.3% 1.2% (1) 2017 results adjusted to reflect only those 598 hotels owned and operated by the Company for the full six months ended June 30, 2018. (2) 2018 outlook includes revenues of approximately $5.0 million and Adjusted EBITDA of approximately $2.0 million for the 26 hotels sold in the first quarter. (3) Includes foreign currency transaction gain of approximately $0.7 million and loss related to interest rate swap of approximately $0.3 million. (4) Includes foreign currency transaction loss of approximately $0.2 million. (5) Includes loss on disposal of assets of approximately $8.6 million, costs incurred in connection with secondary offerings of approximately $1.1 million and transaction costs of approximately $0.2 million due to the revision of an estimate related to the sale of hotel properties. (6) Includes loss on disposal of assets and other non-operating expenses. 17

NON-GAAP RECONCILIATION OF NET INCOME TO PAIRED SHARE INCOME, ADJUSTED PAIRED SHARE INCOME AND ADJUSTED PAIRED SHARE INCOME PER DILUTED PAIRED SHARE FOR THE YEARS ENDED DECEMBER 31, 2017 (ACTUAL) AND 2018 (OUTLOOK) (In thousands, except per share and per Paired Share data) (Unaudited) Year Ended Year Ending December 31, 2018 December 31, 2017 (Outlook) (Actual) Low High Net income per Extended Stay America, Inc. common share - $ 0.41 $ 0.45 $ 0.48 diluted Net income attributable to Extended Stay America, Inc. common $ 78,847 shareholders $ 86,268 $ 91,740 Noncontrolling interests attributable to Class B common shares 93,325 of ESH REIT 108,088 116,312 172,172 Paired Share Income 194,356 208,052 2,351 Debt modification and extinguishment costs 1,621 1,621 (399) (1) Other non-operating (income) expense 299 (2) 299 (2) 25,169 Impairment of long-lived assets 43,600 43,600 (9,973) Gain on sale of hotel properties (38,082) (38,082) 9,866 (3) Other expense 5,000 (4) 5,000 (4) (6,241) Tax effect of adjustments to Paired Share Income (2,114) (1,990) $ 192,945 Adjusted Paired Share Income $ 204,680 $ 218,500 $ 1.00 Adjusted Paired Share Income per Paired Share – diluted $ 1.07 $ 1.15 % growth 7.7% 15.0% 193,670 Weighted average Paired Shares outstanding – diluted 190,709 190,709 (1) Includes foreign currency transaction gain of approximately $0.7 million and loss related to interest rate swap of approximately $0.3 million. (2) Includes foreign currency transaction loss of approximately $0.3 million. (3) Includes loss on disposal of assets of approximately $8.6 million, costs incurred in connection with secondary offerings of approximately $1.1 million and transaction costs of approximately $0.2 million due to the revision of an estimate related to the sale of three hotel properties. (4) Includes loss on disposal of assets and other non-operating expenses. 18
