Attached files
| file | filename |
|---|---|
| EX-99.1 - EXHIBIT 99.1 - FIRST FINANCIAL BANCORP /OH/ | a8k2q18earningsreleaseex991.htm |
| 8-K - 8-K - FIRST FINANCIAL BANCORP /OH/ | a8kearningsrelease2q18.htm |

Exhibit 99.2 Earnings Presentation Second Quarter 2018

Forward Looking Statement Disclosure Certain statements contained in this report which are not statements of historical fact constitute forward-looking statements within the meaning of the Private Securities Litigation Reform Act of 1995. Words such as ‘‘believes,’’ ‘‘anticipates,’’ “likely,” “expected,” “estimated,” ‘‘intends’’ and other similar expressions are intended to identify forward-looking statements but are not the exclusive means of identifying such statements. Examples of forward-looking statements include, but are not limited to, statements we make about (i) our future operating or financial performance, including revenues, income or loss and earnings or loss per share, (ii) future common stock dividends, (iii) our capital structure, including future capital levels, (iv) our plans, objectives and strategies, and (v) the assumptions that underlie our forward-looking statements. As with any forecast or projection, forward-looking statements are subject to inherent uncertainties, risks and changes in circumstances that may cause actual results to differ materially from those set forth in the forward-looking statements. Forward-looking statements are not historical facts but instead express only management’s beliefs regarding future results or events, many of which, by their nature, are inherently uncertain and outside of management’s control. It is possible that actual results and outcomes may differ, possibly materially, from the anticipated results or outcomes indicated in these forward-looking statements. Important factors that could cause actual results to differ materially from those in our forward-looking statements include the following, without limitation: (i) economic, market, liquidity, credit, interest rate, operational and technological risks associated with the Company’s business; (ii) the effect of and changes in policies and laws or regulatory agencies, including the Dodd-Frank Wall Street Reform and Consumer Protection Act and other legislation and regulation relating to the banking industry; (iii) management’s ability to effectively execute its business plans; (iv) mergers and acquisitions, including costs or difficulties related to the integration of acquired companies; (v) the possibility that any of the anticipated benefits of the Company’s recent merger with MainSource Financial Group, Inc. will not be realized or will not be realized within the expected time period; (vi) the effect of changes in accounting policies and practices; (vii) changes in consumer spending, borrowing and saving and changes in unemployment; (viii) changes in customers’ performance and creditworthiness; and (ix) the costs and effects of litigation and of unexpected or adverse outcomes in such litigation. Additional factors that may cause our actual results to differ materially from those described in our forward- looking statements can be found in the Form 10-K for the year ended December 31, 2017, as well as its other filings with the SEC, which are available on the SEC website at www.sec.gov. All forward-looking statements included in this filing are made as of the date hereof and are based on information available at the time of the filing. Except as required by law, the Company does not assume any obligation to update any forward-looking statement. . 2
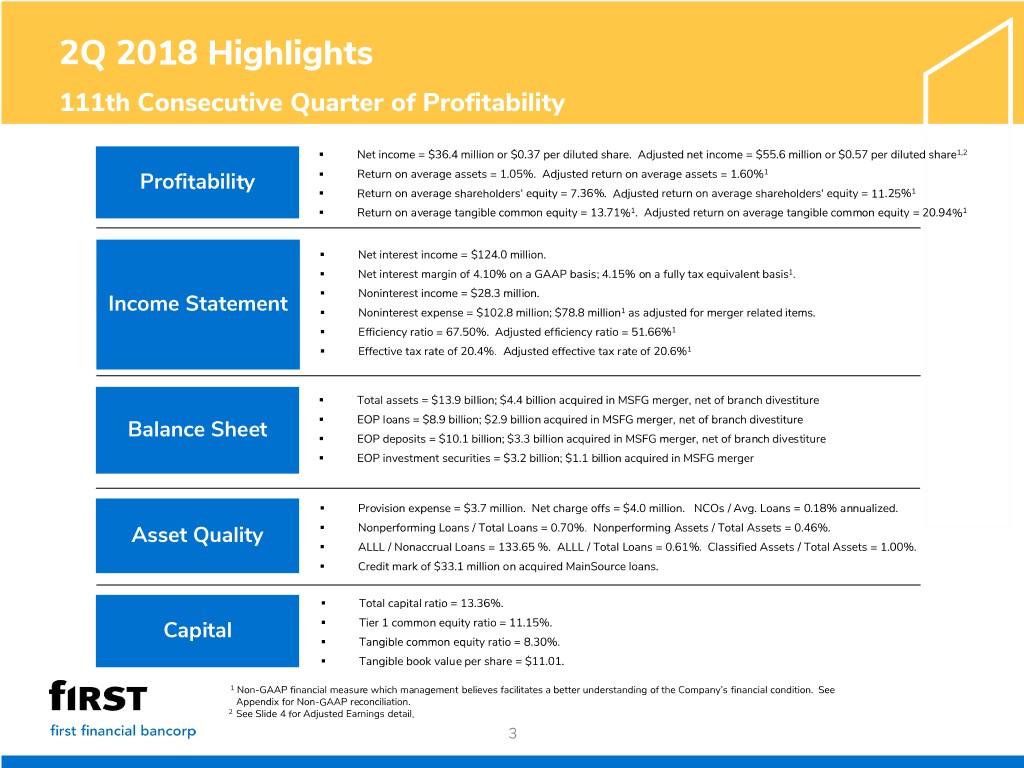
2Q 2018 Highlights 111th Consecutive Quarter of Profitability . Net income = $36.4 million or $0.37 per diluted share. Adjusted net income = $55.6 million or $0.57 per diluted share1,2 1 Profitability . Return on average assets = 1.05%. Adjusted return on average assets = 1.60% . Return on average shareholders’ equity = 7.36%. Adjusted return on average shareholders’ equity = 11.25%1 . Return on average tangible common equity = 13.71%1. Adjusted return on average tangible common equity = 20.94%1 . Net interest income = $124.0 million. . Net interest margin of 4.10% on a GAAP basis; 4.15% on a fully tax equivalent basis1. . Noninterest income = $28.3 million. Income Statement . Noninterest expense = $102.8 million; $78.8 million1 as adjusted for merger related items. . Efficiency ratio = 67.50%. Adjusted efficiency ratio = 51.66%1 . Effective tax rate of 20.4%. Adjusted effective tax rate of 20.6%1 . Total assets = $13.9 billion; $4.4 billion acquired in MSFG merger, net of branch divestiture . EOP loans = $8.9 billion; $2.9 billion acquired in MSFG merger, net of branch divestiture Balance Sheet . EOP deposits = $10.1 billion; $3.3 billion acquired in MSFG merger, net of branch divestiture . EOP investment securities = $3.2 billion; $1.1 billion acquired in MSFG merger . Provision expense = $3.7 million. Net charge offs = $4.0 million. NCOs / Avg. Loans = 0.18% annualized. Asset Quality . Nonperforming Loans / Total Loans = 0.70%. Nonperforming Assets / Total Assets = 0.46%. . ALLL / Nonaccrual Loans = 133.65 %. ALLL / Total Loans = 0.61%. Classified Assets / Total Assets = 1.00%. . Credit mark of $33.1 million on acquired MainSource loans. . Total capital ratio = 13.36%. Capital . Tier 1 common equity ratio = 11.15%. . Tangible common equity ratio = 8.30%. . Tangible book value per share = $11.01. 1 Non-GAAP financial measure which management believes facilitates a better understanding of the Company’s financial condition. See Appendix for Non-GAAP reconciliation. 2 See Slide 4 for Adjusted Earnings detail. 3
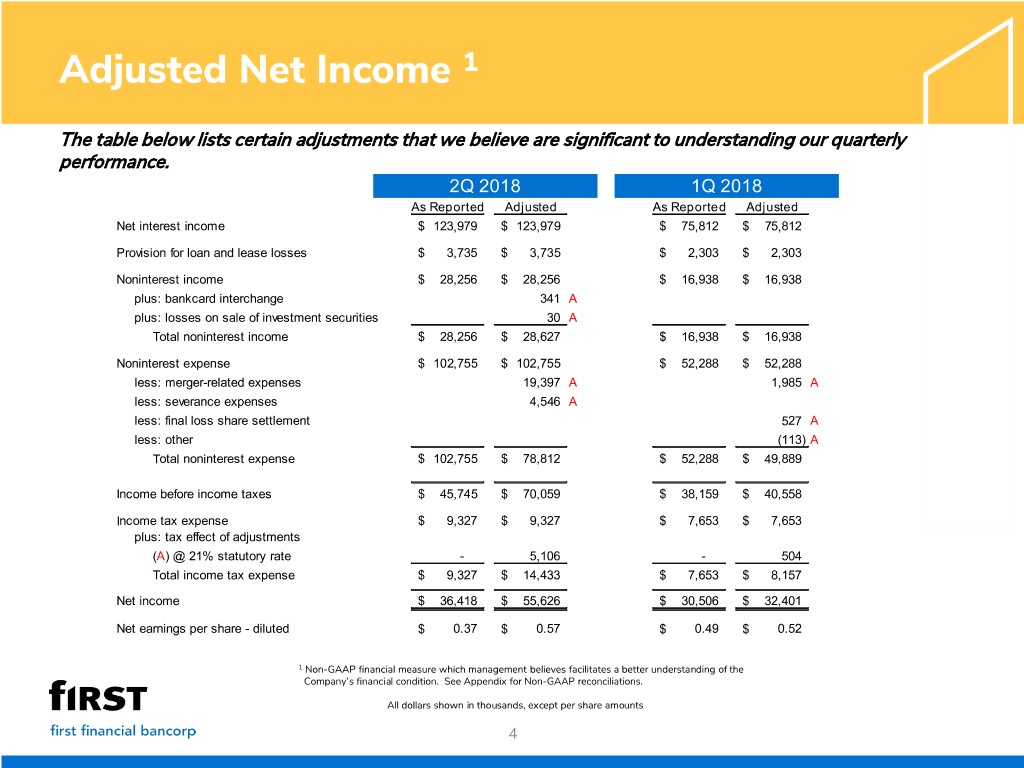
Adjusted Net Income 1 The table below lists certain adjustments that we believe are significant to understanding our quarterly performance. 2Q 2018 1Q 2018 As Reported Adjusted As Reported Adjusted Net interest income $ 123,979 $ 123,979 $ 75,812 $ 75,812 Provision for loan and lease losses $ 3,735 $ 3,735 $ 2,303 $ 2,303 Noninterest income $ 28,256 $ 28,256 $ 16,938 $ 16,938 plus: bankcard interchange 341 A plus: losses on sale of investment securities 30 A Total noninterest income $ 28,256 $ 28,627 $ 16,938 $ 16,938 Noninterest expense $ 102,755 $ 102,755 $ 52,288 $ 52,288 less: merger-related expenses 19,397 A 1,985 A less: severance expenses 4,546 A less: final loss share settlement 527 A less: other (113) A Total noninterest expense $ 102,755 $ 78,812 $ 52,288 $ 49,889 Income before income taxes $ 45,745 $ 70,059 $ 38,159 $ 40,558 Income tax expense $ 9,327 $ 9,327 $ 7,653 $ 7,653 plus: tax effect of adjustments (A) @ 21% statutory rate - 5,106 - 504 Total income tax expense $ 9,327 $ 14,433 $ 7,653 $ 8,157 Net income $ 36,418 $ 55,626 $ 30,506 $ 32,401 Net earnings per share - diluted $ 0.37 $ 0.57 $ 0.49 $ 0.52 1 Non-GAAP financial measure which management believes facilitates a better understanding of the Company’s financial condition. See Appendix for Non-GAAP reconciliations. All dollars shown in thousands, except per share amounts 4
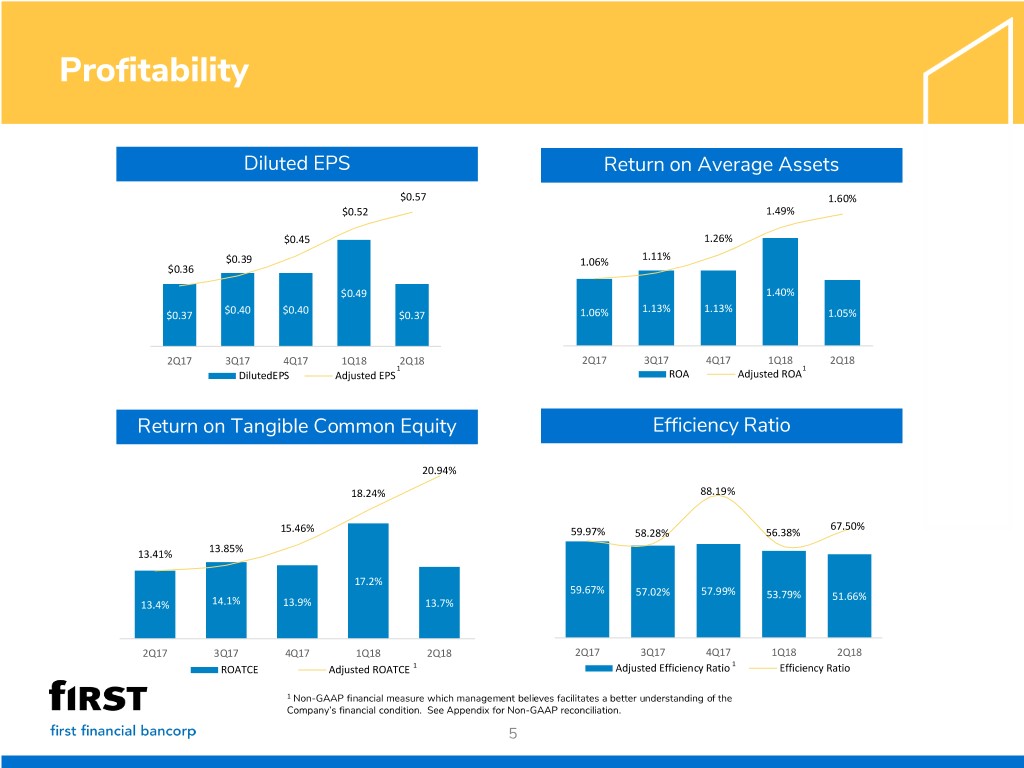
Profitability Diluted EPS Return on Average Assets $0.57 1.60% $0.52 1.49% $0.45 1.26% 1.11% $0.39 1.06% $0.36 $0.49 1.40% 1.13% 1.13% $0.37 $0.40 $0.40 $0.37 1.06% 1.05% 2Q17 3Q17 4Q17 1Q18 2Q18 2Q17 3Q17 4Q17 1Q18 2Q18 1 1 DilutedEPS Adjusted EPS ROA Adjusted ROA Return on Tangible Common Equity Efficiency Ratio 20.94% 18.24% 88.19% 67.50% 15.46% 59.97% 58.28% 56.38% 13.41% 13.85% 17.2% 59.67% 57.02% 57.99% 53.79% 51.66% 13.4% 14.1% 13.9% 13.7% 2Q17 3Q17 4Q17 1Q18 2Q18 2Q17 3Q17 4Q17 1Q18 2Q18 1 ROATCE Adjusted ROATCE 1 Adjusted Efficiency Ratio 1 Efficiency Ratio 1 Non-GAAP financial measure which management believes facilitates a better understanding of the Company’s financial condition. See Appendix for Non-GAAP reconciliation. 5
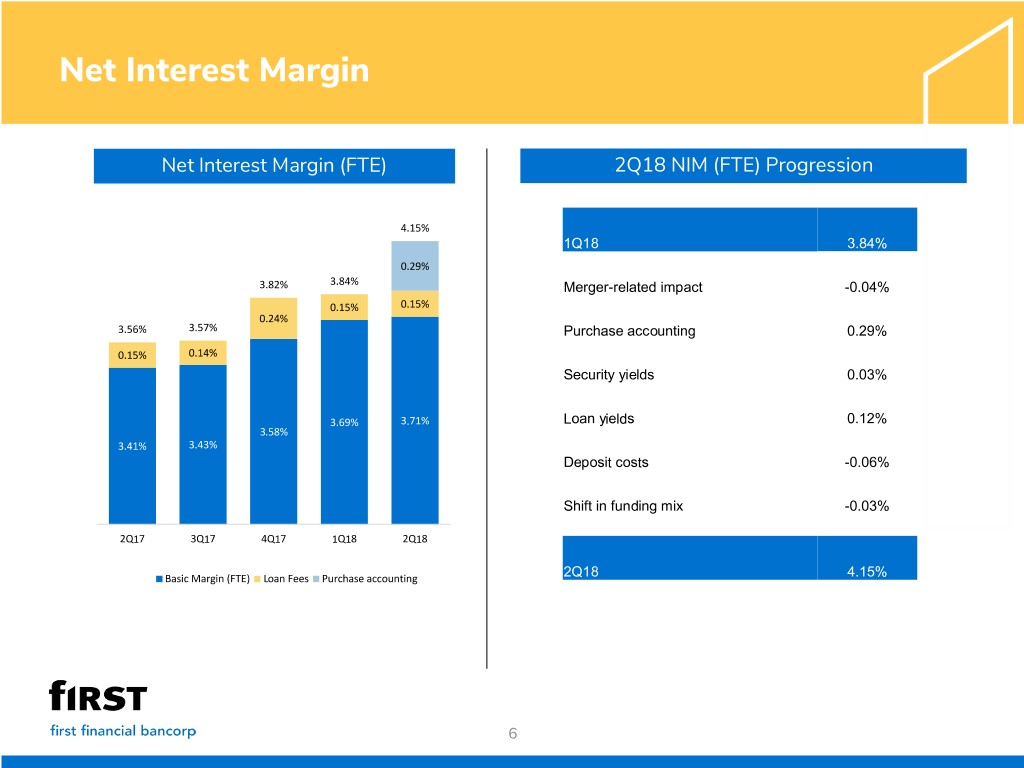
Net Interest Margin Net Interest Margin (FTE) 2Q18 NIM (FTE) Progression 4.15% 1Q18 3.84% 0.29% 3.82% 3.84% Merger-related impact -0.04% 0.15% 0.15% 0.24% 3.56% 3.57% Purchase accounting 0.29% 0.15% 0.14% Security yields 0.03% 3.69% 3.71% Loan yields 0.12% 3.58% 3.41% 3.43% Deposit costs -0.06% Shift in funding mix -0.03% 2Q17 3Q17 4Q17 1Q18 2Q18 Basic Margin (FTE) Loan Fees Purchase accounting 2Q18 4.15% 6
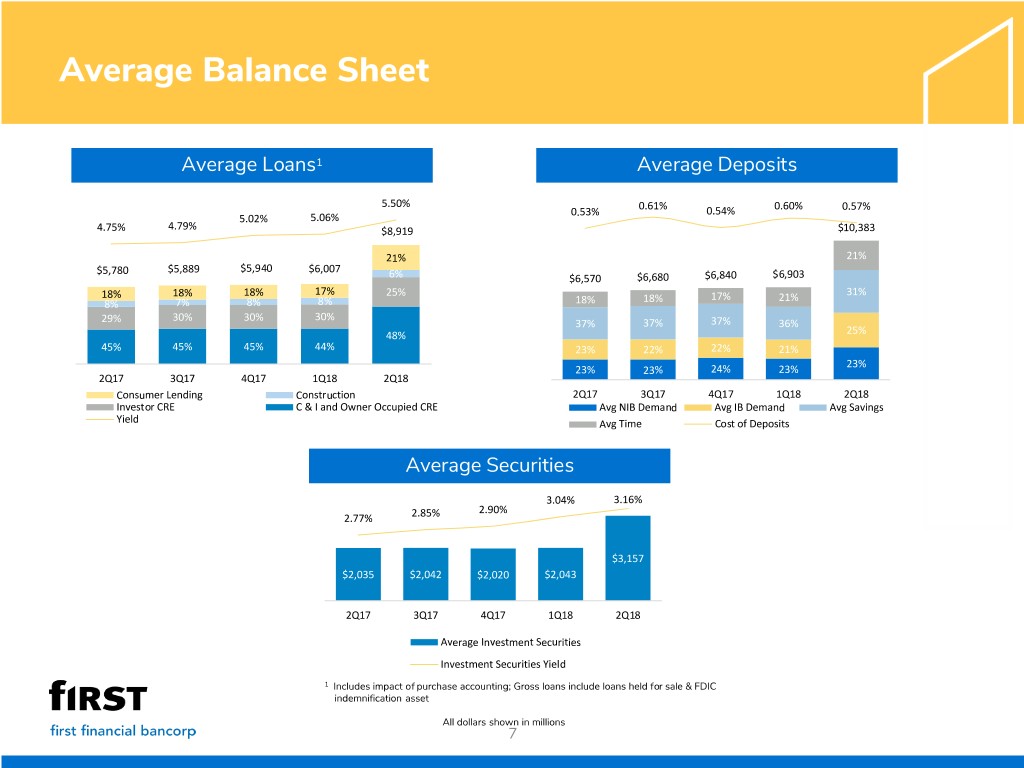
Average Balance Sheet Average Loans1 Average Deposits 5.50% 0.61% 0.60% 0.53% 0.54% 0.57% 5.02% 5.06% 4.75% 4.79% $8,919 $10,383 21% 21% $5,780 $5,889 $5,940 $6,007 6% $6,570 $6,680 $6,840 $6,903 18% 17% 25% 31% 18% 18% 18% 17% 21% 8% 7% 8% 8% 18% 30% 30% 30% 29% 37% 37% 37% 36% 48% 25% 45% 45% 45% 44% 23% 22% 22% 21% 23% 23% 23% 24% 23% 2Q17 3Q17 4Q17 1Q18 2Q18 Consumer Lending Construction 2Q17 3Q17 4Q17 1Q18 2Q18 Investor CRE C & I and Owner Occupied CRE Avg NIB Demand Avg IB Demand Avg Savings Yield Avg Time Cost of Deposits Average Securities 3.04% 3.16% 2.90% 2.77% 2.85% $3,157 $2,035 $2,042 $2,020 $2,043 2Q17 3Q17 4Q17 1Q18 2Q18 Average Investment Securities Investment Securities Yield 1 Includes impact of purchase accounting; Gross loans include loans held for sale & FDIC indemnification asset All dollars shown in millions 7

Loan and Deposit Progressions 2Q18 EOP Loan Progression 2Q18 Average Deposit Progression First Financial as of March 31 $ 6,102,021 First Financial as of March 31 $ 6,903,312 MainSource as of March 31 3,012,330 MainSource as of March 31 3,462,051 Total as of March 31 9,114,351 Total as of March 31 10,365,363 Purchase valuation adjustments (89,619) Purchase valuation adjustments (1,801) Branch divestiture (119,887) Branch divestiture (86,335) Growth/(decline) (20,264) Growth/(decline) 105,408 Balance as of June 30 $ 8,884,581 Balance as of June 30 $ 10,382,635 All dollars shown in thousands 8
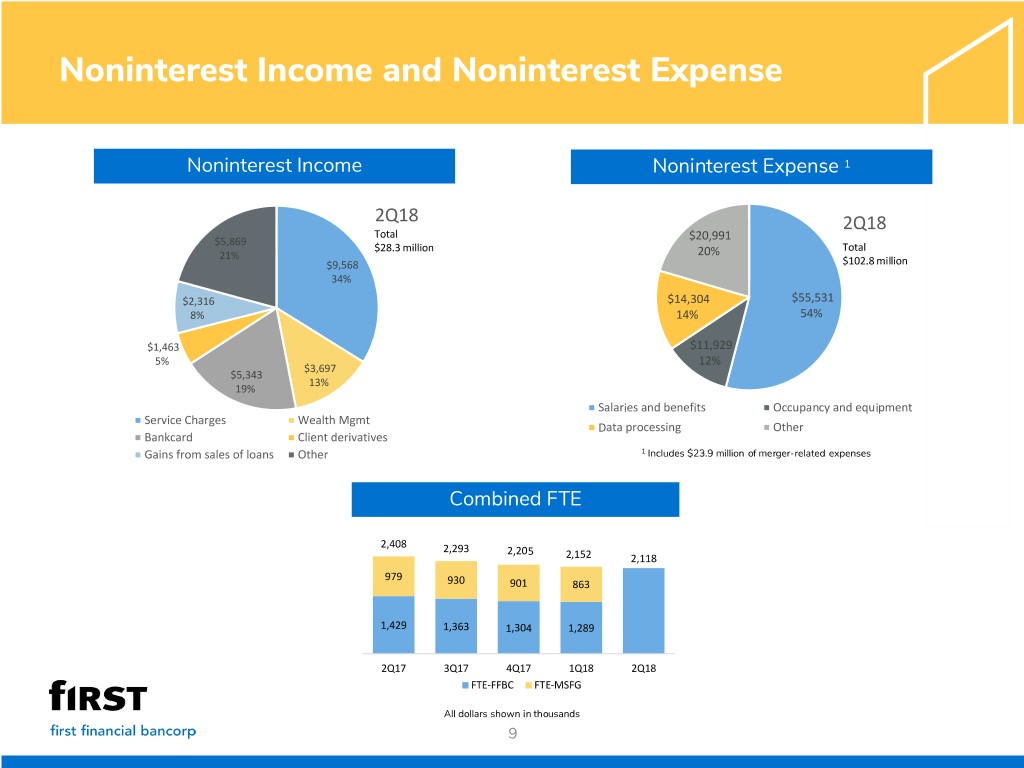
Noninterest Income and Noninterest Expense Noninterest Income Noninterest Expense 1 2Q18 2Q18 Total $5,869 $20,991 $28.3 million Total 21% 20% $9,568 $102.8 million 34% $2,316 $14,304 $55,531 8% 14% 54% $1,463 $11,929 5% 12% $3,697 $5,343 13% 19% Salaries and benefits Occupancy and equipment Service Charges Wealth Mgmt Data processing Other Bankcard Client derivatives Gains from sales of loans Other 1 Includes $23.9 million of merger-related expenses Combined FTE 2,408 2,293 2,205 2,152 2,118 979 930 901 863 1,429 1,363 1,304 1,289 2Q17 3Q17 4Q17 1Q18 2Q18 FTE-FFBC FTE-MSFG All dollars shown in thousands 9
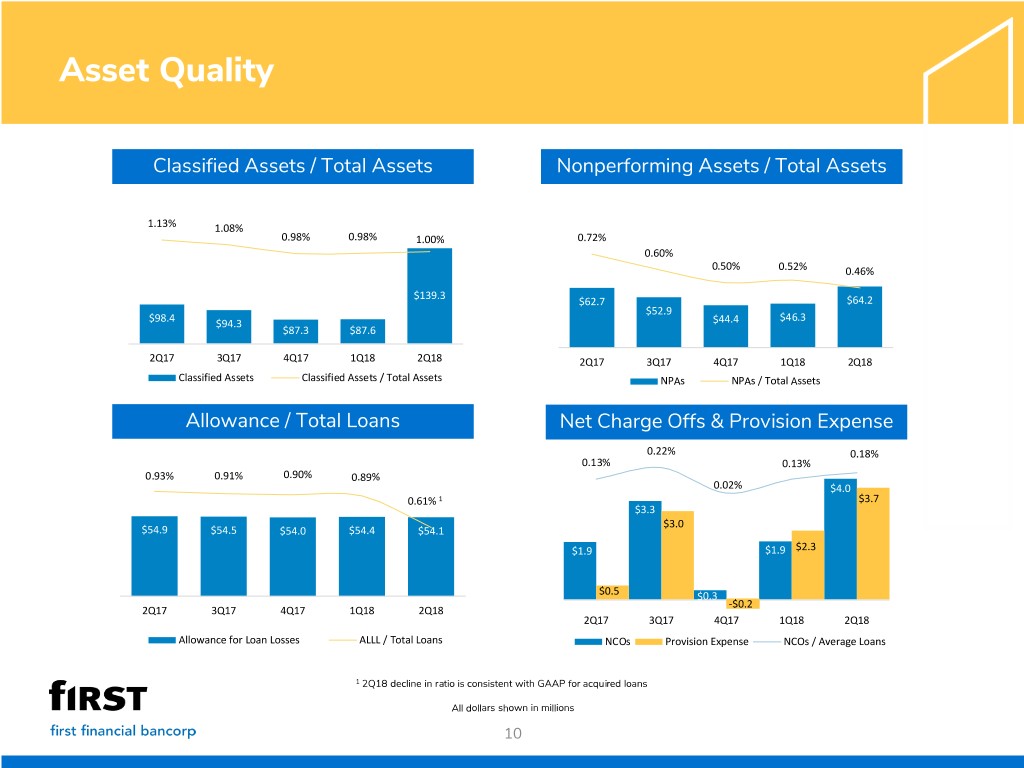
Asset Quality Classified Assets / Total Assets Nonperforming Assets / Total Assets 1.13% 1.08% 0.98% 0.98% 1.00% 0.72% 0.60% 0.50% 0.52% 0.46% $139.3 $62.7 $64.2 $52.9 $46.3 $98.4 $94.3 $44.4 $87.3 $87.6 2Q17 3Q17 4Q17 1Q18 2Q18 2Q17 3Q17 4Q17 1Q18 2Q18 Classified Assets Classified Assets / Total Assets NPAs NPAs / Total Assets Allowance / Total Loans Net Charge Offs & Provision Expense 0.22% 0.18% 0.13% 0.13% 0.93% 0.91% 0.90% 0.89% 0.02% $4.0 0.61% 1 $3.7 $3.3 $3.0 $54.9 $54.5 $54.0 $54.4 $54.1 $1.9 $1.9 $2.3 $0.5 $0.3 -$0.2 2Q17 3Q17 4Q17 1Q18 2Q18 2Q17 3Q17 4Q17 1Q18 2Q18 Allowance for Loan Losses ALLL / Total Loans NCOs Provision Expense NCOs / Average Loans 1 2Q18 decline in ratio is consistent with GAAP for acquired loans All dollars shown in millions 10
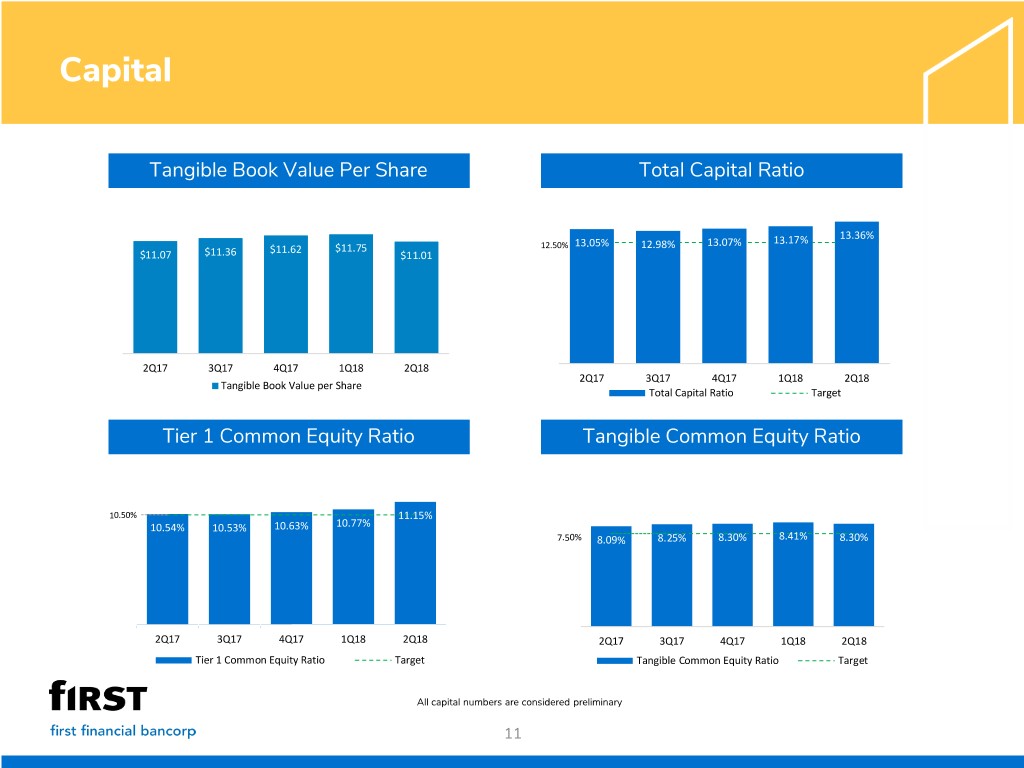
Capital Tangible Book Value Per Share Total Capital Ratio 13.36% 13.05% 13.07% 13.17% $11.62 $11.75 12.50% 12.98% $11.07 $11.36 $11.01 2Q17 3Q17 4Q17 1Q18 2Q18 2Q17 3Q17 4Q17 1Q18 2Q18 Tangible Book Value per Share Total Capital Ratio Target Tier 1 Common Equity Ratio Tangible Common Equity Ratio 10.50% 11.15% 10.54% 10.53% 10.63% 10.77% 7.50% 8.09% 8.25% 8.30% 8.41% 8.30% 2Q17 3Q17 4Q17 1Q18 2Q18 2Q17 3Q17 4Q17 1Q18 2Q18 Tier 1 Common Equity Ratio Target Tangible Common Equity Ratio Target All capital numbers are considered preliminary 11
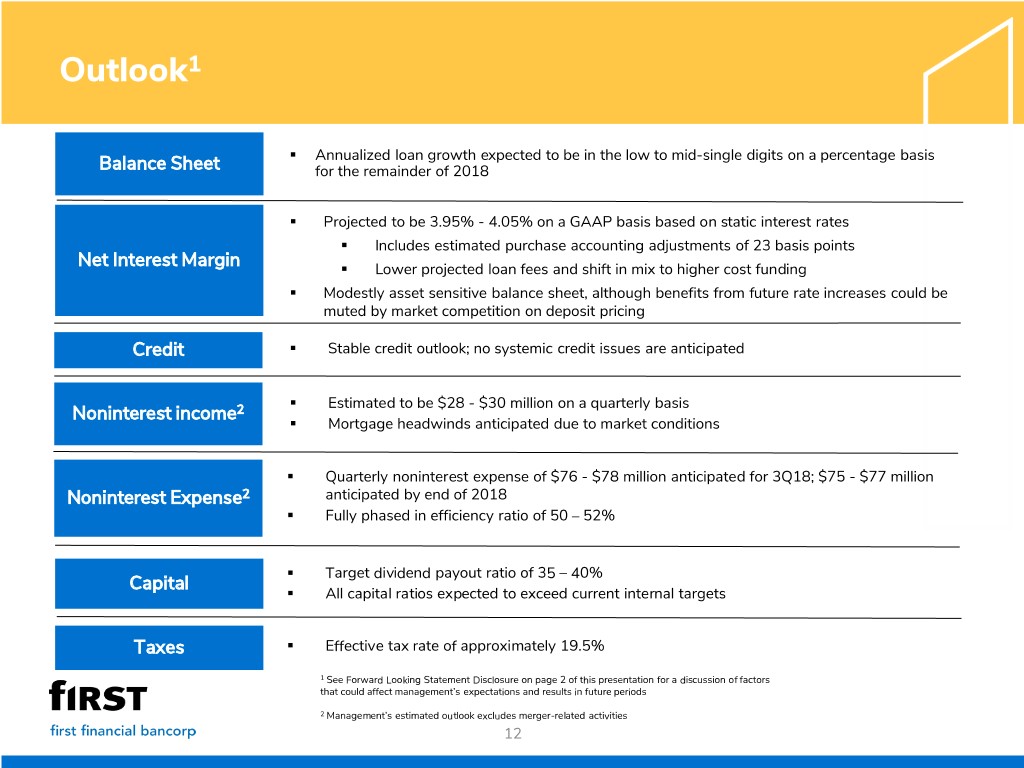
Outlook1 . Annualized loan growth expected to be in the low to mid-single digits on a percentage basis Balance Sheet for the remainder of 2018 . Projected to be 3.95% - 4.05% on a GAAP basis based on static interest rates . Includes estimated purchase accounting adjustments of 23 basis points Net Interest Margin . Lower projected loan fees and shift in mix to higher cost funding . Modestly asset sensitive balance sheet, although benefits from future rate increases could be muted by market competition on deposit pricing Credit . Stable credit outlook; no systemic credit issues are anticipated . Estimated to be $28 - $30 million on a quarterly basis Noninterest income2 . Mortgage headwinds anticipated due to market conditions . Quarterly noninterest expense of $76 - $78 million anticipated for 3Q18; $75 - $77 million Noninterest Expense2 anticipated by end of 2018 . Fully phased in efficiency ratio of 50 – 52% . Target dividend payout ratio of 35 – 40% Capital . All capital ratios expected to exceed current internal targets Taxes . Effective tax rate of approximately 19.5% 1 See Forward Looking Statement Disclosure on page 2 of this presentation for a discussion of factors that could affect management’s expectations and results in future periods 2 Management’s estimated outlook excludes merger-related activities 12
Appendix: Non-GAAP Measures The Company’s earnings release and accompanying presentation contain certain financial information determined by methods other than in accordance with accounting principles generally accepted in the United States (GAAP). Such non-GAAP financial information should be considered supplemental to, and not as a substitute for, or superior to, financial measures calculated in accordance with GAAP. However, we believe that non-GAAP reporting provides meaningful information and therefore we use it to supplement our GAAP information. We have chosen to provide this supplemental information to investors, analysts and other interested parties to enable them to perform additional analyses of operating results, to illustrate the results of operations giving effect to the non-GAAP adjustments and to provide an additional measure of performance. We believe this information is helpful in understanding the results of operations separate and apart from items that may, or could, have a disproportional positive or negative impact in any given period. For a reconciliation of the differences between the non-GAAP financial measures and the most comparable GAAP measures, please refer to the following reconciliation tables. to GAAP Reconciliation 13
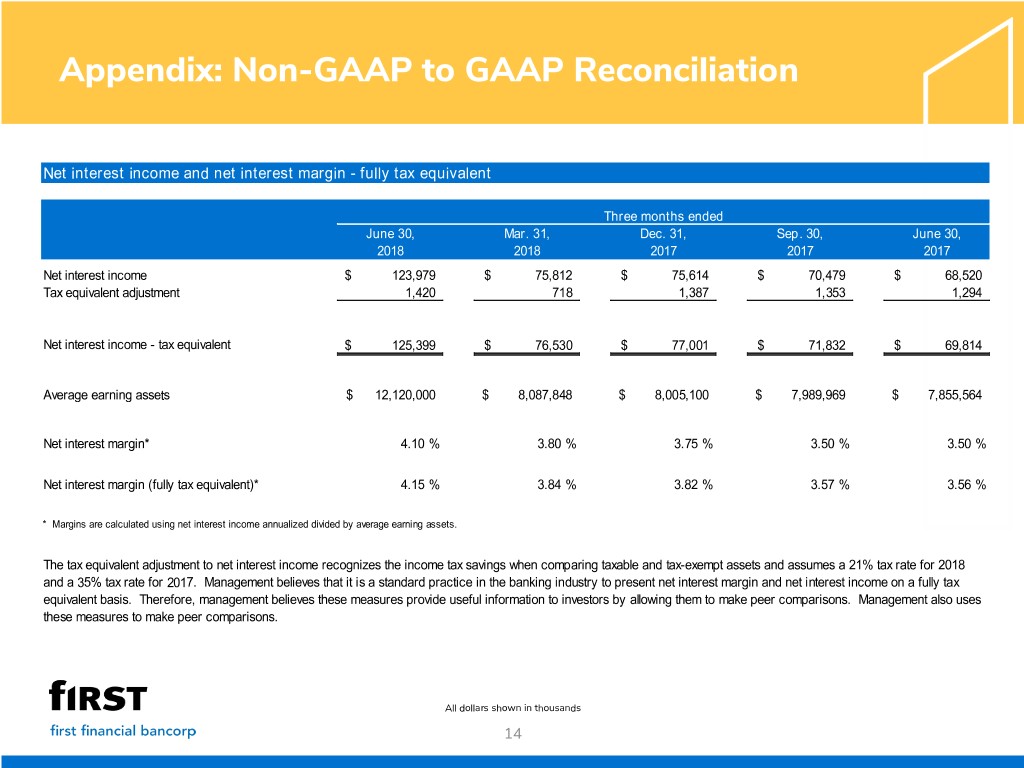
Appendix: Non-GAAP to GAAP Reconciliation Net interest income and net interest margin - fully tax equivalent Three months ended June 30, Mar. 31, Dec. 31, Sep. 30, June 30, 2018 2018 2017 2017 2017 Net interest income $ 123,979 $ 75,812 $ 75,614 $ 70,479 $ 68,520 Tax equivalent adjustment 1,420 718 1,387 1,353 1,294 Net interest income - tax equivalent $ 125,399 $ 76,530 $ 77,001 $ 71,832 $ 69,814 Average earning assets $ 12,120,000 $ 8,087,848 $ 8,005,100 $ 7,989,969 $ 7,855,564 Net interest margin* 4.10 % 3.80 % 3.75 % 3.50 % 3.50 % Net interest margin (fully tax equivalent)* 4.15 % 3.84 % 3.82 % 3.57 % 3.56 % * Margins are calculated using net interest income annualized divided by average earning assets. The tax equivalent adjustment to net interest income recognizes the income tax savings when comparing taxable and tax-exempt assets and assumes a 21% tax rate for 2018 and a 35% tax rate for 2017. Management believes that it is a standard practice in the banking industry to present net interest margin and net interest income on a fully tax equivalent basis. Therefore, management believes these measures provide useful information to investors by allowing them to make peer comparisons. Management also uses these measures to make peer comparisons. All dollars shown in thousands 14
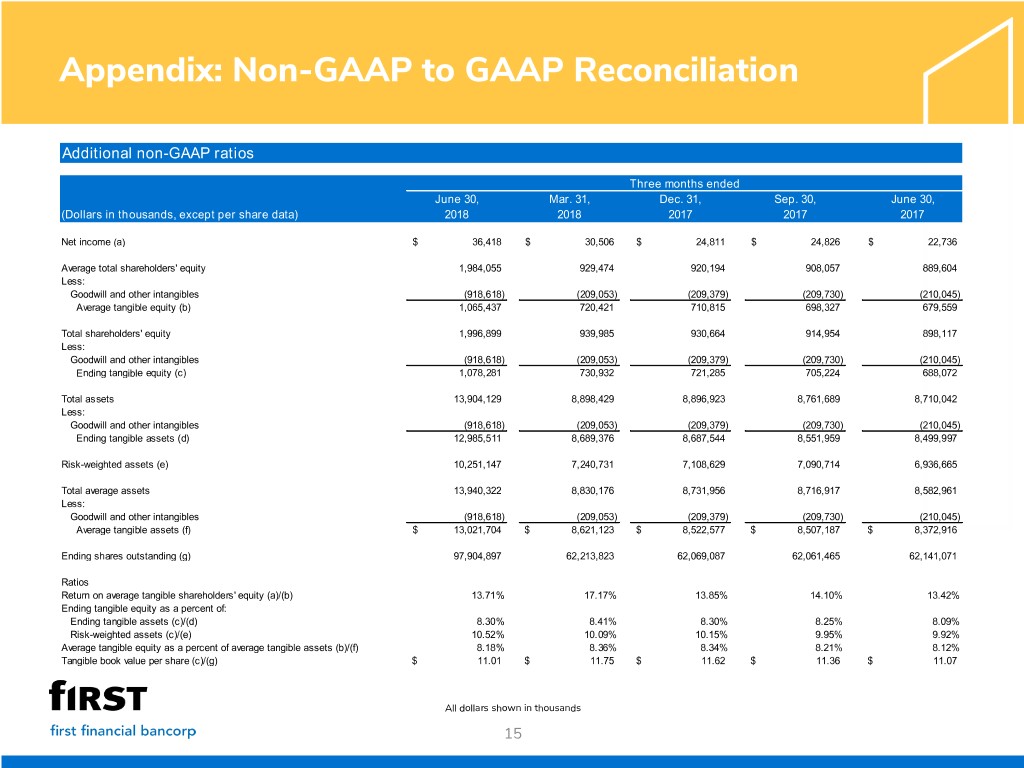
Appendix: Non-GAAP to GAAP Reconciliation Additional non-GAAP ratios Three months ended June 30, Mar. 31, Dec. 31, Sep. 30, June 30, (Dollars in thousands, except per share data) 2018 2018 2017 2017 2017 Net income (a) $ 36,418 $ 30,506 $ 24,811 $ 24,826 $ 22,736 Average total shareholders' equity 1,984,055 929,474 920,194 908,057 889,604 Less: Goodwill and other intangibles (918,618) (209,053) (209,379) (209,730) (210,045) Average tangible equity (b) 1,065,437 720,421 710,815 698,327 679,559 Total shareholders' equity 1,996,899 939,985 930,664 914,954 898,117 Less: Goodwill and other intangibles (918,618) (209,053) (209,379) (209,730) (210,045) Ending tangible equity (c) 1,078,281 730,932 721,285 705,224 688,072 Total assets 13,904,129 8,898,429 8,896,923 8,761,689 8,710,042 Less: Goodwill and other intangibles (918,618) (209,053) (209,379) (209,730) (210,045) Ending tangible assets (d) 12,985,511 8,689,376 8,687,544 8,551,959 8,499,997 Risk-weighted assets (e) 10,251,147 7,240,731 7,108,629 7,090,714 6,936,665 Total average assets 13,940,322 8,830,176 8,731,956 8,716,917 8,582,961 Less: Goodwill and other intangibles (918,618) (209,053) (209,379) (209,730) (210,045) Average tangible assets (f) $ 13,021,704 $ 8,621,123 $ 8,522,577 $ 8,507,187 $ 8,372,916 Ending shares outstanding (g) 97,904,897 62,213,823 62,069,087 62,061,465 62,141,071 Ratios Return on average tangible shareholders' equity (a)/(b) 13.71% 17.17% 13.85% 14.10% 13.42% Ending tangible equity as a percent of: Ending tangible assets (c)/(d) 8.30% 8.41% 8.30% 8.25% 8.09% Risk-weighted assets (c)/(e) 10.52% 10.09% 10.15% 9.95% 9.92% Average tangible equity as a percent of average tangible assets (b)/(f) 8.18% 8.36% 8.34% 8.21% 8.12% Tangible book value per share (c)/(g) $ 11.01 $ 11.75 $ 11.62 $ 11.36 $ 11.07 All dollars shown in thousands 15
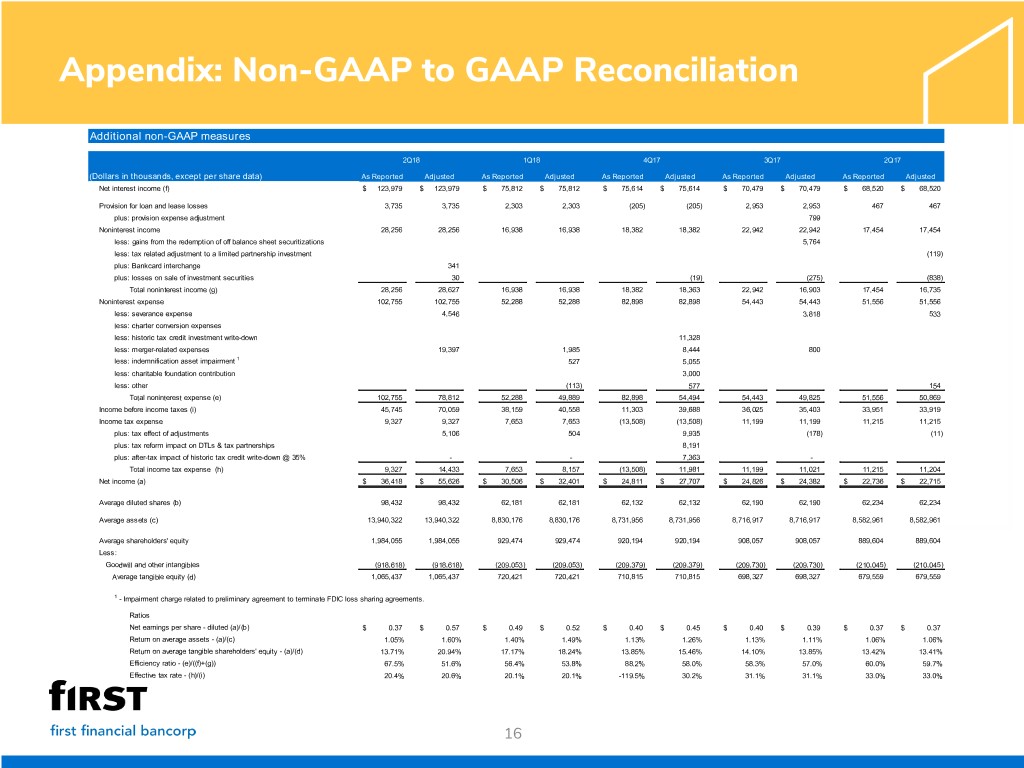
Appendix: Non-GAAP to GAAP Reconciliation Additional non-GAAP measures 2Q18 1Q18 4Q17 3Q17 2Q17 (Dollars in thousands, except per share data) As Reported Adjusted As Reported Adjusted As Reported Adjusted As Reported Adjusted As Reported Adjusted Net interest income (f) $ 123,979 $ 123,979 $ 75,812 $ 75,812 $ 75,614 $ 75,614 $ 70,479 $ 70,479 $ 68,520 $ 68,520 Provision for loan and lease losses 3,735 3,735 2,303 2,303 (205) (205) 2,953 2,953 467 467 plus: provision expense adjustment 799 Noninterest income 28,256 28,256 16,938 16,938 18,382 18,382 22,942 22,942 17,454 17,454 less: gains from the redemption of off balance sheet securitizations 5,764 less: tax related adjustment to a limited partnership investment (119) plus: Bankcard interchange 341 plus: losses on sale of investment securities 30 (19) (275) (838) Total noninterest income (g) 28,256 28,627 16,938 16,938 18,382 18,363 22,942 16,903 17,454 16,735 Noninterest expense 102,755 102,755 52,288 52,288 82,898 82,898 54,443 54,443 51,556 51,556 less: severance expense 4,546 3,818 533 less: charter conversion expenses less: historic tax credit investment write-down 11,328 less: merger-related expenses 19,397 1,985 8,444 800 less: indemnification asset impairment 1 527 5,055 less: charitable foundation contribution 3,000 less: other (113) 577 154 Total noninterest expense (e) 102,755 78,812 52,288 49,889 82,898 54,494 54,443 49,825 51,556 50,869 Income before income taxes (i) 45,745 70,059 38,159 40,558 11,303 39,688 36,025 35,403 33,951 33,919 Income tax expense 9,327 9,327 7,653 7,653 (13,508) (13,508) 11,199 11,199 11,215 11,215 plus: tax effect of adjustments 5,106 504 9,935 (178) (11) plus: tax reform impact on DTLs & tax partnerships 8,191 plus: after-tax impact of historic tax credit write-down @ 35% - - 7,363 - Total income tax expense (h) 9,327 14,433 7,653 8,157 (13,508) 11,981 11,199 11,021 11,215 11,204 Net income (a) $ 36,418 $ 55,626 $ 30,506 $ 32,401 $ 24,811 $ 27,707 $ 24,826 $ 24,382 $ 22,736 $ 22,715 Average diluted shares (b) 98,432 98,432 62,181 62,181 62,132 62,132 62,190 62,190 62,234 62,234 Average assets (c) 13,940,322 13,940,322 8,830,176 8,830,176 8,731,956 8,731,956 8,716,917 8,716,917 8,582,961 8,582,961 Average shareholders' equity 1,984,055 1,984,055 929,474 929,474 920,194 920,194 908,057 908,057 889,604 889,604 Less: Goodwill and other intangibles (918,618) (918,618) (209,053) (209,053) (209,379) (209,379) (209,730) (209,730) (210,045) (210,045) Average tangible equity (d) 1,065,437 1,065,437 720,421 720,421 710,815 710,815 698,327 698,327 679,559 679,559 1 - Impairment charge related to preliminary agreement to terminate FDIC loss sharing agreements. Ratios Net earnings per share - diluted (a)/(b) $ 0.37 $ 0.57 $ 0.49 $ 0.52 $ 0.40 $ 0.45 $ 0.40 $ 0.39 $ 0.37 $ 0.37 Return on average assets - (a)/(c) 1.05% 1.60% 1.40% 1.49% 1.13% 1.26% 1.13% 1.11% 1.06% 1.06% Return on average tangible shareholders' equity - (a)/(d) 13.71% 20.94% 17.17% 18.24% 13.85% 15.46% 14.10% 13.85% 13.42% 13.41% Efficiency ratio - (e)/((f)+(g)) 67.5% 51.6% 56.4% 53.8% 88.2% 58.0% 58.3% 57.0% 60.0% 59.7% Effective tax rate - (h)/(i) 20.4% 20.6% 20.1% 20.1% -119.5% 30.2% 31.1% 31.1% 33.0% 33.0% 16

Update -New colors 17
