Attached files
| file | filename |
|---|---|
| EX-99.1 - Entegra Financial Corp. | e18273_ex99-1.htm |
| 8-K - Entegra Financial Corp. | e18273_enfc-8k.htm |
ENTEGRA FINANCIAL CORP. Second Quarter 2018 Earnings Call July 20, 2018
The discussions included in this document may contain “forward - looking statements” within the meaning of the Private Securities Litigation Reform Act of 1995 , including Section 21 E of the Securities Exchange Act of 1934 and Section 27 A of the Securities Act of 1933 . Such statements involve known and unknown risks, uncertainties and other factors that may cause actual results to differ materially from the anticipated results or other expectations expressed in the forward - looking statements . For the purposes of these discussions, any statements that are not statements of historical fact may be deemed to be “forward - looking statements . ” Such statements are often characterized by the use of qualifying words such as “expects,” “anticipates,” “believes,” “estimates,” “plans,” “projects,” or other statements concerning opinions or judgments of the Company and its management about future events . The accuracy of such forward - looking statements could be affected by factors including, but not limited to, the financial success or changing conditions or strategies of the Company’s customers or vendors, fluctuations in interest rates, actions of government regulators, the availability of capital and personnel or general economic conditions . These forward - looking statements express management’s current expectations, plans or forecasts of future events, results and condition, including financial and other estimates . Additional factors that could cause actual results to differ materially from those anticipated by forward - looking statements are discussed in the Company’s filings with the Securities and Exchange Commission, including without limitation its annual report on Form 10 - K, quarterly reports on Form 10 - Q and current reports on Form 8 - K . Forward - looking statements speak only as of the date they are made, and the Company undertakes no obligation to revise or update these statements following the date of this presentation . Forward - Looking Statements 2

Statements included in this document include non - GAAP financial measures and should be read along with the accompanying tables in Appendix A to our quarterly earnings release furnished to the SEC as of the date hereof , which provide a reconciliation of non - GAAP financial measures to GAAP financial measures . This document discusses financial measures, such as core return on average equity, core return on average assets, core earnings per share and core efficiency ratio, which are non - GAAP measures . We believe that such non - GAAP measures are useful because they enhance the ability of investors and management to evaluate and compare the Company’s operating results from period to period in a meaningful manner . Non - GAAP measures should not be considered as an alternative to any measure of performance as promulgated under GAAP . Investors should consider the Company’s performance and financial condition as reported under GAAP and all other relevant information when assessing the performance or financial condition of the Company . Non - GAAP measures have limitations as analytical tools, and investors should not consider them in isolation or as a substitute for analysis of the Company’s results or financial condition as reported under GAAP . All financial numbers included in this presentation are shown in thousands ( 000 ’s) unless otherwise noted, excluding per share data and percentages . All interim numbers are unaudited . Non - GAAP / Financial Basis 3
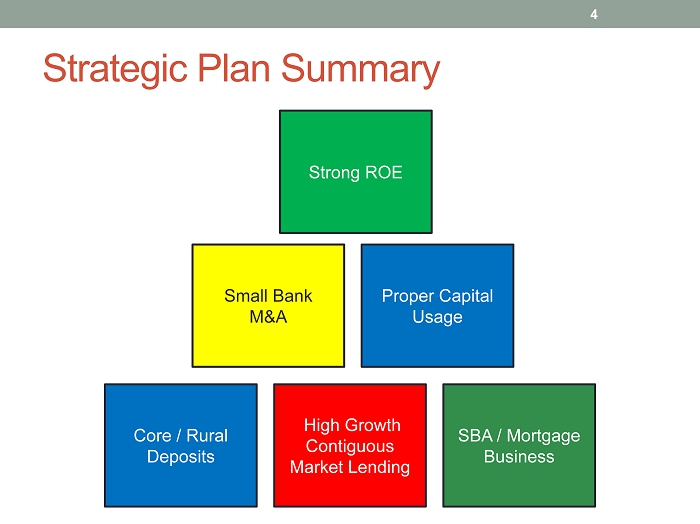
Strategic Plan Summary Strong ROE 4 Core / Rural Deposits High Growth Contiguous Market Lending SBA / Mortgage Business Small Bank M&A Proper Capital Usage Strong ROE
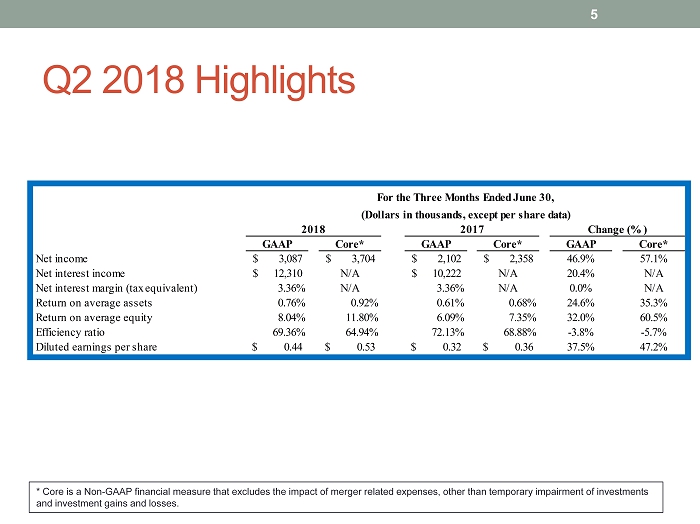
Q2 2018 Highlights 5 GAAP Core* GAAP Core* GAAP Core* Net income 3,087$ 3,704$ 2,102$ 2,358$ 46.9% 57.1% Net interest income 12,310$ N/A 10,222$ N/A 20.4% N/A Net interest margin (tax equivalent) 3.36% N/A 3.36% N/A 0.0% N/A Return on average assets 0.76% 0.92% 0.61% 0.68% 24.6% 35.3% Return on average equity 8.04% 11.80% 6.09% 7.35% 32.0% 60.5% Efficiency ratio 69.36% 64.94% 72.13% 68.88% -3.8% -5.7% Diluted earnings per share 0.44$ 0.53$ 0.32$ 0.36$ 37.5% 47.2% For the Three Months Ended June 30, (Dollars in thousands, except per share data) 2018 2017 Change (%) * Core is a Non - GAAP financial measure that excludes the impact of merger related expenses, other than temporary impairment of i nvestments and investment gains and losses.
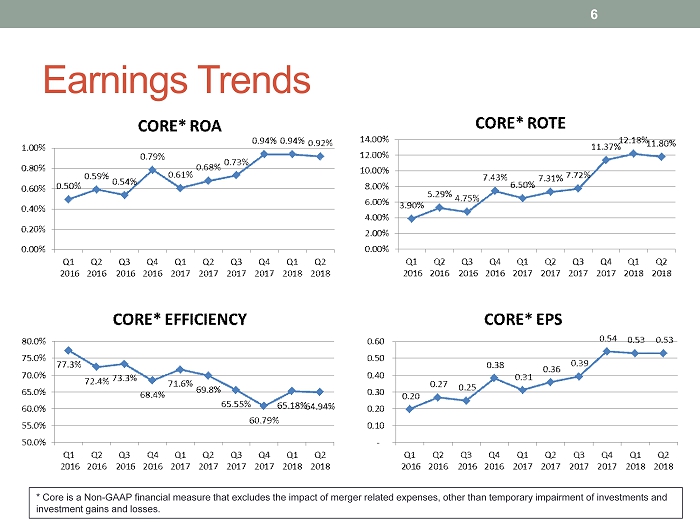
Earnings Trends 6 * Core is a Non - GAAP financial measure that excludes the impact of merger related expenses, other than temporary impairment of i nvestments and investment gains and losses.
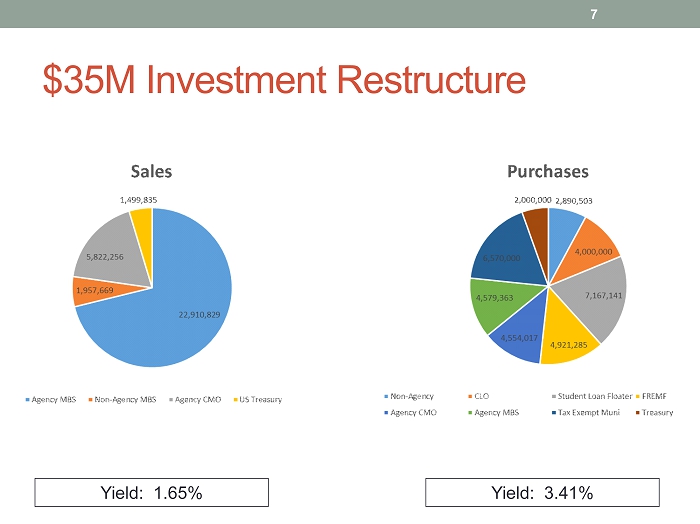
$35M Investment Restructure 7 Yield: 1.65% Yield: 3.41%
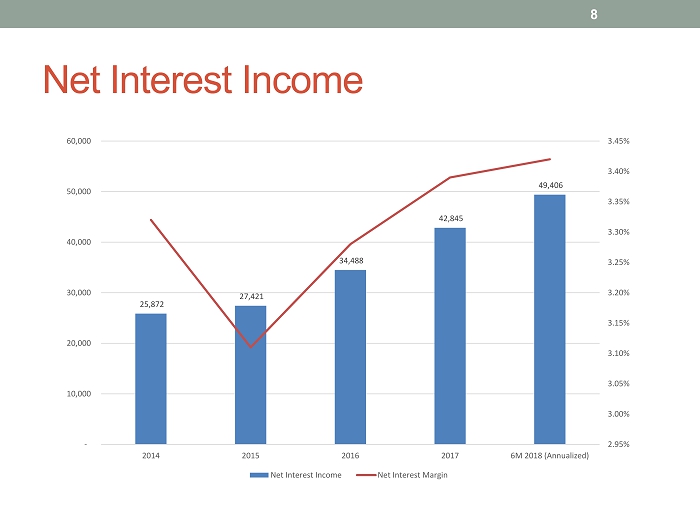
Net Interest Income 8 25,872 27,421 34,488 42,845 49,406 2.95% 3.00% 3.05% 3.10% 3.15% 3.20% 3.25% 3.30% 3.35% 3.40% 3.45% - 10,000 20,000 30,000 40,000 50,000 60,000 2014 2015 2016 2017 6M 2018 (Annualized) Net Interest Income Net Interest Margin
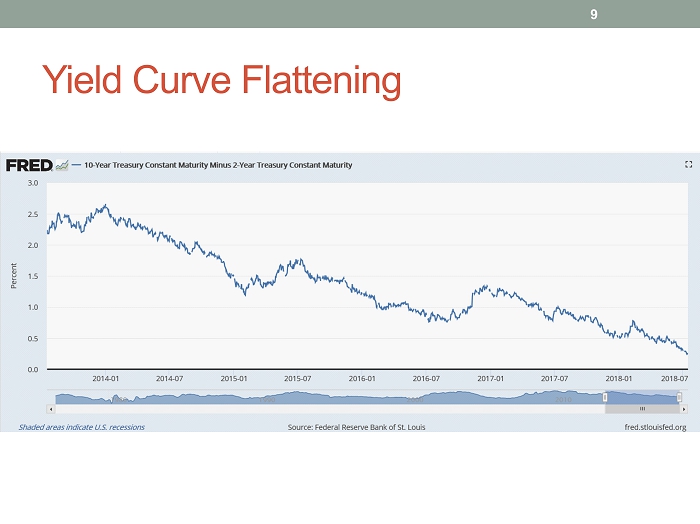
Yield Curve Flattening 9
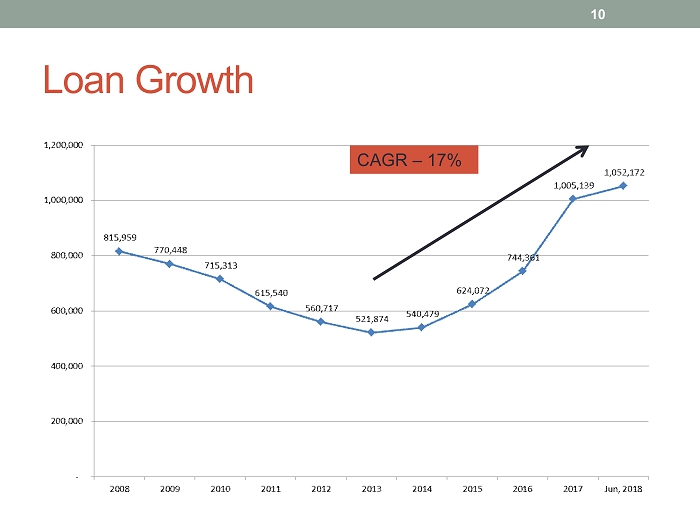
Loan Growth 10 CAGR – 17%