Attached files
| file | filename |
|---|---|
| 8-K - 8-K - APX Group Holdings, Inc. | a8-kprelimfinancials201807.htm |

APX Group Holdings, Inc. Exhibit 99.1 Investor Meetings July 2018
Preliminary Statement This presentation includes forward-looking statements as defined by the Private Securities Litigation Reform Act of 1995 regarding, among other things, statements with respect to certain preliminary unaudited financial results for the Company’s quarter ended June 30, 2018, which are subject to finalization and contingencies associated with the Company’s quarterly financial and accounting procedures. These statements are based on the beliefs and assumptions of management. Although the Company believes that its estimates, plans, intentions and expectations reflected in or suggested by these forward-looking statements are reasonable, the Company cannot assure you that it will achieve or realize these estimates, plans, intentions or expectations. Forward-looking statements are inherently subject to risks, uncertainties and assumptions. Generally, statements that are not historical facts, including statements concerning the Company’s possible or assumed future actions, business strategies, events or results of operations, are forward-looking statements. These statements may be preceded by, followed by or include the words “believes,” “estimates,” “expects,” “projects,” “forecasts,” “may,” “will,” “should,” “seeks,” “plans,” “scheduled,” “anticipates” or “intends” or similar expressions. Forward-looking statements are not guarantees of performance. You should not put undue reliance on these statements which speak only as of the date hereof. You should understand that the following important factors, among others, could affect the Company’s future results and could cause those results or other outcomes to differ materially from those expressed or implied in the Company’s forward-looking statements: 1) risks of the smart home and security industry, including risks of and publicity surrounding the sales, subscriber origination and retention process; 2) the highly competitive nature of the smart home and security industry and product introductions and promotional activity by the Company’s competitors; 3) litigation, complaints or adverse publicity; 4) the impact of changes in consumer spending patterns, consumer preferences, local, regional, and national economic conditions, crime, weather, demographic trends and employee availability; 5) adverse publicity and product liability claims; 6) increases and/or decreases in utility and other energy costs, increased costs related to utility or governmental requirements; 7) cost increases or shortages in smart home and security technology products or components; and 8) the outcome of the Company’s cost saving initiatives and the impact of the costs associated with such initiatives and the impact to the Company’s business results of operations, financial conditions, regulatory compliance and customer experience of the Vivint Flex Pay plan and the Best Buy Smart Home powered by Vivint program. In addition, the origination and retention of new subscribers will depend on various factors, including, but not limited to, market availability, subscriber interest, the availability of suitable components, the negotiation of acceptable contract terms with subscribers, local permitting, licensing and regulatory compliance, and the Company’s ability to manage anticipated expansion and to hire, train and retain personnel, the financial viability of subscribers and general economic conditions. These and other factors that could cause actual results to differ from those implied by the forward-looking statements in this presentation are more fully described in the “Risk Factors” section in the Company’s annual report on form 10-K for the year ended December 31, 2017, filed with the Securities Exchange Commission (SEC), as such factors may be updated from time to time in the Company’s periodic filings with the SEC, which are available on the SEC’s website at www.sec.gov. The risks described in “Risk Factors” are not exhaustive. New risk factors emerge from time to time and it is not possible for us to predict all such risk factors, nor can we assess the impact of all such risk factors on the Company’s business or the extent to which any factor or combination of factors may cause actual results to differ materially from those contained in any forward-looking statements. All forward-looking statements attributable to the Company or persons acting on its behalf are expressly qualified in their entirety by the foregoing cautionary statements. The Company undertakes no obligations to update or revise publicly any forward-looking statements, whether as a result of new information, future events or otherwise, except as required by law. This presentation includes Adjusted EBITDA, which is a supplemental measure that is not required by, or presented in accordance with, accounting principles generally accepted in the United States (“GAAP”). Adjusted EBITDA is not a measurement of our financial performance under GAAP and should not be considered as an alternative to net income (loss) or any other measure derived in accordance with GAAP or as an alternative to cash flows from operating activities as a measure of our liquidity. We believe that Adjusted EBITDA provides useful information about flexibility under our covenants to investors, lenders, financial analysts and rating agencies since these groups have historically used EBITDA-related measures in our industry, along with other measures, to estimate the value of a company, to make informed investment decisions, and to evaluate a company’s ability to meet its debt service requirements. Adjusted EBITDA eliminates the effect of non-cash depreciation of tangible assets and amortization of intangible assets, much of which results from acquisitions accounted for under the purchase method of accounting. Adjusted EBITDA also eliminates the effects of interest rates and changes in capitalization which management believes may not necessarily be indicative of a company’s underlying operating performance. Adjusted EBITDA is also used by us to measure covenant compliance under the indenture governing our senior secured notes, the indenture governing our senior unsecured notes and the credit agreement governing our revolving credit facility. We caution investors that amounts presented in accordance with our definition of Adjusted EBITDA may not be comparable to similar measures disclosed by other issuers, because not all issuers and analysts calculate Adjusted EBITDA in the same manner. See the Annex of this presentation for a reconciliation of Adjusted EBITDA to net loss for the Company, which we believe is the most closely comparable financial measure calculated in accordance with GAAP. Adjusted EBITDA should be considered in addition to and not as a substitute for, or superior to, financial measures presented in accordance with GAAP. The preliminary unaudited financial data for the twelve months ended June 30, 2018 has been derived by subtracting the unaudited financial data for the six months ended June 30, 2017 from the audited financial data for the year ended December 31, 2017 and adding the preliminary unaudited financial data for the six months ended June 30, 2018. The preliminary unaudited financial data for the twelve months ended June 30, 2018 is not necessarily indicative of the results to be expected for the full year or any future period. Solely for convenience, the trademarks, service marks and tradenames referred to in this presentation are presented without the ®, SM and ™ symbols, but such references are not intended to indicate, in any way, that we will not assert, to the fullest extent under applicable law, our rights or the rights of the applicable licensors to these trademarks, service marks and tradenames. All trademarks, service marks and tradenames appearing in this presentation are the property of their respective owners. 2
Presenters Alex Dunn President Mark Davies Chief Financial Officer Dale R. Gerard SVP Finance and Treasurer 3
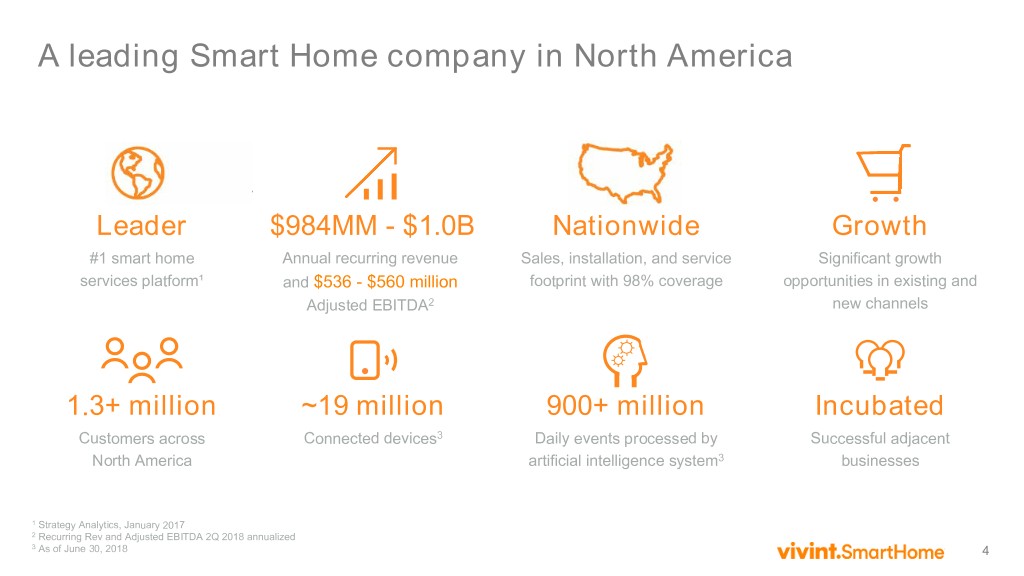
A leading Smart Home company in North America Leader $984MM - $1.0B Nationwide Growth #1 smart home Annual recurring revenue Sales, installation, and service Significant growth services platform¹ and $536 - $560 million footprint with 98% coverage opportunities in existing and Adjusted EBITDA2 new channels 1.3+ million ~19 million 900+ million Incubated Customers across Connected devices3 Daily events processed by Successful adjacent North America artificial intelligence system3 businesses 1 Strategy Analytics, January 2017 2 Recurring Rev and Adjusted EBITDA 2Q 2018 annualized 3 As of June 30, 2018 4
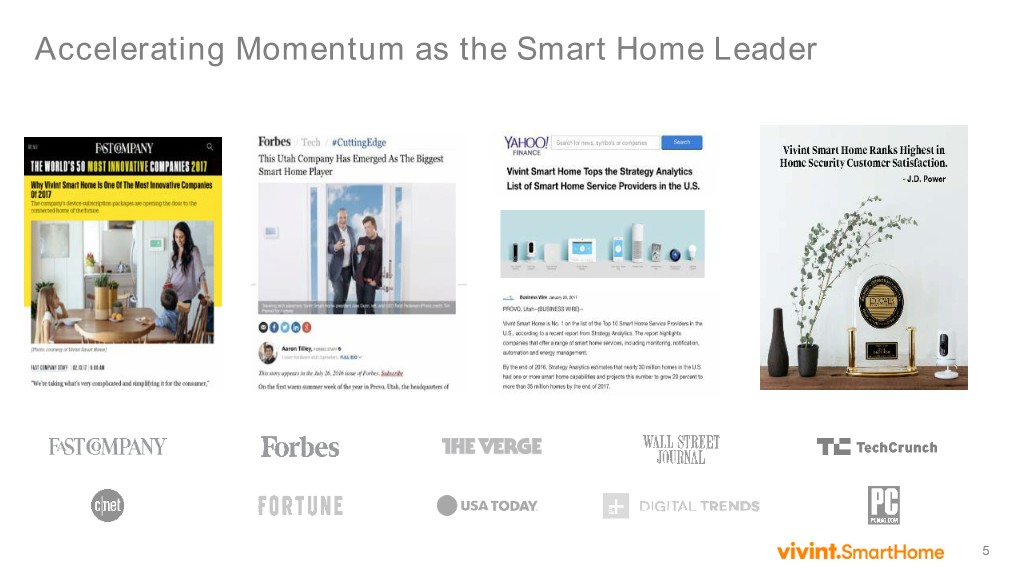
Accelerating Momentum as the Smart Home Leader 5
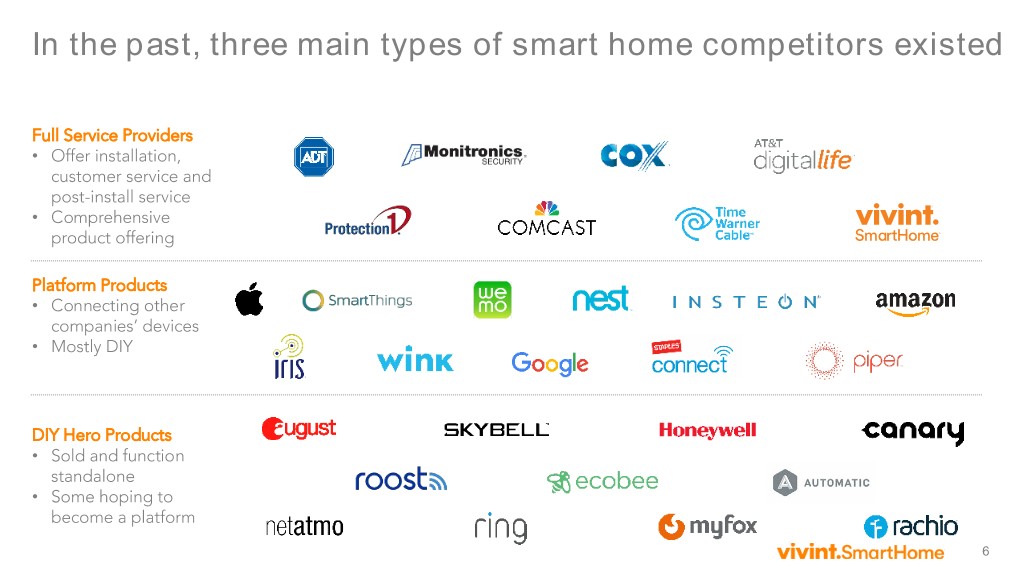
In the past, three main types of smart home competitors existed Full Service Providers • Offer installation, customer service and post-install service • Comprehensive product offering Platform Products • Connecting other companies’ devices • Mostly DIY DIY Hero Products • Sold and function standalone • Some hoping to become a platform 6
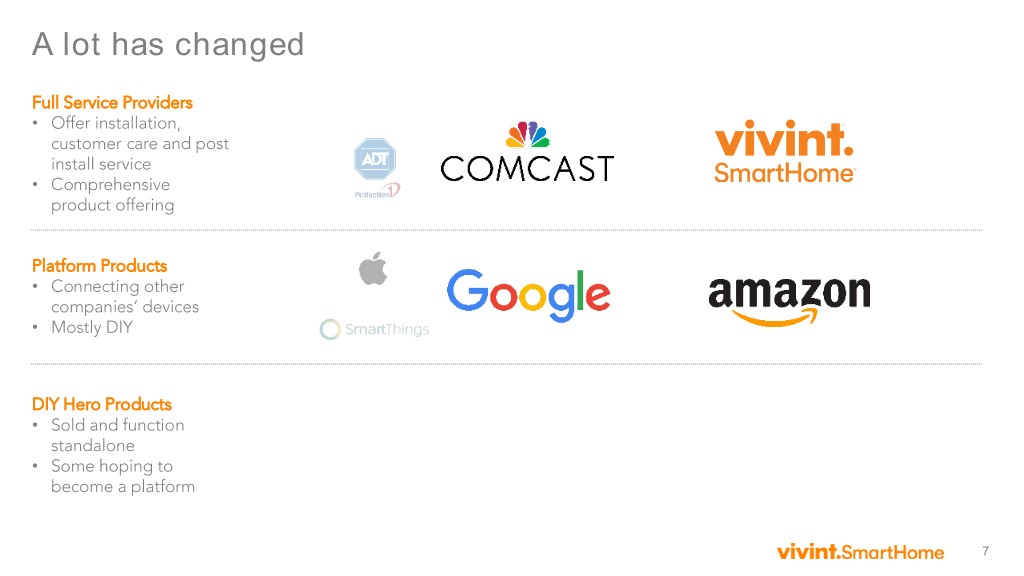
A lot has changed Full Service Providers • Offer installation, customer care and post install service • Comprehensive product offering Platform Products • Connecting other companies’ devices • Mostly DIY DIY Hero Products • Sold and function standalone • Some hoping to become a platform 7
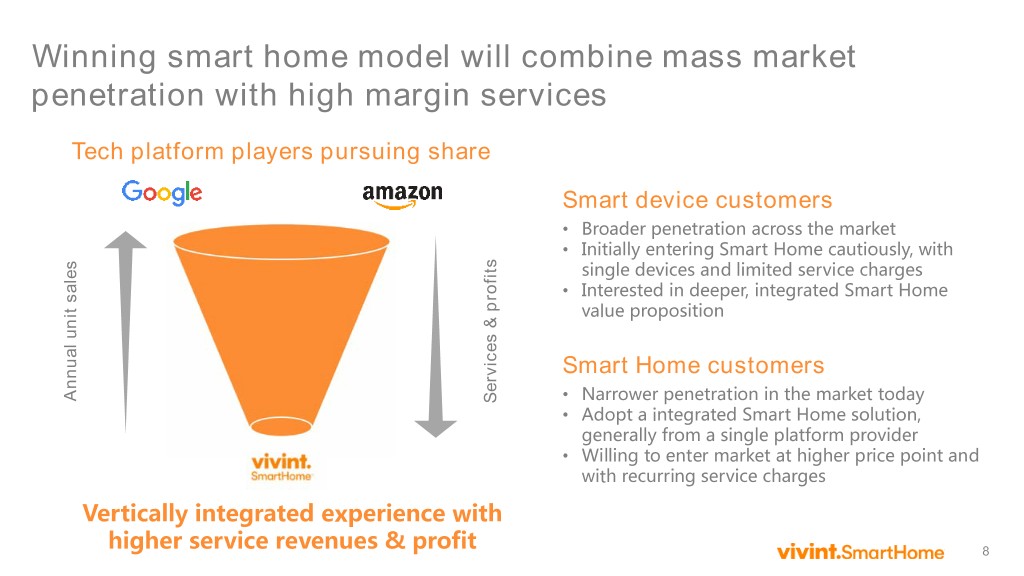
Winning smart home model will combine mass market penetration with high margin services Tech platform players pursuing share Smart device customers • Broader penetration across the market • Initially entering Smart Home cautiously, with single devices and limited service charges • Interested in deeper, integrated Smart Home value proposition Smart Home customers Annual unit unit Annual sales Services & profits Services • Narrower penetration in the market today • Adopt a integrated Smart Home solution, generally from a single platform provider • Willing to enter market at higher price point and with recurring service charges Vertically integrated experience with higher service revenues & profit 8
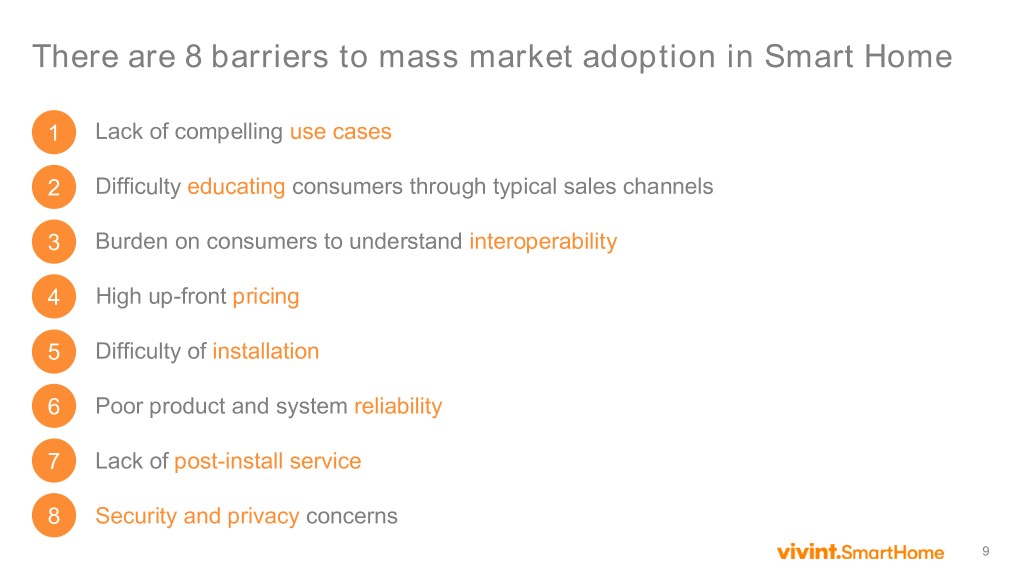
There are 8 barriers to mass market adoption in Smart Home 1 Lack of compelling use cases 2 Difficulty educating consumers through typical sales channels 3 Burden on consumers to understand interoperability 4 High up-front pricing 5 Difficulty of installation 6 Poor product and system reliability 7 Lack of post-install service 8 Security and privacy concerns 9
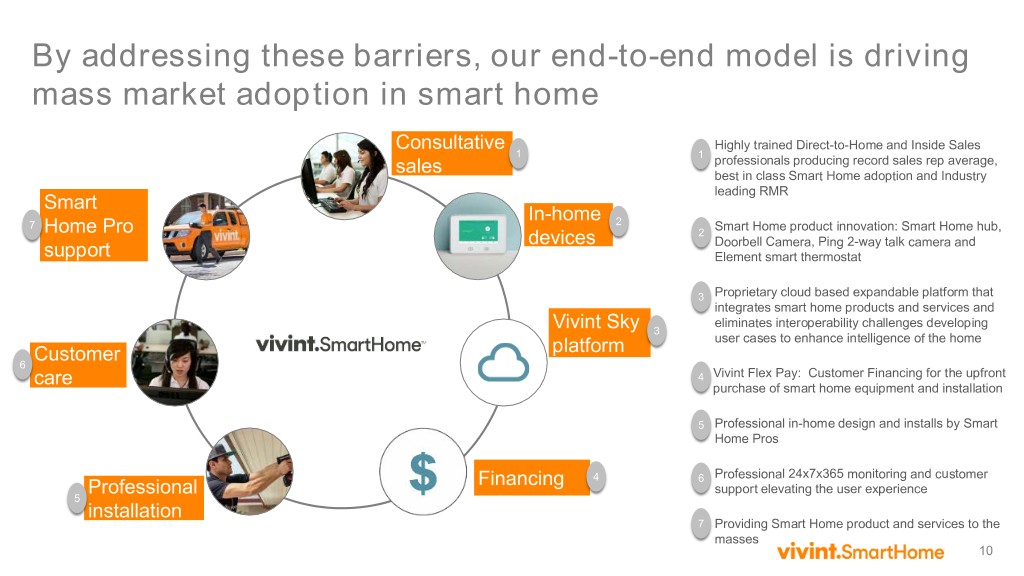
By addressing these barriers, our end-to-end model is driving mass market adoption in smart home Consultative Highly trained Direct-to-Home and Inside Sales 1 1 professionals producing record sales rep average, sales best in class Smart Home adoption and Industry leading RMR Smart In-home 7 2 Smart Home product innovation: Smart Home hub, Home Pro 2 devices Doorbell Camera, Ping 2-way talk camera and support Element smart thermostat 3 Proprietary cloud based expandable platform that integrates smart home products and services and eliminates interoperability challenges developing Vivint Sky 3 user cases to enhance intelligence of the home Customer platform 6 4 Vivint Flex Pay: Customer Financing for the upfront care purchase of smart home equipment and installation 5 Professional in-home design and installs by Smart Home Pros Financing 4 6 Professional 24x7x365 monitoring and customer Professional support elevating the user experience 5 installation 7 Providing Smart Home product and services to the masses 10
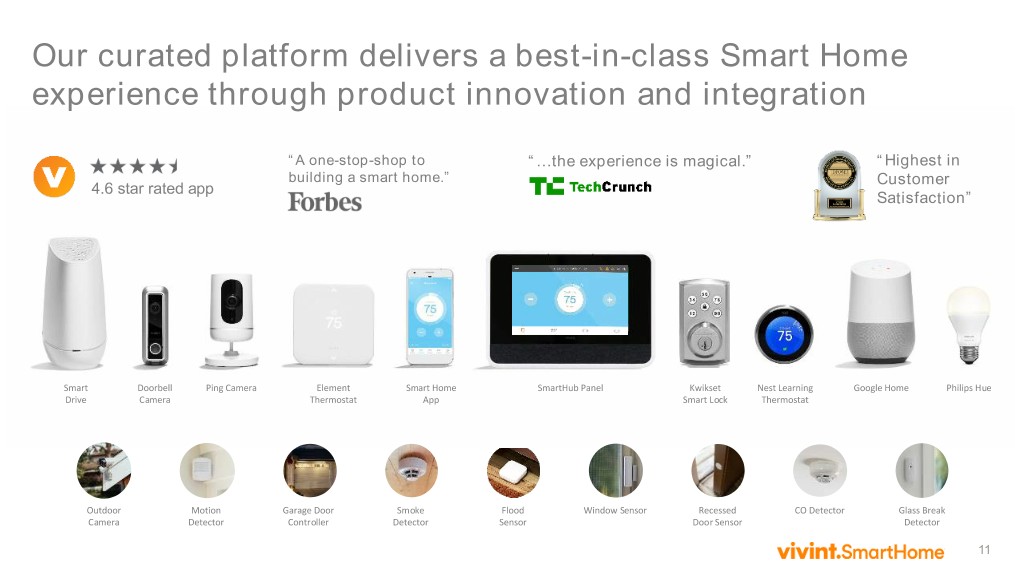
Our curated platform delivers a best-in-class Smart Home experience through product innovation and integration “A one-stop-shop to “…the experience is magical.” “Highest in building a smart home.” Customer 4.6 star rated app Satisfaction” Smart Doorbell Ping Camera Element Smart Home SmartHub Panel Kwikset Nest Learning Google Home Philips Hue Drive Camera Thermostat App Smart Lock Thermostat Outdoor Motion Garage Door Smoke Flood Window Sensor Recessed CO Detector Glass Break Camera Detector Controller Detector Sensor Door Sensor Detector 11
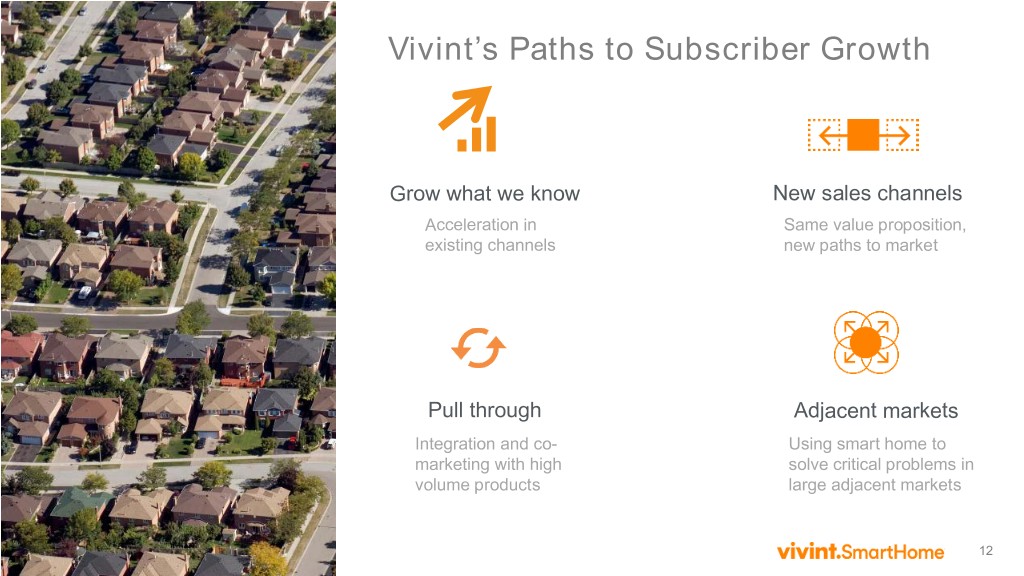
Vivint’s Paths to Subscriber Growth Grow what we know New sales channels Acceleration in Same value proposition, existing channels new paths to market Pull through Adjacent markets Integration and co- Using smart home to marketing with high solve critical problems in volume products large adjacent markets 12
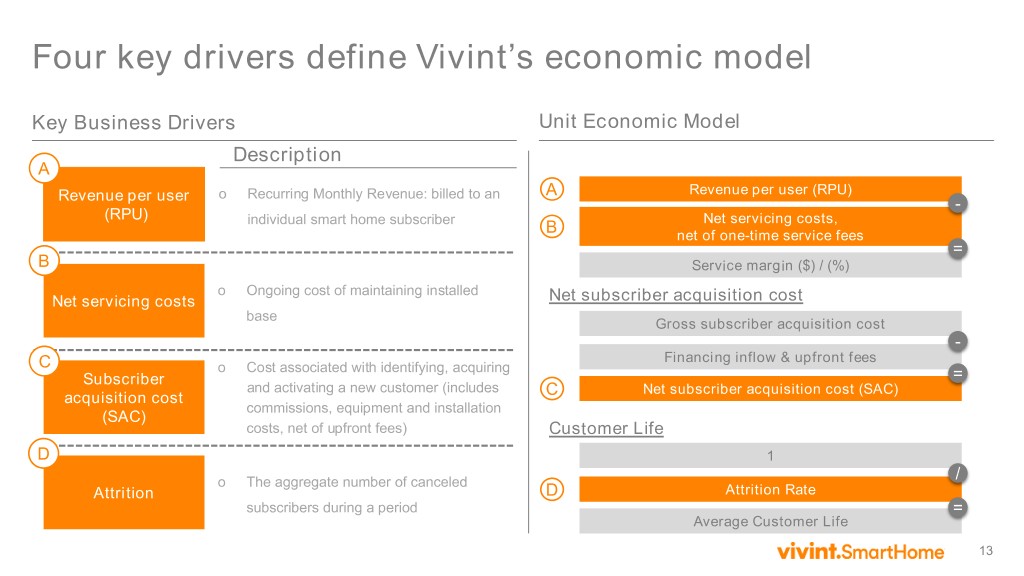
Four key drivers define Vivint’s economic model Key Business Drivers Unit Economic Model Description A Recurring Monthly Revenue: billed to an A Revenue per user (RPU) Revenue per user o - (RPU) individual smart home subscriber Net servicing costs, B net of one-time service fees = B Service margin ($) / (%) Ongoing cost of maintaining installed Net servicing costs o Net subscriber acquisition cost base Gross subscriber acquisition cost - Financing inflow & upfront fees C Cost associated with identifying, acquiring Subscriber o = and activating a new customer (includes Net subscriber acquisition cost (SAC) acquisition cost C commissions, equipment and installation (SAC) costs, net of upfront fees) Customer Life D 1 The aggregate number of canceled / Attrition o D Attrition Rate subscribers during a period = Average Customer Life 13
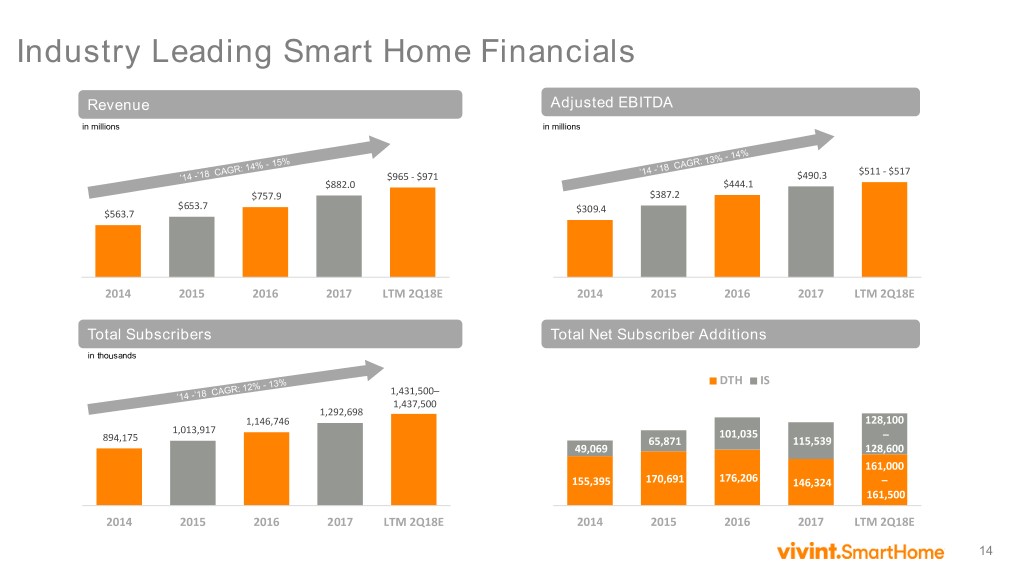
Industry Leading Smart Home Financials Revenue Adjusted EBITDA in millions in millions $511 - $517 $965 - $971 $490.3 $882.0 $444.1 $757.9 $387.2 $653.7 $563.7 $309.4 2014 2015 2016 2017 LTM 2Q18E 2014 2015 2016 2017 LTM 2Q18E Total Subscribers Total Net Subscriber Additions in thousands DTH IS 1,431,500– 1,437,500 1,292,698 1,146,746 128,100 1,013,917 101,035 – 894,175 65,871 115,539 49,069 128,600 161,000 155,395 170,691 176,206 146,324 – 161,500 2014 2015 2016 2017 LTM 2Q18E 2014 2015 2016 2017 LTM 2Q18E 14
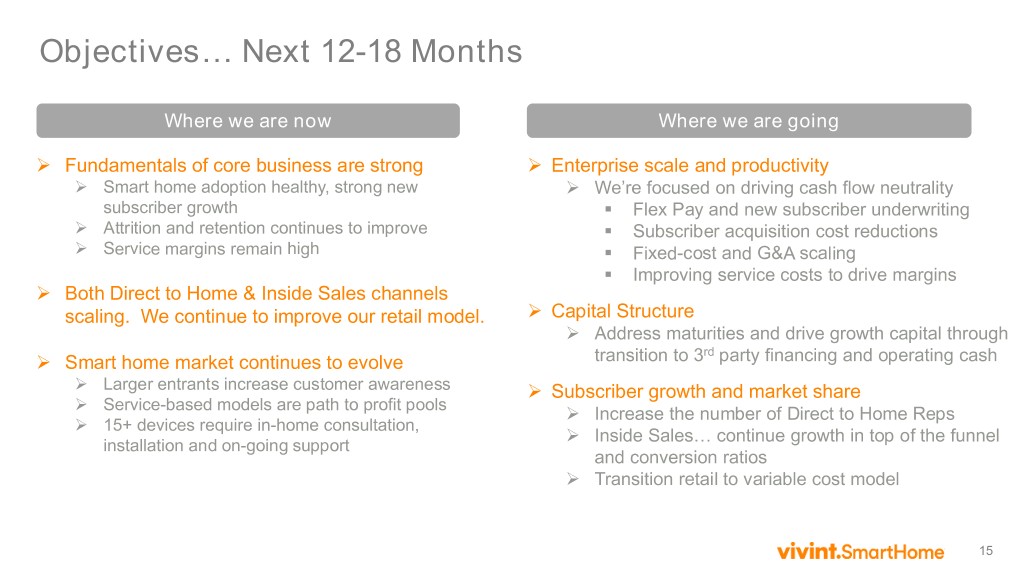
Objectives… Next 12-18 Months Where we are now Where we are going Fundamentals of core business are strong Enterprise scale and productivity Smart home adoption healthy, strong new We’re focused on driving cash flow neutrality subscriber growth . Flex Pay and new subscriber underwriting Attrition and retention continues to improve . Subscriber acquisition cost reductions Service margins remain high . Fixed-cost and G&A scaling . Improving service costs to drive margins Both Direct to Home & Inside Sales channels scaling. We continue to improve our retail model. Capital Structure Address maturities and drive growth capital through rd Smart home market continues to evolve transition to 3 party financing and operating cash Larger entrants increase customer awareness Subscriber growth and market share Service-based models are path to profit pools Increase the number of Direct to Home Reps 15+ devices require in-home consultation, Inside Sales… continue growth in top of the funnel installation and on-going support and conversion ratios Transition retail to variable cost model 15
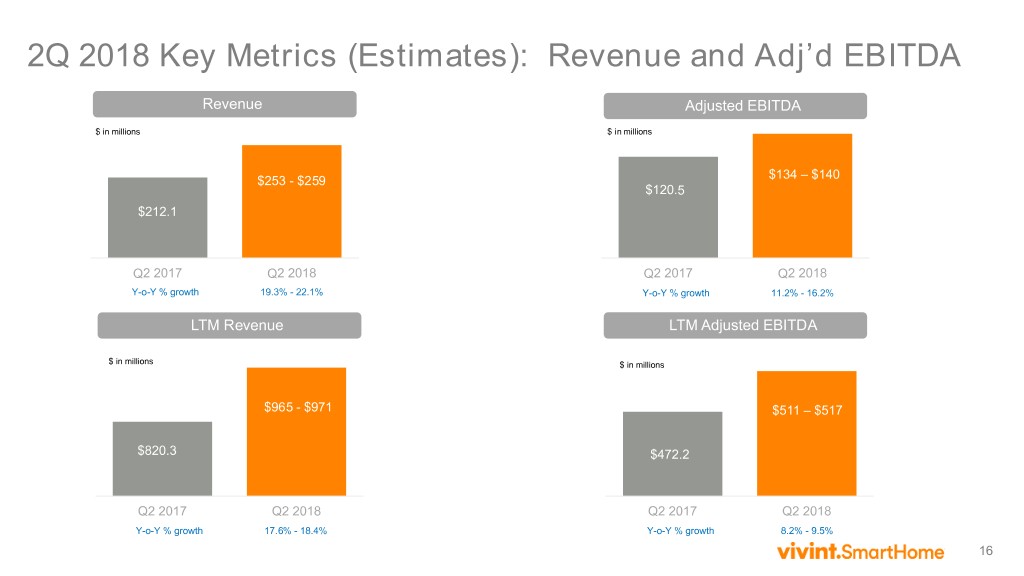
2Q 2018 Key Metrics (Estimates): Revenue and Adj’d EBITDA Revenue Adjusted EBITDA $ in millions $ in millions $134 – $140 $253 - $259 $120.5 $212.1 Q2 2017 Q2 2018 Q2 2017 Q2 2018 Y-o-Y % growth 19.3% - 22.1% Y-o-Y % growth 11.2% - 16.2% LTM Revenue LTM Adjusted EBITDA $ in millions $ in millions $965 - $971 $511 – $517 $820.3 $472.2 Q2 2017 Q2 2018 Q2 2017 Q2 2018 Y-o-Y % growth 17.6% - 18.4% Y-o-Y % growth 8.2% - 9.5% 16
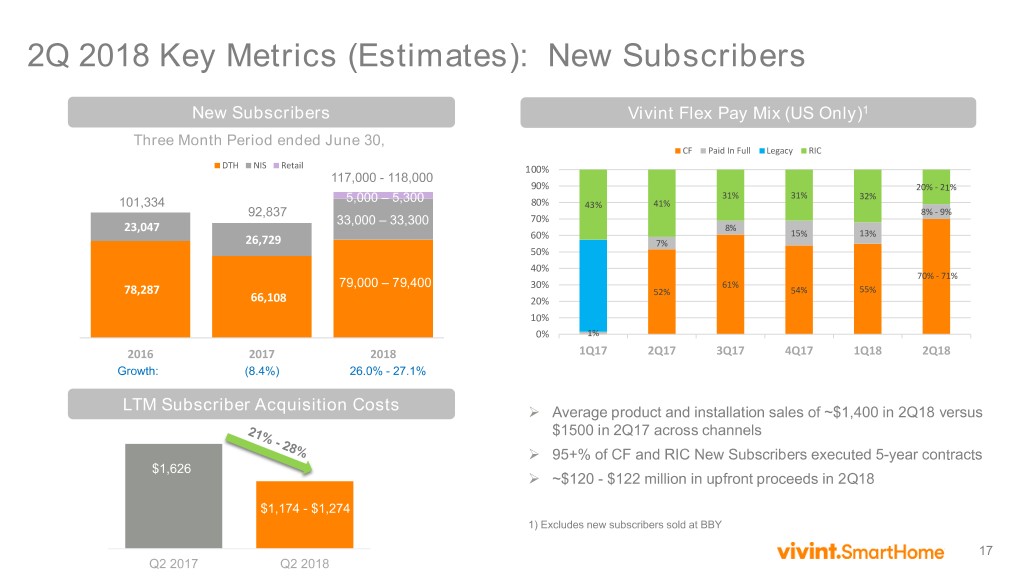
2Q 2018 Key Metrics (Estimates): New Subscribers New Subscribers Vivint Flex Pay Mix (US Only)1 Three Month Period ended June 30, CF Paid In Full Legacy RIC DTH NIS Retail 100% 117,000 - 118,000 90% 20% - 21% 31% 31% 32% 101,334 5,000 – 5,300 80% 43% 41% 92,837 8% - 9% 33,000 – 33,300 70% 23,047 8% 60% 15% 13% 26,729 7% 50% 40% 70% - 71% 79,000 – 79,400 30% 61% 78,287 52% 54% 55% 66,108 20% 10% 0% 1% 2016 2017 2018 1Q17 2Q17 3Q17 4Q17 1Q18 2Q18 Growth: (8.4%) 26.0% - 27.1% LTM Subscriber Acquisition Costs Average product and installation sales of ~$1,400 in 2Q18 versus $1500 in 2Q17 across channels 95+% of CF and RIC New Subscribers executed 5-year contracts $1,626 ~$120 - $122 million in upfront proceeds in 2Q18 $1,174 - $1,274 1) Excludes new subscribers sold at BBY 17 Q2 2017 Q2 2018
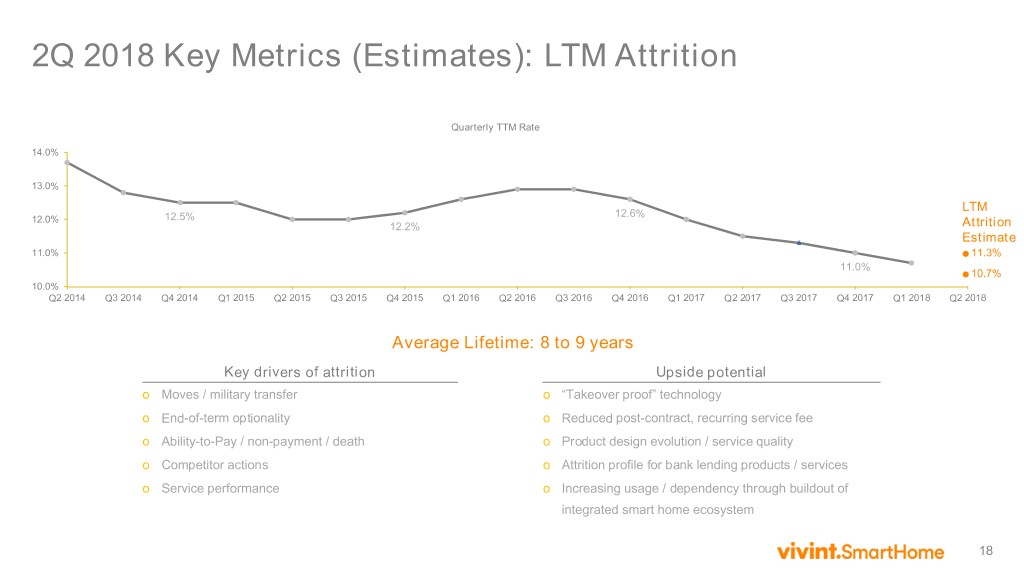
2Q 2018 Key Metrics (Estimates): LTM Attrition Quarterly TTM Rate 14.0% 13.0% 12.6% LTM 12.0% 12.5% 12.2% Attrition Estimate 11.0% 11.3% 11.0% 10.7% 10.0% Q2 2014 Q3 2014 Q4 2014 Q1 2015 Q2 2015 Q3 2015 Q4 2015 Q1 2016 Q2 2016 Q3 2016 Q4 2016 Q1 2017 Q2 2017 Q3 2017 Q4 2017 Q1 2018 Q2 2018 Average Lifetime: 8 to 9 years Key drivers of attrition Upside potential o Moves / military transfer o “Takeover proof” technology o End-of-term optionality o Reduced post-contract, recurring service fee o Ability-to-Pay / non-payment / death o Product design evolution / service quality o Competitor actions o Attrition profile for bank lending products / services o Service performance o Increasing usage / dependency through buildout of integrated smart home ecosystem 18
APX Group Holdings, Inc. Consolidated Financial Statements First Quarters Ended March 31, 2018 and 2017 19
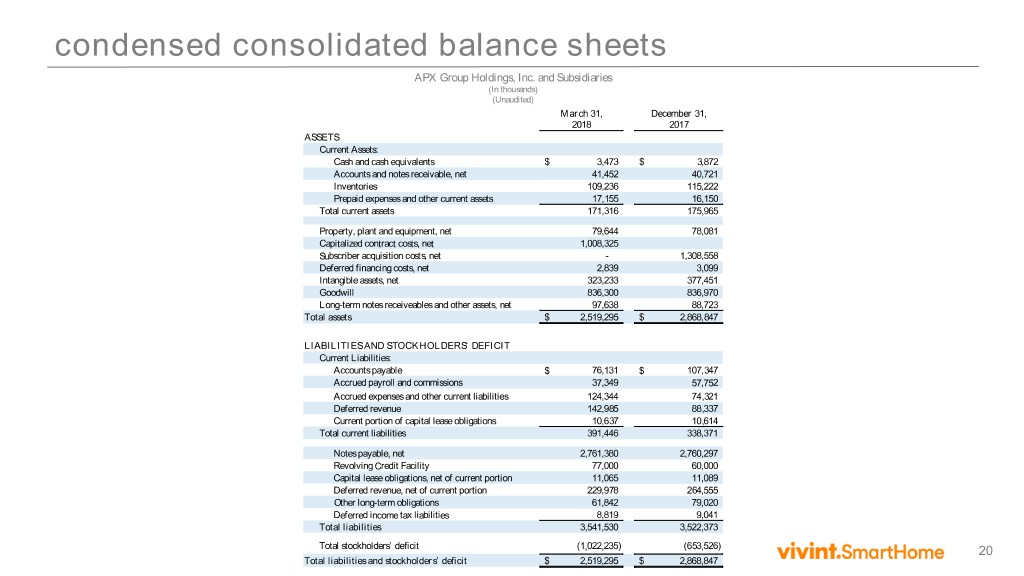
condensed consolidated balance sheets APX Group Holdings, Inc. and Subsidiaries (In thousands) (Unaudited) March 31, December 31, 2018 2017 ASSETS Current Assets: Cash and cash equivalents $ 3,473 $ 3,872 Accounts and notes receivable, net 41,452 40,721 Inventories 109,236 115,222 Prepaid expenses and other current assets 17,155 16,150 Total current assets 171,316 175,965 Property, plant and equipment, net 79,644 78,081 Capitalized contract costs, net 1,008,325 Subscriber acquisition costs, net - 1,308,558 Deferred financing costs, net 2,839 3,099 Intangible assets, net 323,233 377,451 Goodwill 836,300 836,970 Long-term notes receiveables and other assets, net 97,638 88,723 Total assets $ 2,519,295 $ 2,868,847 LIABILITIES AND STOCKHOLDERS’ DEFICIT Current Liabilities: Accounts payable $ 76,131 $ 107,347 Accrued payroll and commissions 37,349 57,752 Accrued expenses and other current liabilities 124,344 74,321 Deferred revenue 142,985 88,337 Current portion of capital lease obligations 10,637 10,614 Total current liabilities 391,446 338,371 Notes payable, net 2,761,380 2,760,297 Revolving Credit Facility 77,000 60,000 Capital lease obligations, net of current portion 11,065 11,089 Deferred revenue, net of current portion 229,978 264,555 Other long-term obligations 61,842 79,020 Deferred income tax liabilities 8,819 9,041 Total liabilities 3,541,530 3,522,373 Total stockholders’ deficit (1,022,235) (653,526) 20 Total liabilities and stockholders’ deficit $ 2,519,295 $ 2,868,847
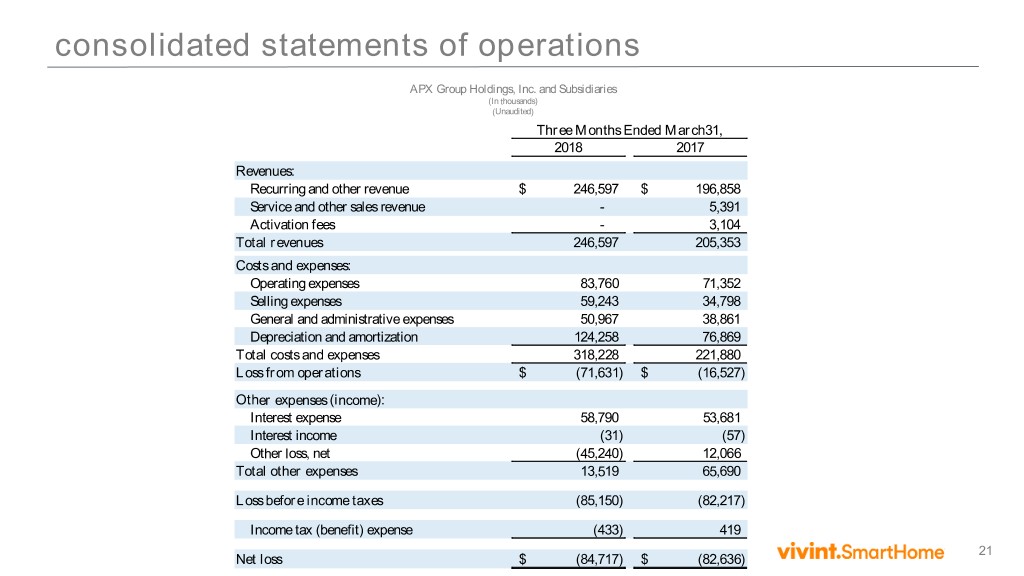
consolidated statements of operations APX Group Holdings, Inc. and Subsidiaries (In thousands) (Unaudited) Three Months Ended March31, 2018 2017 Revenues: Recurring and other revenue $ 246,597 $ 196,858 Service and other sales revenue - 5,391 Activation fees - 3,104 Total revenues 246,597 205,353 Costs and expenses: Operating expenses 83,760 71,352 Selling expenses 59,243 34,798 General and administrative expenses 50,967 38,861 Depreciation and amortization 124,258 76,869 Total costs and expenses 318,228 221,880 Loss from operations $ (71,631) $ (16,527) Other expenses (income): Interest expense 58,790 53,681 Interest income (31) (57) Other loss, net (45,240) 12,066 Total other expenses 13,519 65,690 Loss before income taxes (85,150) (82,217) Income tax (benefit) expense (433) 419 21 Net loss $ (84,717) $ (82,636)
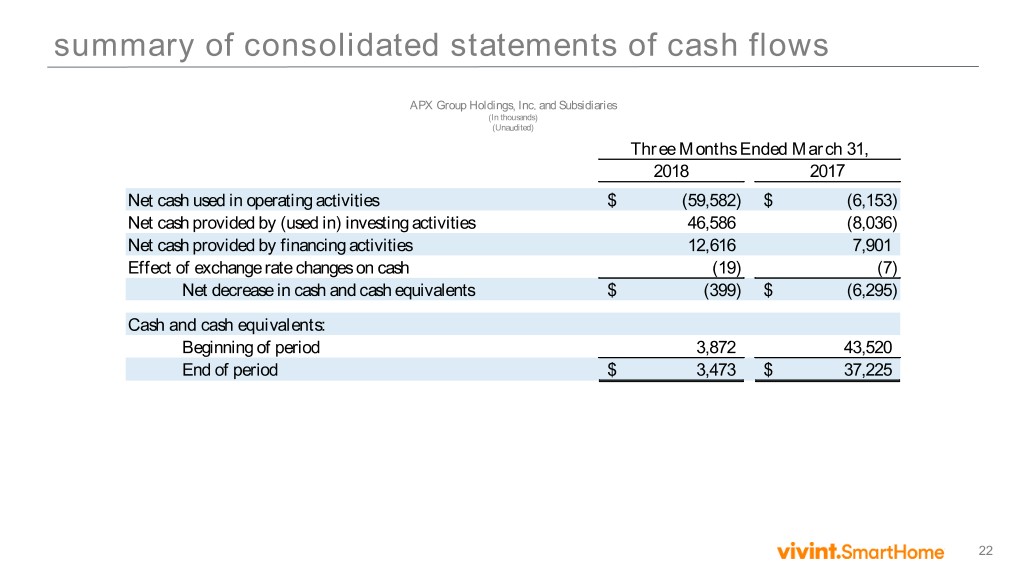
summary of consolidated statements of cash flows APX Group Holdings, Inc. and Subsidiaries (In thousands) (Unaudited) Three Months Ended March 31, 2018 2017 Net cash used in operating activities $ (59,582) $ (6,153) Net cash provided by (used in) investing activities 46,586 (8,036) Net cash provided by financing activities 12,616 7,901 Effect of exchange rate changes on cash (19) (7) Net decrease in cash and cash equivalents $ (399) $ (6,295) Cash and cash equivalents: Beginning of period 3,872 43,520 End of period $ 3,473 $ 37,225 22
APX Group Holdings, Inc. Annex A 23
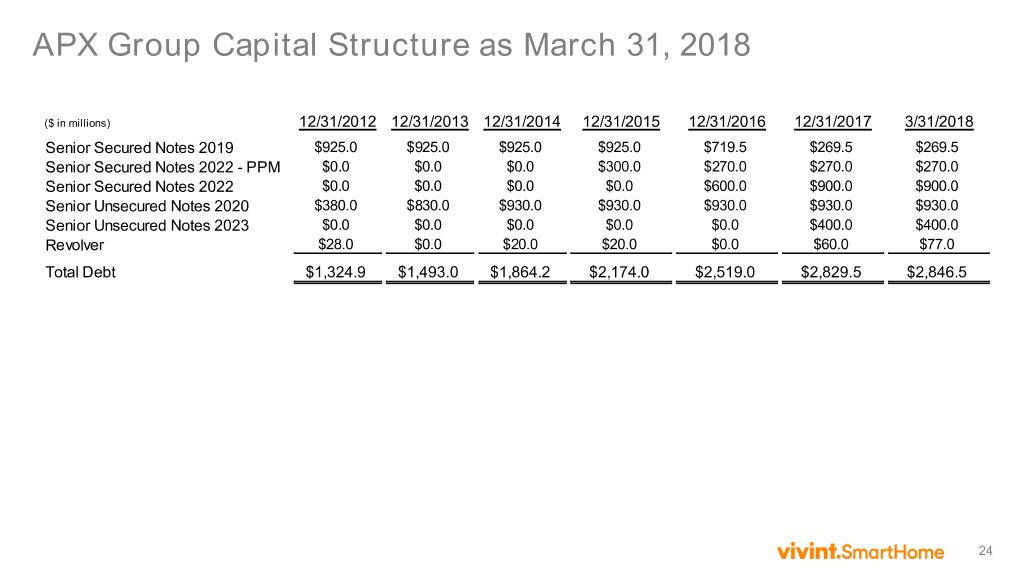
APX Group Capital Structure as March 31, 2018 ($ in millions) 12/31/2012 12/31/2013 12/31/2014 12/31/2015 12/31/2016 12/31/2017 3/31/2018 Senior Secured Notes 2019 $925.0 $925.0 $925.0 $925.0 $719.5 $269.5 $269.5 Senior Secured Notes 2022 - PPM $0.0 $0.0 $0.0 $300.0 $270.0 $270.0 $270.0 Senior Secured Notes 2022 $0.0 $0.0 $0.0 $0.0 $600.0 $900.0 $900.0 Senior Unsecured Notes 2020 $380.0 $830.0 $930.0 $930.0 $930.0 $930.0 $930.0 Senior Unsecured Notes 2023 $0.0 $0.0 $0.0 $0.0 $0.0 $400.0 $400.0 Revolver $28.0 $0.0 $20.0 $20.0 $0.0 $60.0 $77.0 Total Debt $1,324.9 $1,493.0 $1,864.2 $2,174.0 $2,519.0 $2,829.5 $2,846.5 24
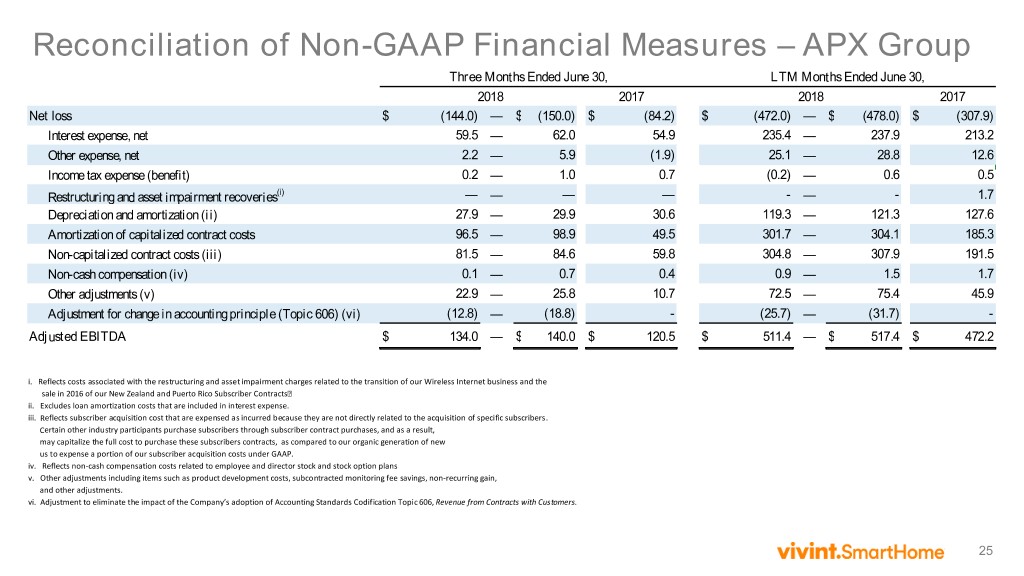
Reconciliation of Non-GAAP Financial Measures – APX Group Three Months Ended June 30, LTM Months Ended June 30, 2018 2017 2018 2017 Net loss $ (144.0) — $ (150.0) $ (84.2) $ (472.0) — $ (478.0) $ (307.9) Interest expense, net 59.5 — 62.0 54.9 235.4 — 237.9 213.2 Other expense, net 2.2 — 5.9 (1.9) 25.1 — 28.8 12.6 Income tax expense (benefit) 0.2 — 1.0 0.7 (0.2) — 0.6 0.5 Restructuring and asset impairment recoveries(i) — — — — - — - 1.7 Depreciation and amortization (ii) 27.9 — 29.9 30.6 119.3 — 121.3 127.6 Amortization of capitalized contract costs 96.5 — 98.9 49.5 301.7 — 304.1 185.3 Non-capitalized contract costs (iii) 81.5 — 84.6 59.8 304.8 — 307.9 191.5 Non-cash compensation (iv) 0.1 — 0.7 0.4 0.9 — 1.5 1.7 Other adjustments (v) 22.9 — 25.8 10.7 72.5 — 75.4 45.9 Adjustment for change in accounting principle (Topic 606) (vi) (12.8) — (18.8) - (25.7) — (31.7) - Adjusted EBITDA $ 134.0 — $ 140.0 $ 120.5 $ 511.4 — $ 517.4 $ 472.2 i. Reflects costs associated with the restructuring and asset impairment charges related to the transition of our Wireless Internet business and the sale in 2016 of our New Zealand and Puerto Rico Subscriber Contracts ii. Excludes loan amortization costs that are included in interest expense. iii. Reflects subscriber acquisition cost that are expensed as incurred because they are not directly related to the acquisition of specific subscribers. Certain other industry participants purchase subscribers through subscriber contract purchases, and as a result, may capitalize the full cost to purchase these subscribers contracts, as compared to our organic generation of new us to expense a portion of our subscriber acquisition costs under GAAP. iv. Reflects non-cash compensation costs related to employee and director stock and stock option plans v. Other adjustments including items such as product development costs, subcontracted monitoring fee savings, non-recurring gain, and other adjustments. vi. Adjustment to eliminate the impact of the Company’s adoption of Accounting Standards Codification Topic 606, Revenue from Contracts with Customers. 25
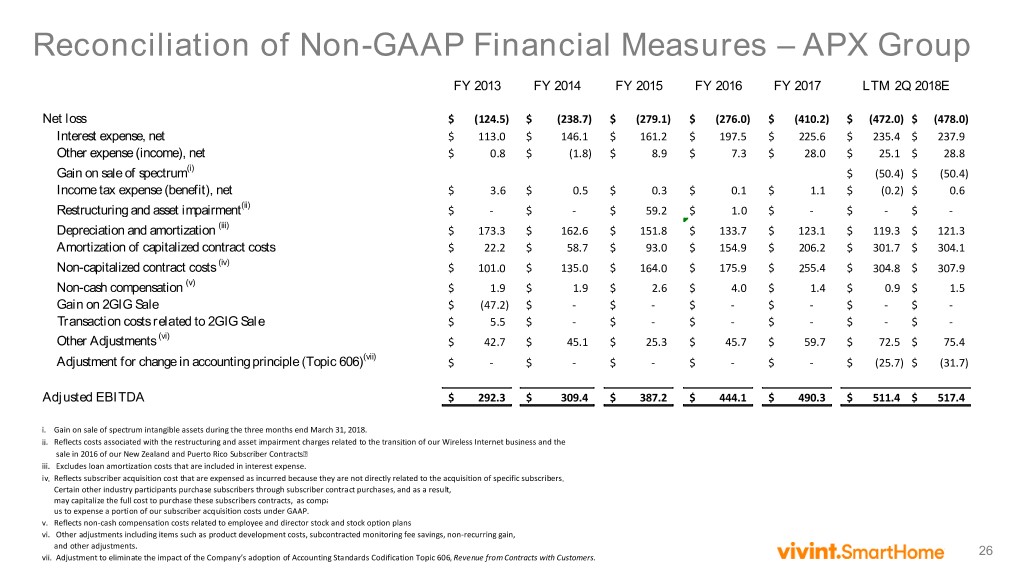
Reconciliation of Non-GAAP Financial Measures – APX Group FY 2013 FY 2014 FY 2015 FY 2016 FY 2017 LTM 2Q 2018E Net loss $ (124.5) $ (238.7) $ (279.1) $ (276.0) $ (410.2) $ (472.0) $ (478.0) Interest expense, net $ 113.0 $ 146.1 $ 161.2 $ 197.5 $ 225.6 $ 235.4 $ 237.9 Other expense (income), net $ 0.8 $ (1.8) $ 8.9 $ 7.3 $ 28.0 $ 25.1 $ 28.8 Gain on sale of spectrum(i) $ (50.4) $ (50.4) Income tax expense (benefit), net $ 3.6 $ 0.5 $ 0.3 $ 0.1 $ 1.1 $ (0.2) $ 0.6 Restructuring and asset impairment(ii) $ - $ - $ 59.2 $ 1.0 $ - $ - $ - Depreciation and amortization (iii) $ 173.3 $ 162.6 $ 151.8 $ 133.7 $ 123.1 $ 119.3 $ 121.3 Amortization of capitalized contract costs $ 22.2 $ 58.7 $ 93.0 $ 154.9 $ 206.2 $ 301.7 $ 304.1 Non-capitalized contract costs (iv) $ 101.0 $ 135.0 $ 164.0 $ 175.9 $ 255.4 $ 304.8 $ 307.9 Non-cash compensation (v) $ 1.9 $ 1.9 $ 2.6 $ 4.0 $ 1.4 $ 0.9 $ 1.5 Gain on 2GIG Sale $ (47.2) $ - $ - $ - $ - $ - $ - Transaction costs related to 2GIG Sale $ 5.5 $ - $ - $ - $ - $ - $ - (vi) Other Adjustments $ 42.7 $ 45.1 $ 25.3 $ 45.7 $ 59.7 $ 72.5 $ 75.4 (vii) Adjustment for change in accounting principle (Topic 606) $ - $ - $ - $ - $ - $ (25.7) $ (31.7) Adjusted EBITDA $ 292.3 $ 309.4 $ 387.2 $ 444.1 $ 490.3 $ 511.4 $ 517.4 i. Gain on sale of spectrum intangible assets during the three months end March 31, 2018. ii. Reflects costs associated with the restructuring and asset impairment charges related to the transition of our Wireless Internet business and the sale in 2016 of our New Zealand and Puerto Rico Subscriber Contracts iii. Excludes loan amortization costs that are included in interest expense. iv. Reflects subscriber acquisition cost that are expensed as incurred because they are not directly related to the acquisition of specific subscribers. Certain other industry participants purchase subscribers through subscriber contract purchases, and as a result, may capitalize the full cost to purchase these subscribers contracts, as compa us to expense a portion of our subscriber acquisition costs under GAAP. v. Reflects non-cash compensation costs related to employee and director stock and stock option plans vi. Other adjustments including items such as product development costs, subcontracted monitoring fee savings, non-recurring gain, and other adjustments. vii. Adjustment to eliminate the impact of the Company’s adoption of Accounting Standards Codification Topic 606, Revenue from Contracts with Customers. 26
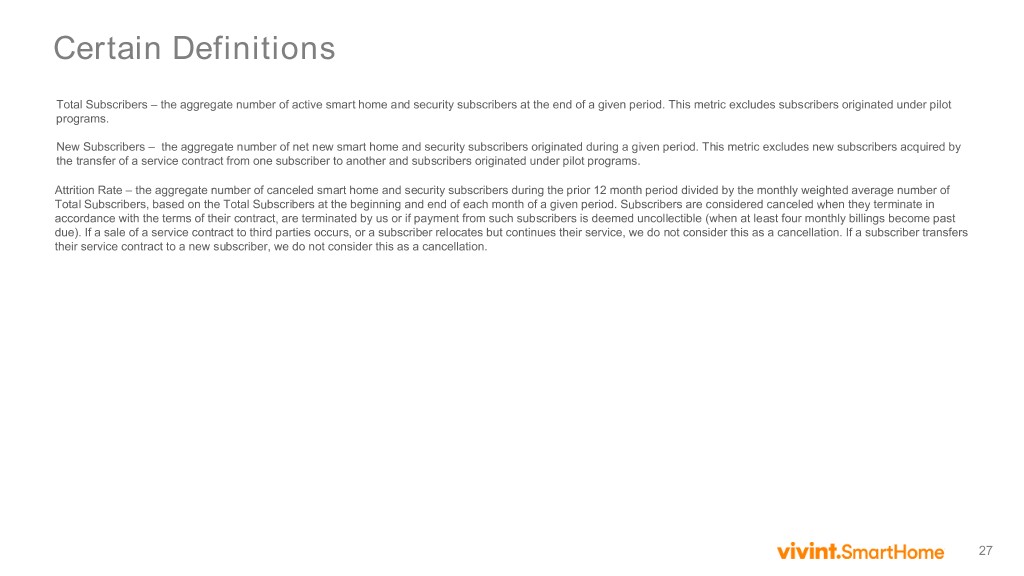
Certain Definitions Total Subscribers – the aggregate number of active smart home and security subscribers at the end of a given period. This metric excludes subscribers originated under pilot programs. New Subscribers – the aggregate number of net new smart home and security subscribers originated during a given period. This metric excludes new subscribers acquired by the transfer of a service contract from one subscriber to another and subscribers originated under pilot programs. Attrition Rate – the aggregate number of canceled smart home and security subscribers during the prior 12 month period divided by the monthly weighted average number of Total Subscribers, based on the Total Subscribers at the beginning and end of each month of a given period. Subscribers are considered canceled when they terminate in accordance with the terms of their contract, are terminated by us or if payment from such subscribers is deemed uncollectible (when at least four monthly billings become past due). If a sale of a service contract to third parties occurs, or a subscriber relocates but continues their service, we do not consider this as a cancellation. If a subscriber transfers their service contract to a new subscriber, we do not consider this as a cancellation. 27
