Attached files
| file | filename |
|---|---|
| EXCEL - IDEA: XBRL DOCUMENT - APX Group Holdings, Inc. | Financial_Report.xls |
| EX-21.1 - EX-21.1 - APX Group Holdings, Inc. | d858687dex211.htm |
| EX-32.2 - EX-32.2 - APX Group Holdings, Inc. | d858687dex322.htm |
| EX-32.1 - EX-32.1 - APX Group Holdings, Inc. | d858687dex321.htm |
| EX-99.1 - EX-99.1 - APX Group Holdings, Inc. | d858687dex991.htm |
| EX-12.1 - EX-12.1 - APX Group Holdings, Inc. | d858687dex121.htm |
| EX-31.1 - EX-31.1 - APX Group Holdings, Inc. | d858687dex311.htm |
| EX-31.2 - EX-31.2 - APX Group Holdings, Inc. | d858687dex312.htm |
Table of Contents
UNITED STATES
SECURITIES AND EXCHANGE COMMISSION
Washington, D.C. 20549
FORM 10-K
(Mark One)
| x | ANNUAL REPORT PURSUANT TO SECTION 13 OR 15(d) OF THE SECURITIES EXCHANGE ACT OF 1934 |
FOR THE FISCAL YEAR ENDED DECEMBER 31, 2014
OR
| ¨ | TRANSITION REPORT PURSUANT TO SECTION 13 OR 15(d) OF THE SECURITIES EXCHANGE ACT OF 1934 |
For the transition period from to
Commission file number: 333-191132-02
APX Group Holdings, Inc.
(Exact name of registrant as specified in its charter)
| DELAWARE | 46-1304852 | |
| State or other jurisdiction of incorporation or organization |
(I.R.S. Employer Identification No.) |
| 4931 North 300 West Provo, UT |
84604 | |
| (Address of principal executive offices) | (Zip Code) |
Registrant’s telephone number, including area code: (801) 377-9111
Securities registered pursuant to Section 12(b) of the Act: NONE
Securities registered pursuant to Section 12(g) of the Act: NONE
Indicate by check mark if the registrant is a well-known seasoned issuer, as defined in Rule 405 of the Securities Act. Yes ¨ No x
Indicate by check mark if the registrant is not required to file reports pursuant to Section 13 or Section 15(d) of the Act. Yes ¨ No x
Indicate by check mark whether the registrant (1) has filed all reports required to be filed by Section 13 or 15(d) of the Securities Exchange Act of 1934 during the preceding 12 months (or for such shorter period that the registrant was required to file such reports), and (2) has been subject to such filing requirements for the past 90 days. Yes ¨ No x
(Note: From January 1, 2014 until the effectiveness of the registrant’s Registration Statement on Form S-4 (File No. 333-193639) on February 4, 2014, the registrant was, and from January 1, 2015, the registrant has been, a voluntary filer not subject to the filing requirements of Section 13 or 15(d) of the Exchange Act; as a voluntary filer the registrant filed all reports required to be filed by Section 13 or 15(d) of the Exchange Act during the preceding 12 months (or for such shorter period that the registrant would have been required to file such reports) as if it were subject to such filing requirements.)
Indicate by check mark whether the registrant has submitted electronically and posted on its corporate Web site, if any, every Interactive Data File required to be submitted and posted pursuant to Rule 405 of Regulation S-T (§232.405 of this chapter) during the preceding 12 months (or for such shorter period that the registrant was required to submit and post such files). Yes x No ¨
Indicate by check mark if disclosure of delinquent filers pursuant to Item 405 of Regulation S-K (§229.405 of this chapter) is not contained herein, and will not be contained, to the best of registrant’s knowledge, in definitive proxy or information statements incorporated by reference in Part III of this Form 10-K or any amendment to this Form 10-K. x
Indicate by check mark whether the registrant is a large accelerated filer, an accelerated filer, a non-accelerated filer or a smaller reporting company. See the definitions of “large accelerated filer,” “accelerated filer” and “smaller reporting company” in Rule 12b-2 of the Exchange Act. (Check one):
| Large accelerated filer | ¨ | Accelerated filer | ¨ | |||
| Non-accelerated filer | x (Do not check if a smaller reporting company) | Smaller reporting company | ¨ | |||
Indicate by check mark whether the registrant is a shell company (as defined in Rule 12b-2 of the Act). Yes ¨ No x
The aggregate market value of voting common stock held by non-affiliates of the registrant as of June 30, 2014, the last business day of the registrant’s most recently completed second fiscal quarter, was zero.
As of March 26, 2015, there were 100 shares of the registrant’s common stock par value $0.01 per share, issued and outstanding.
Table of Contents
| Page | ||||||
| PART I | ||||||
| Item 1 |
5 | |||||
| Item 1A |
14 | |||||
| Item 1B |
27 | |||||
| Item 2 |
27 | |||||
| Item 3 |
28 | |||||
| Item 4 |
28 | |||||
| PART II | ||||||
| Item 5 |
28 | |||||
| Item 6 |
28 | |||||
| Item 7 |
Management’s Discussion and Analysis of Financial Condition and Results of Operations |
30 | ||||
| Item 7A |
58 | |||||
| Item 8 |
60 | |||||
| Item 9 |
Changes in and Disagreements With Accountants on Accounting and Financial Disclosure |
105 | ||||
| Item 9A |
105 | |||||
| Item 9B |
107 | |||||
| PART III | ||||||
| Item 10 |
108 | |||||
| Item 11 |
111 | |||||
| Item 12 |
Security Ownership of Certain Beneficial Owners and Management and Related Stockholder Matters |
124 | ||||
| Item 13 |
Certain Relationships and Related Transactions, and Director Independence |
126 | ||||
| Item 14 |
131 | |||||
| PART IV | ||||||
| Item 15 |
132 | |||||
Table of Contents
CAUTIONARY NOTE REGARDING FORWARD-LOOKING STATEMENTS
This annual report on Form 10-K includes forward-looking statements regarding, among other things, our plans, strategies and prospects, both business and financial. These statements are based on the beliefs and assumptions of our management. Although we believe that our plans, intentions and expectations reflected in or suggested by these forward-looking statements are reasonable, we cannot assure you that we will achieve or realize these plans, intentions or expectations. Forward-looking statements are inherently subject to risks, uncertainties and assumptions. Generally, statements that are not historical facts, including statements concerning our possible or assumed future actions, business strategies, events or results of operations, are forward-looking statements. These statements may be preceded by, followed by or include the words “believes,” “estimates,” “expects,” “projects,” “forecasts,” “may,” “will,” “should,” “seeks,” “plans,” “scheduled,” “anticipates” or “intends” or similar expressions.
Forward-looking statements are not guarantees of performance. You should not put undue reliance on these statements which speak only as of the date hereof. You should understand that the following important factors, in addition to those discussed in “Risk Factors” and elsewhere in this annual report on Form 10-K, could affect our future results and could cause those results or other outcomes to differ materially from those expressed or implied in our forward-looking statements:
| • | risks of the security and home automation industry, including risks of and publicity surrounding the sales, subscriber origination and retention process; |
| • | the highly competitive nature of the security and home automation industry and product introductions and promotional activity by our competitors; |
| • | litigation, complaints or adverse publicity; |
| • | the impact of changes in consumer spending patterns, consumer preferences, local, regional, and national economic conditions, crime, weather, demographic trends and employee availability; |
| • | adverse publicity and product liability claims; |
| • | increases and/or decreases in utility and other energy costs, increased costs related to utility or governmental requirements; and |
| • | cost increases or shortages in security and home automation technology products or components. |
In addition, the origination and retention of new subscribers will depend on various factors, including, but not limited to, market availability, subscriber interest, the availability of suitable components, the negotiation of acceptable contract terms with subscribers, local permitting, licensing and regulatory compliance, and our ability to manage anticipated expansion and to hire, train and retain personnel, the financial viability of subscribers and general economic conditions.
These and other factors that could cause actual results to differ from those implied by the forward-looking statements in this annual report on Form 10-K are more fully described in the “Risk Factors” section of this annual report on Form 10-K. The risks described in “Risk Factors” are not exhaustive. Other sections of this annual report on Form 10-K describe additional factors that could adversely affect our business, financial condition or results of operations. New risk factors emerge from time to time and it is not possible for us to predict all such risk factors, nor can we assess the impact of all such risk factors on our business or the extent to which any factor or combination of factors may cause actual results to differ materially from those contained in any forward-looking statements. All forward-looking statements attributable to us or persons acting on our behalf are expressly qualified in their entirety by the foregoing cautionary statements. We undertake no obligations to update or revise publicly any forward-looking statements, whether as a result of new information, future events or otherwise.
BASIS OF PRESENTATION
On November 16, 2012, APX Group, Inc. and two of its historical affiliates, V Solar Holdings, Inc. (“Solar”) and 2GIG Technologies, Inc. (“2GIG”), were acquired by an investor group (collectively, the “Investors”) comprised of certain investment funds affiliated with Blackstone Capital Partners VI L.P. (“Blackstone” or the “Sponsor”), and certain co-investors and management investors. This acquisition was accomplished through certain mergers and related reorganization transactions (collectively, the “Merger”) pursuant to which each of APX Group, Inc., Solar and 2GIG became indirect wholly-owned subsidiaries of 313 Acquisition LLC (“Acquisition LLC”), an entity wholly-owned by the Investors. Upon the consummation of the Merger, APX Group, Inc. and 2GIG became consolidated subsidiaries of APX Group Holdings, Inc.
3
Table of Contents
(“Holdings” or “Parent Guarantor”), which in turn is wholly-owned by APX Parent Holdco, Inc., which in turn is wholly-owned by Acquisition LLC, and Solar became a direct wholly-owned subsidiary of Acquisition LLC. Acquisition LLC, APX Parent Holdco, Inc. and Parent Guarantor have no independent operations and were formed for the purpose of facilitating the Merger.
The Merger, the equity investment by the Investors, entering into our revolving credit facility and $10.0 million of borrowings thereunder, the issuance of $925.0 million aggregate principal amount of 6.375% Senior Secured Notes due 2019 (the “2019 notes”) and $380.0 million aggregate principal amount of 8.75% senior notes due 2020 (the “2020 notes”) and the payment of related fees and expenses are collectively referred to in this annual report on Form 10-K as the “Transactions.” In May 2013, we issued and sold an additional $200.0 million aggregate principal amount of the 2020 notes. That offering is referred to in this annual report on Form 10-K as the “May 2013 Notes Offering.” In December 2013, we issued and sold an additional $250.0 million aggregate principal amount of the 2020 notes. That offering is referred to in this annual report on Form 10-K as the “December 2013 Notes Offering” (and together with the May 2013 Notes Offering, the “2013 Notes Offerings”). In July 2014, we issued and sold an additional $100.0 million aggregate principal amount of the 2020 notes. That offering is referred to in this annual report on Form 10-K as the “July 2014 Notes Offering” (and together with the 2013 Notes Offerings, the “Subsequent Notes Offerings”).
Unless the context suggests otherwise, references in this annual report on Form 10-K to “Vivint®,” the “Company,” “we,” “us” and “our” refer (1) prior to the Merger, to APX Group, Inc. and its subsidiaries and 2GIG and Solar, which were consolidated variable interest entities prior to the Merger and (2) after the Merger, to the Parent Guarantor and its subsidiaries, including 2GIG to the date of the 2GIG Sale (as defined below). References to the “Issuer” refer to APX Group, Inc., exclusive of its subsidiaries. References to “Parent Guarantor” refer to Holdings, exclusive of its subsidiaries.
Our historical and pro forma results of operations prior to the Merger include the results of Solar, which was considered a variable interest entity. As a result of the Merger, while Solar was a variable interest entity of the Company through the date of Solar’s initial public offering in October 2014, we have not been its primary beneficiary since after the date of the Merger. Accordingly, Solar has not been required to be included in the consolidated financial statements of the Company in periods following the Merger. In addition, the historical and pro forma financial information included in this annual report on Form 10-K include the results of operations of 2GIG up through April 1, 2013, which was the date we completed the sale of 2GIG and its subsidiary (the “2GIG Sale”) to Nortek, Inc. (“Nortek”). In connection with the 2GIG Sale, we entered into a five-year supply agreement with 2GIG, pursuant to which they will be the exclusive provider of our control panel requirements, subject to certain exceptions as provided in the supply agreement. Due to our continuing involvement with 2GIG under the supply agreement, it is not considered a discontinued operation. See “Management’s Discussion and Analysis of Financial Condition and Results of Operations—Basis of Presentation.” Solar and 2GIG do not and will not provide any credit support for any of our indebtedness, including indebtedness incurred under our revolving credit facility, our 2019 notes or our 2020 notes.
The consolidated financial statements for periods preceding the Merger are presented for APX Group, Inc. and its wholly-owned subsidiaries, as well as Solar, 2GIG and their respective subsidiaries (the “Predecessor Period” or “Predecessor” as context requires). The consolidated financial statements for periods succeeding the Merger present the financial position and results of operations of Parent Guarantor and its wholly-owned subsidiaries (“the Successor Period” or “Successor” as context requires). The audited consolidated financial statements for the year ended December 31, 2012 are presented for two periods: the Predecessor Period from January 1, 2012 through November 16, 2012, and the Successor Period from November 17 through December 31, 2012, which relate to the period preceding the Merger and the period succeeding the Merger, respectively. The financial position and results of operations of the Successor are not comparable to the financial position and results of operations of the Predecessor due to the Merger and the application of purchase accounting in accordance with Accounting Standards Codification (“ASC”) 805, Business Combinations.
The unaudited pro forma statement of operations for the year ended December 31, 2012 (“Pro Forma Year”) has been prepared to give pro forma effect to the Transactions as if they had occurred on January 1, 2012. The unaudited pro forma consolidated statement of operations data included in this annual report on Form 10-K does not give effect to the Subsequent Notes Offerings.
The pro forma financial information is for informational purposes only and should not be considered indicative of actual results that would have been achieved had the Transactions actually been consummated on the dates indicated and do not purport to indicate results of operations as of any future date or for any future period. See “Management’s discussion and Analysis of Financial Condition and Results of Operation-Unaudited Pro Forma Financial Information.”
4
Table of Contents
The term “attrition” as used in this annual report on Form 10-K refers to the aggregate number of cancelled security and home automation subscribers during a period divided by the monthly weighted average number of total security and home automation subscribers for such period. Subscribers are considered cancelled when they terminate in accordance with the terms of their contract, are terminated by us or if payment from such subscribers is deemed uncollectible (when at least four monthly billings become past due). Sales of contracts to third parties and certain subscriber residential moves are excluded from the attrition calculation. The term “CAGR”, as used in this annual report on Form 10-K, refers to the compound annual growth rate over the specified period. The term “net subscriber acquisition costs” as used in this annual report on Form 10-K refers to the direct and indirect costs to create a new security and home automation subscriber. These include commissions, equipment, installation, marketing and other allocations (G&A and overhead); less activation fees and up sell revenue. These costs exclude residuals and long-term equity direct-to-home expenses. The term “IRR” means the internal rate of return per subscriber calculated based on our estimates and assumptions related to net subscriber acquisition cost per subscriber, net servicing cost per subscriber, average RMR per new subscriber and attrition. The term “RMR” is the recurring monthly revenue billed to an individual security and home automation subscriber. The term “total RMR” is the aggregate RMR billed to all security and home automation subscribers. The term “total subscribers” is the aggregate number of our active security and home automation subscribers at the end of a given period. The term “average RMR per subscriber” is the total RMR divided by the total subscribers. This is also commonly referred to as Average Revenue per User, or “ARPU.” The term “average RMR per new subscriber” is the aggregate RMR for new subscribers originated during a period divided by the number of new subscribers originated during such period.
Unless specified otherwise, amounts in this annual report on Form 10-K are presented in United States (“U.S.”) dollars. Defined terms in the financial statements have the meanings ascribed to them in the financial statements.
| ITEM 1. | BUSINESS |
Company Overview
We are one of the largest Smart Home companies in North America. In February 2013, we were recognized by Forbes magazine as one of America’s Most Promising Companies. Our fully integrated and remotely accessible residential services platform offers subscribers a suite of products and services that includes interactive security, life-safety, energy management and home automation. We utilize a scalable “direct-to-home” sales model to originate a majority of our new subscribers, which allows us control over our net subscriber acquisition costs. We have built a high-quality subscriber portfolio, with an average credit score of 714, as of December 31, 2014, through our underwriting criteria and compensation structure. Unlike many of our competitors, who generally focus on either subscriber origination or servicing, we originate, install, service and monitor our entire subscriber base, which allows us to control the overall subscriber experience. We seek to deliver a quality subscriber experience with a combination of innovative new products and services and a commitment to customer service, which together with our focus on originating high-quality new subscribers, has enabled us to achieve attrition rates that we believe are historically at or below industry averages. Utilizing this model, we have built a portfolio of approximately 894,000 subscribers, as of December 31, 2014. Approximately 95% and 92% of our revenues during the years ended December 31, 2014 and 2013, respectively, consisted of contractually committed recurring revenues, which have historically resulted in consistent and predictable operating results.
We believe our sales model allows us to originate subscribers at lower net subscriber acquisition cost (as a multiple of RMR) and achieve a higher adoption rate of new service packages compared to many of our competitors. We generate the majority of our new subscribers through our direct-to-home sales channel, which uses teams of trained seasonal sales representatives. For the year ended December 31, 2014, we generated approximately 76% of our new subscribers through our direct-to-home sales channel. In this channel we have historically employed between 2,000 and 2,500 sales representatives and approximately 1,000 installation technicians, who are both largely commission based and deployed in targeted geographical locations. This results in a highly variable cost structure, subscriber density and the ability to complete same-day installations. We diversify our subscriber origination efforts with an “inside sales” channel, which includes our internal-sales call centers, radio, internet and other media advertising, as well as third-party lead generators.
We use underwriting policies that focus on creating a high-quality subscriber portfolio with an attractive return profile with an unlevered IRR in the low to mid 20% range, depending on contractual terms. As of December 31, 2014, based on FICO score at the time of contract origination, approximately 94% of our subscribers had a FICO score of 625 or greater, and the average FICO score of our portfolio was 714. In addition, for the year ended December 31, 2014, over 81% of our new subscribers paid activation fees and, as of December 31, 2014, approximately 88% of our total subscribers are set up on an automatic payment method. We believe that originating high-quality subscribers and our commitment to customer service increases retention which leads to predictable cash flows.
5
Table of Contents
Our business generates positive cash flows from ongoing monitoring and service revenues, which we choose to invest in new subscriber acquisitions and development of additional products and services. During the year ended December 31, 2014 and 2013, respectively, we generated $563.7 million and $500.9 million in total revenue, including $537.7 million and $460.1 million, respectively, in monitoring revenue. See “Management’s Discussion and Analysis of Financial Condition and Results of Operations—Liquidity and Capital Resources.”
In fiscal 2013, we completed the 2GIG Sale. Pursuant to the terms of the 2GIG Sale, Nortek acquired all of the outstanding common stock of 2GIG for aggregate cash consideration of approximately $148.9 million. In connection with the 2GIG Sale, we retained sole ownership of the intellectual property and exclusive rights with respect to the next generation of our control panels and certain peripheral equipment. In addition, we entered into a five-year supply agreement with 2GIG, pursuant to which they will be the exclusive provider of our control panel requirements, subject to certain exceptions. The terms of the credit agreement governing our revolving credit facility and the indentures governing the notes permitted us, subject to certain conditions, to distribute all or a portion of the net proceeds from the 2GIG Sale to our stockholders. In May 2013, we distributed $60.0 million of such proceeds to our stockholders in reliance on these provisions. The remaining proceeds have been used to fund our business activities or otherwise used for general corporate purposes, and we do not intend to make future dividends to our stockholders in reliance on these provisions.
The Residential Security and Automation Industry
According to Barnes Associates estimates, the U.S. market for monitoring and related residential electronic security services was over $23 billion in revenue in 2014 and has grown every year for the past 10 years. The penetration rate for this market was estimated at approximately 19%, as of December 31, 2014. This market is characterized by stable revenues from contractually committed recurring monthly payments and has proven to be recession-resistant through the last two economic downturns.
ABI Research estimates the total number of North American subscribers of home automation services will grow from approximately 877,000 in 2011 to over 13.1 million during 2018 and total annual North American revenues from these services to increase from an estimated $3.3 billion in 2011 to $7.5 billion in 2018.
Products and Service Packages
Our products and service packages allow subscribers to remotely control, monitor and manage the security, life-safety, video, lighting, access control and HVAC systems within their homes. Since January 2010, substantially all of the systems we have installed are interactive and Smart Home enabled. In early 2014, we launched Vivint Sky™, an integrated platform consisting of our proprietary SkyControl panel, equipment, cloud software, mobile application and online experience. Each of our service packages has a differentiated set of equipment and functionality, utilizing the Vivint Sky platform. Historically, we have offered contracts to subscribers ranging in length from 36 to 60 months. We offer three service packages: Smart Security, Smart Energy, and Smart Control. In addition, we offer products and services that include wireless internet and cloud based data storage, neither of which was material to our overall business or operating results for the year ended December 31, 2014.
Smart Security
This service package provides subscribers with residential security monitoring, wireless intrusion equipment, and emergency and non-emergency alerts. The current standard price of the Smart Security service package is $53.99 per month and includes the SkyControl panel, which communicates wirelessly with other equipment and features an LCD touchscreen, two-way voice communication, and remote control capabilities, three door or window sensors, a motion detector, a key fob and a yard sign. Subscribers can select additional equipment, such as glass-break detectors, and safety devices, including smoke and carbon monoxide detectors and personal panic pendants, to customize the system for their particular needs. Like all of our home services, subscribers can operate the system remotely through a smart phone application or a web-enabled device. All equipment in the Smart Security service package is connected wirelessly to the SkyControl panel, which then communicates through a wireless infrastructure to our two UL listed redundant central monitoring stations.
Smart Energy
Our Smart Energy service package provides subscribers the ability to monitor, control and conserve energy usage through the SkyControl panel or remotely through a smartphone application or a web-enabled device. The current standard price of the Smart Energy service package is $59.99 per month and includes a smart thermostat and a lamp/small appliance control, in addition to all of the services that are included with our Smart Security package. The SkyControl panel integrates with motion sensors, thermostats and lamps or small appliances to adjust settings based on occupancy. With our smart thermostat, subscribers can also remotely control their home temperature from any web enabled device as well as opt-in to automatically program their thermostat.
6
Table of Contents
Smart Control
Our Smart Control service package is a fully integrated suite of Smart Home products and services that connects various in-home technologies all through a single platform. The current standard price of the Smart Control service package is $69.99 per month and includes all of the services that are included with the Smart Security package along with the following “Smart Home” add-ons: (1) indoor camera, (2) automatic door lock or deadbolt, (3) smart thermostat, and a (4) lamp/small appliance module. With this package subscribers have the ability to remotely manage their home security and lock, unlock and monitor the status of the automatic door locks as well as the ability to remotely monitor activity in their home through video surveillance and text alerts.
For the year ended December 31, 2014, 69% of new subscribers selected additional services beyond our Smart Security package. In order to provide integrated products and services requested by our subscribers, we continually review our product and service packages and pricing, and as a result we expect to modify our product and service packages and pricing in the future.
Existing subscribers may order additional products or upgrade their current services. When they do this, a local field service technician performs the installation at the subscriber’s home, which may result in additional service charges. In addition, the subscriber is typically billed for the cost of the equipment installed and their RMR increases for the additional service offerings.
Operations
Our management team has a proven record of strong growth and operational excellence and, as a result of their leadership, we have successfully grown revenue and total RMR every year since 2006. Our CEO, Todd Pedersen, a visionary leader, encourages a highly entrepreneurial culture that fosters innovation, founded the Company in 1999. Our senior management team averages over 17 years of experience in high growth or large public companies. In connection with the Transactions, senior management and employees invested $155.2 million (a portion of which was used for the Investors’ acquisition of Solar) in the Company.
We are one of a few Smart Home solutions companies in North America that generates substantially all of its revenue organically from a fully integrated model that encompasses all aspects of the subscriber experience, including sales, installation, servicing and monitoring. This approach allows us to deliver a consistent, quality subscriber experience. We believe this contributes to a strong adoption rate for service packages beyond Smart Security and attrition rates at or below industry average. During the year ended December 31, 2014, 69% of new subscribers selected service packages beyond Smart Security. We also enhance the quality of our subscribers’ experience through proven operational performance. During the year ended December 31, 2014, our average response time to alarms was approximately 12 seconds from the time the signal was received at our monitoring stations. We believe the enhanced functionality of our offerings along with the introduction of innovative new service packages, results in increased subscriber usage. An average of 81% of our surveyed subscribers indicated use of their system at least once per week during the year ended December 31, 2014. We believe increased subscriber usage contributes to higher customer satisfaction and may lead to lower attrition.
Our fully integrated subscriber experience allows our sales representatives, customer service representatives and installation technicians to work closely together to provide the subscriber with an integrated process from contact origination to daily use. We believe our field service technicians and customer service representatives deliver a quality customer service experience that enhances our brand and improves customer satisfaction. Customer service representatives generally resolve a majority of maintenance and service related questions over the telephone or through remote-access to the subscriber’s system. We also believe we have higher Net Promoter Scores (a widely used measure of customer satisfaction and loyalty) than our primary competitors and we have been recognized by third-party organizations for providing outstanding customer service.
Field Service
We employ full-time field service technicians (“FSPs”) throughout North America, who reside in their service territories, to provide prompt service to our subscribers. FSPs undergo comprehensive training on our products and service packages. The FSPs typically focus on maintenance and service issues, but also install products and services for a portion of our new subscribers, primarily those originated through inside sales.
7
Table of Contents
We do not maintain costly physical warehouse, retail or office locations for our FSPs. Instead, we provide FSPs with adequate supplies of products and materials and a company-branded service vehicle. Field service inventories are replenished by shipments from our central warehouse.
We utilize software to schedule appointments, route technicians and follow-up with subscribers to ensure that the service was performed to the subscriber’s satisfaction. All of our full-time FSPs receive updates via a smartphone or tablet detailing their next service appointment or installation through our customer relationship management system (“CRM”).
Customer Service and Alarm Monitoring
Our customer service centers are located in Utah. Our two central monitoring facilities are located in Utah and Minnesota and are fully redundant. Both our customer service center and central monitoring facilities are open 24 hours a day, 7 days a week, and 365 days a year. We have received industry awards for our customer service and alarm monitoring operations.
All employees who work in customer service undergo training on billing related issues as well as service package questions. Customer service representatives are required to pass background checks and, depending upon their job function, may require licensing by the state of Utah. All professionals who work in our monitoring facilities undergo comprehensive training and are required to pass background checks and, in certain cases, licensing tests or other checks to obtain the required licensing. Customer service representatives generally resolve a majority of maintenance and service related questions over the telephone or through remote-access to the subscriber’s panel. Issues not resolved by customer service require a service technician to visit the subscriber’s home, which may result in a trip charge to the subscriber.
Billing
Our billing representatives are located in our Utah offices. We cross-train our billing representatives on customer service with the goal of improving the subscriber experience and to increase personnel flexibility. Billing representatives are also required to pass background checks and, depending upon their job function, may also require licensing by the state of Utah. A majority of our subscribers pay electronically either via ACH or credit card. A subscriber who pays electronically is generally placed on a billing cycle based on their contract origination date and, in certain instances, the subscriber may choose their billing date. Our customers billed via direct invoice are either billed on the first day of the month with payment due on the 25th day of the month, or on the 15th day of the month with payment due on the 10th day of the following month. Subscribers are billed in advance for their monthly services based on the subscriber’s billing cycle and not calendar month.
From time to time, for various reasons we may issue a credit to a subscriber for a payment otherwise due, including addressing subscriber concerns or obtaining the renewal of a subscriber contract. Any such credit decreases revenue and cash collected on the relevant subscriber contract in the amount of such credit.
Key Systems
In March 2014, we implemented our new CRM software, which is an integrated customer relationship management and billing system. The CRM is based on well-established enterprise-scale cloud solution. We believe this new CRM will scale with our business, providing the flexibility to accommodate the multiple customer support and billing models resulting from the anticipated expansion in our product and service packages over time. Historically, our internally developed relationship management system (“CMS”) was used by most of our departments for a wide variety of functions, including, but not limited to, new subscriber originations, customer support and inventory tracking in the field. Our new CRM replaced all CMS functionality except for field service inventory tracking, and enables one-call resolution. It also allows for operational efficiency by not requiring the entry of data multiple times and improving data accuracy. Additionally, the data is replicated to both a reporting and a business intelligence server to reduce processing time, as well as to an offsite server used for disaster recovery purposes.
Software Platform
Over 80% of our new subscribers installed in 2014 use our proprietary Vivint Sky platform, consisting of our SkyControl panel, equipment, cloud software, mobile application and online interface. The SkyControl panel is connected to the Internet and mobile devices through the Vivint Sky cloud software. The Vivint Sky platform enables subscribers using SkyControl to access their systems remotely either directly from the web or through our free Vivint Sky app and it facilitates
8
Table of Contents
communications between the panel and our monitoring stations. The Vivint Sky platform allows our subscribers the ability to remotely arm and disarm their SkyControl security systems, receive alerts and notifications regarding activity in their home, control home automation products such as thermostats, door locks, lighting controls and view live and recorded video.
Go!Control was our primary panel installed in new subscribers’ homes prior to the launch of Vivint Sky platform. We license certain communications infrastructure, software and services to support the Go!Control panel from Alarm.com. The Go!Control panel is also connected to the Internet and smart phone and tablet applications through Alarm.com’s hosted platform. Alarm.com also provides the web interface and technology to enable our subscribers using Go!Control panels to access their systems remotely and it facilitates communication between the panel and monitoring stations through third party cellular networks.
Subscriber Contracts – Security and Home Automation
We seek to ensure that our subscribers understand our product and service packages, along with the key terms of their contracts by conducting two live, interactive telephonic surveys with every subscriber. The first survey is conducted prior to the execution of the contract and installation, and the second survey is conducted after the installation is completed. These telephonic surveys are recorded and stored in our CRM, enabling easy access and review.
Term and Termination
Historically, we have offered contracts to subscribers that range in length from 36 to 60 months, subject to automatic monthly renewal after the expiration of the initial term. A majority of subscriber originations since the beginning of 2013 have 60 month contract lengths. Subscribers have a right of rescission period prescribed by applicable law during which such subscriber may cancel the contract without penalty or obligation. These rescission periods range from 3 to 15 days, depending on the jurisdiction in which a subscriber resides. As a company policy we provide new subscribers 70 years of age and older a 30 day right of rescission. Once the applicable rescission period expires, ownership of the equipment transfers to the subscriber and the subscriber is responsible for the monthly services fees under the contract.
Upfront and Monthly Services Fees
Our subscribers typically pay an activation fee (unless waived by us) and the first month’s service at the time of installation. Under the contract, we have the right to pass through to the subscriber any increase in third party costs such as utility or governmental expenses. We have the right to increase the monthly service fees at the time of renewal with prior written notice.
Other Terms
We provide our subscribers with maintenance free of charge for the first 120 days. After 120 days, we will repair or replace defective equipment without charge, but we typically bill the subscriber a trip charge for each service visit. If a utility or governmental agency requires a change to equipment or service after installation of the system, the subscriber must pay for the equipment and labor associated with the required change.
We do not provide insurance or warrant that the system will prevent a burglary, fire, hold-up or any such other event. Our contracts limit our liability to a maximum of $2,000 per event and, where permissible, provide a one-year statute of limitations to file an action against us. We may cease or suspend monitoring and repair service due to, among other things, work stoppages, weather, phone service interruption, government requirements, subscriber bankruptcy or non-payment by subscribers after we have given notice that their service is being cancelled due to such non-payment.
Suppliers
We provide our services through a panel installed at the premises of our subscribers. As of December 31, 2014, approximately 74% of our installed panels were 2GIG Go!Control panels, approximately 19% were SkyControl panels and approximately 7% were Honeywell LYNX and Vista panels. Since early 2014, our primary panel installed for new subscribers is the SkyControl panel. The 2GIG Go!Control panel was our primary panel for subscribers from the beginning of 2010 through early 2014. In fiscal 2013, we completed the 2GIG Sale as described above under “—Company Overview.” Pursuant to the terms of the 2GIG Sale, Nortek acquired all of the outstanding common stock of 2GIG for
9
Table of Contents
aggregate cash consideration of approximately $148.9 million. In connection with the 2GIG Sale, we retained sole ownership of the intellectual property and exclusive rights with respect to the next generation of our control panels and certain peripheral equipment. We expect this proprietary equipment will be a critical component of our future offerings. In addition, we entered into a five-year supply agreement with 2GIG, pursuant to which they will be the exclusive provider of our control panel requirements and certain peripheral equipment, subject to certain exceptions.
Generally, our third-party distributors maintain a safety stock of certain key items to cover any minor supply chain disruptions. Where possible we also utilize dual sourcing methods to minimize the risk of a disruption from a single supplier.
Sales and Marketing
We have two primary sales channels: direct-to-home and inside sales. For the year ended December 31, 2014, we generated approximately 76% of our new subscribers through our direct-to-home sales channel and 24% through inside sales. We believe our approach to managing our sales channels allows us to originate subscribers at a lower net subscriber acquisition cost (as a multiple of RMR) and achieve a higher adoption rate of new service packages compared to our competitors. Our net subscriber acquisition cost in 2014 was in the $1,900 to $1,950 range, a substantial portion of which is variable. Our net subscriber acquisition cost represented approximately 31 times our average RMR per new subscriber added in 2014. We are continually evaluating ways to improve the effectiveness of our subscriber acquisition activities in both our direct-to-home and inside sales channels.
Because we believe attrition is highly correlated with FICO scores and payment type, our compensation structure incentivizes quality subscriber generation by tying compensation to these factors. We have enhanced our underwriting criteria over time, resulting in an average FICO score of our subscriber portfolio of 714, with sub-600 FICO score subscribers representing only approximately 2% of our subscriber portfolio and approximately 94% of our subscribers having FICO scores of 625 or greater, as of December 31, 2014. We plan to maintain our focus on our underwriting standards and expect to continue to structure our sales compensation to incentivize sales representatives based on the creation of high-quality subscribers.
Direct-to-Home Sales
Our direct-to-home sales channel is typically comprised of between 2,000 and 2,500 sales representatives who benefit from our recruiting and training programs designed to promote professionalism and sales productivity. Each year, between April and August, our sales teams travel to approximately 100 pre-selected markets throughout North America to sell our product and service packages. Markets are selected each year based on a number of factors, including demographics, population density and our past experience selling in these markets. Because expenses associated with our direct-to-home sales channel are directly correlated with new subscriber acquisition, we avoid a large fixed cost base and are able to deploy a flexible go-to-market strategy every year. A typical sales team consists of approximately 20 sales representatives and a designated sales manager. Each sales team is supported by approximately 10 trained installation technicians, including a manager for the technicians. There are also regional managers who generally oversee six to eight sales or installation teams.
Inside Sales
Subscribers originated through our inside sales channel have grown as a percentage of our total originations from approximately 10% in 2009 to approximately 24% for the year ended December 31, 2014. Our inside sales channel utilizes both inbound and outbound leads provided by our marketing department to sell to subscribers in the United States and Canada. The marketing department generates leads through multiple sources, both digital and traditional. Leads generated through digital marketing sources include paid, organic and local search and display advertising. Traditional lead sources include radio advertising, shared mail, email remarketing and third-party lead generation affiliates. Upon receiving a lead or an inquiry from a potential subscriber requesting information on our products and service packages, one of our inside sales representatives calls the potential subscriber. Existing subscribers wishing to upgrade equipment or change their service packages are also processed through inside sales.
Sales and Origination Strategy and Compensation
Sales representatives receive compensation based on the number of qualifying sales during the previous week. Criteria for qualifying sales include, but are not limited to, the amount of RMR, the number of points of protection, subscriber FICO score, etc. To motivate sales representatives and help align compensation with subscriber quality, we have
10
Table of Contents
created a point system. The point system provides the sales representative flexibility to tailor the offering to the subscriber’s needs while maintaining control through a direct link to the sales representative’s compensation. In addition, a significant portion of the direct-to-home sales representative’s compensation is not paid until after the completion of the selling season and is paid only on those subscribers who satisfy certain criteria. In order to retain our sales professionals, we pay ongoing residual commissions to sales representatives and sales management for all active subscriber accounts generated by them. Sales management also receives residual commissions for active subscriber accounts generated by sales representatives working for that manager.
Strategy
Strong Platform for Growth
We have established a history of capitalizing on our business model and technology to offer new product and service packages, as evidenced by the launch of Smart Home products and services in 2011 and the Vivint Sky platform and SkyControl panel in early 2014. Our innovative products and service packages have enabled us to increase average RMR per new subscriber from $44.50 in 2009 to $61.89 for the year ended December 31, 2014. Going forward, we intend to capitalize on the low incremental costs inherent in our business model and existing technology to increase market penetration and inside sales. We expanded our business to New Zealand in 2013 and may consider expansion into other markets over time.
Innovation
We strive to bring easy-to-use technology to our subscribers, which allow them to efficiently use our products and services. As evidenced by the launch of our proprietary Vivint Sky platform in early 2014, we have a reputation for developing and deploying products and services for the home that have robust functionality and that are easy to install and use. Both our SkyControl and Go!Control panels provide a platform to introduce new products and service packages to our subscribers. Another example of our emphasis on providing innovative solutions to our subscribers is our acquisition of Space Monkey, Inc. (“Space Monkey”) in August 2014, which provides a data cloud storage technology solution that will integrate with our Vivint Sky platform. By focusing on innovation, and enhancing the functionality of our existing products and service packages, we believe we can increase subscriber usage and customer satisfaction, thereby potentially lowering our attrition.
To enhance the functionality of the products and services included in our systems, we use various third-party manufacturers and service providers in addition to our in-house development and design of certain products and services. We believe that developing, designing and selling our own products and services that are differentiated from those of our competitors will be a critical driver of our future success. Therefore, we expect to continue introducing new, innovative products and services, including panels and peripherals, along with integrated cloud services. We own the design of these new products, and in certain circumstances leverage partnerships with third parties, particularly Original Design Manufacturers for the manufacture of new products (e.g., video cameras, thermostats, door lock hardware, etc.). By vertically integrating the development and design of our products and services with our existing sales and customer service activities, we believe we are able to more quickly respond to market needs, and better understand our subscribers’ interactions and engagement with our products and services. This provides critical data enabling us to improve the power, usability and intelligence of these products and services.
We have invested in a new innovation center in Lehi, Utah to facilitate the research and development of new products and services, both within and beyond our existing service packages. Professionals and engineers at our innovation center have expertise in all aspects of the development process, including hardware development, software development, design and quality assurance.
Competition
The residential electronic security services industry is highly competitive, but fragmented. Our major competitors include The ADT Corporation, Protection One, Inc., Stanley Security Solutions, a subsidiary of Stanley Black and Decker, Monitronics International, Inc., a subsidiary of Ascent Capital Group, Inc., Tyco Integrated Security, a subsidiary of Tyco International Ltd., Comcast Corporation, AT&T Inc. and numerous smaller providers with regional or local coverage. We also face, or may in the future face, competition from other providers of information and communication products and services, a number of which have significantly greater capital and other resources than we do.
Companies in our industry compete primarily on the basis of price in relation to the quality of the products and services they provide. The Company’s brand and reputation, market visibility, service and product capabilities, quality, price, efficient
11
Table of Contents
direct-to-home sales channel and the ability to identify and sell to prospective customers are all factors that contribute to competitive success in the residential electronic services industry. We emphasize the quality of the service we provide, rather than focusing primarily on price competition. We believe we compete effectively against other national, regional and local security alarm monitoring companies by offering our subscribers an attractive value proposition combined with our proven, award-winning customer service.
Although we face additional competition from new competitors such as cable and telecommunications companies, having installed over 1.5 million integrated security systems we believe we are well positioned to compete with them because we benefit from more than 16 years of experience, our efficient direct-to-home sales channel and our award-winning customer service.
Intellectual Property
Patents, trademarks, copyrights, trade secrets, and other proprietary rights are important to our business and we continuously refine our intellectual property strategy to maintain and improve our competitive position. We seek protection on new intellectual property to protect our ongoing technological innovations and strengthen our brand, and we believe we take appropriate action against infringements or misappropriations of our intellectual property rights by others. We review third-party intellectual property rights to help avoid infringement, and to identify strategic opportunities. We typically enter into confidentiality agreements to further protect our intellectual property.
We own a portfolio of issued U.S. patents and pending U.S. and foreign patent applications that relate to a variety of security, home automation and wireless internet technologies utilized in our business. We also own a portfolio of trademarks, including domestic and foreign registrations for Vivint®, and are a licensee of various patents, from our third-party suppliers and technology partners. Due to the importance that customers place on reputation and trust when making a decision on a security provider, our brand is critical to our business. Patents for individual products or technologies extend for varying periods according to the date of patent filing or grant and the legal term of patents in the various countries where patent protection is being sought. Trademark rights may potentially extend for longer periods of time and are dependent upon national laws and use of the marks.
Government Regulations
United States
We are subject to a variety of laws, regulations and licensing requirements of federal, state and local authorities.
We are also required to obtain various licenses and permits from state and local authorities in connection with the operation of our businesses. The majority of states regulate in some manner the sale, installation, servicing, monitoring or maintenance of electronic security systems. In the states that do regulate such activity, security service companies and their employees are typically required to obtain and maintain licenses, certifications or similar permits from the state as a condition to engaging in the security services business.
In addition, a number of local governmental authorities have adopted ordinances regulating the activities of security service companies, typically in an effort to reduce the number of false alarms in their jurisdictions. These ordinances attempt to reduce false alarms by, among other things, requiring permits for individual electronic security systems, imposing fines (on either the subscriber or the company) for false alarms, discontinuing police response to notification of an alarm activation after a subscriber has had a certain number of false alarms, and requiring various types of verification prior to dispatching authorities.
The sales and marketing practices of security service companies are regulated by the federal, state and local agencies. These laws and regulations typically place restrictions on the manner in which electronic security products and services can be advertised and sold, and to provide residential purchasers with certain rescission rights. In certain circumstances, consumer protection laws also require the disclosure of certain information in the contract between the security services company and the subscriber and, in addition, may prohibit the inclusion of certain terms or conditions of sale in such contracts.
12
Table of Contents
Canada
Companies operating in the electronic security service industry in Canada are subject to provincial regulation of their business activities, including the regulation of direct-to-home sales activities and contract terms and the sale, installation and maintenance of electronic security systems. Most provinces in Canada regulate direct-to-home sales activities and contract terms and require that salespeople and the company on whose behalf the salesperson is selling obtain licenses to carry on business in that province. Consumer protection laws in Canada also require that certain terms and conditions be included in the contract between the electronic security services provider and the subscriber.
A number of Canadian municipalities require subscribers to obtain licenses to use electronic security alarms within their jurisdiction. Municipalities also commonly require entities engaged in direct-to-home sales within their municipality to obtain business licenses.
Customers
Our business is not dependent on any single customer or a few customers, the loss of which would have a material adverse effect on the respective market or on us as a whole. No individual customer accounted for more than 10% of our consolidated 2014 revenue.
Seasonality
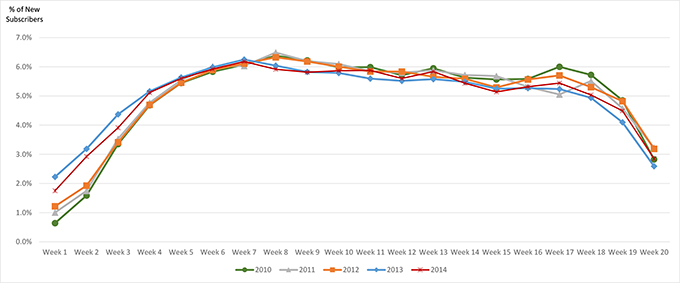
Our direct-to-home sales are seasonal in nature with a substantial majority of our new subscriber originations occurring during a sales season from April through August. We make investments in the recruitment of our direct-to-home sales force and the inventory prior to each sales season. We experience increases in net subscriber acquisition costs during these time periods.
The management of our sales channels has historically resulted in a consistent sales pattern that enables us to more accurately forecast subscriber originations. The chart below depicts the percentage of new subscribers originated each week of the April through August sales season in 2014, 2013, 2012, 2011 and 2010.
Segment Information
Prior to the date of the 2GIG Sale, the Company conducted business through two segments, Vivint and 2GIG. These segments were managed and evaluated separately by management due to the differences in their products and services. We operate primarily in three geographic regions: United States, Canada and New Zealand. The operations in New Zealand are considered immaterial and are reported in conjunction with the United States. See Note 17 in the accompanying consolidated financial statements for more information about our business and geographic segments.
13
Table of Contents
Employees
As of December 31, 2014, we had approximately 3,200 full-time employees, excluding our seasonal direct-to-home installation technicians, sales representatives and certain other support professionals. None of our employees are currently represented by labor unions or trade councils. We believe that we generally have good relationships with our employees. The majority of our employees are located in the Salt Lake City metropolitan area. Employees located outside of the Salt Lake City metropolitan area are primarily comprised of our FSPs, who service our subscribers and are located in all states in the United States except Maine and Vermont and all Canadian provinces except Quebec, and the monitoring professionals located at our monitoring station in South St. Paul, Minnesota.
Corporate Information
APX Group Holdings, Inc. was incorporated under the laws of the state of Delaware on October 26, 2012. Our principal executive offices are located at 4931 North 300 West, Provo, Utah 84604 and our telephone number is (801) 377-9111.
| ITEM 1A. | RISK FACTORS |
You should carefully consider the following risk factors and all other information contained in this annual report on Form 10-K. The risks and uncertainties described below are not the only risks facing us. Additional risks and uncertainties that we are unaware of, or those we currently deem immaterial, also may become important factors that affect us. The following risks could materially and adversely affect our business, financial condition, cash flows or results of operations.
Risks Related To Our Business
Our industry is highly competitive.
We operate in a highly competitive industry. We face competition from several large electronic residential security companies that have or may have greater capital and other resources than us. We also face, and may in the future face, competition from other providers of information and communication products and services, including cable and telecommunications companies, that may have greater capital and resources than us. Competitors that are larger in scale and have greater resources may benefit from greater economies of scale and other lower costs that permit them to offer more favorable terms to consumers (including lower service costs) than we offer, causing such consumers to choose to enter into contracts with such competitors. For instance, cable and telecommunications companies are expanding into the monitored security industry and are bundling their existing offerings with monitored security services. In some instances, it appears that the monitored security services component of such bundled offerings is significantly underpriced and, in effect, subsidized by the rates charged for the other services offered by these companies. These pricing alternatives may influence subscribers’ desire to subscribe to our services at rates and fees we consider appropriate. These competitors may also benefit from greater name recognition and superior advertising, marketing and promotional resources. To the extent that such competitors allocate greater resources to markets where our business is more highly concentrated, the negative impact on our business may increase over time. In addition to potentially reducing the number of new subscribers we are able to originate, increased competition could also result in higher attrition rates that would negatively impact us over time. The benefit offered to larger competitors from economies of scale and other lower costs may be magnified by an economic downturn in which subscribers put a greater emphasis on lower cost products or services. In addition, we face competition from regional competitors that concentrate their capital and other resources in targeting local markets.
We also face potential competition from improvements in do-it-yourself (“DIY”) and self-monitoring systems, which enable consumers to install their own systems and monitor and control their home environment, without third-party involvement or the need for a subscription agreement, through the Internet, text messages, emails or similar communications. Continued pricing pressure or improvements in technology and shifts in consumer preferences towards DIY and self-monitoring could adversely impact our subscriber base or pricing structure and have a material and adverse effect on our business, financial condition, results of operations and cash flows.
We resist competing on price alone because we believe we have competitive advantages such as a reputation for a high level of service and security. However, with cable and telecommunications companies actively targeting the Smart Home market and expanding into the monitored security space, and with large technology companies expanding into the connected home market through the development of their own solutions or the acquisition of other companies with Smart Home solution offerings, this increased competition could result in pricing pressure, a shift in customer preferences
14
Table of Contents
towards the services of these companies and reduce our market share. Continued pricing pressure from these competitors or failure to achieve pricing based on the competitive advantages previously identified above could prevent us from maintaining competitive price points for our products and services resulting in lost customers or in our inability to attract new customers and have an adverse effect on our business, financial condition, results of operations and cash flows.
We rely on long-term retention of subscribers and subscriber attrition can have a material adverse effect on our results.
We incur significant upfront costs to originate new subscribers. Accordingly, our long-term performance is dependent on our subscribers remaining with us for several years after the initial term of their contracts, which is generally between 36 and 60 months. A significant reason for attrition occurs when subscribers relocate and do not reconnect. Subscriber relocations are impacted by changes in the housing market. See “—Our business is subject to macroeconomic and demographic factors that may negatively impact our results of operations.” Some other factors that can increase subscriber attrition include problems experienced with our product or service quality, unfavorable general economic conditions, and the preference for lower pricing of competitors’ products and services over ours. If we fail to keep our customers for a sufficiently long period of time, our profitability, business, financial condition, results of operations and cash flows could be materially and adversely affected. Our inability to retain subscribers for a long term could materially and adversely affect our business, financial condition, cash flows or results of operations.
In addition, we amortize or depreciate our capitalized subscriber acquisition costs based on the estimated life of the subscriber relationships. If attrition rates were to rise significantly, we may be required to accelerate the amortization of expenses or the depreciation of assets related to such subscribers or to impair such assets, which could adversely impact our reported GAAP financial results.
Litigation, complaints or adverse publicity could negatively impact our business, financial condition and results of operations.
From time to time, we engage in the defense of, and may in the future be subject to, certain claims and lawsuits arising in the ordinary course of our business. For example, we have been named as defendants in putative class actions alleging violations of wage and hour laws, the Telephone Consumer Protection Act, common law privacy and consumer protection laws. In addition, we understand that the U.S. Attorney’s office for the District of Utah is engaged in an investigation that we believe relates to certain political contributions made by some of our executive officers and employees. From time to time our subscribers have communicated and may in the future communicate complaints to consumer protection groups and other organizations such as the Better Business Bureau, regulators, law enforcement or the media. Any resulting actions or negative subscriber sentiment or publicity may reduce the volume of our new subscriber originations or increase attrition of existing subscribers. Any of the foregoing may materially and adversely affect our business, financial condition, cash flows or results of operations.
Given our relationship with Vivint Solar and the fact that Vivint Solar uses our registered trademark, “Vivint”, in its name pursuant to a licensing agreement, our subscribers and potential subscribers may associate us with any problems experienced with Vivint Solar or adverse publicity related to their business. Because we have no control over Vivint Solar, we may not be able to take remedial action to cure any issues Vivint Solar has with its customers, and our trademark, brand and reputation may be adversely affected.
We are highly dependent on our ability to attract, train and retain an effective sales force.
Our business is highly dependent on our ability to attract, train and retain an effective sales force, especially for our peak April through August sales season. In addition, because sales representatives become more productive as they gain experience, retaining those individuals is very important for our success. If we are unable to attract, train and retain an effective sales force, our business, financial condition, cash flows or results of operations could be adversely affected.
Our operations depend upon telecommunication services providers to transmit signals to our third-party providers and our monitoring stations.
Our operations depend upon cellular and other telecommunications providers to communicate signals to and from our monitoring stations and subscribers in a timely, cost-efficient and consistent manner. The failure of one or more of these providers to transmit and communicate signals in a timely manner could affect our ability to provide services to our subscribers. There can be no assurance that third-party telecommunications providers and signal-processing centers will continue to transmit and communicate signals to our third-party providers and the monitoring stations without disruption. Any such disruption, particularly one of a prolonged duration, could have a material adverse effect on our business. In addition, failure to renew contracts with existing providers or to contract with other providers on commercially acceptable terms or at all may adversely impact our business.
15
Table of Contents
Certain elements of our operating model have historically relied on our subscribers’ continued selection and use of traditional landline telecommunications to transmit signals to our monitoring stations and to provide services to our subscribers. There is a growing trend for consumers to switch to the exclusive use of cellular, satellite or Internet communication technology in their homes, and telecommunication providers may discontinue their landline services in the future. In addition, many of our subscribers who use cellular communication technology for their systems use products that rely on older 2G technology, and certain telecommunication providers have discontinued 2G services in certain markets, and these and other telecommunication providers may discontinue 2G services in other markets in the future. The discontinuation of landline, 2G and any other services by telecommunications providers in the future would require subscribers to upgrade to alternative, and potentially more expensive, technologies. This could increase our subscriber attrition rates and slow our new subscriber originations. To maintain our subscriber base that uses components that are or could become obsolete, we may be required to upgrade or implement new technologies, including by offering to subsidize the replacement of subscribers’ outdated systems at our expense. Any such upgrades or implementations could require significant capital expenditures and also divert management’s attention and other important resources away from our customer service and new subscriber origination efforts.
Our interactive services are accessed through the Internet and our security monitoring services are increasingly delivered using Internet technologies. Some providers of broadband access may take measures that affect their customers’ ability to use these products and services, such as degrading the quality of the data packets we transmit over their lines, giving those packets low priority, giving other packets higher priority than ours, blocking our packets entirely or attempting to charge their customers more for using our services. In the U.S., there continues to be some uncertainty regarding whether suppliers of broadband Internet access have a legal obligation to allow their customers to access services such as ours without interference. In addition, the Federal Communications Commission (“FCC”) recently adopted net neutrality rules that may impact some aspects of our business. Because these rules are new, we do not yet know the impact the rules may have on our business. Interference with our services or higher charges to customers by broadband service providers for using our products and services could cause us to lose existing subscribers, impair our ability to attract new subscribers and materially and adversely affect our business, financial condition, results of operations and cash flows.
In addition, telecommunication services providers are subject to extensive regulation in the markets where we operate or may expand in the future. Changes in the applicable laws or regulations affecting telecommunication services could require us to change the way we operate, which could increase costs or otherwise disrupt our operations, which in turn could adversely affect our business, financial condition, cash flows or results of operations.
We must successfully upgrade and maintain our information technology systems.
We rely on various information technology systems to manage our operations. We are currently implementing modifications and upgrades to these systems, and have replaced our legacy systems with successor systems with new functionality.
There are inherent costs and risks associated with replacing and changing these systems and implementing new systems, including potential disruption of our internal control structure, substantial capital expenditures, additional administration and operating expenses, retention of sufficiently skilled personnel to implement and operate the new systems, demands on management time and other risks and costs of delays or difficulties in transitioning to new systems or of integrating new systems into our current systems. For example, we encountered issues associated with the implementation of our new integrated CRM system, which resulted in an immaterial error in our financial statements for the quarter ended June 30, 2014. This error was corrected during the quarter ended September 30, 2014. As a result of the issues encountered associated with the CRM implementation, we also issued a significant number of billing-related subscriber credits during the year ended December 31, 2014, which reduced our revenue. While management makes efforts to identify and remediate issues, we can provide no assurance that our remediation efforts will be successful or that we will not encounter additional issues as we complete the implementation of these and other systems. In addition, our information technology system implementations may not result in productivity improvements at a level that outweighs the costs of implementation, or at all. The implementation of new information technology systems may also cause disruptions in our business operations and have an adverse effect on our business, cash flows and operations.
Privacy and data protection laws, privacy or data breaches, or the loss of data could have a material adverse effect on our business.
In the course of our operations, we gather, process, transmit and store subscriber information, including personal, payment, credit and other similar confidential and private information. We use some of this information for operational and marketing purposes and rely on proprietary and commercially available systems, software, tools and monitoring to provide security for such information.
16
Table of Contents
Our collection, retention, transfer and use of this information is regulated by privacy and data protection laws and regulations and industry standards. Our compliance with these laws, regulations and standards increases our operating costs, and additional laws, regulations or standards (and new interpretations of existing laws and regulations) in these areas may further increase our operating costs and adversely affect our ability to effectively market our products and services. Our failure to comply with any of these laws, regulations or standards could result in a loss of subscriber data, fines, sanctions and other liabilities and additional restrictions on our collection, transfer or use of subscriber data. In addition, our failure to comply with any of these laws, regulations or standards could result in a material adverse effect on our reputation, subscriber attrition, new subscriber origination, financial condition, cash flows or results of operations.
Criminals and other nefarious actors are using increasingly sophisticated methods, including cyber-attacks, to capture or alter various types of information relating to subscribers, to engage in illegal activities such as fraud and identity theft, and to expose and exploit potential security and privacy vulnerabilities in corporate systems and web sites. Unauthorized intrusion into the portions of our systems and data storage devices that process and store subscriber information, including but not limited to subscriber transactions and other confidential and private information or the loss of such information, may result in negative consequences. In addition, third parties, including our partners and vendors, could also be a source of security risk to us in the event of a failure of their own security systems and infrastructure. Moreover, we cannot be certain that advances in criminal capabilities, new discoveries in the field of cryptography or other developments will not compromise or breach the technology protecting the networks that access our products and services. Any such compromises or breaches to the systems or loss of data, whether by us, our partners and vendors, or other third parties or as a result of employee error or malfeasance or otherwise, could cause interruptions in operations and damage to our reputation, subject us to costs and liabilities and materially and adversely affect sales, revenues and profits, which in turn could have a material adverse impact on our business, financial condition, cash flows or results of operations.
We are subject to payment related risks.
We accept payments using a variety of methods, including credit card, debit card, direct debit from customer’s bank account, and consumer invoicing. For existing and future payment options we offer to our customers, we may become subject to additional regulations, compliance requirements, and fraud. For certain payment methods, including credit and debit cards, we pay interchange and other fees, which may increase over time and raise our operating costs and lower profitability. We rely on third parties to provide payment processing services, including the processing of credit cards, debit cards, and electronic checks, and it could disrupt our business if these companies become unwilling or unable to provide these services to us. We are also subject to payment card association operating rules, including data security rules, certification requirements, and rules governing electronic funds transfers, which could change or be reinterpreted to make it difficult or impossible for us to comply. If we fail to comply with these rules or requirements, or if our data security systems are breached or compromised, we may be liable for card issuing banks’ costs, subject to fines and higher transaction fees, and lose our ability to accept credit and debit card payments from our customers, process electronic funds transfers, or facilitate other types of online payments, and our business and operating results could be adversely affected.
We may fail to obtain or maintain necessary licenses or otherwise fail to comply with applicable laws and regulations.
Our business is subject to a variety of laws, regulations and licensing requirements and may become subject to additional such requirements in the future. In addition, in certain jurisdictions, we are required to obtain licenses or permits to comply with standards governing servicing of subscribers, monitoring station employee selection and training and to meet certain standards in the conduct of our business. Although we believe we are in material compliance with all applicable laws, regulations, and licensing requirements, in the event that these laws, regulations or licensing requirements change, we may be required to modify our operations or to utilize resources to maintain compliance with such laws and regulations. Our failure to comply with such laws, regulations or licensing requirements as may be in effect from time to time could have a material adverse effect on us.
If we expand the scope of our products or services, or our operations in new markets, we may be required to obtain additional licenses and otherwise maintain compliance with additional laws, regulations or licensing requirements.
New laws, regulations or licensing requirements may be enacted that could have an adverse effect on us. For example, certain U.S. municipalities have adopted, or are considering adopting, laws, regulations or policies aimed at reducing the number of false alarms, including: (i) subjecting companies to fines or penalties for transmitting false alarms, (ii) imposing fines on subscribers for false alarms, or (iii) imposing limitations on law enforcement response. These measures could adversely affect our future operations and business by increasing our costs, reducing customer satisfaction or affecting the public perception of the effectiveness of our products and services. In addition, federal, state and local governmental authorities have considered, and may in the future consider, implementing consumer protection rules and regulations, which could impose significant constraints on our sales channels.
17
Table of Contents
Regulations have been issued by the Federal Trade Commission (“FTC”), FCC, and Canadian Radio-Television and Telecommunications Commission (“CRTC”) that place restrictions on direct-to-home marketing, telemarketing, email marketing and general sales practices. These restrictions include, but are not limited to, limitations on methods of communication, requirements to maintain a “do not call” list, cancellation rights and required training for personnel to comply with these restrictions. On July 1, 2014, the Canadian Anti-Spam Law (“CASL”) regulations went into effect in Canada. The CRTC has enforcement authority under CASL. CASL prohibits the sending of commercial emails without prior consent of the consumer or an existing business relationship and sets forth rules governing the sending of commercial emails. CASL allows for a private right of action for the recovery of damages or provides for enforcement by CRTC permitting the recovery of significant civil penalties, costs and attorneys’ fees in the event that regulations are violated. Changes in regulations or the interpretation of such regulations could have a material adverse effect on our business, financial condition, cash flows or results of operations.
Increased adoption of laws purporting to characterize certain charges in our subscriber contracts as unlawful, may adversely affect our operations.
If a subscriber cancels prior to the end of the initial term of the contract, other than in accordance with the contract, we may, under the terms of the subscriber contract, charge the subscriber the amount that would have been paid over the remaining term of the contract. Several states have adopted, or are considering adopting, laws restricting the charges that can be imposed upon contract cancellation prior to the end of the initial contract term. Such initiatives could negatively impact our business and have a material adverse effect on our business, financial condition, cash flows or results of operations. Adverse judicial determinations regarding these matters could increase legal exposure to subscribers against whom such charges have been imposed and the risk that certain subscribers may seek to recover such charges through litigation. In addition, the costs of defending such litigation and enforcement actions could have an adverse effect on our business, financial condition, cash flows or results of operations.
Our new products and services may not be successful.
We launched our energy management and Smart Home products and services in June 2010 and April 2011, respectively. We launched our wireless Internet on a limited basis during 2013 and our proprietary Vivint Sky cloud solution and new SkyControl panel in early 2014. In 2014, we also began offering a localized cloud based data storage product and service on a limited basis. We anticipate launching additional products and services in the future. These products and services and the new products and services we may launch in the future may not be well-received by our subscribers, may not help us to generate new subscribers and may adversely affect the attrition rate of existing subscribers. Any profits we may generate from these or other new products or services may be lower than profits generated from our other products and services and may not be sufficient for us to recoup our development or subscriber acquisition costs incurred. New products and services may also have lower gross margins, particularly to the extent that they do not fully utilize our existing infrastructure. In addition, new products and services may require increased operational expenses or subscriber acquisition costs and present new and difficult technological challenges that may subject us to claims or complaints if subscribers experience service disruptions or failures or other quality issues. To the extent our new products and services are not successful, it could have a material adverse effect on our business, financial condition, cash flows or results of operations.
The technology we employ may become obsolete, which could require significant capital expenditures.
Our industry is subject to continual technological innovation. Our products and services interact with the hardware and software technology of systems and devices located at our subscribers’ property. We may be required to implement new technologies or adapt existing technologies in response to changing market conditions, subscriber preferences or industry standards, which could require significant capital expenditures. It is also possible that one or more of our competitors could develop a significant technical advantage that allows them to provide additional or superior products or services, or to lower their price for similar products or services, that could put us at a competitive disadvantage. Our inability to adapt to changing technologies, market conditions or subscriber preferences in a timely manner could have a material adverse effect on our business, financial condition, cash flows or results of operations.
Our future operating results are uncertain.
Prior growth rates in revenues and other operating and financial results should not be considered indicative of our future performance. Our future performance and operating results depend on, among other things: (i) our ability to renew and/or upgrade contracts with existing subscribers and maintain customer satisfaction with existing subscribers; (ii) our ability to generate new subscribers, including our ability to scale the number of new subscribers generated through inside sales and other channels; (iii) our ability to increase the density of our subscriber base for existing service locations or continue to expand into new geographic markets; (iv) our ability to successfully develop and market new and innovative
18
Table of Contents
products and services; (v) the level of product, service and price competition; (vi) the degree of saturation in, and our ability to further penetrate, existing markets; (vii) our ability to manage growth, revenues, origination or acquisition costs of new subscribers and attrition rates, the cost of servicing our existing subscribers and general and administrative costs; and (viii) our ability to attract, train and retain qualified employees. If our future operating results suffer as a result of any of the other reasons mentioned above, or any other reasons, there could be a material adverse effect on our business, financial condition, cash flows or results of operations.
Our business is subject to macroeconomic, microeconomic and demographic factors that may negatively impact our results of operations.
Our business is generally dependent on national, regional and local economic conditions. Historically, both the U.S. and worldwide economies have experienced cyclical economic downturns, some of which have been prolonged and severe. These economic downturns have generally coincided with, and contributed to, increased energy costs, concerns about inflation, slower economic activity, decreased consumer confidence and spending, reduced corporate profits and capital spending, adverse business conditions and liquidity concerns. These conditions and concerns result in a decline in business and consumer confidence and increased unemployment.
Where disposable income available for discretionary spending is reduced (due to, for example, higher housing, energy, interest or other costs or where the perceived wealth of subscribers has decreased) and disruptions in the financial markets adversely impact the availability and cost of credit, our business may experience increased attrition rates, a reduced ability to originate new subscribers and reduced consumer demand. For instance, recoveries in the housing market increase the occurrence of relocations which may lead to subscribers disconnecting service and not contracting with us in their new homes. We cannot predict the timing or duration of any economic slowdown or the timing or strength of a subsequent economic recovery, worldwide, or in the specific markets where our subscribers are located.
Furthermore, any deterioration in new construction and sales of existing single-family homes could reduce opportunities to originate new subscribers and increase attrition among our existing subscribers. Such downturns in the economy in general, and the housing market in particular may negatively affect our business.
In addition, unfavorable shifts in population and other demographic factors may cause us to lose subscribers as people migrate to markets where we have little or no presence, or if the general population shifts into a less desirable age, geographic or other demographic group from our business perspective.
Also, our subscribers consist largely of homeowners, who are subject to economic, credit, financial and other risks, as applicable. These risks could materially and adversely affect a subscriber’s ability to make required payments to us on a timely basis. Any such decrease or delay in subscriber payments may have a material adverse effect on us. As a result of financial distress, subscribers may apply for relief under bankruptcy and other laws relating to creditors’ rights. In addition, subscribers may be subject to involuntary application of such bankruptcy and other laws relating to creditors’ rights. The bankruptcy of a subscriber could adversely affect our ability to collect payments, to protect our rights, and otherwise realize the value of our contract with the subscriber. This may occur as a result of, among other things, application of the automatic stay, delays and uncertainty in the bankruptcy process and potential rejection of such subscriber contracts. Our subscribers’ inability to pay, whether as a result of economic or credit issues, bankruptcy or otherwise, could have a material adverse effect on our financial condition, cash flows or and results of operations.
We depend on a limited number of suppliers to provide our products, which, in turn, rely on a limited number of suppliers to provide significant components and materials used in our products. A change in our existing preferred supply arrangements or a material interruption in supply of products could increase our costs or prevent or limit our ability to accept and fill orders for our products and services.
We provide our services through a panel installed at the premises of our subscribers. As of December 31, 2014, approximately 74% of our installed panels were 2GIG Go!Control panels, approximately 19% were SkyControl panels and approximately 8% were Honeywell LYNX or Vista panels. Since early 2014, our primary panel installed is the SkyControl panel. The 2GIG Go!Control panel was our primary panel for subscribers from 2010 through early 2014. In fiscal 2013, we completed the 2GIG Sale. In connection with the 2GIG Sale, we retained sole ownership of the intellectual property and exclusive rights with respect to the SkyControl panel and certain peripheral equipment. We expect this proprietary equipment will be a critical component of our future service offerings. In addition, we entered into a five-year supply agreement with 2GIG, pursuant to which they will be the exclusive provider of our control panel requirements, subject to certain exceptions. Upon the expiration or earlier termination of the initial term of this supply agreement, there can be no assurance that we will be able to renew our supply arrangements with 2GIG on commercially reasonable terms or at all. Any adverse change in, or the cessation of, the relationship between us and 2GIG could expose us to a significant increase in equipment costs.
19
Table of Contents
In addition to 2GIG, we obtain important components of our systems from several other suppliers. Should 2GIG or such other suppliers cease to manufacture the products we purchase from them or become unable to timely deliver these products in accordance with our requirements, or should such other suppliers choose not to do business with us, we may be required to locate alternative suppliers. In addition, any financial or other difficulties our suppliers face may have negative effects on our business. We may be unable to locate alternate suppliers on a timely basis or to negotiate the purchase of control panels or other equipment on favorable terms, if at all. In addition, our equipment suppliers, in turn, depend upon a limited number of outside unaffiliated suppliers for key components and materials used in our control panels and other equipment. If any of these suppliers cease to or are unable to provide components and materials in sufficient quantity and of the requisite quality, especially during our summer selling season when a large percentage of our new subscriber originations occur, and if there are not adequate alternative sources of supply, we could experience significant delays in the supply of control panels and other equipment. Any such delay in the supply of control panels and other equipment of the requisite quality could adversely affect our ability to originate subscribers and cause our subscribers not to continue, renew or upgrade their contracts or to choose not to purchase such products or services from us. This would result in delays in or loss of future revenues and could have a material adverse effect on our business, financial condition, cash flows or results of operations. Also, if previously installed components and materials were found to be defective, we might not be able to recover the costs associated with the recall, repair or replacement of such products, across our installed customer base, and the diversion of personnel and other resources to address such issues could have a material adverse effect on our financial condition, cash flows or results of operations.
We rely on certain third-party providers of licensed software and services integral to the operations of our business.
Certain aspects of the operation of our business depend on third-party software and service providers. We rely on certain software technology that we license from third parties and use in our products and services to perform key functions and provide critical functionality. For example, the Go!Control panel used by most of our subscribers is connected to the Internet and smart phone applications through web interface and technology hosted by Alarm.com. With regard to licensed software technology, we are, to a certain extent, dependent upon the ability of third parties to maintain, enhance or develop their software and services on a timely and cost-effective basis, to meet industry technological standards and innovations to deliver software and services that are free of defects or security vulnerabilities, and to ensure their software and services are free from disruptions or interruptions. Further, these third-party services and software licenses may not always be available to us on commercially reasonable terms or at all.
If our agreements with third-party software or services vendors are not renewed or the third-party software or services become obsolete, fail to function properly, are incompatible with future versions of our products or services, are defective or otherwise fail to address our needs, there is no assurance that we would be able to replace the functionality provided by the third-party software or services with software or services from alternative providers. Furthermore, even if we obtain licenses to alternative software or services that provide the functionality we need, we may be required to replace hardware installed at our monitoring stations and at our subscribers’ homes, including security system control panels and peripherals, to affect our integration of or migration to alternative software products. Any of these factors could have a material adverse effect on our financial condition, cash flows or results of operations.
We are subject to unionization and labor and employment laws and regulations, which could increase our costs and restrict our operations in the future.
Currently, none of our employees are represented by a union. From time to time, however, attempts may be made to organize all or part of our employee base. As we continue to grow, and enter different regions, unions may make further attempts to organize all or part of our employee base. If some or all of our workforce were to become unionized, and the terms of the collective bargaining agreement were significantly different from our current compensation arrangements, it could increase our costs and adversely impact our profitability. Additionally, responding to such organization attempts could distract our management and result in increased legal and other professional fees; and, potential labor union contracts could put us at increased risk of labor strikes and disruption of our operations.
20
Table of Contents
Our business is subject to a variety of employment laws and regulations and may become subject to additional such requirements in the future. Although we believe we are in material compliance with applicable employment laws and regulations, in the event of a change in requirements, we may be required to modify our operations or to utilize resources to maintain compliance with such laws and regulations. Moreover, we may be subject to various employment-related claims, such as individual or class actions or government enforcement actions relating to alleged employment discrimination, employee classification and related withholding, wage-hour, labor standards or healthcare and benefit issues. Our failure to comply with applicable employment laws and regulations and related legal actions against us, may affect our ability to compete or have a material adverse effect on our business, financial condition, cash flows or results of operations.
The loss of our senior management could disrupt our business.
Our senior management is important to the success of our business because there is significant competition for executive personnel with experience in the security and home automation industry and our sales channels. As a result of this need and the competition for a limited pool of industry-based executive experience, we may not be able to retain our existing senior management. In addition, we may not be able to fill new positions or vacancies created by expansion or turnover. Moreover, with the exception of our Chief Executive Officer, we do not and do not currently expect to have in the future “key person” insurance on the lives of any other member of our senior management. The loss of any member of our senior management team without retaining a suitable replacement (either from inside or outside our existing management team) could have a material adverse effect on our business, financial condition, cash flows or results of operations.
If we are unable to acquire necessary intellectual property or adequately protect our intellectual property, we could be competitively disadvantaged.
Our intellectual property, including our patents, trademarks, copyrights, trade secrets, and other proprietary rights, constitutes a significant part of our value. Our success depends, in part, on our ability to protect our intellectual property against dilution, infringement and competitive pressure by defending our intellectual property rights. To protect our intellectual property rights, we rely on a combination of patent, trademark, copyright and trade secret laws of the U.S., Canada and other countries, as well as contract provisions. In addition, we make efforts to acquire rights to intellectual property necessary for our operations. However, there can be no assurance that these measures will be successful in any given case, particularly in those countries where the laws do not protect our proprietary rights as fully as in the U.S.
If we fail to acquire necessary intellectual property or adequately protect or assert our intellectual property rights, competitors may dilute our brands or manufacture and market similar products and services or convert our subscribers, which could adversely affect our market share and results of operations. We may not receive patents or trademarks for all our pending patent and trademark applications, and existing or future patents or licenses may not provide competitive advantages for our products and services. Our competitors may challenge, invalidate or avoid the application of our existing or future intellectual property rights that we receive or license. In addition, patent rights may not prevent our competitors from developing, using or selling products or services that are similar to or address the same market as our products and services. The loss of protection for our intellectual property could reduce the market value of our brands and our products and services, reduce new subscriber originations or upgrade sales to existing subscribers, lower our profits, and could have a material adverse effect on our business, financial condition, cash flows or results of operations.
From time to time, we are subject to claims for infringing the intellectual property rights of others, and will be subject to such claims in the future, which could have an adverse effect on our business and operations.
We cannot be certain that our products and services do not and will not infringe the intellectual property rights of others. We have been in the past, and may be in the future, subject to claims based on allegations of infringement or other violations of the intellectual property rights of others, including litigation brought by special purpose or so-called “non-practicing” entities that focus solely on extracting royalties and settlements by enforcing patent rights. Regardless of their merits, intellectual property claims divert the attention of our personnel and are often time-consuming and expensive. In addition, to the extent claims against us are successful, we may have to pay substantial monetary damages or discontinue or modify certain products or services that are found to infringe another party’s rights or enter into licensing agreements with costly royalty payments. We have in the past and will continue in the future to seek one or more licenses to continue offering certain products or services, which could have a material adverse effect on our business, financial condition, cash flows or results of operations.
21
Table of Contents
We have identified a material weakness in our internal control over financial reporting. If we fail to maintain effective internal control over financial reporting at a reasonable assurance level, we may not be able to accurately report our financial results, which could have a material adverse effect on our operations, investor confidence in our business and the trading prices of our securities.
In connection with the preparation and audit of our consolidated financial statements for the year ended December 31, 2014, we along with our independent registered public accounting firm identified a material weakness in the internal control over our financial reporting. A material weakness is a deficiency, or a combination of deficiencies, in internal control over financial reporting such that there is a reasonable possibility that a material misstatement of a company’s annual or interim financial statements will not be prevented or detected on a timely basis.
The material weakness we identified related to deficiencies in the completeness and effectiveness of our Information Technology General Control (ITGC) environment and the controls associated with our year end financial close process. The deficiencies with our year end financial close process, included reviews of account reconciliations and journal entries, resulting in a number of audit adjustments, primarily in the areas of (1) capitalized subscriber acquisition costs, (2) inventory and (3) accrued expenses.
We have initiated remediation efforts of these controls in the financial statement close process. The remediation includes, but is not limited to, expanding technical accounting skill sets, enhancing reconciliation and review procedures, and adding additional information technology system related controls.
If our remediation efforts are insufficient to address the identified material weakness or if additional material weaknesses in our internal controls are discovered in the future, they may adversely affect our ability to record, process, summarize and report financial information timely and accurately and, as a result, our financial statements may contain material misstatements or omissions.
In addition, it is possible that control deficiencies could be identified by our management or by our independent registered public accounting firm in the future or may occur without being identified. Such a failure could result in regulatory scrutiny, and cause investors to lose confidence in our reported financial condition, lead to a default under our indebtedness and otherwise have a material adverse effect on our business, financial condition, cash flow or results of operations.
Product or service defects or shortfalls in customer service could have an adverse effect on us.
Our inability to provide products, services or customer service in a timely manner or defects with our products or services could adversely affect our reputation. In addition, our inability to meet subscribers’ expectations with respect to our products, services or customer service could increase attrition rates or affect our ability to generate new subscribers and thereby have a material adverse effect on our business, financial condition, cash flow or results of operations.
We are exposed to greater risk of liability for employee acts or omissions or system failure, than may be inherent in other businesses
The nature of the products and services we provide potentially exposes us to greater risks of liability for employee acts or omissions or system failures than may be inherent in other businesses. If subscribers believe that they incurred losses as a result of our action or inaction, the subscribers (or their insurers) have and could in the future bring claims against us. Although our service contracts contain provisions limiting our liability, in an attempt to reduce this risk, in the event of any such litigation, no assurance can be given that these limitations will be enforced, and the costs of such litigation or the related settlements or judgments could have a material adverse effect on our financial condition. In addition, there can be no assurance that we are adequately insured for these risks. Certain of our insurance policies and the laws of some states may limit or prohibit insurance coverage for punitive or certain other types of damages or liability arising from gross negligence. If significant uninsured damages are assessed against us, the resulting liability could have a material adverse effect on our business, financial condition, cash flows or results of operations.
Future transactions could pose risks.
We frequently evaluate strategic opportunities both within and outside our existing lines of business. We expect from time-to-time to pursue additional business opportunities and may decide to eliminate or acquire certain businesses, products or services. For example, in August 2014, we acquired Space Monkey, a data cloud storage technology company. Such acquisitions or dispositions could be material. There are various risks and uncertainties associated with potential acquisitions and divestitures, including: (i) availability of financing; (ii) difficulties related to integrating previously separate businesses into a single unit, including products and service packages, distribution and operational capabilities and business cultures; (iii) general business disruption; (iv) managing the integration process; (v) diversion of management’s attention from day-to-day operations; (vi) assumption of costs and liabilities of an acquired business, including unforeseen or contingent liabilities
22
Table of Contents
or liabilities in excess of the amounts estimated; (vii) failure to realize anticipated benefits and synergies, such as cost savings and revenue enhancements; (viii) potentially substantial costs and expenses associated with acquisitions and dispositions; (ix) failure to retain and motivate key employees; and (x) difficulties in applying our internal control over financial reporting and disclosure controls and procedures to an acquired business. Any or all of these risks and uncertainties, individually or collectively, could have material adverse effect on our business, financial condition, cash flow or results of operations. We can offer no assurance that any such strategic opportunities will prove to be successful. Among other negative effects, our pursuit of such opportunities could cause our cost of investment in new subscribers to grow at a faster rate than our recurring revenue and fees collected at the time of installation. Additionally, any new product or service offerings could require developmental investments or have higher cost structures than our current arrangements, which could reduce operating margins and require more working capital
Goodwill and other identifiable intangible assets represent a significant portion of our total assets, and we may never realize the full value of our intangible assets.
As of December 31, 2014, we had approximately $1.5 billion of goodwill and identifiable intangible assets, excluding deferred financing costs. Goodwill and other identifiable intangible assets are recorded at fair value on the date of acquisition. In addition, as of December 31, 2014, we had $548.1 million of subscriber contract costs, net. We review such assets for impairment at least annually. Impairment may result from, among other things, deterioration in performance, adverse market conditions, adverse changes in applicable laws or regulations, including changes that restrict the activities of or affect the products and services we offer, challenges to the validity of certain intellectual property, reduced sales of certain products or services incorporating intellectual property, increased attrition and a variety of other factors. The amount of any quantified impairment must be expensed immediately as a charge to results of operations. Depending on future circumstances, it is possible that we may never realize the full value of our intangible assets. Any future determination of impairment of goodwill or other identifiable intangible assets could have a material adverse effect on our financial position and results of operations.
Insurance policies may not cover all of our operating risks and a casualty loss beyond the limits of our coverage could negatively impact our business.
We are subject to all of the operating hazards and risks normally incidental to the provision of our products and services and business operations. In addition to contractual provisions limiting our liability to subscribers and third parties, we maintain insurance policies in such amounts and with such coverage and deductibles as required by law and that we believe are reasonable and prudent. Nevertheless, such insurance may not be adequate to protect us from all the liabilities and expenses that may arise from claims for personal injury, death or property damage arising in the ordinary course of our business and current levels of insurance may not be able to be maintained or available at economical prices. If a significant liability claim is brought against us that is not covered by insurance, then we may have to pay the claim with our own funds, which could have a material adverse effect on our business, financial condition, cash flows or results of operations.
We are highly dependent on the proper and efficient functioning of our computer, data back-up, information technology, telecom and processing systems and our redundant monitoring stations.
Our ability to keep our business operating is highly dependent on the proper and efficient operation of our computer systems, information technology systems, telecom systems, data-processing systems, and subscriber software platform. We perform disaster recovery tests at least quarterly and always have two unused servers available to be used in a disaster scenario. We have implemented various techniques to deal with certain known failures that may arise, such as setting up two central monitoring facilities housed in separate and distinct locations in different regions of the U.S. such that if one facility fails or goes offline, the other can automatically assume control. Furthermore, our systems are designed such that data is replicated every 15 minutes offsite such that we can obtain a replica of data with no more than 15 minutes of lost inputs. We also utilize a next-day hardware service such that a failed part within a server could be replaced the following day.
Although we have redundant central monitoring facilities and back-up computer and power systems, if there is a catastrophic event, natural disaster, security breach, negligent or intentional act by an employee or other extraordinary event, we may be unable to provide our subscribers with uninterrupted services. Furthermore, because computer and data back-up and processing systems are susceptible to malfunctions and interruptions, we cannot guarantee that we will not experience service failures in the future. A significant or large-scale malfunction or interruption of any computer or data back-up and processing system could adversely affect our ability to keep our operations running efficiently and respond to alarm system signals. If a malfunction results in a wider or sustained disruption, it could have a material adverse effect on our reputation, business, financial condition, cash flows or results of operations.
23
Table of Contents
Our business is concentrated in certain markets.
Our business is concentrated in certain markets. As of December 31, 2014, subscribers in Texas and California represented approximately 17% and 7%, respectively, of our total subscriber base. Accordingly, our business and results of operations are particularly susceptible to adverse economic, weather and other conditions in such markets and in other markets that may become similarly concentrated.
Catastrophic events may disrupt our business.
Unforeseen events, or the prospect of such events, including war, terrorism and other international conflicts, public health issues including health epidemics or pandemics and natural disasters such as fire, hurricanes, earthquakes, tornados or other adverse weather and climate conditions, whether occurring in the U.S., Canada or elsewhere, could disrupt our operations, disrupt the operations of suppliers or subscribers or result in political or economic instability. These events could reduce demand for our products and services, make it difficult or impossible to receive equipment from suppliers or impair our ability to deliver products and services to customers on a timely basis. Any such disruption could damage our reputation and cause subscriber attrition. We could be subject to claims or litigation with respect to losses caused by such disruptions. Our property and business interruption insurance may not cover a particular event at all or be sufficient to fully cover our losses.
Currency fluctuations could materially and adversely affect us and we have not hedged this risk.
Historically, a portion of our revenue has been denominated in Canadian Dollars. For the year ended December 31, 2014, before intercompany eliminations, approximately $34.2 million, or 6% of our revenues were denominated in Canadian Dollars and as of December 31, 2014, before intercompany eliminations, $136.2 million, or 6% of our total assets and $87.7 million, or 4% of our total liabilities were denominated in Canadian Dollars. In the future, we expect to continue generating revenue denominated in Canadian Dollars, and other foreign currencies. Accordingly, we may be materially and adversely affected by currency fluctuations in the U.S. Dollar versus these currencies. Weaker foreign currencies relative to the U.S. Dollar may result in lower levels of reported revenues with respect to foreign currency-denominated subscriber contracts, net income, assets, liabilities and accumulated other comprehensive income on our U.S. Dollar-denominated financial statements. We have not historically hedged against this exposure. Foreign exchange rates are influenced by many factors outside of our control, including but not limited to: changing supply and demand for a particular currency, monetary policies of governments (including exchange-control programs, restrictions on local exchanges or markets and limitations on foreign investment in a country or on investment by residents of a country in other countries), changes in balances of payments and trade, trade restrictions and currency devaluations and revaluations. Also, governments may from time to time intervene in the currency markets, directly and by regulation, to influence prices directly. As such, these events and actions are unpredictable. The resulting volatility in the exchange rates for the other currencies could have a material adverse effect on our financial condition and results of operations.
If the insurance industry changes its practice of providing incentives to homeowners for the use of residential electronic security services, we may experience a reduction in new subscriber growth or an increase in our subscriber attrition rate.
Some insurers provide a reduction in premium rates for insurance policies written on homes that have monitored electronic security systems. There can be no assurance that insurance companies will continue to offer these rate reductions. If these incentives were reduced or eliminated, homeowners who otherwise may not feel the need for our products or services would be removed from our potential subscriber pool, which could hinder the growth of our business, and existing subscribers may choose to cancel or not renew their contracts, which could increase our attrition rates. In either case, our results of operations and growth prospects could be adversely affected.
The Issuer is a holding company and its principal asset is its ownership of the capital stock of its subsidiaries; accordingly, the Issuer is dependent upon distributions from its subsidiaries to make payments in respect of the notes and to pay taxes and any other expenses.
The Issuer is a holding company and its principal asset is its ownership of the capital stock of its subsidiaries. The Issuer has no independent means of generating revenue. The Issuer intends to cause its subsidiaries to make distributions to the Issuer following the consummation of the Transactions in amounts sufficient to make payments in respect of the notes and the Issuer’s other outstanding indebtedness. To the extent that the Issuer needs funds and its subsidiaries are unable or otherwise restricted from making such distributions under applicable law or regulation, the Issuer’s liquidity and financial condition would be adversely affected and the Issuer may be unable to satisfy its obligations under the notes or under its other indebtedness.
24
Table of Contents
Affiliates of the Sponsor own substantially all of the equity interests in us and may have conflicts of interest with us or the holders of the notes in the future.
As a result of the Merger, the Sponsor owns a substantial majority of our capital stock and has the ability to elect a majority of our board of directors. As a result, affiliates of the Sponsor have control over our decisions to enter into any corporate transaction and will have the ability to prevent any transaction that requires the approval of stockholders regardless of whether holders of the notes believe that any such transactions are in their own best interests. For example, affiliates of the Sponsor could cause us to make acquisitions that increase the amount of our indebtedness or to sell assets or businesses, or could cause us to issue additional capital stock or declare dividends. So long as the Sponsor continues to indirectly own a significant amount of the outstanding shares of our common stock, affiliates of the Sponsor will continue to be able to strongly influence or effectively control our decisions. The indentures governing our 2019 notes and our 2020 notes and the credit agreement governing our revolving credit facility permit us to pay advisory and other fees, dividends and make other restricted payments to the Sponsor under certain circumstances and the Sponsor or its affiliates may have an interest in our doing so. During the year ended December 31, 2014, we made payments to affiliates of the Sponsor of $2.8 million, which included $2.7 million in annual monitoring fees and $0.1 million in fees in connection with our issuance of $100.0 million senior unsecured notes. In addition, the Sponsor has no obligation to provide us with any additional debt or equity financing.
The Sponsor is in the business of making investments in companies and may from time to time acquire and hold interests in businesses that compete directly or indirectly with us or that supply us with goods and services. The Sponsor may also pursue acquisition opportunities that may be complementary to our business and, as a result, those acquisition opportunities may not be available to us. The holders of the notes should consider that the interests of the Sponsor and other Investors may differ from their interests in material respects. See “Security Ownership of Certain Beneficial Owners and Management,” “Certain Relationships and Related Party Transactions, and Director Independence,” “Description of the Notes” and “Description of Other Indebtedness.”
We have recorded net losses in the past and we may experience net losses in the future.
Although we have achieved profitability on an Adjusted EBITDA basis, we have recorded consolidated net losses in each of the previous three years ended December 31, 2014, and we may likely continue to record net losses in future periods.
Risks Relating to Our Indebtedness
Our substantial indebtedness could adversely affect our financial condition and prevent us from fulfilling our obligations under our indebtedness.
Net cash interest paid for the years ended December 31, 2014 and 2013 related to our indebtedness (excluding capital leases) totaled $136.9 million and $114.8 million, respectively. Our net cash provided by operating activities for the years ended December 31, 2014 and 2013, before these interest payments, was $140.2 million and $194.2 million, respectively. Our interest payments in fiscal 2014 and 2013 represented approximately 98% and 60% of such amounts, respectively.
Under the terms of our existing indebtedness, we are not required to make principal payments prior to scheduled maturity. As of December 31, 2014, we had approximately $1.9 billion of debt outstanding, which requires significant interest and principal payments. Subject to the limits contained in the credit agreement governing our revolving credit facility, the indenture governing our 2019 notes, the indenture governing our 2020 notes and the applicable agreements governing our other debt instruments, we may be able to incur substantial additional debt from time to time to finance working capital, capital expenditures, investments or acquisitions, or for other purposes. If we do so, the risks related to our high level of debt could increase. Specifically, our high level of debt could have important consequences, including the following:
| • | making it more difficult for us to satisfy our obligations with respect to our debt; |
| • | limiting our ability to obtain additional financing to fund future working capital, capital expenditures, acquisitions or other general corporate requirements; |
| • | requiring a substantial portion of our cash flows to be dedicated to debt service payments instead of other purposes, thereby reducing the amount of cash flows available for working capital, capital expenditures, acquisitions and other general corporate purposes; |
| • | increasing our vulnerability to general adverse economic and industry conditions; |
| • | exposing us to the risk of increased interest rates as certain of our borrowings are at variable rates of interest; |
25
Table of Contents
| • | limiting our flexibility in planning for and reacting to changes in the industry in which we compete; |
| • | placing us at a disadvantage compared to other, less leveraged competitors; and |
| • | increasing our cost of borrowing. |
Despite our current level of indebtedness, we may be able to incur substantially more debt and enter into other transactions, which could further exacerbate the risks to our financial condition described above.
We may be able to incur significant additional indebtedness in the future. For example, on March 6, 2015, we amended and restated the credit agreement governing our revolving credit facility to provide, among other things, for an increase in the aggregate commitments thereunder from $200.0 million to $289.4 million. As of March 6, 2015, we had $253.9 million of availability to incur secured indebtedness under the revolving credit facility (after giving effect to $3.0 million of outstanding letters of credit and $32.5 million of borrowings). We will be permitted to add, in addition to the revolving credit facility, incremental facilities of up to $225.0 million, subject to certain conditions being satisfied, of which up to $60.0 million may be incurred on the same “superpriority” basis as the revolving credit facility. Moreover, although the indenture governing our 2019 notes, the indenture governing our 2020 notes and the credit agreement governing the revolving credit facility contain restrictions on the incurrence of additional indebtedness and entering into certain types of other transactions, these restrictions are subject to a number of qualifications and exceptions. Additional indebtedness incurred in compliance with these restrictions could be substantial. These restrictions also do not prevent us from incurring obligations, such as trade payables, that do not constitute indebtedness as defined under our debt instruments. To the extent new debt is added to our current debt levels, the substantial leverage risks described in the previous risk factor would increase.
In addition, the exceptions to the restrictive covenants permit us to enter into certain other transactions. For example, the credit agreement governing our revolving credit facility, the indenture governing our 2019 notes and the indenture governing our 2020 notes permitted us, subject to certain conditions, to distribute or otherwise use for restricted payments any proceeds we realized from the 2GIG Sale. On May 14, 2013, we distributed $60.0 million of such proceeds to our stockholders in reliance on these provisions. The remaining proceeds have been used to fund our business activities or otherwise used for general corporate purposes, and we do not intend to make future dividends to our stockholders in reliance on these provisions.
Our variable rate indebtedness subjects us to interest rate risk, which could cause our indebtedness service obligations to increase significantly.
Borrowings under our revolving credit facility are at variable rates of interest and expose us to interest rate risk. If interest rates increase, our debt service obligations on the variable rate indebtedness would increase even though the amount borrowed remained the same, and our net income and cash flows, including cash available for servicing our indebtedness, would correspondingly decrease.
We may be unable to service our indebtedness.
Our ability to make scheduled payments on and to refinance our indebtedness, depends on and is subject to our financial and operating performance, which in turn is affected by general and regional economic, financial, competitive, business and other factors beyond our control, including the availability of financing in the international banking and capital markets. We cannot assure you that our business will generate sufficient cash flow from operations or that future borrowings will be available to us in an amount sufficient to enable us to service our debt, to refinance our debt or to fund our other liquidity needs.
If we are unable to meet our debt service obligations or to fund our other liquidity needs, we will need to restructure or refinance all or a portion of our debt, which could cause us to default on our debt obligations and impair our liquidity. Any refinancing of our indebtedness could be at higher interest rates and may require us to comply with more onerous covenants that could further restrict our business operations.
Moreover, in the event of a default, the holders of our indebtedness, including the 2019 notes, the 2020 notes and borrowings under our revolving credit facility, could elect to declare all the funds borrowed to be due and payable, together with accrued and unpaid interest. The lenders under our revolving credit facility could also elect to terminate their commitments thereunder, cease making further loans, and institute foreclosure proceedings against their collateral, and we could be forced into bankruptcy or liquidation. If we breach our covenants under our revolving credit facility, we would be in default under our revolving credit facility. The lenders could exercise their rights, as described above, and we could be forced into bankruptcy or liquidation.
26
Table of Contents
The indenture governing our 2019 notes, the indenture governing our 2020 notes and the credit agreement governing our revolving credit facility impose significant operating and financial restrictions on us and our subsidiaries, which may prevent us from capitalizing on business opportunities.
The indenture governing our 2019 notes, the indenture governing our 2020 notes and the credit agreement governing our revolving credit facility impose significant operating and financial restrictions on us. These restrictions limit our ability to, among other things:
| • | incur or guarantee additional debt or issue disqualified stock or preferred stock; |
| • | pay dividends and make other distributions on, or redeem or repurchase, capital stock; |
| • | make certain investments; |
| • | incur certain liens; |
| • | enter into transactions with affiliates; merge or consolidate; |
| • | enter into agreements that restrict the ability of restricted subsidiaries to make dividends or other payments us; |
| • | designate restricted subsidiaries as unrestricted subsidiaries; and |
| • | transfer or sell assets. |
As a result of these restrictions, we are limited as to how we conduct our business and we may be unable to raise additional debt or equity financing to compete effectively or to take advantage of new business opportunities. The terms of any future indebtedness we may incur could include more restrictive covenants. We cannot assure you that we will be able to maintain compliance with these covenants in the future and, if we fail to do so, that we will be able to obtain waivers from the lenders and/or amend the covenants.
Our failure to comply with the restrictive covenants described above as well as other terms of our existing indebtedness and/or the terms of any future indebtedness from time to time could result in an event of default, which, if not cured or waived, could result in our being required to repay these borrowings before their due date. If we are forced to refinance these borrowings on less favorable terms or cannot refinance these borrowings, our results of operations and financial condition could be adversely affected.
Our failure to comply with the agreements relating to our outstanding indebtedness, including as a result of events beyond our control, could result in an event of default that could materially and adversely affect our results of operations and our financial condition.
If there were an event of default under any of the agreements relating to our outstanding indebtedness, the holders of the defaulted debt could cause all amounts outstanding with respect to that debt to be due and payable immediately. We cannot assure you that our assets or cash flows would be sufficient to fully repay borrowings under our outstanding debt instruments if accelerated upon an event of default. Further, if we are unable to repay, refinance or restructure our indebtedness under our secured debt, the holders of such debt could proceed against the collateral securing that indebtedness. In addition, any event of default or declaration of acceleration under one debt instrument could also result in an event of default under one or more of our other debt instruments.
| ITEM 1B. | UNRESOLVED STAFF COMMENTS |
None.
| ITEM 2. | PROPERTIES |
Our headquarters, and one of our two monitoring facilities, are located in Provo, Utah. These premises are leased under leases expiring between December 2024 and June 2028. Additionally, we lease the premises for a separate monitoring station located in South St. Paul, Minnesota. We also lease various other facilities in throughout the U.S. and Canada for offices, warehousing, recruiting, and training purposes and own a small recruiting and training facility in Idaho. We believe that these facilities are adequate for our current needs and that suitable additional or substitute space will be available as needed to accommodate any expansion of our operations.
27
Table of Contents
| ITEM 3. | LEGAL PROCEEDINGS |
We are engaged in the defense of certain claims and lawsuits arising out of the ordinary course and conduct of our business and have certain unresolved claims pending, the outcomes of which are not determinable at this time. Our subscriber contracts include exculpatory provisions as described under “Business—Subscriber Contracts—Other Terms” and other liability limitations. We also have insurance policies covering certain potential losses where such coverage is available and cost effective. In our opinion, any liability that might be incurred by us upon the resolution of any claims or lawsuits will not, in the aggregate, have a material adverse effect on our financial condition or results of operations. See Note 16 of our Consolidated Financial Statements included elsewhere in this annual report on Form 10-K for additional information.
| ITEM 4. | MINE SAFETY DISCLOSURES |
Not applicable.
| ITEM 5. | MARKET FOR REGISTRANT’S COMMON EQUITY, RELATED STOCKHOLDER MATTERS AND ISSUER PURCHASES OF EQUITY SECURITIES |
We are a wholly owned subsidiary of APX Parent Holdco, Inc., which in turn is wholly owned through intermediate holding companies by the Investors. Presently, there is no public trading market for our common stock.
| ITEM 6. | SELECTED FINANCIAL DATA |
The following selected historical consolidated financial information and other data set forth below should be read in conjunction with “Management’s Discussion and Analysis of Financial Condition and Results of Operations” and our historical consolidated financial statements and the related notes thereto contained elsewhere in this annual report on Form 10-K.
The selected historical consolidated financial information and other data presented below for the years ended December 31, 2014 and 2013, the Successor Period ended December 31, 2012 and the Predecessor Period from January 1, 2012 through November 16, 2012 and the selected consolidated balance sheet data as of December 31, 2014 and 2013 (Successor) have been derived from our audited consolidated financial statements included in this annual report on Form 10-K. The selected historical consolidated financial information and other data presented below for the years ended December 31, 2011 and 2010 (Predecessor) and the selected consolidated balance sheet data as of December 31, 2012 (Successor), 2011 and 2010 (Predecessor) have been derived from our audited consolidated financial statements which are not included in this annual report on Form 10-K. The selected historical consolidated financial information and other data of the Predecessor are presented for the Issuer and its wholly-owned subsidiaries, as well as Solar, 2GIG and their respective subsidiaries. The selected historical consolidated financial information and other data of the Successor Period from November 17, 2012 through December 31, 2012 reflect the Merger presenting the financial position and results of operations of Parent Guarantor and wholly-owned subsidiaries. The financial position and results of the Successor are not comparable to the financial position and results of the Predecessor due to the Merger and the application of purchase accounting in accordance with ASC 805 Business Combinations.
The historical financial information for the Predecessor Period from January 1, 2012 through November 16, 2012 included in this annual report on Form 10-K includes the results of Solar, which commenced operations in early 2011. As a result of the Transactions, while Solar was a variable interest entity through the date of Solar’s initial public offering in October 2014, we have not been its primary beneficiary since after the date of the Transactions. Accordingly, Solar has not been required to be included in the consolidated financial statements of the Company in periods following the date of the Transactions. The historical financial information included in this annual report on Form 10-K include the results of 2GIG up through April 1, 2013, which was the date we completed the 2GIG Sale to Nortek. Solar and 2GIG do not, and will not, provide any credit support for any indebtedness of the Issuer, including indebtedness incurred under our revolving credit facility or the notes.
28
Table of Contents
| Successor | Predecessor | |||||||||||||||||||||||||
| December 31, | December 31, | Period from |
Period from |
Year Ended December 31, | ||||||||||||||||||||||
| 2014 | 2013 | 2012 | 2012 | 2011 | 2010 | |||||||||||||||||||||
| (in thousands) |
||||||||||||||||||||||||||
| Statement of Operations Data: |
||||||||||||||||||||||||||
| Total revenue |
$ | 563,677 | $ | 500,908 | $ | 57,606 | $ | 397,570 | $ | 339,948 | $ | 238,878 | ||||||||||||||
| Total costs and expenses |
657,546 | 555,788 | 85,799 | 440,563 | 300,934 | 193,649 | ||||||||||||||||||||
|
|
|
|
|
|
|
|
|
|
|
|
|
|||||||||||||||
| (Loss) Income from operations |
(93,869 | ) | (54,880 | ) | (28,193 | ) | (42,993 | ) | 39,014 | 45,229 | ||||||||||||||||
| Other expenses: |
||||||||||||||||||||||||||
| Interest expense |
(147,511 | ) | (114,476 | ) | (12,645 | ) | (106,620 | ) | (102,069 | ) | (69,534 | ) | ||||||||||||||
| Interest income |
1,455 | 1,493 | 4 | 61 | 214 | 64 | ||||||||||||||||||||
| Gain on 2GIG Sale |
— | 46,866 | — | — | — | — | ||||||||||||||||||||
| Other income (expenses) |
1,779 | 76 | (171 | ) | (122 | ) | (386 | ) | (397 | ) | ||||||||||||||||
|
|
|
|
|
|
|
|
|
|
|
|
|
|||||||||||||||
| Loss from continuing operations before income taxes |
(238,146 | ) | (120,921 | ) | (41,005 | ) | (149,674 | ) | (63,227 | ) | (24,638 | ) | ||||||||||||||
| Income tax expense (benefit) |
514 | 3,592 | (10,903 | ) | 4,923 | (3,739 | ) | 4,320 | ||||||||||||||||||
|
|
|
|
|
|
|
|
|
|
|
|
|
|||||||||||||||
| Net loss from continuing operations |
(238,660 | ) | (124,513 | ) | (30,102 | ) | (154,597 | ) | (59,488 | ) | (28,958 | ) | ||||||||||||||
| Discontinued operations: |
||||||||||||||||||||||||||
| Loss from discontinued operations |
— | — | — | (239 | ) | (2,917 | ) | — | ||||||||||||||||||
|
|
|
|
|
|
|
|
|
|
|
|
|
|||||||||||||||
| Net loss |
(238,660 | ) | (124,513 | ) | (30,102 | ) | (154,836 | ) | (62,405 | ) | (28,958 | ) | ||||||||||||||
| Net (loss) income attributable to non-controlling interests |
— | — | — | (1,319 | ) | 6,141 | (5,300 | ) | ||||||||||||||||||
|
|
|
|
|
|
|
|
|
|
|
|
|
|||||||||||||||
| Net loss attributable to APX Group Holdings, Inc. |
$ | (238,660 | ) | $ | (124,513 | ) | $ | (30,102 | ) | N/A | N/A | N/A | ||||||||||||||
|
|
|
|
|
|
|
|||||||||||||||||||||
| Net loss attributable to APX Group, Inc. |
N/A | N/A | N/A | $ | (153,517 | ) | $ | (68,546 | ) | $ | (23,658 | ) | ||||||||||||||
|
|
|
|
|
|
|
|||||||||||||||||||||
| Balance Sheet Data (at period end): |
||||||||||||||||||||||||||
| Cash |
$ | 10,807 | $ | 261,905 | $ | 8,090 | N/A | $ | 3,680 | $ | 3,700 | |||||||||||||||
| Working capital (deficit) |
(51,569 | ) | 187,781 | (32,834 | ) | N/A | (25,013 | ) | (60,584 | ) | ||||||||||||||||
| Adjusted working capital (deficit) (excluding cash and capital lease obligation) |
(56,827 | ) | (69,925 | ) | (36,923 | ) | N/A | (7,148 | ) | (55,981 | ) | |||||||||||||||
| Total assets |
2,303,673 | 2,424,434 | 2,155,348 | N/A | 644,980 | 456,286 | ||||||||||||||||||||
| Total debt |
1,883,155 | 1,762,049 | 1,333,000 | N/A | 623,741 | 424,150 | ||||||||||||||||||||
| Total shareholders’ equity (deficit) |
$ | 224,486 | $ | 490,243 | $ | 679,279 | N/A | $ | (183,499 | ) | $ | (169,207 | ) | |||||||||||||
| Ratio of earnings to fixed charges (1) |
NM | NM | NM | N/A | NM | NM | ||||||||||||||||||||
NM—Not meaningful.
N/A—Not applicable.
29
Table of Contents
| (1) | The ratio of earnings to fixed charges is calculated by dividing the sum of earnings (loss) from continuing operations before income taxes and fixed charges, by fixed charges. Fixed charges include interest expense on all indebtedness, amortization of debt issuance fees and interest expense on operating leases. Earnings were deficient in all periods presented to cover fixed charges by the following amounts: |
| Successor | Predecessor | |||||||||||||||||||||||
| December 31, 2014 |
December 31, 2013 |
Period from November 17, through December 31, 2012 |
Period from January 1, through November 16, 2012 |
Year Ended December 31, | ||||||||||||||||||||
| 2011 | 2010 | |||||||||||||||||||||||
| (in thousands) |
||||||||||||||||||||||||
| $ | (238,146 | ) | $ | (120,921 | ) | $ | (40,789 | ) | $ | (149,668 | ) | $ | (63,188 | ) | $ | (24,623 | ) | |||||||
| ITEM 7. | MANAGEMENT’S DISCUSSION AND ANALYSIS OF FINANCIAL CONDITION AND RESULTS OF OPERATIONS |
The following discussion and analysis provides information which management believes is relevant to an assessment and understanding of our consolidated results of operations and financial condition. This discussion covers periods both prior to and subsequent to the Transactions (as described below). Accordingly, the discussion and analysis of certain historical periods do not reflect the significant impact of the Transactions. The discussion should be read in conjunction with the “Unaudited Pro Forma Financial Information,” “Selected Historical Consolidated Financial Information” and the consolidated financial statements and notes thereto contained in this annual report on Form 10-K. This discussion contains forward-looking statements and involves numerous risks and uncertainties, including, but not limited to, those described in the “Risk Factors” section of this annual report on Form 10-K. Actual results may differ materially from those contained in any forward-looking statements.
Business Overview
We are one of the largest Smart Home companies in North America. In February 2013, we were recognized by Forbes magazine as one of America’s Most Promising Companies. Our fully integrated and remotely accessible residential services platform offers subscribers a suite of products and services that includes interactive security, life-safety, energy management and home automation. We utilize a scalable “direct-to-home” sales model to originate a majority of our new subscribers, which allows us control over our net subscriber acquisition costs. We have built a high-quality subscriber portfolio, with an average credit score of 714, as of December 31, 2014, through our underwriting criteria and compensation structure. Unlike many of our competitors, who generally focus on either subscriber origination or servicing, we originate, install, service and monitor our entire subscriber base, which allows us to control the overall subscriber experience. We seek to deliver a quality subscriber experience with a combination of innovative new products and services and a commitment to customer service, which together with our focus on originating high-quality new subscribers, has enabled us to achieve attrition rates that we believe are historically at or below industry averages. Utilizing this model, we have built a portfolio of approximately 894,000 subscribers, as of December 31, 2014. Approximately 95% and 92% of our revenues during the years ended December 31, 2014 and 2013, respectively, consisted of contractually committed recurring revenues, which have historically resulted in consistent and predictable operating results.
Recent Transactions
On March 6, 2015, we amended and restated the credit agreement governing our revolving credit facility to provide for, among other things, (1) an increase in the aggregate commitments previously available to us from $200.0 million to $289.4 million and (2) the extension of the maturity date with respect to certain of the previously available commitments. See “—Liquidity and Capital Resources—Revolving Credit Facility.”
On October 10, 2014, in connection with the completion of its initial public offering, Solar repaid loans to APX Group, Inc., our wholly-owned subsidiary, and to our parent entity. Our parent entity, in turn, returned a portion of such proceeds to APX Group, Inc. as a capital contribution. These transactions resulted in the receipt by APX Group, Inc. of an aggregate amount of $55.0 million.
30
Table of Contents
Also in connection with Solar’s initial public offering, we negotiated on an arm’s-length basis and entered into a number of agreements with Solar related to services and other support that we have provided and will provide to Solar including:
| • | A Master Intercompany Framework Agreement which establishes a framework for the ongoing relationship between us and Solar and contains master terms regarding the protection of each other’s confidential information, and master procedural terms, such as notice procedures, restrictions on assignment, interpretive provisions, governing law and dispute resolution; |
| • | A Non-Competition Agreement in which we and Solar each define our current areas of business and our competitors, and agree not to directly or indirectly engage in the other’s business for three years; |
| • | A Transition Services Agreement pursuant to which we will provide to Solar various enterprise services, including services relating to information technology and infrastructure, human resources and employee benefits, administration services and facilities-related services; |
| • | A Product Development and Supply Agreement pursuant to which one of Solar’s wholly owned subsidiaries will, for an initial term of three years, subject to automatic renewal for successive one-year periods unless either party elects otherwise, collaborate with us to develop certain monitoring and communications equipment that will be compatible with other equipment used in Solar’s energy systems and will replace equipment Solar currently procures from third parties; |
| • | A Marketing and Customer Relations Agreement which governs various cross-marketing initiatives between us and Solar, in particularly the provision of sales leads from each company to the other; and |
| • | A Trademark License Agreement pursuant to which the licensor, a special purpose subsidiary majority-owned by us and minority-owned by Solar, will grant Solar a royalty-free exclusive license to the trademark “VIVINT SOLAR” in the field of selling renewable energy or energy storage products and services. |
On September 3, 2014, APX Group, Inc. paid a dividend in the amount of $50.0 million to APX Group Holdings, Inc., its sole stockholder, which in turn paid a dividend in the amount of $50.0 million to its stockholders.
On July 1, 2014, we issued and sold an additional $100.0 million aggregate principal amount of the 2020 notes.
Key Factors Affecting Operating Results
Our business is driven through the generation of new subscribers and servicing and maintaining our existing subscriber base. The generation of new subscribers requires significant upfront investment, which in turn provides predictable contractual recurring monthly revenue generated from our monitoring and additional services. We market our service offerings through two sales channels, direct-to-home and inside sales. Historically, most of our new subscriber accounts were generated through direct-to-home sales, primarily from April through August. New subscribers generated through inside sales was approximately 24% of total new subscriber additions in the year ended December 31, 2014, as compared to 23% of total new subscribers in the year ended December 31, 2013. Over time we expect the number of subscribers originated through inside sales to continue to increase, resulting from increased advertising and expansion of our direct-sales calling centers.
Our operating results are impacted by the following key factors: number of subscriber additions, net subscriber acquisition costs, average RMR per subscriber, subscriber adoption rate of additional services beyond our Smart Security package, subscriber attrition, the costs to monitor and service our subscribers, the level of general and administrative expenses and the availability and cost of capital required to generate new subscribers. We focus our investment decisions on generating new subscribers and servicing our existing subscribers in the most cost-effective manner, while maintaining a high level of customer service to minimize subscriber attrition. These decisions are based on the projected cash flows and associated margins generated over the expected life of the subscriber relationship. Attrition is defined as the aggregate number of cancelled subscribers during a period divided by the monthly weighted average number of total subscribers for such period. Subscribers are considered cancelled when they terminate in accordance with the terms of their contract, are terminated by us, or if payment from such subscribers is deemed uncollectible (when at least four monthly billings become past due). Sales of contracts to third parties and certain subscriber moves are excluded from the attrition calculation.
31
Table of Contents
Our ability to increase subscribers depends on a number of factors, both external and internal. External factors include the overall macroeconomic environment and competition from other companies in the geographies we serve, particularly in those markets where our direct-to-home sales representatives are present. Some of our current competitors have longer operating histories, greater name recognition and substantially greater financial and marketing resources than us. In the future, other companies may also choose to begin offering services similar to ours. In addition, because such a large percentage of our new subscribers are generated through direct-to-home sales, any actions limiting this sales channel could negatively affect our ability to grow our subscriber base. We are continually evaluating ways to improve the effectiveness of our subscriber acquisition activities in both our direct-to-home and inside sales channels.
Internal factors include our ability to recruit, train and retain personnel, along with the level of investment in sales and marketing efforts. As a result, we expect to increase our investment in advertising in the markets we serve. We believe maintaining competitive compensation structures, differentiated product offerings and establishing a strong brand are critical to attracting and retaining high-quality personnel and competing effectively in the markets we serve. Successfully growing our revenue per subscriber depends on our ability to continue expanding our technology platform by offering additional value added services demanded by the market. Therefore, we continually evaluate the viability of additional service packages that could further leverage our existing technology platform and sales channels. As evidence of this focus on new services, since 2010, we have successfully expanded our service packages from residential security into energy management and home automation, which allows us to charge higher RMR for these additional service packages. During 2013, we began offering high-speed wireless internet to a limited number of residential customers. In August 2014, we also acquired a data cloud storage technology solution that we began selling on a limited basis in late 2014. These service offerings leverage our existing direct-to-home selling model for the generation of new subscribers. During the year ended December 31, 2014, approximately 69% of our new subscribers contracted for one of our additional service packages. Due to the high rate of adoption for these additional service packages, our average RMR per new subscriber has increased from $44.50 in 2009 to $61.89 for the year ended December 31, 2014, an increase of 39%.
We focus on managing the costs associated with monitoring and service without jeopardizing our award-winning service quality. We believe our ability to retain subscribers over the long-term starts with our underwriting criteria and is enhanced by maintaining our consistent quality service levels.
Subscriber attrition has a direct impact on the number of subscribers who we monitor and service and on our financial results, including revenues, operating income and cash flows. A portion of the subscriber base can be expected to cancel its service every year. Subscribers may choose not to renew or may terminate their contracts for a variety of reasons, including, but not limited to, relocation, cost, switching to a competitor’s service or service issues. If a subscriber relocates but continues their service, we do not consider this as a cancellation. If a subscriber discontinues their service and transfers the original subscriber’s contract to a new subscriber continuing the revenue stream, we also do not consider this as a cancellation. We analyze our attrition by tracking the number of subscribers who cancel as a percentage of the average number of subscribers at the end of each twelve month period. We caution investors that not all companies, investors and analysts in our industry define attrition in the same manner.
32
Table of Contents
The table below presents our subscriber data for the years ended December 31, 2014, 2013 and 2012:
| Year Ended December 31, | ||||||||||||
| 2014 | 2013 | 2012 | ||||||||||
| Beginning balance of subscribers |
795,500 | 671,818 | 562,006 | |||||||||
| Net new additions |
204,464 | 219,034 | 180,347 | |||||||||
| Attrition |
(105,789 | ) | (95,352 | ) | (70,535 | ) | ||||||
|
|
|
|
|
|
|
|||||||
| Ending balance of subscribers |
894,175 | 795,500 | 671,818 | |||||||||
|
|
|
|
|
|
|
|||||||
| Monthly average subscribers |
849,454 | 743,544 | 627,809 | |||||||||
|
|
|
|
|
|
|
|||||||
| Attrition rate |
12.5 | % | 12.8 | % | 11.2 | % | ||||||
|
|
|
|
|
|
|
|||||||
Historically, we have experienced an increased level of subscriber cancellations in the months surrounding the expiration of such subscribers’ initial contract term. Attrition in any twelve month period may be impacted by the number of subscriber contracts reaching the end of their initial term in such period. We believe this trend in cancellations at the end of the initial contract term is comparable to other companies within our industry.
Basis of Presentation
We have historically conducted business through our Vivint and 2GIG operating segments. Through the date of the Transactions, the historical results of our Vivint operating segment included the results of Vivint, Inc. and its subsidiaries, as well as those of Solar, which was historically consolidated as a variable interest entity. After the date of the Transactions, the results of our Vivint operating segment exclude the results of Solar, as it is not a subsidiary of ours and we are no longer considered a primary beneficiary of Solar. On April 1, 2013, we completed the sale of 2GIG to Nortek. See further discussion in Note 4 – Divestiture of Subsidiary. Therefore, 2GIG is excluded from our operating results, beginning on the date of the 2GIG Sale. The results of our 2GIG operating segment include the results of 2GIG Technologies, Inc., which prior to the Merger was a variable interest entity and after the Merger was our consolidated subsidiary until its sale to Nortek.
Revenues from Solar and its subsidiaries were approximately $0.4 million, or less than 1% of our total revenues (excluding intercompany activity), for the period from January 1, 2012 through the date of the Transactions. As of the date of the Transactions, assets of Solar and its subsidiaries were approximately $43.0 million, or 5% of our total assets (excluding intercompany balances), and liabilities of Solar and its subsidiaries were approximately $27.2 million, or 2% of our total liabilities (excluding intercompany balances). Revenues from 2GIG and its subsidiary were approximately $17.5 million, or 3% of our total revenues and $58.1 million, or 13% of our total revenues during the year ended December 31, 2013 and the Pro Forma Year ended December 31, 2012, respectively. As of March 31, 2013, assets of 2GIG and its subsidiary were approximately $138.5 million, or 6% of our total assets (excluding intercompany balances), and liabilities of 2GIG and its subsidiary were approximately $63.2 million, or 4% of our total liabilities (excluding intercompany balances).
Historically, a substantial majority of 2GIG’s revenues were generated from Vivint through (i) sales of its security systems and (ii) fees billed to Vivint associated with a third-party monitoring platform. Sales to Vivint represented approximately 71%, 45% and 54% of 2GIG’s revenues on a stand-alone basis from January 1, 2013 through the date of the 2GIG Sale, the Successor Period ended December 31, 2012 and the Predecessor Period from January 1, 2012 through November 16, 2012, respectively. The results of 2GIG’s operations discussed in this annual report on Form 10-K exclude intercompany activity with Vivint, as these transactions were eliminated in consolidation.
The consolidated financial statements for the year ended December 31, 2012 are presented for the Predecessor Period from January 1, 2012 through November 16, 2012 and the Successor Period ended December 31, 2012, which relate to the period preceding the Merger and the period succeeding the Merger, respectively. The consolidated financial statements of the Predecessor are presented for the Issuer and its wholly-owned subsidiaries. The audited consolidated financial statements for the Successor Period reflect the Transactions presenting the financial position and results of operations of the Parent Guarantor and its wholly-owned subsidiaries. The financial position and results of the Successor are not comparable to the financial position and results of the Predecessor due to the Transactions and the application of purchase accounting in
33
Table of Contents
accordance with ASC 805 Business Combinations. The Transactions have had and are expected to continue to have, a significant effect on our future financial condition and results of operations. For instance, as a result of the Transactions, our borrowings have increased significantly, although at lower rates of interest. Also, the application of purchase accounting in accordance with ASC 805 Business Combinations required that our assets and liabilities be adjusted to their fair value. These adjustments resulted in a decrease in our revenues, primarily related to activation fees billed to our subscribers prior to the Transactions. The revenue associated with activation fees is deferred upon billing and recognized over the estimated life of the subscriber relationships. There was deemed to be no fair value associated with the deferred activation fee revenues at the time of these Transactions. As a result, the recognition of the deferred revenues associated with these activation fees was eliminated. Our amortization expense also increased due to intangible assets acquired in the Transactions. We also incurred significant non-recurring charges in connection with the Transactions, including (i) equity-based compensation expense relating to management awards that vested upon the closing of the Transactions, (ii) payment to employees of bonuses and other compensation related to the Transactions and (iii) certain expenses related to the Transactions that may be required to be expensed by accounting standards.
The unaudited Pro Forma Year statement of operations for the year ended December 31, 2012 has been prepared to give pro forma effect to the Transactions as if they had occurred on January 1, 2012. The pro forma financial information is for informational purposes only and should not be considered indicative of actual results that would have been achieved had the Transactions actually been consummated on the dates indicated and do not purport to indicate results of operations as of any future date or for any future period. See “—Unaudited Pro Forma Financial Information.”
The term “attrition” as used in this annual report on Form10-K refers to the aggregate number of cancelled subscribers during a period divided by the monthly weighted average number of total subscribers for such period. Subscribers are considered cancelled when they terminate in accordance with the terms of their contract, are terminated by us or if payment from such subscribers is deemed uncollectible (when at least four monthly billings become past due). Sales of contracts to third parties and certain subscriber residential moves are excluded from the attrition calculation. The term “net subscriber acquisition costs” as used in this annual report on Form 10-K refers to the gross costs to generate and install a security and home automation subscriber net of any fees collected at the time of the contract signing. The term “RMR” is the recurring monthly revenue billed to a security and home automation subscriber. The term “total RMR” is the aggregate RMR billed to all security and home automation subscribers. The term “total subscribers” is the aggregate number of our active security and home automation subscribers at the end of a given period. The term “average RMR per subscriber” is the total RMR divided by the total subscribers. This is also commonly referred to as Average Revenue per User, or “ARPU.” The term “average RMR per new subscriber” is the aggregate RMR for new subscribers originated during a period divided by the number of new subscribers originated during such period.
How We Generate Revenue
Vivint
Our primary source of revenue is generated through monitoring services provided to our subscribers in accordance with their subscriber contracts. The remainder of our revenue is generated through additional services, activation fees, upgrades and maintenance and repair fees. Monitoring revenues accounted for 95%, 95%, 96% and 94%, of total revenues for the years ended December 31, 2014 and 2013, the Successor Period ended December 31, 2012 and the Predecessor Period from January 1, 2012 through November 16, 2012, respectively.
Monitoring revenue. Monitoring services for our subscriber contracts are billed in advance, generally monthly, pursuant to the terms of subscriber contracts and recognized ratably over the service period. The amount of RMR billed is dependent upon which of our service packages is included in the subscriber contracts. We generally realize higher RMR for our Smart Energy and Smart Control service packages than our Smart Security service package. Historically, we have generally offered contracts to subscribers that range in length from 36 to 60 months that are subject to automatic annual or monthly renewal after the expiration of the initial term. At the end of each monthly period, the portion of monitoring fees related to services not yet provided are deferred and recognized as these services are provided.
Service and other sales revenue. Our service and other sales revenue is primarily comprised of amounts charged for selling additional equipment, and maintenance and repair. These amounts are billed, and the associated revenue recognized, at the time of installation or when the services are performed. Service and other sales revenue also includes contract fulfillment revenue, which relates to amounts paid by subscribers who cancel their monitoring contract in-term and for which we have no future service obligation to them. We recognize this revenue upon receipt of payment from the subscriber.
34
Table of Contents
Activation fees. Activation fees represent upfront one-time charges billed to subscribers at the time of installation and are deferred. These fees are recognized over the estimated customer life of 12 years using a 150% declining balance method, which converts to a straight-line methodology after approximately five years.
2GIG
2GIG’s primary source of revenue was generated through the sale of electronic home security and automation products to dealers and distributors throughout North America. The remainder of the revenue was earned from monthly recurring service fees. System sales, which are included in service and other sales revenue on our consolidated statements of operations, accounted for approximately 14%, 3%, 13%, 12% and 13% of total consolidated revenues from January 1, 2013 through the date of the 2GIG Sale, the year ended December 31, 2013, the Pro Forma Year, the Successor Period ended December 31, 2012 and the Predecessor Period from January 1, 2012 through November 16, 2012, respectively. Product sales accounted for approximately 92%, 97%, 87%, 81% and 88% of 2GIG’s total revenues on a stand-alone basis from January 1, 2013 through the date of the 2GIG Sale, the period January 1, 2013 through the date of the 2GIG Sale, the Pro Forma Year, the Successor Period ended December 31, 2012 and the Predecessor Period from January 1, 2012 through November 16, 2012, respectively.
Service and other sales revenue. Net sales revenue from distribution of the 2GIG products was recognized when title to the products transferred to the customer, which occurred upon shipment from our third-party logistics provider’s facility to the customer. Invoicing occurred at the time of shipment and in certain cases, included freight costs based on specific vendor contracts.
Recurring services revenue. Net recurring services revenue was based on back-end services for all panels sold to distributors and direct-sell dealers and subsequently placed in service in end-user locations. The back-end services are provided by Alarm.com, an independent platform services provider. 2GIG received a fixed monthly amount from Alarm.com for each of our systems installed with customers that used the Alarm.com platform.
Costs and Expenses
Vivint
Operating expenses. Operating expenses primarily consists of labor associated with monitoring and servicing subscribers and labor and equipment expenses related to upgrades and service repairs. We also incur equipment costs associated with excess and obsolete inventory and rework costs related to equipment removed from subscriber’s homes. In addition, a portion of general and administrative expenses, comprised of certain human resources, facilities and information technologies costs are allocated to operating expenses. This allocation is primarily based on employee headcount and facility square footage occupied. Because our FSPs perform most subscriber installations generated through our inside sales channels, the costs incurred by the field service associated with these installations are allocated to capitalized subscriber acquisition costs.
Selling expenses. Selling expenses are primarily comprised of costs associated with housing for our direct-to-home sales representatives, advertising and lead generation, marketing and recruiting, certain portions of sales commissions, overhead (including allocation of certain general and administrative expenses) and other costs not directly tied to a specific subscriber origination. These costs are expensed as incurred.
General and administrative expenses. General and administrative expenses consist largely of finance, legal, research and development (“R&D”), human resources, information technology and executive management expenses, including stock-based compensation expense. Stock-based compensation expense is recorded within various components of our costs and expenses. General and administrative expenses also include the provision for doubtful accounts. We allocate approximately one-third of our gross general and administrative expenses, excluding the provision for doubtful accounts, into operating and selling expenses in order to reflect the overall costs of those components of the business. In addition, in connection with certain service agreements with Solar, we subleased corporate office space to them through October 2014 and provide certain other administrative services to Solar. We charge Solar the costs associated with these service agreements (See Note 7).
Depreciation and amortization. Depreciation and amortization consists of depreciation from property and equipment, amortization of equipment leased under capital leases, capitalized subscriber acquisition costs and intangible assets.
35
Table of Contents
2GIG
Operating expenses. 2GIG did not directly manufacture, assemble, warehouse or ship any of the products it sold. Its products were produced by contract manufacturers, and warehoused and fulfilled through third-party logistics providers. Operating expenses primarily consisted of cost of goods sold, freight charges, royalty fees on licensed technology, warehouse expenses, and fulfillment service fees charged by its logistics providers.
General and administrative expenses. General and administrative expenses consisted largely of finance, R&D, including third-party engineering costs, legal, operations, sales commissions, and executive management costs. 2GIG’s personnel-related costs were included in general and administrative expense.
Depreciation and amortization. Depreciation and amortization consisted of depreciation of property and equipment.
Key Operating Metrics
In evaluating our results, we review the key performance measures discussed below. We believe that the presentation of key performance measures is useful to investors and lenders because they are used to measure the value of companies such as ours with recurring revenue streams.
Total Subscribers
Total subscribers is the aggregate number of our active security and home automation subscribers at the end of a given period.
Total Recurring Monthly Revenue
Total RMR is the aggregate RMR billed to all security and home automation subscribers. This revenue is earned for Smart Security, Smart Energy, and Smart Control service offerings.
Average RMR per Subscriber
Average RMR per subscriber is the total RMR divided by the total subscribers. This is also commonly referred to as Average Revenue per User, or ARPU.
Attrition
Attrition is the aggregate number of cancelled security and home automation subscribers during a period divided by the monthly weighted average number of total security and home automation subscribers for such period. Subscribers are considered cancelled when they terminate in accordance with the terms of their contract, are terminated by us or if payment from such subscribers is deemed uncollectible (when at least four monthly billings become past due).
Critical Accounting Estimates
In preparing our consolidated financial statements, we make assumptions, judgments and estimates that can have a significant impact on our revenue, income (loss) from operations and net loss, as well as on the value of certain assets and liabilities on our Consolidated Balance Sheets. We base our assumptions, judgments and estimates on historical experience and various other factors that we believe to be reasonable under the circumstances. Actual results could differ materially from these estimates under different assumptions or conditions. At least quarterly, we evaluate our assumptions, judgments and estimates and make changes accordingly. Historically, our assumptions, judgments and estimates relative to our critical accounting estimates have not differed materially from actual results. We believe that the assumptions, judgments and estimates involved in the accounting for income taxes, allowance for doubtful accounts, valuation of intangible assets, and fair value have the greatest potential impact on our consolidated financial statements; therefore, we consider these to be our critical accounting estimates. For information on our significant accounting policies, see Note 2 to our consolidated financial statements.
Revenue Recognition
We recognize revenue principally on three types of transactions: (i) monitoring, which includes RMR, (ii) service and other sales, which includes non-recurring service fees charged to our subscribers provided on contracts, contract fulfillment revenues and sales of products that are not part of our service offerings, and (iii) activation fees on the subscriber contracts, which are amortized over the estimated life of the subscriber relationship.
36
Table of Contents
Monitoring services for our subscriber contracts are billed in advance, generally monthly, pursuant to the terms of subscriber contracts and recognized ratably over the service period. RMR is recognized monthly as services are provided in accordance with the rates set forth in our subscriber contracts. Costs of providing ongoing monitoring services are expensed in the period incurred.
Any services included in service and other sales revenue are recognized upon provision of the applicable services. Revenue from 2GIG product sales was recognized when title passed to the customer, which was generally upon shipment from the warehouse of our third-party logistics provider. Revenue generated by Vivint from the sale of products that are not part of the service offerings is recognized upon installation. Contract fulfillment revenue represents fees received from subscribers at the time of, or subsequent to, the in-term termination of their contract. This revenue is recognized when payment is received from the subscriber.
Activation fees represent upfront one-time charges billed to subscribers at the time of installation and are deferred. These fees are recognized over the estimated customer life of 12 years using a 150% declining balance method, which converts to a straight-line methodology after approximately five years.
Subscriber Acquisition Costs
A portion of the direct costs of acquiring new security and home automation subscribers, primarily sales commissions, equipment, and installation costs, are deferred and recognized over a pattern that reflects the estimated life of the subscriber relationships. We amortize these costs over 12 years using a 150% declining balance method, which converts to a straight-line methodology after approximately 5 years. We evaluate attrition on a periodic basis, utilizing observed attrition rates for our subscriber contracts and industry information and, when necessary, make adjustments to the estimated life of the subscriber relationship and amortization method.
Subscriber acquisition costs represent the costs related to the origination of new subscribers. A portion of subscriber acquisition costs is expensed as incurred, which includes costs associated with the direct-to-home sale housing, marketing and recruiting, certain portions of sales commissions (residuals), overhead and other costs, considered not directly and specifically tied to the origination of a particular subscriber. The remaining portion of the costs is considered to be directly tied to subscriber acquisition and consist primarily of certain portions of sales commissions, equipment, and installation costs. These costs are deferred and recognized in a pattern that reflects the estimated life of the subscriber relationships. Subscriber acquisition costs are largely correlated to the number of new subscribers originated.
In conjunction with the Merger and in accordance with purchase accounting, the total purchase price was allocated to our net tangible and identifiable intangible assets based on their estimated fair values as of November 16, 2012 (See Note 3). We recorded the value of Subscriber Contract Costs on the date of the Merger at fair value and classified it as an intangible asset, which is amortized over 10 years in a pattern that is consistent with the amount of revenue expected to be generated from the related subscriber contracts.
Accounts Receivable
Accounts receivable consist primarily of amounts due from subscribers for RMR services. Accounts receivable are recorded at invoiced amounts and are non-interest bearing. The gross amount of accounts receivable has been reduced by an allowance for doubtful accounts of approximately $3.4 million and $1.9 million at December 31, 2014 and December 31, 2013, respectively. We estimate this allowance based on historical collection rates, attrition rates, and contractual obligations underlying the sale of the subscriber contracts to third parties. As of December 31, 2014 and 2013, no accounts receivable were classified as held for sale. Provision for doubtful accounts recognized and included in general and administrative expenses in the accompanying audited consolidated statements of operations totaled $15.7 million and $10.4 million for the year ended December 31, 2014 and 2013, respectively.
Loss Contingencies
We record accruals for various contingencies including legal proceedings and other claims that arise in the normal course of business. The accruals are based on judgment, the probability of losses and, where applicable, the consideration of opinions of legal counsel. We record an accrual when a loss is deemed probable to occur and is reasonably estimable. Factors that we consider in the determination of the likelihood of a loss and the estimate of the range of that loss in respect of legal
37
Table of Contents
matters include the merits of a particular matter, the nature of the litigation, the length of time the matter has been pending, the procedural posture of the matter, whether we intend to defend the matter, the likelihood of settling for an insignificant amount and the likelihood of the plaintiff accepting an amount in this range. However, the outcome of such legal matters is inherently unpredictable and subject to significant uncertainties.
Goodwill and Intangible Assets
Purchase accounting requires that all assets and liabilities acquired in a transaction be recorded at fair value on the acquisition date, including identifiable intangible assets separate from goodwill. For significant acquisitions, we obtain independent appraisals and valuations of the intangible (and certain tangible) assets acquired and certain assumed obligations as well as equity. Identifiable intangible assets include customer relationships, trade names and trademarks and developed technology, which equaled $703.2 million at December 31, 2014. Goodwill represents the excess of cost over the fair value of net assets acquired and was $841.5 million at December 31, 2014.
The estimated fair values and useful lives of identified intangible assets are based on many factors, including estimates and assumptions of future operating performance and cash flows of the acquired business, estimates of cost avoidance, the nature of the business acquired, the specific characteristics of the identified intangible assets and our historical experience and that of the acquired business. The estimates and assumptions used to determine the fair values and useful lives of identified intangible assets could change due to numerous factors, including product demand, market conditions, regulations affecting the business model of our operations, technological developments, economic conditions and competition. The carrying values and useful lives for amortization of identified intangible assets are reviewed annually during our fourth fiscal quarter and as necessary if changes in facts and circumstances indicate that the carrying value may not be recoverable and any resulting changes in estimates could have a material adverse effect on our financial results.
When we determine that the carrying value of intangible assets, goodwill and long-lived assets may not be recoverable, an impairment charge is recorded. Impairment is generally measured based on valuation techniques considered most appropriate under the circumstances, including a projected discounted cash flow method using a discount rate determined by our management to be commensurate with the risk inherent in our current business model or prevailing market rates of investment securities, if available.
We conduct a goodwill impairment analysis annually in our fourth fiscal quarter, as of October 1, and as necessary if changes in facts and circumstances indicate that the fair value of our reporting units may be less than their carrying amount. Under applicable accounting guidance, we are permitted to use a qualitative approach to evaluate goodwill impairment when no indicators of impairment exist and if certain accounting criteria are met. To the extent that indicators exist or the criteria are not met, we use a quantitative approach to evaluate goodwill impairment based on estimated growth in our business and discount rates. Such quantitative impairment assessment is performed using a two-step, fair value based test. The first step requires that we compare the estimated fair value of our reporting units to the carrying value of the reporting unit’s net assets, including goodwill. If the fair value of the reporting unit is greater than the carrying value of its net assets, goodwill is not considered to be impaired and no further testing is required. If the fair value of the reporting unit is less than the carrying value of its net assets, we would be required to complete the second step of the test by analyzing the fair value of its goodwill. If the carrying value of the goodwill exceeds its fair value, an impairment charge is recorded.
Property and Equipment
Property and equipment are stated at cost and depreciated on the straight-line method over the estimated useful lives of the assets or the lease term, whichever is shorter. Amortization expense associated with leased assets is included with depreciation expense. Routine repairs and maintenance are charged to expense as incurred. We periodically assess potential impairment of our property and equipment and perform an impairment review whenever events or changes in circumstances indicate that the carrying value may not be recoverable.
Income Taxes
We account for income taxes based on the asset and liability method. Under the asset and liability method, deferred tax assets and deferred tax liabilities are recognized for the future tax consequences attributable to differences between the financial statement carrying amounts of existing assets and liabilities and their respective tax basis and operating loss and tax credit carryforwards. Valuation allowances are established when necessary to reduce deferred tax assets when it is determined that it is more likely than not that some portion of the deferred tax asset will not be realized.
We recognize the effect of an uncertain income tax position on the income tax return at the largest amount that is more-likely-than-not to be sustained upon audit by the relevant taxing authority. An uncertain income tax position will not be recognized if it has less than a 50% likelihood of being sustained. Our policy for recording interest and penalties is to record such items as a component of the provision for income taxes.
38
Table of Contents
Recent Accounting Pronouncements
In May 2014, the FASB issued authoritative guidance which clarifies the principles used to recognize revenue for all entities. The new guidance requires companies to recognize revenue when it transfers goods or services to a customer in an amount that reflects the consideration to which a company expects to be entitled. The guidance is effective for annual and interim periods beginning after December 15, 2016. The guidance allows for either a “full retrospective” adoption or a “modified retrospective” adoption, however early adoption is not permitted. We are currently evaluating the impact the adoption of this guidance will have on our consolidated financial statements.
In August 2014, the Financial Accounting Standards Board issued ASU No. 2014-15. This standard provides guidance on determining when and how to disclose going-concern uncertainties in the financial statements. The new standard requires management to perform interim and annual assessments of an entity’s ability to continue as a going concern within one year of the date the financial statements are issued. This ASU is effective for fiscal years, and interim periods within those years, beginning on or after December 15, 2016, with early adoption permitted. We are evaluating the new guidance and plan to provide additional information about its expected impact at a future date.
In February 2013, the FASB issued authoritative guidance which expands the disclosure requirements for amounts reclassified out of accumulated other comprehensive income (“AOCI”). The guidance requires an entity to provide information about the amounts reclassified out of AOCI by component and present, either on the face of the income statement or in the notes to financial statements, significant amounts reclassified out of AOCI by the respective line items of net income but only if the amount reclassified is required under GAAP to be reclassified to net income in its entirety in the same reporting period. For other amounts, an entity is required to cross-reference to other disclosures required under GAAP that provide additional detail about those amounts. This guidance does not change the current requirements for reporting net income or OCI in financial statements. The guidance became effective for us in the first quarter of fiscal year 2014. The adoption of this guidance did not have a material impact on our financial position, results of operations or cash flows.
In July 2013, the FASB issued authoritative guidance which amends the guidance related to the presentation of unrecognized tax benefits and allows for the reduction of a deferred tax asset for a net operating loss carryforward whenever the net operating loss carryforward or tax credit carryforward would be available to reduce the additional taxable income or tax due if the tax position is disallowed. This guidance became effective for us for annual and interim periods beginning in fiscal year 2014. The adoption of this guidance did not have a material impact on our financial position, results of operations or cash flows.
39
Table of Contents
Results of operations
| Successor | Predecessor | |||||||||||||||||||||
| Year Ended December 31, 2014 |
Year Ended December 31, 2013 |
Period from November 17 through December 31, 2012 |
Period from January 1 through November 16, 2012 |
Pro Forma Year Ended December 31, 2012 |
||||||||||||||||||
| (unaudited) | ||||||||||||||||||||||
| (in thousands) |
||||||||||||||||||||||
| Revenue |
||||||||||||||||||||||
| Vivint |
$ | 563,677 | $ | 483,401 | $ | 50,791 | $ | 346,270 | $ | 392,238 | ||||||||||||
| 2GIG |
— | 17,507 | 6,815 | 51,300 | 58,115 | |||||||||||||||||
|
|
|
|
|
|
|
|
|
|
|
|||||||||||||
| Total revenue |
563,677 | 500,908 | 57,606 | 397,570 | 450,353 | |||||||||||||||||
| Transaction related costs |
||||||||||||||||||||||
| Vivint |
— | — | 28,118 | 22,219 | — | |||||||||||||||||
| 2GIG |
— | — | 3,767 | 1,242 | — | |||||||||||||||||
|
|
|
|
|
|
|
|
|
|
|
|||||||||||||
| Total transaction related costs |
— | — | 31,885 | 23,461 | — | |||||||||||||||||
| Costs and expenses |
||||||||||||||||||||||
| Vivint |
657,546 | 536,502 | 46,241 | 365,300 | 426,449 | |||||||||||||||||
| 2GIG |
— | 19,286 | 7,673 | 51,802 | 67,432 | |||||||||||||||||
|
|
|
|
|
|
|
|
|
|
|
|||||||||||||
| Total costs and expenses |
657,546 | 555,788 | 53,914 | 417,102 | 493,881 | |||||||||||||||||
| (Loss) income from continuing operations |
||||||||||||||||||||||
| Vivint |
(93,869 | ) | (53,101 | ) | (23,568 | ) | (41,249 | ) | (34,211 | ) | ||||||||||||
| 2GIG |
— | (1,779 | ) | (4,625 | ) | (1,744 | ) | (9,317 | ) | |||||||||||||
|
|
|
|
|
|
|
|
|
|
|
|||||||||||||
| Total (loss) income from continuing operations |
(93,869 | ) | (54,880 | ) | (28,193 | ) | (42,993 | ) | (43,528 | ) | ||||||||||||
| Other expenses |
144,277 | 66,041 | 12,812 | 106,681 | 104,546 | |||||||||||||||||
|
|
|
|
|
|
|
|
|
|
|
|||||||||||||
| Loss before taxes |
(238,146 | ) | (120,921 | ) | (41,005 | ) | (149,674 | ) | (148,074 | ) | ||||||||||||
| Income tax expense (benefit) |
514 | 3,592 | (10,903 | ) | 4,923 | (5,980 | ) | |||||||||||||||
|
|
|
|
|
|
|
|
|
|
|
|||||||||||||
| Net loss from continuing operations |
(238,660 | ) | (124,513 | ) | (30,102 | ) | (154,597 | ) | $ | (142,094 | ) | |||||||||||
|
|
|
|||||||||||||||||||||
| Loss from discontinued operations |
— | — | — | (239 | ) | |||||||||||||||||
|
|
|
|
|
|
|
|
|
|||||||||||||||
| Less net (loss) income attributable to non-controlling interests |
— | — | — | (1,319 | ) | |||||||||||||||||
|
|
|
|
|
|
|
|
|
|||||||||||||||
| Net loss attributable to APX Group Holdings, Inc |
$ | (238,660 | ) | $ | (124,513 | ) | $ | (30,102 | ) | |||||||||||||
|
|
|
|
|
|
|
|||||||||||||||||
| Net loss attributable to APX Group, Inc |
$ | (153,517 | ) | |||||||||||||||||||
|
|
|
|||||||||||||||||||||
| Key operating metrics (1) |
||||||||||||||||||||||
| Total Subscribers (thousands), as of December 31 |
894.2 | 795.5 | 671.8 | N/A | 671.8 | |||||||||||||||||
| Total RMR (thousands) (end of period) |
$ | 48,732 | $ | 42,202 | $ | 34,276 | N/A | $ | 34,276 | |||||||||||||
| Average RMR per Subscriber |
$ | 54.50 | $ | 53.05 | $ | 51.02 | N/A | $ | 51.02 | |||||||||||||
| (1) | Reflects Vivint metrics only for all periods presented. |
40
Table of Contents
Year Ended December 31, 2014 Compared to the Year Ended December 31, 2013—Vivint
Revenues
The following table provides the significant components of our revenue for the years ended December 31, 2014 and 2013:
| Successor | % Change | |||||||||||
| Year Ended December 31, | 2014 Actual vs. | |||||||||||
| 2014 | 2013 | 2013 Actual | ||||||||||
| (in thousands) | ||||||||||||
| Monitoring revenue |
$ | 537,695 | $ | 459,681 | 17 | % | ||||||
| Service and other sales revenue |
21,980 | 22,077 | 0 | % | ||||||||
| Activation fees |
4,002 | 1,643 | 144 | % | ||||||||
|
|
|
|
|
|
|
|||||||
| Total revenues |
$ | 563,677 | $ | 483,401 | 17 | % | ||||||
|
|
|
|
|
|
|
|||||||
Total revenues increased $80.3 million, or 17%, for the year ended December 31, 2014 as compared to the year ended December 31, 2013, primarily due to the growth in monitoring revenue, which increased $78.0 million, or 17%. This increase resulted from $66.8 million of fees from the net addition of approximately 99,000 subscribers at December 31, 2014 compared to December 31, 2013 and a $20.9 million increase from continued growth in the percentage of our subscribers contracting for new products and service packages, partially offset by a $10.1 million increase in refunds and credits during the period.
Service and other sales revenue decreased $0.1 million, or 0%, for the year ended December 31, 2014 as compared to the year ended December 31, 2013. This decrease was primarily due to an increase of $0.6 million of other revenue offset by a decrease in upgrade revenue of $0.7 million related to subscriber service upgrades and purchases of additional equipment.
The revenue associated with activation fees is deferred upon billing and recognized over the estimated life of the subscriber relationship. There was deemed to be no fair value associated with deferred activation fee revenues at the time of the Acquisition. Thus, all activation fee revenue for the years ended December 31, 2014 and 2013 relate to contracts generated after the Acquisition. Thus, revenues recognized related to activation fees increased $2.4 million, or 144%, for the year ended December 31, 2014 as compared to the year ended December 31, 2013, primarily due to the increase in the number of subscribers from whom we have collected activation fees since the date of the Acquisition.
Costs and Expenses
The following table provides the significant components of our costs and expenses for the years ended December 31, 2014 and 2013:
| Successor | % Change | |||||||||||
| Year Ended December 31, | 2014 Actual vs. |
|||||||||||
| 2014 | 2013 | 2013 Actual | ||||||||||
| (in thousands) | ||||||||||||
| Operating expenses |
$ | 202,769 | $ | 152,554 | 33 | % | ||||||
| Selling expenses |
107,370 | 98,884 | 9 | % | ||||||||
| General and administrative |
126,083 | 91,696 | 38 | % | ||||||||
| Depreciation and amortization |
221,324 | 193,368 | 14 | % | ||||||||
|
|
|
|
|
|
|
|||||||
| Total costs and expenses |
$ | 657,546 | $ | 536,502 | 23 | % | ||||||
|
|
|
|
|
|
|
|||||||
Operating expenses increased $50.2 million, or 33%, for the year ended December 31, 2014 as compared to the year ended December 31, 2013, primarily to support the growth in our subscriber base and our wireless internet business. This increase was principally comprised of $19.8 million in equipment costs, $17.3 million in personnel costs within our monitoring, customer support and field service functions, a $6.9 million increase in cellular communications fees related to our monitoring services and a $3.7 million increase in information technology costs. In addition, we recognized a loss on impairment of $1.4 million associated with our CMS technology (See Note 11 to our accompanying consolidated financial statements).
41
Table of Contents
Selling expenses, excluding amortization of capitalized subscriber acquisition costs, increased $8.5 million, or 9%, for the year ended December 31, 2014 as compared to the year ended December 31, 2013, primarily due to a $7.8 million increase in facility, administrative and information technology costs and a $1.3 million increase in advertising costs, all to support the expected increase in our subscriber contract originations and our wireless internet business over time. This increase is offset, in part, by a $0.7 million decrease in personnel costs.
General and administrative expenses increased $34.4 million, or 38%, for the year ended December 31, 2014 as compared to the year ended December 31, 2013, partly due to a $21.5 million increase in personnel costs, primarily related to information technologies, R&D and management staffing to support the expected growth of the business and our wireless internet service. The increase was also due to a $7.8 million increase in brand recognition expenses and a $3.2 million increase in facility, administrative and information technology costs, all to support the growth in our business, along with a $5.6 million increase in the provision for doubtful accounts, primarily related to the growth in our revenues and accounts receivable. These increases were partially offset by a $3.5 million decrease in other advertising costs.
Depreciation and amortization increased $28.0 million, or 14%, for the year ended December 31, 2014 as compared to the year ended December 31, 2013. The increase was primarily due to increased amortization of subscriber contract costs.
Year Ended December 31, 2014 Compared to the Year Ended December 31, 2013—2GIG
All intercompany revenue and expenses between Vivint and 2GIG have been eliminated in consolidation and from the amounts presented below, as discussed in Note 4.
| Successor | % Change | |||||||||||
| Year Ended December 31, | 2014 Actual vs. 2013 Actual |
|||||||||||
| 2014 | 2013 | |||||||||||
| (in thousands) |
||||||||||||
| Total revenue |
$ | — | $ | 17,507 | -100 | % | ||||||
| Operating expenses |
— | (11,667 | ) | -100 | % | |||||||
| General and administrative |
— | (5,481 | ) | -100 | % | |||||||
| Other expenses |
— | (2,138 | ) | -100 | % | |||||||
|
|
|
|
|
|
|
|||||||
| Loss from operations |
$ | — | $ | (1,779 | ) | -100 | % | |||||
|
|
|
|
|
|
|
|||||||
2GIG is no longer included in our results of operations, from the date of the 2GIG Sale.
Year Ended December 31, 2014 Compared to the Year Ended December 31, 2013—Consolidated
Other Expenses, net
The following table provides the significant components of our other expenses, net, for the years ended December 31, 2014 and 2013:
| Successor | % Change | |||||||||||
| Year Ended December 31, | 2014 Actual vs. 2013 Actual |
|||||||||||
| 2014 | 2013 | |||||||||||
| (in thousands) | ||||||||||||
| Interest expense |
$ | 147,511 | $ | 114,476 | 29 | % | ||||||
| Interest income |
(1,455 | ) | (1,493 | ) | -3 | % | ||||||
| Gain on 2GIG Sale |
— | (46,866 | ) | -100 | % | |||||||
| Other income |
(1,779 | ) | (76 | ) | 2241 | % | ||||||
|
|
|
|
|
|
|
|||||||
| Total other expenses, net |
$ | 144,277 | $ | 66,041 | 118 | % | ||||||
|
|
|
|
|
|
|
|||||||
Interest expense increased $33.0 million, or 29%, for the year ended December 31, 2014, as compared with the year ended December 31, 2013, due to a higher principal balance on our debt resulting from the issuance of $550.0 million of senior unsecured notes payable since the beginning of 2013. During the year ended December 31, 2013, we realized a gain of
42
Table of Contents
$46.9 million as a result of the 2GIG Sale. See Note 4 of our consolidated financial statements for additional information. During the year ended December 31, 2014, other income consisted of proceeds from the settlement of a lawsuit and a gain associated with a facility fire. See Note 12 of our consolidated financial statements for additional information.
Income Taxes
The following table provides the significant components of our income tax expense for the years ended December 31, 2014 and 2013:
| Successor | % Change | |||||||||||
| Year Ended December 31, | 2014 Actual vs. | |||||||||||
| 2014 | 2013 | 2013 Actual | ||||||||||
| (in thousands) | ||||||||||||
| Income tax expense |
$ | 514 | $ | 3,592 | -86 | % | ||||||
Income tax expense decreased $3.1 million, or 86%, for the year ended December 31, 2014, as compared with the year ended December 31, 2013. After the 2GIG Sale on April 1, 2013, we were in a net deferred tax asset position, which required the application of a full valuation allowance against this deferred tax asset, resulting in income tax expense for the year ended December 31, 2013. Our tax expense during the year ended December 31, 2014 was primarily due to foreign income taxes.
Unaudited Pro Forma Financial Information
The following unaudited pro forma consolidated statement of operations data is presented for supplemental information purposes only. The unaudited pro forma consolidated statement of operations data does not purport to represent what our results of operations would have been had the Merger occurred on the dates specified, and it does not purport to project our results of operations or financial condition for any future period. The unaudited pro forma consolidated statement of operations data should be read in conjunction with this “Management’s Discussion and Analysis of Financial Condition and Results of Operations,” as well as “Selected Historical Consolidated Financial Information” and our consolidated financial statements and related notes thereto appearing elsewhere in this annual report on Form 10-K. The pro forma adjustments are based upon available information and certain assumptions that we believe are reasonable. All pro forma adjustments and their underlying assumptions are described more fully in the notes to our unaudited pro forma consolidated statements of operations. We are providing information on a pro forma basis, giving effect to the Transactions, to provide a supplemental analysis of our results of operations.
The unaudited consolidated pro forma statements of operations data has been derived by applying pro forma adjustments to our historical consolidated statements of operations contained elsewhere in this annual report on Form 10-K. The Merger, which occurred on November 16, 2012, was accounted for as a business combination. As a result of the Merger, we applied purchase accounting in accordance with ASC 805 Business Combinations, which required that our assets and liabilities be recorded at their respective fair values as of the Merger date. Our historical consolidated financial statements for the year ended December 31, 2012 are presented for two periods: the Predecessor Period from January 1, 2012 through November 16, 2012 and the Successor Period ended December 31, 2012, which relate to the period preceding the Merger and the period succeeding the Merger, respectively.
The unaudited pro forma consolidated statement of operations data for the year ended December 31, 2012 has been derived by (i) adding the historical audited consolidated statement of operations for the Predecessor Period from January 1, 2012 through November 16, 2012 and the historical audited consolidated statement of operations for the Successor Period ended December 31, 2012 and (ii) applying pro forma adjustments to give effect to the Transactions as if they had occurred on January 1, 2012.
The pro forma consolidated statements of operations data included in this annual report on Form 10-K includes the results of Solar, which was considered a variable interest entity. As a result of the Merger, while Solar was a variable interest entity through the date of Solar’s initial public offering, we are no longer its primary beneficiary. Accordingly, Solar is no longer required to be included in the consolidated financial statements of the Company. In addition, the pro forma statements of operations included in this annual report on Form 10-K include the results of 2GIG. On April 1, 2013, we completed the 2GIG Sale. Solar and 2GIG do not and will not provide any credit support for any of our indebtedness, including indebtedness incurred under our revolving credit facility, our 2019 notes or our 2020 notes.
43
Table of Contents
Unaudited Pro Forma Condensed Statements of Operations
Fiscal Year Ended December 31, 2012
| Successor | Predecessor | |||||||||||||||||
| Period from November 17, through December 31, 2012 (Actual) |
Period from January 1, through November 16, 2012 (Actual) |
Adjustments | Pro Forma Year Ended December 31, 2012 |
|||||||||||||||
| (in thousands) | ||||||||||||||||||
| Revenue: |
||||||||||||||||||
| Monitoring revenue |
||||||||||||||||||
| Vivint |
$ | 48,984 | $ | 324,691 | $ | (834 | )(1) | $ | 372,841 | |||||||||
| 2GIG |
138 | 580 | — | 718 | ||||||||||||||
|
|
|
|
|
|
|
|
|
|||||||||||
| Total monitoring revenue |
49,122 | 325,271 | (834 | ) | 373,559 | |||||||||||||
| Service and other sales revenue |
||||||||||||||||||
| Vivint |
1,796 | 16,091 | — | 17,887 | ||||||||||||||
| 2GIG |
6,677 | 50,720 | — | 57,397 | ||||||||||||||
|
|
|
|
|
|
|
|
|
|||||||||||
| Total service and other sales revenue |
8,473 | 66,811 | — | 75,284 | ||||||||||||||
| Activation fees |
||||||||||||||||||
| Vivint |
11 | 5,331 | (3,989 | )(1) | 1,353 | |||||||||||||
| 2GIG |
— | — | — | — | ||||||||||||||
|
|
|
|
|
|
|
|
|
|||||||||||
| Total activation fees |
11 | 5,331 | (3,989 | ) | 1,353 | |||||||||||||
| Contract sales |
||||||||||||||||||
| Vivint |
— | 157 | — | 157 | ||||||||||||||
|
|
|
|
|
|
|
|
|
|||||||||||
| Total contract sales |
— | 157 | — | 157 | ||||||||||||||
|
|
|
|
|
|
|
|
|
|||||||||||
| Total revenues |
||||||||||||||||||
| Vivint |
50,791 | 346,270 | (4,823 | ) | 392,238 | |||||||||||||
| 2GIG |
6,815 | 51,300 | — | 58,115 | ||||||||||||||
|
|
|
|
|
|
|
|
|
|||||||||||
| Total revenues |
57,606 | 397,570 | (4,823 | ) | 450,353 | |||||||||||||
| Costs and expenses: |
||||||||||||||||||
| Operating expenses |
||||||||||||||||||
| Vivint |
16,115 | 114,258 | (1,571 | )(2) | 128,802 | |||||||||||||
| 2GIG |
4,584 | 31,539 | 1,912 | (3) | 38,035 | |||||||||||||
|
|
|
|
|
|
|
|
|
|||||||||||
| Total operating expenses |
20,699 | 145,797 | 341 | 166,837 | ||||||||||||||
| Cost of contract sales |
||||||||||||||||||
| Vivint |
— | 95 | — | 95 | ||||||||||||||
|
|
|
|
|
|
|
|
|
|||||||||||
| Total cost of contract sales |
— | 95 | — | 95 | ||||||||||||||
| Selling expenses |
||||||||||||||||||
| Vivint |
12,284 | 91,559 | (34,022 | )(2) | 78,075 | |||||||||||||
| 8,318 | (4) | |||||||||||||||||
| (64 | )(5) | |||||||||||||||||
|
|
|
|
|
|
|
|
|
|||||||||||
| Total selling expenses |
12,284 | 91,559 | (25,768 | ) | 78,075 | |||||||||||||
| General and administrative expenses |
||||||||||||||||||
| Vivint |
$ | 6,946 | $ | 78,772 | $ | (35,048 | )(2) | $ | 52,225 | |||||||||
| 1,209 | (6) | |||||||||||||||||
| 2,243 | (7) | |||||||||||||||||
| (1,716 | )(5) | |||||||||||||||||
| (181 | )(8) | |||||||||||||||||
| 2GIG |
2,575 | 21,200 | (436 | )(5) | 23,339 | |||||||||||||
|
|
|
|
|
|
|
|
|
|||||||||||
| Total general and administrative expenses |
9,521 | 99,972 | (33,929 | ) | 75,564 | |||||||||||||
44
Table of Contents
| Successor | Predecessor | |||||||||||||||||
| Period from November 17, through December 31, 2012 (Actual) |
Period from January 1, through November 16, 2012 (Actual) |
Adjustments | Pro Forma Year Ended December 31, 2012 |
|||||||||||||||
| (in thousands) | ||||||||||||||||||
| Transaction related expenses |
||||||||||||||||||
| Vivint |
28,118 | 22,219 | (50,337 | )(9) | — | |||||||||||||
| 2GIG |
3,767 | 1,242 | (5,009 | )(9) | — | |||||||||||||
|
|
|
|
|
|
|
|
|
|||||||||||
| Total transaction related expenses |
31,885 | 23,461 | (55,346 | ) | — | |||||||||||||
| Depreciation and amortization |
||||||||||||||||||
| Vivint |
10,896 | 80,616 | 75,740 | (10) | 167,252 | |||||||||||||
| 2GIG |
514 | (937 | ) | 6,481 | (10) | 6,058 | ||||||||||||
|
|
|
|
|
|
|
|
|
|||||||||||
| Total depreciation and amortization expenses |
11,410 | 79,679 | 82,221 | 173,310 | ||||||||||||||
|
|
|
|
|
|
|
|
|
|||||||||||
| Total costs and expenses |
||||||||||||||||||
| Vivint |
74,359 | 387,519 | (35,429 | ) | 426,449 | |||||||||||||
| 2GIG |
11,440 | 53,044 | 2,948 | 67,432 | ||||||||||||||
|
|
|
|
|
|
|
|
|
|||||||||||
| Total costs and expenses |
85,799 | 440,563 | (32,481 | ) | 493,881 | |||||||||||||
|
|
|
|
|
|
|
|
|
|||||||||||
| Loss from operations |
(28,193 | ) | (42,993 | ) | 27,658 | (43,528 | ) | |||||||||||
| Other expenses: |
||||||||||||||||||
| Interest expense, net |
(12,641 | ) | (106,559 | ) | 15,234 | (11) | (103,966 | ) | ||||||||||
| Other expenses |
(171 | ) | (122 | ) | (287 | )(12) | (580 | ) | ||||||||||
|
|
|
|
|
|
|
|
|
|||||||||||
| Loss from continuing operations before income taxes |
(41,005 | ) | (149,674 | ) | 42,605 | (148,074 | ) | |||||||||||
| Income tax (benefit) expense |
(10,903 | ) | 4,923 | — | (13) | (5,980 | ) | |||||||||||
|
|
|
|
|
|
|
|
|
|||||||||||
| Net loss from continuing operations |
$ | (30,102 | ) | $ | (154,597 | ) | $ | 42,605 | $ | (142,094 | ) | |||||||
|
|
|
|
|
|
|
|
|
|||||||||||
See Notes to Unaudited Pro Forma Condensed Statements of Operations
45
Table of Contents
Notes to Unaudited Pro Forma Condensed Statements of Operations
| (1) | Reflects the adjustment to revenue as a result of the reduction of deferred revenue to its fair value in connection with the Transactions in accordance with the FASB Accounting Standards Codification Business Combination Topic. |
| (2) | Represents nonrecurring bonuses and other payments to employees directly related to the Merger. |
| (3) | Represents the impact on the cost of systems sold by 2GIG to third parties resulting from the revaluation of inventory to its fair value as of the beginning of the period. |
| (4) | Reflects Company obligations settled in conjunction with the Merger that have an ongoing service requirement. |
| (5) | Reflects the elimination of stock-related compensation expenses associated with equity awards fully vested and settled in connection with the Merger. |
| (6) | Reflects the monitoring fee payable by us pursuant to the support and services agreement with an affiliate of Blackstone. See “Certain Relationships and Related Party Transactions, and Director Independence” |
| (7) | Reflects stock-based compensation costs related to equity awards granted in connection with the Merger. |
| (8) | Reflects the elimination of certain liabilities as a result of the Merger. |
| (9) | Reflects the elimination of non-recurring accounting, investment banking, legal and professional fees that were directly associated with the Merger. |
| (10) | Represents the net increase in depreciation and amortization expense due to fair value adjustments made as part of purchase price accounting related to definite-lived intangible assets with estimated useful lives as follows: |
| Fair Value | Estimated Useful Life (Years) |
Annual Amortization |
||||||||||
| Calculation of annualized amortization of definite-lived intangible assets: |
||||||||||||
| Customer contracts(1) |
$ | 990,777 | 10 | $ | 157,093 | |||||||
| 2GIG customer relationships |
45,000 | 10 | 3,710 | |||||||||
| 2GIG 2.0 technology |
17,000 | 8 | — | |||||||||
| 2GIG 1.0 technology |
8,000 | 6 | 3,172 | |||||||||
| CMS technology |
2,300 | 5 | 460 | |||||||||
|
|
|
|
|
|||||||||
| $ | 1,063,077 | $ | 164,435 | |||||||||
|
|
|
|
|
|||||||||
| Calculation of the pro forma adjusted to depreciation and amortization: |
||||
| Annual total amortization (from table above) |
$ | 164,435 | ||
| Historical amortization for 2012 Successor and Predecessor periods |
(10,058 | ) | ||
|
|
|
|||
| Pro Forma adjustment—acquired intangibles amortization |
154,377 | |||
| Subscriber acquisition costs amortization |
181 | |||
| Historical subscriber acquisition costs amortization in Successor period |
(72,337 | ) | ||
|
|
|
|||
| Pro Forma adjustment—subscriber acquisition costs |
(72,156 | ) | ||
|
|
|
|||
| Total Pro Forma adjustment—depreciation and amortization |
$ | 82,221 | ||
|
|
|
| (1) | Subscriber acquisition costs before the Merger are now included in customer contracts. |
Identifiable long-lived intangible assets are amortized on a basis that approximates the underlying net cash flows resulting from the associated intangible asset.
46
Table of Contents
| (11) | Reflects the net decrease in interest expense resulting from elimination of the interest expense incurred on predecessor debt that was repaid at the time of the Merger, partially offset by interest expense on our new long-term debt issued in connection with the Merger and without giving pro forma effect to interest expense associated with the Subsequent Notes Offerings as follows: |
| Interest on Senior Secured Notes due 2019 |
$ | 51,751 | ||
| Interest on Senior Notes due 2020 |
29,186 | |||
| Interest on revolving line of credit and unused fees |
1,358 | |||
| Amortization of deferred loan costs |
7,413 | |||
|
|
|
|||
| Total interest related to new debt issued |
89,708 | |||
| Less: Historical obligations settled in Merger: |
||||
| Interest related to historical term loans |
87,322 | |||
| Interest on historical revolving line of credit and unused fees |
2,320 | |||
| Amortization of deferred loan costs on historical debt |
6,458 | |||
| Imputed interest on liabilities settled in Merger |
8,842 | |||
|
|
|
|||
| Total interest on obligations settled in Merger |
104,942 | |||
|
|
|
|||
| Pro Forma adjustment |
$ | 15,234 | ||
|
|
|
| (12) | Reflects the fair value adjustment related to warrant liabilities settled in the Merger. |
| (13) | No income tax expense (benefit) relating to the pro forma adjustments herein was recognized as we continue to be in a net operating loss position and net operating loss carryforwards have been offset by a valuation allowance. |
Year Ended December 31, 2013 compared to the Pro Forma Year Ended December 31, 2012—Vivint
Revenues
The following table provides the significant components of our revenue for the year ended December 31, 2013, the Successor Period ended December 31, 2012, the Predecessor Period ended November 16, 2012 and the Pro Forma Year ended December 31, 2012 (in thousands):
| Successor | Predecessor | % Change | ||||||||||||||||||||
| Year Ended December 31, 2013 |
Period from November 17 through December 31, 2012 |
Period from January 1 through November 16, 2012 |
Pro Forma Year Ended December 31, 2012 |
2013 Actual vs. Pro Forma 2012 |
||||||||||||||||||
| (unaudited) | ||||||||||||||||||||||
| Monitoring revenue |
$ | 459,681 | $ | 48,984 | $ | 324,691 | $ | 372,841 | 23 | % | ||||||||||||
| Service and other sales revenue |
22,077 | 1,796 | 16,091 | 17,887 | 23 | |||||||||||||||||
| Activation fees |
1,643 | 11 | 5,331 | 1,353 | 21 | |||||||||||||||||
| Contract Sales |
— | — | 157 | 157 | — | |||||||||||||||||
|
|
|
|
|
|
|
|
|
|
|
|||||||||||||
| Total revenues |
$ | 483,401 | $ | 50,791 | $ | 346,270 | $ | 392,238 | 23 | % | ||||||||||||
|
|
|
|
|
|
|
|
|
|
|
|||||||||||||
Total revenues increased $91.2 million, or 23%, for the year ended December 31, 2013 as compared to the Pro Forma Year ended December 31, 2012, primarily due to the growth in monitoring revenue, which increased $86.8 million, or 23%. This increase resulted from $74.2 million of fees from the net addition of approximately 124,000 subscribers and a $19.0 million increase from continued growth in the percentage of our subscribers contracting for new products and service packages, partially offset by an increase of $5.8 million in refunds and other adjustments resulting from the revenue growth.
Service and other sales revenue increased $4.2 million, or 23%, for the year ended December 31, 2013 as compared to the Pro Forma Year ended December 31, 2012. This growth was primarily due to an increase in upgrade revenue related to subscriber service upgrades and purchases of additional equipment.
Activation fees increased $0.3 million, or 21%, for the year ended December 31, 2013 as compared to the Pro Forma Year ended December 31, 2012, primarily due an increase in the number of subscribers being billed activation fees.
47
Table of Contents
Costs and Expenses
The following table provides the significant components of our costs and expenses for the year ended December 31, 2013, the Successor Period ended December 31, 2012, the Predecessor Period ended November 16, 2012 and the Pro Forma Year ended December 31, 2012 (in thousands):
| Successor | Predecessor | Pro Forma Year Ended December 31, 2012 |
% Change | |||||||||||||||||||||
| Year Ended December 31, 2013 |
Period from November 17 through December 31, 2012 |
Period from January 1 through November 16, 2012 |
2013 Actual vs. Pro Forma 2012 |
|||||||||||||||||||||
| (unaudited) | ||||||||||||||||||||||||
| Operating expenses |
$ | 152,554 | $ | 16,115 | $ | 114,258 | $ | 128,802 | 18 | % | ||||||||||||||
| Cost of contract sales |
— | — | 95 | 95 | — | |||||||||||||||||||
| Selling expenses |
98,884 | 12,284 | 91,559 | 78,075 | 27 | |||||||||||||||||||
| General and administrative |
91,696 | 6,946 | 78,772 | 52,225 | 76 | |||||||||||||||||||
| Transaction related expenses |
— | 28,118 | 22,219 | — | — | |||||||||||||||||||
| Depreciation and amortization |
193,368 | 10,896 | 80,616 | 167,252 | 16 | |||||||||||||||||||
|
|
|
|
|
|
|
|
|
|
|
|||||||||||||||
| Total costs and expenses |
$ | 536,502 | $ | 74,359 | $ | 387,519 | $ | 426,449 | 26 | % | ||||||||||||||
|
|
|
|
|
|
|
|
|
|
|
|||||||||||||||
Operating expenses increased $23.8 million, or 18%, for the year ended December 31, 2013 as compared to the Pro Forma Year ended December 31, 2012, primarily to support the growth in our subscriber base. This increase was principally comprised of $10.0 million in personnel costs within our monitoring, customer support and field service functions, a $7.7 million increase in inventory used in subscriber upgrades and service repairs, a $3.6 million increase in cellular communications fees related to our monitoring services and a $3.1 million increase in shipping expenses resulting from the growth in our subscriber base.
Selling expenses, excluding amortization of capitalized subscriber acquisition costs, increased $20.8 million, or 27%, for the year ended December 31, 2013 as compared to the Pro Forma Year ended December 31, 2012, primarily due to a $7.2 million increase in personnel costs and a $4.7 million increase in facility and information technology costs, all to support the increase in our subscriber contract originations. In addition, advertising costs increased by $7.7 million, primarily in support of the growth in our inside sales subscriber contract originations.
General and administrative expenses increased $39.5 million, or 76%, for the year ended December 31, 2013 as compared to the Pro Forma Year ended December 31, 2012, primarily due to an $11.9 million increase in personnel costs, a $6.6 million increase in outside contracted services, primarily related to increased legal and compliance costs, a $2.9 million increase in monitoring, advisory and consulting services under a support and services agreement with Blackstone Management Partners L.L.C, a $1.5 million increase in facility costs and a $1.1 million increase in sponsorship and advertising costs, all to support the growth in our business. We also reserved $6.0 million related to legal contingencies and incurred $5.4 million in bonus and other transaction costs related to the 2GIG Sale. Depreciation and amortization increased $26.1 million, or 16%, for the year ended December 31, 2013 as compared to the Pro Forma Year ended December 31, 2012. The increase was primarily due to increased amortization of subscriber contract costs.
Year Ended December 31, 2013 compared to the Pro Forma Year Ended December 31, 2012—2GIG
All intercompany revenue and expenses between Vivint and 2GIG have been eliminated in consolidation and from the amounts presented below (in thousands):
48
Table of Contents
| Successor | Predecessor | % Change | ||||||||||||||||||||
| Year Ended December 31, 2013 |
Period from November 17 through December 31, 2012 |
Period from January 1 through November 16, 2012 |
Pro Forma Year Ended December 31, 2012 |
2013 Actual vs. Pro Forma 2012 |
||||||||||||||||||
| (unaudited) | ||||||||||||||||||||||
| Total revenue |
$ | 17,507 | $ | 6,815 | $ | 51,300 | $ | 58,115 | (70 | )% | ||||||||||||
| Operating expenses |
(11,667 | ) | (4,584 | ) | (31,539 | ) | (38,035 | ) | (69 | ) | ||||||||||||
| General and administrative |
(5,481 | ) | (2,575 | ) | (21,200 | ) | (23,339 | ) | (77 | ) | ||||||||||||
| Transaction related expenses |
— | (3,767 | ) | (1,242 | ) | — | — | |||||||||||||||
| Other (expenses) income |
(2,138 | ) | (514 | ) | 937 | (6,058 | ) | (65 | ) | |||||||||||||
|
|
|
|
|
|
|
|
|
|
|
|||||||||||||
| Loss from operations |
$ | (1,779 | ) | $ | (4,625 | ) | $ | (1,744 | ) | $ | (9,317 | ) | (81 | )% | ||||||||
|
|
|
|
|
|
|
|
|
|
|
|||||||||||||
Revenues
Revenues decreased $40.6 million, or 70%, for the year ended December 31, 2013 as compared to the Pro Forma Year ended December 31, 2012, primarily due to the sale of 2GIG on April 1, 2013. Following the 2GIG Sale, we excluded 2GIG’s results of operations from our statement of operations.
Costs and Expenses
Operating expenses decreased $26.4 million, or 69%, for the year ended December 31, 2013 as compared to the Pro Forma Year ended December 31, 2012, primarily due to the 2GIG Sale on April 1, 2013. General and administrative expenses decreased $17.9 million, or 77%, for the year ended December 31, 2013 as compared to the Pro Forma Year ended December 31, 2012, also primarily due to the 2GIG Sale. Other expenses in the year ended December 31, 2013 primarily represented amortization of intangible assets acquired in the Merger.
Year Ended December 31, 2013 compared to the Pro Forma Year Ended December 31, 2012—Consolidated
Other Expenses, net
The following table provides the significant components of our other expenses, net, for the year ended December 31, 2013, the Successor Period ended December 31, 2012, the Predecessor Period ended November 16, 2012 and the Pro Forma Year ended December 31, 2012 (in thousands):
| Successor | Predecessor | % Change | ||||||||||||||||||||
| Year Ended December 31, 2013 |
Period from November 17 through December 31, 2012 |
Period from January 1 through November 16, 2012 |
Pro Forma Year Ended December 31, 2012 |
2013 Actual vs. Pro Forma 2012 |
||||||||||||||||||
| (unaudited) | ||||||||||||||||||||||
| Interest expense |
$ | 114,476 | $ | 12,645 | $ | 106,620 | $ | 104,031 | 10 | % | ||||||||||||
| Interest income |
(1,493 | ) | (4 | ) | (61 | ) | (65 | ) | — | |||||||||||||
| Gain on 2GIG Sale |
(46,866 | ) | — | — | — | — | ||||||||||||||||
| Other (income) expenses |
(76 | ) | 171 | 122 | 580 | (113 | ) | |||||||||||||||
|
|
|
|
|
|
|
|
|
|
|
|||||||||||||
| Total other expenses, net |
$ | 66,041 | $ | 12,812 | $ | 106,681 | $ | 104,546 | (37 | )% | ||||||||||||
|
|
|
|
|
|
|
|
|
|
|
|||||||||||||
Interest expense increased $10.4 million, or 10%, for the year ended December 31, 2013 as compared to the Pro Forma Year ended December 31, 2012, primarily due to a higher principal balance associated with the May 2013 Notes Offering. During the year ended December 31, 2013, we realized a gain of $46.9 million as a result of the 2GIG Sale. See Note 3 to the accompanying consolidated financial statements for additional information.
49
Table of Contents
Income Tax From Continuing Operations
The following table provides the significant components of our income tax from continuing operations for the year ended December 31, 2013, the Successor Period ended December 31, 2012, the Predecessor Period ended November 16, 2012 and the Pro Forma Year ended December 31, 2012 (in thousands):
| Successor | Predecessor | % Change | ||||||||||||||||||||
| Year Ended December 31, 2013 |
Period from November 17 through December 31, 2012 |
Period from January 1 through November 16, 2012 |
Pro Forma Year Ended December 31, 2012 |
2013 Actual vs. Pro Forma 2012 |
||||||||||||||||||
| (unaudited) | ||||||||||||||||||||||
| Income tax expense (benefit) |
$ | 3,592 | $ | (10,903 | ) | $ | 4,923 | $ | (5,980 | ) | (160 | )% | ||||||||||
Income tax expense was $3.6 million for the year ended December 31, 2013 as compared to an income tax benefit of $6.0 million for the Pro Forma year ended December 31, 2012. The increase of approximately $9.6 million, or 160%, was primarily related to the elimination of 2GIG’s deferred tax liability in conjunction with the 2GIG Sale. As a result, after the 2GIG Sale, we were in a net deferred tax asset position and recorded an off-setting valuation allowance.
Unaudited Quarterly Results of Operations
The following tables present our unaudited quarterly consolidated results of operations for the eight Successor quarters ended December 31, 2014 and 2013. This unaudited quarterly consolidated information has been prepared on the same basis as our audited consolidated financial statements and, in the opinion of management, the statement of operations data includes all adjustments, consisting of normal recurring adjustments, necessary for the fair presentation of the results of operations for these periods. You should read these tables in conjunction with our audited consolidated financial statements and related notes located elsewhere in this annual report on Form 10-K. The results of operations for any quarter are not necessarily indicative of the results of operations for a full year or any future periods.
| Successor | ||||||||||||||||
| Three Months Ended | ||||||||||||||||
| December 31, 2014 |
September 30, 2014 (1) |
June 30, 2014 (1) |
March 31, 2014 |
|||||||||||||
| (in thousands) | ||||||||||||||||
| Statement of operations data |
||||||||||||||||
| Revenue |
$ | 152,430 | $ | 146,895 | $ | 134,199 | $ | 130,154 | ||||||||
| Loss from operations |
(28,796 | ) | (22,398 | ) | (30,446 | ) | (12,229 | ) | ||||||||
| Net loss |
(65,645 | ) | (59,464 | ) | (66,271 | ) | (47,280 | ) | ||||||||
| Successor | ||||||||||||||||
| Three Months Ended | ||||||||||||||||
| December 31, 2013 |
September 30, 2013 |
June 30, 2013 |
March 31, 2013 |
|||||||||||||
| (in thousands) | ||||||||||||||||
| Statement of operations data |
||||||||||||||||
| Revenue |
$ | 132,711 | $ | 129,503 | $ | 114,252 | $ | 124,442 | ||||||||
| Loss from operations |
(14,470 | ) | (8,689 | ) | (23,729 | ) | (7,992 | ) | ||||||||
| Net loss |
(37,172 | ) | (34,905 | ) | (21,527 | ) | (30,909 | ) | ||||||||
| (1) | During the three months ended September 30, 2014, we recorded certain out-of-period adjustments totaling $3.8 million, primarily associated with equipment recorded as subscriber acquisition costs rather than operating expenses during the three months ended June 30, 2014 due to a reporting error identified during an information technology system implementation and included other immaterial items. As a results of these adjustments, subscriber acquisition costs decreased by $3.4 million and total operating expenses increased by $3.8 million. |
Liquidity and Capital Resources
Our primary source of liquidity has historically been cash from operations, proceeds from the issuance of debt securities and borrowing availability under our revolving credit facility. As of December 31, 2014, we had $10.8 million of cash and $177.0 million of availability under our revolving credit facility (after giving effect to $3.0 million of letters of credit outstanding and $20.0 million of borrowings). On July 1, 2014, we issued and sold an additional $100.0 million of our
50
Table of Contents
2020 notes. On September 3, 2014, APX Group, Inc. paid a dividend in the amount of $50.0 million to APX Group Holdings, Inc., its sole stockholder, which in turn paid a dividend in the amount of $50.0 million to its stockholders. Subsequent to year end, our revolving credit facility agreement was amended and restated as described in Note 21.
On October 10, 2014, in connection with the completion of its initial public offering, Solar repaid loans to APX Group, Inc., our wholly-owned subsidiary, and to our parent entity. Our parent entity, in turn, returned a portion of such proceeds to APX Group, Inc. as a capital contribution. These transactions resulted in the receipt by APX Group, Inc. of an aggregate amount of $55.0 million.
As market conditions warrant, we and our major equity holders, including the Sponsor and its affiliates, may from time to time, seek to repurchase debt securities that we have issued or loans that we have borrowed, including the notes and borrowings under our revolving credit facility, in privately negotiated or open market transactions, by tender offer or otherwise. Any such repurchases may be funded by incurring new debt, including additional borrowings under our revolving credit facility. Any new debt may be secured debt. We may also use available cash on our balance sheet. The amounts involved in any such transactions, individually or in the aggregate, may be material. Further, any such purchases may result in our acquiring and retiring a substantial amount of any particular series, with the attendant reduction in the trading liquidity of any such series. Depending on conditions in the credit and capital markets and other factors, we will, from time to time, consider various financing transactions, the proceeds of which could be used to refinance our indebtedness or for other purposes.
Cash Flow and Liquidity Analysis
Significant factors influencing our liquidity position include cash flows generated from monitoring and other fees received from the subscribers we service and the level of investment in capitalized subscriber acquisition costs and general and administrative expenses. Our cash flows provided by operating activities include cash received from RMR, along with upfront activation fees, upgrade and other maintenance and repair fees. Cash used in operating activities includes the cash costs to monitor and service those subscribers, and certain costs, principally marketing and the portion of subscriber acquisition costs that are expensed and general and administrative costs. Except for the Successor Period from November 17 through December 31, 2012, we have historically generated, and expect to continue generating, positive cash flows from operating activities. Historically, we financed subscriber acquisition costs through our operating cash flows, the issuance of debt, and to a lesser extent, through the issuance of equity and contract sales to third parties.
The direct-to-home sales are seasonal in nature. We make investments in the recruitment of our direct-to-home sales force and the inventory for the April through August sales period prior to each sales season. We experience increases in subscriber acquisition costs, as well as costs to support the sales force throughout North America, during this time period.
The following table provides a summary of cash flow data (in thousands):
| Successor | Predecessor | |||||||||||||||||
| Year ended December 31, 2014 |
Year ended December 31, 2013 |
Period from November 17, through December 31, 2012 |
Period from January 1, through November 16, 2012 |
|||||||||||||||
| Net cash provided by (used in) operating activities |
$ | 3,349 | $ | 79,425 | $ | (25,243 | ) | $ | 95,371 | |||||||||
| Net cash used in investing activities |
(349,270 | ) | (176,638 | ) | (1,949,454 | ) | (270,246 | ) | ||||||||||
| Net cash provided by financing activities |
95,057 | 351,147 | 1,982,746 | 189,504 | ||||||||||||||
Cash Flows from Operating Activities
We generally reinvest the cash flows from operating activities into our business, primarily to (1) maintain and grow our subscriber base (2) expand our infrastructure to support this growth (3) enhance our existing service offerings and (4) develop new service offerings. These investments are focused on generating new subscribers, increasing the revenue from our existing subscriber base, enhancing the overall quality of service provided to our subscribers, increasing the productivity and efficiency of our workforce and back-office functions necessary to scale our business.
51
Table of Contents
For the year ended December 31, 2014, net cash provided by operating activities was $3.3 million. This cash was primarily generated from a net loss of ($238.7) million, adjusted for $232.5 million in non-cash amortization, depreciation and stock-based compensation, and a $20.6 million increase in fees paid by subscribers in advance of when the associated revenue is recognized. This was partially offset by a $21.9 million increase in accounts receivable, primarily related to the growth in our revenues and timing of our billing cycle.
For the year ended December 31, 2013, net cash provided by operating activities was $79.4 million. This cash was primarily generated from a net loss of ($124.5) million, adjusted for $206.1 million in non-cash amortization, depreciation and stock-based compensation, a $22.0 million increase in accrued expenses and other liabilities, primarily related to management bonus and incentive plans and contingent liabilities, and a $24.4 million increase in fees paid by subscribers in advance of when the associated revenue is recognized. This was partially offset by an $8.4 million increase in inventories due to the seasonality of our inventory purchases and usage.
Our outstanding debt as of December 31, 2014 was approximately $1.9 billion, approximately $1.3 billion of which was attributable to the transactions related to Blackstone’s acquisition in November 2012. Net cash interest paid for the years ended December 31, 2014 and 2013 related to our indebtedness (excluding capital leases) totaled $136.9 million and $114.8 million, respectively. Our net cash provided by operating activities for the years ended December 31, 2014 and 2013, before these interest payments, was $140.2 million and $194.2 million, respectively. Our interest payments in fiscal 2014 and 2013 represented approximately 98% and 60% of such amounts, respectively. For additional information regarding our outstanding indebtedness see “—Long-Term Debt” below.
For the Successor Period ended December 31, 2012, net cash used in operating activities was $25.2 million. This cash used was primarily from a net loss of ($30.1) million, adjusted for $12.4 million in non-cash amortization and depreciation, a $13.1 million change in deferred income taxes and a $14.3 million increase in accrued expenses and other liabilities. For the Predecessor Period from January 1, 2012 through November 16, 2012, net cash provided by operating activities was $95.4 million. This cash was primarily generated from a net loss of ($154.8) million, including discontinued operations, adjusted for $88.7 million in non-cash amortization, depreciation and stock-based compensation expenses, a $109.5 million increase in accrued expenses and other liabilities, principally related to bonuses and other payments to employees directly related to the Transactions and commissions associated with direct-to-home sales. Operating cash was also generated from $26.3 million in fees paid by subscribers in advance of when the associated revenue is recognized.
Cash Flows from Investing Activities
Historically, our investing activities have primarily consisted of capitalized subscriber acquisition costs, capital expenditures, business combinations and technology acquisitions. Capital expenditures primarily consist of periodic additions to property and equipment to support the growth in our business.
For the year ended December 31, 2014, net cash used in investing activities was $349.3 million, consisting primarily of capitalized subscriber acquisition costs of $321.9 million, capital expenditures of $32.2 million, a portion of which related to our wireless internet infrastructure, strategic acquisitions of $18.5 million related to Wildfire Broadband, LLC and Space Monkey and the acquisition of certain patents and other intangible assets of $9.6 million. This was offset by net cash of $22.7 million received in connection with the notes receivable from Solar (see Note 4 of our consolidated financial statements included elsewhere in this annual report on Form 10-K for additional information) and $14.4 million released from restricted cash.
For the year ended December 31, 2013, net cash used in investing activities was $176.6 million, consisting primarily of $298.6 million of capitalized subscriber acquisition costs, $8.7 million of capital expenditures and $4.3 million of intangible asset acquisition costs, partially offset by $144.8 million of proceeds from the 2GIG Sale.
For the Successor Period ended December 31, 2012 and the Predecessor Period from January 1, 2012 through November 16, 2012, net cash used in investing activities was $1,949.5 million and $270.2 million, respectively. In the Successor Period, our cash used in investing activities primarily consisted of $1,915.5 million of cash used to complete the Transactions, capitalized subscriber acquisition costs of $12.9 million and capital expenditures of $1.5 million. In the Predecessor Period, cash used in investing activities primarily consisted of $263.7 million of capitalized subscriber acquisition costs and capital expenditures of $5.9 million.
Cash Flows from Financing Activities
Historically, our cash flows provided by financing activities primarily related to the issuance of debt to fund the portion of upfront costs associated with generating new subscribers that are not covered through our operating cash flows. Uses of cash for financing activities are generally associated with the payment of dividends to our stockholders and the repayment of debt.
52
Table of Contents
For the year ended December 31, 2014, net cash provided by financing activities was $95.1 million, consisting primarily of $102.0 million in proceeds from the July 2014 Notes Offering, $32.3 million of equity contributions and $20.0 million in borrowings from our revolving credit facility, partially offset by $50.0 million of payments of dividends.
For the year ended December 31, 2013, net cash provided by financing activities was $351.1 million, consisting primarily of $457.3 million in proceeds from the 2013 Notes Offerings, $22.5 million of borrowings from our revolving credit facility, partially offset by $60.0 million of payments of dividends from the 2GIG sale proceeds and $50.5 million of repayments of our revolving credit facility.
For the Successor Period ended December 31, 2012 and the Predecessor Period from January 1, 2012 through November 16, 2012, net cash provided by financing activities was $1,982.7 million and $189.5 million, respectively. In the Successor Period, our net cash provided by financing activities was primarily from $1,305.0 million of proceeds from the issuance of $925.0 million aggregate principal amount of 2019 notes and $380.0 million aggregate principal amount of 2020 notes, borrowings under our revolving credit facility of $28.0 million and $708.5 million from the issuance of our common stock in connection with the Transactions, partially offset by $58.4 million in payments of deferred financing costs. For the Predecessor Period, our net cash provided by financing activities primarily consisted of $116.2 million of proceeds under our previous credit agreement and $105.0 million of borrowings under our revolving credit facility, partially offset by $42.2 million of repayments of the revolving credit facility, $6.7 million in payments of deferred financing costs and $4.1 million in repayments of capital lease obligations.
Long-Term Debt
Following the Transactions, we remain a highly leveraged company with significant debt service requirements. As of December 31, 2014, we had approximately $1,875.0 million of total debt outstanding, consisting of $925.0 million of outstanding 2019 notes and $930.0 million of outstanding 2020 notes, with $177.0 million of availability (after giving effect to $3.0 million of letters of credit outstanding and $20.0 million of borrowings and not giving effect to the March 2015 amendment and restatement of our revolving credit facility discussed below).
Revolving Credit Facility
On November 16, 2012, we entered into a $200.0 million senior secured revolving credit facility, with a five year maturity, of which $177.0 million was undrawn and available as of December 31, 2014 (after giving effect to $3.0 million of outstanding letters of credit and $20.0 million of borrowings as of December 2014). In addition, we may request one or more term loan facilities, increased commitments under the revolving credit facility or new revolving credit commitments, in an aggregate amount not to exceed $225.0 million. Availability of such incremental facilities and/or increased or new commitments will be subject to certain customary conditions.
On June 28, 2013, we amended and restated the credit agreement to provide for a new repriced tranche of revolving credit commitments with a lower interest rate. Nearly all of the existing tranches of revolving credit commitments was terminated and converted into the repriced tranche, with the unterminated portion of the existing tranche continuing to accrue interest at the original higher rate.
On March 6, 2015, we amended and restated the credit agreement to provide for, among other things, (1) an increase in the aggregate commitments previously available to us from $200.0 million to $289.4 million and (2) the extension of the maturity date with respect to certain of the previously available commitments.
Borrowings under the amended and restated revolving credit facility bear interest at a rate per annum equal to an applicable margin plus, at our option, either (1) the base rate determined by reference to the highest of (a) the Federal Funds rate plus 0.50%, (b) the prime rate of Bank of America, N.A. and (c) the LIBOR rate determined by reference to the costs of funds for U.S. dollar deposits for an interest period of one month, plus 1.00% or (2) the LIBOR rate determined by reference to the London interbank offered rate for dollars for the interest period relevant to such borrowing. The applicable margin for base rate-based borrowings (1)(a) under the Series A Revolving Commitments of approximately $247.5 million and Series C Revolving Commitments of approximately $20.8 million is currently 2.0% per annum and (b) under the Series B Revolving Commitments of approximately $21.2 million is currently 3.0% and (2)(a) the applicable margin for LIBOR rate-based borrowings (a) under the Series A Revolving Commitments and Series C Revolving Commitments is currently 3.0% per annum and (b) under the Series B Revolving Commitments is currently 4.0%. The applicable margin for borrowings under the revolving credit facility is subject to one step-down of 25 basis points based on our meeting a consolidated first lien net leverage ratio test at the end of each fiscal quarter.
53
Table of Contents
In addition to paying interest on outstanding principal under the revolving credit facility, we are required to pay a quarterly commitment fee (which will be subject to one step-down based on our meeting a consolidated first lien net leverage ratio test) to the lenders under the revolving credit facility in respect of the unutilized commitments thereunder. We also pay customary letter of credit and agency fees.
We are not required to make any scheduled amortization payments under the revolving credit facility. The principal amount outstanding under the revolving credit facility will be due and payable in full on (1) with respect to the non-extended commitments under the Series C Revolving Credit Facility, November 16, 2017 and (2) with respect to the extended commitments under the Series A Revolving Credit Facility and Series B Revolving Credit Facility, March 31, 2019.
2019 Notes
On November 16, 2012, we issued $925.0 million of the 2019 notes. Interest on the 2019 notes is payable semi-annually in arrears on each June 1 and December 1.
We may, at our option, redeem at any time and from time to time prior to December 1, 2015, some or all of the 2019 notes at 100% of their principal amount thereof plus accrued and unpaid interest to the redemption date plus a “make-whole premium.” Prior to December 1, 2015, during any twelve month period, we also may, at our option, redeem at any time and from time to time up to 10% of the aggregate principal amount of the issued 2019 notes at a price equal to 103% of the principal amount thereof, plus accrued and unpaid interest. From and after December 1, 2015, we may, at our option, redeem at any time and from time to time some or all of the 2019 notes at 104.781%, declining ratably on each anniversary thereafter to par from and after December 1, 2018, in each case, plus any accrued and unpaid interest to the date of redemption. In addition, on or prior to December 1, 2015, we may, at our option, redeem up to 35% of the aggregate principal amount of the 2019 notes with the proceeds from certain equity offerings at 106.37%, plus accrued and unpaid interest to the date of redemption.
2020 Notes
On November 16, 2012, we issued $380.0 million of the 2020 notes. Interest on the 2020 notes is payable semi-annually in arrears on each June 1 and December 1. During the year ended December 31, 2013, we issued an additional $450.0 million of the 2020 notes and on July 1, 2014, we issued an additional $100.0 million of the 2020 notes, each under the indenture dated as of November 16, 2012.
We may, at our option, redeem at any time and from time to time prior to December 1, 2015, some or all of the 2020 notes at 100% of their principal amount thereof plus accrued and unpaid interest to the redemption date plus a “make-whole premium.” From and after December 1, 2015, we may, at our option, redeem at any time and from time to time some or all of the 2020 notes at 106.563%, declining ratably on each anniversary thereafter to par from and after December 1, 2018, in each case, plus any accrued and unpaid interest to the date of redemption. In addition, on or prior to December 1, 2015, we may, at our option, redeem up to 35% of the aggregate principal amount of the 2020 notes with the proceeds from certain equity offerings at 108.75%, plus accrued and unpaid interest to the date of redemption.
Guarantees and Security
All of our obligations under the revolving credit facility, the 2019 notes and the 2020 notes are guaranteed by APX Group Holdings, Inc. and each of our existing and future material wholly-owned U.S. restricted subsidiaries to the extent such entities guarantee indebtedness under the revolving credit facility or our other indebtedness. See Note 19 of our consolidated financial statements included elsewhere in this annual report on Form 10-K for additional financial information regarding guarantors and non-guarantors.
The obligations under the revolving credit facility and the 2019 notes are secured by a security interest in (i) substantially all of the present and future tangible and intangible assets of APX Group, Inc., and the guarantors, including without limitation equipment, subscriber contracts and communication paths, intellectual property, fee-owned real property, general intangibles, investment property, material intercompany notes and proceeds of the foregoing, subject to permitted liens and other customary exceptions, (ii) substantially all personal property of APX Group, Inc. and the guarantors consisting of accounts receivable arising from the sale of inventory and other goods and services (including related contracts
54
Table of Contents
and contract rights, inventory, cash, deposit accounts, other bank accounts and securities accounts), inventory and intangible assets to the extent attached to the foregoing books and records of the Issuer and the guarantors, and the proceeds thereof, subject to permitted liens and other customary exceptions, in each case held by the Issuer and the guarantors and (iii) a pledge of all of the capital stock of APX Group, Inc., each of its subsidiary guarantors and each restricted subsidiary of APX Group, Inc. and its subsidiary guarantors, in each case other than excluded assets and subject to the limitations and exclusions provided in the applicable collateral documents.
Under the terms of the applicable security documents and intercreditor agreement, the proceeds of any collection or other realization of collateral received in connection with the exercise of remedies will be applied first to repay amounts due under the revolving credit facility, and up to an additional $60.0 million of “superpriority” obligations that we may incur in the future, before the holders of the 2019 notes receive any such proceeds.
Debt Covenants
The credit agreement governing the revolving credit facility and the indentures governing the notes contain a number of covenants that, among other things, restrict, subject to certain exceptions, our and our restricted subsidiaries’ ability to:
| • | incur or guarantee additional debt or issue disqualified stock or preferred stock; |
| • | pay dividends and make other distributions on, or redeem or repurchase, capital stock; |
| • | make certain investments; |
| • | incur certain liens; |
| • | enter into transactions with affiliates; |
| • | merge or consolidate; |
| • | enter into agreements that restrict the ability of restricted subsidiaries to make dividends or other payments to APX Group, Inc.; |
| • | designate restricted subsidiaries as unrestricted subsidiaries; and |
| • | transfer or sell assets. |
The credit agreement governing the revolving credit facility and the indentures governing the notes contain change of control provisions and certain customary affirmative covenants and events of default. As of December 31, 2014, we were in compliance with all restrictive covenants related to our long-term obligations.
Subject to certain exceptions, the credit agreement governing the revolving credit facility and the indentures governing the notes permit us and our restricted subsidiaries to incur additional indebtedness, including secured indebtedness.
Our future liquidity requirements will be significant, primarily due to debt service requirements. The actual amounts of borrowings under the revolving credit facility will fluctuate from time to time. We believe that amounts available through our revolving credit facility and incremental facilities will be sufficient to meet our operating needs for the next twelve months, including working capital requirements, capital expenditures, debt repayment obligations and potential new acquisitions.
Covenant Compliance
Under the indentures governing our notes and the credit agreement governing our revolving credit facility, our ability to engage in activities such as incurring additional indebtedness, making investments, refinancing certain indebtedness, paying dividends and entering into certain merger transactions is governed, in part, by our ability to satisfy tests based on Adjusted EBITDA.
“Adjusted EBITDA” is defined as net income (loss) before interest expense (net of interest income), income and franchise taxes and depreciation and amortization (including amortization of capitalized subscriber acquisition costs), further adjusted to exclude the effects of certain contract sales to third parties, non-capitalized subscriber acquisition costs, stock based compensation, the historical results of Solar and certain unusual, non-cash, non-recurring and other items permitted in certain covenant calculations under the indentures governing our notes and the credit agreement governing our revolving credit facility.
We believe that the presentation of Adjusted EBITDA is appropriate to provide additional information to investors about the calculation of, and compliance with, certain financial covenants in the indentures governing our notes and the credit agreement governing our revolving credit facility. We caution investors that amounts presented in accordance with our definition of Adjusted EBITDA may not be comparable to similar measures disclosed by other issuers, because not all issuers and analysts calculate Adjusted EBITDA in the same manner.
55
Table of Contents
Adjusted EBITDA is not a measurement of our financial performance under GAAP and should not be considered as an alternative to net income (loss) or any other performance measures derived in accordance with GAAP or as an alternative to cash flows from operating activities as a measure of our liquidity.
The following table sets forth a reconciliation of net loss before non-controlling interests to Adjusted EBITDA (in thousands):
| Successor | Combined | Successor | Predecessor | |||||||||||||||||||||
| Year ended December 31, 2014 |
Year ended December 31, 2013 |
Year ended December 31, 2012 |
Period from November 17, through December 31, 2012 |
Period from January 1, through November 16, 2012 |
||||||||||||||||||||
| Net loss before non-controlling interests |
$ | (238,660 | ) | $ | (124,513 | ) | $ | (184,938 | ) | $ | (30,102 | ) | $ | (154,836 | ) | |||||||||
| Interest expense, net |
146,056 | 112,983 | 119,200 | |||||||||||||||||||||
| Other (income) expense |
(1,779 | ) | (76 | ) | 293 | |||||||||||||||||||
| Gain on 2GIG Sale (1) |
— | (46,866 | ) | — | ||||||||||||||||||||
| Income tax (benefit) expense |
514 | 3,592 | (5,980 | ) | ||||||||||||||||||||
| Amortization of capitalized creation costs |
58,730 | 22,214 | 72,186 | |||||||||||||||||||||
| Depreciation and amortization (2) |
162,594 | 173,292 | 18,903 | |||||||||||||||||||||
| Transaction costs related to 2GIG Sale (3) |
— | 5,519 | — | |||||||||||||||||||||
| Transaction related costs (4) |
— | 811 | 132,360 | |||||||||||||||||||||
| Non-capitalized subscriber acquisition costs (5) |
134,995 | 100,985 | 70,362 | |||||||||||||||||||||
| Non-cash compensation (6) |
1,887 | 1,899 | 874 | |||||||||||||||||||||
| Adjustment for Solar business (7) |
— | — | 7,077 | |||||||||||||||||||||
| Other adjustments (8) |
45,078 | 42,450 | 13,641 | |||||||||||||||||||||
|
|
|
|
|
|
|
|||||||||||||||||||
| Adjusted EBITDA |
$ | 309,415 | $ | 292,290 | $ | 243,978 | ||||||||||||||||||
|
|
|
|
|
|
|
|||||||||||||||||||
| (1) | Non-recurring gain on the 2GIG Sale. |
| (2) | Excludes loan amortization costs that are included in interest expense. |
| (3) | Bonuses and transaction related costs associated with the 2GIG Sale. |
| (4) | Reflects total bonus and other payments to employees, and legal and consulting fees to third-parties, directly related to the Transactions. |
| (5) | Reflects subscriber acquisition costs that are expensed as incurred because they are not directly related to the acquisition of specific subscribers. Certain other industry participants purchase subscribers through subscriber contract purchases, and as a result, may capitalize the full cost to purchase these subscriber contracts, as compared to our organic generation of new subscribers, which requires us to expense a portion of our subscriber acquisition costs under GAAP. |
| (6) | Reflects non-cash compensation costs related to employee and director stock and stock option plans. |
| (7) | Reflects the exclusion of Solar results from the time it commenced operations in 2011. |
56
Table of Contents
| (8) | Other adjustments represent primarily the following items (in thousands): |
| Successor | Combined | |||||||||||
| Year ended December 31, 2014 |
Year ended December 31, 2013 |
Year ended December 31, 2012 |
||||||||||
| Product development (a) |
$ | 14,208 | $ | 12,318 | $ | — | ||||||
| One-time compensation-related payments (b) |
6,112 | 959 | — | |||||||||
| Purchase accounting deferred revenue fair value adjustment (c) |
5,274 | 6,894 | 1,606 | |||||||||
| Start-up of new strategic initiatives (d) |
3,251 | 3,084 | — | |||||||||
| Monitoring fee (e) |
3,177 | 2,918 | — | |||||||||
| Information technology implementation (f) |
3,196 | 1,230 | — | |||||||||
| Subcontracted monitoring agreement (g) |
2,225 | 1,078 | — | |||||||||
| Fire related losses, net of probable insurance recoveries (h) |
(21 | ) | — | — | ||||||||
| CMS technology impairment loss (i) |
1,351 | — | — | |||||||||
| Non-operating legal and professional fees |
883 | 5,356 | 554 | |||||||||
| Non-cash contingent liabilities |
— | 6,500 | 2,124 | |||||||||
| Solar-business costs (j) |
— | 34 | 4,165 | |||||||||
| Discontinued operations (k) |
— | — | 239 | |||||||||
| Technology licensing disputes (l) |
— | — | 2,239 | |||||||||
| Rebranding |
— | — | 1,409 | |||||||||
| All other adjustments |
5,422 | 2,079 | 1,305 | |||||||||
|
|
|
|
|
|
|
|||||||
| Total other adjustments |
$ | 45,078 | $ | 42,450 | $ | 13,641 | ||||||
|
|
|
|
|
|
|
|||||||
| (a) | Costs related to the development of control panels, including associated software. |
| (b) | Run-rate savings related to December 2014 reduction-in-force (“RIF”), along with severance payments associated with the RIF and other non-recurring employee compensation payments. |
| (c) | Add back revenue reduction directly related to purchase accounting deferred revenue adjustments. |
| (d) | Costs related to the start-up of potential new service offerings and sales channels. |
| (e) | Blackstone Management Partners L.L.C monitoring fee (See Note 16 to the accompanying consolidated financial statements). |
| (f) | Costs related to the implementation of new information technologies. |
| (g) | Run-rate savings from committed future reductions in subcontract monitoring fees. |
| (h) | Fire relates losses, net of insurance recoveries of $8.2 million considered probable at December 31, 2014. (See Note 12 to the accompanying consolidated financial statements). |
| (i) | CMS technology impairment loss (See Note 11 to the accompanying consolidated financial statements). |
| (j) | Costs incurred by Vivint on behalf of the Solar business, prior to the Transactions. |
| (k) | Costs associated with our Smart Grid business, which discontinued operations in 2011. |
| (l) | Settlement costs and reserves associated with technology licensing disputes. |
Other Factors Affecting Liquidity and Capital Resources
Vehicle Leases. Since 2010, we have leased, and expect to continue leasing, vehicles primarily for use by our FSPs. For the most part, these leases have 36 month durations and we account for them as capital leases. At the end of the lease term for each vehicle we have the option to either (i) purchase it for the estimated end-of-lease fair market value established at the beginning of the lease term; or (ii) return the vehicle to the lessor to be sold by them and in the event the sale price is less than the estimated end-of-lease fair market value we are responsible for such deficiency. As of December 31, 2014, our total capital lease obligations were $16.2 million, of which $5.5 million is due within the next 12 months.
Aircraft Lease. In December 2012, we entered into an aircraft lease agreement for the use of a corporate aircraft, which is accounted for as an operating lease. Upon execution of the lease, we paid a $5.9 million security deposit which is refundable at the end of the lease term. Beginning January 2013, we are required to make 156 monthly rental payments of approximately $83,000 each. In January 2015, an amendment to the agreement was made which, among other changes, increased the required monthly rental payments to approximately $87,000 each. We also have the option to extend the lease
57
Table of Contents
for an additional 36 months upon expiration of the initial term. The lease agreement also provides us the option to purchase the aircraft on certain specified dates for a stated dollar amount, which represents the current estimated fair value as of the purchase date.
Off-Balance Sheet Arrangements
Currently we do not engage in off-balance sheet financing arrangements.
Contractual Obligations
The following table summarizes our contractual obligations as of December 31, 2014. Certain contractual obligations are reflected on our consolidated balance sheet, while others are disclosed as future obligations under GAAP.
| Payments Due by Period | ||||||||||||||||||||
| Total | Less than 1 Year |
1 - 3 Years | 3 - 5 Years | More than 5 Years |
||||||||||||||||
| (dollars in thousands) |
||||||||||||||||||||
| Long-term debt obligations (1) |
$ | 1,883,155 | $ | — | $ | 20,000 | $ | 925,000 | $ | 938,155 | ||||||||||
| Interest on long-term debt (2) |
783,094 | 140,343 | 280,688 | 280,688 | 81,375 | |||||||||||||||
| Capital lease obligations |
16,204 | 5,549 | 9,886 | 769 | — | |||||||||||||||
| Operating lease obligations |
125,574 | 11,536 | 23,019 | 22,825 | 68,194 | |||||||||||||||
| Purchase obligations (3) |
15,336 | 6,818 | 8,505 | 13 | — | |||||||||||||||
| Other long-term obligations |
5,156 | 706 | 1,191 | 935 | 2,324 | |||||||||||||||
|
|
|
|
|
|
|
|
|
|
|
|||||||||||
| Total contractual obligations |
$ | 2,828,519 | $ | 164,952 | $ | 343,289 | $ | 1,230,230 | $ | 1,090,048 | ||||||||||
|
|
|
|
|
|
|
|
|
|
|
|||||||||||
| (1) | Includes $20.0 million of borrowings under our revolving credit facility. At December 31, 2014, our revolving credit facility provided for availability of $200.0 million and would have matured November 16, 2017 (without giving effect to the amendment and restatement of our revolving credit facility discuss under “—Liquidity and Capital Resources—Long-Term Debt—Revolving Credit Facility” above). As of December 31, 2014, there was approximately $177.0 million of availability under our revolving credit facility (after giving effect to $3.0 million of outstanding letters of credit). |
| (2) | Represents aggregate interest payments on $925.0 million of the outstanding 2019 notes and $930.0 million of outstanding 2020 notes, as well as letter of credit and commitment fees for the unused portion of our revolving credit facility. Does not reflect interest payments on future borrowings under our revolving credit facility. |
| (3) | Purchase obligations consist of commitments for purchases of goods and services. We have contingent liabilities related to legal proceedings and other matters arising in the ordinary course of business. Although it is reasonably possible we may incur losses upon conclusion of such matters, an estimate of any loss or range of loss cannot be made at this time. In the opinion of management, it is expected that amounts, if any, which may be required to satisfy such contingencies will not be material in relation to the accompanying consolidated financial statements. |
| ITEM 7A. | QUANTITATIVE AND QUALITATIVE DISCLOSURES ABOUT MARKET RISK |
Our operations include activities in the United States, Canada and New Zealand. These operations expose us to a variety of market risks, including the effects of changes in interest rates and foreign currency exchange rates. We monitor and manage these financial exposures as an integral part of our overall risk management program.
Interest Rate Risk
In connection with the Transactions, we entered into a revolving credit facility that bears interest at a floating rate. As a result, we may be exposed to fluctuations in interest rates to the extent of our borrowings under the revolving credit facility. Our long-term debt portfolio is expected to primarily consist of fixed rate instruments. To help manage borrowing costs, we may from time to time enter into interest rate swap transactions with financial institutions acting as principal counterparties. Assuming the borrowing of all amounts available under our revolving credit facility (after giving effect to the amendment and restatement of our revolving credit facility on March 6, 2015), if interest rates related to our revolving credit facility increase by 1% due to normal market conditions, our interest expense will increase by approximately $2.9 million per annum.
We had $20.0 million in borrowings under the revolving credit facility as of December 31, 2014.
58
Table of Contents
Foreign Currency Risk
We have exposure to the effects of foreign currency exchange rate fluctuations on the results of our Canadian operations. Our Canadian operations use the Canadian dollar to conduct business but our results are reported in U.S. dollars. Our operations in New Zealand are immaterial to our overall operating results. We are exposed periodically to the foreign currency rate fluctuations that affect transactions not denominated in the functional currency of our U.S. and Canadian operations. We do not use derivative financial instruments to hedge investments in foreign subsidiaries since such investments are long-term in nature.
59
Table of Contents
| ITEM 8. | FINANCIAL STATEMENTS AND SUPPLEMENTARY DATA |
INDEX TO CONSOLIDATED FINANCIAL STATEMENTS
| Page | ||||
| Consolidated Financial Statements APX Group Holdings, Inc. and Subsidiaries (Successor) and APX Group, Inc. and Subsidiaries (Predecessor): |
||||
| 61 | ||||
| Consolidated Balance Sheets as of December 31, 2014 and 2013 (Successor) |
62 | |||
| 63 | ||||
| 64 | ||||
| 65 | ||||
| 66 | ||||
| 68 | ||||
60
Table of Contents
Report of Independent Registered Public Accounting Firm
The Board of Directors
APX Group Holdings, Inc. and Subsidiaries
We have audited the accompanying consolidated balance sheets of APX Group Holdings, Inc. and Subsidiaries as of December 31, 2014 and 2013, and the related consolidated statements of operations, comprehensive loss, shareholders’ equity and cash flows for the years ended December 31, 2014 and 2013, and the period from November 17, 2012 through December 31, 2012 (Successor), and the accompanying consolidated statements of operations, comprehensive loss, changes in equity (deficit), and cash flows for APX Group, Inc. and Subsidiaries for the period from January 1, 2012 through November 16, 2012 (Predecessor). These financial statements are the responsibility of the Company’s management. Our responsibility is to express an opinion on these financial statements based on our audits.
We conducted our audits in accordance with the standards of the Public Company Accounting Oversight Board (United States). Those standards require that we plan and perform the audit to obtain reasonable assurance about whether the financial statements are free of material misstatement. We were not engaged to perform an audit of the Company’s internal control over financial reporting. Our audits included consideration of internal control over financial reporting as a basis for designing audit procedures that are appropriate in the circumstances, but not for the purpose of expressing an opinion on the effectiveness of the Company’s internal control over financial reporting. Accordingly, we express no such opinion. An audit also includes examining, on a test basis, evidence supporting the amounts and disclosures in the financial statements, assessing the accounting principles used and significant estimates made by management, and evaluating the overall financial statement presentation. We believe that our audits provide a reasonable basis for our opinion.
In our opinion, the financial statements referred to above present fairly, in all material respects, the consolidated financial position of APX Group Holdings, Inc. and Subsidiaries at December 31, 2014 and 2013, and the consolidated results of its operations and its cash flows for the years ended December 31, 2014 and 2013 and the period from November 17, 2012 through December 31, 2012 (Successor), and the consolidated results of the operations of APX Group, Inc. and Subsidiaries and its cash flows for the period from January 1, 2012 to November 16, 2012 (Predecessor), in conformity with U.S. generally accepted accounting principles.
| /s/ Ernst & Young LLP |
| Salt Lake City, Utah |
| March 26, 2015 |
61
Table of Contents
APX Group Holdings, Inc. and Subsidiaries (Successor)
Consolidated Balance Sheets
(In thousands, except share and per-share amounts)
| December 31, | ||||||||
| 2014 | 2013 | |||||||
| ASSETS |
||||||||
| Current Assets: |
||||||||
| Cash and cash equivalents |
$ | 10,807 | $ | 261,905 | ||||
| Restricted cash and cash equivalents |
14,214 | 14,375 | ||||||
| Accounts receivable, net |
8,739 | 2,593 | ||||||
| Inventories |
36,157 | 29,260 | ||||||
| Prepaid expenses and other current assets |
15,454 | 13,870 | ||||||
|
|
|
|
|
|||||
| Total current assets |
85,371 | 322,003 | ||||||
| Property and equipment, net |
62,790 | 35,818 | ||||||
| Subscriber contract costs, net |
548,073 | 288,316 | ||||||
| Deferred financing costs, net |
52,158 | 59,375 | ||||||
| Intangible assets, net |
703,226 | 840,714 | ||||||
| Goodwill |
841,522 | 836,318 | ||||||
| Restricted cash and cash equivalents, net of current portion |
— | 14,214 | ||||||
| Long-term investments and other assets, net |
10,533 | 27,676 | ||||||
|
|
|
|
|
|||||
| Total assets |
$ | 2,303,673 | $ | 2,424,434 | ||||
|
|
|
|
|
|||||
| LIABILITIES AND STOCKHOLDERS’ EQUITY |
||||||||
| Current Liabilities: |
||||||||
| Accounts payable |
$ | 31,324 | $ | 24,004 | ||||
| Accrued payroll and commissions |
37,979 | 46,007 | ||||||
| Accrued expenses and other current liabilities |
28,862 | 33,118 | ||||||
| Deferred revenue |
33,226 | 26,894 | ||||||
| Current portion of capital lease obligations |
5,549 | 4,199 | ||||||
|
|
|
|
|
|||||
| Total current liabilities |
136,940 | 134,222 | ||||||
| Notes payable, net |
1,863,155 | 1,762,049 | ||||||
| Revolving line of credit |
20,000 | — | ||||||
| Capital lease obligations, net of current portion |
10,655 | 6,268 | ||||||
| Deferred revenue, net of current portion |
32,504 | 18,533 | ||||||
| Other long-term obligations |
6,906 | 3,905 | ||||||
| Deferred income tax liabilities |
9,027 | 9,214 | ||||||
|
|
|
|
|
|||||
| Total liabilities |
2,079,187 | 1,934,191 | ||||||
| Commitments and contingencies (See Note 16) |
||||||||
| Stockholders’ equity: |
||||||||
| Common stock, $0.01 par value, 100 shares authorized; 100 shares issued and outstanding |
— | — | ||||||
| Additional paid-in capital |
636,724 | 652,488 | ||||||
| Accumulated deficit |
(393,275 | ) | (154,615 | ) | ||||
| Accumulated other comprehensive loss |
(18,963 | ) | (7,630 | ) | ||||
|
|
|
|
|
|||||
| Total stockholders’ equity |
224,486 | 490,243 | ||||||
|
|
|
|
|
|||||
| Total liabilities and stockholders’ equity |
$ | 2,303,673 | $ | 2,424,434 | ||||
|
|
|
|
|
|||||
See accompanying notes to consolidated financial statements
62
Table of Contents
APX Group Holdings, Inc. and Subsidiaries (Successor) and APX Group, Inc. and Subsidiaries (Predecessor)
Consolidated Statements of Operations
(In thousands)
| Successor | Predecessor | |||||||||||||||||
| Year ended December 31, 2014 |
Year ended December 31, 2013 |
Period from November 17, through December 31, 2012 |
Period from January 1, through November 16, 2012 |
|||||||||||||||
| Revenues: |
||||||||||||||||||
| Monitoring revenue |
$ | 537,695 | $ | 460,130 | $ | 49,122 | $ | 325,271 | ||||||||||
| Service and other sales revenue |
21,980 | 39,135 | 8,473 | 66,968 | ||||||||||||||
| Activation fees |
4,002 | 1,643 | 11 | 5,331 | ||||||||||||||
|
|
|
|
|
|
|
|
|
|||||||||||
| Total revenues |
563,677 | 500,908 | 57,606 | 397,570 | ||||||||||||||
| Costs and expenses: |
||||||||||||||||||
| Operating expenses (exclusive of depreciation and amortization shown separately below) |
202,769 | 164,221 | 20,699 | 145,892 | ||||||||||||||
| Selling expenses |
107,370 | 98,884 | 12,284 | 91,559 | ||||||||||||||
| General and administrative expenses |
126,083 | 97,177 | 9,521 | 99,972 | ||||||||||||||
| Transaction related expenses |
— | — | 31,885 | 23,461 | ||||||||||||||
| Depreciation and amortization |
221,324 | 195,506 | 11,410 | 79,679 | ||||||||||||||
|
|
|
|
|
|
|
|
|
|||||||||||
| Total costs and expenses |
657,546 | 555,788 | 85,799 | 440,563 | ||||||||||||||
|
|
|
|
|
|
|
|
|
|||||||||||
| Loss from operations |
(93,869 | ) | (54,880 | ) | (28,193 | ) | (42,993 | ) | ||||||||||
| Other expenses (income): |
||||||||||||||||||
| Interest expense |
147,511 | 114,476 | 12,645 | 106,620 | ||||||||||||||
| Interest income |
(1,455 | ) | (1,493 | ) | (4 | ) | (61 | ) | ||||||||||
| Other (income) expenses |
(1,779 | ) | (76 | ) | 171 | 122 | ||||||||||||
| Gain on 2GIG Sale |
— | (46,866 | ) | — | — | |||||||||||||
|
|
|
|
|
|
|
|
|
|||||||||||
| Loss from continuing operations before income taxes |
(238,146 | ) | (120,921 | ) | (41,005 | ) | (149,674 | ) | ||||||||||
| Income tax expense (benefit) |
514 | 3,592 | (10,903 | ) | 4,923 | |||||||||||||
|
|
|
|
|
|
|
|
|
|||||||||||
| Net loss from continuing operations |
(238,660 | ) | (124,513 | ) | (30,102 | ) | (154,597 | ) | ||||||||||
| Discontinued operations: |
||||||||||||||||||
| Loss from discontinued operations |
— | — | — | (239 | ) | |||||||||||||
|
|
|
|
|
|
|
|
|
|||||||||||
| Net loss before non-controlling interests |
(238,660 | ) | (124,513 | ) | (30,102 | ) | (154,836 | ) | ||||||||||
| Net loss attributable to non-controlling interests |
— | — | — | (1,319 | ) | |||||||||||||
|
|
|
|
|
|
|
|
|
|||||||||||
| Net loss |
$ | (238,660 | ) | $ | (124,513 | ) | $ | (30,102 | ) | $ | (153,517 | ) | ||||||
|
|
|
|
|
|
|
|
|
|||||||||||
See accompanying notes to consolidated financial statements
63
Table of Contents
APX Group Holdings, Inc. and Subsidiaries (Successor) and APX Group, Inc. and Subsidiaries (Predecessor)
Consolidated Statements of Comprehensive Loss
(In thousands)
| Successor | Predecessor | |||||||||||||||||
| Year ended December 31, 2014 |
Year ended December 31, 2013 |
Period from November 17, through December 31, 2012 |
Period from January 1, through November 16, 2012 |
|||||||||||||||
| Net loss before non-controlling interests |
$ | (238,660 | ) | $ | (124,513 | ) | $ | (30,102 | ) | $ | (154,836 | ) | ||||||
| Other comprehensive (loss) income, net of tax effects: |
||||||||||||||||||
| Foreign currency translation adjustment |
(11,333 | ) | (8,558 | ) | 928 | 708 | ||||||||||||
| Change in fair value of interest rate swap agreement |
— | — | — | 318 | ||||||||||||||
|
|
|
|
|
|
|
|
|
|||||||||||
| Total other comprehensive (loss) income |
(11,333 | ) | (8,558 | ) | 928 | 1,026 | ||||||||||||
| Comprehensive loss before non-controlling interests |
(249,993 | ) | (133,071 | ) | (29,174 | ) | (153,810 | ) | ||||||||||
| Comprehensive loss attributable to non-controlling interests |
— | — | — | (1,319 | ) | |||||||||||||
|
|
|
|
|
|
|
|
|
|||||||||||
| Comprehensive loss |
$ | (249,993 | ) | $ | (133,071 | ) | $ | (29,174 | ) | $ | (152,491 | ) | ||||||
|
|
|
|
|
|
|
|
|
|||||||||||
See accompanying notes to consolidated financial statements
64
Table of Contents
APX Group Holdings, Inc. and Subsidiaries (Successor) and APX Group, Inc. and Subsidiaries (Predecessor)
Consolidated Statements of Changes in Equity (Deficit)
(In thousands)
| Common Stock | Additional paid-in capital |
Accumulated deficit |
Accumulated other comprehensive income (loss) |
Non- controlling interests |
Total | |||||||||||||||||||
| Predecessor: |
||||||||||||||||||||||||
| Balance, January 1, 2012 |
$ | 1 | $ | 46,836 | $ | (234,982 | ) | $ | 162 | $ | 4,484 | $ | (183,499 | ) | ||||||||||
| Net loss |
— | — | (153,517 | ) | — | (1,319 | ) | (154,836 | ) | |||||||||||||||
| Change in fair value of interest rate swap agreement |
— | — | — | 318 | — | 318 | ||||||||||||||||||
| Foreign currency translation adjustment |
— | — | — | 708 | — | 708 | ||||||||||||||||||
| Stock-based compensation |
— | 1,780 | — | — | 591 | 2,371 | ||||||||||||||||||
| Issuance of Series D preferred stock and warrants, net of issuance costs and amount allocated to liability |
— | 4,454 | — | — | — | 4,454 | ||||||||||||||||||
| Change in fair value of warrant |
— | 1,047 | — | — | — | 1,047 | ||||||||||||||||||
| Solar share issuance |
— | — | — | — | 14,193 | 14,193 | ||||||||||||||||||
| Cash dividends paid |
— | — | — | — | (80 | ) | (80 | ) | ||||||||||||||||
|
|
|
|
|
|
|
|
|
|
|
|
|
|||||||||||||
| Balance, November 16, 2012 |
1 | 54,117 | (388,499 | ) | 1,188 | 17,869 | (315,324 | ) | ||||||||||||||||
| Successor: |
||||||||||||||||||||||||
| Elimination of the predecessor equity structure and non-controlling interests |
(1 | ) | (54,117 | ) | 388,499 | (1,188 | ) | (17,869 | ) | 315,324 | ||||||||||||||
| Investment by Parent |
— | 708,453 | — | — | — | 708,453 | ||||||||||||||||||
|
|
|
|
|
|
|
|
|
|
|
|
|
|||||||||||||
| Balance, November 17, 2012 |
— | 708,453 | — | — | — | 708,453 | ||||||||||||||||||
| Net loss |
— | — | (30,102 | ) | — | — | (30,102 | ) | ||||||||||||||||
| Foreign currency translation adjustment |
— | — | — | 928 | — | 928 | ||||||||||||||||||
|
|
|
|
|
|
|
|
|
|
|
|
|
|||||||||||||
| Balance, December 31, 2012 |
— | 708,453 | (30,102 | ) | 928 | — | 679,279 | |||||||||||||||||
| Net loss |
— | — | (124,513 | ) | — | — | (124,513 | ) | ||||||||||||||||
| Foreign currency translation adjustment |
— | — | — | (8,558 | ) | — | (8,558 | ) | ||||||||||||||||
| Stock-based compensation |
— | 1,956 | — | — | — | 1,956 | ||||||||||||||||||
| Net worth adjustment |
— | 2,079 | — | — | — | 2,079 | ||||||||||||||||||
| Cash dividends paid |
— | (60,000 | ) | — | — | — | (60,000 | ) | ||||||||||||||||
|
|
|
|
|
|
|
|
|
|
|
|
|
|||||||||||||
| Balance, December 31, 2013 |
— | 652,488 | (154,615 | ) | (7,630 | ) | — | 490,243 | ||||||||||||||||
| Net loss |
— | — | (238,660 | ) | — | — | (238,660 | ) | ||||||||||||||||
| Foreign currency translation adjustment |
— | — | — | (11,333 | ) | — | (11,333 | ) | ||||||||||||||||
| Stock-based compensation |
— | 1,936 | — | — | — | 1,936 | ||||||||||||||||||
| Capital contribution |
— | 32,300 | — | — | — | 32,300 | ||||||||||||||||||
| Cash dividends paid |
— | (50,000 | ) | — | — | — | (50,000 | ) | ||||||||||||||||
|
|
|
|
|
|
|
|
|
|
|
|
|
|||||||||||||
| Balance, December 31, 2014 |
$ | — | $ | 636,724 | $ | (393,275 | ) | $ | (18,963 | ) | $ | — | $ | 224,486 | ||||||||||
|
|
|
|
|
|
|
|
|
|
|
|
|
|||||||||||||
See accompanying notes to consolidated financial statements
65
Table of Contents
APX Group Holdings, Inc. and Subsidiaries (Successor) and APX Group, Inc. and Subsidiaries (Predecessor)
Consolidated Statements of Cash Flows
(In thousands)
| Successor | Predecessor | |||||||||||||||||
| Year ended December 31, 2014 |
Year ended December 31, 2013 |
Period from November 17, through December 31, 2012 |
Period from January 1, through November 16, 2012 |
|||||||||||||||
| Cash flows from operating activities: |
||||||||||||||||||
| Net loss from continuing operations |
$ | (238,660 | ) | $ | (124,513 | ) | $ | (30,102 | ) | $ | (154,597 | ) | ||||||
| Loss from discontinued operations |
— | — | — | (239 | ) | |||||||||||||
| Adjustments to reconcile net loss to net cash provided by (used in) operating activities of continuing operations: |
||||||||||||||||||
| Amortization of subscriber contract costs |
58,730 | 22,214 | 181 | 72,005 | ||||||||||||||
| Amortization of customer relationships |
143,578 | 160,424 | 9,574 | — | ||||||||||||||
| Depreciation and amortization of other intangible assets |
19,016 | 12,868 | 1,655 | 7,676 | ||||||||||||||
| Amortization of deferred financing costs |
9,251 | 8,642 | 1,032 | 6,619 | ||||||||||||||
| Gain on sale of 2GIG |
— | (46,866 | ) | — | — | |||||||||||||
| Gain on change in fair value of warrant liability |
— | — | — | (287 | ) | |||||||||||||
| Loss (gain) on sale or disposal of assets |
662 | 263 | (45 | ) | 119 | |||||||||||||
| Loss on asset impairment |
3,116 | — | — | — | ||||||||||||||
| Stock-based compensation |
1,936 | 1,956 | — | 2,371 | ||||||||||||||
| Provision for doubtful accounts |
15,656 | 10,360 | 1,307 | 8,204 | ||||||||||||||
| Paid in kind interest income |
— | (1,323 | ) | — | — | |||||||||||||
| Non-cash adjustments to deferred revenue |
181 | 1,181 | 822 | — | ||||||||||||||
| Deferred income taxes |
(265 | ) | 8,030 | (13,120 | ) | 1,421 | ||||||||||||
| Changes in operating assets and liabilities, net of acquisitions and divestiture: |
||||||||||||||||||
| Accounts receivable |
(21,866 | ) | (11,486 | ) | 2,333 | (17,901 | ) | |||||||||||
| Inventories |
(6,926 | ) | (8,439 | ) | (257 | ) | 20,111 | |||||||||||
| Prepaid expenses and other current assets |
746 | 2,407 | (6,870 | ) | 2,305 | |||||||||||||
| Accounts payable |
7,248 | (2,690 | ) | (1,034 | ) | 11,793 | ||||||||||||
| Accrued expenses and other liabilities |
(9,643 | ) | 22,041 | 14,271 | 109,515 | |||||||||||||
| Deferred revenue |
20,589 | 24,356 | (4,990 | ) | 26,256 | |||||||||||||
|
|
|
|
|
|
|
|
|
|||||||||||
| Net cash provided by (used in) operating activities |
3,349 | 79,425 | (25,243 | ) | 95,371 | |||||||||||||
| Cash flows from investing activities: |
||||||||||||||||||
| Subscriber acquisition costs |
(321,855 | ) | (298,643 | ) | (12,938 | ) | (263,731 | ) | ||||||||||
| Capital expenditures |
(32,211 | ) | (8,973 | ) | (1,456 | ) | (5,894 | ) | ||||||||||
| Proceeds from the sale of capital assets |
964 | 306 | — | 274 | ||||||||||||||
| Proceeds from the sale of 2GIG, net of cash sold |
— | 144,750 | — | — | ||||||||||||||
| Acquisition of the predecessor including transaction costs, net of cash acquired |
— | — | (1,915,473 | ) | — | |||||||||||||
| Net cash used in acquisitions |
(18,500 | ) | (4,272 | ) | — | — | ||||||||||||
| Acquisition of intangible assets |
(9,649 | ) | — | — | — | |||||||||||||
| Purchases of short-term investments—other |
(60,000 | ) | — | — | — | |||||||||||||
| Proceeds from sale of short-term investments—other |
60,069 | — | — | — | ||||||||||||||
| Proceeds from note receivable |
22,699 | — | — | — | ||||||||||||||
| Change in restricted cash |
14,375 | (161 | ) | — | (152 | ) | ||||||||||||
| Investment in preferred stock |
(3,000 | ) | — | — | — | |||||||||||||
| Acquisition of other assets |
(2,162 | ) | (9,645 | ) | (19,587 | ) | (743 | ) | ||||||||||
|
|
|
|
|
|
|
|
|
|||||||||||
| Net cash used in investing activities |
(349,270 | ) | (176,638 | ) | (1,949,454 | ) | (270,246 | ) | ||||||||||
See accompanying notes to consolidated financial statements
66
Table of Contents
APX Group Holdings, Inc. and Subsidiaries (Successor) and APX Group, Inc. and Subsidiaries (Predecessor)
Consolidated Statements of Cash Flows Continued
(In thousands)
| Cash flows from financing activities: |
||||||||||||||||||
| Proceeds from notes payable |
102,000 | 457,250 | 1,305,000 | 116,163 | ||||||||||||||
| Borrowings from revolving line of credit |
20,000 | 22,500 | 28,000 | 105,000 | ||||||||||||||
| Repayments on revolving line of credit |
— | (50,500 | ) | — | (42,241 | ) | ||||||||||||
| Proceeds from sale of subscriber contracts |
2,261 | — | — | — | ||||||||||||||
| Acquisition of subscriber contracts |
(2,277 | ) | — | — | — | |||||||||||||
| Repayments of capital lease obligations |
(6,300 | ) | (7,207 | ) | (353 | ) | (4,060 | ) | ||||||||||
| Deferred financing costs |
(2,927 | ) | (10,896 | ) | (58,354 | ) | (6,684 | ) | ||||||||||
| Payments of dividends |
(50,000 | ) | (60,000 | ) | — | (80 | ) | |||||||||||
| Excess tax benefit from share-based payment awards |
— | — | — | 2,651 | ||||||||||||||
| Capital contributions |
32,300 | — | — | 9,193 | ||||||||||||||
| Proceeds from issuance of preferred stock and warrants |
— | — | — | 4,562 | ||||||||||||||
| Proceeds from the issuance of common stock in connection with acquisition of the predecessor |
— | — | 708,453 | — | ||||||||||||||
| Proceeds from issuance of preferred stock by Solar |
— | — | — | 5,000 | ||||||||||||||
|
|
|
|
|
|
|
|
|
|||||||||||
| Net cash provided by financing activities |
95,057 | 351,147 | 1,982,746 | 189,504 | ||||||||||||||
| Effect of exchange rate changes on cash |
(234 | ) | (119 | ) | 41 | (251 | ) | |||||||||||
|
|
|
|
|
|
|
|
|
|||||||||||
| Net (decrease) increase in cash |
(251,098 | ) | 253,815 | 8,090 | 14,378 | |||||||||||||
| Cash: |
||||||||||||||||||
| Beginning of period |
261,905 | 8,090 | — | 3,680 | ||||||||||||||
|
|
|
|
|
|
|
|
|
|||||||||||
| End of period |
$ | 10,807 | $ | 261,905 | $ | 8,090 | $ | 18,058 | ||||||||||
|
|
|
|
|
|
|
|
|
|||||||||||
| Supplemental cash flow disclosures: |
||||||||||||||||||
| Income tax paid |
$ | 196 | $ | 485 | $ | — | $ | 2,235 | ||||||||||
| Interest paid |
$ | 137,908 | $ | 116,802 | $ | 44 | $ | 91,470 | ||||||||||
| Supplemental non-cash flow disclosure: |
||||||||||||||||||
| Capital lease additions |
$ | 12,040 | $ | 8,905 | $ | 574 | $ | 4,729 |
See accompanying notes to consolidated financial statements
67
Table of Contents
APX Group Holdings, Inc. and Subsidiaries (Successor) and APX Group, Inc. and Subsidiaries (Predecessor)
Notes to Consolidated Financial Statements
NOTE 1—DESCRIPTION OF BUSINESS
APX Group Holdings, Inc. (“Holdings” or “Parent”), and its wholly-owned subsidiaries, (collectively the “Company”), is one of the largest Smart Home companies in North America. The Company is engaged in the sale, installation, servicing and monitoring of electronic home security and automation systems, primarily in the United States and Canada.
On November 16, 2012, APX Group, Inc. (“APX”), 2GIG Technologies, Inc. (“2GIG”), and their respective subsidiaries were acquired by an investor group comprised of certain investment funds affiliated with Blackstone Capital Partners VI L.P., and certain co-investors and management investors (collectively, the “Investors”). This stock acquisition was accomplished through certain mergers and related reorganization transactions (collectively, the “Merger”) pursuant to which each of APX and 2GIG, and their respective subsidiaries became indirect wholly-owned subsidiaries of 313 Acquisition LLC, an entity wholly-owned by the Investors.
As a result of the Merger, Vivint, Inc. and its wholly-owned subsidiaries and 2GIG and its wholly-owned subsidiaries collectively became wholly-owned by APX Group, Inc., which is wholly-owned by APX Group Holdings, Inc., which is wholly-owned by APX Parent Holdco, Inc., which is wholly owned by 313 Acquisition, LLC. APX Parent Holdco, Inc. and APX Group Holdings, Inc. have no operations and were formed for the purpose of facilitating the Merger.
NOTE 2—SIGNIFICANT ACCOUNTING POLICIES
Basis of Presentation—As a result of the Merger, the consolidated financial statements are presented on two bases of accounting and are not necessarily comparable: January 1, 2012 through November 16, 2012 (the “Predecessor Period” or “Predecessor” as context requires) and November 17, 2012 through December 31, 2014 (the “Successor Period” or “Successor” as context requires), which relate to the period preceding the Merger and the period succeeding the Merger, respectively. The audited consolidated financial statements for the Predecessor Period are presented for APX Group, Inc. and its wholly-owned subsidiaries, including variable interest entities. The audited consolidated financial statements for the Successor Period reflect the Merger presenting the financial position and results of operations of APX Group Holdings, Inc. and its wholly-owned subsidiaries. The financial position and results of operations of the Successor are not comparable to the financial position and results of operations of the Predecessor due to the Merger and the basis of presentation of purchase accounting as compared to historical cost in accordance with Accounting Standards Codification (“ASC”) 805 Business Combinations.
The consolidated financial statements for the Predecessor and Successor include the financial position and results of operations of the following entities:
| Successor |
Predecessor | |||
| APX Group Holdings, Inc. |
— | |||
| APX Group, Inc. |
APX Group, Inc. | |||
| Vivint, Inc. |
Vivint, Inc. | |||
| Vivint Canada, Inc. |
Vivint Canada, Inc. | |||
| ARM Security, Inc. |
ARM Security, Inc. | |||
| AP AL, LLC |
AP AL, LLC | |||
| Vivint Purchasing, LLC |
Vivint Purchasing, LLC | |||
| Vivint Servicing, LLC |
Vivint Servicing, LLC | |||
| 2GIG Technologies, Inc. (1) |
2GIG Technologies, Inc. | |||
| 2GIG Technologies Canada, Inc. (1) |
2GIG Technologies Canada, Inc. | |||
| — |
V Solar Holdings, Inc. | |||
| — |
Vivint Solar, Inc. | |||
| 313 Aviation, LLC |
— | |||
| Vivint Wireless, Inc. |
— | |||
| Smartrove, Inc. |
— | |||
| Vivint New Zealand, Ltd. |
— | |||
| Vivint Australia Pty Ltd. |
— | |||
| Vivint Louisiana, LLC |
— | |||
| Vivint Funding Holdings, LLC |
— | |||
| Vivint Puerto Rico, LLC |
— | |||
| Vivint Group, Inc. (2) |
— | |||
| Vivint Data Management (2) |
— | |||
| Vivint Firewild, LLC (2) |
— | |||
| Vivint Canada Funding |
— | |||
| Vivint Canada Servicing |
— | |||
| IPR LLC (2) |
— | |||
| Farmington IP LLC |
— |
| (1) | The audited consolidated financial statements for the year ended December 31, 2013 include the results of 2GIG up through April 1, 2013, which was the date the Company completed the sale of 2GIG to Nortek, Inc. (“2GIG Sale”) (See Note 4). |
68
Table of Contents
| (2) | Formed during the year ended December 31, 2014. |
The Successor and Predecessor Period include substantially the same operating entities except that Vivint Solar, Inc. and its subsidiaries (“Solar”) is not included in the Successor Period since Solar is separately owned and is no longer a consolidated variable interest entity. The majority of the operations of Successor Period entities are included within the operations of Vivint, Inc.
Principles of Consolidation—The accompanying Successor consolidated financial statements include the accounts of APX Group Holdings, Inc. and its subsidiaries, including 2GIG as a wholly-owned subsidiary through April 1, 2013. The accompanying Predecessor consolidated financial statements include APX Group, Inc. and its subsidiaries, and 2GIG and Solar, which were variable interest entities (or “VIE’s”) prior to the Merger (See Note 7). All significant intercompany balances and transactions have been eliminated in consolidation.
The financial information presented in the accompanying consolidated financial statements reflects the financial position and operating results of Smart Grid as discontinued operations (See Note 6).
Changes in Presentation of Comparative Financial Statements—Certain reclassifications have been made to our prior period consolidated financial information in order to conform to the current year presentation. These changes did not have a significant impact on the consolidated financial statements.
Revenue Recognition—The Company recognizes revenue principally on three types of transactions: (i) monitoring, which includes revenues for monitoring and other automation services of the Company’s subscriber contracts and certain subscriber contracts that have been sold and recurring monthly revenue associated with the Company’s wireless internet services, (ii) service and other sales, which includes services provided on contracts, contract fulfillment revenue, sales of products that are not part of the basic equipment package and revenue from 2GIG up through the date of the 2GIG Sale, and (iii) activation fees on the Company’s contracts, which are amortized over the expected life of the customer.
Monitoring services for the Company’s subscriber contracts are billed in advance, generally monthly, pursuant to the terms of subscriber contracts and recognized ratably over the service period. Costs of providing ongoing monitoring services are expensed in the period incurred.
Service and other sales revenue is recognized as services are provided or when title to the products and equipment sold transfers to the customer. Contract fulfillment revenue, included in service and other sales, is recognized when payment is received from customers who cancel their contract in-term. Revenue from sales of products that are not part of the basic equipment package is recognized upon delivery of products.
Activation fees represent upfront one-time charges billed to subscribers at the time of installation and are deferred. These fees are recognized over the estimated customer life of 12 years using a 150% declining balance method, which converts to a straight-line methodology after approximately five years.
69
Table of Contents
Through the date of the 2GIG Sale, service and other sales revenue included net recurring services revenue, which was based on back-end services provided by Alarm.com for all panels sold to distributors and direct-sell dealers and subsequently placed in service at end-user locations. The Company received a fixed monthly amount from Alarm.com for each system installed with non-Vivint customers that used the Alarm.com platform.
Subscriber Contract Costs—A portion of the direct costs of acquiring new subscribers, primarily sales commissions, equipment, and installation costs, are deferred and recognized over a pattern that reflects the estimated life of the subscriber relationships. The Company amortizes these costs over 12 years using a 150% declining balance method, which converts to straight-line methodology after approximately five years. The Company evaluates subscriber account attrition on a periodic basis, utilizing observed attrition rates for the Company’s subscriber contracts and industry information and, when necessary, makes adjustments to the estimated subscriber relationship period and amortization method.
In conjunction with the Merger and in accordance with purchase accounting, the total purchase price was allocated to the Company’s net tangible and identifiable intangible assets based on their estimated fair values as of November 16, 2012 (See Note 3). The Company recorded the value of Subscriber Contract Costs on the date of the Merger at fair value and classified it as an intangible asset, which is amortized over 10 years in a pattern that is consistent with the amount of revenue expected to be generated from the related subscriber contracts.
Cash and Cash Equivalents—Cash and cash equivalents consists of highly liquid investments with remaining maturities when purchased of three months or less.
Restricted Cash and Cash Equivalents—Restricted cash and cash equivalents is restricted for a specific purpose and cannot be included in the general cash account. At December 31, 2014 and 2013, the restricted cash and cash equivalents was held by a third-party trustee. Restricted cash and cash equivalents consists of highly liquid investments with remaining maturities when purchased of three months or less.
Accounts Receivable—Accounts receivable consists primarily of amounts due from customers for recurring monthly monitoring services. The accounts receivable are recorded at invoiced amounts and are non-interest bearing. The gross amount of accounts receivable has been reduced by an allowance for doubtful accounts of $3.4 million and $1.9 million at December 31, 2014 and 2013, respectively. The Company estimates this allowance based on historical collection experience and subscriber attrition rates. When the Company determines that there are accounts receivable that are uncollectible, they are charged off against the allowance for doubtful accounts. As of December 31, 2014 and 2013, no accounts receivable were classified as held for sale. Provision for doubtful accounts is included in general and administrative expenses in the accompanying consolidated statements of operations.
The changes in the Company’s allowance for accounts receivable were as follows for the periods ended (in thousands):
| Successor | Predecessor | |||||||||||||||||
| Year ended December 31, 2014 |
Year ended December 31, 2013 |
Period from November 17, through December 31, 2012 |
Period from January 1, through November 16, 2012 |
|||||||||||||||
| Beginning balance |
$ | 1,901 | $ | 2,301 | $ | 3,649 | $ | 1,903 | ||||||||||
| Provision for doubtful accounts |
15,656 | 10,360 | 1,307 | 8,204 | ||||||||||||||
| Write-offs and adjustments |
(14,184 | ) | (10,760 | ) | (2,655 | ) | (6,458 | ) | ||||||||||
|
|
|
|
|
|
|
|
|
|||||||||||
| Balance at end of period |
$ | 3,373 | $ | 1,901 | $ | 2,301 | $ | 3,649 | ||||||||||
|
|
|
|
|
|
|
|
|
|||||||||||
Inventories—Inventories, which comprise home automation and security system equipment and parts, are stated at the lower of cost or market with cost determined under the first-in, first-out (FIFO) method. The Company records an allowance for excess and obsolete inventory based on anticipated obsolescence, usage and historical write-offs.
70
Table of Contents
Long-lived Assets and Intangibles—Property and equipment are stated at cost and depreciated on the straight-line method over the estimated useful lives of the assets or the lease term for assets under capital leases, whichever is shorter. Intangible assets with definite lives are amortized over the remaining estimated economic life of the underlying technology or relationships, which ranges from 2 to 10 years. Definite-lived intangible assets are amortized on the straight-line method over the estimated useful life of the asset or in a pattern in which the economic benefits of the intangible asset are consumed. Amortization expense associated with leased assets is included with depreciation expense. Routine repairs and maintenance are charged to expense as incurred. The Company periodically assesses potential impairment of its long-lived assets and intangibles and performs an impairment review whenever events or changes in circumstances indicate that the carrying value may not be recoverable. In addition, the Company periodically assesses whether events or changes in circumstance continue to support an indefinite life of certain intangible assets or warrant a revision to the estimated useful life of definite-lived intangible assets.
Long-term Investments— The Company’s long-term investments are comprised of cost based investments in other companies as discussed in Note 8. The Company performs impairment analyses of its cost based investments annually, as of October 1, or more often when events occur or circumstances change that would, more likely than not, reduce the fair value of the investment below its carrying value. When indicators of impairment do not exist and certain accounting criteria are met, the Company evaluates impairment using a qualitative approach. As of December 31, 2014, no indicators of impairment existed associated with these cost based investments.
Deferred Financing Costs— Costs incurred in connection with obtaining debt financing are deferred and amortized utilizing the straight-line method, which approximates the effective-interest method, over the life of the related financing. If such financing is paid off or replaced prior to maturity with debt instruments that have substantially different terms, the unamortized costs are charged to expense. In connection with refinancing the debt in conjunction with the Merger, the Company wrote off $3.5 million related to unamortized deferred financing costs. Deferred financing costs included in the accompanying consolidated balance sheets at December 31, 2014 and 2013 were $52.2 million and $59.4 million, net of accumulated amortization of $20.0 million and $9.9 million, respectively. Amortization expense on deferred financing costs recognized and included in interest expense in the accompanying consolidated statements of operations, totaled $10.1 million for the year ended December 31, 2014, $8.8 million for the year ended December 31, 2013, $1.0 million for the Successor Period ended December 31, 2012 and $6.6 million for the Predecessor Period ended November 16, 2012.
Residual Income Plan—The Company has a program that allows third-party sales channel partners to receive additional compensation based on the performance of the underlying contracts they create. The Company calculates the present value of the expected future payments and recognizes this amount in the period the commissions are earned. Subsequent accretion and adjustments to the estimated liability are recorded as interest and operating expense respectively. The Company monitors actual payments and customer attrition on a periodic basis and, when necessary, makes adjustments to the liability. The amount included in accrued expenses and other current liabilities was $0.4 million and $0.3 million as of December 31, 2014 and 2013, respectively, and the amount included in other long-term obligations was $3.0 million and $2.1 million at December 31, 2014 and 2013, respectively, representing the present value of the estimated amounts owed to third-party sales channel partners.
Stock-Based Compensation—The Company measures compensation cost based on the grant-date fair value of the award and recognizes that cost over the requisite service period of the awards (See Note 15).
Advertising Expense—Advertising costs are expensed as incurred. Advertising costs were approximately $23.6 million and $23.0 million for the years ended December 31, 2014 and 2013, $1.7 million for the Successor Period ended December 31, 2012 and $8.2 million for the Predecessor Period ended November 16, 2012.
Income Taxes—The Company accounts for income taxes based on the asset and liability method. Under the asset and liability method, deferred tax assets and deferred tax liabilities are recognized for the future tax consequences attributable to differences between the financial statement carrying amounts of existing assets and liabilities and their respective tax bases and operating loss and tax credit carryforwards. Valuation allowances are established when necessary to reduce deferred tax assets when it is determined that it is more likely than not that some portion of the deferred tax asset will not be realized.
The Company recognizes the effect of an uncertain income tax position on the income tax return at the largest amount that is more-likely-than-not to be sustained upon audit by the relevant taxing authority. An uncertain income tax position will not be recognized if it has less than a 50% likelihood of being sustained. The Company’s policy for recording interest and penalties is to record such items as a component of the provision for income taxes.
Contracts Sold—On March 31, 2014, the Company received approximately $2.3 million in proceeds from the sale of certain subscriber contracts to a third-party. Concurrently, the Company entered into an agreement with the buyer to continue providing billing, monitoring and support services for the contracts that were sold for a period of ten years. As a result of this continuing involvement on the part of the Company in the servicing of the contracts, accounting guidance precluded gain recognition at the time of the sale. Accordingly, the Company treated this transaction as a secured borrowing and recorded a liability for the proceeds received at the time of the sale. On November 24, 2014, the Company repurchased the subscriber contracts from this third-party for $2.3 million and the associated liability was settled. No material gain/loss on the transaction was recognized.
71
Table of Contents
Use of Estimates—The preparation of financial statements in conformity with U.S. generally accepted accounting principles requires management to make estimates and assumptions that affect the amounts reported in the financial statements. Actual results could differ from those estimates.
Concentrations of Credit Risk—Financial instruments that potentially subject the Company to concentration of credit risk consist principally of receivables and cash. At times during the year, the Company maintains cash balances in excess of insured limits. The Company is not dependent on any single customer or geographic location. The loss of a customer would not adversely impact the Company’s operating results or financial position.
Concentrations of Supply Risk—As of December 31, 2014, approximately 74% of the Company’s installed panels were 2GIG Go!Control panels and 19% were SkyControl panels. On April 1, 2013, the Company completed the 2GIG Sale. In connection with the 2GIG Sale, the Company entered into a five-year supply agreement with 2GIG, pursuant to which they will be the exclusive provider of the Company’s control panel requirements, subject to certain exceptions as provided in the supply agreement. The loss of 2GIG as a supplier could potentially impact the Company’s operating results or financial position.
Fair Value Measurement—Fair value is based on the price that would be received to sell an asset or paid to transfer a liability in an orderly transaction between market participants at the measurement date. Assets and liabilities subject to on-going fair value measurement are categorized and disclosed into one of three categories depending on observable or unobservable inputs employed in the measurement. These two types of inputs have created the following fair value hierarchy:
Level 1: Quoted prices in active markets that are accessible at the measurement date for assets and liabilities.
Level 2: Observable prices that are based on inputs not quoted in active markets, but corroborated by market data.
Level 3: Unobservable inputs are used when little or no market data is available.
This hierarchy requires the Company to minimize the use of unobservable inputs and to use observable market data, if available, when determining fair value. The Company recognizes transfers between levels of the hierarchy based on the fair values of the respective financial measurements at the end of the reporting period in which the transfer occurred. There were no transfers between levels of the fair value hierarchy during the years ended December 31, 2014 and 2013.
The carrying amounts of the Company’s accounts receivable, accounts payable and accrued and other liabilities approximate their fair values due to their short maturities.
Goodwill—The Company conducts a goodwill impairment analysis annually in the fourth fiscal quarter, as of October 1, and as necessary if changes in facts and circumstances indicate that the fair value of the Company’s reporting units may be less than its carrying amount. When indicators of impairment do not exist and certain accounting criteria are met, the Company is able to evaluate goodwill impairment using a qualitative approach. When necessary, the Company’s quantitative goodwill impairment test consists of two steps. The first step requires that the Company compare the estimated fair value of its reporting units to the carrying value of the reporting unit’s net assets, including goodwill. If the fair value of the reporting unit is greater than the carrying value of its net assets, goodwill is not considered to be impaired and no further testing is required. If the fair value of the reporting unit is less than the carrying value of its net assets, the Company would be required to complete the second step of the test by analyzing the fair value of its goodwill. If the carrying value of the goodwill exceeds its fair value, an impairment charge is recorded (See Note 11).
Foreign Currency Translation and Other Comprehensive Income—The functional currencies of Vivint Canada, Inc. and Vivint New Zealand, Ltd. are the Canadian and New Zealand dollars, respectively. Accordingly, assets and liabilities are translated from their respective functional currencies into U.S. dollars at period-end rates and revenue and expenses are translated at the weighted-average exchange rates for the period. Adjustments resulting from this translation process are classified as other comprehensive income (loss) and shown as a separate component of equity.
Letters of Credit—As of December 31, 2014 and 2013, the Company had $3.0 million and $2.2 million, respectively, of letters of credit issued in the ordinary course of business, all of which are undrawn.
New Accounting Pronouncement—In May 2014, the FASB issued authoritative guidance which clarifies the principles used to recognize revenue for all entities. The new guidance requires companies to recognize revenue when it transfers goods or services to a customer in an amount that reflects the consideration to which a company expects to be
72
Table of Contents
entitled. The guidance is effective for annual and interim periods beginning after December 15, 2016. The guidance allows for either a “full retrospective” adoption or a “modified retrospective” adoption, however early adoption is not permitted. The Company is currently evaluating the impact the adoption of this guidance will have on its consolidated financial statements.
In August 2014, the Financial Accounting Standards Board issued ASU No. 2014-15. This standard provides guidance on determining when and how to disclose going-concern uncertainties in the financial statements. The new standard requires management to perform interim and annual assessments of an entity’s ability to continue as a going concern within one year of the date the financial statements are issued. This ASU is effective for fiscal years, and interim periods within those years, beginning on or after December 15, 2016, with early adoption permitted. We are evaluating the new guidance and plan to provide additional information about its expected impact at a future date.
In February 2013, the FASB issued authoritative guidance which expands the disclosure requirements for amounts reclassified out of accumulated other comprehensive income (“AOCI”). The guidance requires an entity to provide information about the amounts reclassified out of AOCI by component and present, either on the face of the income statement or in the notes to financial statements, significant amounts reclassified out of AOCI by the respective line items of net income but only if the amount reclassified is required under GAAP to be reclassified to net income in its entirety in the same reporting period. For other amounts, an entity is required to cross-reference to other disclosures required under GAAP that provide additional detail about those amounts. This guidance does not change the current requirements for reporting net income or OCI in financial statements. The guidance became effective for the Company in the first quarter of fiscal year 2014. The adoption of this guidance did not have a material impact on its financial position, results of operations or cash flows.
In July 2013, the FASB issued authoritative guidance which amends the guidance related to the presentation of unrecognized tax benefits and allows for the reduction of a deferred tax asset for a net operating loss carryforward whenever the net operating loss carryforward or tax credit carryforward would be available to reduce the additional taxable income or tax due if the tax position is disallowed. This guidance became effective for the Company for annual and interim periods beginning in fiscal year 2014. The adoption of this guidance did not have a material impact on its financial position, results of operations or cash flows.
NOTE 3—BUSINESS COMBINATION
Wildfire Acquisition
On January 31, 2014, a wholly-owned subsidiary of the Company completed the purchase of certain assets, and assumed certain liabilities, of Wildfire Broadband, LLC (“Wildfire”). Pursuant to the terms of the asset purchase agreement the Company paid aggregate cash consideration of $3.5 million, of which $0.4 million was held in escrow for indemnification obligations and was settled in early 2015. This strategic acquisition was made to provide the Company access to Wildfire’s existing customers, wireless internet infrastructure and know-how. The accompanying consolidated financial statements include the financial position and results of operations associated with the Wildfire assets acquired and liabilities assumed from January 31, 2014. The pro forma impact of Wildfire on the Company’s financial position and results of operations for the year ended December 31, 2014 is immaterial. The associated goodwill is deductible for income tax purposes.
The following table summarizes the estimated fair value of the assets acquired and liabilities assumed at the time of acquisition (in thousands):
| Net assets acquired from Wildfire |
$ | 96 | ||
| Intangible assets (See Note 11) |
2,900 | |||
| Goodwill |
504 | |||
|
|
|
|||
| Total cash consideration |
$ | 3,500 | ||
|
|
|
During the year ended December 31, 2014, the Company incurred costs associated with the Wildfire acquisition, which were not material, consisting of accounting, legal and professional fees and payments to employees directly associated with the acquisition. These costs are included in general and administrative expenses in the accompanying audited consolidated statements of operations.
73
Table of Contents
Space Monkey Acquisition
On August 25, 2014, the Company’s parent purchased Space Monkey, Inc. (“Space Monkey”), a data cloud storage technology company, then merged Space Monkey with a wholly-owned subsidiary of the Company. Pursuant to the terms of the merger the Company paid aggregate cash consideration of $15.0 million, of which $1.5 million is held in escrow for indemnification obligations. This strategic acquisition was made to support the growth and development of the Company’s Smart Home platform. The accompanying condensed consolidated financial statements include the financial position and results of operations associated with the Space Monkey assets acquired and liabilities assumed from August 25, 2014. The pro forma impact of Space Monkey on the Company’s financial position and results of operations for the year ended December 31, 2014 is immaterial.
The following table summarizes the estimated fair value of the assets acquired and liabilities assumed at the time of acquisition (in thousands):
| Net assets acquired from Space Monkey |
$ | 404 | ||
| Deferred tax liability |
(1,106 | ) | ||
| Intangible assets (See Note 11) |
8,300 | |||
| Goodwill |
7,402 | |||
|
|
|
|||
| Total estimated fair value of the assets acquired and liabilities assumed |
$ | 15,000 | ||
|
|
|
During the year ended December 31, 2014, the Company incurred costs associated with the Space Monkey acquisition, which were not material, consisting of accounting, legal and professional fees and payments to employees directly associated with the acquisition. These costs are included in general and administrative expenses in the accompanying consolidated statements of operations.
Smartrove Acquisition
On May 29, 2013, a wholly-owned subsidiary of the Company, Vivint Wireless, Inc. (“Vivint Wireless”), completed a 100% stock acquisition of Smartrove. Pursuant to the terms of the stock purchase agreement, Vivint Wireless acquired the business for aggregate cash consideration of $4.3 million. This strategic acquisition was made to provide Vivint Wireless with full ownership of certain intellectual property used in its operations. The accompanying consolidated financial statements include the financial position and results of operations of Smartrove as a wholly-owned subsidiary from May 29, 2013. The pro forma impact of Smartrove on the Company’s financial position and results of operations for the year ended December 31, 2013 was immaterial.
The associated goodwill is not deductible for income tax purposes. The following table summarizes the estimated fair values of the assets acquired and liabilities assumed as of December 31, 2014 (in thousands):
| Net assets acquired from Smartrove—Cash |
$ | 3 | ||
| Deferred income tax liability |
(1,533 | ) | ||
| Intangible assets (See Note 11) |
4,040 | |||
| Goodwill |
1,765 | |||
|
|
|
|||
| Total fair value of the assets acquired and liabilities assumed |
$ | 4,275 | ||
|
|
|
During the year ended December 31, 2013, the Company incurred costs associated with the Smartrove Acquisition, which were not material, consisting of accounting, investment banking, legal and professional fees and payments to employees directly associated with the acquisition. These costs are included in general and administrative expenses in the accompanying consolidated statements of operations.
74
Table of Contents
The Merger
As described in Note 1, the Merger was completed on November 16, 2012, and was financed by a combination of equity invested by affiliates of The Blackstone Group, certain co-investors, the Company’s management and certain employees and borrowings under a revolving credit facility and issuance of notes. The Company’s management and certain employees invested approximately $155.2 million in the form of a rollover of their equity in APX and 2GIG and cash investments were used to repay all outstanding borrowings under the Predecessor’s secured credit facilities, pay Predecessor shareholders, purchase equity units of Acquisition LLC and pay transaction fees and expenses. As part of the Merger, as of December 31, 2014 and 2013, there was $14.2 and $28.4 million, respectively, held in escrow and presented as restricted cash in the accompanying financial statements for payments to employees that will be due in the next two years. At the time of the Merger, approximately $54.3 million was placed in escrow to cover potential adjustments to the total purchase consideration associated with general representations and warranties and adjustments to tangible net worth, in accordance with the terms of the Merger’s escrow agreement. This amount is included in the total purchase consideration discussed below. The remaining escrow balance, after all adjustments are made in accordance with the escrow agreement, is expected to be paid to the former Company shareholders during 2015. Because these amounts held in escrow are not controlled by the Company, they are not included in the accompanying consolidated balance sheets.
Purchase Consideration
The following table summarizes the purchase price consideration (in thousands):
| Revolving line of credit |
$ | 10,000 | ||
| Issuance of bonds, net of issuance costs |
1,246,646 | |||
| Contributed equity |
713,821 | |||
| Less: Transaction costs |
(31,540 | ) | ||
| Less: Net worth adjustment |
(3,289 | ) | ||
|
|
|
|||
| Total purchase consideration |
$ | 1,935,638 | ||
|
|
|
Purchase Price Allocation
The purchase price of approximately $1.9 billion includes the purchase of all outstanding stock, settlement of the Predecessor’s debt, settlement of stock-based awards, payments to employees under long-term incentive arrangements, transaction fees and expenses and purchase of subscriber accounts held by third parties. Payments to employees consisted of payments to officers, employees and directors as change in control payments and special retention bonuses. On the date of the Merger, the Company paid $28.4 million or 50% of the amount due to employees under long-term incentive arrangements. Of the remaining 50%, the Company paid one of two equal installments during the year ended December 31, 2014. The remaining installment will be paid by the third anniversary date of the Merger. In addition to the payments under these long-term incentive arrangements, the Company also incurred $48.6 million of costs related to bonus and other payments to employees directly related to the Merger. These employee expenses are included in total costs and expenses in the Predecessor Period consolidated statement of operations.
The estimated fair values of the assets acquired and liabilities assumed are based on information obtained from various sources including, the Company’s management and historical experience. The fair value of the intangible assets was determined using the income and the cost approaches. Key assumptions used in the determination of fair value include projected cash flows, subscriber attrition rates and discount rates between 8% and 14%.
The following table summarizes the estimated fair values of the assets acquired and liabilities assumed as of November 16, 2012(in thousands):
| Current assets acquired |
$ | 73,239 | ||
| Property, plant and equipment |
29,293 | |||
| Other assets |
30,535 | |||
| Intangible assets |
1,062,300 | |||
| Goodwill |
880,302 | |||
| Current liabilities assumed |
(100,258 | ) | ||
| Deferred income tax liability |
(33,996 | ) | ||
| Other liabilities |
(5,777 | ) | ||
|
|
|
|||
| Total purchase price allocation |
$ | 1,935,638 | ||
|
|
|
75
Table of Contents
Goodwill resulting from the Merger is not deductible for income tax purposes. The Company incurred costs associated with the Merger of approximately $31.9 million in the Successor Period from November 17, 2012 through December 31, 2012 and approximately $23.5 million in the Predecessor Period from January 1, 2012 through November 16, 2012. These costs consist of accounting, investment banking, legal and professional fees and employee expenses directly associated with the Merger and are included in the accompanying consolidated statements of operations.
NOTE 4—DIVESTITURE OF SUBSIDIARY
On April 1, 2013, the Company completed the 2GIG Sale. Pursuant to the terms of the 2GIG Sale, Nortek, Inc. acquired all of the outstanding common stock of 2GIG for aggregate cash consideration of approximately $148.9 million, including cash, working capital and indebtedness adjustments as provided in the stock purchase agreement. In connection with the 2GIG Sale, the Company entered into a five-year supply agreement with 2GIG, pursuant to which they will be the exclusive provider of the Company’s control panel requirements, subject to certain exceptions as provided in the supply agreement. A portion of the net proceeds from the 2GIG Sale was used to repay $44.0 million of outstanding borrowings under the Company’s revolving credit facility. The terms of the indenture governing the 2020 notes (as defined below), the indenture governing the 2019 notes (as defined below) and the credit agreement governing the revolving credit facility, permit the Company, subject to certain conditions, to distribute all or a portion of the net proceeds from the 2GIG Sale to the Company’s stockholders. In May 2013, the Company distributed a dividend of $60.0 million from such proceeds to stockholders. Subject to the applicable conditions, the Company may distribute the remaining proceeds in the future. The Company’s financial position and results of operations include 2GIG through March 31, 2013.
The following table summarizes the net gain recognized in connection with this divestiture (in thousands):
| Adjusted net sale price |
$ | 148,871 | ||
| 2GIG assets (including cash of $3,383), net of liabilities |
(109,053 | ) | ||
| 2.0 technology, net of amortization |
16,903 | |||
| Other |
(9,855 | ) | ||
|
|
|
|||
| Net gain on divestiture |
$ | 46,866 | ||
|
|
|
NOTE 5—LONG-TERM DEBT
On November 16, 2012, APX issued $1.3 billion aggregate principal amount of notes, of which $925.0 million aggregate principal amount of 6.375% senior secured notes due 2019 (the “2019 notes”) mature on December 1, 2019 and are secured on a first-priority lien basis by substantially all of the tangible and intangible assets whether now owned or hereafter acquired by the Company, subject to permitted liens and exceptions, and $380.0 million aggregate principal amount of 8.75% senior notes due 2020 (the “2020 notes” and together with the 2019 notes, the “notes”), mature on December 1, 2020.
During 2013, APX completed two offerings of additional 2020 notes under the indenture dated November 16, 2012 . On May 31, 2013, APX issued $200.0 million of 2020 notes at a price of 101.75% and on December 13, 2013, APX issued an additional $250.0 million of 2020 notes at a price of 101.50%. Blackstone Advisory Partners L.P. (“Blackstone Partners”) participated as one of the initial purchasers of the 2020 notes in each of the May 31, 2013 and December 13, 2013 offerings and received approximately $0.2 million and $0.3 million in fees, respectively, at the time of closing.
On July 1, 2014, APX issued an additional $100.0 million of 2020 notes. In connection with the issuance, Blackstone Partners participated as one of the initial purchasers of the 2020 notes and received approximately $0.1 million in fees at the time of closing.
Interest accrues at the rate of 6.375% per annum for the 2019 notes and 8.75% per annum for the 2020 notes. Interest on the notes is payable semiannually in arrears on each June 1 and December 1. APX may redeem each series of the notes, in whole or part, at any time prior to December 1, 2015 at a redemption price equal to the principal amount of the notes to be redeemed, plus a make-whole premium and any accrued and unpaid interest at the redemption date. In addition, after December 1, 2015, APX may redeem the notes at the prices and on the terms specified in the applicable indenture.
76
Table of Contents
Revolving Credit Facility
On November 16, 2012, APX Group Holdings, Inc. and the other guarantors entered into a revolving credit facility in the aggregate principal amount of $200.0 million. On June 28, 2013, the Company amended and restated the credit agreement to provide for a new repriced tranche of revolving credit commitments with a lower interest rate. Nearly all of the existing tranches of revolving credit commitments were terminated and converted into the repriced tranche, with the unterminated portion of the existing tranche continuing to accrue interest at the original rate.
Borrowings under the revolving credit facility bear interest at a rate per annum equal to an applicable margin plus, at our option, either (1) the base rate determined by reference to the highest of (a) the Federal Funds rate plus 0.50%, (b) the prime rate of Bank of America, N.A. and (c) the LIBOR rate determined by reference to the costs of funds for U.S. dollar deposits for an interest period of one month, plus 1.00% or (2) the LIBOR rate determined by reference to the London interbank offered rate for dollars for the interest period relevant to such borrowing. The applicable margin for base rate-based borrowings (1)(a) under the repriced tranche is currently 2.0% per annum and (b) under the former tranche is currently 3.0% and (2)(a) the applicable margin for LIBOR rate-based borrowings (a) under the repriced tranche is currently 3.0% per annum and (b) under the former tranche is currently 4.0%. The applicable margin for borrowings under the revolving credit facility is subject to one step-down of 25 basis points based on our meeting a consolidated first lien net leverage ratio test at the end of each fiscal quarter.
In addition to paying interest on outstanding principal under the revolving credit facility, the Company is required to pay a quarterly commitment fee of 0.50% (which will be subject to one step-down based on our meeting a consolidated first lien net leverage ratio test) to the lenders under the revolving credit facility in respect of the unutilized commitments thereunder. The Company also pays customary letter of credit and agency fees. The borrowings are due November 16, 2017, which may be repaid at any time without penalty.
The Company’s debt at December 31, 2014 had maturity dates of 2019 and beyond and consisted of the following (in thousands):
| Outstanding Principal |
Unamortized Premium |
Net Carrying Amount |
||||||||||
| Revolving credit facility due 2017 |
$ | 20,000 | $ | — | $ | 20,000 | ||||||
| 6.375% Senior Secured Notes due 2019 |
925,000 | — | 925,000 | |||||||||
| 8.75% Senior Notes due 2020 |
930,000 | 8,155 | 938,155 | |||||||||
|
|
|
|
|
|
|
|||||||
| Total Notes payable |
$ | 1,875,000 | $ | 8,155 | $ | 1,883,155 | ||||||
|
|
|
|
|
|
|
|||||||
The Company’s debt at December 31, 2013 consisted of the following (in thousands):
| Outstanding Principal |
Unamortized Premium |
Net Carrying Amount |
||||||||||
| Revolving credit facility due 2017 |
$ | — | $ | — | $ | — | ||||||
| 6.375% Senior Secured Notes due 2019 |
925,000 | — | 925,000 | |||||||||
| 8.75% Senior Notes due 2020 |
830,000 | 7,049 | 837,049 | |||||||||
|
|
|
|
|
|
|
|||||||
| Total Notes payable |
$ | 1,755,000 | $ | 7,049 | $ | 1,762,049 | ||||||
|
|
|
|
|
|
|
|||||||
NOTE 6—DISCONTINUED OPERATIONS
During the first quarter of 2012, the Company abandoned Smart Grid, a component of its energy management business. The circumstances leading up to the abandonment included a shift in the strategic direction for Smart Grid within the energy management framework. All operating activity ceased during the second quarter of 2012. No income taxes were recorded on discontinued operations because the tax effect was immaterial and the tax benefit of the loss was offset by a valuation allowance.
77
Table of Contents
The following table presents discontinued operations of the disposed business component (in thousands):
| Predecessor | ||||
| Period from January 1, through November 16, 2012 |
||||
| Revenue, net |
$ | 91 | ||
| Operating loss |
(329 | ) | ||
| Interest expense |
(1 | ) | ||
| Impairment of acquired intangible |
— | |||
|
|
|
|||
| Total discontinued operations |
$ | (239 | ) | |
|
|
|
|||
NOTE 7—VARIABLE INTEREST ENTITIES
Accounting rules require the primary beneficiary of a variable interest entity (“VIE”) to include the financial position and results of operations of the VIE in its condensed consolidated financial statements. The Predecessor consolidated financial statements include APX Group, Inc. and its subsidiaries, and 2GIG and Solar, which were VIE’s prior to the Merger in the Predecessor Period. In connection with the Merger, 2GIG became a wholly-owned subsidiary and their financial position and results of operations were consolidated by the Company in the Successor Period through the date of the 2GIG Sale. Also in connection with the Merger, the Investors purchased Solar for $75.0 million and, while Solar was a VIE of the Company through the date of Solar’s initial public offering, the Investors became the primary beneficiary and, as a result, the Solar financial position and results of operations are not consolidated by the Company in the Successor Period.
2GIG
2GIG is engaged in the manufacture, wholesale distribution, and monitoring of electronic home security and automation systems primarily in the United States and Canada. 2GIG supplies the majority of the equipment used by the Company in its security systems installations. Sales of this equipment to other legal entities owned or consolidated by the Company represented approximately 71% of 2GIG’s total sales during 2013 through April 1, 2013, the date of the 2GIG Sale. The Company determined that 2GIG was a VIE, prior to the Merger, and the Company was the primary beneficiary because Vivint, Inc. was 2GIG’s largest customer, 2GIG was dependent on Vivint, Inc. for ongoing financial support and because the Company, through its related parties, had the ability to control the operations of 2GIG. Accordingly, as indicated above, the financial position and results of operations are consolidated by the Company for the Predecessor Period. Non-controlling interests in the consolidated financial statements include the portion of equity and results of operations related to 2GIG.
Solar
Solar, formed in April 2011, installs solar panels on the roofs of customer’s homes and enters into purchase agreements for the customers to purchase the electricity generated by the panels. Solar also takes advantage of local government and federal incentive programs that offer assistance in generating green power. During the Predecessor Period, the Company determined that Solar was a VIE and the Company was the primary beneficiary because Solar was dependent on Vivint, Inc. for ongoing financial support and because the Company had the ability to control the operations of Solar through its related parties. Accordingly, as indicated above, the financial position and results of operations are consolidated by the Company for the Predecessor Period and not for the Successor Period. The assets of Solar are restricted in that they are only available to settle the obligations of Solar and not of the Company and similarly, the creditors of Solar have no recourse to the general assets of the Company.
The Company and Solar have entered into agreements under which the Company subleased corporate office space through October 2014, and provides certain other ongoing administrative services to Solar. During the years ended December 31, 2014 and 2013, the Company charged $8.5 million and $2.9 million, respectively, of general and administrative expenses to Solar in connection with these agreements. There were no charges for the Successor Period ended December 31, 2012 or the Predecessor Period ended November 16, 2012 in connection with these agreements. The balance
78
Table of Contents
due from Solar in connection with these agreements and other expenses paid on Solar’s behalf was $2.1 million and $3.1 million at December 31, 2014 and 2013, respectively, and is included in prepaid expenses and other current assets in the accompanying consolidated balance sheets.
On December 27, 2012, the Company executed a Subordinated Note and Loan Agreement with Solar. The terms of the agreement state that Solar may borrow up to $20.0 million, bearing interest on the outstanding balance at an annual rate of 7.5%, which interest is due and payable semi-annually on June 1 and December 1 of each year commencing on June 1, 2013. The balance outstanding on December 31, 2013, representing principal of $20.0 million and payment-in-kind interest of $1.3 million, is included in prepaid and other current assets and long-term investments and other assets, net, respectively, in the accompanying consolidated balance sheets. In addition, accrued interest of $0.1 million on December 31, 2013, respectively, is included in prepaid expenses and other current assets in the accompanying audited consolidated balance sheets. On October 10, 2014, in connection with the completion of its initial public offering, Solar repaid loans to APX Group, Inc., our wholly-owned subsidiary, and to our parent entity. Our parent entity, in turn, returned a portion of such proceeds to APX Group, Inc. as a capital contribution. These transactions resulted in the receipt by APX Group, Inc. of an aggregate amount of $55.0 million. These variable interests represent the Company’s maximum exposure to loss from direct involvement with Solar.
Also in connection with Solar’s initial public offering, the Company entered into a number of agreements with Solar related to services and other support that it has provided and will provide to Solar including:
| • | A Master Intercompany Framework Agreement which establishes a framework for the ongoing relationship between the Company and Solar and contains master terms regarding the protection of each other’s confidential information, and master procedural terms, such as notice procedures, restrictions on assignment, interpretive provisions, governing law and dispute resolution; |
| • | A Non-Competition Agreement in which the Company and Solar each define their current areas of business and their competitors, and agree not to directly or indirectly engage in the other’s business for three years; |
| • | A Transition Services Agreement pursuant to which the Company will provide to Solar various enterprise services, including services relating to information technology and infrastructure, human resources and employee benefits, administration services and facilities-related services; |
| • | A Product Development and Supply Agreement pursuant to which one of Solar’s wholly owned subsidiaries will, for an initial term of three years, subject to automatic renewal for successive one-year periods unless either party elects otherwise, collaborate with the Company to develop certain monitoring and communications equipment that will be compatible with other equipment used in Solar’s energy systems and will replace equipment Solar currently procures from third parties; |
| • | A Marketing and Customer Relations Agreement which governs various cross-marketing initiatives between the Company and Solar, in particularly the provision of sales leads from each company to the other; and |
| • | A Trademark License Agreement pursuant to which the licensor, a special purpose subsidiary majority-owned by the Company and minority-owned by Solar, will grant Solar a royalty-free exclusive license to the trademark “VIVINT SOLAR” in the field of selling renewable energy or energy storage products and services. |
NOTE 8—COST BASED INVESTMENTS
During the year ended December 31, 2014, the Company entered into a project agreement with a privately-held company (the “Investee”), whereby the Investee will develop technology for the Company. The Company is not required to make any payments to the Investee for developing the above technology, however, the Company is required to pay the Investee a royalty for any sales of product that include the technology once developed. In connection with the project agreement, the Company also entered into an investment agreement with the Investee, whereby the Company will purchase up to a predetermined number of shares of the Investee. The amount of the investment by the Company in the Investee was $0.1 million as of December 31, 2014. The Company could make up to $2.8 million in additional investments in the Investee, subject to the achievement of certain technology development milestones. These additional investments are expected to occur through July 1, 2016. The Company has determined that the arrangement with the Investee constitutes a variable interest. The Company is not required to consolidate the results of the Investee as the Company is not the primary beneficiary.
79
Table of Contents
On February 19, 2014, the Company invested $3.0 million in a convertible note (“Convertible Note”) of a privately held company (“Investee”) not affiliated with the Company. The Convertible Note had a stated maturity date of February 19, 2015 and bore interest equal to the greater of (a) 0.5% or (b) annual interest rates established for federal income tax purposes by the Internal Revenue Service. The outstanding principal and accrued interest balance of the Convertible Note converted to preferred stock (“preferred stock”) of the Investee on August 29, 2014, under the terms of the agreement.
The Company performs impairment analyses of its cost based investments annually, or more often, when events occur or circumstances change that would, more likely than not, reduce the fair value of the investment below its carrying value. When indicators of impairment do not exist and certain accounting criteria are met, the Company evaluates impairment using a qualitative approach. As of December 31, 2014, no indicators of impairment existed associated with these cost based investments.
NOTE 9—BALANCE SHEET COMPONENTS
The following table presents balance sheet component balances as of December 31, 2014 and December 31, 2013 (in thousands):
| December 31, | ||||||||
| 2014 | 2013 | |||||||
| Subscriber contract costs |
||||||||
| Subscriber contract costs |
$ | 628,739 | $ | 310,666 | ||||
| Accumulated amortization |
(80,666 | ) | (22,350 | ) | ||||
|
|
|
|
|
|||||
| Subscriber contract costs, net |
$ | 548,073 | $ | 288,316 | ||||
|
|
|
|
|
|||||
| Long-term investments and other assets |
||||||||
| Notes receivable, net of allowance (See Notes 7 and 17) |
$ | 600 | $ | 21,323 | ||||
| Security deposit receivable |
6,606 | 6,261 | ||||||
| Investments (See Note 2) |
3,306 | — | ||||||
| Other |
21 | 92 | ||||||
|
|
|
|
|
|||||
| Total long-term investments and other assets, net |
$ | 10,533 | $ | 27,676 | ||||
|
|
|
|
|
|||||
| Accrued payroll and commissions |
||||||||
| Accrued payroll |
$ | 16,432 | $ | 15,475 | ||||
| Accrued commissions |
21,547 | 30,532 | ||||||
|
|
|
|
|
|||||
| Total accrued payroll and commissions |
$ | 37,979 | $ | 46,007 | ||||
|
|
|
|
|
|||||
| Accrued expenses and other current liabilities |
||||||||
| Accrued interest payable |
$ | 11,695 | $ | 10,982 | ||||
| Loss contingencies |
9,663 | 9,263 | ||||||
| Other |
7,504 | 12,873 | ||||||
|
|
|
|
|
|||||
| Total accrued expenses and other current liabilities |
$ | 28,862 | $ | 33,118 | ||||
|
|
|
|
|
|||||
80
Table of Contents
NOTE 10—PROPERTY AND EQUIPMENT
Property and equipment consisted of the following (in thousands):
| December 31, | Estimated Useful Lives | |||||||||
| 2014 | 2013 | |||||||||
| Vehicles |
$ | 20,728 | $ | 13,851 | 3-5 years | |||||
| Computer equipment and software |
18,069 | 6,742 | 3-5 years | |||||||
| Leasehold improvements |
13,606 | 13,345 | 2-15 years | |||||||
| Office furniture, fixtures and equipment |
12,845 | 4,793 | 7 years | |||||||
| Warehouse equipment |
110 | 1,802 | 7 years | |||||||
| Buildings |
702 | 702 | 39 years | |||||||
| Construction in process |
12,601 | 3,119 | ||||||||
|
|
|
|
|
|||||||
| 78,661 | 44,354 | |||||||||
| Accumulated depreciation and amortization |
(15,871 | ) | (8,536 | ) | ||||||
|
|
|
|
|
|||||||
| Net property and equipment |
$ | 62,790 | $ | 35,818 | ||||||
|
|
|
|
|
|||||||
Property and equipment includes approximately $20.9 million and $13.7 million of assets under capital lease obligations, net of accumulated amortization of $4.1 million and $2.7 million at December 31, 2014 and 2013, respectively. Construction in process includes $9.8 million of infrastructure associated with the Wireless business as of December 31, 2014. Depreciation and amortization expense on all property and equipment was $11.3 million and $9.1 million for the years ended December 31, 2014 and 2013, respectively, $1.2 million for the Successor Period ended December 31, 2012 and $7.4 million for the Predecessor Period ended November 16, 2012. Amortization expense relates to assets under capital leases as included in depreciation and amortization expense.
NOTE 11—GOODWILL AND INTANGIBLE ASSETS
Goodwill
The changes in the carrying amount of goodwill for the years ended December 31, 2014 and 2013, by operating segment, were as follows (in thousands):
| Vivint | 2GIG | Consolidated | ||||||||||
| Balance as of January 1, 2013 |
$ | 832,850 | $ | 43,792 | $ | 876,642 | ||||||
| Goodwill resulting from Smartrove acquisition |
1,765 | — | 1,765 | |||||||||
| Goodwill resulting from net worth adjustments |
2,079 | — | 2,079 | |||||||||
| Goodwill resulting from income tax adjustments |
1,852 | — | 1,852 | |||||||||
| Effect of foreign currency translation |
(2,228 | ) | — | (2,228 | ) | |||||||
| Divestiture of 2GIG |
— | (43,792 | ) | (43,792 | ) | |||||||
|
|
|
|
|
|
|
|||||||
| Balance as of December 31, 2013 |
836,318 | — | 836,318 | |||||||||
| Goodwill resulting from Wildfire acquisition |
504 | — | 504 | |||||||||
| Goodwill resulting from Space Monkey acquisition |
7,402 | — | 7,402 | |||||||||
| Effect of foreign currency translation |
(2,702 | ) | — | (2,702 | ) | |||||||
|
|
|
|
|
|
|
|||||||
| Balance as of December 31, 2014 |
$ | 841,522 | $ | — | $ | 841,522 | ||||||
|
|
|
|
|
|
|
|||||||
81
Table of Contents
In accordance with authoritative guidance for accounting for goodwill and other intangible assets, the Company performs an impairment test on its goodwill annually in its fourth fiscal quarter, as of October 1, or more often when events occur or circumstances change that would, more likely than not, reduce the fair value of a reporting unit below its carrying value. When indicators of impairment do not exist and certain accounting criteria are met, the Company is able to evaluate goodwill impairment using a qualitative approach. As of December 31, 2014, no indicators of impairment existed.
Intangible assets, net
The following table presents intangible asset balances as of December 31, 2014 and 2013 (in thousands):
| December 31, | Estimated Useful Lives | |||||||||
| 2014 | 2013 | |||||||||
| Definite-lived intangible assets: |
||||||||||
| Customer contracts |
$ | 978,776 | $ | 984,403 | 10 years | |||||
| 2GIG 2.0 technology |
17,000 | 17,000 | 8 years | |||||||
| CMS and other technology |
7,067 | 6,114 | 5 years | |||||||
| Space Monkey technology |
7,100 | — | 6 years | |||||||
| Wireless internet technologies |
4,690 | 4,690 | 2-3 years | |||||||
| Patents |
6,518 | — | 5 years | |||||||
| Non-compete agreements |
2,000 | — | 2-3 years | |||||||
|
|
|
|
|
|||||||
| 1,023,151 | 1,012,207 | |||||||||
| Accumulated amortization |
(320,198 | ) | (171,493 | ) | ||||||
|
|
|
|
|
|||||||
| Definite-lived intangible assets, net |
702,953 | 840,714 | ||||||||
| Indefinite-lived intangible assets: |
||||||||||
| IP addresses |
214 | — | ||||||||
| Domain names |
59 | — | ||||||||
|
|
|
|
|
|||||||
| Total indefinite-lived intangible assets |
273 | — | ||||||||
|
|
|
|
|
|||||||
| Total intangible assets, net |
$ | 703,226 | $ | 840,714 | ||||||
|
|
|
|
|
|||||||
During the years ended December 31, 2014 and 2013, respectively, the Company recognized $1.3 million and $0.1 million of amortization expense related to the capitalized software development costs. There were no capitalized software development costs for the Successor Period ended December 31, 2012 or the Predecessor Period ended November 16, 2012.
Identifiable intangible assets acquired by the Company in connection with the Smartrove acquisition consisted of $4.0 million of Smartrove technology and $0.7 million of other related technologies. Identifiable intangible assets acquired by the Company in connection with the Wildfire acquisition were $2.1 million of customer contracts and $0.8 million associated with non-compete agreements entered into by certain former members of Wildfire management. Identifiable intangible assets acquired by the Company in connection with the Space Monkey acquisition were $7.1 million of Space Monkey technology and $1.2 million associated with non-compete agreements entered into by certain former members of Space Monkey management.
82
Table of Contents
On March 29, 2014, the Company implemented new customer relationship management software (“CRM”). Historically, the Company’s customer management system (“CMS”) technology was used for customer support and inventory tracking. The new CRM software replaced the customer support functionality of the CMS technology. Following the CRM implementation, the CMS technology continued to be used for inventory tracking. Due to the implementation of the new CRM software, as of March 31, 2014, the Company determined there to be a significant change in the extent and manner in which the CMS technology was being used. The Company estimated the fair value of the CMS technology as of March 31, 2014 to be $0.3 million based on management experience, inquiry and assessment of the remaining functionality of this technology as it related to inventory tracking. The associated impairment loss of $1.4 million is included in operating expenses in the accompanying consolidated statement of operations for the year ended December 31, 2014. In addition, the estimated remaining useful life of the CMS technology was evaluated and revised to one year from March 31, 2014, based on the intended use of the asset. The impact on income from continuing operations and net income from the change in the estimated remaining useful life was immaterial
Amortization expense related to intangible assets was $151.3 million and $164.2 million for the years ended December 31, 2014 and 2013, respectively, $10.1 million for the Successor Period ended December 31, 2012 and $0.3 million for the Predecessor Period ended November 16, 2012.
Estimated future amortization expense of intangible assets, excluding approximately $0.2 million in patents currently in process, is as follows as of December 31, 2014 (in thousands):
| 2015 |
$ | 136,142 | ||
| 2016 |
118,585 | |||
| 2017 |
102,264 | |||
| 2018 |
90,529 | |||
| 2019 |
78,790 | |||
| Thereafter |
176,437 | |||
|
|
|
|||
| Total estimated amortization expense |
$ | 702,747 | ||
|
|
|
83
Table of Contents
NOTE 12—FAIR VALUE MEASUREMENTS
Cash equivalents and restricted cash equivalents are classified as Level 1 as they have readily available market prices in an active market. The following summarizes the financial instruments of the Company at fair value based on the valuation approach applied to each class of security as of December 31, 2014 and 2013 (in thousands):
| Fair Value Measurement at Reporting Date Using | ||||||||||||||||
| Balance at December 31, 2014 |
Quoted Prices in Active Markets for Identical Assets (Level 1) |
Significant Other Observable Inputs (Level 2) |
Significant Unobservable Inputs (Level 3) |
|||||||||||||
| Assets: |
||||||||||||||||
| Cash equivalents: |
||||||||||||||||
| Money market funds |
$ | 1 | $ | 1 | $ | — | $ | — | ||||||||
| Restricted cash equivalents: |
||||||||||||||||
| Money market funds |
14,214 | 14,214 | — | — | ||||||||||||
|
|
|
|
|
|
|
|
|
|||||||||
| Total assets |
$ | 14,215 | $ | 14,215 | $ | — | $ | — | ||||||||
|
|
|
|
|
|
|
|
|
|||||||||
| Fair Value Measurement at Reporting Date Using | ||||||||||||||||
| Balance at December 31, 2013 |
Quoted Prices in Active Markets for Identical Assets (Level 1) |
Significant Other Observable Inputs (Level 2) |
Significant Unobservable Inputs (Level 3) |
|||||||||||||
| Assets: |
||||||||||||||||
| Cash equivalents: |
||||||||||||||||
| Money market funds |
$ | 10,002 | $ | 10,002 | $ | — | $ | — | ||||||||
| Restricted cash equivalents: |
||||||||||||||||
| Money market funds |
14,214 | 14,214 | — | — | ||||||||||||
| Restricted cash equivalents, net of current portion: |
||||||||||||||||
| Money market funds |
14,214 | 14,214 | — | — | ||||||||||||
|
|
|
|
|
|
|
|
|
|||||||||
| Total assets |
$ | 38,430 | $ | 38,430 | $ | — | $ | — | ||||||||
|
|
|
|
|
|
|
|
|
|||||||||
The carrying amounts of the Company’s accounts receivable, accounts payable and accrued and other liabilities approximate their fair values due to their short maturities.
The fair market value of the 2019 notes was approximately $881.1 million and $941.2 million as of December 31, 2014 and 2013, respectively. The carrying value of the 2019 notes was $925.0 million as of December 31, 2014 and 2013. The 2020 notes had a fair market value of approximately $792.8 million and $844.5 million as of December 31, 2014 and December 31, 2013, respectively, and a carrying amount of $930.0 million and $830.0 million as of December 31, 2014 and 2013, respectively. The fair value of the 2019 notes and the 2020 notes was considered a Level 2 measurement as the value was determined using observable market inputs, such as current interest rates as well as prices observable from less active markets.
84
Table of Contents
NOTE 13—FACILITY FIRE
On March 18, 2014, a fire occurred at a facility leased by the company in Lindon, Utah. This facility contained the Company’s primary inventory warehouse and call center operations. For the year ended December 31, 2014, the Company recognized probable insurance recoveries of $8.2 million related to the fire damage, offset by gross expenses of $7.8 million. The probable insurance recoveries of $0.5 million, in excess of the gross expenses, are included in other income on the audited consolidated statement of operations. Of the $8.2 million in probable insurance recoveries, $2.8 million were received by the Company prior to December 31, 2014. The expenses associated with the fire primarily related to impairment of damaged assets and recovery costs to maintain business continuity. The $5.4 million of probable insurance recoveries not yet received from the Company’s insurance provider are included in prepaid expenses and other current assets in the accompanying audited consolidated balance sheet at December 31, 2014.
NOTE 14—INCOME TAXES
APX Group files a consolidated federal income tax return with its wholly-owned subsidiaries.
For tax purposes, the Merger was treated as a stock acquisition. As a result, assets and liabilities were not adjusted to fair value for tax purposes. Goodwill resulting from the transaction is not deductible for tax purposes. For tax purposes, acquisition costs are divided into three categories; deductible costs, amortizable costs, and capitalized costs. Acquisition costs are allocated among the categories based on the nature and timing of the incurred cost. Deductible costs are deducted in the period incurred. Amortizable costs are capitalized and amortized over a period of 15 years. Capitalized costs are capitalized to the cost of the stock and are not amortized.
Income tax provision (benefit) consisted of the following (in thousands):
| Successor | Predecessor | |||||||||||||||||
| Year ended December 31, 2014 |
Year ended December 31, 2013 |
Period from November 17, through December 31, 2012 |
Period from January 1, through November 16, 2012 |
|||||||||||||||
| Current income tax: |
||||||||||||||||||
| Federal |
$ | — | $ | (579 | ) | $ | — | $ | 2,635 | |||||||||
| State |
779 | (1,351 | ) | 56 | 837 | |||||||||||||
| Foreign |
— | (145 | ) | 28 | 276 | |||||||||||||
|
|
|
|
|
|
|
|
|
|||||||||||
| Total |
779 | (2,075 | ) | 84 | 3,748 | |||||||||||||
| Deferred income tax: |
||||||||||||||||||
| Federal |
(925 | ) | 8,614 | (9,489 | ) | — | ||||||||||||
| State |
(181 | ) | (1,938 | ) | (1,788 | ) | — | |||||||||||
| Foreign |
841 | (1,009 | ) | 290 | 1,175 | |||||||||||||
|
|
|
|
|
|
|
|
|
|||||||||||
| Total |
(265 | ) | 5,667 | (10,987 | ) | 1,175 | ||||||||||||
|
|
|
|
|
|
|
|
|
|||||||||||
| Provision (benefit) for income taxes |
$ | 514 | $ | 3,592 | $ | (10,903 | ) | $ | 4,923 | |||||||||
|
|
|
|
|
|
|
|
|
|||||||||||
The following reconciles the tax expense computed at the statutory federal rate and the Company’s tax (benefit) expense (in thousands):
|
|
||||||||||||||||||
| Successor | Predecessor | |||||||||||||||||
| Year ended December 31, 2014 |
Year ended December 31, 2013 |
Period from November 17, through December 31, 2012 |
Period from January 1, through November 16, 2012 |
|||||||||||||||
| Computed expected tax expense |
$ | (81,107 | ) | $ | (41,113 | ) | $ | (13,941 | ) | $ | (50,970 | ) | ||||||
| State income taxes, net of federal tax effect |
395 | (2,171 | ) | (1,143 | ) | 555 | ||||||||||||
| Foreign income taxes |
1,645 | 136 | (69 | ) | 610 | |||||||||||||
| Permanent differences |
2,261 | 1,215 | 534 | 4,820 | ||||||||||||||
| Non-deductible acquisition costs |
— | — | 3,716 | 2,896 | ||||||||||||||
| Intercompany elimination |
— | — | — | 2,843 | ||||||||||||||
| Change in valuation allowance |
77,320 | 45,525 | — | 44,169 | ||||||||||||||
|
|
|
|
|
|
|
|
|
|||||||||||
| Provision for income taxes |
$ | 514 | $ | 3,592 | $ | (10,903 | ) | $ | 4,923 | |||||||||
|
|
|
|
|
|
|
|
|
|||||||||||
85
Table of Contents
The tax effects of temporary differences that give rise to significant portions of the deferred tax assets and liabilities were as follows (in thousands):
| December 31, | ||||||||
| 2014 | 2013 | |||||||
| Gross deferred tax assets: |
||||||||
| Net operating loss carryforwards |
$ | 544,793 | $ | 430,327 | ||||
| Accrued expenses and allowances |
9,474 | 35,435 | ||||||
| Inventory reserves |
4,156 | 2,398 | ||||||
| Purcahsed intangibles |
4,579 | — | ||||||
| Alternative minimum tax credit and research and development credit |
41 | — | ||||||
| Deferred subscriber income |
7,433 | 835 | ||||||
| Valuation allowance |
(139,585 | ) | (48,685 | ) | ||||
|
|
|
|
|
|||||
| 430,891 | 420,310 | |||||||
| Gross deferred tax liabilities: |
||||||||
| Deferred subscriber contract costs |
(437,595 | ) | (394,448 | ) | ||||
| Purchased intangibles |
— | (29,128 | ) | |||||
| Property and equipment |
(1,715 | ) | (4,261 | ) | ||||
| Prepaid expenses |
(644 | ) | (1,687 | ) | ||||
|
|
|
|
|
|||||
| (439,954 | ) | (429,524 | ) | |||||
|
|
|
|
|
|||||
| Net deferred tax liabilities |
$ | (9,063 | ) | $ | (9,214 | ) | ||
|
|
|
|
|
|||||
The long-term portion of the net deferred tax liability was approximately $9,027,000 and $9,214,000 at December 31, 2014 and 2013, respectively. The current portion of the net deferred tax liability was approximately $36,000 and $0 at December 31, 2014 and 2013, respectively, and is included in accrued expenses and other liabilities on the Company’s Consolidated Balance Sheet as of December 31, 2014.
The Company had net operating loss carryforwards as follows (in thousands):
| December 31, | ||||||||
| 2014 | 2013 | |||||||
| Net operating loss carryforwards: |
||||||||
| United States |
$ | 1,355,632 | $ | 1,021,238 | ||||
| State |
1,301,462 | 967,155 | ||||||
| Canada |
30,688 | 35,689 | ||||||
| New Zealand |
4,203 | 1,388 | ||||||
United States (“U.S.”) and state net operating loss carryforwards will begin to expire in 2026, if not used. Included in both the U.S. and state net operating loss carryforwards are approximately $11.5 million at both December 31, 2014 and 2013 of net operating loss carryforwards for which a benefit will be recorded in Additional Paid in Capital when realized. The Company had U.S. R&D credits of approximately $41,000 at December 31, 2014, and no U.S. R&D credits at December 31, 2013, which begin to expire in 2030.
Realization of the Company’s net operating loss carryforwards and tax credits is dependent on generating sufficient taxable income prior to their expiration. The Company has determined that there is an IRC Section 382 limitation with respect to the carryforward items.
The Company has considered and weighed the available evidence, both positive and negative, to determine whether it is more-likely-than-not that some portion, or all, of the deferred tax assets will not be realized.
Based on available information, management does not believe it is more likely than not that its deferred tax assets will be utilized. Accordingly, the Company has established a valuation allowance to the extent of and equal to the net deferred tax assets. The Company recorded a valuation allowance for U.S. deferred tax assets of approximately $139.4 million and $48.7 million at December 31, 2014 and 2013, respectively. In addition to the change in valuation allowance from operations, the valuation allowance changes include impact of acquisition and disposition related items.
86
Table of Contents
As of December 31, 2014, the Company’s income tax returns for the years ended December 31, 2008 through December 31, 2014, remain subject to examination by the Internal Revenue Service and state authorities.
NOTE 15—STOCK-BASED COMPENSATION
313 Incentive Units
The Company’s indirect parent, 313 Acquisition LLC (“313”), which is wholly owned by the Investors, has authorized the award of profits interests, representing the right to share a portion of the value appreciation on the initial capital contributions to 313 (“Incentive Units”). As of December 31, 2014, a total of 74,527,942 Incentive Units had been awarded to current and former members of senior management and a board member, of which 46,484,562 were issued to the Company’s Chief Executive Officer and President. The Incentive Units are subject to time-based and performance-based vesting conditions, with one-third subject to ratable time-based vesting over a five year period and two-thirds subject to the achievement of certain investment return thresholds by The Blackstone Group, L.P. and its affiliates (“Blackstone”). The Company anticipates making comparable equity incentive grants at 313 to other members of senior management and adopting other equity and cash-based incentive programs for other members of management from time to time. The fair value of stock-based awards is measured at the grant date and is recognized as expense over the employee’s requisite service period. The grant date fair value was determined using a Monte Carlo simulation valuation approach with the following assumptions: expected volatility of 55% to 65%; expected exercise term from 4 to 5 years; and risk-free rate of 0.62% to 1.18%.
A summary of the Incentive Unit activity for the years ended December 31, 2014 and 2013 is presented below:
| Incentive Units | Weighted Average Exercise Price Per Share |
Weighted Average Remaining Contractual Life (Years) |
Aggregate Intrinsic Value |
|||||||||||||
| (in thousands) | ||||||||||||||||
| Outstanding, December 31, 2012 |
46,484,562 | 1.00 | ||||||||||||||
| Granted |
23,175,000 | 1.00 | ||||||||||||||
| Forfeited |
(1,200,000 | ) | 1.00 | |||||||||||||
| Exercised |
— | — | ||||||||||||||
|
|
|
|||||||||||||||
| Outstanding, December 31, 2013 |
68,459,562 | 1.00 | 9.12 | $ | 20,537,869 | |||||||||||
| Granted |
7,375,000 | 1.30 | ||||||||||||||
| Forfeited |
(1,306,620 | ) | 1.00 | |||||||||||||
| Exercised |
— | — | ||||||||||||||
|
|
|
|||||||||||||||
| Outstanding, December 31, 2014 |
74,527,942 | 1.03 | 8.19 | $ | 20,145,882 | |||||||||||
|
|
|
|||||||||||||||
| Unvested shares expected to vest after December 31, 2014 |
65,253,593 | 1.03 | 8.20 | $ | 17,464,128 | |||||||||||
| Exercisable at December 31, 2014 |
9,274,349 | 1.01 | 8.12 | $ | 2,681,754 | |||||||||||
As of December 31, 2014, there was $5.3 million of unrecognized compensation expense related to outstanding Incentive Units, which will be recognized over a weighted-average period of 3.0 years. As of December 31, 2014 and 2013, the weighted average grant date fair value of the outstanding incentive units was $0.33 and $0.34, respectively.
Vivint Stock Appreciation Rights
The Company’s subsidiary, Vivint, has awarded Stock Appreciation Rights (“SARs”) to various levels of key employees. The purpose of the SARs is to attract and retain personnel and provide an opportunity to acquire an equity interest of Vivint. The SARs are subject to time-based and performance-based vesting conditions, with one-third subject to ratable time-based vesting over a five year period and two-thirds subject to the achievement of certain investment return thresholds by Blackstone. In connection with this plan, 6,696,660 SARs were outstanding as of December 31, 2014. In addition, 36,065,303 SARs have been set aside for funding incentive compensation pools pursuant to long-term incentive plans established by the Company.
The fair value of the Vivint awards is measured at the grant date and is recognized as expense over the employee’s requisite service period. The fair value is determined using a Black-Scholes option valuation model with the following assumptions: expected volatility varies from 55% to 60%, expected dividends of 0%; expected exercise term between 6.01 and 6.50 years; and risk-free rates between 1.72% and 1.77%. Due to the lack of historical exercise data, the Company used the simplified method in determining the estimated exercise term, for all Vivint awards.
87
Table of Contents
A summary of the SAR activity for the years ended December 31, 2014 and 2013 is presented below:
| Stock Appreciation Rights |
Weighted Average Exercise Price Per Share |
Weighted Average Remaining Contractual Life (Years) |
Aggregate Intrinsic Value |
|||||||||||||
| (in thousands) | ||||||||||||||||
| Outstanding, December 31, 2012 |
— | $ | — | |||||||||||||
| Granted |
8,262,500 | 1.00 | ||||||||||||||
| Forfeited |
(356,250 | ) | 1.00 | |||||||||||||
| Exercised |
— | — | ||||||||||||||
|
|
|
|||||||||||||||
| Outstanding, December 31, 2013 |
7,906,250 | 1.00 | 9.55 | $ | 2,371,875 | |||||||||||
| Granted |
1,290,000 | 1.30 | ||||||||||||||
| Forfeited |
(2,499,590 | ) | 1.04 | |||||||||||||
| Exercised |
— | — | ||||||||||||||
|
|
|
|||||||||||||||
| Outstanding, December 31, 2014 |
6,696,660 | 1.04 | 8.62 | $ | 1,734,748 | |||||||||||
|
|
|
|||||||||||||||
| Unvested shares expected to vest after December 31, 2014 |
5,950,906 | 1.04 | 8.62 | $ | 1,523,276 | |||||||||||
| Exercisable at December 31, 2014 |
745,754 | 1.02 | 8.56 | $ | 211,472 | |||||||||||
As of December 31, 2014, there was $0.6 million of unrecognized compensation expense related to outstanding Vivint awards, which will be recognized over a weighted-average period of 3.2 years. As of December 31, 2014 and 2013, the weighted average grant date fair value of the outstanding SARs was $0.44 and $0.42, respectively.
Wireless Stock Appreciation Rights
The Company’s subsidiary, Vivint Wireless, has awarded SARs to various key employees. The purpose of the SARs is to attract and retain personnel and provide an opportunity to acquire an equity interest of Vivint Wireless. The SARs are subject to a five year time-based ratable vesting period. In connection with this plan, 70,000 SARs were outstanding as of December 31, 2014. The Company anticipates making similar grants from time to time.
The fair value of the Vivint Wireless awards is measured at the grant date and is recognized as expense over the employee’s requisite service period. The fair value is determined using a Black-Scholes option valuation model with the following assumptions: expected volatility of 65%, expected dividends of 0%; expected exercise term of 6.50 years; and risk-free rate of 1.51%. Due to the lack of historical exercise data, the Company used the simplified method in determining the estimated exercise term, for all Vivint Wireless awards.
A summary of the SAR activity for the year ended December 31, 2014 and 2013 is presented below:
| Stock Appreciation Rights |
Weighted Average Exercise Price Per Share |
Weighted Average Remaining Contractual Life (Years) |
Aggregate Intrinsic Value |
|||||||||||||
| (in thousands) | ||||||||||||||||
| Outstanding, December 31, 2012 |
— | $ | — | |||||||||||||
| Granted |
70,000 | 5.00 | ||||||||||||||
| Forfeited |
— | — | ||||||||||||||
| Exercised |
— | — | ||||||||||||||
|
|
|
|||||||||||||||
| Outstanding, December 31, 2013 |
70,000 | 5.00 | 9.42 | — | ||||||||||||
| Granted |
— | — | ||||||||||||||
| Forfeited |
— | — | ||||||||||||||
| Exercised |
— | — | ||||||||||||||
|
|
|
|||||||||||||||
| Outstanding, December 31, 2014 |
70,000 | 5.00 | 8.41 | — | ||||||||||||
|
|
|
|||||||||||||||
| Unvested shares expected to vest after December 31, 2014 |
56,000 | 5.00 | 8.41 | — | ||||||||||||
| Exercisable at December 31, 2014 |
14,000 | 5.00 | 8.41 | — | ||||||||||||
As of December 31, 2014, there was $0.1 million of unrecognized compensation expense related to all Vivint Wireless awards, which will be recognized over a weighted-average period of 3.4 years. As of December 31, 2014 and 2013, the weighted average grant date fair value of the outstanding SARs was $2.30.
88
Table of Contents
Stock-based compensation expense in connection with all stock-based awards for the years ended December 31, 2014 and 2013, the Successor Period ended December 31, 2012 and the Predecessor Period ended November 16, 2012 is presented by entity as follows (in thousands):
| Successor | Predecessor | |||||||||||||||||
| Year ended December 31, 2014 |
Year ended December 31, 2013 |
Period from November 17, through December 31, 2012 |
Period from January 1, through November 16, 2012 |
|||||||||||||||
| Operating expenses |
$ | 63 | $ | 62 | $ | — | $ | 14 | ||||||||||
| Selling expenses |
185 | 158 | — | 36 | ||||||||||||||
| General and administrative expenses |
1,687 | 1,736 | — | 2,321 | ||||||||||||||
|
|
|
|
|
|
|
|
|
|||||||||||
| Total stock-based compensation |
$ | 1,935 | $ | 1,956 | $ | — | $ | 2,371 | ||||||||||
|
|
|
|
|
|
|
|
|
|||||||||||
NOTE 16—COMMITMENTS AND CONTINGENCIES
Indemnification—Subject to certain limitations, the Company is obligated to indemnify its current and former directors, officers and employees with respect to certain litigation matters and investigations that arise in connection with their service to the Company. These obligations arise under the terms of its certificate of incorporation, its bylaws, applicable contracts, and Delaware and California law. The obligation to indemnify generally means that the Company is required to pay or reimburse the individuals’ reasonable legal expenses and possibly damages and other liabilities incurred in connection with these matters.
Legal—The Company is named from time to time as a party to lawsuits arising in the ordinary course of business related to its sales, marketing, the provision of its services and equipment claims. Actions filed against the Company include commercial, intellectual property, customer, and labor and employment related claims, including complaints of alleged wrongful termination and potential class action lawsuits regarding alleged violations of federal and state wage and hour and other laws. In general, litigation can be expensive and disruptive to normal business operations. Moreover, the results of legal proceedings are difficult to predict, and the costs incurred in litigation can be substantial. The Company believes the amounts provided in its financial statements are adequate in light of the probable and estimated liabilities. Factors that the Company considers in the determination of the likelihood of a loss and the estimate of the range of that loss in respect of legal matters include the merits of a particular matter, the nature of the matter, the length of time the matter has been pending, the procedural posture of the matter, how the Company intends to defend the matter, the likelihood of settling the matter and the anticipated range of a possible settlement. Because such matters are subject to many uncertainties, the ultimate outcomes are not predictable and there can be no assurances that the actual amounts required to satisfy alleged liabilities from the matters described above will not exceed the amounts reflected in the Company’s financial statements or that the matters will not have a material adverse effect on the Company’s results of operations, financial condition or cash flows.
The Company regularly reviews outstanding legal claims and actions to determine if reserves for expected negative outcomes of such claims and actions are necessary. The Company had reserves for all such matters of approximately $9.7 million and $9.3 million as of December 31, 2014 and 2013, respectively. In conjunction with one of the settlements, the Company is obligated to pay certain future royalties, based on sales of future products.
Operating Leases—The Company leases office, warehouse space, certain equipment, software and an aircraft under operating leases with related and unrelated parties expiring in various years through 2028. The leases require the Company to pay additional rent for increases in operating expenses and real estate taxes and contain renewal options. The Company entered into a lease agreement for its corporate headquarters in 2009. In July 2012, the Company entered into a lease for additional office space for an initial lease term of 15 years. In August 2014, the Company entered into a lease for additional office space for an initial lease term of 11 years.
Total rent expense for operating leases was approximately $11.0 million and $6.1 million for the years ended December 31, 2014 and 2013, respectively, $0.7 million for the Successor Period ended December 31, 2012 and $4.6 million for the Predecessor Period ended November 16, 2012.
Capital Leases—The Company also leases certain equipment under capital leases with expiration dates through August 2016. On an ongoing basis, the Company enters into vehicle lease agreements under a Fleet Lease Agreement. The lease agreements are typically 36 month leases for each vehicle and the average remaining life for the fleet is 28 months as of December 31, 2014. As of December 31, 2014 and 2013, the capital lease obligation balance was $16.2 million and $10.5 million, respectively.
89
Table of Contents
As of December 31, 2014, future minimum lease payments were as follows (in thousands):
| Operating | Capital | Total | ||||||||||
| 2015 |
$ | 11,536 | $ | 6,313 | $ | 17,849 | ||||||
| 2016 |
11,516 | 5,411 | 16,927 | |||||||||
| 2017 |
11,503 | 5,140 | 16,643 | |||||||||
| 2018 |
11,609 | 796 | 12,405 | |||||||||
| 2019 |
11,216 | — | 11,216 | |||||||||
| Thereafter |
68,194 | — | 68,194 | |||||||||
|
|
|
|
|
|
|
|||||||
| 125,574 | 17,660 | 143,234 | ||||||||||
| Amounts representing interest |
— | (1,456 | ) | (1,456 | ) | |||||||
|
|
|
|
|
|
|
|||||||
| Total lease payments |
$ | 125,574 | $ | 16,204 | $ | 141,778 | ||||||
|
|
|
|
|
|
|
|||||||
NOTE 17—RELATED PARTY TRANSACTIONS
On September 3, 2014, APX paid a dividend in the amount of $50.0 million to Holdings, its sole stockholder, which in turn paid a dividend in the amount of $50.0 million to its stockholders.
The Company incurred additional expenses during the years ended December 31, 2014 and 2013, the Successor Period ended December 31, 2012 and the Predecessor Period ended November 16, 2012 of approximately $3.1 million, $3.1 million, $0.1 million and $1.2 million, respectively, for other related-party transactions including contributions to the charitable organization Vivint Gives Back, legal fees, and services. Accrued expenses and other current liabilities at December 31, 2014 and 2013, included a payable to Vivint Gives Back for $1.3 million and $1.1 million, respectively. In addition, transactions with Solar, as described in Note 7, are considered to be related-party transactions.
On November 16, 2012, the Company entered into a support and services agreement with Blackstone Management Partners L.L.C. (“BMP”), an affiliate of Blackstone. Under the support and services agreement, the Company paid BMP, at the closing of the Merger, a transaction fee of approximately $20 million as consideration for BMP’s performance of due diligence investigations, financial and structural analysis, providing corporate strategy and other advice and negotiation assistance in connection with the Merger. In addition, the Company engaged BMP to provide monitoring, advisory and consulting services on an ongoing basis. In consideration for these services, the Company agreed to pay an annual monitoring fee equal to the greater of (i) a minimum base fee of $2.7 million subject to adjustments if the Company engages in a business combination or disposition that is deemed significant and (ii) the amount of the monitoring fee paid in respect of the immediately preceding fiscal year, without regard to any post-fiscal year “true-up” adjustments as determined by the agreement. The Company incurred expenses of approximately $3.2 million and $2.9 million during the years ended December 31, 2014 and 2013, respectively, in connection with this agreement. There were no expenses incurred during the Successor Period ended December 31, 2012 or the Predecessor Period ended November 16, 2012 in connection with this agreement.
Under the support and services agreement, the Company also engaged BMP to arrange for Blackstone’s portfolio operations group to provide support services customarily provided by Blackstone’s portfolio operations group to Blackstone’s private equity portfolio companies of a type and amount determined by such portfolio services group to be warranted and appropriate. BMP will invoice the Company for such services based on the time spent by the relevant personnel providing such services during the applicable period but in no event shall the Company be obligated to pay more than $1.5 million during any calendar year.
Long-term investments and other assets, includes amounts due for non-interest bearing advances made to employees that are expected to be repaid in excess of one year. Amounts due from employees as of both December 31, 2014 and 2013, amounted to approximately $0.3 million. As of December 31, 2014 and 2013, this amount was fully reserved.
Prepaid expenses and other current assets at December 31, 2014 and 2013 included a receivable for $0.3 million from certain members of management in regards to their personal use of the corporate jet.
90
Table of Contents
The Company incurred expenses of approximately $31,000 and $1.4 million for use of a corporate jet owned partially by stockholders of the Company during the Successor Period ended December 31, 2012 and the Predecessor Period ended November 16, 2012, respectively. The stockholders of the Company sold their share of the corporate jet during the first quarter of fiscal year 2013 and as such, no related-party expenses were incurred during the years ended December 31, 2014 or 2013.
During 2009, the Company acquired certain customer lead generation know-how and technology from a company owned by a stockholder and agreed to pay the seller monthly amounts ranging from $40,000 to $50,000 through January 2013. During the Predecessor Period ended November 16, 2012, the Company paid $0.5 million, of which $0.1 million was paid as part of the Merger and completely satisfied the obligation, under this agreement.
The Company recognized revenue of approximately $6.6 million for providing monitoring services for contracts owned by stockholders and employees of the Company during the Predecessor Period ended November 16, 2012.
Transactions involving related parties cannot be presumed to be carried out at an arm’s-length basis.
NOTE 18—SEGMENT REPORTING AND BUSINESS CONCENTRATIONS
Prior to the 2GIG Sale on April 1, 2013, the Company conducted business through two operating segments, Vivint and 2GIG. These segments were managed and evaluated separately by management due to the differences in their products and services. The primary source of revenue for the Vivint segment is generated through monitoring services provided to subscribers, in accordance with their subscriber contracts. The primary source of revenue for the 2GIG segment was through the sale of electronic security and automation systems to security dealers and distributors, including Vivint. Fees and expenses charged by 2GIG to Vivint, related to intercompany purchases, were eliminated in consolidation.
91
Table of Contents
For the year ended December 31, 2014, the Company conducted business through one operating segment, Vivint. The following table presents a summary of revenue, costs and expenses and assets as of December 31, 2013 (in thousands):
| Vivint | 2GIG | Eliminations | Consolidated Total |
|||||||||||||
| Revenues |
$ | 483,401 | $ | 60,220 | $ | (42,713 | ) | $ | 500,908 | |||||||
| All other costs and expenses |
536,502 | 52,200 | (32,914 | ) | 555,788 | |||||||||||
|
|
|
|
|
|
|
|
|
|||||||||
| (Loss) income from operations |
$ | (53,101 | ) | $ | 8,020 | $ | (9,799 | ) | $ | (54,880 | ) | |||||
|
|
|
|
|
|
|
|
|
|||||||||
| Intangible assets, including goodwill |
$ | 1,677,032 | $ | — | $ | — | $ | 1,677,032 | ||||||||
|
|
|
|
|
|
|
|
|
|||||||||
| Total assets |
$ | 2,424,434 | $ | — | $ | — | $ | 2,424,434 | ||||||||
|
|
|
|
|
|
|
|
|
|||||||||
The following table presents a summary of revenue, costs and expenses and assets as of December 31, 2012 and for the Successor Period from November 17, 2012 through December 31, 2012 (in thousands):
| Vivint | 2GIG | Eliminations | Consolidated Total |
|||||||||||||
| Revenues |
$ | 50,791 | $ | 12,372 | $ | (5,557 | ) | $ | 57,606 | |||||||
| Transaction related costs |
28,118 | 3,767 | — | 31,885 | ||||||||||||
| All other costs and expenses |
46,241 | 12,712 | (5,039 | ) | 53,914 | |||||||||||
|
|
|
|
|
|
|
|
|
|||||||||
| Loss from operations |
$ | (23,568 | ) | $ | (4,107 | ) | $ | (518 | ) | $ | (28,193 | ) | ||||
|
|
|
|
|
|
|
|
|
|||||||||
| Intangible assets, including goodwill |
$ | 1,840,065 | $ | 85,933 | $ | 3,663 | $ | 1,929,661 | ||||||||
|
|
|
|
|
|
|
|
|
|||||||||
| Total assets |
$ | 2,050,529 | $ | 115,881 | $ | (11,062 | ) | $ | 2,155,348 | |||||||
|
|
|
|
|
|
|
|
|
|||||||||
The following table presents a summary of revenue and costs and expenses for the Predecessor Period from January 1, 2012 through November 16, 2012 (in thousands):
| Vivint | 2GIG | Eliminations | Consolidated Total |
|||||||||||||
| Revenues |
$ | 346,270 | $ | 112,136 | $ | (60,836 | ) | $ | 397,570 | |||||||
| Transaction related costs |
22,219 | 1,242 | — | 23,461 | ||||||||||||
| All other costs and expenses |
365,300 | 104,276 | (52,474 | ) | 417,102 | |||||||||||
|
|
|
|
|
|
|
|
|
|||||||||
| (Loss) income from operations |
$ | (41,249 | ) | $ | 6,618 | $ | (8,362 | ) | $ | (42,993 | ) | |||||
|
|
|
|
|
|
|
|
|
|||||||||
The Company primarily operates in three geographic regions: United States, Canada and New Zealand. The operations in New Zealand are considered immaterial and reported in conjunction with the United States. Revenues and long-lived assets by geographic region were as follows (in thousands):
| United States | Canada | Total | ||||||||||
| As of and for |
||||||||||||
| Successor Year ended December 31, 2014 |
||||||||||||
| Revenue from external customers |
$ | 529,521 | $ | 34,156 | $ | 563,677 | ||||||
| Property and equipment, net |
62,368 | 422 | 62,790 | |||||||||
| Successor Year ended December 31, 2013 |
||||||||||||
| Revenue from external customers |
$ | 474,344 | $ | 26,564 | $ | 500,908 | ||||||
| Property and equipment, net |
35,220 | 598 | 35,818 | |||||||||
| Successor Period from November 17 through December 31, 2012 |
||||||||||||
| Revenue from external customers |
$ | 52,196 | $ | 5,410 | $ | 57,606 | ||||||
| Property and equipment, net |
29,415 | 791 | 30,206 | |||||||||
| Predecessor Period from January 1, through November 16, 2012 |
||||||||||||
| Revenue from external customers |
$ | 363,875 | $ | 33,695 | $ | 397,570 | ||||||
NOTE 19—EMPLOYEE BENEFIT PLAN
Beginning March 1, 2010, Vivint and 2GIG offered eligible employees the opportunity to defer a percentage of their earned income into company-sponsored 401(k) plans. 2GIG made matching contributions to the plan in the amount of $36,000, $25,000 and $79,000 for the year ended December 31, 2013, the Successor Period ended December 31, 2012 and the Predecessor Period ended November 16, 2012, respectively.
92
Table of Contents
NOTE 20—GUARANTOR AND NON-GUARANTOR SUPPLEMENTAL FINANCIAL INFORMATION
The 2019 notes and the 2020 notes were issued by APX. The 2019 notes and the 2020 notes are fully and unconditionally guaranteed, jointly and severally by Holdings and each of APX’s existing and future material wholly-owned U.S. restricted subsidiaries. APX’s existing and future foreign subsidiaries are not expected to guarantee the notes.
Presented below is the condensed consolidating financial information of APX, subsidiaries of APX that are guarantors (the “Guarantor Subsidiaries”), and APX’s subsidiaries that are not guarantors (the “Non-Guarantor Subsidiaries”) as of and for the years ended December 31, 2014 and 2013, the Successor Period ended December 31, 2012 and the Predecessor Period ended November 16, 2012. The audited consolidating financial information reflects the investments of APX in the Guarantor Subsidiaries and the Non-Guarantor Subsidiaries using the equity method of accounting.
93
Table of Contents
Condensed Consolidating Balance Sheet
December 31, 2014 (Successor)
(In thousands)
| APX | Guarantor | Non-Guarantor | ||||||||||||||||||||||
| Parent | Group, Inc. | Subsidiaries | Subsidiaries | Eliminations | Consolidated | |||||||||||||||||||
| Assets |
||||||||||||||||||||||||
| Current assets |
$ | — | $ | 9,435 | $ | 109,996 | $ | 6,626 | $ | (40,686 | ) | $ | 85,371 | |||||||||||
| Property and equipment, net |
— | — | 62,271 | 519 | — | 62,790 | ||||||||||||||||||
| Subscriber acquisition costs, net |
— | — | 500,916 | 47,157 | — | 548,073 | ||||||||||||||||||
| Deferred financing costs, net |
— | 52,158 | — | — | — | 52,158 | ||||||||||||||||||
| Investment in subsidiaries |
224,486 | 2,057,857 | — | — | (2,282,343 | ) | — | |||||||||||||||||
| Intercompany receivable |
— | — | 34,000 | — | (34,000 | ) | — | |||||||||||||||||
| Intangible assets, net |
— | — | 645,558 | 57,668 | — | 703,226 | ||||||||||||||||||
| Goodwill |
— | — | 811,947 | 29,575 | — | 841,522 | ||||||||||||||||||
| Long-term investments and other assets |
— | 184 | 10,502 | 31 | (184 | ) | 10,533 | |||||||||||||||||
|
|
|
|
|
|
|
|
|
|
|
|
|
|||||||||||||
| Total Assets |
$ | 224,486 | $ | 2,119,634 | $ | 2,175,190 | $ | 141,576 | $ | (2,357,213 | ) | $ | 2,303,673 | |||||||||||
|
|
|
|
|
|
|
|
|
|
|
|
|
|||||||||||||
| Liabilities and Stockholders’ Equity |
||||||||||||||||||||||||
| Current liabilities |
$ | — | $ | 11,993 | $ | 119,285 | $ | 46,348 | $ | (40,686 | ) | $ | 136,940 | |||||||||||
| Intercompany payable |
— | — | — | 34,000 | (34,000 | ) | — | |||||||||||||||||
| Notes payable and revolving line of credit, net of current portion |
— | 1,883,155 | — | — | — | 1,883,155 | ||||||||||||||||||
| Capital lease obligations, net of current portion |
— | — | 10,646 | 9 | — | 10,655 | ||||||||||||||||||
| Deferred revenue, net of current portion |
— | — | 29,438 | 3,066 | — | 32,504 | ||||||||||||||||||
| Other long-term obligations |
— | — | 6,497 | 409 | — | 6,906 | ||||||||||||||||||
| Deferred income tax liability |
— | — | 107 | 9,104 | (184 | ) | 9,027 | |||||||||||||||||
| Total equity |
224,486 | 224,486 | 2,009,217 | 48,640 | (2,282,343 | ) | 224,486 | |||||||||||||||||
|
|
|
|
|
|
|
|
|
|
|
|
|
|||||||||||||
| Total liabilities and stockholders’ equity |
$ | 224,486 | $ | 2,119,634 | $ | 2,175,190 | $ | 141,576 | $ | (2,357,213 | ) | $ | 2,303,673 | |||||||||||
|
|
|
|
|
|
|
|
|
|
|
|
|
|||||||||||||
94
Table of Contents
Condensed Consolidating Balance Sheet
December 31, 2013 (Successor)
(In thousands)
| Parent | APX Group, Inc. |
Guarantor Subsidiaries |
Non-Guarantor Subsidiaries |
Eliminations | Consolidated | |||||||||||||||||||
| Assets |
||||||||||||||||||||||||
| Current assets |
$ | — | $ | 249,209 | $ | 89,768 | $ | 7,163 | $ | (24,137 | ) | $ | 322,003 | |||||||||||
| Property and equipment, net |
— | — | 35,218 | 600 | — | 35,818 | ||||||||||||||||||
| Subscriber acquisition costs, net |
— | — | 262,064 | 26,252 | — | 288,316 | ||||||||||||||||||
| Deferred financing costs, net |
— | 59,375 | — | — | — | 59,375 | ||||||||||||||||||
| Investment in subsidiaries |
490,243 | 1,953,465 | — | — | (2,443,708 | ) | — | |||||||||||||||||
| Intercompany receivable |
— | — | 44,658 | — | (44,658 | ) | — | |||||||||||||||||
| Intangible assets, net |
— | — | 764,296 | 76,418 | — | 840,714 | ||||||||||||||||||
| Goodwill |
— | — | 804,041 | 32,277 | — | 836,318 | ||||||||||||||||||
| Restricted cash |
— | — | 14,214 | — | — | 14,214 | ||||||||||||||||||
| Long-term investments and other assets |
— | (302 | ) | 27,954 | 24 | — | 27,676 | |||||||||||||||||
|
|
|
|
|
|
|
|
|
|
|
|
|
|||||||||||||
| Total Assets |
$ | 490,243 | $ | 2,261,747 | $ | 2,042,213 | $ | 142,734 | $ | (2,512,503 | ) | $ | 2,424,434 | |||||||||||
|
|
|
|
|
|
|
|
|
|
|
|
|
|||||||||||||
| Liabilities and Stockholders’ Equity |
||||||||||||||||||||||||
| Current liabilities |
$ | — | $ | 9,561 | $ | 117,544 | $ | 31,254 | $ | (24,137 | ) | $ | 134,222 | |||||||||||
| Intercompany payable |
— | — | — | 44,658 | (44,658 | ) | — | |||||||||||||||||
| Notes payable and revolving line of credit, net of current portion |
— | 1,762,049 | — | — | — | 1,762,049 | ||||||||||||||||||
| Capital lease obligations, net of current portion |
— | — | 6,268 | — | — | 6,268 | ||||||||||||||||||
| Deferred revenue, net of current portion |
— | — | 16,676 | 1,857 | — | 18,533 | ||||||||||||||||||
| Other long-term obligations |
— | — | 3,559 | 346 | — | 3,905 | ||||||||||||||||||
| Deferred income tax liability |
— | (106 | ) | 289 | 9,031 | — | 9,214 | |||||||||||||||||
| Total equity |
490,243 | 490,243 | 1,897,877 | 55,588 | (2,443,708 | ) | 490,243 | |||||||||||||||||
|
|
|
|
|
|
|
|
|
|
|
|
|
|||||||||||||
| Total liabilities and stockholders’ equity |
$ | 490,243 | $ | 2,261,747 | $ | 2,042,213 | $ | 142,734 | $ | (2,512,503 | ) | $ | 2,424,434 | |||||||||||
|
|
|
|
|
|
|
|
|
|
|
|
|
|||||||||||||
95
Table of Contents
Condensed Consolidating Statements of Operations and Comprehensive Loss
For the Year Ended December 31, 2014 (Successor)
(In thousands)
| Parent | APX Group, Inc. |
Guarantor Subsidiaries |
Non-Guarantor Subsidiaries |
Eliminations | Consolidated | |||||||||||||||||||
| Revenues |
$ | — | $ | — | $ | 530,888 | $ | 35,911 | $ | (3,122 | ) | $ | 563,677 | |||||||||||
| Costs and expenses |
— | — | 623,124 | 37,544 | (3,122 | ) | 657,546 | |||||||||||||||||
|
|
|
|
|
|
|
|
|
|
|
|
|
|||||||||||||
| Loss from operations |
— | — | (92,236 | ) | (1,633 | ) | — | (93,869 | ) | |||||||||||||||
| Loss from subsidiaries |
(238,660 | ) | (93,850 | ) | — | — | 332,510 | — | ||||||||||||||||
| Other income (expense), net |
— | (145,917 | ) | 1,676 | (36 | ) | — | (144,277 | ) | |||||||||||||||
|
|
|
|
|
|
|
|
|
|
|
|
|
|||||||||||||
| Loss before income tax expenses |
(238,660 | ) | (239,767 | ) | (90,560 | ) | (1,669 | ) | 332,510 | (238,146 | ) | |||||||||||||
| Income tax expense (benefit) |
— | (1,107 | ) | 779 | 842 | — | 514 | |||||||||||||||||
|
|
|
|
|
|
|
|
|
|
|
|
|
|||||||||||||
| Net loss |
$ | (238,660 | ) | $ | (238,660 | ) | $ | (91,339 | ) | $ | (2,511 | ) | $ | 332,510 | $ | (238,660 | ) | |||||||
|
|
|
|
|
|
|
|
|
|
|
|
|
|||||||||||||
| Other comprehensive loss, net of tax effects: |
||||||||||||||||||||||||
| Net loss |
$ | (238,660 | ) | $ | (238,660 | ) | $ | (91,339 | ) | $ | (2,511 | ) | $ | 332,510 | $ | (238,660 | ) | |||||||
| Foreign currency translation adjustment |
— | (11,333 | ) | (6,895 | ) | (4,438 | ) | 11,333 | (11,333 | ) | ||||||||||||||
|
|
|
|
|
|
|
|
|
|
|
|
|
|||||||||||||
| Total other comprehensive loss |
— | (11,333 | ) | (6,895 | ) | (4,438 | ) | 11,333 | (11,333 | ) | ||||||||||||||
|
|
|
|
|
|
|
|
|
|
|
|
|
|||||||||||||
| Comprehensive loss |
$ | (238,660 | ) | $ | (249,993 | ) | $ | (98,234 | ) | $ | (6,949 | ) | $ | 343,843 | $ | (249,993 | ) | |||||||
|
|
|
|
|
|
|
|
|
|
|
|
|
|||||||||||||
96
Table of Contents
Condensed Consolidating Statements of Operations and Comprehensive Loss
For the Year Ended December 31, 2013 (Successor)
(In thousands)
| Parent | APX Group, Inc. |
Guarantor Subsidiaries |
Non-Guarantor Subsidiaries |
Eliminations | Consolidated | |||||||||||||||||||
| Revenues |
$ | — | $ | — | $ | 476,168 | $ | 27,790 | $ | (3,050 | ) | $ | 500,908 | |||||||||||
| Costs and expenses |
— | — | 527,403 | 31,435 | (3,050 | ) | 555,788 | |||||||||||||||||
|
|
|
|
|
|
|
|
|
|
|
|
|
|||||||||||||
| Loss from operations |
— | — | (51,235 | ) | (3,645 | ) | — | (54,880 | ) | |||||||||||||||
| Loss from subsidiaries |
(124,513 | ) | (57,752 | ) | — | — | 182,265 | — | ||||||||||||||||
| Other income (expense), net |
— | (66,867 | ) | 906 | (80 | ) | — | (66,041 | ) | |||||||||||||||
|
|
|
|
|
|
|
|
|
|
|
|
|
|||||||||||||
| Loss before income tax expenses |
(124,513 | ) | (124,619 | ) | (50,329 | ) | (3,725 | ) | 182,265 | (120,921 | ) | |||||||||||||
| Income tax expense (benefit) |
— | (106 | ) | 4,853 | (1,155 | ) | — | 3,592 | ||||||||||||||||
|
|
|
|
|
|
|
|
|
|
|
|
|
|||||||||||||
| Net loss |
$ | (124,513 | ) | $ | (124,513 | ) | $ | (55,182 | ) | $ | (2,570 | ) | $ | 182,265 | $ | (124,513 | ) | |||||||
|
|
|
|
|
|
|
|
|
|
|
|
|
|||||||||||||
| Other comprehensive loss, net of tax effects: |
||||||||||||||||||||||||
| Net loss |
$ | (124,513 | ) | $ | (124,513 | ) | $ | (55,182 | ) | $ | (2,570 | ) | $ | 182,265 | $ | (124,513 | ) | |||||||
| Foreign currency translation adjustment |
— | (8,558 | ) | (4,641 | ) | (3,917 | ) | 8,558 | (8,558 | ) | ||||||||||||||
|
|
|
|
|
|
|
|
|
|
|
|
|
|||||||||||||
| Total other comprehensive loss |
— | (8,558 | ) | (4,641 | ) | (3,917 | ) | 8,558 | (8,558 | ) | ||||||||||||||
|
|
|
|
|
|
|
|
|
|
|
|
|
|||||||||||||
| Comprehensive loss |
$ | (124,513 | ) | $ | (133,071 | ) | $ | (59,823 | ) | $ | (6,487 | ) | $ | 190,823 | $ | (133,071 | ) | |||||||
|
|
|
|
|
|
|
|
|
|
|
|
|
|||||||||||||
97
Table of Contents
Condensed Consolidating Statements of Operations and Comprehensive Loss
For the Period From November 17, 2012 to December 31, 2012 (Successor)
(In thousands)
| Parent | APX Group, Inc. |
Guarantor Subsidiaries |
Non-Guarantor Subsidiaries |
Eliminations | Consolidated | |||||||||||||||||||
| Revenues |
$ | — | $ | — | $ | 54,251 | $ | 3,412 | $ | (57 | ) | $ | 57,606 | |||||||||||
| Costs and expenses |
— | — | 83,477 | 2,379 | (57 | ) | 85,799 | |||||||||||||||||
|
|
|
|
|
|
|
|
|
|
|
|
|
|||||||||||||
| (Loss) income from operations |
— | — | (29,226 | ) | 1,033 | — | (28,193 | ) | ||||||||||||||||
| (Loss) income from subsidiaries |
(30,102 | ) | (17,549 | ) | — | — | 47,651 | — | ||||||||||||||||
| Other income (expense), net |
— | (12,553 | ) | (256 | ) | (3 | ) | — | (12,812 | ) | ||||||||||||||
|
|
|
|
|
|
|
|
|
|
|
|
|
|||||||||||||
| (Loss) income from continuing operations before income tax expense |
(30,102 | ) | (30,102 | ) | (29,482 | ) | 1,030 | 47,651 | (41,005 | ) | ||||||||||||||
| Income tax (benefit) expense |
— | — | (11,193 | ) | 290 | — | (10,903 | ) | ||||||||||||||||
|
|
|
|
|
|
|
|
|
|
|
|
|
|||||||||||||
| Net (loss) income |
$ | (30,102 | ) | $ | (30,102 | ) | $ | (18,289 | ) | $ | 740 | $ | 47,651 | $ | (30,102 | ) | ||||||||
|
|
|
|
|
|
|
|
|
|
|
|
|
|||||||||||||
| Other comprehensive (loss) income, net of tax effects: |
||||||||||||||||||||||||
| Net (loss) income before non-controlling interests |
$ | (30,102 | ) | $ | (30,102 | ) | $ | (18,289 | ) | $ | 740 | $ | 47,651 | $ | (30,102 | ) | ||||||||
| Foreign currency translation adjustment |
— | 928 | 444 | 484 | (928 | ) | 928 | |||||||||||||||||
|
|
|
|
|
|
|
|
|
|
|
|
|
|||||||||||||
| Comprehensive loss |
$ | (30,102 | ) | $ | (29,174 | ) | $ | (17,845 | ) | $ | 1,224 | $ | 46,723 | $ | (29,174 | ) | ||||||||
|
|
|
|
|
|
|
|
|
|
|
|
|
|||||||||||||
98
Table of Contents
Condensed Consolidating Statements of Operations and Comprehensive Loss
For the Period From January 1, 2012 to November 16, 2012 (Predecessor)
(In thousands)
| Parent | APX Group, Inc. |
Guarantor Subsidiaries |
Non-Guarantor Subsidiaries |
Eliminations | Consolidated | |||||||||||||||||||
| Revenues |
$ | — | $ | — | $ | 375,502 | $ | 23,431 | $ | (1,363 | ) | $ | 397,570 | |||||||||||
| Costs and expenses |
— | — | 413,378 | 28,548 | (1,363 | ) | 440,563 | |||||||||||||||||
|
|
|
|
|
|
|
|
|
|
|
|
|
|||||||||||||
| Loss from operations |
— | — | (37,876 | ) | (5,117 | ) | — | (42,993 | ) | |||||||||||||||
| Loss from subsidiaries |
— | (153,517 | ) | — | — | 153,517 | — | |||||||||||||||||
| Other expense |
— | — | (103,830 | ) | (2,851 | ) | — | (106,681 | ) | |||||||||||||||
|
|
|
|
|
|
|
|
|
|
|
|
|
|||||||||||||
| Loss from continuing operations before income tax expenses |
— | (153,517 | ) | (141,706 | ) | (7,968 | ) | 153,517 | (149,674 | ) | ||||||||||||||
| Income tax expense |
— | — | 3,500 | 1,423 | — | 4,923 | ||||||||||||||||||
|
|
|
|
|
|
|
|
|
|
|
|
|
|||||||||||||
| Loss from continuing operations |
— | (153,517 | ) | (145,206 | ) | (9,391 | ) | 153,517 | (154,597 | ) | ||||||||||||||
| Loss form discontinued operations |
— | — | (239 | ) | — | — | (239 | ) | ||||||||||||||||
|
|
|
|
|
|
|
|
|
|
|
|
|
|||||||||||||
| Net loss before non-controlling interests |
— | (153,517 | ) | (145,445 | ) | (9,391 | ) | 153,517 | (154,836 | ) | ||||||||||||||
| Net income (loss) attributable to non-controlling interests |
— | — | 6,781 | (8,100 | ) | — | (1,319 | ) | ||||||||||||||||
|
|
|
|
|
|
|
|
|
|
|
|
|
|||||||||||||
| Net loss |
$ | — | $ | (153,517 | ) | $ | (152,226 | ) | $ | (1,291 | ) | $ | 153,517 | $ | (153,517 | ) | ||||||||
|
|
|
|
|
|
|
|
|
|
|
|
|
|||||||||||||
| Other comprehensive income (loss), net of tax effects: |
||||||||||||||||||||||||
| Net loss before non-controlling interests |
$ | — | $ | (153,517 | ) | $ | (145,445 | ) | $ | (9,391 | ) | $ | 153,517 | $ | (154,836 | ) | ||||||||
| Change in fair value of interest rate swap agreement |
— | 318 | 318 | — | (318 | ) | 318 | |||||||||||||||||
| Foreign currency translation adjustment |
— | 708 | 708 | — | (708 | ) | 708 | |||||||||||||||||
|
|
|
|
|
|
|
|
|
|
|
|
|
|||||||||||||
| Comprehensive loss before non-controlling interests |
— | (152,491 | ) | (144,419 | ) | (9,391 | ) | 152,491 | (153,810 | ) | ||||||||||||||
| Comprehensive income (loss) attributable to non-controlling interests |
— | — | (6,781 | ) | 8,100 | — | 1,319 | |||||||||||||||||
|
|
|
|
|
|
|
|
|
|
|
|
|
|||||||||||||
| Comprehensive loss |
$ | — | $ | (152,491 | ) | $ | (151,200 | ) | $ | (1,291 | ) | $ | 152,491 | $ | (152,491 | ) | ||||||||
|
|
|
|
|
|
|
|
|
|
|
|
|
|||||||||||||
99
Table of Contents
Condensed Consolidating Statements of Cash Flows
For the Year ended December 31, 2014 (Successor)
(In thousands)
| Parent | APX Group, Inc. |
Guarantor Subsidiaries |
Non-Guarantor Subsidiaries |
Eliminations | Consolidated | |||||||||||||||||||
| Cash flows from operating activities: |
||||||||||||||||||||||||
| Net cash provided by (used in) operating activities |
$ | 50,000 | $ | (894 | ) | $ | (35,183 | ) | $ | 39,426 | $ | (50,000 | ) | $ | 3,349 | |||||||||
| Cash flows from investing activities: |
||||||||||||||||||||||||
| Subscriber contract costs |
— | — | (292,420 | ) | (29,435 | ) | — | (321,855 | ) | |||||||||||||||
| Capital expenditures |
— | — | (32,026 | ) | (185 | ) | — | (32,211 | ) | |||||||||||||||
| Proceeds from the sale of subsidiary |
— | — | — | — | — | — | ||||||||||||||||||
| Proceeds from sale of capital assets |
— | — | 964 | — | — | 964 | ||||||||||||||||||
| Investment in subsidiary |
(32,300 | ) | (340,024 | ) | — | — | 372,324 | — | ||||||||||||||||
| Acquisition of intangible assets |
— | — | (9,649 | ) | — | — | (9,649 | ) | ||||||||||||||||
| Net cash used in acquisitions |
— | — | (18,500 | ) | — | — | (18,500 | ) | ||||||||||||||||
| Investment in marketable securities |
— | (60,000 | ) | — | — | — | (60,000 | ) | ||||||||||||||||
| Proceeds from marketable securities |
— | 60,069 | — | — | — | 60,069 | ||||||||||||||||||
| Proceeds from note receivable |
— | — | 22,699 | — | — | 22,699 | ||||||||||||||||||
| Change in restricted cash |
— | — | 14,375 | — | — | 14,375 | ||||||||||||||||||
| Investment in convertible note |
— | — | (3,000 | ) | — | — | (3,000 | ) | ||||||||||||||||
| Other assets |
— | — | (2,153 | ) | (9 | ) | — | (2,162 | ) | |||||||||||||||
|
|
|
|
|
|
|
|
|
|
|
|
|
|||||||||||||
| Net cash used in investing activities |
(32,300 | ) | (339,955 | ) | (319,710 | ) | (29,629 | ) | 372,324 | (349,270 | ) | |||||||||||||
| Cash flows from financing activities: |
||||||||||||||||||||||||
| Proceeds from notes payable |
— | 102,000 | — | — | — | 102,000 | ||||||||||||||||||
| Borrowings from revolving line of credit |
— | 20,000 | — | — | — | 20,000 | ||||||||||||||||||
| Intercompany receivable |
— | — | 10,658 | — | (10,658 | ) | — | |||||||||||||||||
| Intercompany payable |
— | — | 340,024 | (10,658 | ) | (329,366 | ) | — | ||||||||||||||||
| Proceeds from contract sales |
— | — | 2,261 | — | — | 2,261 | ||||||||||||||||||
| Acquisition of contracts |
— | — | (2,277 | ) | — | — | (2,277 | ) | ||||||||||||||||
| Repayments of capital lease obligations |
— | — | (6,297 | ) | (3 | ) | — | (6,300 | ) | |||||||||||||||
| Deferred financing costs |
— | (2,927 | ) | — | — | — | (2,927 | ) | ||||||||||||||||
| Capital contribution |
32,300 | 32,300 | — | — | (32,300 | ) | 32,300 | |||||||||||||||||
| Payment of dividends |
(50,000 | ) | (50,000 | ) | — | — | 50,000 | (50,000 | ) | |||||||||||||||
|
|
|
|
|
|
|
|
|
|
|
|
|
|||||||||||||
| Net cash (used in) provided by financing activities |
(17,700 | ) | 101,373 | 344,369 | (10,661 | ) | (322,324 | ) | 95,057 | |||||||||||||||
| Effect of exchange rate changes on cash |
— | — | — | (234 | ) | — | (234 | ) | ||||||||||||||||
|
|
|
|
|
|
|
|
|
|
|
|
|
|||||||||||||
| Net increase in cash |
— | (239,476 | ) | (10,524 | ) | (1,098 | ) | — | (251,098 | ) | ||||||||||||||
| Cash: |
||||||||||||||||||||||||
| Beginning of period |
— | 248,908 | 8,291 | 4,706 | — | 261,905 | ||||||||||||||||||
|
|
|
|
|
|
|
|
|
|
|
|
|
|||||||||||||
| End of period |
$ | — | $ | 9,432 | $ | (2,233 | ) | $ | 3,608 | $ | — | $ | 10,807 | |||||||||||
|
|
|
|
|
|
|
|
|
|
|
|
|
|||||||||||||
100
Table of Contents
Condensed Consolidating Statements of Cash Flows
For the Year ended December 31, 2013 (Successor)
(In thousands)
| Parent | APX Group, Inc. |
Guarantor Subsidiaries |
Non-Guarantor Subsidiaries |
Eliminations | Consolidated | |||||||||||||||||||
| Cash flows from operating activities: |
||||||||||||||||||||||||
| Net cash provided by (used in) operating activities |
$ | 60,000 | $ | (201 | ) | $ | 43,219 | $ | 36,407 | $ | (60,000 | ) | $ | 79,425 | ||||||||||
| Cash flows from investing activities: |
||||||||||||||||||||||||
| Subscriber contract costs |
— | — | (270,707 | ) | (27,936 | ) | — | (298,643 | ) | |||||||||||||||
| Capital expenditures |
— | — | (8,620 | ) | (56 | ) | — | (8,676 | ) | |||||||||||||||
| Proceeds from the sale of subsidiary |
— | 144,750 | — | — | — | 144,750 | ||||||||||||||||||
| Investment in subsidiary |
— | (254,394 | ) | — | — | 254,394 | — | |||||||||||||||||
| Proceeds from the sale of capital assets |
— | — | 9 | — | — | 9 | ||||||||||||||||||
| Net cash used in acquisition |
— | — | (4,272 | ) | — | — | (4,272 | ) | ||||||||||||||||
| Change in restricted cash |
— | — | (161 | ) | — | — | (161 | ) | ||||||||||||||||
| Other assets |
— | — | (9,648 | ) | 3 | — | (9,645 | ) | ||||||||||||||||
|
|
|
|
|
|
|
|
|
|
|
|
|
|||||||||||||
| Net cash used in investing activities |
— | (109,644 | ) | (293,399 | ) | (27,989 | ) | 254,394 | (176,638 | ) | ||||||||||||||
| Cash flows from financing activities: |
||||||||||||||||||||||||
| Proceeds from notes payable |
— | 457,250 | — | — | — | 457,250 | ||||||||||||||||||
| Intercompany receivable |
— | — | 7,096 | — | (7,096 | ) | — | |||||||||||||||||
| Intercompany payable |
— | — | 254,394 | (7,096 | ) | (247,298 | ) | — | ||||||||||||||||
| Borrowings from revolving line of credit |
— | 22,500 | — | — | — | 22,500 | ||||||||||||||||||
| Repayments on revolving line of credit |
— | (50,500 | ) | — | — | — | (50,500 | ) | ||||||||||||||||
| Repayments of capital lease obligations |
— | — | (7,207 | ) | — | — | (7,207 | ) | ||||||||||||||||
| Deferred financing costs |
— | (10,896 | ) | — | — | — | (10,896 | ) | ||||||||||||||||
| Payment of dividends |
(60,000 | ) | (60,000 | ) | — | — | 60,000 | (60,000 | ) | |||||||||||||||
|
|
|
|
|
|
|
|
|
|
|
|
|
|||||||||||||
| Net cash (used in) provided by financing activities |
(60,000 | ) | 358,354 | 254,283 | (7,096 | ) | (194,394 | ) | 351,147 | |||||||||||||||
| Effect of exchange rate changes on cash |
— | — | — | (119 | ) | — | (119 | ) | ||||||||||||||||
|
|
|
|
|
|
|
|
|
|
|
|
|
|||||||||||||
| Net increase in cash |
— | 248,509 | 4,103 | 1,203 | — | 253,815 | ||||||||||||||||||
| Cash: |
||||||||||||||||||||||||
| Beginning of period |
— | 399 | 4,188 | 3,503 | — | 8,090 | ||||||||||||||||||
|
|
|
|
|
|
|
|
|
|
|
|
|
|||||||||||||
| End of period |
$ | — | $ | 248,908 | $ | 8,291 | $ | 4,706 | $ | — | $ | 261,905 | ||||||||||||
|
|
|
|
|
|
|
|
|
|
|
|
|
|||||||||||||
101
Table of Contents
Condensed Consolidating Statements of Cash Flows
For the Period From November 17, 2012 to December 31, 2012 (Successor)
(In thousands)
| Parent | APX Group, Inc. |
Guarantor Subsidiaries |
Non-Guarantor Subsidiaries |
Eliminations | Consolidated | |||||||||||||||||||
| Cash flows from operating activities: |
||||||||||||||||||||||||
| Net cash provided by (used in) operating activities |
$ | — | $ | 399 | $ | (22,272 | ) | $ | 326 | $ | (3,696 | ) | $ | (25,243 | ) | |||||||||
| Cash flows from investing activities: |
||||||||||||||||||||||||
| Subscriber contract costs |
— | — | (11,683 | ) | (1,255 | ) | — | (12,938 | ) | |||||||||||||||
| Capital expenditures |
— | — | (1,333 | ) | (123 | ) | — | (1,456 | ) | |||||||||||||||
| Net cash used in acquisition of the predecessor including transaction costs, net of cash acquired |
— | (1,915,473 | ) | — | — | — | (1,915,473 | ) | ||||||||||||||||
| Investment in subsidiary |
(708,453 | ) | (67,626 | ) | (3,696 | ) | — | 779,775 | — | |||||||||||||||
| Other assets |
— | — | (19,587 | ) | — | — | (19,587 | ) | ||||||||||||||||
|
|
|
|
|
|
|
|
|
|
|
|
|
|||||||||||||
| Net cash used in investing activities |
(708,453 | ) | (1,983,099 | ) | (36,299 | ) | (1,378 | ) | 779,775 | (1,949,454 | ) | |||||||||||||
| Cash flows from financing activities: |
||||||||||||||||||||||||
| Proceeds from notes payable |
— | 1,333,000 | — | — | — | 1,333,000 | ||||||||||||||||||
| Proceeds from the issuance of common stock in connection with acquisition of the predecessor |
708,453 | 708,453 | — | — | (708,453 | ) | 708,453 | |||||||||||||||||
| Intercompany payable |
— | — | 63,112 | 4,514 | (67,626 | ) | — | |||||||||||||||||
| Repayments of capital lease obligations |
— | — | (353 | ) | — | — | (353 | ) | ||||||||||||||||
| Deferred financing costs |
— | (58,354 | ) | — | — | — | (58,354 | ) | ||||||||||||||||
|
|
|
|
|
|
|
|
|
|
|
|
|
|||||||||||||
| Net cash (used in) provided by financing activities |
708,453 | 1,983,099 | 62,759 | 4,514 | (776,079 | ) | 1,982,746 | |||||||||||||||||
| Effect of exchange rate changes on cash |
— | — | — | 41 | — | 41 | ||||||||||||||||||
|
|
|
|
|
|
|
|
|
|
|
|
|
|||||||||||||
| Net increase in cash |
— | 399 | 4,188 | 3,503 | — | 8,090 | ||||||||||||||||||
| Cash: |
||||||||||||||||||||||||
| Beginning of period |
— | — | — | — | — | — | ||||||||||||||||||
|
|
|
|
|
|
|
|
|
|
|
|
|
|||||||||||||
| End of period |
$ | — | $ | 399 | $ | 4,188 | $ | 3,503 | $ | — | $ | 8,090 | ||||||||||||
|
|
|
|
|
|
|
|
|
|
|
|
|
|||||||||||||
102
Table of Contents
Condensed Consolidating Statements of Cash Flows
For the Period From January 1, 2012 to November 16, 2012 (Predecessor)
(In thousands)
| Parent | APX Group, Inc. |
Guarantor Subsidiaries |
Non-Guarantor Subsidiaries |
Eliminations | Consolidated | |||||||||||||||||||
| Cash flows from operating activities: |
||||||||||||||||||||||||
| Net cash provided by (used in) operating activities |
$ | — | $ | — | $ | 100,385 | $ | 43,330 | $ | (48,344 | ) | $ | 95,371 | |||||||||||
| Cash flows from investing activities: |
||||||||||||||||||||||||
| Subscriber contract costs |
— | — | (205,705 | ) | (58,026 | ) | — | (263,731 | ) | |||||||||||||||
| Capital expenditures |
— | — | (5,231 | ) | (663 | ) | — | (5,894 | ) | |||||||||||||||
| Proceeds from the sale of capital assets |
— | — | 274 | — | — | 274 | ||||||||||||||||||
| Change in restricted cash |
— | — | — | (152 | ) | — | (152 | ) | ||||||||||||||||
| Investment in subsidiary |
— | (4,562 | ) | — | — | 4,562 | — | |||||||||||||||||
| Other assets |
— | — | (725 | ) | (18 | ) | — | (743 | ) | |||||||||||||||
|
|
|
|
|
|
|
|
|
|
|
|
|
|||||||||||||
| Net cash used in investing activities |
— | (4,562 | ) | (211,387 | ) | (58,859 | ) | 4,562 | (270,246 | ) | ||||||||||||||
| Cash flows from financing activities: |
||||||||||||||||||||||||
| Proceeds from notes payable |
— | — | 116,163 | — | — | 116,163 | ||||||||||||||||||
| Proceeds from issuance of preferred stock and warrants |
— | 4,562 | — | — | — | 4,562 | ||||||||||||||||||
| Proceeds from issuance of preferred stock by Solar |
— | — | — | 5,000 | — | 5,000 | ||||||||||||||||||
| Capital contribuitons-non-controlling interest |
— | — | — | 9,193 | — | 9,193 | ||||||||||||||||||
| Borrowings from revolving line of credit |
— | — | 101,000 | 4,000 | — | 105,000 | ||||||||||||||||||
| Intercompany receivable |
— | — | (46,036 | ) | — | 46,036 | — | |||||||||||||||||
| Intercompany payable |
— | — | — | 2,254 | (2,254 | ) | — | |||||||||||||||||
| Repayments on revolving line of credit |
— | — | (42,241 | ) | — | — | (42,241 | ) | ||||||||||||||||
| Repayments of captial lease obligations |
— | — | (4,060 | ) | — | — | (4,060 | ) | ||||||||||||||||
| Excess tax benefit from share-based payment awards |
— | — | 2,651 | — | — | 2,651 | ||||||||||||||||||
| Deferred financing costs |
— | — | (5,720 | ) | (964 | ) | — | (6,684 | ) | |||||||||||||||
| Payment of dividends |
— | — | — | (80 | ) | — | (80 | ) | ||||||||||||||||
|
|
|
|
|
|
|
|
|
|
|
|
|
|||||||||||||
| Net cash (used in) provided by financing activities |
— | 4,562 | 121,757 | 19,403 | 43,782 | 189,504 | ||||||||||||||||||
| Effect of exchange rate changes on cash |
— | — | — | (251 | ) | — | (251 | ) | ||||||||||||||||
|
|
|
|
|
|
|
|
|
|
|
|
|
|||||||||||||
| Net increase in cash |
— | — | 10,755 | 3,623 | — | 14,378 | ||||||||||||||||||
| Cash: |
||||||||||||||||||||||||
| Beginning of period |
— | — | 2,817 | 863 | — | 3,680 | ||||||||||||||||||
|
|
|
|
|
|
|
|
|
|
|
|
|
|||||||||||||
| End of period |
$ | — | $ | — | $ | 13,572 | $ | 4,486 | $ | — | $ | 18,058 | ||||||||||||
|
|
|
|
|
|
|
|
|
|
|
|
|
|||||||||||||
103
Table of Contents
NOTE 21—SUBSEQUENT EVENTS
On March 6, 2015 APX Group Holdings, Inc. and the other guarantors party thereto amended and restated the credit agreement governing APX’s revolving credit facility to provide for, among other, (1) an increase in the aggregate commitments previously available to APX thereunder from $200.0 million to $289.4 million and (2) the extension of the maturity date with respect to certain of the previously available commitments.
As of March 6, 2015, outstanding borrowings under revolving credit facility totaled $32.5 million.
104
Table of Contents
ITEM 9. CHANGES IN AND DISAGREEMENTS WITH ACCOUNTANTS ON ACCOUNTING AND FINANCIAL DISCLOSURE
None.
| ITEM 9A. | CONTROLS AND PROCEDURES |
Disclosure Controls and Procedures
We maintain disclosure controls and procedures (as that term is defined in Rules 13a-15(e) and 15d-15(e) under the Securities Exchange Act of 1934, as amended (the “Exchange Act”)) that are designed to ensure that information required to be disclosed in our reports under the Exchange Act is recorded, processed, summarized and reported within the time periods specified in the SEC’s rules and forms, and that such information is accumulated and communicated to our management, including our principal executive officer and principal financial officer, as appropriate, to allow timely decisions regarding required disclosures. Any controls and procedures, no matter how well designed and operated, can provide only reasonable assurance of achieving the desired control objectives. Our management, with the participation of our principal executive officer and principal financial officer, has evaluated the effectiveness of the design and operation of our disclosure controls and procedures as of December 31, 2014, the end of the period covered by this report. Based upon that evaluation, our principal executive officer and principal financial officer concluded that, as of the end of the period covered by this report, the design and operation of our disclosure controls and procedures were not effective to accomplish their objectives due to the material weakness discussed below.
105
Table of Contents
Internal Control Over Financial Reporting
Management’s Annual Report on Internal Control Over Financial Reporting
Our management is responsible for establishing and maintaining adequate internal control over our financial reporting. Our internal control over financial reporting is designed to provide reasonable assurances regarding the reliability of financial reporting and the preparation of financial statements for external purposes in accordance with U.S. generally accepted accounting principles. Our internal control over financial reporting includes those policies and procedures that:
| • | pertain to the maintenance of records that, in reasonable detail, accurately and fairly reflect the transactions and dispositions of our assets; |
| • | provide reasonable assurance that transactions are recorded as necessary to permit preparation of financial statements in accordance with U.S. generally accepted accounting principles, and that receipts and expenditures are being made only in accordance with authorizations of our management and directors; and |
| • | provide reasonable assurance regarding prevention or timely detection of unauthorized acquisition, use or disposition of our assets that could have a material effect on the financial statements. |
Our internal control systems include the controls themselves, actions taken to correct deficiencies as identified, an organizational structure providing for division of responsibilities, careful selection and training of qualified financial personnel and a program of internal audits
Because of its inherent limitations, internal control over financial reporting may not prevent or detect misstatements. Also, projections of any evaluation of effectiveness to future periods are subject to the risk that controls may become inadequate because of changes in conditions, or that the degree of compliance with the policies or procedures may deteriorate.
Our management has assessed the effectiveness of our internal control over financial reporting as of December 31, 2014. In making this assessment, management used the framework set forth by the Committee of Sponsoring Organizations of the Treadway Commission (COSO) in Internal Control-Integrated Framework.
Based on this assessment, our management concluded that our internal control over financial reporting was not effective as of December 31, 2014 due to the material weakness discussed below.
Description of Material Weakness
In connection with the preparation and audit of our consolidated financial statements, we and our independent registered public accounting firm identified a material weakness in internal control over financial reporting. A material weakness is a deficiency, or a combination of deficiencies, in internal control over financial reporting such that there is a reasonable possibility that a material misstatement of a company’s annual or interim financial statements will not be prevented or detected on a timely basis.
The material weakness we identified related to deficiencies in the completeness and effectiveness of our Information Technology General Control (ITGC) environment and the controls associated with our year end financial close process. The deficiencies with our year end financial close process, included reviews of account reconciliations and journal entries, resulting in a number of audit adjustments, primarily in the areas of (1) capitalized subscriber acquisition costs, (2) inventory and (3) accrued expenses.
We have initiated remediation efforts of these controls in the financial statement close process. The remediation includes, but is not limited to, expanding technical accounting skill sets, enhancing reconciliation and review procedures, and adding additional information technology system related controls.
106
Table of Contents
| ITEM 9B. | OTHER INFORMATION |
Iran Threat Reduction and Syria Human Rights Act of 2012
Pursuant to Section 219 of the Iran Threat Reduction and Syria Human Rights Act of 2012, which added Section 13(r) of the Exchange Act, the Company hereby incorporates by reference herein Exhibit 99.1 of this report, which includes disclosures publicly filed and/or provided to The Blackstone Group L.P. by Travelport Limited and Travelport Worldwide Limited, which may be considered our affiliate.
107
Table of Contents
| ITEM 10. | DIRECTORS, EXECUTIVE OFFICERS AND CORPORATE GOVERNANCE |
The following table sets forth, as of March 1, 2015, certain information regarding our directors and executive officers are responsible for overseeing the management of our business.
| Name |
Age |
Position | ||
| Todd Pedersen |
46 | Chief Executive Officer and Director | ||
| Alex Dunn |
43 | President and Director | ||
| David Bywater |
45 | Chief Operating Officer | ||
| Matt Eyring |
45 | Chief Strategy and Innovation Officer | ||
| Mark Davies |
54 | Chief Financial Officer | ||
| Dale Gerard |
44 | Senior Vice President of Finance and Treasurer | ||
| Nathan Wilcox |
48 | General Counsel | ||
| JT Hwang |
40 | Chief Information Officer | ||
| Patrick Kelliher |
51 | Chief Accounting Officer | ||
| Todd Santiago |
42 | Chief Sales Officer | ||
| Jeff Lyman |
38 | Chief Marketing Officer | ||
| Jeremy Warren |
40 | Chief Technology Officer | ||
| David F. D’Alessandro |
64 | Director | ||
| Bruce McEvoy |
37 | Director | ||
| Joseph Trustey |
52 | Director | ||
| Peter Wallace |
39 | Director |
Todd Pedersen founded the Company in 1999 and served as our President, Chief Executive Officer and Director. In February 2013, Mr. Pedersen relinquished his title as our President and remained our Chief Executive Officer and Director.
Alex Dunn was named our President in February 2013. Prior to this he served as our Chief Operating Officer and Director from July of 2005 through January 2013. Prior to joining the Company, he served as Deputy Chief of Staff and Chief Operating Officer to Governor Mitt Romney in Massachusetts. Before joining Governor Romney’s staff, Mr. Dunn served as entrepreneur-in-residence at the venture capital firm General Catalyst. There, he helped start m-Qube, a mobile media management company. Prior to that, he co-founded LavaStorm Technologies, an international telecommunications software company, where he served as Chief Executive Officer.
David Bywater has served as our Chief Operating Officer since July 2013. Before joining us, Mr. Bywater served as Executive Vice President and Corporate Officer for Xerox and was the Chief Operating Officer of its State Government Services. Prior to that, Mr. Bywater worked at Affiliated Computer Services (ACS), where, during his tenure, he managed a number of their business units. ACS was acquired by Xerox in 2009. From 1999 to 2003, Mr. Bywater was a senior manager at Bain & Company.
Matt Eyring has served as our Chief Strategy and Innovation Officer since December 2012. Before joining us, Mr. Eyring was the managing partner of Innosight, a global strategy and innovation consulting firm. Prior to Innosight, Mr. Eyring was Vice President and General Manager at LavaStorm Technologies. Mr. Eyring currently serves on the board of Virgin Health Miles and is a technical advisor to the U.S. Department of Health and Human Services Innovation Fellows program.
Mark Davies has served as our Chief Financial Officer since November 2013. Before joining us, Mr. Davies served two years as Executive Vice President of Alcoa, as President of the company’s Global Business Services unit and member of the Alcoa Executive Council. Prior to Alcoa, Mr. Davies worked at Dell Inc. for 12 years, most recently as the Managing Vice President of Strategic Programs, reporting to Chairman, Michael Dell. Prior to that, Mr. Davies served as Chief Financial Officer of the Global Consumer Group.
Dale Gerard has served as our Senior Vice President of Finance and Treasurer since September 2014. Prior to this, he served as Vice President of Finance and Treasurer from January 2013 to September 2014. Prior to this he served as Treasurer from March 2010 to January 2013. Prior to joining us, Mr. Gerard was the Assistant Treasurer and Director of Finance at ACL. Before joining ACL, Mr. Gerard served as Senior Treasury Analyst at Wabash National Corporation. Prior to that, Mr. Gerard spent four years at Chemtura Corporation, formerly Great Lakes Chemical Corporation, as Finance Analyst in the Fine Chemical and Fluorine business units.
Nathan Wilcox has served as our General Counsel since October 2007. Before joining us, Mr. Wilcox was a shareholder at Anderson & Karrenberg, P.C., and specialized in commercial and civil litigation. With more than 20 years of legal experience, he has extensive experience in civil and commercial litigation. Mr. Wilcox is also the President of the Utah Alarm Association and a member of the Electronic Security Association’s Bylaws Committee as well as a board member.
108
Table of Contents
JT Hwang has served as our Chief Information Officer since August 2014. Mr. Hwang served as our Chief Technology Officer continuously from joining the Company in March of 2008 through August 2014, with the exception of the period from June of 2010 to January 2013, when he served as the Chief Information Officer. He has over 16 years of experience in the computer science field. Before joining the Company, Mr. Hwang was Chief Architect at Netezza Corporation, a global provider of data warehouse appliance solutions, beginning in October 2006. He also served as Chief Architect of Hewlett-Packard’s Advanced Solutions Lab from March 2002 to October 2006.
Patrick Kelliher has served as Chief Accounting Officer since February 2014. Prior to this, he served as Vice President of Finance and Corporate Controller from March 2012 to February 2014. Prior to joining us, he served as Senior Director of Finance and Business Unit Controller of Adobe. Prior to Adobe, Mr. Kelliher was the Vice President of Finance and Controller for Omniture, Inc. Before that he has served in various senior finance roles at other high growth technology companies.
Todd Santiago has served as our Chief Sales Officer since February 2013. Prior to this, Mr. Santiago was president of 2GIG where he coordinated the successful launch of Go!Control. Prior to joining 2GIG, Mr. Santiago was Partner and General Manager of Signature Academies in Boise, ID and VP and General Manager at NCH Corporation in Irving, TX. Mr. Santiago is the brother-in-law of Mr. Pedersen.
Jeff Lyman has served as our Chief Marketing Officer of the Company since February 2014. Prior to this he served as our Vice President of Consumer Experience from August 2013 to February 2014. Prior to joining us, he served most recently as Senior Director for Mobile & Web Design at NIKE+, Nike’s activity tracking service. Mr. Lyman held other positions at NIKE, including leading digital and marketplace communication for NIKEiD (NIKE’s custom footwear experience) and Nike Basketball.
Jeremy Warren has served as our Chief Technology Officer since December 2014. Prior to this, he served as Vice President of Innovation from November 2012 to December 2014. Prior to this, he was Chief Technology Officer at 2GIG Technologies where he was responsible for the engineering and mass production of 2GIG’s product line. Prior to joining 2GIG, he was Chief Technology Officer of the U.S. Department of Justice and Chief Architect of Lavastorm Technologies.
Bruce McEvoy has served as a Director of the Company since November 16, 2012. Mr. McEvoy is a Managing Director at Blackstone in the Private Equity Group. Before joining Blackstone in 2006, Mr. McEvoy worked as an Associate at General Atlantic from 2002 to 2004, and was a consultant at McKinsey & Company from 1999 to 2002. Mr. McEvoy currently serves on the boards of directors of Catalent Pharma Solutions, Inc., Performance Food Group, GCA Services, RGIS Inventory Services, Vivint Solar and SeaWorld Entertainment.
David F. D’Alessandro has served as a Director of the Company since July 31, 2013. Mr. D’Alessandro is the chairman of the Board of Directors of SeaWorld Entertainment, Inc., a position he has held since 2010, and has served as Chief Executive Officer since January 15, 2015. He served as Chairman, President and Chief Executive Officer of John Hancock Financial Services from 2000 to 2004, having served as President and Chief Operating Officer of the same entity from 1996 to 2000, and guided the company through a merger with ManuLife Financial Corporation in 2004. Mr. D’Alessandro served as President and Chief Operating Officer of ManuLife in 2004. He is a former Partner of the Boston Red Sox. He also holds honorary doctorates from three colleges and serves as vice chairman of Boston University.
Joseph Trustey has served as a Director of the Company since November 16, 2012. Mr. Trustey joined Summit Partners in 1992. Prior to joining Summit Partners, he worked as a consultant with Bain & Co. and served as a Captain in the U.S. Army. Based in Summit’s Boston office, Mr. Trustey is active in the firm’s investment activities in North America, Europe and Asia. During tenure with Summit Partners, Mr. Trustey has served as a director of many companies including two public companies. He is currently a director of Aramsco, Belkin, Commercial Defeasance, ISH (acquired by PwC), Vivint Solar and Tippmann Sports.
Peter Wallace has served as a Director of the Company since November 16, 2012. Mr. Wallace is a Senior Managing Director at Blackstone in the Private Equity Group, which he joined in 1997. Mr. Wallace serves on the board of directors of Vivint Solar (Chair), AlliedBarton Security Services, Michaels Stores, Inc., SeaWorld Entertainment and The Weather Channel Companies.
109
Table of Contents
Corporate Governance Matters
Background and Experience of Directors
When considering whether directors have the experiences, qualifications, attributes or skills, taken as a whole, to enable the Board to satisfy its oversight responsibilities effectively in light of our business and structure, the Board focused on, among other things, each person’s background and experience as reflected in the information discussed in each of the directors’ individual biographies set forth above. We believe that our directors provide an appropriate mix of experience and skills relevant to the size and nature of our business. The members of the Board considered, among other things, the following important characteristics which make each director a valuable member of the Board:
| • | Mr. Pedersen’s extensive knowledge of our industry and significant experience, as well as his insights as the original founder of our firm. Mr. Pedersen has played a critical role in our firm’s successful growth since its founding and has developed a unique and unparalleled understanding of our business. |
| • | Mr. Dunn’s extensive knowledge of our industry and significant leadership experience. |
| • | Mr. D’Alessandro’s extensive business and leadership experience, including as Chairman, President and Chief Executive Officer of John Hancock Financial Services, as well as his familiarity with board responsibilities, oversight and control resulting from serving on the boards of directors of public companies. |
| • | Mr. McEvoy’s extensive knowledge of a variety of different industries and his significant financial and investment experience from his involvement in Blackstone, including as Managing Director. |
| • | Mr. Trustey’s significant financial expertise and business experience, including as a Managing Director at Summit Partners, as well as his familiarity with board responsibilities, oversight and control resulting from serving on the boards of directors of public companies. |
| • | Mr. Wallace’s significant financial expertise and business experience, including as a Senior Managing Director in the Private Equity Group at Blackstone, as well as his familiarity with board responsibilities, oversight and control resulting from serving on the boards of directors of public companies. |
Independence of Directors
We are not a listed issuer whose securities are listed on a national securities exchange or in an inter-dealer quotation system which has requirements that a majority of the board of directors be independent. However, if we were a listed issuer whose securities were traded on the New York Stock Exchange and subject to such requirements, we would be entitled to rely on the controlled company exception contained in Section 303A of the NYSE Listed Company Manual for exception from the independence requirements related to the majority of our Board of Directors. Pursuant to Section 303A of the NYSE Listed Company Manual, a company of which more than 50% of the voting power is held by an individual, a group of another company is exempt from the requirements that its board of directors consist of a majority of independent directors. At December 31, 2012, Blackstone beneficially owns greater than 50% of the voting power of the Company which would qualify the Company as a controlled company eligible for exemption under the rule.
Committees of the Board
Our Board of Directors has an Audit Committee and a Compensation Committee. Our Board of Directors may also establish from time to time any other committees that it deems necessary and advisable.
Audit Committee
Our Audit Committee consists of Messrs. McEvoy and Wallace. The Audit Committee is responsible for assisting our Board of Directors with its oversight responsibilities regarding: (i) the integrity of our financial statements; (ii) our compliance with legal and regulatory requirements; (iii) our independent registered public accounting firm’s qualifications and independence; and (iv) the performance of our internal audit function and independent registered public accounting firm. While our Board of Directors has not designated any of its members as an audit committee financial expert, we believe that each of the current Audit Committee members is fully qualified to address any accounting, financial reporting or audit issues that may come before it.
Compensation Committee
In March 2014, our Board of Directors established a Compensation Committee consisting of Messrs. D’Alessandro, McEvoy and Wallace. The Compensation Committee is responsible for determining, reviewing, approving and overseeing our executive compensation program.
Code of Ethics
We are not required to adopt a code of ethics because our securities are not listed on a national securities exchange and we do not have a code of ethics that applies to our principal executive officer, principal financial officer, principal accounting officer or controller, or persons performing similar functions. Although we do not have a code of ethics, our other compliance procedures are sufficient to ensure that we carry out our responsibilities in accordance with applicable laws and regulations.
110
Table of Contents
Compensation Committee Interlocks and Insider Participation
In March 2014, our Board of Directors formed a Compensation Committee that is responsible for making all compensation determinations. No member of the Compensation Committee was at any time during fiscal year 2014, or at any other time, one of our officers or employees. We are parties to certain transactions with our Sponsor described in “Certain Relationships and Related Transactions, and Director Independence.” None of our executive officers has served as a director or member of a compensation committee (or other committee serving an equivalent function) of any entity, one of whose executive officers served as a director of our Board or member of our Compensation Committee.
| ITEM 11. | EXECUTIVE COMPENSATION |
Compensation Committee Report
In March 2014, our Board of Directors formed a Compensation Committee that is responsible for making all compensation determinations. The compensation committee has reviewed and discussed with management the following Compensation Discussion and Analysis. Based on such review and discussions, the compensation committee approved the inclusion of the following Compensation Discussion and Analysis in this annual report on Form 10-K for the fiscal year ended December 31, 2014.
Submitted by the Compensation Committee:
David F. D’Alessandro, Director
Bruce McEvoy, Director
Peter Wallace, Director
Compensation Discussion and Analysis
Introduction
Our executive compensation plan is designed to attract and retain individuals with the qualifications to manage and lead the Company as well as to motivate them to develop professionally and contribute to the achievement of our financial goals and ultimately create and grow our overall enterprise value.
Our named executive officers, or NEOs, for 2014 were:
| • | Todd Pedersen, our Chief Executive Officer; |
| • | Mark Davies, our Chief Financial Officer; |
| • | Alex Dunn, our President; |
| • | Matt Eyring, our Chief Strategy and Innovation Officer; |
| • | Todd Santiago, our Chief Sales Officer; |
| • | Todd Thompson, our Former Chief Information Officer, who terminated employment with us effective October 31, 2014. |
Executive Compensation Objectives and Philosophy
Our primary executive compensation objectives are to:
| • | attract, retain and motivate senior management leaders who are capable of advancing our mission and strategy and ultimately, creating and maintaining our long-term equity value. Such leaders must engage in a collaborative approach and possess the ability to execute our business strategy in an industry characterized by competitiveness and growth; |
111
Table of Contents
| • | reward senior management in a manner aligned with our financial performance; and |
| • | align senior management’s interests with our equity owners’ long-term interests through equity participation and ownership. |
To achieve our objectives, we deliver executive compensation through a combination of the following components:
| • | Base salary; |
| • | Cash bonus opportunities; |
| • | Long-term incentive compensation; |
| • | Broad-based employee benefits; |
| • | Supplemental executive perquisites; and |
| • | Severance benefits. |
Base salaries, broad-based employee benefits, supplemental executive perquisites and severance benefits are designed to attract and retain senior management talent. We also use annual cash bonuses and long-term equity awards to promote performance-based pay that aligns the interests of our named executive officers with the long-term interests of our equity-owners and to enhance executive retention.
Compensation Determination Process
In March 2014, our Board of Directors formed a compensation committee that is responsible for making all executive compensation determinations (the “Committee”). Our Committee did not use any compensation consultants in making its compensation determinations and has not benchmarked any of its compensation determinations against a peer group.
Messrs. Pedersen and Dunn generally participate in discussions and deliberations with our Committee regarding the determinations of annual cash incentive awards for our executive officers. Specifically, they make recommendations to our Committee regarding the performance targets to be used under our annual bonus plan and the amounts of annual cash incentive awards. Messrs. Pedersen and Dunn do not participate in discussions or determinations regarding their individual compensation.
Employment Agreements
On August 7, 2014, Messrs. Pedersen and Dunn entered into employment agreements with us. These employment agreements contained the same material terms as, and superseded, those they had entered into previously with our indirect parent, 313 Acquisition LLC (“Parent”). No other named executive officer has an employment agreement. A full description of the material terms of Mr. Pedersen’s and Mr. Dunn’s employment agreements is discussed below under “Narrative Disclosure to Summary Compensation Table and 2014 Grants of Plan-Based Awards.”
Compensation Elements
The following is a discussion and analysis of each component of our executive compensation program:
Base Salary
Annual base salaries compensate our executive officers for fulfilling the requirements of their respective positions and provide them with a predictable and stable level of cash income relative to their total compensation.
Our Committee believes that the level of an executive officer’s base salary should reflect such executive’s performance, experience and breadth of responsibilities, salaries for similar positions within our industry and any other factors relevant to that particular job. The Committee, with the assistance of our Human Resources Department, used the experience, market knowledge and insight of its members in evaluating the competitiveness of current salary levels.
In the sole discretion of our Committee, base salaries for our executive officers may be periodically adjusted to take into account changes in job responsibilities or competitive pressures. The “Summary Compensation Table” and corresponding footnote below show the base salary earned by each named executive officer during fiscal 2014 as well as the base salary adjustments for Messrs. Eyring, Santiago and Thompson made during fiscal 2014.
Bonuses
Cash bonus opportunities are available to various managers, directors and executives, including our named executive officers, in order to motivate their achievement of short-term performance goals and tie a portion of their cash compensation to performance.
Fiscal 2014 Management Bonus - Messrs. Pedersen and Dunn
In fiscal 2014, Messrs. Pedersen and Dunn participated in a formalized annual cash incentive compensation plan pursuant to which they are eligible to receive an annual cash incentive award based on the achievement of company-wide performance objectives. As provided in their respective employment agreements, the target bonus amounts for each of Messrs. Pedersen and Dunn are 100% of their respective base salaries.
112
Table of Contents
Actual amounts paid to Messrs. Pedersen and Dunn under the fiscal 2014 annual cash incentive plan were calculated by multiplying each named executive officer’s bonus potential target (which is 100% of base salary) by an achievement factor based on our actual achievement relative to company-wide performance objective(s).
The achievement factor was determined by calculating our actual achievement against the company-wide performance target(s) based on the pre-established scale set forth in the following table:
| % Attainment of Performance Target |
Achievement Factor |
|||
| Less than 90% |
0 | |||
| 90% |
50 | % | ||
| 100% |
100 | % | ||
| 110% |
200 | % | ||
| 130% or greater |
250 | % | ||
Based on the pre-established scale set forth above, no cash incentive award would have been paid to Messrs. Pedersen and Dunn unless our actual performance for 2014 was at or above 90% of the performance target(s). If our actual performance was 100% of target, then Messrs. Pedersen and Dunn would have been entitled to their respective bonus potential target amounts. If performance was 110% of target, then they would have been eligible for a cash incentive award equal to 200% of their respective bonus potential target amounts. If performance was 130% or more of target, then they would have been eligible for a maximum cash incentive equal to 250% of their respective bonus potential target amounts. For performance percentages between these levels, the resulting achievement factor would be adjusted on a linear basis. The performance target for 2014 for Messrs. Pedersen and Dunn was Adjusted EBITDA (as that term is defined elsewhere in this annual report on Form 10-K under the heading “Management’s Discussion and Analysis of Financial Condition and Results of Operations—Liquidity and Capital Resources—Covenant Compliance”) of $331.9 million for Vivint.
For fiscal 2014, the actual Adjusted EBITDA achieved for Vivint was $309.4 million, or 93.2% of target, resulting in an achievement factor of 66.5% of their base salaries under the annual cash incentive plan. The following table illustrates the calculation of the annual cash incentive awards payable to each of Messrs. Pedersen and Dunn under the fiscal 2014 annual cash incentive plan in light of these performance results.
| Name |
2014 Salary | Target Bonus % |
Target Bonus Amount |
Achievement Factor |
Bonus Earned* |
|||||||||||||||
| Todd Pedersen |
$ | 500,000 | 100 | % | $ | 500,000 | 66.5 | % | $ | 332,262 | ||||||||||
| Alex Dunn |
$ | 500,000 | 100 | % | $ | 500,000 | 66.5 | % | $ | 332,262 | ||||||||||
| * | Amounts may not total due to rounding. |
Fiscal 2014 Management Bonus – Messrs. Davies, Eyring, Santiago and Thompson
In fiscal 2014, Messrs. Davies, Eyring, Santiago and Thompson were eligible to receive a discretionary bonus based on a percentage of such executive’s base salary. For fiscal 2014, each of Messrs. Davies, Eyring, Santiago and Thompson were eligible to receive a target bonus opportunity of 50% of their respective base salaries. In connection with his resignation from the Company effective October 31, 2014, Mr. Thompson was not entitled to a management bonus with respect to fiscal 2014. Based on Mr. Davies’s contribution to financial management and operational improvement, Mr. Eyring’s contribution to the strategic direction and technology development of the Company and Mr. Santiago’s contribution to the success of our 2014 selling efforts, based on the recommendation of Mr. Dunn, the Committee awarded the named executive officers, an annual bonus in the following amounts:
| Named Executive Officer |
2014 Salary | Target Bonus % |
Target Bonus Amount |
Bonus Earned |
||||||||||||
| Mark Davies |
500,000 | 50 | % | $ | 250,000 | $ | 234,500 | |||||||||
| Matt Eyring |
515,000 | 50 | % | $ | 257,500 | $ | 241,535 | |||||||||
| Todd Santiago |
515,000 | 50 | % | $ | 257,500 | $ | 241,535 | |||||||||
Retention Bonuses
In June 2012, the Board of Directors awarded Mr. Dunn a retention bonus payable upon a change of control of the Company. The Board of Directors determined that the retention bonuses were appropriate in order to incentivize each executive’s continued employment
113
Table of Contents
while the Company explored a possible sale of the Company. The bonus agreements provided that the rights to any bonus payments would be forfeited if the executive’s employment was terminated prior to the date of the change of control (other than due to a termination without cause or as a result of death or disability). Mr. Dunn’s payment was variable and was tied to the value received for APX Group, Inc.’s outstanding shares of common stock in connection with a change of control. The retention bonus amount became payable in connection with the closing of the Transactions and a portion of the retention bonus was held in escrow in order to cover potential post-closing purchase price adjustments and indemnification claims. Amounts released from escrow and paid to Mr. Dunn in 2014 are reported under the “Bonus” column of the “Summary Compensation Table.”
Sign-On Bonuses
From time to time, the Committee may award sign-on bonuses in connection with the commencement of an NEO’s employment with us. Sign-on bonuses are used only when necessary to attract highly skilled individuals to the Company. Generally they are used to incentivize candidates to leave their current employers, or may be used to offset the loss of unvested compensation they may forfeit as a result of leaving their current employers. In fiscal 2013, in order to attract to Mr. Davies to the position of Chief Financial Officer, the Board of Directors determined to award Mr. Davies a sign-on bonus of $350,000 in connection with the commencement of his employment with us and a payment equal to $500,000 on each of the first and second anniversaries of his November 4, 2013 start date.
Long-Term Incentive Compensation
Equity Awards
Our Parent, an entity controlled by investment funds or vehicles affiliated with Blackstone, grants long-term equity incentive awards designed to promote our interest by providing these executives with the opportunity to acquire equity interests as an incentive for their remaining in our service and aligning the executives’ interests with those of the Company’s ultimate equity holders. The long-term equity incentive awards are in the form of Class B Units in Parent.
The Class B Units are profits interests having economic characteristics similar to stock appreciation rights and represent the right to share in any increase in the equity value of Parent. Therefore, the Class B Units only have value to the extent there is an appreciation in the value of our business from and after the applicable date of grant. In addition, the vesting of two-thirds of the Class B Units is subject to Blackstone achieving minimum internal rates of return on its investment in Class A Units, as described further below.
The Class B Units granted to our named executive officers are designed to motivate them to focus on efforts that will increase the value of our equity while enhancing their retention. The specific sizes of the equity grants made were determined in light of Blackstone’s practices with respect to management equity programs at other private companies in its portfolio and the executive officer’s position and level of responsibility with us.
The Class B Units are divided into a time-vesting portion (one-third of the Class B Units granted), a 2.0x exit-vesting portion (one-third of the Class B Units granted), and a 3.0x exit-vesting portion (one-third of the Class B Units granted). Unvested Class B units are not entitled to distributions from the Company. For additional information regarding our Class B Units, see “Narrative Disclosure to Summary Compensation Table and Grants of Plan-Based Awards—Equity Awards.”
Another key component of our long-term equity incentive program is that at the time of the Transactions certain of our NEOs and other eligible employees were provided with the opportunity to invest in Class A Units of Parent on the same general terms as Blackstone and other co-investors. The Class A Units are equity interests, have economic characteristics that are similar to those of shares of common stock in a corporation and have no vesting schedule. We consider this investment opportunity an important part of our long-term equity incentive program because it encourages equity ownership and aligns the NEOs’ financial interests with those of our ultimate equity holders. Each of Messrs. Pedersen, Dunn and Santiago, when presented with the opportunity, chose to invest in Class A Units of Parent.
Payments for Pre-Merger Options in Connection with the Transactions
In connection with the Transactions, all outstanding unvested options to acquire APX Group, Inc. and 2GIG common stock were vested in full and cashed out based on the difference between the change in control price and the option’s exercise price. A portion of the cash proceeds was held in escrow in order to cover potential post-closing purchase price adjustments and indemnification claims. The amount released from escrow and paid to Mr. Santiago in 2014 with respect to his 2GIG options is reflected in the “Option Exercises and Stock Vested in 2014” table below.
In November 2012, an entity controlled by Mr. Dunn exercised an option to purchase 1,250 shares of preferred stock and common stock of APX Group, Inc. and Solar from the Company’s founders, which shares were then cashed out in connection with Transactions. A portion of the cash proceeds was held in escrow in order to cover potential post-closing purchase price adjustments and indemnification claims. The amount released from escrow and paid to Mr. Dunn in 2014 with respect to the exercise of this option is reflected in the “Option Exercises and Stock Vested in 2014” table below and is based on the difference between the change in control price and the option’s exercise price.
114
Table of Contents
Fiscal 2014 Grants
In connection with the Company’s offer of employment to Mr. Davies, Parent agreed to grant Mr. Davies 4,325,000 Class B Units with the same vesting terms as described above. The Class B Units granted to Mr. Davies are similar to the Class B Units as described above, but contain the following different economic terms: Mr. Davies’s Class B Units will not entitle him to receive any distributions in respect of such units unless and until the cumulative value of such foregone distributions attributable to each Class B Unit equals the fair market value of a Class B Unit on the date of the grant of such Class B Unit (such foregone amount, the “Delayed Amount Per Class B Unit”). At that point, Mr. Davies (together with the other holders of Class B Units subject to similar foregone distributions) will become entitled to receive pro rata distributions of all subsequent amounts (to the exclusion of other holders who do not have similar rights) until he has received distributions per Class B Unit equal to the Delayed Amount Per Class B Unit. Thereafter, Mr. Davies will become entitled to receive the same amounts with respect to his Class B Units as other holders of Class B Units receive with respect to their Class B Units. Parent approved the grant of these Class B Units to Mr. Davies on January 24, 2014.
Benefits and Perquisites
We provide to all of our employees, including our named executive officers, employee benefits that are intended to attract and retain employees while providing them with retirement and health and welfare security. Broad-based employee benefits include:
| • | a 401(k) savings plan; |
| • | paid vacation, sick leave and holidays; |
| • | medical, dental, vision and life insurance coverage; and |
| • | employee assistance program benefits. |
We do not match employee contributions to the 401(k) savings plan. At no cost to the employee, we provide an amount of basic life insurance valued at $50,000.
We also provide our named executive officers with specified perquisites and personal benefits that are not generally available to all employees, such as personal use of our Company leased aircraft, use of a company vehicle, household services, financial advisory services, reimbursement for health insurance premiums, enhanced employee cafeteria benefits, relocation assistance and, in certain circumstances, reimbursement for personal travel. Each of Messrs. Pedersen and Dunn has also been provided with an annual fringe benefit allowance of $300,000 under the terms of their new employment agreements. We also reimburse our named executive officers for taxes incurred in connection with certain of these perquisites. In addition, on January 1, 2013, we entered into time-sharing agreements with Messrs. Pedersen and Dunn, governing their personal use of the Company leased aircraft. Messrs. Pedersen and Dunn pay for personal flights an amount equal to the aggregate variable cost to the Company for such flights, up to the maximum authorized by Federal Aviation Regulations. The aggregate variable cost for this purpose includes fuel costs, out-of-town hangar costs, landing fees, airport taxes and fees, customs fees, travel expenses of the crew, any “deadhead” segments of flights to reposition corporate aircraft and other related rental fees. In addition, family members of our named executive officers have, in limited circumstances, accompanied the named executive officers on business travel on the Company leased aircraft for which we incurred de minimis incremental costs.
We provide these perquisites and personal benefits in order to further our goal of attracting and retaining our executive officers. These benefits and perquisites are reflected in the “All Other Compensation” column of the “Summary Compensation Table” and the accompanying footnote in accordance with the SEC rules.
Severance Arrangements
Our Board of Directors believes that providing severance benefits to some of our named executive officers is critical to our long-term success, because severance benefits act as a retention device that helps secure an executive’s continued employment and dedication to the Company. Of the named executive officers, only Messrs. Pedersen and Dunn have existing severance arrangements. Under the terms of their severance arrangements, which are included in their employment agreements, Messrs. Pedersen and Dunn are eligible to receive severance benefits if their employment is terminated for any reason other than voluntary resignation or willful misconduct. The severance payments are contingent upon the affected executive’s execution of a release and waiver of claims, which contains non-compete, non-solicitation and confidentiality provisions. See “Potential Payments Upon Termination or Change in Control” for descriptions of these arrangements.
None of our other named executive officers have severance agreements or are otherwise entitled to severance upon termination of employment. We do, however, on occasion pay severance on a case by case basis to our executives based on the executive, his or her position, nature of the potential separation, such executive’s compliance with specified post-termination restrictive covenants and in order to obtain a release and waiver of claims in favor of us and our affiliates. For example, in connection with Mr. Thompson’s resignation, the Compensation Committee determined that, in consideration for entering into a release and waiver of claims, it was appropriate to enter into a separation agreement with him, which agreement is described under “Potential Payments Upon Termination or Change in Control” below.
115
Table of Contents
Summary Compensation Table
The following table provides summary information concerning compensation paid or accrued by us to or on behalf of our named executive officers.
| Name and Principal Position |
Year | Salary ($)(1) |
Bonus ($)(2) |
Stock Awards ($)(3) |
Non-Equity Incentive Plan Compensation ($)(4) |
All Other ($)(5) |
Total ($) |
|||||||||||||||||||||
| Todd Pedersen, Chief Executive Officer and Director |
2014 | 500,000 | — | — | 332,262 | 776,538 | 1,608,800 | |||||||||||||||||||||
| 2013 | 500,000 | 120,000 | — | 430,000 | 625,276 | 1,675,276 | ||||||||||||||||||||||
| 2012 | 377,692 | 220,500 | 3,021,194 | 335,196 | 1,886,699 | 5,841,281 | ||||||||||||||||||||||
| Mark Davies, Chief Financial Officer |
2014 | 500,000 | 734,500 | 398,856 | 47,584 | 1,680,940 | ||||||||||||||||||||||
| 2013 | 79,452 | 389,041 | — | — | — | 468,493 | ||||||||||||||||||||||
| Alex Dunn, President and Director |
2014 | 500,000 | 276,342 | — | 332,262 | 742,772 | 1,851,376 | |||||||||||||||||||||
| 2013 | 500,000 | 120,000 | — | 430,000 | 573,377 | 1,623,377 | ||||||||||||||||||||||
| 2012 | 305,000 | 9,813,248 | 3,021,195 | 19,414 | 163,547 | 13,322,404 | ||||||||||||||||||||||
| Matt Eyring, |
2014 | 515,000 | 241,535 | — | 53,576 | 810,111 | ||||||||||||||||||||||
| Chief Strategy and Innovation Officer |
2013 | 402,192 | 250,000 | 490,167 | — | 43,436 | 1,185,795 | |||||||||||||||||||||
| Todd Santiago, Chief Sales Officer |
2014 | 515,000 | 241,535 | — | 89,442 | 845,977 | ||||||||||||||||||||||
| 2013 | 393,348 | 1,750,000 | 490,167 | — | 59,442 | 2,692,957 | ||||||||||||||||||||||
| Todd Thompson, Former Chief Information Officer |
2014 | 257,500 | — | 5,236 | — | 484,037 | 746,773 | |||||||||||||||||||||
| (1) | Effective January 1, 2014, the base salary of each of Messrs. Eyring and Santiago was increased from $500,000 to $515,000. In addition, effective January 1, 2014, the base salary of Mr. Thompson was increased from $300,000 to $309,000. Mr. Thompson’s salary in the table above reflects that portion of his annual base salary earned in fiscal 2014 through his resignation date. |
| (2) | Amounts reported in this column for 2012 and 2014 for Mr. Dunn include payments pursuant to his retention bonus agreement as follows: $9,639,998 paid in 2012 and $276,342 paid in 2014. Amount reported in this column for 2014 for Mr. Davies represents the payment of the second installment of his sign-on bonus in the amount of $500,000 and his annual discretionary bonus earned with respect to 2014 in the amount of $234,500. Amounts reported in this column for 2014 for Messrs. Eyring and Santiago reflect their annual discretionary bonuses earned with respect to fiscal 2014. |
| (3) | Amounts included in this column form Messrs. Pedersen, Davies, Dunn, Eyring and Santiago reflect the aggregate grant date fair value of the Class B Units granted during each of the years presented calculated in accordance with Financial Accounting Standards Board Accounting Standards Codification Topic 718, Compensation-Stock Compensation (“FASB ASC Topic 718”). Achievement of the performance conditions for the exit-vesting portions of the Class B Units was not deemed probable on the date of grant, and, accordingly, pursuant to the SEC’s disclosure rules, no value is included in this table for those portions of the awards. The fair value at the grant date of the Class B Units granted to Mr. Davies in fiscal 2014 assuming achievement of the performance conditions was $975,522. The fair value at grant date of the Class B Units granted in 2013 assuming achievement of the performance conditions was $1,182,167 for each of Messrs. Eyring and Santiago. The fair value at grant date of the Class B Units granted in 2012 assuming achievement of the performance conditions was $7,824,823 for each of Messrs. Pedersen and Dunn. The terms of these units are summarized under “Compensation Discussion and Analysis-Compensation Elements-Long-Term Incentive Compensation” above and under “Narrative Disclosure to Summary Compensation Table and Grants of Plan-Based Awards Table-Equity Awards” and “Potential Payments Upon Termination or Change in Control” below. Amount included in this column for Mr. Thompson reflects the incremental fair value computed in accordance with FASB ASC Topic 718 in connection Parent’s agreement to waive its call rights with respect to Mr. Thompson’s 46,690 Class B Units that were vested as of the date of his departure. See “Potential Payments Upon Termination or Change in Control” below. For a discussion of the assumptions used to calculate the amounts reported in this column for 2014, please see footnote 15 to our audited consolidated financial statements included in this annual report on Form 10-K. |
| (4) | Amounts reported in this column for 2014 for Messrs. Pedersen and Dunn reflect amounts earned under the fiscal 2014 annual cash incentive plan. See “Compensation Discussion and Analysis-Compensation Elements-Bonuses.” |
| (5) | Amounts reported under All Other Compensation for fiscal 2014 reflect the following: |
| (a) | as to Mr. Pedersen, $300,000 additional cash compensation paid to Mr. Pedersen pursuant to his employment agreement (see “Narrative Disclosure to Summary Compensation Table and Grants of Plan Based Awards-Employment Agreements”), reimbursement for health insurance premiums, country club membership fees, $53,058 in actual Company expenditures for use, including business use, of a Company car, $132,363 in actual Company expenditures for financial advisory services provided to Mr. Pedersen, other miscellaneous personal benefits and $138,028 reimbursed for taxes with respect to perquisites. In addition, Mr. Pedersen reimburses the Company for the aggregate variable costs associated with his personal use of the Company leased aircraft in accordance with the time-sharing agreement described under “Compensation Discussion and Analysis-Compensation Elements-Benefits and Perquisites.” While maintenance costs are not included in the reimbursement amount under the time-sharing agreement, the Company has determined it is appropriate to allocate a portion of the maintenance costs when calculating the aggregate incremental cost associated with personal use of the Company aircraft for purposes of SEC disclosure. Therefore, amounts reported also reflect $40,766 in maintenance costs allocated on the basis of the proportion of personal use. In addition, family members of Mr. Pedersen have, in limited circumstances, accompanied him on business travel on the Company leased aircraft for which we incurred de minimis incremental costs; |
| (b) | as to Mr. Davies, actual Company expenditures for use, including business use, of a Company car, the value of meals in the Company cafeteria, reimbursement for health insurance premiums, other miscellaneous personal benefits and $12,653 reimbursed for taxes owed with respect to perquisites; |
| (c) | as to Mr. Dunn, $300,000 additional cash compensation paid to Mr. Dunn pursuant to his employment agreement (see “Narrative Disclosure to Summary Compensation Table and Grants of Plan Based Awards-Employment Agreements”), reimbursement for health insurance premiums, the value of meals in the Company cafeteria, country club membership fees, $80,891 in actual Company expenditures for use, including business use, of a Company car, $132,363 in actual Company expenditures for financial advisory services provided to Mr. Dunn, other miscellaneous personal benefits and $163,028 reimbursed for taxes with respect to perquisites. In addition, Mr. Dunn reimburses the Company for the aggregate variable costs associated with his personal use of the Company leased aircraft in accordance with the time-sharing agreement described under “Compensation Discussion and Analysis-Compensation Elements-Benefits and Perquisites.” As discussed in footnote 6(a) above, amounts reported reflect a similar allocation of $40,613 in maintenance costs associated with Mr. Dunn’s personal use of the Company leased aircraft. In addition, family members of Mr. Dunn have, in limited circumstances, accompanied him on business travel on the Company leased aircraft for which we incurred de minimis incremental costs; |
116
Table of Contents
| (d) | as to Mr. Eyring, actual Company expenditures for use, including business use, of a Company car, the value of meals in the Company cafeteria, country club membership fees, other miscellaneous personal benefits and $10,871 reimbursed for taxes owed with respect to perquisites; |
| (e) | as to Mr. Santiago, actual Company expenditures for use, including business use, of a Company car, the value of meals in the Company cafeteria, country club membership fees, other miscellaneous personal benefits and $22,886 reimbursed for taxes owed with respect to perquisites. In addition, family members of Mr. Santiago have, in limited circumstances, accompanied him on business travel on the Company leased aircraft for which we incurred de minimis incremental costs. |
| (f) | as to Mr. Thompson, $433,763 in connection with his resignation (including, pursuant to his separation agreement, $342,500 in cash severance and $74,367 with respect to the transfer of legal title and ownership of Mr. Thompson’s Company owned vehicle to him, which amount reflects the value of the vehicle on the date of transfer, amounts with respect to the retainment of a Company-issued cell phone and iPad, and payment for accrued but unused vacation days), reimbursement for health insurance premiums, the value of meals in the Company cafeteria, actual Company expenditures for use, including business use, of a Company car, other miscellaneous personal benefits and $37,483 reimbursed for taxes with respect to perquisites. |
Grants of Plan-Based Awards in 2014
The following table provides supplemental information relating to grants of plan-based awards made to our named executive officers during 2014.
| Grant Date |
Estimated Future Payouts Under Non-Equity Incentive Plan Awards |
Estimated Future Payouts Under Equity Incentive Plan Awards(1) |
All Other Stock Awards: Number of Shares of Stock or Units (#)(1) |
Grant Date Fair Value of Stock and Option Awards ($)(2) |
||||||||||||||||||||||||||||||||
| Name |
|
Threshold ($) |
Target ($) |
Maximum ($) |
Threshold (#) |
Target (#) |
Maximum (#) |
|
|
|||||||||||||||||||||||||||
| Todd Pedersen |
— | 250,000 | 500,000 | 1,250,000 | — | — | — | — | — | |||||||||||||||||||||||||||
| Mark Davies |
3/3/2014 | — | — | — | — | 2,883,333 | — | 1,441,667 | 398,856 | |||||||||||||||||||||||||||
| Alex Dunn |
— | 250,000 | 500,000 | 1,250,000 | — | — | — | — | — | |||||||||||||||||||||||||||
| Matt Eyring |
— | — | — | — | — | — | — | — | — | |||||||||||||||||||||||||||
| Todd Santiago |
— | — | — | — | — | — | — | — | — | |||||||||||||||||||||||||||
| Todd Thompson |
9/3/2014 | — | — | — | — | — | 46,690 | 5,236 | ||||||||||||||||||||||||||||
| (1) | As described in more detail in the “Narrative Disclosure to Summary Compensation Table and Grants of Plan-Based Awards-Equity Awards” section that follows, amounts reported reflect grants of Class B Units that are divided into three tranches for vesting purposes: one third are time-vesting, one-third are 2.0x exit-vesting and one-third are 3.0x exit-vesting. All of the exit-vesting units are reported as an equity incentive plan award in the “Estimated Future Payouts Under Equity Incentive Plan Awards” column, while the time-vesting tranche of the awards are reported as an all other stock award in the “All Other Stock Awards: Number of Shares of Stock or Units” column. |
| (2) | Amount included in this column for Mr. Davies represents the grant date fair value of the Class B Units granted to him calculated in accordance with FASB ASC Topic 718. The value at the grant date for the exit-vesting portions of the Class B Units is based upon the probable outcome of the performance conditions. See footnote (3) to the Summary Compensation Table. Amount included in this column for Mr. Thompson reflects the incremental fair value computed in accordance with FASB ASC Topic 718 in connection Parent’s agreement to waive its call rights with respect to Mr. Thompson’s 46,690 Class B Units that were vested as of the date of his departure. See “Potential Payments Upon Termination or Change in Control” below. For a discussion of the assumptions used to calculate the amounts reported in this column, please see footnote 15 to our audited consolidated financial statements included in this annual report on Form 10-K. |
Narrative Disclosure to Summary Compensation Table and Grants of Plan-Based Awards
Employment Agreements
The employment agreements with our Chief Executive Officer (CEO), Todd Pedersen, and our President, Alex Dunn, contain substantially similar terms. The principal terms of each of these agreements are summarized below, except with respect to potential payments and other benefits upon specified terminations, which are summarized below under “Potential Payments Upon Termination or Change in Control.”
Each employment agreement was entered into on August 7, 2014, provides for a term ending on November 16, 2017 and extends automatically for additional one-year periods unless either party elects not to extend the term. Under the employment agreements, each executive is eligible to receive a minimum base salary, specified below, and an annual bonus based on the achievement of specified financial goals for fiscal years 2013 and beyond. If these goals are achieved, the executive may receive an annual incentive cash bonus equal to a percentage of his base salary as provided below.
Mr. Pedersen’s employment agreement provides that he is to serve as CEO and is eligible to receive a base salary of $500,000, subject to periodic adjustments as may be approved by our Board of Directors. Mr. Pedersen is also eligible to receive a target bonus of 100% of his annual base salary at the end of the fiscal year if targets established by the Board of Directors are achieved.
Mr. Dunn’s employment agreement provides that he is to serve as President and is eligible to receive a base salary of $500,000, subject to periodic adjustments as may be approved by our Board of Directors. Mr. Dunn is also eligible to receive a target bonus of 100% of his annual base salary at the end of the fiscal year if targets established by the Board of Directors are achieved.
The employment agreements contain the method for determining the bonus of Messrs. Pedersen and Dunn for any given year. The agreements provide that the calculation of any bonus will be determined based on the achievement of performance objectives, with targets for “threshold,” “target,” and “high” achievement of the specified objectives as further described under “Compensation Discussion and Analysis-Compensation Elements-Bonuses.”
117
Table of Contents
In addition, each employment agreement provides for the following:
| • | Reasonable personal use of the company airplane, subject to reimbursement by the executive of an amount determined on a basis consistent with IRS guidelines; |
| • | An annual payment equal to $300,000 per year, subject to all applicable taxes and withholdings, intended to be used to reimburse the Company for the costs of the executive’s personal use of the company airplane; and |
| • | Access to a financial advisor to provide the executive with customary financial advice, subject to a combined aggregate cap of $250,000 on such professional fees for Messrs. Pedersen and Dunn. |
Each executive officer is also entitled to participate in all employee benefit plans, programs and arrangements made available to other executive officers generally.
Each of the employment agreements also contains restrictive covenants, including an indefinite covenant on confidentiality of information, and covenants related to non-competition and non-solicitation of our employees and customers and affiliates at all times during employment, and for two years after any termination of employment. These covenants are substantially the same as the covenants Messrs. Pedersen and Dunn agreed to in connection with their receipt of Class B Units summarized below under “Narrative Disclosure to Summary Compensation Table and Grants of Plan-Based Awards—Equity Awards—Restrictive Covenants.”
Equity Awards
As a condition to receiving his Class B Units, each named executive officer was required to enter into a subscription agreement with us and Parent and to become a party to the limited liability company agreement of Parent as well as a securityholders agreement. These agreements generally govern the named executive officer’s rights with respect to the Class B units and contain certain rights and obligations of the parties thereto with respect to vesting, governance, distributions, indemnification, voting, transfer restrictions and rights, including put and call rights, tag-along rights, drag-along rights, registration rights and rights of first refusal, and certain other matters.
Vesting Terms
Only vested Class B units are entitled to distributions. The Class B units are divided into a time-vesting portion (1/3 of the Class B Units granted), a 2.0x exit-vesting portion (1/3 of the Class B Units granted), and a 3.0x exit-vesting portion (1/3 of the Class B Units granted).
| • | Time-Vesting Units: Twelve months after the initial “vesting reference date,” as defined in the applicable subscription agreement, 20% of the named executive officer’s time-vesting Employee Units will vest, subject to continued employment through such date. The “vesting reference date” for Messrs. Pedersen and Dunn is November 16, 2012, the date of the grant of their Class B Units. The “vesting reference” date for the Class B Units granted to Messrs. Eyring and Santiago on August 12, 2013 is also November 16, 2012 and the “vesting reference date” for the Class B Units granted to Mr. Davies is November 4, 2013, which is the date he commenced employment with us. Thereafter, an additional 20% of the named executive officer’s time-vesting Class B Units will vest every year until he is fully vested, subject to his continued employment through each vesting date. Notwithstanding the foregoing, the time-vesting Class B Units will become fully vested upon a change of control (as defined in the securityholders agreement) that occurs while the named executive officer is still employed by us. In addition, as to Messrs. Pedersen and Dunn, the time-vesting Class B Units will also continue to vest for one year following a termination by Parent without “cause” (excluding by reason of death or disability) or resignation by the executive for “good reason,” each as defined in the executive’s employment agreement (any such termination, a “qualifying termination”). |
| • | 2.0x Exit-Vesting Units: The 2.0x exit-vesting Class B Units vest if the named executive officer is employed by us when and if Blackstone receives cash proceeds in respect of its Class A units in the Company equal to (x) a return equal to 2.0x Blackstone’s cumulative invested capital in respect of the Class A Units and (y) an annual internal rate of return of at least 20% on Blackstone’s cumulative invested capital in respect of its Class A Units. In addition, as to Messrs. Pedersen and Dunn, the 2.0x exit-vesting Class B Units will remain eligible to vest for one year following a qualifying termination if a change of control occurs during such one-year period and, as a result of such change of control, the 2.0x exit-vesting conditions are met. |
| • | 3.0 Exit-Vesting Units: The 3.0x exit-vesting Class B Units vest if the named executive officer is employed by us when and if Blackstone receives cash proceeds in respect of its Class A units in the Company equal to (x) a return equal to 3.0x Blackstone’s cumulative invested capital in respect of the Class A Units and (y) an annual internal rate of return of at least 25% on Blackstone’s cumulative invested capital in respect of its Class A Units. In addition, as to Messrs. Pedersen and Dunn, the 3.0x exit-vesting Class B Units will remain eligible to vest for one year following a qualifying termination if a change of control occurs during such one-year period and, as a result of such change of control, the 3.0x exit-vesting conditions are met. |
Other than as described above with respect to Messrs. Pedersen and Dunn and below with respect to Mr. Thompson, any Class B Units that have not vested as of the date of termination of a named executive officer’s employment will be immediately forfeited.
118
Table of Contents
Put Rights
Prior to an initial public offering, if an executive officer’s employment is terminated due to death or disability, such executive has the right, subject to specified limitations and for a specified period following the termination date, to cause the Company to purchase on one occasion all, but not less than all, of such executive’s vested Class B Units, in either case, at the fair market value of such units.
Call Rights Regarding Messrs. Pedersen’s and Dunn’s Class B Units
If Messrs. Pedersen or Dunn is terminated for any reason, or in the event of a restrictive covenant violation, the Company has the right, for a specified period following the termination of such executive’s employment, to purchase all of such executive’s vested Class B units as follows:
| Triggering Event |
Call Price |
Put Price | ||
| Death or Disability |
fair market value | fair market value | ||
| Termination With Cause or Voluntary Resignation When Grounds Exist for Cause |
lesser of (a) fair market value and (b) cost |
N/A | ||
| Termination Without Cause or Resignation For Good Reason |
fair market value | N/A | ||
| Voluntary Resignation Without Good Reason Prior to November 16, 2014 |
lesser of (a) fair market value and (b) cost |
N/A | ||
| Voluntary Resignation on or After November 16, 2014 |
fair market value | N/A | ||
| Restrictive Covenant Violation |
lesser of (a) fair market value and (b) cost | N/A |
Call Rights Regarding Other Executive Officers’ Class B Units
With respect to our other executive officers, if the executive officer is terminated for any reason, in the event of a restrictive covenant violation or if the executive engages in any conduct that would be a violation of a restrictive covenant set forth in the executive’s management unit subscription agreement but for the fact that the conduct occurred outside the relevant periods (any such conduct a “Competitive Activity”), then the Company has the right, for a specified period following the termination of such executive’s employment, to purchase all of such executive’s vested Class B units as follows:
| Triggering Event |
Call Price |
Put Price | ||
| Death or Disability |
fair market value | fair market value | ||
| Termination With Cause or Voluntary Resignation When Grounds Exist for Cause |
lesser of (a) fair market value and (b) cost | N/A | ||
| Termination Without Cause |
fair market value | N/A | ||
| Voluntary Resignation Prior to November 16, 2014, or, if Later, the Second Anniversary of Date of Hire |
lesser of (a) fair market value and (b) cost | N/A | ||
| Voluntary Resignation on or After November 16, 2014, or, if Later, the Second Anniversary of Date of Hire |
fair market value | N/A | ||
| Restrictive Covenant Violation |
lesser of (a) fair market value and (b) cost | N/A | ||
| Competitive Activity Not Constituting a Restrictive Covenant Violation |
fair market value | N/A |
Restrictive Covenants
In addition, as a condition of receiving their units in Parent, our executive officers have agreed to specified restrictive covenants, including an indefinite covenant on confidentiality of information, and covenants related to non-disparagement, non-competition and non-solicitation of our employees and customers and affiliates at all times during the named executive officer’s employment, and for specified periods after any termination of employment as set forth in the subscription agreement (two years for Messrs. Pedersen and Dunn and one-year non-compete and non-solicit periods and a three-year non-disparagement period for each of our other executive officers).
Additional terms regarding the equity awards are summarized above under “Compensation Discussion and Analysis—Compensation Elements—Long-Term Equity Compensation” and under “Potential Payments Upon Termination or Change in Control” below.
119
Table of Contents
Outstanding Equity Awards at 2014 Fiscal Year-End
The following table provides information regarding outstanding equity awards for our named executive officers as of December 31, 2014. The equity awards held by the named executive officers are Class B Units, which represent an equity interest in Parent.
| Equity Awards | ||||||||||||||||||||
| Name |
Grant Date | Number
of Shares or Units That Have Not Vested (#)(1) |
Market Value of Shares or Units That Have Not Vested ($)(2) |
Equity Incentive Plan Awards: Number of Unearned Shares, Units or Other Rights That Have Not Vested (#)(3) |
Equity Incentive Plan Awards: Market or Payout Value of Unearned Shares, Units or Other Rights That Have Not Vested (#)(2) |
|||||||||||||||
| Todd Pedersen |
11/16/2012 | 4,648,410 | — | 15,494,699 | — | |||||||||||||||
| Mark Davies |
3/3/2014 | 1,153,333 | — | 2,883,333 | — | |||||||||||||||
| Alex Dunn |
11/16/2012 | 4,648,410 | — | 15,494,699 | — | |||||||||||||||
| Matt Eyring |
7/12/2013 | 865,000 | — | 2,883,333 | — | |||||||||||||||
| Todd Santiago |
7/12/2013 | 865,000 | — | 2,883,333 | — | |||||||||||||||
| Todd Thompson (4) |
— | — | — | — | — | |||||||||||||||
| (1) | Reflects the number of time-vesting Class B Units of Parent, which vest 20% over a five year period on each anniversary of the November 16, 2012 or the applicable vesting reference date, subject to the executive’s continued employment on such date. Additional terms of these time-vesting units are summarized under “Compensation Discussion and Analysis—Compensation Elements—Long-Term Equity Compensation,” “Narrative Disclosure to Summary Compensation Table and Grants of Plan Based Awards Table—Equity Awards” and “Potential Payments Upon Termination or Change in Control.” |
Vesting of the time-vesting Class B Units will be accelerated upon a change of control that occurs while the executive is still employed by us and, as to Messrs. Pedersen and Dunn, will also continue to vest for one year following a qualifying termination, each as described under “Narrative Disclosure to Summary Compensation Table and Grants of Plan-Based Awards—Equity Awards.”
| (2) | Because there was no public market for the Class B Units of Parent as of December 31, 2014, the market value of such units was not determinable as of such date. |
| (3) | Reflects exit-vesting Class B Units (of which one-half are 2.0x exit-vesting and one-half are 3.0x exit-vesting). Unvested exit-vesting Class B units vest as described under the “Narrative Disclosure to Summary Compensation Table and Grants of Plan-Based Awards—Equity Awards” section above. As to Messrs. Pedersen and Dunn, the 2.0x and 3.0x exit-vesting Class B Units will remain eligible to vest for one year following a qualifying termination if a change of control occurs during such one-year period and, as a result of such change of control, the respective exit-vesting conditions are met, each as described under “Narrative Disclosure to Summary Compensation Table and Grants of Plan-Based Awards—Equity Awards.” |
| (4) | As described below under “Potential Payments Upon Termination or Change in Control,” in connection with Mr. Thompson’s resignation, Parent agreed to waive its call rights with respect to the 46,690 Class B Units that were vested as of the date of his departure. All other Class B Units that were not vested upon his departure were immediately forfeited. |
120
Table of Contents
Option Exercises and Stock Vested in 2014
The following table provides information regarding the equity held by our named executive officers that vested during 2014.
| Option Awards | Equity Awards | |||||||||||||||
| Name |
Number of Shares or Units Acquired on Exercise (#) |
Value Realized on Exercise ($)(1) |
Number of Shares or Units Acquired on Vesting (#) |
Value Realized on Vesting ($) |
||||||||||||
| Todd Pedersen |
— | — | 1,549,470 | (3 | ) | |||||||||||
| Mark Davies |
— | — | 288,333 | (3 | ) | |||||||||||
| Alex Dunn(1) |
— | 138,391 | 1,549,470 | (3 | ) | |||||||||||
| Matt Eyring |
— | — | 288,333 | (3 | ) | |||||||||||
| Todd Santiago(2) |
— | 356,111 | 288,333 | (3 | ) | |||||||||||
| Todd Thompson |
— | — | 46,690 | (3 | ) | |||||||||||
| (1) | In November 2012, an entity controlled by Mr. Dunn exercised an option to purchase 1,250 shares of preferred stock and common stock of APX Group, Inc. and Solar from the Company’s founders, which shares were then cashed out in connection with Transactions based on the difference between the change in control price and the option’s exercise price. A portion of the cash proceeds was held in escrow in order to cover potential post-closing purchase price adjustments and indemnification claims. The amount reported reflects the cash proceeds released from escrow and paid to Mr. Dunn in 2014. |
| (2) | In connection with the Transactions, all outstanding unvested options to acquire APX Group, Inc. and 2GIG common stock were vested in full and cashed out based on the difference between the change in control price and the option’s exercise price. A portion of the cash proceeds was held in escrow in order to cover potential post-closing purchase price adjustments and indemnification claims. The amount reported reflects the cash proceeds released from escrow and paid to Mr. Santiago in 2014 with respect to his 2GIG options. |
| (3) | Because there was no public market for the Class B Units of Parent as of December 31, 2014, the market value of such units on the vesting date was not determinable. |
Pension Benefits
We have no pension benefits for our executive officers.
Nonqualified Deferred Compensation for 2014
We have no nonqualified defined contribution or other nonqualified deferred compensation plans for our executive officers.
121
Table of Contents
Potential Payments Upon Termination or Change in Control
The following section describes the potential payments and benefits that would have been payable to our named executive officers under existing plans and contractual arrangements assuming (1) a termination of employment and/or (2) a change of control occurred, in each case, on December 31, 2014, the last business day of fiscal 2014. The amounts shown in the table do not include payments and benefits to the extent they are provided generally to all salaried employees upon termination of employment and do not discriminate in scope, terms or operation in favor of the named executive officers. These include distributions of plan balances under our 401(k) savings plan and similar items.
Messrs. Pedersen and Dunn
Pursuant to their respective employment agreements, if Mr. Pedersen’s or Mr. Dunn’s employment terminates for any reason, the executive is entitled to receive: (1) any base salary accrued through the date of termination; (2) any annual bonus earned, but unpaid, as of the date of termination; (3) reimbursement of any unreimbursed business expenses properly incurred by the executive; and (4) such employee benefits, if any, as to which the executive may be entitled under our employee benefit plans (the payments and benefits described in (1) through (4) being “accrued rights”).
If the employment of Messrs. Pedersen and Dunn is terminated by us without “cause” (as defined below) (other than by reason of death or while he is disabled) or if either executive resigns with “good reason” (as defined below) (any such termination, a “qualifying termination”), such executive is entitled to the accrued rights and, conditioned upon execution and non-revocation of a release and waiver of claims in favor of us and our affiliates, and continued compliance with the non-compete, non-solicitation, non-disparagement, and confidentiality provisions set forth in the employment agreements and described above under “Narrative Disclosure to Summary Compensation Table and Grants of Plan-Based Awards”:
| • | a pro rata portion of his target annual bonus based upon the portion of the fiscal year during which the executive was employed (the “pro rata bonus”); |
| • | a lump-sum cash payment equal to 200% of the executive’s then-current base salary plus 200% of the actual bonus the executive received in respect of the immediately preceding fiscal year (or, if a termination of employment occurs prior to any annual bonus becoming payable under his employment agreement, the target bonus for the immediately preceding fiscal year); and |
| • | a lump-sum cash payment equal to the cost of the health and welfare benefits for the executive and his dependents, at the levels at which the executive received benefits on the date of termination, for two years (the “COBRA payment”). |
Under the employment agreements for Messrs. Pedersen and Dunn, “cause” means the executive’s continued failure to substantially perform his employment duties for a period of ten (10) days; any dishonesty in the performance of the executive’s employment duties that is materially injurious to us; act(s) on the executive’s part constituting either a felony or a misdemeanor involving moral turpitude; the executive’s willful malfeasance or misconduct in connection with his employment duties that causes substantial injury to us; or the executive’s material breach of any covenants set forth in the employment agreements, including the restrictive covenants set forth therein. A termination for “good reason” is deemed to occur upon specified events, including: a material reduction in the executive’s base salary; a material reduction in the executive’s authority or responsibilities; specified relocation events; or our breach of any of the provisions of the employment agreements. Each of the foregoing events is subject to specified notice and cure periods.
In the event of the executive’s termination of employment due to death or disability, he will only be entitled to the accrued rights, the pro rata bonus payment, and the COBRA payment.
The following table lists the payments and benefits that would have been triggered for Messrs. Pedersen and Dunn under the circumstances described below assuming that the applicable triggering event occurred on December 31, 2014.
| Name |
Cash Severance ($)(1) |
Prorated Bonus ($)(2) |
Continuation of Health Benefits ($)(3) |
Accrued But Unused Vacation ($)(4) |
Value of Accelerated Equity ($)(5) |
Total ($) |
||||||||||||||||||
| Todd Pedersen |
||||||||||||||||||||||||
| Termination Without Cause or for Good Reason |
2,100,000 | 500,000 | 27,785 | 47,346 | — | 2,675,131 | ||||||||||||||||||
| Change of Control |
— | — | — | — | — | — | ||||||||||||||||||
| Death or Disability |
— | 500,000 | 27,785 | 47,346 | — | 575,131 | ||||||||||||||||||
| Alex Dunn |
||||||||||||||||||||||||
| Termination Without Cause or for Good Reason |
2,100,000 | 500,000 | 27,785 | 37,879 | — | 2,665,664 | ||||||||||||||||||
| Change of Control |
— | — | — | — | — | — | ||||||||||||||||||
| Death or Disability |
— | 500,000 | 27,785 | 37,879 | — | 565,664 | ||||||||||||||||||
| (1) | Cash severance reflects a lump sum cash payment equal to the sum of (x) 200% of the executive’s base salary of $500,000 and (y) 200% of the executive’s respective actual bonus for the preceding year. For fiscal 2013, Mr. Pedersen received an annual bonus of $550,000 and Mr. Dunn received an annual bonus of $550,000. |
122
Table of Contents
| (2) | Reflects the executive’s target bonus of for the twelve complete months of employment for the 2014 fiscal year. |
| (3) | Reflects the cost of providing the executive officer with continued health and welfare benefits for the executive and his dependents under COBRA for two years and assuming 2015 rates. |
| (4) | Amounts reported in this column reflect the following number of accrued but unused vacation days: Mr. Pedersen, 25 days and Mr. Dunn, 20 days. |
| (5) | Upon a change of control each of Messrs. Pedersen’s and Dunn’s unvested time-vesting Class B Units would become immediately vested. However, because there was no public market for the Class B Units as of December 31, 2014, the market value of such Class B Units was not determinable. In addition, the unvested 2.0x and 3.0x exit-vesting Class B Units would vest upon a change of control if the applicable exit-vesting hurdles were met. Amounts reported assume that the exit-vesting Class B Units do not vest upon a change of control. |
Messrs. Davies, Eyring and Santiago
If Messrs. Davies, Eyring and Santiago had terminated employment as of December 31, 2014 for any reason, they would have only been entitled to receive their respective accrued by unused vacation as follows: Mr. Davies, $22,728 for 12 accrued but unused vacation days, Mr. Eyring, $29,261 for 15 accrued but unused vacation days and Mr. Santiago, $29,261 for 15 accrued but unused vacation days.
Upon a change of control all of Messrs. Davies’, Eyring’s and Santiago’s unvested time-vesting Class B Units would become immediately vested. However, because there was no public market for the Class B Units as of December 31, 2014, the market value of such Class B Units was not determinable. In addition, the unvested 2.0x and 3.0x exit-vesting Class B Units would vest upon a change of control if the applicable exit-vesting hurdles were met. We have assumed that the exit-vesting Class B Units do not vest upon a change of control.
In addition, as described above under “Narrative Disclosure to Summary Compensation Table and Grants of Plan-Based Awards—Equity Awards—Restrictive Covenants,” as a condition of receiving their units in Parent, Messrs. Davies, Eyring and Santiago agreed to specified restrictive covenants for specified periods upon a termination of employment, including an indefinite covenant on confidentiality of information, and one-year non-competition and non-solicitation covenants and a three-year non-disparagement covenant.
Mr. Thompson’s Resignation
Mr. Thompson resigned from his employment with us as Chief Information Officer effective October 31, 2014. In connection with Mr. Thompson’s resignation, we entered into a separation agreement with him pursuant to which, in exchange for his execution and non-revocation of a release and waiver of claims in favor of us and our affiliates, we agreed to (1) pay him a lump sum cash amount equal to $342,500 (which amount represented 10 months of base salary ($257,500) and the approximate closing costs for a real estate transaction involving the sale of Mr. Thompson’s residence in connection with his relocation to Provo, Utah ($85,000)), (2) transfer legal title and ownership of Mr. Thompson’s Company owned vehicle to him, which vehicle was worth $74,367 on the date of transfer and (3) allow him to retain his Company-issued cell phone and iPad. In addition, Parent agreed to waive its call rights with respect to the 46,690 Class B Units that were vested as of the date of his departure. All other Class B Units that were not vested upon his departure were immediately forfeited. The foregoing payments and benefits are contingent on Mr. Thompson’s compliance with certain restrictive covenants for specified periods, including an indefinite covenant on confidentiality of information and non-disparagement, and one-year non-competition and non-solicitation covenants. In connection with his resignation, Mr. Thompson also received $16,471 for 14 accrued but unused vacation days.
123
Table of Contents
Director Compensation
The members of our Board of Directors other than David D’Alessandro, who was elected to the Board of Directors in fiscal 2013, received no additional compensation for serving on the Board of Directors or our Audit Committee during 2014.
In connection with Mr. D’Alessandro’s election, the Company entered into a letter agreement setting forth the compensation terms related to his service on the Board of Directors. Pursuant to the letter agreement, the Company will pay an annual retainer of $150,000 per year, and Mr. D’Alessandro will not be eligible for any bonus amounts or be eligible to participate in any of the Company’s employee benefit plans.
In addition, in 2013, an affiliate of Mr. D’Alessandro was granted 500,000 Class B Units, which are similar to the Class B Units granted to the named executive officers. The Class B Units are divided into a time-vesting portion (one-third of the Class B Units granted), a 2.0x exit-vesting portion (one-third of the Class B Units granted), and a 3.0x exit-vesting portion (one-third of the Class B Units granted). The vesting terms of these units are substantially similar to the Class B Units previously granted to our named executive officers and are described under “Narrative to Summary Compensation Table and Grants of Plan-Based Awards—Equity Awards” and the “vesting reference date” is July 18, 2013. However, if Mr. D’Alessandro ceases to serve on the Board of Directors, all unvested time-vesting Class B Units will be forfeited, and a percentage of the exit-vesting Class B Units will be forfeited with such percentage equal to 100% prior to July 31, 2014, 80% prior to July 31, 2015, 60% prior to July 31, 2016, 40% prior to July 31, 2017, 20% prior to July 31, 2018 and 0% on or after July 31, 2018.
The following table provides information on the compensation of our non-management directors in fiscal 2014.
| Name |
Fees Earned or Paid in Cash |
Stock Awards ($)(1) |
Option Awards ($) |
Non-Equity Incentive Plan Compensation ($) |
Change in Pension Value and Nonqualified Deferred Compensation Earnings ($) |
All Other Compensation ($) |
Total ($) |
|||||||||||||||||||||
| David F. D’Alessandro |
$ | 150,000 | $ | — | $ | — | $ | — | $ | — | $ | — | $ | 150,000 | ||||||||||||||
| Bruce McEvoy(2) |
— | — | — | — | — | — | — | |||||||||||||||||||||
| Joseph Trustey(2) |
— | — | — | — | — | — | — | |||||||||||||||||||||
| Peter Wallace(2) |
— | — | — | — | — | — | — | |||||||||||||||||||||
| (1) | As of December 31, 2014, Mr. D’Alessandro held 133,334 unvested time-vesting Class B Units and 333,333 unvested Class B Units subject to exit-vesting criteria. . |
| (2) | Employees of Blackstone and Summit Partners do not receive any compensation from us for their services on our Board of Directors. |
| ITEM 12. | SECURITY OWNERSHIP OF CERTAIN BENEFICIAL OWNERS AND MANAGEMENT AND RELATED STOCKHOLDER MATTERS |
Acquisition LLC owns 99.7% of the issued and outstanding shares of common stock of APX Parent Holdco, Inc., which, in turn, owns 100% of the issued and outstanding shares of common stock of Parent Guarantor, which, in turn owns 100% of the issued and outstanding shares of common stock of the Issuer.
124
Table of Contents
The following table sets forth certain information as of December 31, 2014 with respect to Class A limited liability company interests in Acquisition LLC (“Class A Units”) beneficially owned by (i) each person known by us to be the beneficial owner of more than 5% of the outstanding Class A Units, (ii) each of our directors, (iii) each of our named executive officers and (iv) all of our directors and executive officers as a group.
The amounts and percentages of shares of Class A Units beneficially owned are reported on the basis of SEC regulations governing the determination of beneficial ownership of securities. Under SEC rules, a person is deemed to be a “beneficial owner” of a security if that person has or shares voting power or investment power, which includes the power to dispose of or to direct the disposition of such security. A person is also deemed to be a beneficial owner of any securities of which that person has a right to acquire beneficial ownership within 60 days. Securities that can be so acquired are deemed to be outstanding for purposes of computing such person’s ownership percentage, but not for purposes of computing any other person’s percentage. Under these rules, more than one person may be deemed to be a beneficial owner of the same securities and a person may be deemed to be a beneficial owner of securities as to which such person has no economic interest.
Except as indicated in the footnotes to the table, each of the unitholders listed below has sole voting and investment power with respect to Class A Units owned by such unitholder. Unless otherwise noted, the address of each beneficial owner of is c/o APX Group, Inc. 4931 North 300 West, Provo, Utah 84604.
| Class A Units | ||||||||
| Name and Address of Beneficial Owner |
Amount and Nature of Beneficial Ownership |
Percent of Class | ||||||
| Principal Unitholders: |
||||||||
| Blackstone Funds(1)(2) |
579,077,203 | 73 | % | |||||
| Summit Funds(1)(3) |
50,000,000 | 6 | % | |||||
| Directors and Named Executive Officers(4): |
||||||||
| Todd Pedersen |
96,479,649 | 12 | % | |||||
| Alex Dunn |
9,000,000 | 1 | % | |||||
| David F. D’Alessandro |
— | — | ||||||
| Bruce McEvoy(5) |
— | — | ||||||
| Joseph Trustey |
— | — | ||||||
| Peter Wallace(5) |
— | — | ||||||
| Mark Davies |
— | — | ||||||
| Matt Eyring |
— | — | ||||||
| Todd Santiago |
1,500,000 | * | ||||||
| All Directors and Executive Officers as a Group (16 persons) |
108,504,649 | 14 | % | |||||
| * | Indicates less than 1% |
| (1) | The limited liability company agreement of Acquisition LLC (the “LLC Agreement”) provides that the business and affairs of Acquisition LLC will be managed by the Board of Directors, initially comprised of five members, three of whom will be appointed by Blackstone, one of whom will be appointed by Mr. Pedersen, and one of whom will be appointed by the Summit Funds, and Blackstone Capital Partners VI L.P. (“BCP VI”) acting as managing member (in such capacity, the “Managing Member”). The Managing Member is an affiliate of Blackstone and will have the ability to appoint its own successor if it resigns its position as Managing Member. Effective July 30, 2013, the Managing Member increased the size of the Board of Directors from five to six members and appointed Mr. D’Alessandro to the Board of Directors. Pursuant to the LLC Agreement, Members of Acquisition LLC, including employee members, will be deemed to have voted their respective limited liability company interests in Acquisition LLC in favor of all actions taken by the Board of Directors and the Managing Member. The Managing Member, the Blackstone entities described below, and Stephen A. Schwarzman may be deemed to beneficially own all the outstanding shares of common stock of the Issuer indirectly beneficially owned by Acquisition LLC, directly held by its wholly owned indirect subsidiary Parent Guarantor and all of the limited liability company interests in Acquisition LLC. Each of the Managing Member, such Blackstone entities and Mr. Schwarzman disclaim beneficial ownership of such shares of common stock of the Issuer and limited liability company interests in Acquisition LLC (other than the Blackstone Funds to the extent of their direct holdings). |
| (2) | Represents (i) 436,112,143.59 Class A Units directly held by BCP VI, (ii) 2,644,957.26 Class A Units directly held by Blackstone Family Investment Partnership VI—ESC L.P. (“BFIP VI—ESC”), (iii) 220,012.15 Class A Units directly held by Blackstone Family Investment Partnership VI L.P. (“BFIP VI”) and (iv) 140,100,090 Class A Units directly held by Blackstone VNT Co-Invest, L.P. (“VNT”) (BCP VI, BFIP VI-ESC, BFIP VI and VNT are collectively referred to as the “Blackstone Funds”). BCP VI Side-by-Side GP L.L.C. is the general partner of each of BFIP VI-ESC and BFIP VI. Blackstone Management |
125
Table of Contents
| Associates VI L.L.C. is the general partner of each of BCP VI and VNT. BMA VI L.L.C. is the sole member of Blackstone Management Associates VI L.L.C. Blackstone Holdings III L.P. is the managing member of BMA VI L.L.C. and the sole member of BCP VI Side-by-Side GP L.L.C. The general partner of Blackstone Holdings III L.P. is Blackstone Holdings III GP L.P. The general partner of Blackstone Holdings III GP L.P. is Blackstone Holdings III GP Management L.L.C. The sole member of Blackstone Holdings III GP Management L.L.C. is The Blackstone Group L.P. The general partner of The Blackstone Group L.P. is Blackstone Group Management L.L.C. Blackstone Group Management L.L.C. is wholly owned by Blackstone’s senior managing directors and controlled by its founder, Stephen A. Schwarzman. Each of such Blackstone entities and Mr. Schwarzman may be deemed to beneficially own the limited liability company interests in Acquisition LLC beneficially owned by the Blackstone Funds directly or indirectly controlled by it or him, but each disclaims beneficial ownership of such limited liability company interests in Acquisition LLC (other than the Blackstone Funds to the extent of their direct holdings). The address of each of Mr. Schwarzman and each of the other entities listed in this footnote is c/o The Blackstone Group L.P., 345 Park Avenue, New York, New York 10154. |
| (3) | Class A Units shown as beneficially owned by the Summit Funds (as hereinafter defined) are held by the following entities: (i) Summit Partners Growth Equity Fund VIII-A, L.P. (“SPGE VIII-A”) owns 36,490,138.53 Class A Units, (ii) Summit Partners Growth Equity Fund VIII-B, L.P. (“SPGE VIII-B”) owns 13,330,631.47 Class A Units, (iii) Summit Investors I, LLC (“SI”) owns 164,980 Class A Units and (iv) Summit Investors I (UK), LP (“SI(UK)” and together with SPGE VIII-A, SPGE VIII-B and SI, the “Summit Funds”) owns 14,250 Class A Units. Summit Partners, L.P. is (i) the managing member of Summit Partners GE VIII, LLC, which is the general partner of Summit Partners GE VIII, L.P., which is the general partner of each of Summit Partners Growth Equity Fund VIII-A, L.P. and Summit Partners Growth Equity Fund VIII-B, L.P., and (ii) the manager of Summit Investors Management, LLC, which is the managing member of Summit Investors I, LLC and the general partner of Summit Investors I (UK), L.P. Summit Partners, L.P., through a three-person investment committee currently composed of Peter Y. Chung, Bruce R. Evans and Martin J. Mannion, has voting and dispositive authority over the Units held by the Summit Funds. Each of such Summit entities and therefore Summit Partners, L.P. may be deemed to beneficially own limited liability company interests in Acquisition LLC beneficially owned by the Summit Funds directly or indirectly controlled by it, but each disclaims beneficial ownership of such limited liability company interests in Acquisition LLC (other than Summit Partners, L.P. and other than the Summit Funds to the extent of their direct holdings). The address of each of these entities and Messrs. Chung, Evans and Mannion is 222 Berkeley Street, 18th Floor, Boston, Massachusetts 02116. |
| (4) | Certain directors and executive officers also own profits interests in Acquisition LLC, having economic characteristics similar to stock appreciation rights, in the form of Class B Units of Acquisition LLC, as described under “Management—Executive Compensation—Compensation Discussion and Analysis—Long-term Incentive Compensation”. Directors and executive officers as a group hold an aggregate of 63,659,562 Class B Units. |
| (5) | Messrs. McEvoy and Wallace are each employees of affiliates of the Blackstone Funds, but each disclaims beneficial ownership of the limited liability company interests in Acquisition LLC beneficially owned by the Blackstone Funds. The address for Messrs., McEvoy and Wallace is c/o The Blackstone Group L.P., 345 Park Avenue, New York, New York 10154. |
| ITEM 13. | CERTAIN RELATIONSHIPS AND RELATED TRANSACTIONS, AND DIRECTOR INDEPENDENCE |
Support and Services Agreement
In connection with the Merger, we entered into a support and services agreement with Blackstone Management Partners L.L.C. (“BMP”), an affiliate of Blackstone. Under the support and services agreement, we paid BMP, at the closing of the Merger, an approximately $20.0 million transaction fee as consideration for BMP undertaking due diligence investigations and financial and structural analysis and providing corporate strategy and other advice and negotiation assistance in connection with the Merger. In addition, we have agreed to reimburse BMP for any out-of-pocket expenses incurred by BMP and its affiliates and to indemnify BMP and its affiliates and related parties, in each case, in connection with the Transactions and the provision of services under the support and services agreement.
Monitoring Services and Fees
In addition, under this agreement, we have engaged BMP to provide, directly or indirectly, monitoring, advisory and consulting services that may be requested by us in the following areas: (a) advice regarding the structure, distribution and timing of debt and equity offerings and advice regarding relationships with our lenders and bankers, (b) advice regarding the structuring and implementation of equity participation plans, employee benefit plans and other incentive arrangements for certain of our key executives, (c) general advice regarding dispositions and/or acquisitions, (d) advice regarding the strategic direction of our business of Parent Guarantor, the Surviving Company and such other advice directly related or ancillary to the above advisory services as may be reasonably requested by us. These services will generally be provided until the first to occur of (i) the tenth anniversary of the closing date of the Merger (November 16, 2022), (ii) the date of a first underwritten public offering of shares of our common stock listed on the New York Stock Exchange or Nasdaq’s national market system for aggregate proceeds of at least $150 million (an “IPO”) and (iii) the date upon which Blackstone owns less than 9.9% of our common stock or that of our direct or indirect controlling parent and such stock has a fair market value (as determined by Blackstone) of less than $25 million (each of the events specified in clauses (i) through (iii) above, the “Exit Date”).
126
Table of Contents
In consideration for the monitoring services we have paid BMP, at the closing of the Merger, a monitoring fee (for advisory services to the provided by BMP during the remainder of our 2012 fiscal year) and will pay at the beginning of each subsequent fiscal year a monitoring fee (for advisory services to be provided by BMP during such fiscal year). The monitoring fee paid at the closing of the Transactions was $0.7 million (which amount is equal to $2.7 million prorated based on the portion of fiscal 2012 which occurred after the Transactions). The monitoring fee payable for monitoring services in any subsequent fiscal year of ours will be equal to the greater of (i) a minimum base fee of $2.7 million (the “Minimum Annual Fee”), subject to adjustment as summarized below if we engage in a business combination or disposition that is “significant” (as defined in the Support and Services Agreement) and (ii) the amount of the monitoring fee paid in respect of the immediately preceding fiscal year, without regard to the post-fiscal year “true-up” adjustment described in the paragraph below (which will not yet have occurred at the time the annual monitoring fee is paid). We refer to the adjusted monitoring fee for any fiscal year of the Surviving Company as the “Monitoring Fee” for such fiscal year.
In the case of a significant business combination or disposition, if 1.5% of our pro forma consolidated EBITDA (as defined in the Support and Services Agreement) after giving effect to the business combination or disposition exceeds (in the case of a business combination) or is less than (in the case of a disposition) the then-current Monitoring Fee, the Monitoring Fee for the year in which the significant business combination or disposition occurs will be adjusted upward or downward, respectively, by the amount of such excess or shortfall, with such adjustment prorated based on the remaining full or partial fiscal quarters remaining in our then-current fiscal year. We will pay upward adjustments to the Monitoring Fee promptly upon availability of the pro forma income statement prepared in respect of such business combination. Downward adjustments to the Monitoring Fee will be effected through a rebate of the fee paid to BMP in that fiscal year. Subsequently, the Minimum Annual Fee applicable to full fiscal years following any significant business combination or disposition will be equal to 1.5% of our pro forma consolidated EBITDA after giving effect to the business combination or disposition (subject to further adjustments for subsequent significant business combinations and dispositions). However, in all cases (including in the case of a current-year rebate described above), the Monitoring Fee will always be at least $2.7 million and in no event will a rebate for a downward adjustment result in BMP retaining a monitoring fee of less than $2.7 million for monitoring services in respect of any particular fiscal year.
In addition to the adjustments to the Minimum Annual Fee and the Monitoring Fee in connection with significant business combinations or dispositions and the related payments or rebates described above, there may be other adjustments to the Monitoring Fee based on projected consolidated EBITDA and a post-fiscal year “true-up.” If 1.5% of our projected consolidated EBITDA, as first presented to our board of directors by senior management during the last third of such fiscal year, is projected to exceed the amount of the monitoring fee already paid to BMP in respect of monitoring services due to be rendered during that fiscal year, we will pay BMP the amount of such excess as an upward adjustment to the Monitoring Fee within two business days of such presentation. Following the completion of each applicable fiscal year and within deadlines required by our revolving credit facility, our chief financial officer will certify to BMP the amount of our consolidated EBITDA for such fiscal year. If 1.5% of such certified consolidated EBITDA is greater than the Monitoring Fee previously paid to BMP for monitoring services rendered during that fiscal year (including the adjustment in respect of projected EBITDA described above), we will, jointly and severally, pay BMP the amount of such excess within two business days of such certification. If 1.5% of such certified consolidated EBITDA is less than the monitoring fee previously paid to BMP for services rendered during that fiscal year (including the adjustment in respect of projected consolidated EBITDA described above), the amount of such shortfall will be applied as a credit against the next payment by us of the Monitoring Fee to BMP. However, BMP will always be entitled to retain the Minimum Annual Fee as then in effect and BMP will have no obligation to rebate any amount that would result in BMP having been paid Monitoring Fees for monitoring services in an amount less than the Minimum Annual Fee applicable to the relevant fiscal year.
Upon (i) an IPO, or (ii) the date upon which Blackstone owns less than 50% of the common stock of the Company or its direct or indirect controlling parent, and such stock has a fair market value (as determined by Blackstone) of less than $25 million, we will pay to BMP a milestone payment equal to the present value of all Monitoring Fee payments that, absent such event occurring, would otherwise have accrued and been payable through the tenth anniversary of the date of the support and services agreement, based on the continued payment of a Monitoring Fee in an amount equal to the then-applicable estimate for the Monitoring Fee for the fiscal year of the Surviving Company in which such event occurs, discounted at a rate equal to the yield to maturity on the close of business on the second business day immediately preceding the date the payment is payable of the class of outstanding U.S. government bonds having a final maturity closest to such tenth anniversary date.
Portfolio Operations Support and Other Services
Under the support and services agreement, we have, retroactively to September 16, 2012 (the date of the transaction agreement relating to the Merger) and through the Exit Date (or an earlier date determined by BMP), engaged BMP to arrange for Blackstone’s portfolio operations group to provide support services customarily provided by Blackstone’s portfolio operations group to Blackstone’s private equity portfolio companies of a type and amount determined by such portfolio services group to be warranted and
127
Table of Contents
appropriate. BMP will invoice us for such services based on the time spent by the relevant personnel providing such services during the applicable period and Blackstone’s allocated costs of such personnel, but in no event shall we be obligated to pay more than $1.5 million during any calendar year; this cap has been prorated for 2012 for the portion of 2012 occurring after the Merger.
Investor Securityholders’ Agreement
In connection with the closing of the Merger, 313 Acquisition LLC and the Parent Guarantor entered into a Securityholders’ Agreement (the “Securityholders’ Agreement”) with the Investors. The Securityholders’ Agreement governs certain matters relating to ownership of 313 Acquisition LLC and the Parent Guarantor, including with respect to the election of directors of our parent companies, transfer of shares, including tag-along rights and drag-along rights, other special corporate governance provisions and registration rights (including customary indemnification provisions).
Other
Prior to 2013, we used a corporate plane owned by an entity which was partially owned by us and certain of our shareholders. During the Successor Period and Predecessor Period, we incurred expenses of approximately $0.03 million and $1.4 million, respectively, related to this arrangement. In addition, we established a charitable foundation and from time to time, we match donations made by individual employees to the foundation. In the Successor Period and Predecessor Period, our employees contributed approximately $0.1 million and $0.8 million, respectively, to the foundation. Expenses related to the foundation during the same periods were not significant. Finally, we recognized revenue of approximately $6.6 million during the Predecessor Period ended November 16, 2012 for providing monitoring services for contracts owned by stockholders and employees of the Company. See Note 15 to our audited consolidated financial statements for additional information.
Agreements with Solar
Revolving Lines of Credit
In December 2012, we entered into a Subordinated Note and Loan Agreement with Solar, pursuant to which Solar may incur up to $20.0 million in revolver borrowings. Accrued interest is paid-in-kind through additions to the principal amount on a semi-annual basis and interest accrued on these borrowings at 7.5% per year through December 2013.
In December 2012, Solar borrowed $15.0 million in revolver borrowings and from January 2013 through May 2013, Solar borrowed an additional $5.0 million from us. Interest accrues on these borrowings at 7.5% per year and accrued interest is paid in kind through additions to the principal amount on a semi-annual basis. In July 2013, we amended and restated this agreement to provide for a maturity date of January 1, 2016.
While prepayments are permitted under the loan agreement, the principal amount and accrued interest of the loan under the loan agreement is due upon the earliest to occur of (1) a change of control, (2) an event of default and (3) January 1, 2016. Solar’s obligations to us with respect to the loan are subordinate to such guaranty obligations and all of its other indebtedness.
These revolver borrowings were repaid by Solar with the proceeds of its recent initial public offering.
Turnkey Full-Service Sublease Agreement
On June 20, 2013, we entered into a Turnkey Full-Service Sublease Agreement, or the Sublease Agreement, with Solar which was applied retroactively to be in effect as of January 1, 2013. This agreement specifies the terms under which Solar subleases up to 60,000 square feet of corporate office space in Provo, Utah from us and requires us to provide Solar with certain services. Under the Sublease Agreement, Solar pays us $3.41 per rentable square foot per month and $86.54 per month per a specified number of employees. In connection with its recent initial public offering and a planned move to independent office space, we have amended and restated this agreement with Solar to focus exclusively on the real estate issues at the Provo headquarters and are addressing certain services that we continue to provide to Solar under the Transition Services Agreement and related agreements. See “— Recent Agreements with Solar” below.
Administrative Services Agreement
On June 1, 2011, we entered into an Administrative Services Agreement, or the Service Agreement with Solar, which was terminated effective as of December 31, 2013. The Service Agreement required us to provide Solar with certain administrative, managerial and account management services. In exchange for the services, Solar agreed to pay us an administrative fee of up to $20.00 per account per month plus $0.04 per kilowatt hour of electricity generated by the solar equipment each month for each customer account. The terms of the Service Agreement prevent Solar from competing with us until December 31, 2016 with respect to residential home automation, control, energy management and security systems, and prevents us from competing with Solar with respect to the installation of solar energy systems on residential rooftops. The Service Agreement imposes confidentiality obligations on both parties, which survive termination.
128
Table of Contents
Trademark / Service Mark License Agreement
On June 1, 2011, we and Solar entered into a Trademark / Service Mark License Agreement, or the Trademark Agreement. Pursuant to the Trademark Agreement, we granted Solar and its subsidiaries a non-exclusive license to use certain Vivint marks, subject to certain quality control requirements, in exchange for a fee per month of $0.01 per kilowatt hour of electricity generated by the solar equipment each month for each customer account. On June 10, 2013, the Trademark Agreement was amended and restated to grant Solar a royalty-free, non-exclusive license to the marks, and was applied retroactively to be in effect as of January 1, 2013. Solar may only use the marks to manufacture, purchase and distribute its solar energy systems for residential rooftop installation, as well as in advertising and promotional material. We generally have the right to consent to any sublicense of the marks. In connection with its recent initial public offering, Solar terminated this agreement and we do not expect any additional payments to us as a result of this termination. See “— Recent Agreements with Solar” below.
Master Backup Maintenance Service Agreement
On January 23, 2014, we entered into a Master Backup Maintenance Services Agreement, or the Master Maintenance Agreement, with Vivint Solar Provider, LLC, one of Solar’s wholly owned subsidiaries, pursuant to which Vivint Solar Provider, LLC, engaged us as a backup provider of, among other tasks, specified maintenance, operations and customer services tasks related to Solar’s solar energy systems owned by third parties. The Master Maintenance Agreement provides the framework for a form agreement to be entered into by us and Solar’s investment funds. The form agreement requires us, upon certain triggering events, primarily the default of Vivint Solar Provider, LLC, to provide certain services and maintenance that it was providing. These services are to be provided at the cost incurred by us in providing such services, plus 10%. The agreement also requires each party to maintain certain levels of insurance coverage. In addition, Vivint Solar Provider, LLC, granted us a power of attorney to perform services and otherwise take action on behalf of Vivint Solar Provider, LLC, under the agreements covered by the agreement. Either party may terminate the agreement if the other fails to perform its material obligations and such failure is not remedied within 30 days of receipt of notice or upon the occurrence of a force majeure event that prevents such party from performing its obligations for a continuous 180 day period. Vivint Solar Provider, LLC, us, and one of Solar’s investment funds entered into an addendum to the agreement, which provide that such investment fund would receive the backup services under the agreement. Vivint Solar Provider, LLC may also terminate the agreement if we become insolvent or by providing 60 days’ prior written notice to us. In connection with its recent initial public offering, Solar terminated this agreement. See “— Recent Agreements with Solar” below.
Arrangement Regarding Our Executive Officers
Pursuant to an arrangement between us and Solar, in each of 2012 and 2013, 25% of Messrs. Pedersen and Dunn’s salary and bonus was allocated to, and paid by, Solar. In 2012 and 2013, we charged Solar an aggregate of $269,111 and $500,000, respectively, pursuant to that arrangement. This arrangement will not be applicable in 2014 or future periods.
Recent Agreements with Solar
In connection with Solar’s recent initial public offering, we have negotiated on an arm’s-length basis and entered into a number of agreements with Solar related to services and other support that we have provided and will provide to Solar, including:
| • | Master Intercompany Framework Agreement. This agreement establishes a framework for the ongoing relationship between us and Solar. This agreement contains master terms regarding the protection of each other’s confidential information, and master procedural terms, such as notice procedures, restrictions on assignment, interpretive provisions, governing law and dispute resolution. We and Solar each make customary representations and warranties that will apply across all of the agreements between us, and we each agree not to damage the value of the goodwill associated with the “VIVINT” or “VIVINT SOLAR” marks. We agree to provide Solar notice if we plans to stop using or to abandon rights in the “VIVINT” mark in any country or jurisdiction, and Solar is permitted to take steps to prevent abandonment of the “VIVINT” mark. We each also agree not to make public statements about each other without the consent of the other or disparage one another. |
| • | Non-Competition Agreement. In this agreement, we and Solar each define our current areas of business and our competitors, and agree not to directly or indirectly engage in the other’s business for three years. Our area of business is defined as residential and commercial automation and security products and services, energy management (i.e., wireless or remote management and control of energy controlling or consuming devices in a residence, including thermostats, HVAC, lighting, other appliances and in-house consumption monitoring), products and services for accessing and using the Internet, products and services for the storage, access, retrieval, and sharing of data, fixed and mobile data services, audio/video entertainment services, healthcare and wellness services, content distribution network services, wholesale cloud computing services, demand response services and information security. Solar’s area of business is defined as |
129
Table of Contents
| selling renewable energy and energy storage products and services. We and Solar may each engage in the business of energy inverters, aggregate consumption monitoring and micro-grid technology. We may not sell products and services to Solar’s competitors. Solar may purchase products and services from specified Vivint competitors. Although Solar may not engage in our business for three years, we may engage in Solar’s business in markets where Solar is not yet operating, including by selling customer leads to Solar’s competitors (other than SolarCity Corporation). Once Solar begins operating in a market, we will provide those leads exclusively to Solar. This agreement permits us and Solar to make investments of up to 2.5% in any publicly traded company without violating the commitments in this agreement. This agreement also permits Solar to obtain financing from a Vivint competitor. Finally, in this agreement we also each agree that for five years, unless we or Solar obtain prior written permission from the other party, neither of us will solicit for employment any member of the other’s executive or senior management team, or any of the other’s employees who primarily manage sales, installation or servicing of the other’s products and services. The commitment not to solicit those employees lasts for 180 days after the employee finishes employment with us or Solar. General purpose employment advertisements and contact initiated by an employee are not, however, considered solicitation. |
| • | Transition Services Agreement. Pursuant to this agreement we will provide to Solar various enterprise services, including services relating to information technology and infrastructure, human resources and employee benefits, administration services and facilities-related services. We agreed to perform the services with the same degree of care and diligence that we take in performing services for our own operations. We also agreed to provide Solar with reasonable assistance with Solar’s eventual transition to providing those services in-house or through the use of third-party service providers. Solar will pay us a sum of $313,000 per month for the services, which represents our good faith estimate of our full cost of providing the services to Solar, without markup or surcharge. As Solar transitions any service from us to an alternate provider or in-house, the fees paid to us will be reduced accordingly, except for any third party license fees related to services we obtains for Solar that cannot be terminated or assigned to Solar. The agreement will also account for the possibility that new services will be required from us that were not initially addressed in the agreement. The initial term of this agreement is six months; however, we and Solar will seek to complete the transition of the services contemplated by this agreement as soon as commercially practicable. |
| • | Product Development and Supply Agreement. Pursuant to this agreement, one of Solar’s wholly owned subsidiaries will collaborate with us to develop certain monitoring and communications equipment that will be compatible with other equipment used in Solar’s solar energy systems and will replace equipment Solar currently procures from third parties. |
The initial term of the agreement is three years, and it will automatically renew for successive one-year periods unless either party elects otherwise.
| • | Marketing and Customer Relations Agreement. This agreement governs various cross-marketing initiatives between us and Solar, in particular the provision of sales leads from each company to the other. Sales leads resulting in installations, as well as sales to each other’s customers (whether or not a lead is provided), generate commissions payable between the parties. The commission rate is 50% of the applicable commission that is paid to the paying party’s sales personnel performing similar lead generation services; this is intended to properly incentivize leads while accounting for the somewhat lower level of effort required for lead generation as opposed to outright sales. The term of this agreement, including the term of the schedules defining the terms of the mutual lead generation program, is three years. |
| • | Sublease Agreement. This agreement provides for the short-term (estimated to be less than six months) sublease of space by Solar at the Morinda building (separate from the Provo headquarters). Similar to the Sublease Agreement described above, this agreement is focused only on real estate issues and certain specifically related services at the Morinda building. Other services at this location, in particular IT and similar services, are provided pursuant to the Transition Services Agreement. |
| • | Bill of Sale. This agreement governs the transfer of certain assets such as office equipment from us to Solar. |
| • | Trademark License Agreement. Pursuant to this agreement, the licensor, a special purpose subsidiary majority-owned by us and minority-owned by Solar, will grant Solar a royalty-free exclusive license to the trademark “VIVINT SOLAR” in the field of selling renewable energy or energy storage products and services. The agreement enables Solar to sublicense the Vivint Solar trademark to its subsidiaries and to certain third parties, such as suppliers and distributors, to the extent necessary for Solar to operate its business. The agreement governs how Solar may use and display the Vivint Solar trademark and provides that Solar may create new marks that incorporate “VIVINT SOLAR” with licensor’s reasonable approval. The agreement also provides that the licensor will apply to register Vivint Solar trademarks as reasonably requested by Solar, and that Solar will work together with the licensor in enforcing and protecting the Vivint Solar trademarks. The agreement is perpetual but may be terminated voluntarily by Solar or by the licensor if (1) a court finds that Solar have materially breached the agreement and not cured such breach within 30 days after notice, (2) Solar becomes insolvent, makes an assignment for the benefit of creditors, or becomes subject to bankruptcy proceedings, (3) one of the parties (or us, with respect to the licensor) is acquired by a competitor of the other party, or (4) Solar ceases using the “VIVINT SOLAR” mark worldwide. We retain ownership of the Vivint trademark and Solar has no right to use “Vivint” except as part of “VIVINT SOLAR”. |
130
Table of Contents
Procedures with Respect to Review and Approval of Related Person Transactions
From time to time, we may do business with certain companies affiliated with Blackstone. The board of directors has not adopted a formal written policy for the review and approval of transactions with related persons. However, the board of directors reviews and approves transactions with related persons as appropriate.
| ITEM 14. | PRINCIPAL ACCOUNTANT FEES AND SERVICES |
Disclosure of Fees Paid to Independent Registered Public Accounting Firm
Aggregate fees billed to the Company for the fiscal year ended December 31, 2014 and 2013 represent fees billed by the Company’s principal independent registered public accounting firm, Ernst & Young LLP.
| Year Ended | ||||||||
| Fee Category |
2014 | 2013 | ||||||
| Audit Fees (a) |
$ | 1,094,000 | $ | 1,332,250 | ||||
| Audit-Related Fees |
— | — | ||||||
|
|
|
|
|
|||||
| Total Audit and Audit-Related Fees |
1,094,000 | 1,332,250 | ||||||
| Tax Fees (b) |
14,000 | 152,000 | ||||||
| All Other Fees |
— | — | ||||||
|
|
|
|
|
|||||
| Total |
$ | 1,108,000 | $ | 1,484,250 | ||||
|
|
|
|
|
|||||
| (a) | Audit Fees primarily consisted of audit work performed for the preparation of the Company’s annual consolidated financial statements and reviews of interim consolidated financial information and in connection with regulatory filings. |
| (b) | Tax Fees included tax compliance, planning and support services. |
The audit committee pre-approves all audit and non-audit services provided by its independent registered public accounting firm. The audit committee considered whether the non-audit services rendered by Ernst & Young LLP were compatible with maintaining Ernst & Young LLP’s independence as the independent registered public accounting firm of the Company’s consolidated financial statements and concluded they were.
131
Table of Contents
| ITEM 15. | EXHIBITS AND FINANCIAL STATEMENT SCHEDULES |
(a) Exhibits
| Exhibit No. |
Description | |
| 3.1 |
Fourth Amended and Restated Certificate of Incorporation of APX Group, Inc. (incorporated by reference to Exhibit 3.1 to the Registration Statement on Form S-4 of APX Group Holdings, Inc. and the other registrants listed therein (File Number: 333-191132)) | |
| 3.2 |
Bylaws of the APX Group, Inc. (incorporated by reference to Exhibit 3.2 to the Registration Statement on Form S-4 of APX Group Holdings, Inc. and the other registrants listed therein (File Number: 333-191132)) | |
| 3.3 |
Certificate of Incorporation of APX Group Holdings, Inc. (incorporated by reference to Exhibit 3.3 to the Registration Statement on Form S-4 of APX Group Holdings, Inc. and the other registrants listed therein (File Number: 333-191132)) | |
| 3.4 |
Bylaws of APX Group Holdings, Inc. (incorporated by reference to Exhibit 3.4 to the Registration Statement on Form S-4 of APX Group Holdings, Inc. and the other registrants listed therein (File Number: 333-191132)) | |
| 4.1 |
Indenture, dated as of November 16, 2012, among APX Group, Inc., the guarantors named therein and Wilmington Trust, National Association, as trustee, relating to the Company’s 6.375% Senior Secured Notes due 2019 (incorporated by reference to Exhibit 4.1 to the Registration Statement on Form S-4 of APX Group Holdings, Inc. and the other registrants listed therein (File Number: 333-191132)) | |
| 4.2 |
First Supplemental Indenture, dated as of December 20, 2012, among 313 Aviation, LLC and Wilmington Trust, National Association, as trustee, relating to the Company’s 6.375% Senior Secured Notes due 2019 (incorporated by reference to Exhibit 4.2 to the Registration Statement on Form S-4 of APX Group Holdings, Inc. and the other registrants listed therein (File Number: 333-191132)) | |
| 4.3 |
Second Supplemental Indenture, dated as of May 14, 2013, among Vivint Wireless, Inc. and Wilmington Trust, National Association, as trustee, relating to the Company’s 6.375% Senior Secured Notes due 2019 (incorporated by reference to Exhibit 4.3 to the Registration Statement on Form S-4 of APX Group Holdings, Inc. and the other registrants listed therein (File Number: 333-191132)) | |
| 4.4 |
Third Supplemental Indenture, dated as of December 18, 2014, among Vivint Wireless, Inc. and Wilmington Trust, National Association, as trustee, relating to the Company’s 6.375% Senior Secured Notes due 2019 (incorporated by reference to Exhibit 4.4 to the Registration Statement on Form S-4 of APX Group Holdings, Inc. and the other registrants listed therein (File Number: 333-191132)) | |
| 4.5 |
Form of Note relating to Company’s 6.375% Senior Secured Notes due 2019 (attached as exhibit to Exhibit 4.1) (incorporated by reference to Exhibit 4.4 to the Registration Statement on Form S-4 of APX Group Holdings, Inc. and the other registrants listed therein (File Number: 333-191132)) | |
| 4.6 |
Indenture, dated as of November 16, 2012, among APX Group, Inc., the guarantors named therein and Wilmington Trust, National Association, as trustee, relating to the Company’s 8.75% Senior Notes due 2020 (incorporated by reference to Exhibit 4.5 to the Registration Statement on Form S-4 of APX Group Holdings, Inc. and the other registrants listed therein (File Number: 333-191132)) | |
| 4.7 |
First Supplemental Indenture, dated as of December 20, 2012, among 313 Aviation, LLC and Wilmington Trust, National Association, as trustee, relating to the Company’s 8.75% Senior Notes due 2020 (incorporated by reference to Exhibit 4.6 to the Registration Statement on Form S-4 of APX Group Holdings, Inc. and the other registrants listed therein (File Number: 333-191132)) | |
| 4.8 |
Second Supplemental Indenture, dated as of May 14, 2013, among Vivint Wireless, Inc. and Wilmington Trust, National Association, as trustee, relating to the Company’s 8.75% Senior Notes due 2020 (incorporated by reference to Exhibit 4.7 to the Registration Statement on Form S-4 of APX Group Holdings, Inc. and the other registrants listed therein (File Number: 333-191132)) | |
| 4.9 |
Third Supplemental Indenture, dated as of May 31, 2013, among APX Group, Inc., the guarantors named therein and Wilmington Trust, National Association, as trustee, relating to the Company’s 8.75% Senior Notes due 2020 (incorporated by reference to Exhibit 4.8 to the Registration Statement on Form S-4 of APX Group Holdings, Inc. and the other registrants listed therein (File Number: 333-191132)) | |
132
Table of Contents
| Exhibit No. |
Description | |
| 4.10 |
Fourth Supplemental Indenture, dated as of December 13, 2013, among APX Group, Inc., the guarantors named therein and Wilmington Trust, National Association, as trustee, relating to the Company’s 8.75% Senior Notes due 2020 (incorporated by reference to Exhibit 4.1 to the Current Report on Form 8-K of APX Group Holdings, Inc. (File Number: 333-191132-02)) | |
| 4.11 |
Fifth Supplemental Indenture, dated as of July 1, 2014, among APX Group, Inc., the guarantors named therein and Wilmington Trust, National Association, as trustee, relating to the Company’s 8.75% Senior Notes due 2020 (incorporated by reference to Exhibit 4.1 to the Current Report on Form 8-K of APX Group Holdings, Inc. (File Number: 333-191132-02)) | |
| 4.12 |
Sixth Supplemental Indenture, dated as of December 18, 2014, among APX Group, Inc., the guarantors named therein and Wilmington Trust, National Association, as trustee, relating to the Company’s 8.75% Senior Notes due 2020 (incorporated by reference to Exhibit 4.12 to the Registration Statement on Form S-4 of APX Group Holdings, Inc. and the other registrants listed therein (File Number: 333-191132)) | |
| 4.13 |
Form of Note relating to Company’s 8.75% Senior Notes due 2020 (attached as exhibit to Exhibit 4.6) (incorporated by reference to Exhibit 4.9 to the Registration Statement on Form S-4 of APX Group Holdings, Inc. and the other registrants listed therein (File Number: 333-191132)) | |
| 10.1 |
Amended and Restated Credit Agreement, dated as of June 28, 2013, among APX Group, Inc., the other guarantors party thereto, Bank of America, N.A., as Administrative Agent and the other lenders and parties thereto (incorporated by reference to Exhibit 10.1 to the Registration Statement on Form S-4 of APX Group Holdings, Inc. and the other registrants listed therein (File Number: 333-191132)) | |
| 10.2 |
Second Amended and Restated Credit Agreement, dated as of March 6, 2015, among APX Group, Inc., the other guarantors party thereto, Bank of America, N.A., as Administrative Agent and the other lenders and parties thereto (incorporated by reference to Exhibit 10.1 to the Current Report on Form 8-K of APX Group Holdings, Inc. (File Number: 333-191132-02)) | |
| 10.3 |
Security Agreement, dated as of November 16, 2012, among the grantors named therein and Bank of America, N.A., as Administrative Agent (incorporated by reference to Exhibit 10.2 to the Registration Statement on Form S-4 of APX Group Holdings, Inc. and the other registrants listed therein (File Number: 333-191132)) | |
| 10.4 |
Security Agreement, dated as of November 16, 2012, among the grantors named therein and Wilmington Trust, National Association, as Collateral Agent (incorporated by reference to Exhibit 10.3 to the Registration Statement on Form S-4 of APX Group Holdings, Inc. and the other registrants listed therein (File Number: 333-191132)) | |
| 10.5 |
Intercreditor Agreement and Collateral Agency Agreement, dated as of November 16, 2012, among 313 Group Inc., the other grantors named therein, Bank of America, N.A., as Credit Agreement Collateral Agent, Wilmington Trust, National Association, as Notes Collateral Agent, and each Additional Collateral Agent from time to time party thereto (incorporated by reference to Exhibit 10.4 to the Registration Statement on Form S-4 of APX Group Holdings, Inc. and the other registrants listed therein (File Number: 333-191132)) | |
| 10.6 |
Transaction Agreement, dated September 16, 2012, by and among 313 Acquisition LLC, 313 Group, Inc., 313 Solar, Inc., 313 Technologies, Inc., APX Group, Inc., V Solar Holdings, Inc. and 2GIG Technologies, Inc. (incorporated by reference to Exhibit 2.1 to the Registration Statement on Form S-4 of APX Group Holdings, Inc. and the other registrants listed therein (File Number: 333-191132)) | |
| 10.7** |
Management Subscription Agreement (Co-Investment Units), dated as of November 16, 2012, between 313 Acquisition LLC and Todd Pedersen (incorporated by reference to Exhibit 10.5 to the Registration Statement on Form S-4 of APX Group Holdings, Inc. and the other registrants listed therein (File Number: 333-191132)) | |
| 10.8** |
Management Subscription Agreement (Co-Investment Units), dated as of November 16, 2012, between 313 Acquisition LLC and Alex Dunn (incorporated by reference to Exhibit 10.6 to the Registration Statement on Form S-4 of APX Group Holdings, Inc. and the other registrants listed therein (File Number: 333-191132)) | |
| 10.9** |
Management Subscription Agreement (Incentive Units), dated as of November 16, 2012, between Acquisition LLC and Todd Pedersen (incorporated by reference to Exhibit 10.7 to the Registration Statement on Form S-4 of APX Group Holdings, Inc. and the other registrants listed therein (File Number: 333-191132)) | |
133
Table of Contents
| Exhibit No. |
Description | |
| 10.10** | Management Subscription Agreement (Incentive Units), dated as of November 16, 2012, between Acquisition LLC and Alex Dunn (incorporated by reference to Exhibit 10.8 to the Registration Statement on Form S-4 of APX Group Holdings, Inc. and the other registrants listed therein (File Number: 333-191132)) | |
| 10.11** | Form of Management Subscription Agreement (Incentive Units) (incorporated by reference to Exhibit 10.9 to the Registration Statement on Form S-4 of APX Group Holdings, Inc. and the other registrants listed therein (File Number: 333-191132)) | |
| 10.12** | Form of Management Subscription Agreement (Co-Investment Units) (incorporated by reference to Exhibit 10.10 to the Registration Statement on Form S-4 of APX Group Holdings, Inc. and the other registrants listed therein (File Number: 333-191132)) | |
| 10.13** | 313 Acquisition LLC Unit Plan, dated as of November 16, 2012 (incorporated by reference to Exhibit 10.11 to the Registration Statement on Form S-4 of APX Group Holdings, Inc. and the other registrants listed therein (File Number: 333-191132)) | |
| 10.14** | Form of Aircraft Time-Sharing Agreement (incorporated by reference to Exhibit 10.12 to the Registration Statement on Form S-4 of APX Group Holdings, Inc. and the other registrants listed therein (File Number 333-193639)) | |
| 10.15** | Employment Agreement, dated as of August 7, 2014, between APX Group, Inc. and Alex Dunn (incorporated by reference to Exhibit 10.1 to the Quarterly Report on Form 10-Q of APX Group Holdings, Inc. (File Number: 333-193639)) | |
| 10.16** | Employment Agreement, dated as of August 7, 2014, between APX Group, Inc. and Todd Pedersen (incorporated by reference to Exhibit 10.2 to the Quarterly Report on Form 10-Q of APX Group Holdings, Inc. (File Number: 333-193639)) | |
| 12.1* | Computation of Ratio of Earnings to Fixed Charges | |
| 21.1* | Subsidiaries of APX Group, Inc. | |
| 31.1* | Certification of the Registrant’s Chief Executive Officer, Todd Pedersen, pursuant to Rule 13a-14 of the Securities Exchange Act of 1934 | |
| 31.2* | Certification of the Registrant’s Chief Financial Officer, Mark Davies, pursuant to Rule 13a-14 of the Securities Exchange Act of 1934 | |
| 32.1* | Certification of the Registrant’s Chief Executive Officer, Todd Pedersen, pursuant to 18 U.S.C. Section 1350, as adopted pursuant to Section 906 of the Sarbanes-Oxley Act of 2002 | |
| 32.2* | Certification of the Registrant’s Chief Financial Officer, Mark Davies, pursuant to 18 U.S.C. Section 1350, as adopted pursuant to Section 906 of the Sarbanes-Oxley Act of 2002 | |
| 99.1* | Section 13(r) Disclosure | |
| 99.2 | Stock Purchase Agreement, dated as of February 13, 2013, by and among Nortek, Inc. and APX Group, Inc. (incorporated by reference to Exhibit 99.1 to the Quarterly Report on Form 10-Q of APX Group Holdings, Inc. (File Number: 333-193639)) | |
| 101.1* | The following materials are formatted in XBRL (eXtensible Business Reporting Language): (i) the Consolidated Balance Sheets, (ii) the Consolidated Statements of Operations, (iii) the Consolidated Statements of Comprehensive Loss, (iv) the Consolidated Statements of Changes in Equity, (v) the Consolidated Statements of Cash Flows, (vi) Notes to Consolidated Financial Statements, and (vii) document and entity information. (A) | |
| * | Filed herewith. |
| ** | Identifies exhibits that consist of a management contract or compensatory plan or arrangement. |
| (A) | Pursuant to Rule 406T of Regulation S-T, the Interactive Data files on Exhibit 101.1 hereto are deemed not filed or part of a registration statement or prospectus for purposes of Sections 11 or 12 of the Securities Act of 1933, as amended, are deemed not filed for purposes of Section 18 of the Securities and Exchange Act of 1934, as amended, and otherwise are not subject to liability under those sections. |
| (b) | Financial Statement Schedules |
Financial schedules are omitted because they are not applicable or not required, or because the information is included herein in our financial statements and/or the notes related thereto.
134
Table of Contents
Pursuant to the requirements of Section 13 or 15(d) of the Securities Exchange Act of 1934, the registrant has duly caused this report to be signed on its behalf by the undersigned, thereunto duly authorized.
| APX GROUP HOLDINGS, INC. | ||
| By: | /s/ MARK DAVIES | |
| Mark Davies | ||
| Chief Financial Officer | ||
| Date: March 26, 2015 | ||
Pursuant to the requirements of the Securities Exchange Act of 1934, this report has been signed below by the following persons on behalf of the registrant and in the capacities and on the dates indicated.
| Signature |
Title |
Date | ||||
| By: | /s/ TODD PEDERSEN Todd Pedersen |
Chief Executive Officer and Director (Principal Executive Officer) |
March 26, 2015 | |||
| By: | /s/ MARK DAVIES Mark Davies |
Chief Financial Officer (Principal Financial Officer) |
March 26, 2015 | |||
| By: | /s/ PATRICK KELLIHER Patrick Kelliher |
Chief Accounting Officer (Principal Accounting Officer) |
March 26, 2015 | |||
| By: | /s/ ALEX DUNN Alex Dunn |
President and Director | March 26, 2015 | |||
| By: | /s/ DAVID F. D’ALESSANDRO David F. D’Alessandro |
Director | March 26, 2015 | |||
| By: | /s/ BRUCE MCEVOY Bruce McEvoy |
Director | March 26, 2015 | |||
| By: | /s/ JOSEPH TRUSTEY Joseph Trustey |
Director | March 26, 2015 | |||
| By: | /s/ PETER WALLACE Peter Wallace |
Director | March 26, 2015 | |||
135