Attached files
| file | filename |
|---|---|
| 8-K - 8-K - HD Supply Holdings, Inc. | a18-15727_18k.htm |
Disclaimer Forward-Looking Statements and Preliminary Results This presentation includes “forward-looking statements” within the meaning of Section 27A of the Securities Act and Section 21E of the Exchange Act. Forward-looking statements are based on management’s beliefs and assumptions and information currently available to management and are subject to known and unknown risks and uncertainties, many of which may be beyond our control. We caution you that the forward-looking information presented in this presentation is not a guarantee of future results, and that actual results may differ materially from those made in or suggested by the forward-looking information contained in this presentation. In addition, forward-looking statements generally can be identified by the use of forward-looking terminology such as “may,” “plan,” “seek,” “comfortable with,” “will,” “expect,” “intend,” “estimate,” “anticipate,” “believe” or “continue” or the negative thereof or variations thereon or similar terminology. A number of important factors could cause actual events to differ materially from those contained in or implied by the forward-looking statements, including those “Risk factors” in our annual report on Form 10-K, for the fiscal year ended January 28, 2018, filed on March 13, 2018 and those described from time to time in our, and HD Supply, Inc.’s, other filings with the U.S. Securities and Exchange Commission, which can be found at the SEC’s website www.sec.gov. Any forward-looking information presented herein is made only as of the date of this presentation, and we do not undertake any obligation to update or revise any forward-looking information to reflect changes in assumptions, the occurrence of unanticipated events, or otherwise. Estimates for Net sales, Adjusted EBITDA, Adjusted net income per diluted share, Free Cash Flow and Net Debt are preliminary estimates and are subject to risks and uncertainties, including, among others, changes in connection with quarter-end adjustments. Any variation between HD Supply’s actual results and the preliminary financial data set forth herein may be material. Non-GAAP Financial Measures HD Supply supplements its financial results that are determined in accordance with accounting principles generally accepted in the United States of America (“GAAP”) with non-GAAP measurements, including Adjusted EBITDA, Adjusted net income, Adjusted net income per diluted share, Net debt and Free cash flow. This supplemental information should not be considered in isolation or as a substitute for the GAAP measurements. Additional information regarding Adjusted EBITDA, Adjusted net income and Adjusted net income per diluted share referred to in this presentation is included at the end of this presentation under “Reconciliation of Non-GAAP Measures.”
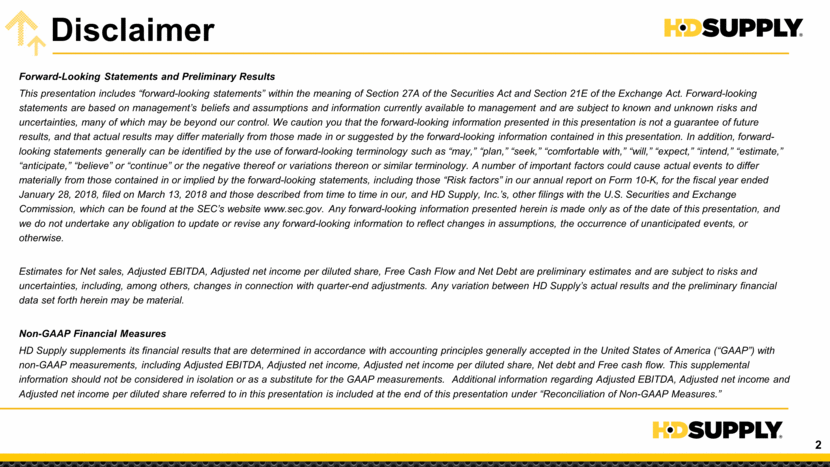
Welcome! Telling Our Story on Behalf of Over 11,000 Associates Joe DeAngelo HD Supply Overview 8:00 – 8:30 HD Supply Facilities Maintenance 8:30 – 9:15 Will Stengel 9:15 – 9:30 Break & Refreshments HD Supply Construction & Industrial 9:30 – 10:15 John Stegeman, Alan Sollenberger Investors, Analysts HD Supply Hosts Registration & Breakfast 7:00 – 8:00 10:15 – 10:45 HD Supply Financial Overview Evan Levitt 12:00 – 2:00 FM Growth Investment Showcase and C&I Business Showcase Investors, Analysts HD Supply Hosts 2:00 – 2:15 Departures 11:50 – 12:00 General Session Close and Afternoon Overview Joe DeAngelo 11:00 – 11:50 Q&A Joe DeAngelo, Evan Levitt, Will Stengel, John Stegeman 10:45 – 11:00 Lunch Served
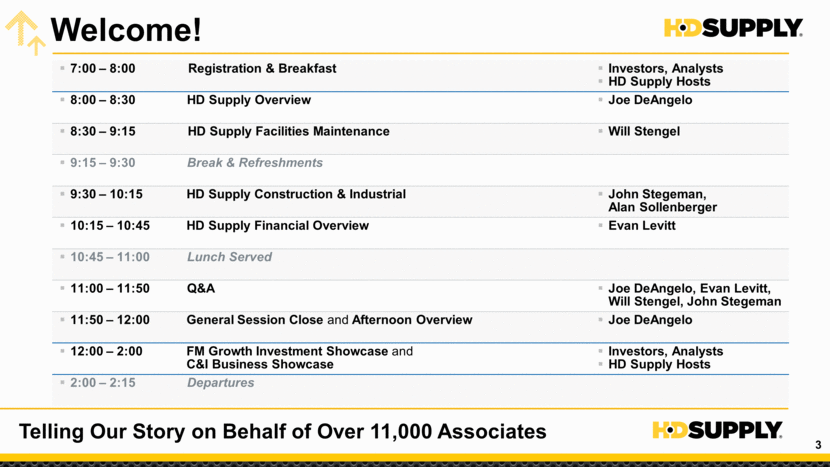
1 Represents the costs related to exiting the Company's previous corporate headquarters, costs incurred for the strategic alignment of workforce and the costs incurred for branch closures and consolidations. These costs include severance, relocation costs and other related costs. 2 Represents the loss on extinguishment of debt including the premium paid to repurchase or call the debt as well as the write-off of unamortized deferred financing costs, original issue discount and other assets or liabilities associated with such debt. Also includes the costs of debt modification. 3 During the fiscal year ended January 31, 2016, the Company recorded a $1,007 million tax benefit for the reversal of substantially all of the valuation allowance on its U.S. net deferred tax assets and a $189 million tax benefit for the reduction in unrecognized tax benefits as a result of IRS and state audit settlements. GAAP Financials Fiscal 2015 Fiscal 2016 Fiscal 2017 Q1’17 Q1’18 LTM Q1’17 LTM Q1’18 ($ in millions) Net Sales $4,615 $4,819 $5,121 $1,216 $1,389 $4,859 $5,294 Cost of sales 2,801 2,894 3,088 732 837 2,919 3,193 Gross Profit 1,814 1,925 2,033 484 552 1,940 2,101 Operating expenses: Selling, general and administrative 1,184 1,269 1,334 334 372 1,295 1,372 Depreciation and amortization 97 84 85 21 22 84 86 Restructuring1 8 7 6 - 7 - 13 Total operating expenses 1,289 1,360 1,425 355 401 1,379 1,471 Operating Income 525 565 608 129 151 561 630 Interest expense 394 269 166 49 34 233 151 Interest (income) - - (2) - (1) - (3) Loss on extinguishment & modification of debt2 100 179 84 3 - 67 81 Other (income) expense, net 1 - - - - - - Income from Continuing Operations Before Provision (Benefit) for Income Taxes 30 117 360 77 118 261 401 Provision (benefit) for income taxes3 (1,170) 51 193 19 29 96 203 Income from continuing operations 1,200 66 167 58 89 165 198 Income from discontinued operations, net of tax 272 130 803 27 - 130 776 Net Income $1,472 $196 $970 $85 $89 $295 $974
HD Supply Overview $5.3 Billion LTM Q1’18 Net Sales; $764 Million LTM Q1’18 Adjusted EBITDA (14.4% of Net Sales)1,3 Leading Industrial Distributor with #1 Positions2 in Large, Fragmented, Growing Industry Segments Specialized Business Units Providing Complete Solutions for Customer Success Living Space MRO4: ~200K SKUs, ~300K Customers Specialty Construction3: ~450K SKUs, ~200K Customers Scale, National Presence and Local Expertise Accelerate Competitive Advantage Over 300 Locations, 41 U.S. States, 6 Canadian Provinces and Local Sales Coverage in All Major MSAs3 Talent Driving Winning Environment and Quality & Consistency of Investment Leading MRO and Specialty Construction Distributor $5.3B Facilities Maintenance 55% Adj. EBITDA: $514M (18% of Net Sales) Construction & Industrial 45% Adj. EBITDA: $250M (10% of Net Sales) Net Sales by Business Unit1,3 Industry Segment Opportunity2 c Facilities Maintenance ~$55B Construction & Industrial ~$30B $85B 1 Based on the Last Twelve Months (LTM) ending Jan. ’18. Intercompany eliminations not shown 2 Management estimates based on industry data and knowledge 3 Includes A.H. Harris Construction Supplies, acquired March 5, 2018 4 Maintenance, Repair and Operations
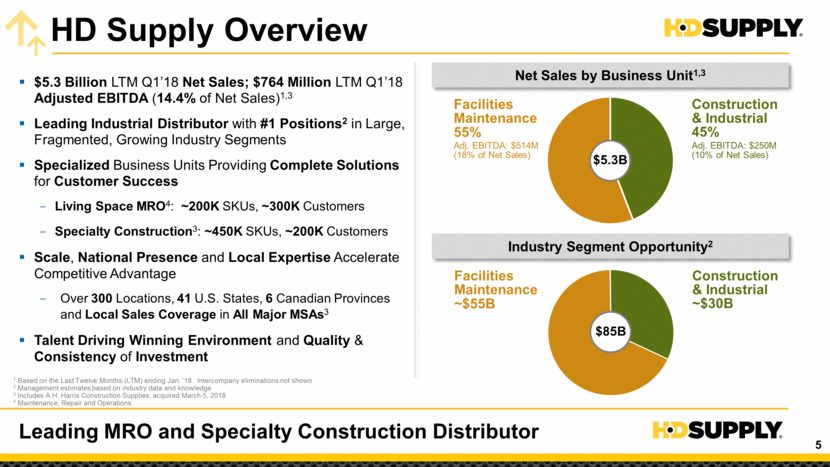
HD Supply Leadership Disciplined People, Thought and Action Will Stengel President, Facilities Maintenance 20 Years Relevant Experience 14 Years with HD Supply The Home Depot; Bank of America; Stonebridge Associates John Stegeman President, Construction & Industrial 33 Years Relevant Experience 8 Years with HD Supply Ferguson Evan Levitt CFO & Chief Administrative Officer 27 Years Relevant Experience 11 Years with HD Supply The Home Depot; Payless ShoeSource; Arthur Andersen 25 Years Relevant Experience 8 Years with HD Supply King & Spalding; Sullivan, Hall, Booth & Smith Dan McDevitt General Counsel and Corporate Secretary Anna Stevens Chief People Officer 20 Years Relevant Experience 10 Years with HD Supply AT&T; Progressive, Inc.; Bell South; Aerotek Inc. 35 Years Relevant Experience 14 Years with HD Supply The Home Depot; The Stanley Works; General Electric Field Leadership Support Joe DeAngelo Chairman & CEO
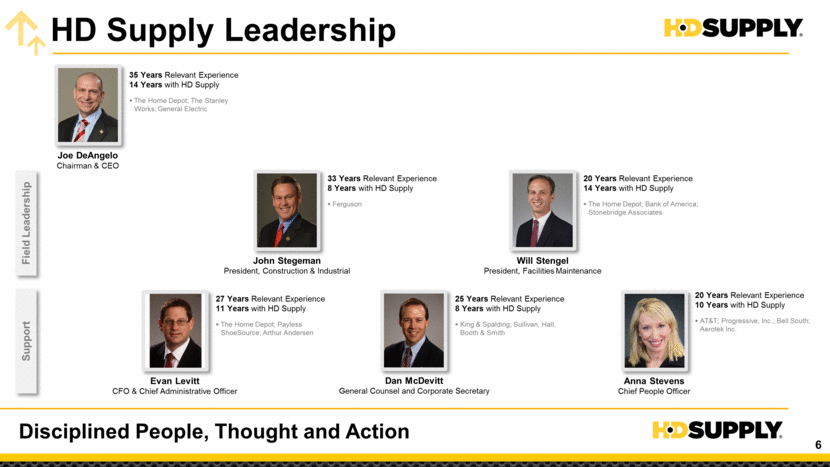
HD Supply Evolution Disciplined Strategic Evolution to Deliver Value Creation Annual FM and C&I Net Sales $0.1B ’97 ’98 ’99 ’00 ’01 ’02 ’03 ’04 ’05 ’06 ’07 ’08 ’09 ’10 ’11 ’12 ’13 ’14 ’15 ’16 ’17 ’18F $5.9B1 Integrated Hughes MRO and Construction Supply (+$1B sales) Sold as HD Supply to Private Equity Consortium Sale of LBM Business Unit ’09 Acquisition of Orco Supply (Construction & Industrial) Acquisition of Peachtree Business Products (Facilities Maintenance) Financial Crisis Sale of Plumbing and Industrial PVF ’12 Stegeman Named C&I Pres. C&I Relocates to ATL ’15 Sale of Crown Bolt HD Supply IPO Levitt Named CFO Sale of Power Solutions Maintenance Warehouse Founded as Direct Marketer to Apartment Building Maintenance Professionals ’67 ’00 ’06 Home Depot Acquires Maintenance Warehouse Home Depot Acquires White Cap ’03 White Cap Founded as Specialty Distributor to Pool Contractors DeAngelo Named CEO ’74 Z ’97 Home Depot Acquires Hughes Supply Z Stengel Named FM Pres. Acquisition of A.H. Harris (Construction & Industrial) Achieved Financial Leverage Target Range of 2.0-3.0x ’18 Two $500M Share Repurchase Programs Authorized LDC Opens FM Relocates to Atlanta Sale of Waterworks Sale of Interior Solutions ’16 ’17 1 ’18F based on the midpoint of Company guidance, published June 5, 2018
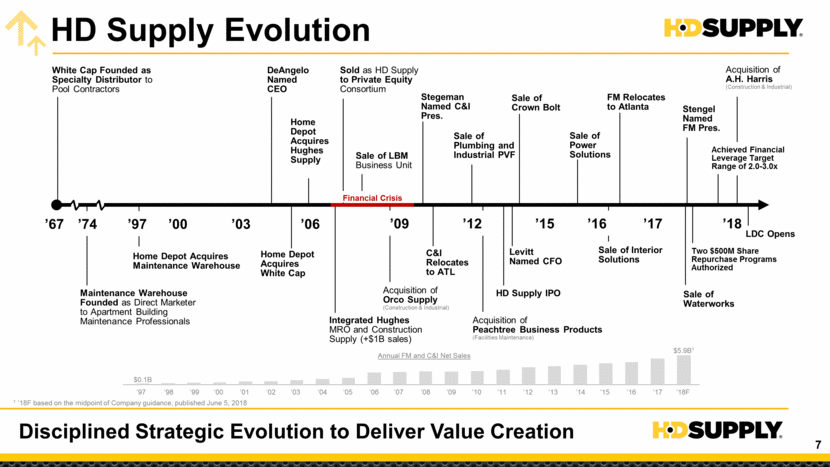
Appropriately Leveraged ~2.5x Net Debt / Adj. EBITDA Modest Fixed Charges ~$120M Cash Interest Low Complexity Two Business Units Consolidated Company Leadership in Atlanta Attractive Capital Allocation Alternatives Organic Investments Strategic Acquisitions: Density and Capabilities Share Repurchases Fiscal 2018 Highly Leveraged 7.2x Net Debt / Adj. EBITDA1 Significant Fixed Charges $527M Cash Interest High Complexity Eight Business Units Geographically Separated Leadership Teams in Multiple Cities Available Resources Used for Deleveraging Divestitures, Refinancing, Free Cash Flow Fiscal 2013 HD Supply Evolution Fundamental Business Improvements 1 At fiscal year-end 2013 following a $1.1B Initial Public Offering. Note: Contains forward looking information; please see Disclaimer on slide 2. No reconciliation of the forecasted range for Adjusted EBITDA to Net income full year fiscal 2018 is included in this presentation because we are unable to quantify certain amounts that would be required to be included in the GAAP measure without unreasonable efforts. In addition, the company believes such reconciliations would imply a degree of precision that would be confusing or misleading to investors.
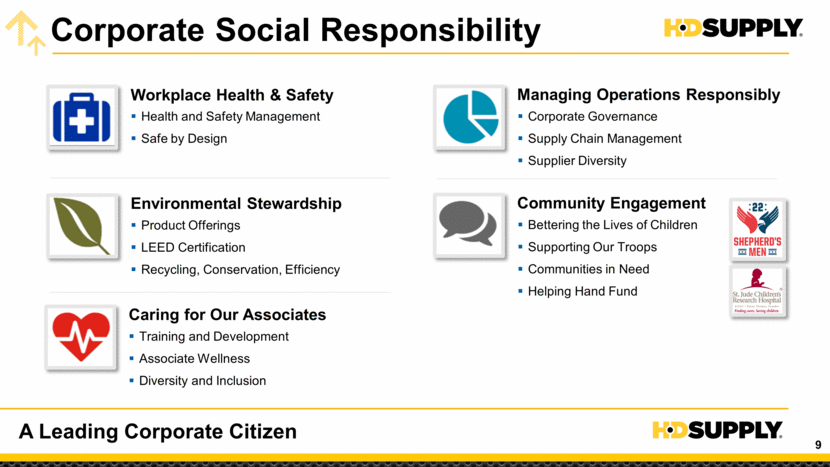
A Leading Corporate Citizen Corporate Social Responsibility Environmental Stewardship Product Offerings LEED Certification Recycling, Conservation, Efficiency Caring for Our Associates Training and Development Associate Wellness Diversity and Inclusion Workplace Health & Safety Health and Safety Management Safe by Design Managing Operations Responsibly Corporate Governance Supply Chain Management Supplier Diversity Community Engagement Bettering the Lives of Children Supporting Our Troops Communities in Need Helping Hand Fund
Investment Considerations #1 Positions in Fragmented Living Space MRO and Specialty Construction Supply Industry Segments with a Long Runway of Growth and Advantage through Scale Deep Relationships with Customers who Value Differentiated Service, Product Breadth and Knowledge, Support, Reliability, Last-Mile Logistics and Supplier Relationships; Innovation at Accelerating Pace to Better Serve Customers Successfully Grew Sales 300+ BPs in Excess of Industry and Adjusted EBITDA 1.5x Faster Across the Cycle High-Returning Organic Growth Initiatives to Drive Continued Growth in Excess of Industry and Margin Leverage, a Synergistic Acquisition Pipeline to Expand Geographic Reach and Increase Density and the Balance Sheet Flexibility to Opportunistically Repurchase Shares Experienced Team with a Strong Track-Record of Performance Across Varied Business Environments A Differentiated Growth Platform
Will Stengel President, Facilities Maintenance

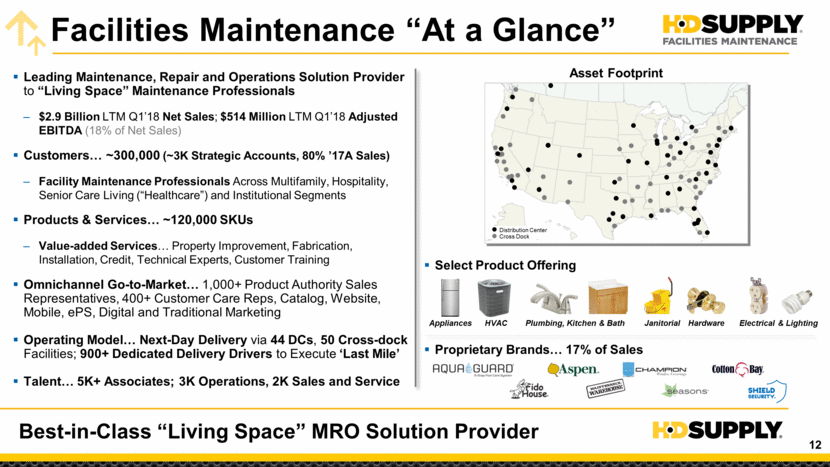
Facilities Maintenance “At a Glance” Best-in-Class “Living Space” MRO Solution Provider Leading Maintenance, Repair and Operations Solution Provider to “Living Space” Maintenance Professionals $2.9 Billion LTM Q1’18 Net Sales; $514 Million LTM Q1’18 Adjusted EBITDA (18% of Net Sales) Customers ~300,000 (~3K Strategic Accounts, 80% ’17A Sales) Facility Maintenance Professionals Across Multifamily, Hospitality, Senior Care Living (“Healthcare”) and Institutional Segments Products & Services ~120,000 SKUs Value-added Services Property Improvement, Fabrication, Installation, Credit, Technical Experts, Customer Training Omnichannel Go-to-Market 1,000+ Product Authority Sales Representatives, 400+ Customer Care Reps, Catalog, Website, Mobile, ePS, Digital and Traditional Marketing Operating Model Next-Day Delivery via 44 DCs, 50 Cross-dock Facilities; 900+ Dedicated Delivery Drivers to Execute ‘Last Mile’ Talent 5K+ Associates; 3K Operations, 2K Sales and Service Distribution Center Cross Dock Electrical & Lighting HVAC Plumbing, Kitchen & Bath Appliances Janitorial Hardware Asset Footprint Select Product Offering Proprietary Brands 17% of Sales
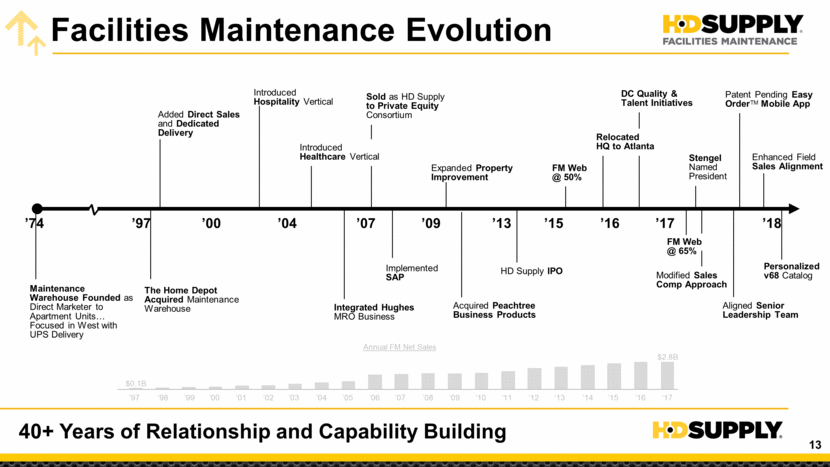
Facilities Maintenance Evolution 40+ Years of Relationship and Capability Building ’74 ’97 ’00 ’17 ’07 ’13 ’15 ’09 ’04 ’16 ’18 Z Introduced Hospitality Vertical Sold as HD Supply to Private Equity Consortium Introduced Healthcare Vertical Expanded Property Improvement FM Web @ 50% Added Direct Sales and Dedicated Delivery Enhanced Field Sales Alignment Patent Pending Easy Order Mobile App Stengel Named President DC Quality & Talent Initiatives Relocated HQ to Atlanta Maintenance Warehouse Founded as Direct Marketer to Apartment Units Focused in West with UPS Delivery The Home Depot Acquired Maintenance Warehouse HD Supply IPO Integrated Hughes MRO Business Implemented SAP Personalized v68 Catalog Modified Sales Comp Approach Acquired Peachtree Business Products FM Web @ 65% Annual FM Net Sales $2.8B $0.1B ’97 ’98 ’99 ’00 ’01 ’02 ’03 ’04 ’05 ’06 ’07 ’08 ’09 ’10 ’11 ’12 ’13 ’14 ’15 ’16 ’17 Aligned Senior Leadership Team TM
Facilities Maintenance Leadership Relevant Expertise and Team Alignment Deborah McFarlane VP, Human Resources Quiana Pinckney Director, Strategic Communications, PR Tripper Briggs VP, Strategic Business Development & PMO Marc Gonzalez VP, Chief Financial Officer Jeff Howe VP, Chief Sales Officer Dan Mueller VP, Global Supply Chain Klaus Werner VP, Chief Digital Officer Brad Paulsen VP, Merchandising, Global Sourcing, Pricing Will Stengel President 20 Years Relevant Experience 14 Years with HD Supply 30 Years <1 Year HDS 30 Years 1 Year HDS 16 Years 3 Years HDS 30 Years <1 Year HDS 20 Years 4 Years HDS 20 Years 12 Years HDS 22 Years 15 Years HDS 17 Years 10 Years HDS Selling Channels Enablers The Home Depot; Toys R Us; U.S. Army Kohl’s; UPS Windstream; Global Crossing; Motorola Alex Lee; Rosetta; Lowe’s Home Improvement; BellSouth The Home Depot The Home Depot; NASDAQ The Home Depot Constangy, Brooks, Smith & Prophete; The Powell Group The Home Depot; Bank of America; Stonebridge Associates
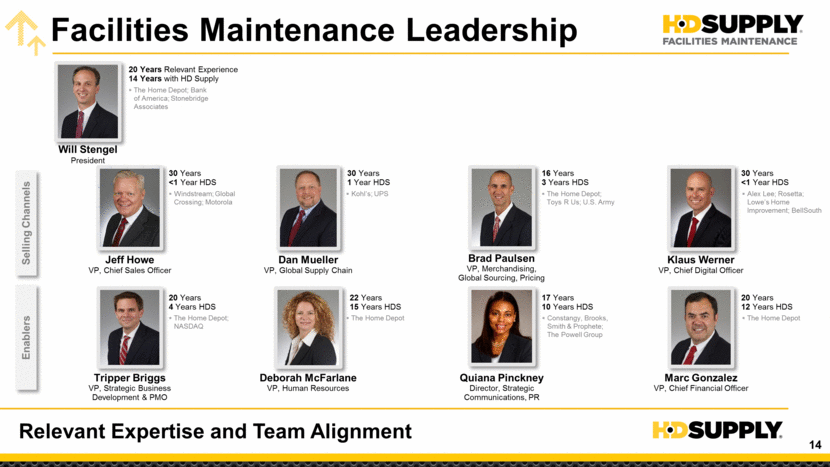
Facility Maintenance Key Facts Attractive Long-term Growth Opportunities More U.S. Households are Renting than at Any Time in Last 50 Years – NMHC Survey, U.S. Census Bureau 2016 American Community Survey, Pew Research 80% of Apartment Units Were Built 18+ Years Ago; Average Age of an Apartment is 40 Years – NMHC Survey #1 Factor Influencing Lease Renewal Decisions is Quality of Maintenance Services – Satisfacts Research 5.1 Million Hospitality Properties in United States, +300K Since 2012 – Third Party Subscription-based Research Hospitality Demand has Grown 2X as Fast as Supply in Last 5 Years – Third Party Subscription-based Research ~50% Increase in Number of Seniors by 2030 1 in 5 Americans will be of Retirement Age – U.S. Census Bureau, 2016 Baseline Number of Residents in Assisted Living Facilities Expected to Double by 2030, up to 2 Million – American Senior Communities
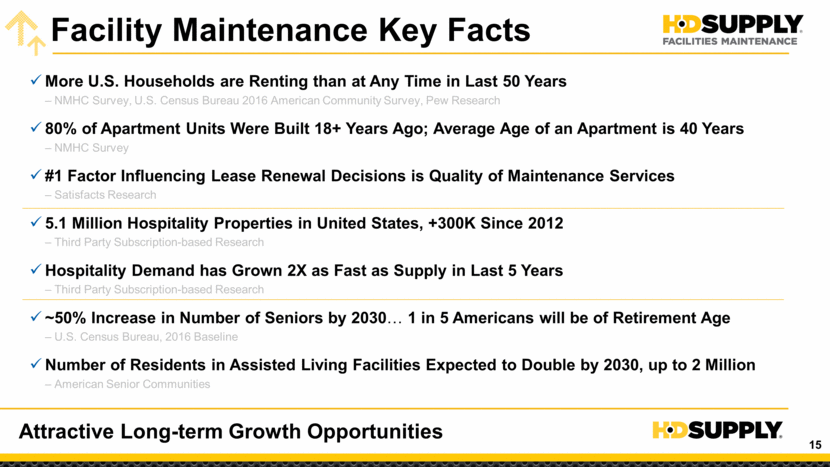
Growth Opportunity 5% Position in Large, Attractive Growth Opportunity Sell More to Existing Customers Add New Products & Services Expand Sales Channels Acquire New Customers Open New Locations $55B Total Addressable Opportunity Tactical Growth Imperatives Addressable Opportunity $2.9B 5% LTM Q1’18 Sales
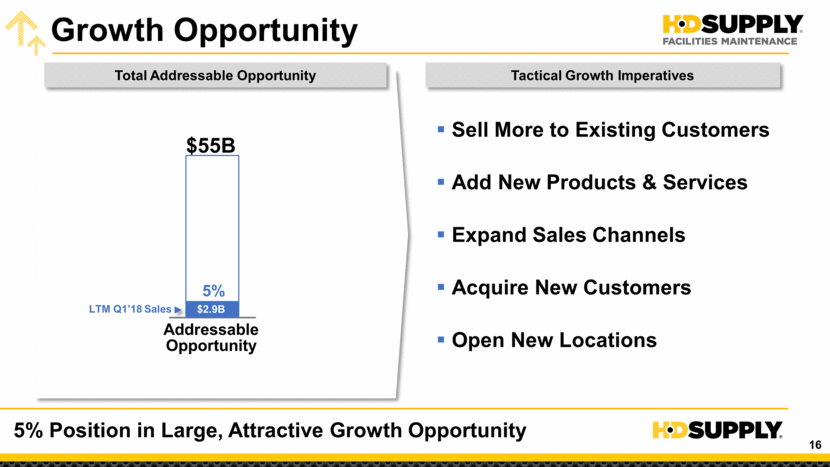
Deep Customer Relationships Focused on “Living Space” Maintenance “Living Space” Vertical Overviews Multifamily Hospitality Healthcare 65% of ’17A Sales 19% of ’17A Sales 8% of ’17A Sales Multifamily Property Owner, Operator and Management Companies; Maintenance Technician Hotel / Motel Owner, Operator, Franchisee; Maintenance Engineer, Housekeeping Professional Senior Living Facility Owner and Operator; Maintenance Engineer / Technician Customer Relationship Breadth 120,000 Unique Customers; 20M Units 2,500 Strategic Accounts 450 Field Account Reps 45,000 Unique Customers; 5M Units 200 Strategic Accounts 120 Field Account Reps 26,000 Unique Customers; 3M Units 100 Strategic Accounts 65 Field Account Reps Easy Interaction to Order, Helpful to Find the Right Products, Accurate Next Day Delivery
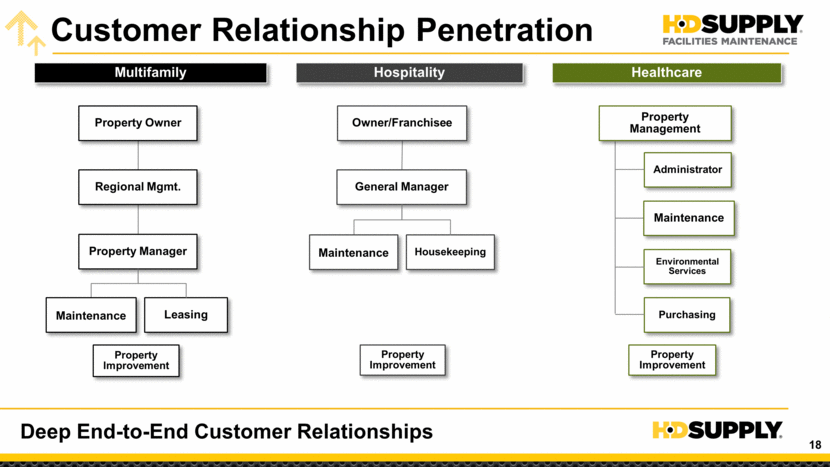
Customer Relationship Penetration Property Owner Regional Mgmt. Property Manager Leasing Property Improvement Maintenance Property Management Purchasing Environmental Services Administrator Property Improvement Maintenance Owner/Franchisee General Manager Housekeeping Property Improvement Maintenance Multifamily Hospitality Healthcare Deep End-to-End Customer Relationships
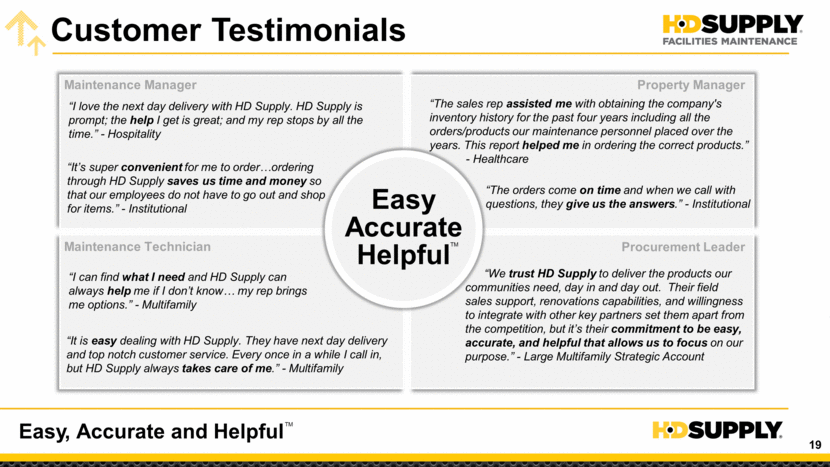
Customer Testimonials Easy, Accurate and Helpful Easy Accurate Helpful Maintenance Manager Property Manager “The sales rep assisted me with obtaining the company's inventory history for the past four years including all the orders/products our maintenance personnel placed over the years. This report helped me in ordering the correct products.” - Healthcare Maintenance Technician Procurement Leader “I love the next day delivery with HD Supply. HD Supply is prompt; the help I get is great; and my rep stops by all the time.” - Hospitality “It is easy dealing with HD Supply. They have next day delivery and top notch customer service. Every once in a while I call in, but HD Supply always takes care of me.” - Multifamily “I can find what I need and HD Supply can always help me if I don’t know my rep brings me options.” - Multifamily “It’s super convenient for me to order ordering through HD Supply saves us time and money so that our employees do not have to go out and shop for items.” - Institutional “The orders come on time and when we call with questions, they give us the answers.” - Institutional “We trust HD Supply to deliver the products our communities need, day in and day out. Their field sales support, renovations capabilities, and willingness to integrate with other key partners set them apart from the competition, but it’s their commitment to be easy, accurate, and helpful that allows us to focus on our purpose.” - Large Multifamily Strategic Account TM TM
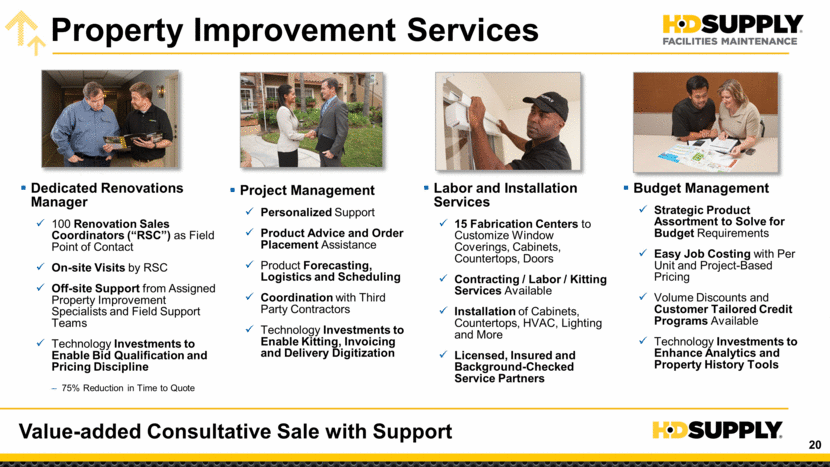
Property Improvement Services Value-added Consultative Sale with Support Dedicated Renovations Manager 100 Renovation Sales Coordinators (“RSC”) as Field Point of Contact On-site Visits by RSC Off-site Support from Assigned Property Improvement Specialists and Field Support Teams Technology Investments to Enable Bid Qualification and Pricing Discipline 75% Reduction in Time to Quote Project Management Personalized Support Product Advice and Order Placement Assistance Product Forecasting, Logistics and Scheduling Coordination with Third Party Contractors Technology Investments to Enable Kitting, Invoicing and Delivery Digitization Labor and Installation Services 15 Fabrication Centers to Customize Window Coverings, Cabinets, Countertops, Doors Contracting / Labor / Kitting Services Available Installation of Cabinets, Countertops, HVAC, Lighting and More Licensed, Insured and Background-Checked Service Partners Budget Management Strategic Product Assortment to Solve for Budget Requirements Easy Job Costing with Per Unit and Project-Based Pricing Volume Discounts and Customer Tailored Credit Programs Available Technology Investments to Enhance Analytics and Property History Tools
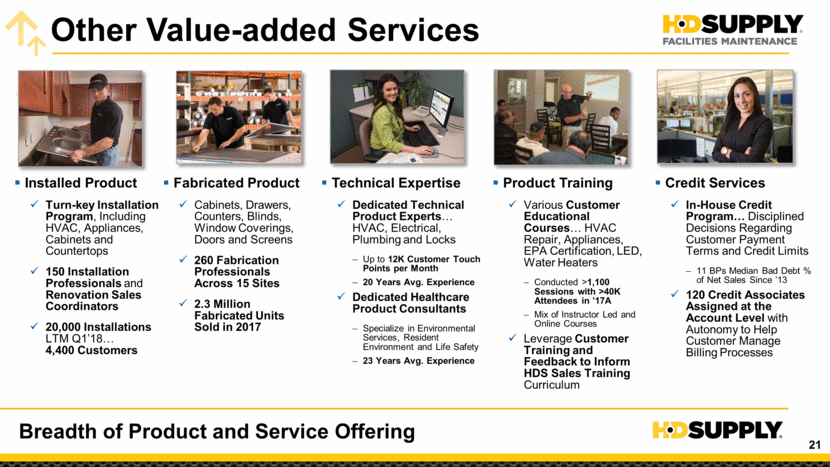
Other Value-added Services Breadth of Product and Service Offering Installed Product Turn-key Installation Program, Including HVAC, Appliances, Cabinets and Countertops 150 Installation Professionals and Renovation Sales Coordinators 20,000 Installations LTM Q1’18 4,400 Customers Fabricated Product Cabinets, Drawers, Counters, Blinds, Window Coverings, Doors and Screens 260 Fabrication Professionals Across 15 Sites 2.3 Million Fabricated Units Sold in 2017 Technical Expertise Dedicated Technical Product Experts HVAC, Electrical, Plumbing and Locks Up to 12K Customer Touch Points per Month 20 Years Avg. Experience Dedicated Healthcare Product Consultants Specialize in Environmental Services, Resident Environment and Life Safety 23 Years Avg. Experience Product Training Various Customer Educational Courses HVAC Repair, Appliances, EPA Certification, LED, Water Heaters Conducted >1,100 Sessions with >40K Attendees in ’17A Mix of Instructor Led and Online Courses Leverage Customer Training and Feedback to Inform HDS Sales Training Curriculum Credit Services In-House Credit Program Disciplined Decisions Regarding Customer Payment Terms and Credit Limits 11 BPs Median Bad Debt % of Net Sales Since ’13 120 Credit Associates Assigned at the Account Level with Autonomy to Help Customer Manage Billing Processes
Easy Accurate Helpful Selling Channel Capabilities +3x Customer Value with a HD Supply Multichannel Experience Web / Mobile Catalog / Call Center ePS Inside Sales Marketing Outside Sales Omnichannel Lifetime Value of Customer Capabilities Single Channel Multi- Channel +3x 850+ Product Authority Outside Sales Representatives 150+ Strategic Inside Sales Representatives Outbound Calling ~500 Customer Care and Special Order Service Reps Industry Leading Personalized Catalog and Strategic Digital Marketing Personalized Website Experience Patent Pending Easy Order Mobile App 900+ Dedicated Delivery Drivers Interacting with Customers “Team Selling” Customer Service Connectivity with 50+ ePS Partners 100+ Renovation Specialists Associates Co-located with Customers V V V V V V TM TM
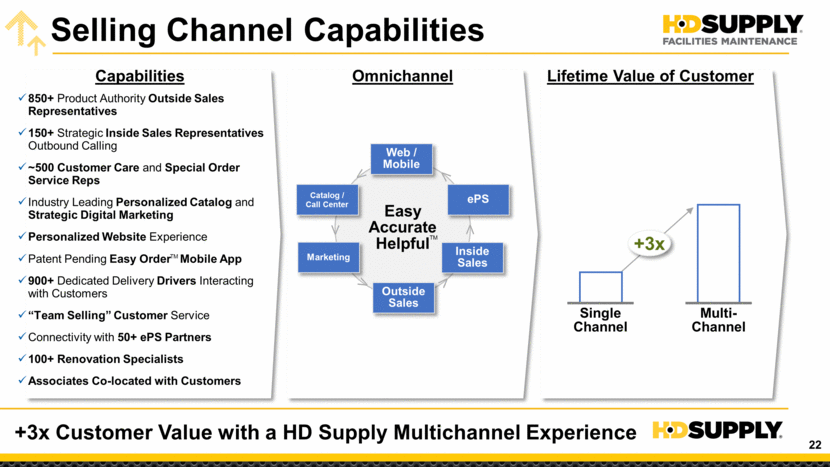
Facilities Maintenance Growth Vision Deliver a Differentiated Customer Experience Easy Accurate Helpful Growth Loyalty Increase Rents Secure Tenants Limit Unit Downtime Reduce Admin Burden Provide Spend Clarity Omnichannel Sales Embedded Services Mobile Enabled Delivery Excellence Predict and Prevent Our Value Customer Need TM
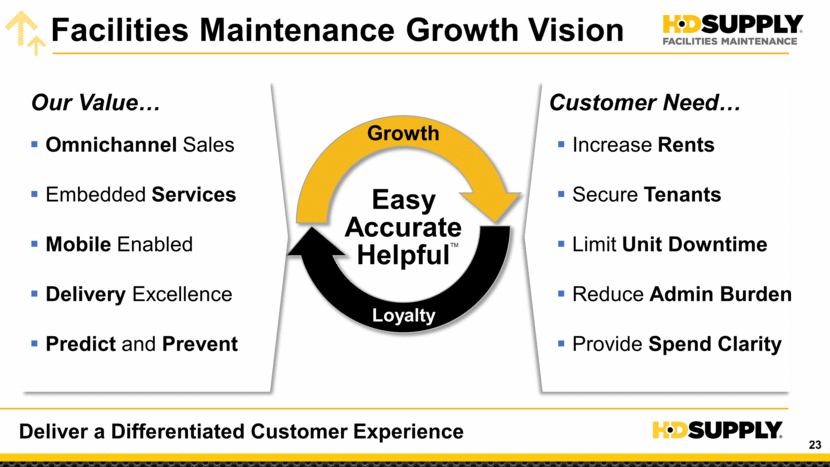
Strategic Growth Investment Focused Investment Program to Deliver Profitable Growth Selling Channels Enablers “Extend Customer Experience” “Enable Selling Channels” Objective Investment Examples Extend the Customer Experience Across Each Selling Channel Field Sales Inside Sales Customer Care Catalog and Marketing Web and Mobile Build Out Dynamic Capabilities to Enable Selling Channels Supply Chain Product Assortment Pricing Data and Analytics Talent Added Strategic Sales Coverage Sales Tools for Field Sales Enhanced Website Functionality Added Mobile Capabilities Personalized Catalog and Marketing Pricing Capabilities and Tools DC and Logistics Excellence Sales, Customer and Supply Chain Data Analytics and Visibility Next-Generation Expert Talent and Project Management Tools
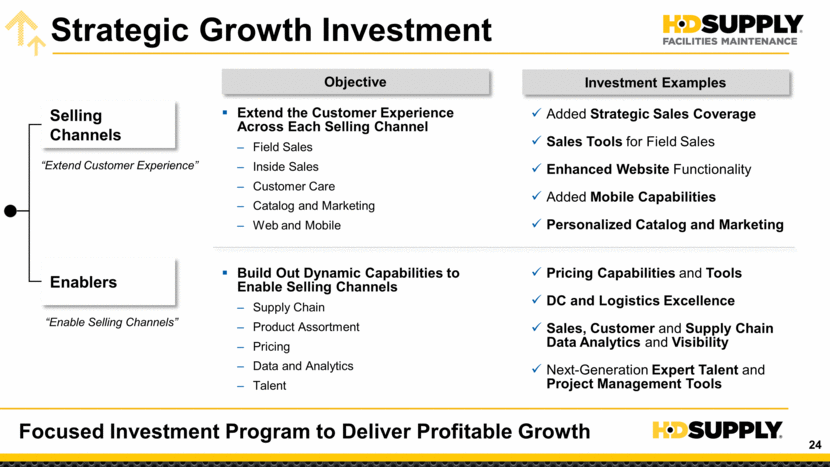
Sales Enablement Proprietary Sales Dashboard Product Spend Reporting, Compliance Tracking, Goal and Comp Performance “Super-User” Group 2x YTD Growth Versus Company Average Proprietary Customer Digital Quoting Faster and Simplified Quote Process +6x Adoption Over Past 90 Days 60% Conversion Rate 2x Improvement Strategic Marketing Coverage Targeted “Marketing Only” Coverage to Grow Existing Customers ~30K Accounts +10 Pts. Growth Improvement Investments to Sell More to Existing Customers Customized Selling Tools and Visibility Strategic Marketing Coverage Pre-Pilot Post-Pilot +10 Pts. 2 © HD Supply, Inc. All Rights Reserved. Confidential and Proprietary Information. Digital Quoting Trend Reporting § 43K+ Quotes Since Sep. ’17 – $26M in Quotes Converted to $14M in Orders 58% Quote Conversion § Encouraging Trend Over 8 Months – 46 Quotes in Sep. ’17 à 13K in Apr. ’18 – All Sales Channels and Verticals “Made the Jump” in the Last 60 Days § “Zoom In” Functionality Allows Rep Level Detail – Filter by Sales Channel, Vertical, Front Line Leader or Sales Associate to Drive Ownership and Accountability – Color Coded to Benchmark Monthly Quotes and Conversions Activity Trend Associate “Drill Down” Sep. Oct. Nov. Dec. Jan. Feb. Mar. Apr. May <$0.1 $0.3 $0.5 $0.5 $0.9 $1.5 $2.8 $8.1 $11.8 FY ’17 FY ’18 ($ in Millions) 46 503 597 823 1,523 2,789 4,730 12,990 19,178 Quote Value Quote Count 1. 713 Reps x 40 Quotes/Month x 12 Months x $600 Order Value x 58% Conversion Rate = $120M; May Scale to $200M based on Increases to Monthly Quotes, Order Value or Conversion Rate
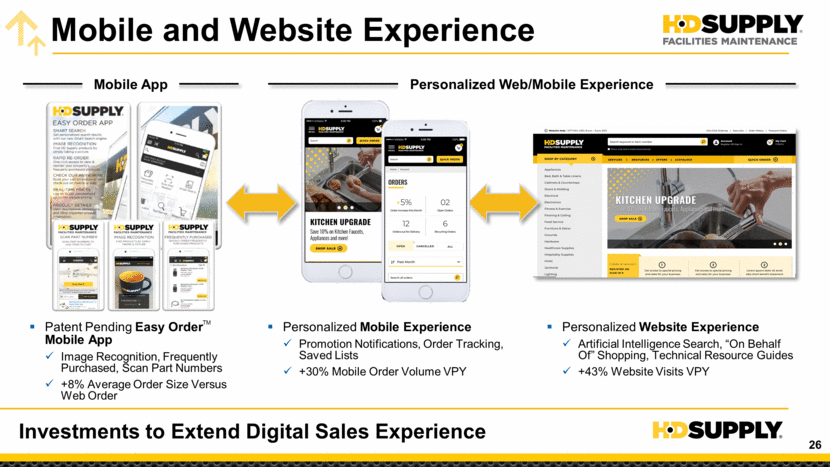
Mobile and Website Experience Patent Pending Easy Order Mobile App Image Recognition, Frequently Purchased, Scan Part Numbers +8% Average Order Size Versus Web Order Personalized Mobile Experience Promotion Notifications, Order Tracking, Saved Lists +30% Mobile Order Volume VPY Personalized Website Experience Artificial Intelligence Search, “On Behalf Of” Shopping, Technical Resource Guides +43% Website Visits VPY Investments to Extend Digital Sales Experience Mobile App Personalized Web/Mobile Experience TM
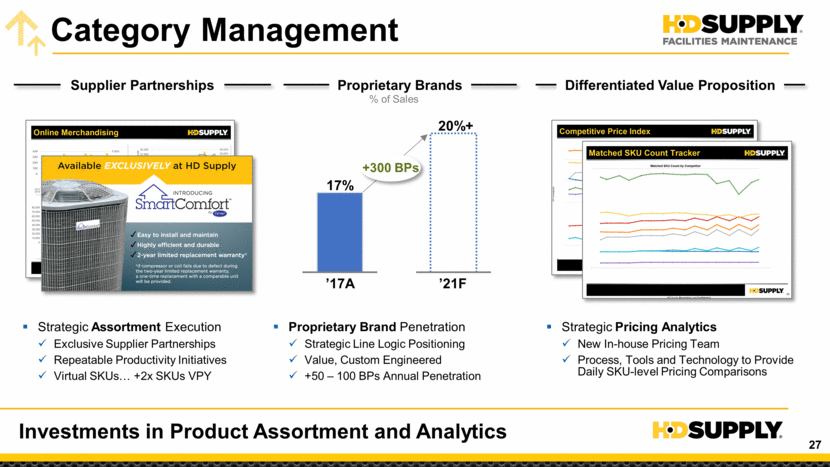
Category Management Investments in Product Assortment and Analytics Strategic Assortment Execution Exclusive Supplier Partnerships Repeatable Productivity Initiatives Virtual SKUs +2x SKUs VPY Strategic Pricing Analytics New In-house Pricing Team Process, Tools and Technology to Provide Daily SKU-level Pricing Comparisons Proprietary Brand Penetration Strategic Line Logic Positioning Value, Custom Engineered +50 – 100 BPs Annual Penetration ’17A ’21F 20%+ 17% +300 BPs Proprietary Brands Supplier Partnerships % of Sales Differentiated Value Proposition
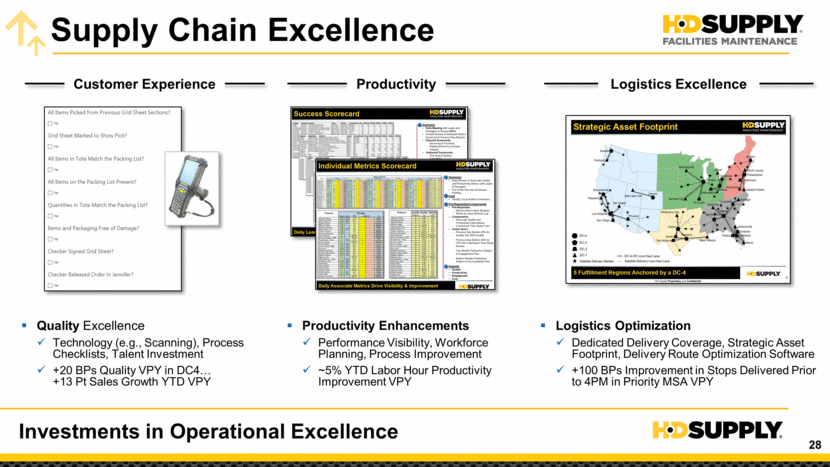
Supply Chain Excellence Quality Excellence Technology (e.g., Scanning), Process Checklists, Talent Investment +20 BPs Quality VPY in DC4 +13 Pt Sales Growth YTD VPY Logistics Optimization Dedicated Delivery Coverage, Strategic Asset Footprint, Delivery Route Optimization Software +100 BPs Improvement in Stops Delivered Prior to 4PM in Priority MSA VPY Productivity Enhancements Performance Visibility, Workforce Planning, Process Improvement ~5% YTD Labor Hour Productivity Improvement VPY Investments in Operational Excellence Logistics Excellence Productivity Customer Experience
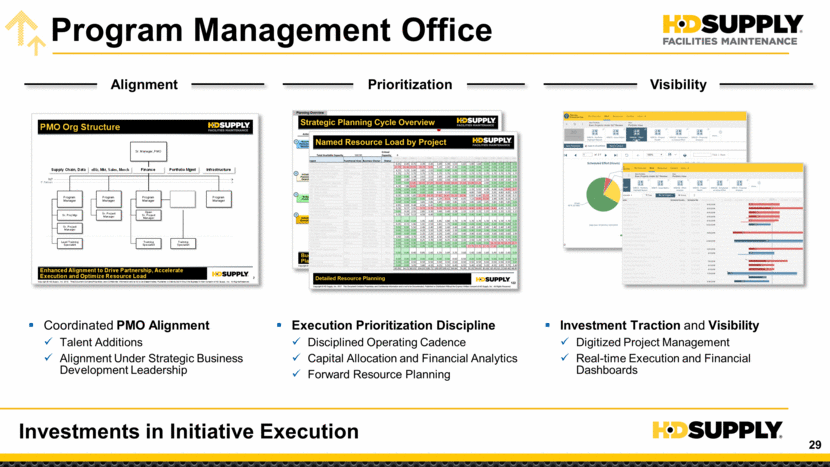
Program Management Office Investments in Initiative Execution Coordinated PMO Alignment Talent Additions Alignment Under Strategic Business Development Leadership Investment Traction and Visibility Digitized Project Management Real-time Execution and Financial Dashboards Execution Prioritization Discipline Disciplined Operating Cadence Capital Allocation and Financial Analytics Forward Resource Planning Prioritization Alignment Visibility 2 Copyright © HD Supply, Inc. 2018. This Document Contains Proprietary and Confidential Information and is not to be Disseminated , Published or Distributed Without the Express Written Consent of HD Supply, Inc. All Rights Reserved. PMO Org Structure Enhanced Alignment to Drive Partnership , Accelerate Execution and Optimize Resource Load Supply Chain, Data Sr . Project Manager Lead Training Specialist Training Specialist Finance Sr . Manager, PMO Training Specialist Portfolio Mgmt Sr . Proj Mgr Program Manager eBiz, Mkt, Sales , Merch SLT IT Partners Sr . Project Manager Program Manager Open Sr. Project Manager Program Manager Infrastructure Program Manager
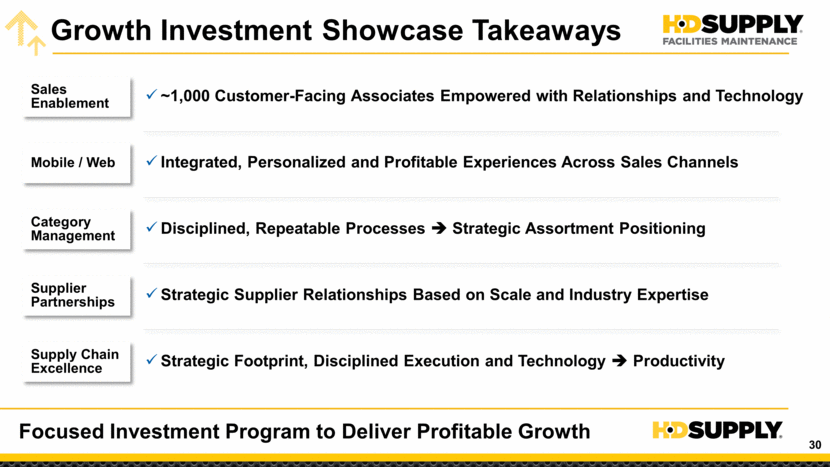
Growth Investment Showcase Takeaways Mobile / Web Category Management Sales Enablement ~1,000 Customer-Facing Associates Empowered with Relationships and Technology Integrated, Personalized and Profitable Experiences Across Sales Channels Disciplined, Repeatable Processes Strategic Assortment Positioning Supply Chain Excellence Strategic Footprint, Disciplined Execution and Technology Productivity Supplier Partnerships Strategic Supplier Relationships Based on Scale and Industry Expertise Focused Investment Program to Deliver Profitable Growth
John Stegeman President, Construction & Industrial

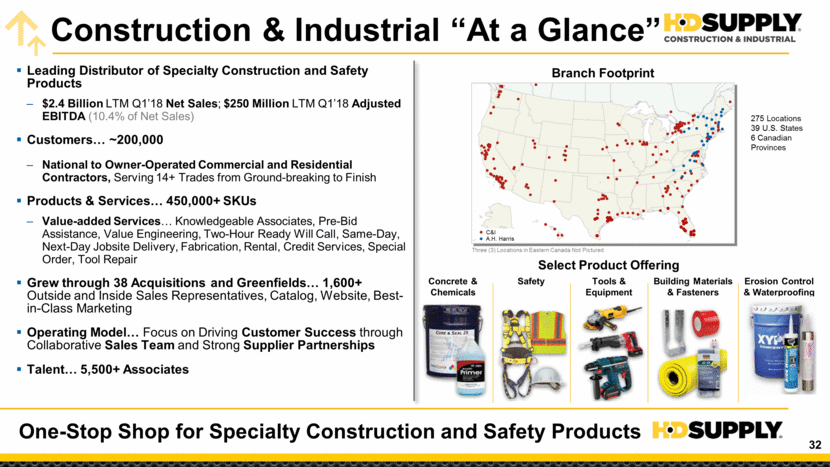
Construction & Industrial “At a Glance” One-Stop Shop for Specialty Construction and Safety Products Branch Footprint Leading Distributor of Specialty Construction and Safety Products $2.4 Billion LTM Q1’18 Net Sales; $250 Million LTM Q1’18 Adjusted EBITDA (10.4% of Net Sales) Customers ~200,000 National to Owner-Operated Commercial and Residential Contractors, Serving 14+ Trades from Ground-breaking to Finish Products & Services 450,000+ SKUs Value-added Services Knowledgeable Associates, Pre-Bid Assistance, Value Engineering, Two-Hour Ready Will Call, Same-Day, Next-Day Jobsite Delivery, Fabrication, Rental, Credit Services, Special Order, Tool Repair Grew through 38 Acquisitions and Greenfields 1,600+ Outside and Inside Sales Representatives, Catalog, Website, Best-in-Class Marketing Operating Model Focus on Driving Customer Success through Collaborative Sales Team and Strong Supplier Partnerships Talent 5,500+ Associates Concrete & Chemicals Select Product Offering Safety Tools & Equipment Building Materials & Fasteners C&I A.H. Harris Three (3) Locations in Eastern Canada Not Pictured 275 Locations 39 U.S. States 6 Canadian Provinces Erosion Control & Waterproofing
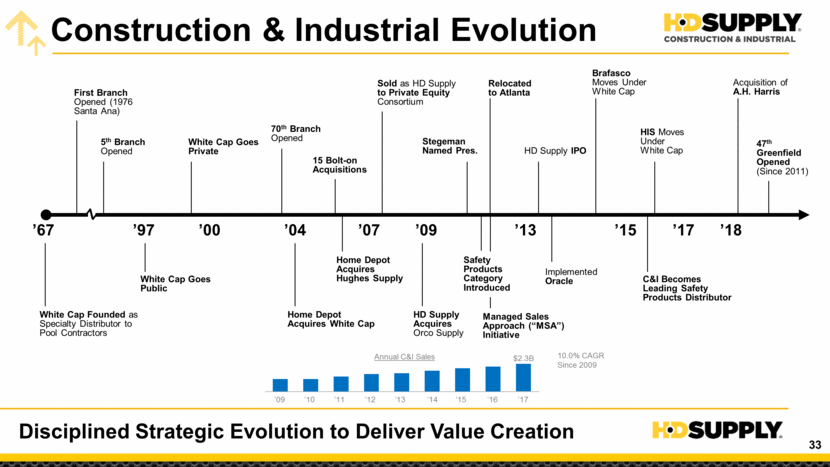
Construction & Industrial Evolution Disciplined Strategic Evolution to Deliver Value Creation Annual C&I Sales $2.3B ’09 ’10 ’11 ’12 ’13 ’14 ’15 ’16 ’17 White Cap Founded as Specialty Distributor to Pool Contractors First Branch Opened (1976 Santa Ana) Sold as HD Supply to Private Equity Consortium 70th Branch Opened Home Depot Acquires Hughes Supply 5th Branch Opened White Cap Goes Public 15 Bolt-on Acquisitions Relocated to Atlanta ’67 ’97 ’00 ’17 ’07 ’13 ’15 ’09 ’04 Acquisition of A.H. Harris 47th Greenfield Opened (Since 2011) C&I Becomes Leading Safety Products Distributor Stegeman Named Pres. HD Supply Acquires Orco Supply Safety Products Category Introduced HD Supply IPO White Cap Goes Private ’18 Home Depot Acquires White Cap Managed Sales Approach (“MSA”) Initiative Brafasco Moves Under White Cap HIS Moves Under White Cap 10.0% CAGR Since 2009 Z Implemented Oracle
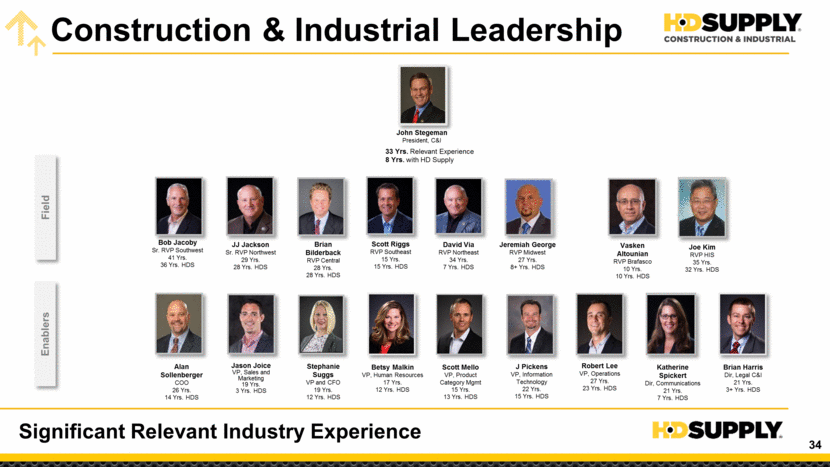
Construction & Industrial Leadership John Stegeman President, C&I Vasken Altounian RVP Brafasco 10 Yrs. 10 Yrs. HDS Katherine Spickert Dir, Communications 21 Yrs. 7 Yrs. HDS Alan Sollenberger COO 26 Yrs. 14 Yrs. HDS Joe Kim RVP HIS 35 Yrs. 32 Yrs. HDS Betsy Malkin VP, Human Resources 17 Yrs. 12 Yrs. HDS Scott Riggs RVP Southeast 15 Yrs. 15 Yrs. HDS Bob Jacoby Sr. RVP Southwest 41 Yrs. 36 Yrs. HDS Brian Bilderback RVP Central 28 Yrs. 28 Yrs. HDS JJ Jackson Sr. RVP Northwest 29 Yrs. 28 Yrs. HDS David Via RVP Northeast 34 Yrs. 7 Yrs. HDS Jason Joice VP, Sales and Marketing 19 Yrs. 3 Yrs. HDS Brian Harris Dir, Legal C&I 21 Yrs. 3+ Yrs. HDS Stephanie Suggs VP and CFO 19 Yrs. 12 Yrs. HDS Robert Lee VP, Operations 27 Yrs. 23 Yrs. HDS Scott Mello VP, Product Category Mgmt 15 Yrs. 13 Yrs. HDS Jeremiah George RVP Midwest 27 Yrs. 8+ Yrs. HDS J Pickens VP, Information Technology 22 Yrs. 15 Yrs. HDS 33 Yrs. Relevant Experience 8 Yrs. with HD Supply Enablers Field Significant Relevant Industry Experience
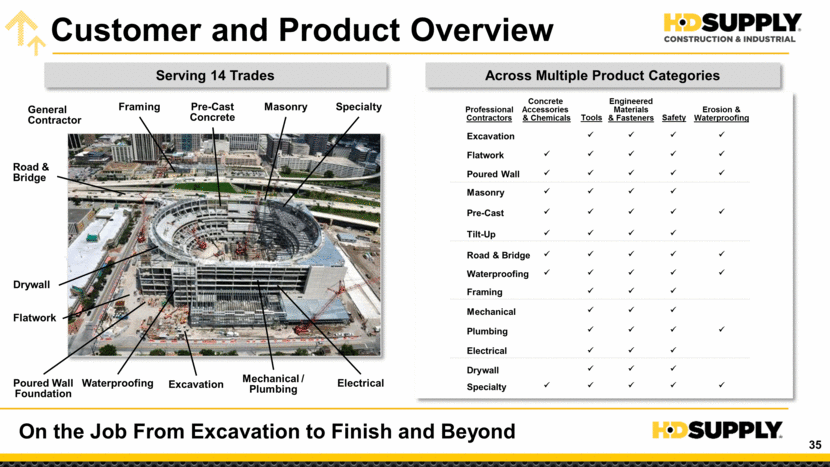
Customer and Product Overview On the Job From Excavation to Finish and Beyond Serving 14 Trades Across Multiple Product Categories Electrical Excavation Mechanical / Plumbing Poured Wall Foundation Drywall Masonry Framing Specialty Road & Bridge Pre-Cast Concrete Flatwork Waterproofing General Contractor Concrete Accessories & Chemicals Engineered Materials & Fasteners Tools Safety Erosion & Waterproofing Professional Contractors Masonry Flatwork Excavation Poured Wall Mechanical Plumbing Electrical Tilt-Up Pre-Cast Framing Road & Bridge Waterproofing Drywall Specialty
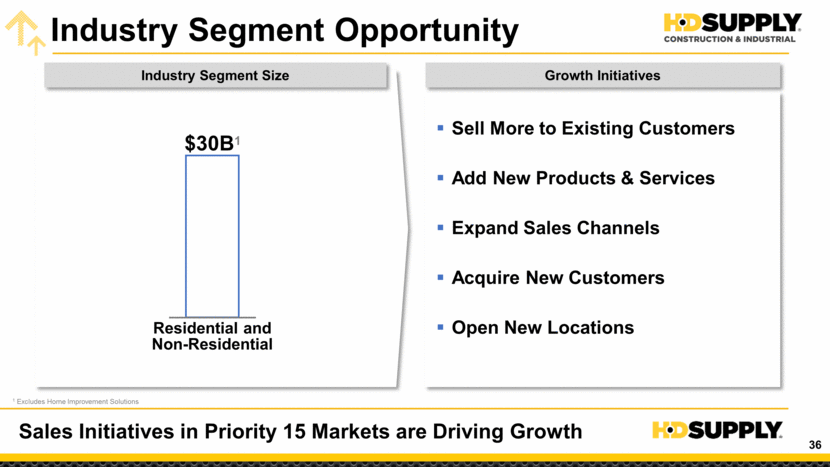
Industry Segment Opportunity Sales Initiatives in Priority 15 Markets are Driving Growth Industry Segment Size Growth Initiatives Residential and Non-Residential 1 Excludes Home Improvement Solutions $30B1 $2.9B Sell More to Existing Customers Add New Products & Services Expand Sales Channels Acquire New Customers Open New Locations
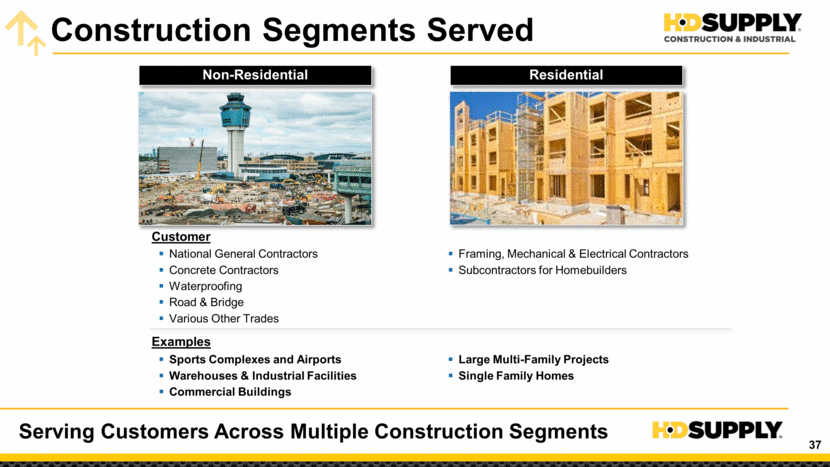
Construction Segments Served Serving Customers Across Multiple Construction Segments Non-Residential Residential National General Contractors Concrete Contractors Waterproofing Road & Bridge Various Other Trades Framing, Mechanical & Electrical Contractors Subcontractors for Homebuilders Customer Examples Sports Complexes and Airports Warehouses & Industrial Facilities Commercial Buildings Large Multi-Family Projects Single Family Homes
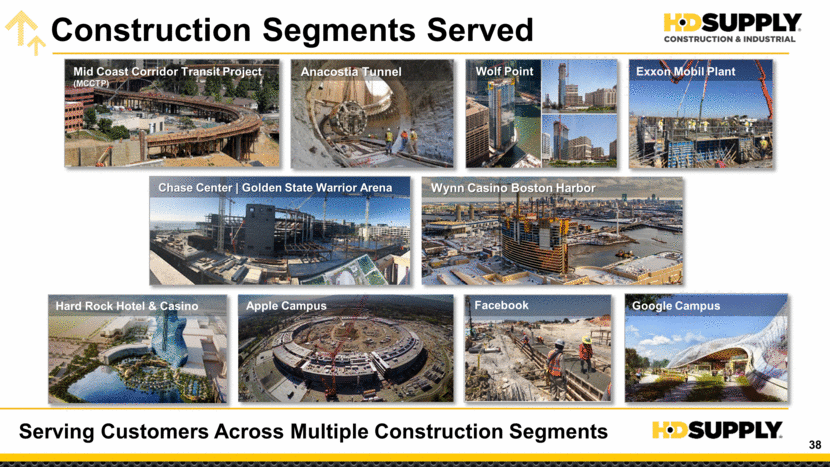
Construction Segments Served Serving Customers Across Multiple Construction Segments Anacostia Tunnel Mid Coast Corridor Transit Project (MCCTP) Wolf Point Exxon Mobil Plant Chase Center Golden State Warrior Arena Wynn Casino Boston Harbor Hard Rock Hotel & Casino Apple Campus Facebook Google Campus
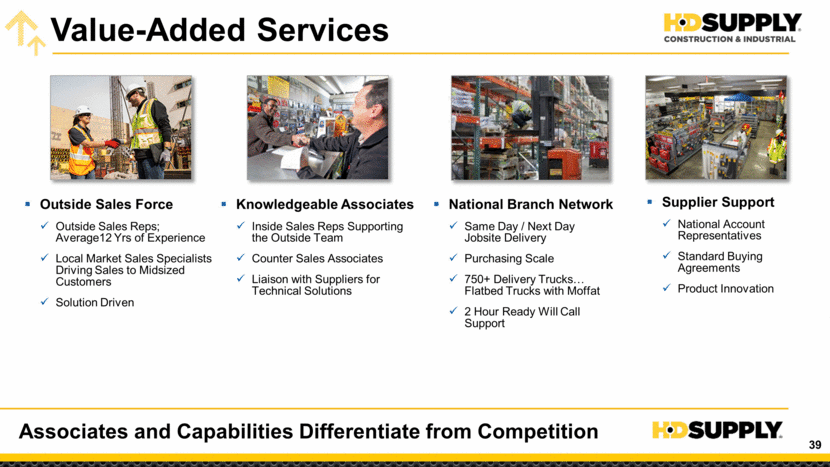
Value-Added Services Associates and Capabilities Differentiate from Competition Outside Sales Force Outside Sales Reps; Average12 Yrs of Experience Local Market Sales Specialists Driving Sales to Midsized Customers Solution Driven National Branch Network Same Day / Next Day Jobsite Delivery Purchasing Scale 750+ Delivery Trucks Flatbed Trucks with Moffat 2 Hour Ready Will Call Support Knowledgeable Associates Inside Sales Reps Supporting the Outside Team Counter Sales Associates Liaison with Suppliers for Technical Solutions Supplier Support National Account Representatives Standard Buying Agreements Product Innovation
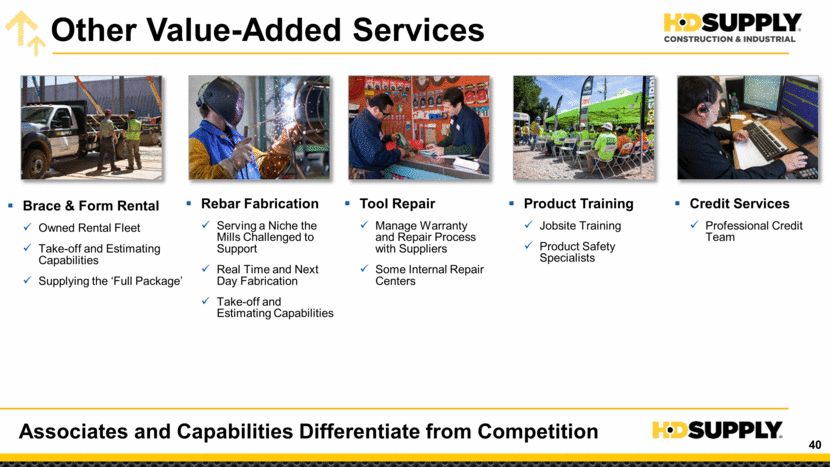
Other Value-Added Services Associates and Capabilities Differentiate from Competition Credit Services Professional Credit Team Product Training Jobsite Training Product Safety Specialists Tool Repair Manage Warranty and Repair Process with Suppliers Some Internal Repair Centers Rebar Fabrication Serving a Niche the Mills Challenged to Support Real Time and Next Day Fabrication Take-off and Estimating Capabilities Brace & Form Rental Owned Rental Fleet Take-off and Estimating Capabilities Supplying the ‘Full Package’
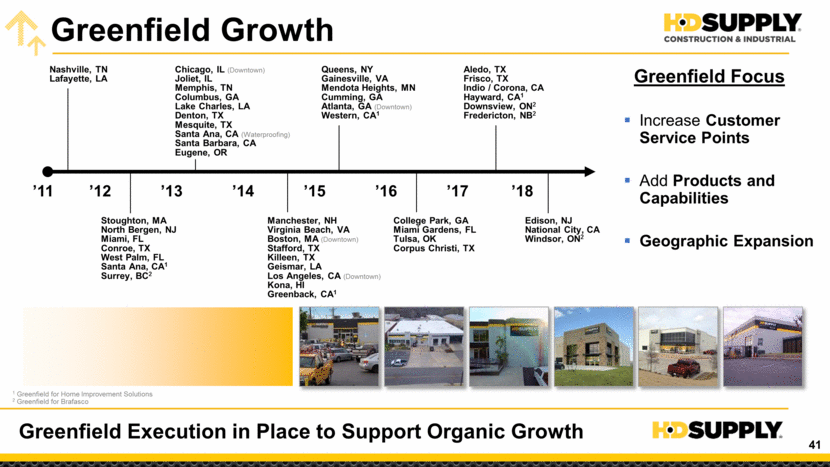
Greenfield Growth Greenfield Execution in Place to Support Organic Growth Greenfield Focus Increase Customer Service Points Add Products and Capabilities Geographic Expansion Nashville, TN Lafayette, LA Queens, NY Gainesville, VA Mendota Heights, MN Cumming, GA Atlanta, GA (Downtown) Western, CA1 Manchester, NH Virginia Beach, VA Boston, MA (Downtown) Stafford, TX Killeen, TX Geismar, LA Los Angeles, CA (Downtown) Kona, HI Greenback, CA1 Stoughton, MA North Bergen, NJ Miami, FL Conroe, TX West Palm, FL Santa Ana, CA1 Surrey, BC2 ’11 ’12 ’13 ’16 ’17 ’15 Aledo, TX Frisco, TX Indio / Corona, CA Hayward, CA1 Downsview, ON2 Fredericton, NB2 College Park, GA Miami Gardens, FL Tulsa, OK Corpus Christi, TX Chicago, IL (Downtown) Joliet, IL Memphis, TN Columbus, GA Lake Charles, LA Denton, TX Mesquite, TX Santa Ana, CA (Waterproofing) Santa Barbara, CA Eugene, OR ’14 ’18 Edison, NJ National City, CA Windsor, ON2 1 Greenfield for Home Improvement Solutions 2 Greenfield for Brafasco
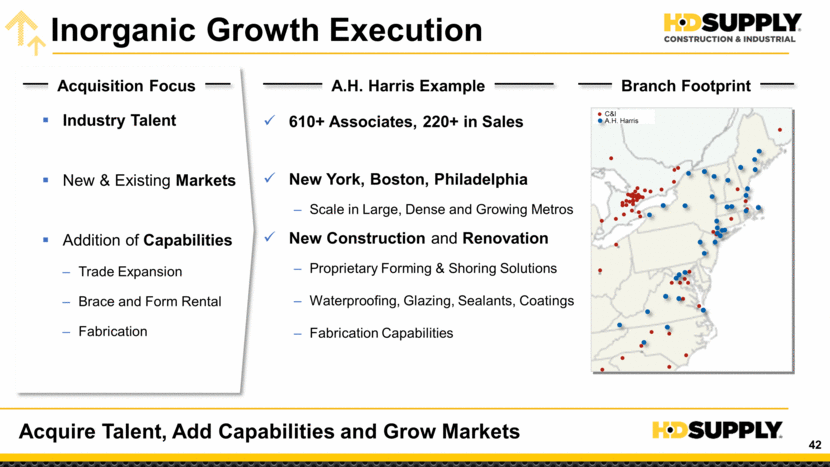
Inorganic Growth Execution Industry Talent New & Existing Markets Addition of Capabilities Trade Expansion Brace and Form Rental Fabrication Acquire Talent, Add Capabilities and Grow Markets 610+ Associates, 220+ in Sales New York, Boston, Philadelphia Scale in Large, Dense and Growing Metros New Construction and Renovation Proprietary Forming & Shoring Solutions Waterproofing, Glazing, Sealants, Coatings Fabrication Capabilities C&I A.H. Harris Acquisition Focus A.H. Harris Example Branch Footprint
Construction & Industrial Summary Positioned for Long-Term Growth #1 Position in Large, Fragmented Industry Segments Executive and Field Leadership with Significant Relevant Experience Knowledgeable Associates Drive First Choice Customer Service Strong Customer and Supplier Relationships Provide Competitive Advantage as Market Fluctuates Breadth of Products and Value Added Services Differentiate C&I and Support and Enable Continued Growth Greenfields and Acquisitions Provide Additional Opportunities for Growth
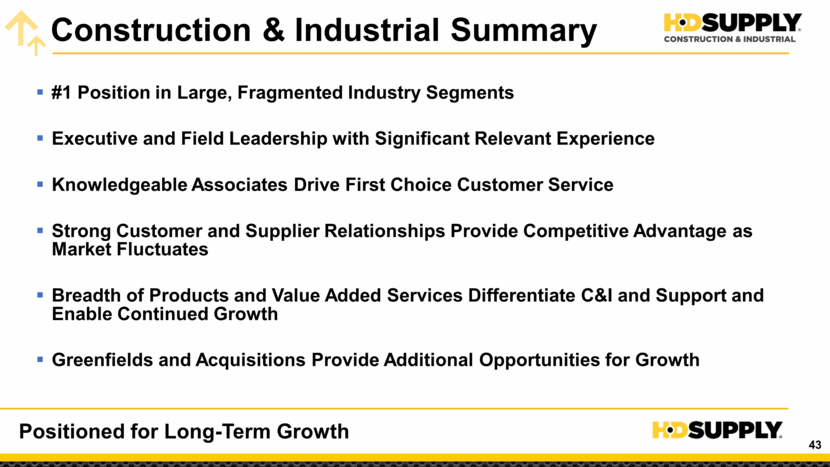
One Team, Driving Customer Success and Value Creation Customer Focused Concrete and Chemicals Safety Waterproofing Power Tools and Accessories Building Materials and Fasteners Commodities Sales and Marketing Category Management Value Added Services Training & Development Jobsite Events Growth Service Our Capabilities Our Products Preview of Afternoon Showcase
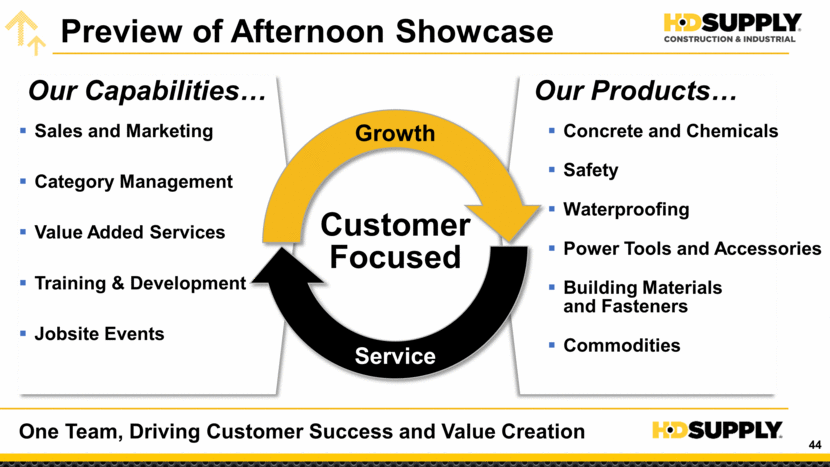
Sales and Marketing Differentiators Sales Leadership & Marketing Drives Sustained Growth Account Managers Product Sales Specialists Marketing Capabilities Catalog Trader Field Focus Technology Solutions
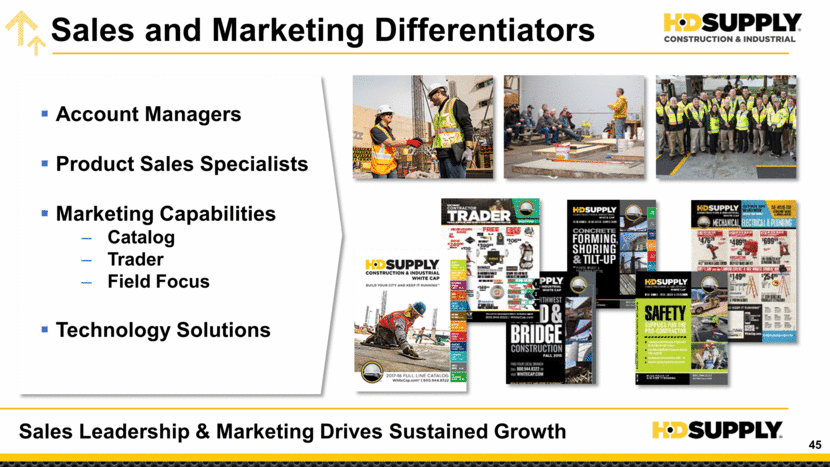
Training & Development Differentiators Investing in the Future Growth of HD Supply Career Development Program Business Leadership Workshop Sales & Pricing Training Product Training Other Programs Emerging Leaders, Functional Development
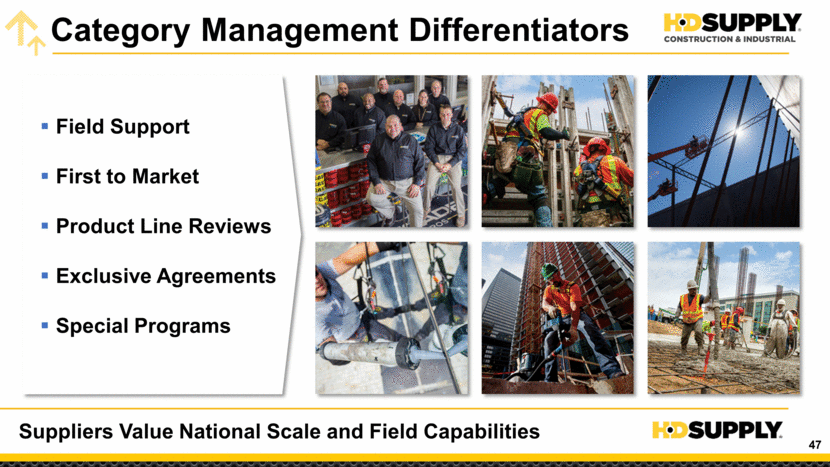
Category Management Differentiators Suppliers Value National Scale and Field Capabilities Field Support First to Market Product Line Reviews Exclusive Agreements Special Programs
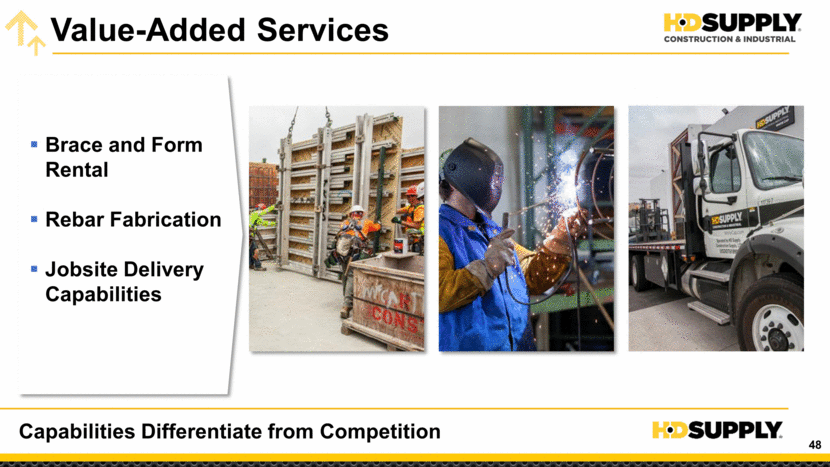
Value-Added Services Capabilities Differentiate from Competition Brace and Form Rental Rebar Fabrication Jobsite Delivery Capabilities
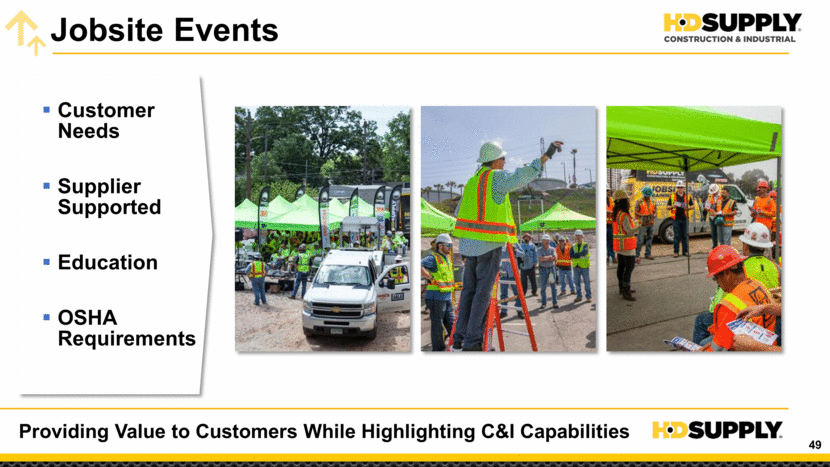
Jobsite Events Providing Value to Customers While Highlighting C&I Capabilities Customer Needs Supplier Supported Education OSHA Requirements
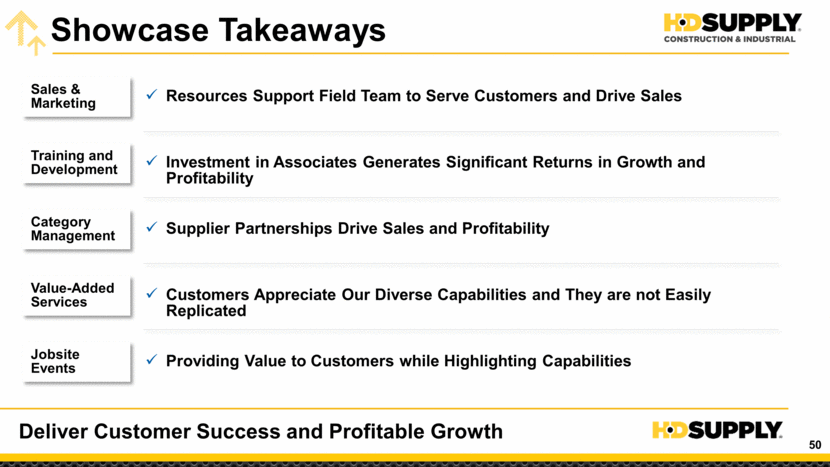
Showcase Takeaways Deliver Customer Success and Profitable Growth Training and Development Category Management Sales & Marketing Resources Support Field Team to Serve Customers and Drive Sales Investment in Associates Generates Significant Returns in Growth and Profitability Supplier Partnerships Drive Sales and Profitability Jobsite Events Providing Value to Customers while Highlighting Capabilities Value-Added Services Customers Appreciate Our Diverse Capabilities and They are not Easily Replicated
Evan Levitt CFO & Chief Administrative Officer

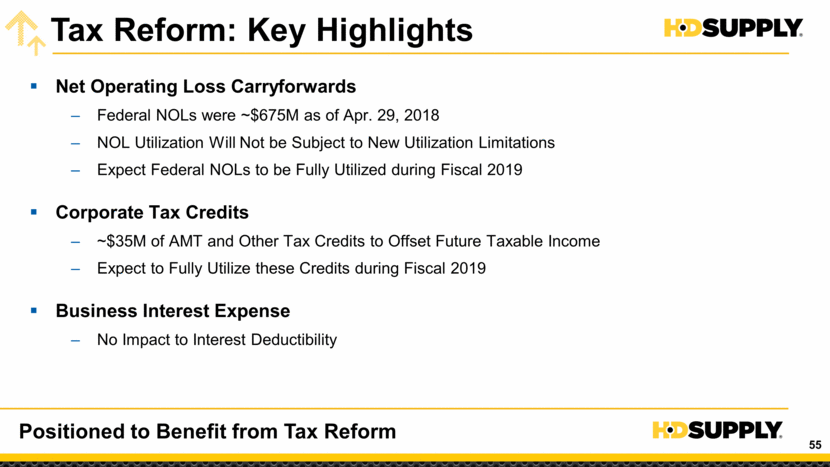
Recent Financial Performance Adjusted EBITDA ($ in millions, except per share amounts) Strong and Accelerating Profitability 1 ’18F based on the midpoint of Company guidance, published June 5, 2018 2 The LTM Q1’18 period Organic Sales Growth VPY excludes the contribution from A.H. Harris Construction Supplies, acquired March 5, 2018 3 Income from Continuing Operations in ’15A contains a $1,007 million tax benefit for the reversal of substantially all of the valuation allowance on its U.S. net deferred tax assets and a $189 million tax benefit for the reduction in unrecognized tax benefits as a result of IRS and state audit settlements 4 Free Cash Flow is defined as Operating Cash Flow, Less Capital Expenditures (including Cash Flow from Discontinued Operations) Note: “VPY” denotes Versus Prior Year, “LTM” denotes Last Twelve Months Note: Contains forward looking information; please see Disclaimer on slide 2. No reconciliation of the forecasted range for Adjusted EBITDA or Adjusted Net Income per Diluted Share to Net income for full year fiscal 2018 is included in this presentation because we are unable to quantify certain amounts that would be required to be included in the GAAP measures without unreasonable efforts. In addition, the company believes such reconciliations would imply a degree of precision that would be confusing or misleading to investors Net Sales Organic Sales Growth VPY2 Gross Margin % of Net Sales % of Net Sales Adjusted EBITDA Adjusted Net Income per Diluted Share Income from Continuing Operations3 Free Cash Flow4 ’15A $4,615 8.4% $1,814 39.3% $650 14.1% $0.67 $650M $1,200 $336 $1.50 ’16A $4,819 4.4% $1,925 39.9% $680 14.1% $680M $66 $432 $2.31 ’17A $5,121 6.3% $2,033 39.7% $731 14.3% $731M $167 $408 $4,859 $5,294 3.4% 7.9% $1,940 $2,101 39.9% 39.7% $670 $764 13.8% 14.4% LTM Q1’17 LTM Q1’18 $670M $764M $165 $198 $3.19 ’18F1 $5,880 ~8% $847 14.4% $847M ~$500
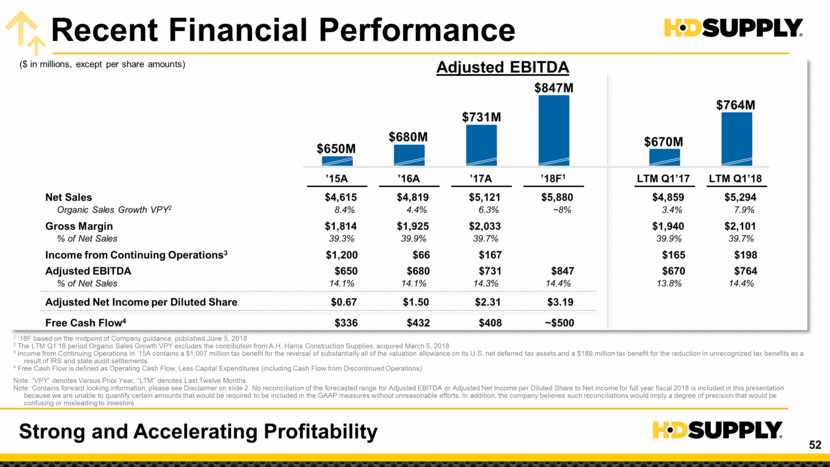
Capital Structure through the Cycle Maximizing Optionality Net Debt / Adj. EBITDA1 Down ~5 Turns ’13A ’14A 6.1x ’17A 2.2x ’18F ~2.5x ’07A 7.8x ’08A 8.9x ’09A 14.9x ’10A 11.6x ’11A 9.5x ’12A 9.3x ’15A 4.7x ’16A 4.1x Corporate Rating4 $1.1B Initial Public Offering (Jun. ’13) $0.8B Sale of Power Solutions (Oct. ’15) $2.5B Sale of Waterworks (Aug. ’17) B2/B B3/B Caa1/B Caa2/B Caa2/B Caa1/B B3/B B3/B B2/B+ B1/BB- Ba3/BB Ba3/BB+ 7.2x 1 Net Debt is defined as Outstanding Principal Balances, plus Letters of Credit, less Cash & Cash Equivalents. Adjusted EBITDA as reported 2 Includes $502M and $364M of Paid-in-Kind Interest Paid at Extinguishment in ‘12A and ‘13A, respectively 3 Includes Capital Lease Payments in ’18F. Excludes Interest Income and Original Issue Discounts and Paid-in-Kind Interest Paid at Extinguishment 4 Corporate Rating per Moody’s Investor Service / S&P Global Ratings. Ratings reflect those in place at the end of the fiscal year Note: Fiscal 2018 includes A.H. Harris as of March 5, 2018 and a 53rd week of operations Note: Contains forward looking information; please see Disclaimer on slide 2. No reconciliation of the forecasted range for Adjusted EBITDA to Net income for full year fiscal 2018 is included in this presentation because we are unable to quantify certain amounts that would be required to be included in the GAAP measure without unreasonable efforts. In addition, the company believes such reconciliations would imply a degree of precision that would be confusing or misleading to investors ($ in millions) Net Debt1 $5,821 $5,350 $5,302 $5,017 $5,421 $6,323 $5,487 $5,219 $4,137 $3,814 $1,605 Free Cash Flow2 $521 $471 $11 $502 ($280) ($796) ($498) $176 $336 $432 ~$2,100 ~$500 $408 Cash Interest Paid3 $412 $397 $366 $363 $356 $621 $527 $456 $397 $296 ~$120 $159
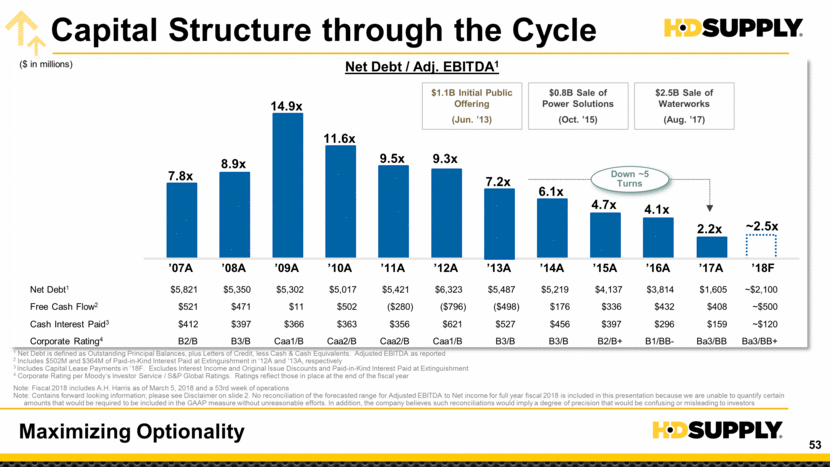
Capital Structure 2.6x Net Debt to LTM Adj. EBITDA Within Target Range Callable (S&P, Moody's) Total Debt Facilities2 Ratings Rate1 (Interest) Limit $2,128 Now @ Par Senior ABL Facility Due 2022 BBB– / na 2.91% L+125 $52 ($1.0B Facility) Now @ Par Senior Term B-3 Loans Due 2021 Senior Term B-4 Loans Due 2023 Now @ Par BBB– / Ba3 BBB– / Ba3 4.55% L+225 4.80% L+250 $533 $543 4/15/19 @ 104.313% Senior Unsecured Notes Due 2024 BB– / B2 5.75% Increases to 7.0% in Apr. ’19 $1,000 BB+ Stable / Ba3 Stable ($ in millions, as of April 29, 2018) 2.0x-3.0x Leverage Remains Long-Term Target Comfortable up to 3.0x Given Cash Flow Profile and the Low Cyclicality of the Business 1 Represents the stated rate of interest, without including the effect of discounts 2 Excludes $87M in capital lease related to the Leadership Development Center
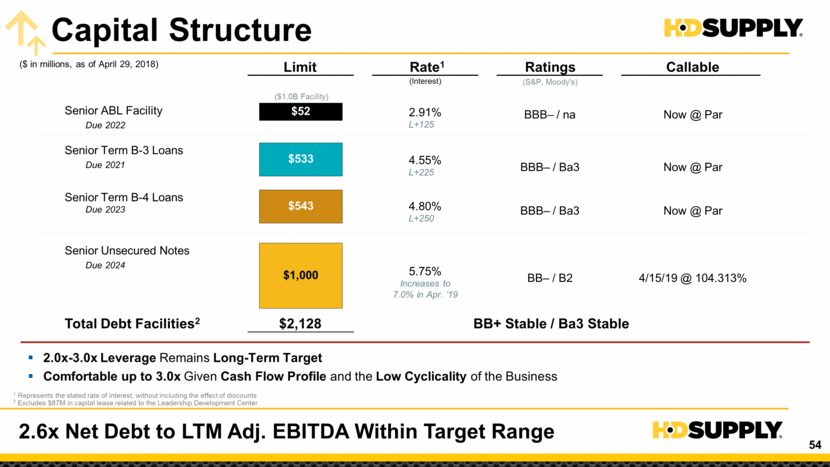
Tax Reform: Key Highlights Positioned to Benefit from Tax Reform Net Operating Loss Carryforwards Federal NOLs were ~$675M as of Apr. 29, 2018 NOL Utilization Will Not be Subject to New Utilization Limitations Expect Federal NOLs to be Fully Utilized during Fiscal 2019 Corporate Tax Credits ~$35M of AMT and Other Tax Credits to Offset Future Taxable Income Expect to Fully Utilize these Credits during Fiscal 2019 Business Interest Expense No Impact to Interest Deductibility
Long-Term Capital Allocation Strategy Allocate Capital to the Highest Return Opportunities Recent Execution Performance In Q2’17, Accelerated Investments in Selling Channels and Enablers Approximately $12M of Accelerated Investment in 2018 Robust Business Cases Justify Investments Website Visits up 43% Mobile Order Volume up 30%, Mobile Order Size +8% vs. Web 10 Pt. Growth Improvement in Pilot “Marketing Only” Accounts Completed A.H. Harris Acquisition in Mar. ’18 Scale and Industry Presence in the Northeast Enhanced Capabilities in Waterproofing, Fabrication Significant Liquidity1 Allows for Decisive Action without Financing Contingencies Strong Double-Digit Returns from Value Creation and Attractive Purchase Multiples Buy at Attractive Multiples Synergies of 1+ Turns of Adj. EBITDA Opportunity to be the Natural Consolidator Culture and New Capabilities Returned $627M to Shareholders via Share Repurchases at an Average Price of $32.39 per Share2 Repurchased 9.5% of Outstanding Shares Since Q1’17 30%+ Return from Share Repurchases as of June 20, 2018 1 Total Liquidity of $880M as of Apr. 29, 2018 2 Through June 4, 2018, via two (2) open market buyback authorizations, totaling $1.0B, Authorized Jun. 3, 2017 and Aug. 25, 2017 and executed in accordance with guidelines specified under Rule 10b5-1 of the Securities Exchange Act of 1934 Organic Growth Investments Acquisitions Capital Return to Shareholders
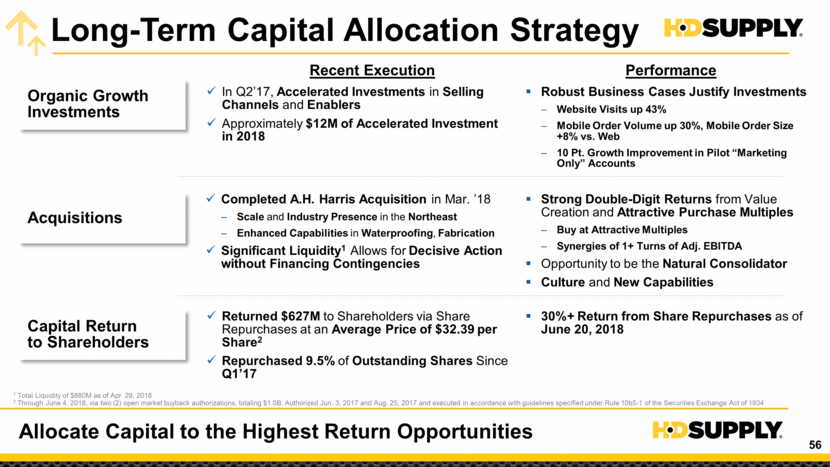
EPS Growth Framework Sustainable Earnings per Share Growth Organic Profitable Growth Target Market Growth +300 Basis Points Sales Growth 1.5x Operating Leverage on Core Sales Growth Target Maximize EBITDA with Incremental Profitable Growth Opportunities Above Target Execute Acquisitions Acquire Strategic Assets at Attractive Multiples and Realize Synergies Repurchase Outstanding Shares Opportunistically Repurchase Shares 1 Compound Annual Growth Rate Deliver EPS Growth Organic Double-Digit Earnings per Share CAGR1 through the Cycle Thereafter, Incremental Earnings per Share Growth Driven by Capital Allocation Opportunities
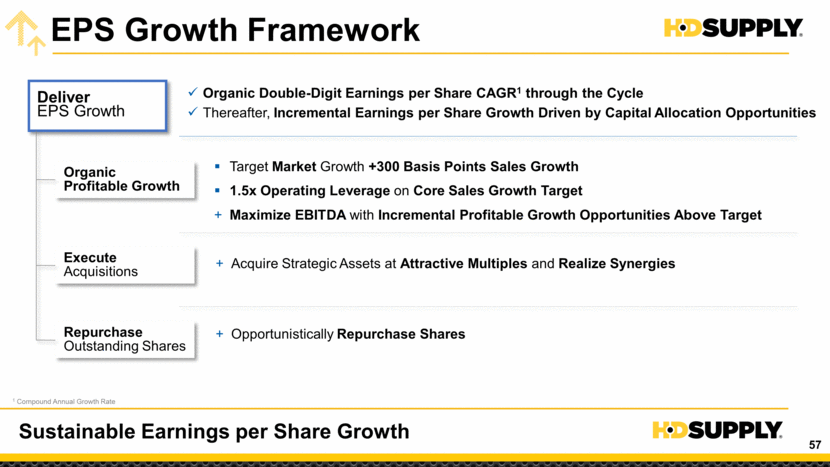
Raised FY’18 Guidance FY’18 Guidance Raised Due to Strong Q1 Performance ($ in millions) $5,121M FY’17 +300 BPs $360M $75M $5,880M Core Business Growth1 A.H Harris2 53rd Week and Holiday Shift FY’18 Net Sales $731M FY’17 1.5x FY’17 Supply Chain Costs A.H Harris2 Adj. EBITDA $40M $7M Midpoint Midpoint 53rd Week and Holiday Shift $7M FY’18 FM Accelerated Investments ($12M) Core Business Growth 1.5x Op. Lev4 $279M $62M $5,940M $5,820M FY’18 $847M $862M $832M 1 End Market estimate of 2%-3% is the management estimate of the growth of our industry segments based on multiple quantitative and long-term average growth target based on management estimates and projections 2 Consolidated from March 5, 2018 3 Guidance raised on June 5, 2018 4 Operating Leverage is defined as Adjusted EBITDA growth divided by total Net Sales growth Note: Contains forward looking information; please see Disclaimer on slide 2. No reconciliation of the forecasted range for Adjusted EBITDA to Net income for full year fiscal 2018 is included in this presentation because we are unable to quantify certain amounts that would be required to be included in the GAAP measure without unreasonable efforts. In addition, the company believes such reconciliations would imply a degree of precision that would be confusing or misleading to investors. $45M Guidance Raised3 Guidance Raised3 $12M
Appendix

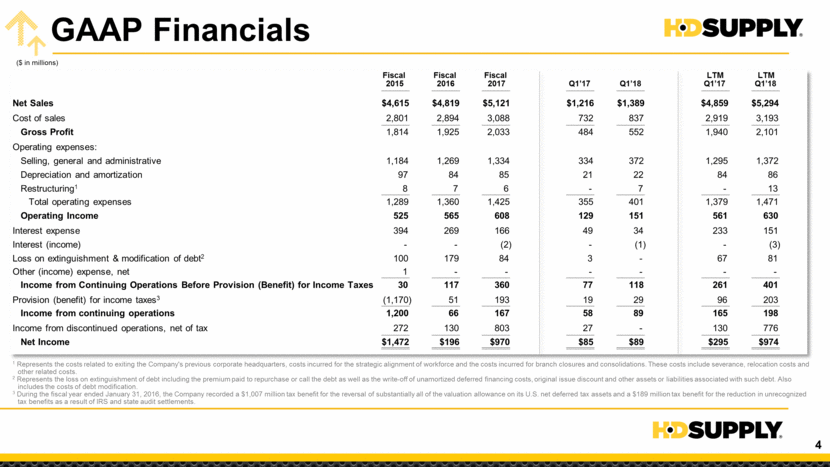
1 During the fiscal year ended January 31, 2016, the Company recorded a $1,007 million tax benefit for the reversal of substantially all of the valuation allowance on its U.S. net deferred tax assets and a $189 million tax benefit for the reduction in unrecognized tax benefits as a result of IRS and state audit settlements. 2 Depreciation and amortization includes amounts recorded within Cost of sales in the Consolidated Statements of Operations. 3 Represents the loss on extinguishment of debt including the premium paid to repurchase or call the debt as well as the write-off of unamortized deferred financing costs, original issue discount and other assets or liabilities associated with such debt. Also includes the costs of debt modification. 4 Represents the costs incurred for strategic alignment of workforce and branch closures or consolidations. These costs include occupancy costs, severance, relocation costs and other costs incurred to exit a location. 5 Represents the cost incurred in the acquisition and integration of A.H. Harris Construction Supplies. 6 Cash paid for income taxes in fiscal 2017 and LTM Q1’18 excludes $13 million in tax payments related to the sale of the Waterworks business unit. Reconciliation of Non-GAAP Measures Fiscal 2015 Fiscal 2016 Fiscal 2017 Q1’17 Q1’18 LTM Q1’17 LTM Q1’18 Net income $1,472 $196 $970 $85 $89 $295 $974 Less: Income from discontinued operations, net of tax 272 130 803 27 - 130 776 Income from continuing operations 1,200 66 167 58 89 165 198 Interest Expense, net 394 269 164 49 33 233 148 Provision (benefit) for income taxes1 (1,170) 51 193 19 29 96 203 Depreciation and amortization2 100 88 90 22 24 89 92 Loss on extinguishment & modification of debt3 100 179 84 3 - 67 81 Restructuring charges4 8 7 6 - 7 - 13 Stock-based compensation 16 20 26 6 6 20 26 Acquisition and integration costs5 - - 1 - 2 - 3 Other 2 - - - - - - Adjusted EBITDA $650 $680 $731 $157 $190 $670 $764 Net income $1,472 $196 $970 $85 $89 $295 $974 Less: Income from discontinued operations, net of tax 272 130 803 27 - 130 776 Income from continuing operations 1,200 66 167 58 89 165 198 Plus: Provision (benefit) for income taxes1 (1,170) 51 193 19 29 96 203 Less: Cash income taxes6 (16) (13) (16) (3) (2) (15) (15) Plus: Amortization of acquisition-related intangible assets (other than software) 12 12 12 3 5 12 14 Plus: Loss on extinguishment & modification of debt3 100 179 84 3 - 67 81 Plus: Restructuring charges4 8 7 6 - 7 - 13 Plus: Acquisition and integration costs5 - - 1 - 2 - 3 Plus: Other 1 - - - - - - Adjusted net income $135 $302 $447 $80 $130 $325 $497 Weighted Average Common Shares Outstanding (in thousands) Basic 197,011 199,385 192,236 200,708 184,326 Diluted 201,308 202,000 193,668 203,017 185,155 Adjusted Net Income per Share - Basic $0.69 $1.51 $2.33 $0.40 $0.71 Adjusted Net Income per Share - Diluted $0.67 $1.50 $2.31 $0.39 $0.70 ($ in millions, except per share amounts)
