Attached files
| file | filename |
|---|---|
| EX-32.4 - EX-32.4 - HD Supply Holdings, Inc. | a2231265zex-32_4.htm |
| EX-32.3 - EX-32.3 - HD Supply Holdings, Inc. | a2231265zex-32_3.htm |
| EX-32.2 - EX-32.2 - HD Supply Holdings, Inc. | a2231265zex-32_2.htm |
| EX-32.1 - EX-32.1 - HD Supply Holdings, Inc. | a2231265zex-32_1.htm |
| EX-31.4 - EX-31.4 - HD Supply Holdings, Inc. | a2231265zex-31_4.htm |
| EX-31.3 - EX-31.3 - HD Supply Holdings, Inc. | a2231265zex-31_3.htm |
| EX-31.2 - EX-31.2 - HD Supply Holdings, Inc. | a2231265zex-31_2.htm |
| EX-31.1 - EX-31.1 - HD Supply Holdings, Inc. | a2231265zex-31_1.htm |
| EX-23.1 - EX-23.1 - HD Supply Holdings, Inc. | a2231265zex-23_1.htm |
| EX-21.1 - EX-21.1 - HD Supply Holdings, Inc. | a2231265zex-21_1.htm |
| EX-12.1 - EX-12.1 - HD Supply Holdings, Inc. | a2231265zex-12_1.htm |
Use these links to rapidly review the document
TABLE OF CONTENTS
HD SUPPLY
PART IV
UNITED STATES
SECURITIES AND EXCHANGE COMMISSION
Washington, D.C. 20549
FORM 10-K
ý |
ANNUAL REPORT PURSUANT TO SECTION 13 OR 15(d) OF THE SECURITIES EXCHANGE ACT OF 1934 |
|
For the fiscal year ended January 29, 2017 |
||
or |
||
o |
TRANSITION REPORT PURSUANT TO SECTION 13 OR 15(d) OF THE SECURITIES EXCHANGE ACT OF 1934 |
|
For the transaction period
from to
|
||
| Commission File Number |
Exact name of Registrant as specified in its charter, Address of principal executive offices and Telephone number |
State of incorporation | I.R.S. Employer Identification Number |
||||
|---|---|---|---|---|---|---|---|
001-35979 |
HD SUPPLY HOLDINGS, INC. 3100 Cumberland Boulevard, Suite 1480 Atlanta, Georgia 30339 (770) 852-9000 |
Delaware | 26-0486780 | ||||
333-159809 |
HD SUPPLY, INC. |
Delaware |
75-2007383 |
||||
Securities registered pursuant to Section 12 (b) of the Act:
HD Supply Holdings, Inc.: Common stock, par value $0.01 per share |
The NASDAQ Stock Market LLC |
|
(Title of Each Class) |
(Name of Each Exchange on which Registered) |
Securities registered pursuant to Section 12 (g) of the Act:
|
None | |||
|
(Title of Class) |
Indicate by check mark if the registrant is a well-known seasoned issuer, as defined in Rule 405 of the Securities Act.
HD Supply Holdings, Inc. |
Yes ý | No o | HD Supply, Inc. |
Yes o | No ý |
Indicate by check mark if the registrant is not required to file reports pursuant to Section 13 or Section 15(d) of the Act.
HD Supply Holdings, Inc. |
Yes o | No ý | HD Supply, Inc. |
Yes ý | No o |
Indicate by check mark whether the registrant (1) has filed all reports required to be filed by Section 13 or 15(d) of the Securities Exchange Act of 1934 during the past 12 months (or for such shorter period that the registrant was required to file such reports), and (2) has been subject to such filing requirements for the past 90 days.
HD Supply Holdings, Inc. |
Yes ý | No o | HD Supply, Inc. |
Yes o | No ý |
Indicate by check mark whether the registrant has submitted electronically and posted on its corporate Web site, if any, every Interactive Data File required to be submitted and posted pursuant to Rule 405 of Regulation S-T (§232.405) during the preceding 12 months (or for such shorter period that the registrant was required to submit and post such files).
HD Supply Holdings, Inc. |
Yes ý | No o | HD Supply, Inc. |
Yes ý | No o |
Indicate by check mark if disclosure of delinquent filers in response to Item 405 of Regulation S-K (§229.405) is not contained herein, and will not be contained, to the best of registrant's knowledge, in definitive proxy or information statements incorporated by reference in Part III of this Form 10-K or any amendment to this Form 10-K.
HD Supply Holdings, Inc. |
ý | HD Supply, Inc. | ý |
Indicate by check mark whether the registrant is a large accelerated filer, an accelerated filer, a non-accelerated filer, or a smaller reporting company. See the definitions of "large accelerated filer," "accelerated filer," and "smaller reporting company" in Rule 12b-2 of the Exchange Act.
HD Supply Holdings, Inc. |
||||||
Large accelerated filer ý |
Accelerated filer o |
Non-accelerated filer o |
Smaller reporting company o |
|||
HD Supply, Inc. |
|
|
||||
Large accelerated filer o |
Accelerated filer o |
Non-accelerated filer ý |
Smaller reporting company o |
|||
Indicate by check mark whether the registrant is a shell company (as defined in Rule 12b-2 of the Act).
HD Supply Holdings, Inc. |
Yes o | No ý | HD Supply, Inc. |
Yes o | No ý |
The aggregate market value of the voting common stock held by non-affiliates of the registrant as of July 29, 2016 (the last business day of our most recently completed fiscal second quarter) was $7,271,295,053.
The number of shares of the registrant's common stock outstanding as of March 10, 2017:
HD Supply Holdings, Inc. |
201,718,760 shares of common stock, par value $0.01 per share | |
HD Supply, Inc. |
1,000 shares of common stock, par value $0.01 per share, all of which were owned by HDS Holding Corporation, a wholly-owned subsidiary of HD Supply Holdings, Inc. |
HD Supply, Inc. meets the conditions set forth in General Instruction I(1)(a) and (b) of Form 10-K and is therefore filing this Form with the reduced disclosure format applicable to HD Supply, Inc.
Documents incorporated by reference:
Portions of HD Supply Holdings, Inc.'s proxy statement to be filed with the Securities and Exchange Commission in connection with HD Supply Holdings, Inc.'s 2017 annual meeting of stockholders (the "Proxy Statement') are incorporated by reference into Part III hereof. Such Proxy Statement will be filed within 120 days of HD Supply Holdings, Inc.'s fiscal year ended January 29, 2017.
INDEX TO FORM 10-K
This Form 10-K is a combined annual report being filed separately by two registrants: HD Supply Holdings, Inc. and HD Supply, Inc. Unless the context indicates otherwise, any reference in this report to "Holdings" refers to HD Supply Holdings, Inc., any reference to "HDS" refers to HD Supply, Inc., the indirect wholly-owned subsidiary of Holdings, and any references to "HD Supply," the "Company," "we," "us" and "our" refer to HD Supply Holdings, Inc. together with its direct and indirect subsidiaries, including HDS. Each registrant hereto is filing on its own behalf all of the information contained in this annual report that relates to such registrant. Each registrant hereto is not filing any information that does not relate to such registrant, and therefore makes no representation as to any such information.
Background Information and Glossary of Certain Defined Terms
The 2007 Transactions
On August 30, 2007, investment funds associated with Clayton, Dubilier & Rice, LLC ("CD&R"), The Carlyle Group ("Carlyle") and Bain Capital Partners, LLC ("Bain", and together with CD&R and Carlyle, the "Equity Sponsors") formed Holdings (previously named HDS Investment Holding, Inc.) and entered into a stock purchase agreement with The Home Depot, Inc. ("Home Depot") pursuant to which Home Depot agreed to sell to Holdings, or to a wholly-owned subsidiary of Holdings, certain intellectual property and all the outstanding common stock of HDS and the Canadian subsidiary CND Holdings, Inc. On August 30, 2007, through a series of transactions, Holdings' direct wholly-owned subsidiary, HDS Holding Corporation, acquired direct control of HDS through the merger of its wholly-owned subsidiary, HDS Acquisition Corp., with and into HDS and CND Holdings, Inc. Through these transactions (the "2007 Transactions"), Home Depot was paid cash of $8.2 billion and 12.5% of Holdings' then outstanding common stock.
Upon completion of Holdings' secondary public offerings in fiscal 2014 and fiscal 2015, the Equity Sponsors and Home Depot sold all of their remaining original investment in Holdings.
Defined Terms for Indebtedness
In this annual report on Form 10-K, unless otherwise indicated or the context otherwise requires:
- •
- "2007 Senior Subordinated Notes" refers to HDS's 13.5% Senior Subordinated Notes due 2015.
- •
- "2012 First Priority Notes" refers collectively to the April 2012 First Priority Notes and the Additional Notes.
- •
- "Additional Notes" refers to HDS's 81/8% Senior Secured First Priority Notes due 2019 issued on August 2, 2012 in an
aggregate principal amount of $300 million.
- •
- "April 2012 First Priority Notes" refers to HDS's 81/8% Senior Secured First Priority Notes due 2019 issued on April 12,
2012 in an aggregate principal amount of $950 million.
- •
- "April 2012 Second Priority Notes" refers to HDS's 11.0% Senior Secured Second Priority Notes due 2020 issued on April 12, 2012 in an
aggregate principal amount of $675 million.
- •
- "December 2014 First Priority Notes" refers to HDS's 5.25% Senior Secured First Priority Notes due 2021 issued on December 4, 2014 in an
aggregate principal amount of $1,250 million.
- •
- "April 2016 Senior Unsecured Notes" refers to HDS's 5.75% Senior Unsecured Notes due 2024 issued on April 11, 2016 in an aggregate
principal amount of $1,000 million.
- •
- "February 2013 Senior Unsecured Notes" refers to HDS's 7.50% Senior Notes due 2020 issued on February 1, 2013 in an aggregate principal amount of $1,275 million.
1
- •
- "January 2013 Senior Subordinated Notes" refers to HDS's 10.5% Senior Subordinated Notes due 2021 issued on January 16, 2013 in an
aggregate principal amount of $950 million.
- •
- "October 2012 Senior Unsecured Notes" refers to HDS's 11.50% Senior Notes due 2020 issued on October 15, 2012 in an aggregate principal
amount of $1,000 million.
- •
- "Priority Notes" refers collectively to the December 2014 First Priority Notes and the April 2012 Second Priority Notes.
- •
- "Senior ABL Facility" refers to HDS's asset based lending facility issued on April 12, 2012, providing for senior secured revolving
loans and letters of credit of up to a maximum aggregate principal amount of $1,500 million (subject to availability under the borrowing base).
- •
- "Senior Credit Facilities" refers collectively to the Senior ABL Facility and the Term Loan Facility.
- •
- "Senior Notes" refers collectively to the October 2012 Senior Unsecured Notes and February 2013 Senior Unsecured Notes.
- •
- "Term Loan" refers to the term loans issued under the Term Loan Facility.
- •
- "Term Loan Facility" refers to HDS's senior secured credit facility issued on April 12, 2012, providing for Term Loans in an aggregate
principal amount of $1,000 million.
- •
- "Term B-1 Loans" refers to the tranche of Term Loans issued on October 14, 2016 under the Term Loan Facility in an aggregate principal
amount of approximately $842 million.
- •
- "Term B-2 Loans" refers to the tranche of Term Loans issued on October 14, 2016 under the Term Loan Facility in an aggregate principal amount of $550 million.
Refinancing Transactions
On February 6, 2014, HDS amended the Term Loan Facility to lower the applicable borrowing margins, extend the maturity date, add a soft call provision applicable to optional prepayment of term loans thereunder, and add a provision whereby HDS may withhold up to $150 million from repayments otherwise required to be made with the proceeds of asset sales and use such proceeds to repay any debt, including debt that is junior to the term loans.
On December 4, 2014, HDS issued the December 2014 First Priority Notes at par.
On December 19, 2014, HDS used the net proceeds from the December 2014 First Priority Notes issuance, together with available cash, to redeem all of the outstanding 2012 First Priority Notes.
On August 13, 2015, HDS amended the Term Loan Facility to lower the applicable borrowing margins, extend the maturity date, and prepay in full the tranche of senior secured loans outstanding under the Term Loan Facility.
On October 13, 2015, HDS used the net proceeds from the sale of the Power Solutions business unit to redeem all of the outstanding $675 million aggregate principal amount of its April 2012 Second Priority Notes.
On April 11, 2016, HDS issued the April 2016 Senior Unsecured Notes at par.
On April 27, 2016, HDS used the net proceeds from the April 2016 Senior Unsecured Notes issuance, together with available cash, to redeem all of the outstanding October 2012 Senior Unsecured Notes.
On October 14, 2016, HDS amended the Term Loan Facility to eliminate its LIBOR floor by issuing Term B-1 Loans in an aggregate principal amount of approximately $842 million as a
2
replacement tranche for all outstanding term loans and issued Term B-2 Loans in an aggregate principal amount of $550 million.
On October 17, 2016, HDS used the proceeds from the Term B-2 Loans, together with cash on hand and available borrowings under HDS's Senior ABL Facility, to redeem all of the outstanding $1,275 million aggregate principal of the February 2013 Unsecured Notes.
HDS's Senior Credit Facilities, December 2014 First Priority Notes, and April 2016 Senior Unsecured Notes are discussed in greater detail in "Item 8. Financial Statements and Supplementary Data—Notes to the Consolidated Financial Statements—Note 5, Debt" within this annual report on Form 10-K.
Glossary of Certain Other Terms
| AMI | Advanced Meter Infrastructure | |
| AMR | Automated Meter Reading | |
| ASC | Accounting Standards Codification | |
| DCF | Discounted cash flow | |
| DOT | U.S. Department of Transportation | |
| Exchange Act | Securities Exchange Act of 1934 | |
| Fiscal 2014 | Fiscal year ended February 1, 2015 | |
| Fiscal 2015 | Fiscal year ended January 31, 2016 | |
| Fiscal 2016 | Fiscal year ended January 29, 2017 | |
| GAAP | Generally accepted accounting principles in the United States of America | |
| Gross margin | Gross profit as a percentage of net sales | |
| HDS | HD Supply, Inc. | |
| HDPE | High-density polyethylene | |
| Holdings | HD Supply Holdings, Inc. | |
| Home Depot | The Home Depot, Inc. | |
| HVAC | Heating, ventilating, and air conditioning | |
| IPVF | Industrial Pipes, Valves and Fittings | |
| MRO | Maintenance, repair and operations | |
| NOLs | Net operating losses | |
| OEM | Original equipment manufacturer | |
| Peachtree | Peachtree Business Products LLC | |
| PIK | Paid-in-kind | |
| PVC | Polyvinyl chlorides | |
| RAMSCO | Rexford Albany Municipal Supply Company, Inc. | |
| SKU | Stock-keeping unit | |
| SEC | U.S. Securities and Exchange Commission | |
| U.S. | United States | |
| Vendor rebates | Vendors providing for inventory purchase rebates |
Forward-looking statements and information
This annual report on Form 10-K includes forward-looking statements within the meaning of the Private Securities Litigation Reform Act of 1995 that are based on management's beliefs and assumptions and information currently available to management. Some of the forward-looking statements can be identified by the use of forward-looking terms such as "believes," "expects," "may," "will," "should," "could," "seeks," "intends," "plans," "estimates," "anticipates" or other comparable terms. These forward-looking statements include all matters that are not historical facts. They appear in
3
a number of places throughout this report and include statements regarding our intentions, beliefs or current expectations concerning, among other things, our results of operations, financial condition, liquidity, prospects, growth strategies and the industries in which we operate.
Forward-looking statements are subject to known and unknown risks and uncertainties, many of which may be beyond our control. We caution you that forward-looking statements are not guarantees of future performance and that our actual results of operations, financial condition and liquidity, and the development of the industries in which we operate may differ materially from those made in or suggested by the forward-looking statements contained in this report. In addition, even if our results of operations, financial condition and liquidity, and the development of the industries in which we operate are consistent with the forward-looking statements contained in this report, those results or developments may not be indicative of results or developments in subsequent periods. A number of important factors could cause actual results to differ materially from those contained in or implied by the forward-looking statements, including those reflected in forward-looking statements relating to our operations and business, the risks and uncertainties discussed in this annual report on Form 10-K (See Item 1A, Risk Factors) and those described from time to time in our other filings with the SEC. Factors that could cause actual results to differ from those reflected in forward-looking statements relating to our operations and business include:
- •
- inherent risks of the maintenance, repair and operations market, infrastructure spending and the non-residential and residential construction
markets;
- •
- our ability to maintain profitability;
- •
- our ability to service our debt and to refinance all or a portion of our indebtedness;
- •
- limitations and restrictions in the agreements governing our indebtedness;
- •
- the competitive environment in which we operate and demand for our products and services in highly competitive and fragmented industries;
- •
- the loss of any of our significant customers;
- •
- competitive pricing pressure from our customers;
- •
- our ability to identify and acquire suitable acquisition candidates on favorable terms;
- •
- cyclicality and seasonality of the maintenance, repair and operations market, infrastructure spending and the non-residential and residential
construction markets;
- •
- our ability to identify and develop relationships with a sufficient number of qualified suppliers and to maintain our supply chains;
- •
- our ability to manage fixed costs;
- •
- the development of alternatives to distributors in the supply chain;
- •
- our ability to manage our working capital through product purchasing and customer credit policies;
- •
- potential material liabilities under our self-insured programs;
- •
- our ability to attract, train and retain highly qualified associates and key personnel;
- •
- limitations on our income tax net operating loss carryforwards in the event of an ownership change; and
- •
- our ability to identify and integrate new products.
4
You should read this annual report on Form 10-K completely and with the understanding that actual future results may be materially different from expectations. All forward-looking statements made in this report are qualified by these cautionary statements. These forward-looking statements are made only as of the date of this annual report on Form 10-K, and we do not undertake any obligation, other than as may be required by law, to update or revise any forward-looking statements to reflect changes in assumptions, the occurrence of unanticipated events, changes in future operating results over time or otherwise. Comparisons of results for current and any prior periods are not intended to express any future trends or indications of future performance, unless expressed as such, and should only be viewed as historical data.
5
Our Company
HD Supply is one of the largest industrial distributors in North America. We believe we have leading positions in the three distinct market sectors in which we specialize: Maintenance, Repair & Operations ("MRO"); Infrastructure; and Specialty Construction. These market sectors are large and fragmented, and we believe they present opportunities for significant growth. We aspire to be the "First Choice" of customers, associates, suppliers and the communities in which we operate. This aspiration drives our relentless focus and is reflected in the customer and market centricity, speed and precision, intense teamwork, process excellence and trusted relationships that define our culture. We believe this aspiration distinguishes us from other distributors and has created value for our shareholders, driven above-market growth and delivered attractive returns on invested capital.
We serve our markets with an integrated go-to-market strategy. We operate through approximately 500 locations across 48 U.S. states and six Canadian provinces. We have approximately 14,000 associates delivering localized, customer-tailored products, services and expertise. We serve approximately 530,000 customers, which include contractors, government entities, maintenance professionals, home builders and industrial businesses. Our broad range of end-to-end product lines and services include approximately 845,000 stock-keeping units ("SKUs") of quality, name-brand and proprietary-brand products as well as value-add services supporting the entire life-cycle of a project from infrastructure and construction to maintenance, repair and operations.
For the fiscal year ended January 29, 2017, or fiscal 2016, we:
- •
- generated $7 billion in Net sales, representing 4.4% growth over the fiscal year ended January 31, 2016, or fiscal 2015;
- •
- generated Net income of $196 million in fiscal 2016, as compared to a Net income of $1,472 million in fiscal 2015, which included
income tax credits of $1,196 million;
- •
- generated $921 million of Adjusted EBITDA, representing 5.1% growth over fiscal 2015; and
- •
- generated $532 million of Adjusted net income in fiscal 2016, as compared to $351 million in fiscal 2015.
For a reconciliation of Net income (loss), the most directly comparable financial measure under GAAP, to Adjusted EBITDA and Adjusted net income, see "Part II, Item 7. Management's Discussion and Analysis of Financial Condition and Results of Operations—Key Business Metrics—Adjusted EBITDA and Adjusted Net Income (Loss)."
We believe our long-standing customer relationships and competitive advantage stem from our knowledgeable associates, extensive product and service offerings, national footprint, integrated best-in-class technology, broad purchasing scale and strategic supplier relationships. We believe that our comprehensive supply chain solutions improve the effectiveness and efficiency of our customers' businesses. Our value-add services include customer training, material and product fabrication, kitting, jobsite delivery, will-call pickup options, as well as onsite managed inventory, online material management and emergency response capabilities. Furthermore, we believe our product application knowledge, comprehensive product assortment, and sourcing expertise allow our customers to perform reliably and give them the tools to enhance profitability.
We reach our customers through a variety of sales channels, including professional outside and inside sales forces, call centers and branch-supported direct marketing programs utilizing market-specific product catalogs, and business unit websites. Our distribution network allows us to provide rapid, reliable, on-time delivery and customer pickup throughout the United States and Canada.
6
Additionally, we believe our highly integrated, best-in-class technology provides leading e-commerce and integrated workflow capabilities for our customers, while providing us unparalleled pricing, budgeting, reporting and analytical capabilities across our Company. We believe customers view us as an integral part of the value chain due to our extensive product knowledge, expansive product availability and the ability to directly integrate with their systems and workflows.
Our Strategy
Since 2007 we have undertaken significant operating and growth initiatives at all levels. We developed and are implementing a multi-year strategy to optimize our business mix. This strategy includes entering new markets and product lines, streamlining and upgrading our process and technology capabilities, acquiring new capabilities and optimizing our portfolio of businesses. At the same time, we attracted what we believe to be "best of the best" talent, capitalizing on relevant experience, teamwork and change navigation.
Each of our businesses invest in high-growth initiatives that align with our five growth plays:
- 1.
- Sell
More to Existing Customers (i.e., Share of Wallet)
- 2.
- Introduce
New Products and Services
- 3.
- Expand
the Channels to Reach Our Customers (e.g., Internet, Catalog, and Mobility)
- 4.
- Acquire
New Customers
- 5.
- Enter New Geographies (i.e., Open New Locations)
Through investments in these growth plays, we believe we are well-positioned to grow in excess of the markets in which we operate. Specific initiatives focus on increasing penetration within our existing customer base, including the addition of new sales talent across the Company and a training facility for our Waterworks business to ensure we continue to have a highly trained sales force; and the addition of new products and services, including proprietary brands, primarily in our Facilities Maintenance business. We also continue to invest in mobile technologies and e-commerce. We focus primarily on sales talent acquisition and entering new geographies to acquire new customers.
HD Supply is managed primarily on a product-line basis and reports results of operations in three reportable segments. The reportable segments are Facilities Maintenance, Waterworks, and Construction & Industrial. In addition, the consolidated financial statements include Corporate, which comprises enterprise-wide functional departments that operate in a centralized structure.
Facilities Maintenance. Facilities Maintenance distributes MRO products, provides value-add services and fabricates custom products. Our Facilities Maintenance business unit serves the owners of multifamily, hospitality, healthcare and institutional facilities. Products include electrical and lighting items, plumbing, HVAC products, appliances, janitorial supplies, hardware, kitchen and bath cabinets, window coverings, textiles and guest amenities, healthcare maintenance and water and wastewater treatment products. Facilities Maintenance operates a distribution center-based model that sells its products primarily through a professional sales force, e-commerce and print catalogs.
Waterworks. Waterworks distributes complete lines of water and wastewater transmission products, serving contractors and municipalities in the water and wastewater industries for non-residential and residential uses. Our Waterworks business unit serves non-residential, residential, water systems, sewage systems and other markets. Waterworks reaches customers through a nationwide network of regionally organized branches and operates a bid-based model, primarily for municipal projects. Products include pipes, fittings, valves, hydrants and meters for use in the construction, maintenance and repair of water and waste-water systems as well as fire-protection systems. Waterworks has complemented its core products through additional offerings, including smart meters (AMR/AMI), fusible piping solutions and
7
specific engineered treatment plant products and services. Waterworks' services and capabilities allow us to integrate with our customers and form part of their sourcing and procurement function.
Construction & Industrial. Construction & Industrial distributes specialized hardware, tools, engineered materials and safety products to non-residential and residential contractors. Service offerings range from pre-bid assistance and product submittals to engineering and tool repair. Construction & Industrial reaches customers through a nationwide network of regionally organized branches as well as print catalogs and e-commerce. Products include tilt-up brace systems, forming and shoring systems, concrete chemicals, hand and power tools, cutting tools, rebar, ladders, safety and fall arrest equipment, specialty screws and fasteners, sealants and adhesives, drainage pipe, geo-synthetics, erosion and sediment control equipment and other engineered materials used broadly across all types of non-residential and residential construction. Construction & Industrial also includes Home Improvement Solutions, which offers light remodeling and construction supplies, kitchen and bath cabinets, windows, plumbing materials, electrical equipment and other products, primarily to small remodeling contractors and trade professionals through local retail outlets.
Corporate. In addition to the reportable segments, our consolidated financial results include "Corporate" which includes costs related to our centralized support functions, which are comprised of finance, information technology, human resources, legal, supply chain and other support services, and removes inter-segment transactions.
Our Market Sectors
We offer a diverse range of products and services to the Maintenance, Repair & Operations, Infrastructure and Specialty Construction market sectors in the United States and Canada. The markets in which we operate have a high degree of customer and supplier fragmentation, with customers that typically demand a high level of service and availability of a broad set of complex products from a large number of suppliers. These market dynamics make the distributor a critical element within the value chain. Net sales for HD Supply outside of the United States, primarily in Canada, were $124 million, $125 million, and $130 million in fiscal 2016, fiscal 2015, and fiscal 2014, respectively.
Maintenance, Repair & Operations
In the Maintenance, Repair & Operations market sector, our Facilities Maintenance and Home Improvement Solutions businesses serve customers across multiple industries by primarily delivering supplies and services needed to maintain and upgrade multifamily, hospitality, healthcare and institutional facilities. Facilities Maintenance is a distribution center-based model, while Home Improvement Solutions (included in the Construction & Industrial reportable segment) operates through retail outlets primarily serving cash and carry customers. We estimate that this market sector currently represents an addressable market in excess of $51 billion annually with demand driven primarily by ongoing maintenance requirements of a broad range of existing structures and traditional repair and remodeling construction activity across multiple industries. We believe Facilities Maintenance customers value speed and product availability over price. We believe our maintenance, repair and operations business focused on living spaces, including apartment units, hotel or motel rooms and senior care living facilities, provides stable demand, particularly in a challenging economic environment, when new construction tends to decrease.
Infrastructure
In the Infrastructure market sector, our Waterworks business unit supports both established infrastructure and new projects by meeting demand for critical supplies and services used to build and maintain water systems. We estimate that this market sector currently represents an addressable market in excess of $11 billion annually with demand in the United States driven primarily by an aging and
8
overburdened national infrastructure and general population growth trends. The broad geographic presence of our Waterworks business unit, through a regionally organized branch distribution network, reduces our exposure to economic factors in any single region. We believe we have the potential to capitalize on a substantial backlog of deferred projects that will need to be addressed in the coming years as a result of our customers delaying much needed upgrades or repairs during the recent economic downturn as well as a continued recovery in the non-residential and residential construction markets.
Specialty Construction
In the Specialty Construction market sector, our Construction & Industrial business unit serves professional contractors and trades by meeting their distinct and customized supply needs in non-residential, residential and industrial applications. We estimate that this market sector currently represents an addressable market of approximately $25 billion annually with demand driven primarily by residential construction, non-residential construction, industrial and repair and remodeling construction spending. Construction & Industrial serves this sector through the broad national presence of its regionally organized branch distribution network, as well as branches in six Canadian provinces. We believe we are well-positioned to benefit from the continued recovery from historical lows within the non-residential and residential construction end-markets.
Our History
In March 1997, Home Depot, the former parent of our operating subsidiaries, acquired Maintenance Warehouse / America Corp., a Texas corporation organized on January 26, 1985, and a leading direct marketer of MRO products to the hospitality and multifamily housing markets. Since 1997, our business has grown rapidly, primarily through the acquisition of more than 40 businesses.
From fiscal 2000 to fiscal 2004, we extended our presence into new categories while growing existing businesses through 10 acquisitions. New businesses included plumbing and HVAC (through the acquisition of Apex Supply), flooring products and installation (Floors, Inc., Floorworks, Inc., and Arvada Hardwood Floor Company) and specialty hardware, tools and materials for construction contractors (White Cap). Growth at existing businesses was driven organically and through "tuck-in" acquisitions, expanding our presence in the MRO market sector (N-E Thing Supply and Economy Maintenance Supply) and flooring and design services for professional homebuilders (Creative Touch Interiors).
In fiscal 2005, we accelerated the pace of consolidation by acquiring 18 businesses, the largest of which was National Waterworks, a leading distributor of products used to build, repair and maintain water and wastewater transmission systems. In fiscal 2006, we transformed our business with the acquisition of Hughes Supply, which doubled our Net sales and further established our market leadership in a number of our largest business units, which we supplemented with 11 other strategic acquisitions.
In 2007, investment funds associated with the Equity Sponsors formed Holdings and purchased HDS and the Canadian subsidiary CND Holdings, Inc. from Home Depot. In connection with the 2007 Transactions, Home Depot obtained a 12.5% interest in the then outstanding common stock of Holdings.
Since 2007, we have focused on extending our presence in key growth sectors and exiting less attractive sectors. In February 2008, we sold our Lumber and Building Materials operations to ProBuild Holdings. In June 2009, we purchased substantially all of the assets of ORCO Construction Supply, the second largest construction materials distributor in the U.S., through Construction & Industrial. In February 2011, we sold all of the assets of SESCO/QUESCO, an electrical products division of HD Supply Canada, to Sonepar Canada. In May 2011, we purchased all of the assets of RAMSCO,
9
expanding Waterworks in upstate New York. In September 2011, we sold our Plumbing/HVAC operations to Hajoca Corporation. In March 2012, we sold our IPVF business to Shale-Inland Holdings LLC. In June 2012, we acquired Peachtree, which specializes in customizable business and property marketing supplies, to enhance Facilities Maintenance. In December 2012, we purchased substantially all of the assets of Water Products, expanding the geographic footprint of Waterworks.
On July 2, 2013, Holdings completed an initial public offering of 61,170,212 shares of its common stock at a price of $18.00 per share, for an aggregate offering price of $1,039 million, net of underwriters' discounts and commissions and offering expenses of approximately $16 million.
During fiscal 2014, we completed the disposal of Litemor through liquidation. In January 2015, we sold substantially all of the assets of our Hardware Solutions business to Home Depot. In October 2015, we sold our Power Solutions business to Anixter Inc. In May 2016, we sold our Interior Solutions business to Interior Specialists, Inc. For additional information on the discontinued operations, see Note 2, "Discontinued Operations," within "Part II. Item 8. Financial Statements and Supplementary Data."
Upon completion of Holdings' secondary public offerings in fiscal 2014 and fiscal 2015, the Equity Sponsors and Home Depot sold all of their remaining original investment in Holdings.
Customers and Suppliers
We maintain a customer base of approximately 530,000 customers, many of whom represent long-term relationships. We are subject to very low customer concentration with our ten largest customers generating approximately 7.8% of our Net sales in fiscal 2016, reducing our exposure to any single customer.
We have developed relationships with approximately 9,000 strategic suppliers, many of which are long-standing. These supplier relationships provide us with reliable access to inventory, volume purchasing benefits and the ability to deliver a diverse product offering on a cost-effective basis. We maintain multiple suppliers for a substantial number of our products, thereby limiting the risk of product shortage for customers.
Competition
We operate in a highly fragmented industry and hold leading positions in multiple market sectors. Competition, including from our competitors and specific competitive factors, varies for each market sector. The majority of our competition comes from mid-size regional distributors and small, local distributors; however, we also face competition from a number of national competitors, including Fastenal, Grainger, MSC Industrial, Watsco, Interline Brands (a Division of Home Depot) and Ferguson (a Division of Wolseley plc).
We believe the principal competitive factors for our market sectors include local selling capabilities, availability, breadth and cost of materials and supplies, technical knowledge and expertise, value-add service capabilities, customer and supplier relationships, reliability and accuracy of service, effective use of technology, delivery capabilities and timeliness, pricing of products, and the provision of credit. We believe that our competitive strengths and strategy allow us to compete effectively in our market sectors.
Seasonality
In a typical year, our operating results are impacted by seasonality. Historically, sales of our products have been higher in the second and third quarters of each fiscal year due to favorable weather and longer daylight conditions during these periods. Seasonal variations in operating results may also
10
be significantly impacted by inclement weather conditions, such as cold or wet weather, which can delay construction projects and customer deliveries.
Products
Maintenance, Repair & Operations:
Facilities Maintenance: Electrical and lighting items, plumbing, HVAC products, appliances, janitorial supplies, hardware, kitchen and bath cabinets, window coverings, textiles and guest amenities, healthcare maintenance and water and wastewater treatment products.
Home Improvement Solutions: Kitchen cabinets, windows, plumbing materials, masonry, electrical equipment, lumber, flooring and tools and tool rentals for small remodeling, home improvement and do-it-yourself residential projects.
Infrastructure:
Waterworks: Water and wastewater transmission products including pipe (PVC, Ductile Iron, and HDPE), fittings, valves, fire protection, metering systems, storm drain, hydrants, fusion machine rental and repair.
Specialty Construction:
Construction & Industrial: Tilt-up brace systems, forming and shoring systems, concrete chemicals, hand and power tools, cutting tools, rebar, ladders, safety and fall arrest equipment, specialty screws and fasteners, sealants and adhesives, drainage pipe, geo-synthetics, erosion and sediment control equipment and other engineered materials used broadly across all types of non-residential and residential construction
Intellectual property
Our trademarks and those of our subsidiaries are registered or otherwise legally protected in the United States, Canada and elsewhere. We, together with our subsidiaries, own approximately 160 trademarks registered worldwide. We also rely upon trade secrets and know-how to develop and maintain our competitive position. We protect intellectual property rights through a variety of methods, including trademark, patent, copyright and trade secret laws, in addition to confidentiality agreements with suppliers, employees, consultants and others who have access to our proprietary information. Generally, registered trademarks have a perpetual life, provided that they are renewed on a timely basis and continue to be used properly as trademarks. We intend to maintain our material trademark registrations so long as they remain valuable to our business. Other than the trademarks HD Supply ®, USABluebook ®, Seasons ®, Brigade ®, Maintenance Warehouse ® and White Cap ®, we do not believe our business is dependent to a material degree on trademarks, patents, copyrights or trade secrets. Other than commercially available software licenses, we do not believe that any of our licenses for third-party intellectual property are material to our business, taken as a whole. See "Risk Factors—Risks Relating to Our Business—If we are unable to protect our intellectual property rights, or we infringe on the intellectual property rights of others, our ability to compete could be negatively impacted."
Employees
In domestic and international operations, we had approximately 14,000 employees as of January 29, 2017, consisting of approximately 9,000 hourly personnel and approximately 5,000 salaried employees.
11
As of January 29, 2017, less than one percent of our hourly workforce was covered by collective bargaining agreements.
Regulation
Our operations are affected by various statutes, regulations and laws in the markets in which we operate, which historically have not had a material effect on our business. While we are not engaged in a regulated industry, we are subject to various laws applicable to businesses generally, including laws affecting land usage, zoning, the environment, health and safety, transportation, labor and employment practices (including pensions), competition, immigration and other matters. Additionally, building codes may affect the products our customers are allowed to use, and consequently, changes in building codes may affect the saleability of our products. The transportation and disposal of many of our products are also subject to federal regulations. The DOT regulates our operations in domestic interstate commerce. We are subject to safety requirements governing interstate operations prescribed by the DOT. Vehicle dimensions and driver hours of service also remain subject to both federal and state regulation. See "Risk Factors—Risks Relating to Our Business—Our costs of doing business could increase as a result of changes in U.S. federal, state or local regulations."
Environmental, Health and Safety Matters
We are subject to a broad range of foreign, federal, state and local environmental, health and safety laws and regulations, including those pertaining to air emissions, water discharges, the handling, disposal and transport of solid and hazardous materials and wastes, the investigation and remediation of contamination and otherwise relating to health and safety and the protection of the environment and natural resources. As our operations, and those of many of the companies we have acquired, to a limited extent involve and have involved the handling, transport and distribution of materials that are, or could be classified as, toxic or hazardous, there is some risk of contamination and environmental damage inherent in our operations and the products we handle, transport and distribute. Our environmental, health and safety liabilities and obligations may result in significant capital expenditures and other costs, which could negatively impact our business, financial condition and results of operations. We may be fined or penalized by regulators for failing to comply with environmental, health and safety laws and regulations, or we may be held responsible for such failures by companies we have acquired. In addition, contamination resulting from our current or past operations, and those of many of the companies we have acquired, may trigger investigation or remediation obligations, which may have a material adverse effect on our business, financial condition and results of operations.
Available Information
We are subject to the reporting and information requirements of the Exchange Act and, as a result, we file periodic reports and other information with the SEC.
The public may read and copy any such reports or other information that we file with the SEC. Such filings are available to the public over the internet at the SEC's website at http://www.sec.gov. The SEC's website is included in this annual report on Form 10-K as an inactive textual reference only.
In addition, the Company's annual report on Form 10-K, quarterly reports on Form 10-Q, current reports on Form 8-K, and amendments to those reports are available free of charge to the public through the "Investor Relations" portion of the Company's website, www.hdsupply.com, as soon as reasonably practical after they are filed with the SEC. We include our website address in this filing only as a textual reference. The information contained on our website is not incorporated by reference into
12
this report. You may also obtain a copy of any information that we file with the SEC at no cost by calling us, or writing to us, at the following address:
HD
Supply
3100 Cumberland Boulevard, Suite 1480
Atlanta, Georgia 30339
Attn: General Counsel
(770) 852-9000
13
Risks Relating to Our Business
We are subject to inherent risks of the maintenance, repair and operations market, infrastructure spending and the non-residential and residential construction markets, including risks related to general economic conditions.
Demand for our products and services depends to a significant degree on spending in our markets. The level of activity in our markets depends on a variety of factors that we cannot control.
Historically, both new housing starts and residential remodeling have decreased in slow economic periods. In addition, residential construction activity can impact the level of non-residential construction activity. Other factors impacting the level of activity in the non-residential and residential construction markets include:
- •
- changes in interest rates;
- •
- unemployment rates;
- •
- high foreclosure rates and unsold/foreclosure inventory;
- •
- unsold new housing inventory;
- •
- availability of financing (including the impact of disruption in the mortgage markets);
- •
- adverse changes in industrial economic outlook;
- •
- a decrease in the affordability of homes;
- •
- vacancy rates;
- •
- capacity utilization;
- •
- capital spending;
- •
- commercial investment;
- •
- corporate profitability;
- •
- local, state and federal government regulation; and
- •
- shifts in populations away from the markets that we serve.
Infrastructure spending depends largely on interest rates, availability and commitment of public funds for municipal spending, capacity utilization and general economic conditions. In the maintenance, repair and operations market, the level of activity depends largely on the number of units and occupancy rates within multifamily, hospitality, healthcare and institutional facilities markets. Because all of our markets are sensitive to changes in the economy, downturns (or lack of substantial improvement) in the economy in any region in which we operate have adversely affected and could continue to adversely affect our business, financial condition and results of operations. For example, we distribute many of our products to waterworks contractors in connection with non-residential building, residential and industrial construction projects. The water and wastewater transmission products industry is affected by changes in economic conditions, including national, regional and local standards in construction activity, and the amount spent by municipalities on waterworks infrastructure. While we operate in many markets in the United States and Canada, our business is particularly impacted by changes in the economies of California, Texas and Florida, which represented approximately 18.5%, 11.2% and 9.0%, respectively, of our Net sales for fiscal 2016.
14
In addition, the markets in which we compete are sensitive to general business and economic conditions in the United States and worldwide, including availability of credit, interest rates, fluctuations in capital, credit and mortgage markets and business and consumer confidence. Adverse developments in global financial markets and general business and economic conditions, including through recession, downturn or otherwise, could have a material adverse effect on our business, financial condition, results of operations and cash flows, including our ability and the ability of our customers and suppliers to access capital. There was a significant decline in economic growth, both in the United States and worldwide, that began in the second half of 2007 and continued through 2009. In addition, volatility and disruption in the capital markets during that period reached unprecedented levels, with stock markets falling dramatically and credit becoming very expensive or unavailable to many companies without regard to those companies' underlying financial strength. As a result of these developments, many lenders and institutional investors reduced, and in some cases, ceased to provide funding to borrowers. Although there has since been stabilization and improvement in the general economy and certain industries and markets in which we operate, there can be no guarantee that any improvement in these areas will continue or be sustained.
We have been, and may continue to be, adversely impacted by the decline in the new residential construction market from its peak in 2005.
Our business is dependent, in part, upon the new residential construction market. The homebuilding industry has undergone a significant decline from its peak in 2005. According to the U.S. Census Bureau, actual single family housing starts in the U.S. during 2016 increased 9% from 2015 levels, but remain 54% below their peak in 2005. The multi-year downturn in the homebuilding industry has resulted in a substantial reduction in demand for our products and services, which in turn has had a significant adverse effect on our business and operating results during fiscal years 2008 to 2016, as compared to peak levels. In addition, during this period the mortgage markets experienced disruption and reduced availability of mortgages for potential homebuyers due to more restrictive standards to qualify for mortgages, including with respect to new home construction loans. Although the new residential construction market has improved modestly in recent years, there can be no assurance this trend will continue.
We cannot predict the duration of the current housing industry market conditions, or the timing or strength of any future recovery of housing activity in our markets. We also cannot provide any assurances that the homebuilding industry will recover to historical levels, or that the operational strategies we have implemented to address the current market conditions will be successful. Weakness in the new residential construction market could have a significant adverse effect on our business, financial condition and operating results. In addition, because of these factors, there may be fluctuations in our operating results, and the results for any historical period may not be indicative of results for any future period.
The non-residential building construction market could experience a downturn which could materially and adversely affect our business, liquidity and results of operations.
Our business is dependent, in part, on the non-residential building construction market and a slowdown of or volatility in the United States economy in general could have an adverse effect on our business units that serve this industry. According to the U.S. Census Bureau, actual non-residential building construction put-in-place in the U.S. during 2016 increased 8%, but remains 7% lower than 2008 levels. From time to time, our business units that serve the non-residential building construction market have also been adversely affected in various parts of the country by declines in non-residential building construction starts due to, among other things, changes in tax laws affecting the real estate industry, high interest rates and the level of residential construction activity. Continued uncertainty about current economic conditions will continue to pose a risk to our business units that serve the
15
non-residential building construction market as participants in this industry may postpone spending in response to tighter credit, negative financial news and/or declines in income or asset values, which could have a continued material negative effect on the demand for our products and services.
We cannot predict the duration of the current market conditions or the timing or strength of any future recovery of non-residential building construction activity in our markets. Weakness in the non-residential building construction market would have a significant adverse effect on our business, financial condition and operating results. In addition, because of these factors, there may be fluctuations in our operating results, and the results for any historical period may not be indicative of results for any future period.
Residential renovation and improvement activity levels may not return to historic levels which may negatively impact our business, liquidity and results of operations.
Certain of our business units rely on residential renovation and improvement (including repair and remodeling) activity levels. Unlike most previous cyclical declines in new home construction in which we did not experience comparable declines in our home improvement business units, the most recent economic decline adversely affected our home improvement business units as well. Management believes that residential improvement project spending in the United States increased 8% in 2016, but remains 18% below its peak level in 2005. Elevated unemployment levels, mortgage delinquency and foreclosure rates, limitations in the availability of mortgage and home improvement financing and lower housing turnover may continue to limit consumers' spending, particularly on discretionary items, and affect their confidence level leading to continued reduced spending on home improvement projects.
We cannot predict the timing or strength of a significant recovery in these markets. Continued depressed activity levels in consumer spending for home improvement and new home construction will continue to adversely affect our business, liquidity, results of operations and our financial position. Furthermore, continued economic weakness may cause unanticipated shifts in consumer preferences and purchasing practices and in the business models and strategies of our customers. Such shifts may alter the nature and prices of products demanded by the end consumer, and, in turn, our customers and could adversely affect our operating performance.
We may be unable to maintain profitability.
We have set goals to progressively improve our profitability over time by growing our sales, increasing our gross margin and reducing our expenses as a percentage of sales. For fiscal years 2016, 2015 and 2014, we had net income of $196 million, $1,472 million, and $3 million, respectively. There can be no assurance that we will achieve our enhanced profitability goals. Factors that could significantly adversely affect our efforts to achieve these goals include, but are not limited to, the failure to:
- •
- grow our revenue through organic growth or through acquisitions;
- •
- improve our revenue mix by investing (including through acquisitions) in businesses that provide higher margins than we have been able to
generate historically;
- •
- achieve improvements in purchasing or maintain or increase our rebates from vendors through our vendor consolidation and/or low-cost country
initiatives;
- •
- improve our gross margins through the utilization of improved pricing practices and technology and sourcing savings;
- •
- maintain or reduce our overhead and support expenses as we grow;
- •
- effectively evaluate future inventory reserves;
16
- •
- collect monies owed to us from customers;
- •
- maintain relationships with our significant customers; and
- •
- integrate any businesses acquired.
Any of these failures or delays may adversely affect our ability to increase our profitability.
We may be required to take impairment charges relating to our operations which could impact our future operating results.
As of January 29, 2017, goodwill represented approximately 50% of our total assets. Goodwill is not amortized and is subject to impairment testing at least annually using a fair value based approach. The identification and measurement of impairment involves the estimation of the fair value of reporting units. The estimates of fair value of reporting units are based on the best information available as of the date of the assessment and incorporate management assumptions about expected future cash flows and other valuation techniques. Future cash flows can be affected by changes in industry or market conditions among other things.
The recoverability of goodwill is evaluated at least annually and when events or changes in circumstances indicate that the fair value of a reporting unit has more likely than not declined below its carrying value. The annual impairment test resulted in no impairment of goodwill during fiscal 2016, fiscal 2015, or fiscal 2014.
We cannot accurately predict the amount and timing of any impairment of assets, and we may be required to take goodwill or other asset impairment charges relating to certain of our reporting units and asset groups in the event we experience weakness in the non-residential and/or residential construction markets and/or the general U.S. economy. Similarly, certain company transactions could result in goodwill impairment charges being recorded. Any such non-cash charges would have an adverse effect on our financial results.
In the event of a general economic downturn in the United States, we may be required to close under-performing locations.
We may have to close under-performing branches from time to time as warranted by general economic conditions and/or weakness in the industries in which we operate. For example, during fiscal 2016, we closed certain branches and terminated employees as part of our on-going cost savings and profitability enhancement efforts. Any future facility closures could have a significant adverse effect on our financial condition, operating results and cash flows.
We occupy most of our facilities under long-term non-cancelable leases. We may be unable to renew leases on favorable terms or at all. Also, if we close a facility, we may remain obligated under the applicable lease.
Most of our facilities are located in leased premises. Many of our current leases are non-cancelable and typically have terms ranging from 3 to 5 years, with options to renew for specified periods of time. We believe that leases we enter into in the future will likely be long-term and non-cancelable and have similar renewal options. However, there can be no assurance that we will be able to renew our current or future leases on favorable terms or at all which could have an adverse effect on our ability to operate our business and on our results of operations. In addition, if we close or idle a facility, we generally remain committed to perform our obligations under the applicable lease, which include, among other things, payment of the base rent for the balance of the lease term. Over the course of the last three fiscal years, we closed or idled facilities for which we remain liable on the lease obligations. Our obligation to continue making rental payments in respect of leases for closed or idled facilities could have a material adverse effect on our business and results of operations.
17
The industries in which we operate are highly competitive and fragmented, and demand for our products and services could decrease if we are not able to compete effectively.
The markets in which we operate are fragmented and highly competitive. Our competition includes other distributors and manufacturers that sell products directly to their respective customer bases and some of our customers that resell our products. To a limited extent, retailers of electrical fixtures and supplies, building materials, maintenance, repair and operations supplies and contractors' tools also compete with us. We also expect that new competitors may develop over time as internet-based enterprises become more established and reliable and refine their service capabilities. Competition varies depending on product line, customer classification and geographic area.
We compete with many local, regional and, in several markets and product categories, other national distributors. Certain of our competitors have substantially greater financial and other resources than us. No assurance can be given that we will be able to respond effectively to these competitive pressures. Increased competition by existing and future competitors could result in reductions in sales, prices, volumes and gross margins that could materially adversely affect our business, financial condition and results of operations. Furthermore, our success will depend, in part, on our ability to maintain our market share and gain market share from competitors.
In addition, contracts with municipalities are often awarded and renewed through periodic competitive bidding. We may not be successful in obtaining or renewing these contracts, which could be harmful to our business and financial performance.
Our competitors continue to consolidate, which could cause markets to become more competitive and could negatively impact our business.
Our competitors in the United States and Canada continue to consolidate. This consolidation is being driven by customer needs and supplier capabilities, which could cause markets to become more competitive as greater economies of scale are achieved by distributors, or as competitors with new business models are willing and able to operate with lower gross profit on select products. Customers are increasingly aware of the total costs of fulfillment and of the need to have consistent sources of supply at multiple locations. We believe these customer needs could result in fewer distributors as the remaining distributors become larger and more capable of being consistent sources of supply.
There can be no assurance that we will be able to take advantage effectively of this trend toward consolidation. The trend in our industry toward consolidation could make it more difficult for us to maintain operating margins and could also increase competition for our potential acquisition targets and result in higher purchase price multiples. Furthermore, as our industrial and construction customers face increased foreign competition and potentially lose business to foreign competitors or shift their operations overseas in an effort to reduce expenses, we may face increased difficulty in growing and maintaining our market share and growth prospects in these markets.
The loss of any of our significant customers could adversely affect our financial condition.
Our ten largest customers generated approximately 7.8% of our Net sales in fiscal 2016. We cannot guarantee that we will maintain or improve our relationships with these customers or that we will continue to supply these customers at historical levels. During the economic downturn, some of our customers reduced their operations. For example, some specialty construction customers exited or severely curtailed building activity in certain of our markets. There is no assurance that our customers will determine to increase their operations or return to historic levels. Slow economic recovery could continue to have a significant adverse effect on our financial condition, operating results and cash flows.
18
In addition, consolidation among customers could also result in a loss of some of our present customers to our competitors. The loss of one or more of our significant customers, a significant customer's decision to purchase our products in significantly lower quantities than they have in the past or deterioration in our relationship with any of our significant customers could significantly affect our financial condition, operating results and cash flows.
Generally, our customers are not required to purchase any minimum amount of products from us. The contracts into which we have entered with most of our customers typically provide that we supply particular products or services for a certain period of time when and if ordered by the customer. Should our customers purchase our products in significantly lower quantities than they have in the past, such decreased purchases could have a material adverse effect on our financial condition, operating results and cash flows.
The majority of our Net sales are credit sales which are made primarily to customers whose ability to pay is dependent, in part, upon the economic strength of the industry and geographic areas in which they operate, and the failure to collect monies owed from customers could adversely affect our financial condition.
The majority of our Net sales volume in fiscal 2016 was facilitated through the extension of credit to our customers whose ability to pay is dependent, in part, upon the economic strength of the industry in the areas where they operate. Our business units offer credit to customers, either through unsecured credit that is based solely upon the creditworthiness of the customer, or secured credit for materials sold for a specific job where the security lies in lien rights associated with the material going into the job. The type of credit offered depends both on the financial strength of the customer and the nature of the business in which the customer is involved. End users, resellers and other non-contractor customers generally purchase more on unsecured credit than secured credit. The inability of our customers to pay off their credit lines in a timely manner, or at all, would adversely affect our financial condition, operating results and cash flows. Furthermore, our collections efforts with respect to non-paying or slow-paying customers could negatively impact our customer relations going forward.
Because we depend on the creditworthiness of certain of our customers, if the financial condition of our customers declines, our credit risk could increase. Significant contraction in our markets, coupled with tightened credit availability and financial institution underwriting standards, could adversely affect certain of our customers. Should one or more of our larger customers declare bankruptcy, it could adversely affect the collectability of our accounts receivable, bad debt reserves and net income.
We are subject to competitive pricing pressure from our customers.
Certain of our largest customers historically have exerted significant pressure on their outside suppliers to keep prices low because of their market share and their ability to leverage such market share in the highly fragmented building products supply industry. The economic downturn resulted in increased pricing pressures from our customers. If we are unable to generate sufficient cost savings to offset any price reductions, our financial condition, operating results and cash flows may be adversely affected.
Future strategic transactions could impact our reputation, business, financial position, results of operations and cash flows, and we may not achieve the acquisition component of our growth strategy.
We may pursue strategic transactions in the future, which could involve acquisitions or dispositions of businesses or assets. Any future strategic transaction could involve integration or implementation challenges, business disruption or other risks, or change our business profile significantly. Any inability on our part to successfully implement strategic transactions could have an adverse impact on our reputation, business, financial position, results of operations and cash flows. Any acquisition that we
19
make may not provide us with the benefits that were anticipated when entering into such acquisition. Any future disposition transactions could also impact our business and may subject us to various risks, including failure to obtain appropriate value for the disposed businesses, post-closing claims being levied against us and disruption to our other businesses during the sale process or thereafter.
In addition, although acquisitions may continue to be a component of our growth strategy, there can be no assurance that we will be able to continue to grow our business through acquisitions as we have done historically or that any businesses acquired will perform in accordance with expectations or that business judgments concerning the value, strengths and weaknesses of businesses acquired will prove to be correct. Future acquisitions may result in the incurrence of debt and contingent liabilities, an increase in interest expense and amortization expense and significant charges relative to integration costs. Our strategy could be impeded if we do not identify suitable acquisition candidates, and our financial condition and results of operations will be adversely affected if we overpay for acquisitions.
Acquisitions involve a number of special risks, including:
- •
- problems implementing disclosure controls and procedures for the newly acquired business;
- •
- unforeseen difficulties extending internal control over financial reporting and performing the required assessment at the newly acquired
business;
- •
- potential adverse short-term effects on operating results through increased costs or otherwise;
- •
- diversion of management's attention and failure to recruit new, and retain existing, key personnel of the acquired business;
- •
- failure to successfully implement infrastructure, logistics and systems integration;
- •
- our business growth could outpace the capability of our systems; and
- •
- the risks inherent in the systems of the acquired business and risks associated with unanticipated events or liabilities, any of which could have a material adverse effect on our business, financial condition and results of operations.
In addition, we may not be able to obtain financing necessary to complete acquisitions on attractive terms or at all.
A range of factors may make our quarterly revenues and earnings variable.
We have historically experienced, and in the future expect to continue to experience, variability in revenues and earnings on a quarterly basis. The factors expected to contribute to this variability include, among others: (i) the cyclical nature of some of the markets in which we compete, including the non-residential and residential construction markets, (ii) general economic conditions in the various local markets in which we compete, (iii) the pricing policies of our competitors, (iv) the production schedules of our customers and (v) the effects of the weather. These factors, among others, make it difficult to project our operating results on a consistent basis, which may affect the value of our securities.
The maintenance, repair and operations market, infrastructure spending and the non-residential and residential construction markets are seasonal and cyclical.
Although weather patterns affect our operating results throughout the year, adverse weather historically has reduced construction and maintenance and repair activity in our first and fourth fiscal quarters. In contrast, our highest volume of Net sales historically has occurred in our second and third fiscal quarters. To the extent that hurricanes, severe storms, floods, other natural disasters or similar events occur in the geographic regions in which we operate, our business may be adversely affected. In addition, most of our business units experience seasonal variation as a result of the dependence of our
20
customers on suitable weather to engage in construction, maintenance and renovation and improvement projects. For example, our Construction & Industrial business unit sells products used primarily in the non-residential and residential construction industry. Generally, during the winter months, construction activity declines due to inclement weather and shorter daylight hours. As a result, operating results for the business units that experience such seasonality may vary significantly from period to period. We anticipate that fluctuations from period to period will continue in the future.
Disruptions at distribution centers or shipping ports, due to events such as work stoppages, as well as disruptions caused by tornadoes, hurricanes, blizzards and other storms and natural disasters from time to time, may affect our ability to both maintain key products in inventory and deliver products to our customers on a timely basis, which may in turn adversely affect our results of operations.
In addition, infrastructure spending and the non-residential and residential construction markets are subject to cyclical market pressures. The length and magnitude of these cycles have varied over time and by market. Prices of the products we sell are historically volatile and subject to fluctuations arising from changes in supply and demand, national and international economic conditions, labor costs, competition, market speculation, government regulation and trade policies, as well as from periodic delays in the delivery of our products. We have a limited ability to control the timing and amount of changes to prices that we pay for our products. In addition, the supply of our products fluctuates based on available manufacturing capacity. A shortage of capacity, or excess capacity, in the industry can result in significant increases or declines in market prices for those products, often within a short period of time. Such price fluctuations can adversely affect our financial condition, operating results and cash flows.
Fluctuating commodity prices may adversely impact our results of operations.
The cost of steel, ductile iron, polyvinyl chlorides ("PVC") and other commodities used in the products we distribute can be volatile. Although we attempt to resist cost increases by our suppliers and to pass on increased costs to our customers, we are not always able to do so quickly or at all. In addition, if prices decrease for commodities used in products we distribute, we may have inventories purchased at higher prices than prevailing market prices. Significant fluctuations in the cost of the commodities used in products we distribute have in the past adversely affected, and in the future may adversely affect, our results of operations and financial condition.
If petroleum prices increase, our results of operations could be adversely affected. Conversely, prolonged weakness in the oil and gas industry could negatively impact our financial condition, results of operations and cash flows.
Petroleum prices have fluctuated significantly in recent years. Prices and availability of petroleum products are subject to political, economic and market factors that are outside our control. Political events in petroleum-producing regions as well as hurricanes and other weather-related events may cause the price of fuel to increase. Within our business units, we deliver products to our customers via our own trucks as well as third-party carriers. Our operating profit will be adversely affected if we are unable to obtain the fuel we require or to fully offset the anticipated impact of higher fuel prices through increased prices or fuel surcharges to our customers. Besides passing fuel costs on to customers, we have not entered into any hedging arrangements that protect against fuel price increases, and we do not have any long-term fuel purchase contracts. If shortages occur in the supply of necessary petroleum products and we are not able to pass along the full impact of increased petroleum prices to our customers, our results of operations would be adversely affected.
A number of our branch locations serve customers that are either direct or indirect participants in the oil & gas industry, such as our Waterworks business unit's supplying of High Density Polyethylene pipe to oil and gas related customers. A number of our branch locations are also geographically located
21
in or near areas where the oil & gas industry is a significant component of the overall local economy, such as in Texas and in the various shale gas producing regions within the U.S. and Canada. If the prices of oil and gas continue to remain relatively low and our customers are negatively impacted, then our customers' demand for our products and services could also be negatively impacted which would have an adverse effect on our financial condition, results of operations and cash flows.
Product shortages may impair our operating results.
Our ability to offer a wide variety of products to our customers is dependent upon our ability to obtain adequate product supply from manufacturers or other suppliers. Generally, our products are obtainable from various sources and in sufficient quantities. However, the loss of, or substantial decrease in the availability of, products from our suppliers, or the loss of our key supplier agreements, could adversely impact our financial condition, operating results and cash flows. In addition, supply interruptions could arise from shortages of raw materials (including petroleum products), labor disputes or weather conditions affecting products or shipments, transportation disruptions, adjustments to our inventory levels or other factors within and beyond our control. Short-and long-term disruptions in our supply chain would result in a need to maintain higher inventory levels as we replace similar product, a higher cost of product and ultimately a decrease in our Net sales and profitability. A disruption in the timely availability of our products by our key suppliers would result in a decrease in our revenues and profitability, especially in our business units with supplier concentration, such as our Waterworks business. Although in many instances we have agreements with our suppliers, these agreements are generally terminable by either party on limited notice. Failure by our suppliers to continue to supply us with products on commercially reasonable terms, or at all, would put pressure on our operating margins and have a material adverse effect on our financial condition, operating results and cash flows. Short-term changes in the cost of these materials, some of which are subject to significant fluctuations, are sometimes, but not always passed on to our customers. Our inability to pass on material price increases to our customers could adversely impact our financial condition, operating results and cash flows.
We rely on third-party suppliers and long supply chains, and if we fail to identify and develop relationships with a sufficient number of qualified suppliers, or if there is a significant interruption in our supply chains, our ability to timely and efficiently access products that meet our standards for quality could be adversely affected.
We buy our products and supplies from suppliers located throughout the world. These suppliers manufacture and source products from the United States and abroad. Our ability to identify and develop relationships with qualified suppliers who can satisfy our standards for quality and our need to access products and supplies in a timely and efficient manner is a significant challenge. We may be required to replace a supplier if their products do not meet our quality or safety standards. In addition, our suppliers could discontinue selling products at any time for reasons that may or may not be in our control or the suppliers' control. Our operating results and inventory levels could suffer if we are unable to promptly replace a supplier who is unwilling or unable to satisfy our requirements with a supplier providing similar products. Our suppliers' ability to deliver products may also be affected by financing constraints caused by credit market conditions, which could negatively impact our revenue and cost of products sold, at least until alternate sources of supply are arranged.
In addition, since some of the products that we distribute are produced in foreign countries, we are dependent on long supply chains for the successful delivery of many of our products. The length and complexity of these supply chains make them vulnerable to numerous risks, many of which are beyond our control, which could cause significant interruptions or delays in delivery of our products. Factors such as political instability, the financial instability of suppliers, suppliers' noncompliance with applicable laws, trade restrictions, labor disputes, currency fluctuations, changes in tariff or import
22
policies, severe weather, terrorist attacks and transport capacity and cost may disrupt these supply chains and our ability to access products and supplies. For example, if the government of China were to reduce or withdraw the tax benefits they provide our Chinese suppliers, the cost of some of our products may increase and our margins could be reduced. We expect more of our products will be imported in the future, which will further increase these risks. If we increase the percentage of our products that are sourced from lower-cost countries, these risks will be amplified. Moreover, these risks will be amplified by our ongoing efforts to consolidate our supplier base across our business units. A significant interruption in our supply chains caused by any of the above factors could result in increased costs or delivery delays and result in a decrease in our Net sales and profitability.
New trade policies could make sourcing product from foreign countries more difficult and more costly.
We source product from outside of the United States. Considerable political uncertainty has arisen in the United States that may result in changes in the trade policies around which we have built our sourcing practices and operations. Given our significant investment in our sourcing and logistics operations and infrastructure, as well as our reliance upon non-domestic suppliers, any significant changes to the United States trade policies (and those of other countries in response) may cause a material adverse effect on our ability to source products from other countries or significantly increase the costs of obtaining such products, which would result in a material adverse effect on our financial results.
We have substantial fixed costs and, as a result, our operating income is sensitive to changes in our Net sales.
A significant portion of our expenses are fixed costs (including personnel), which do not fluctuate with Net sales. Consequently, a percentage decline in our Net sales could have a greater percentage effect on our operating income if we do not act to reduce personnel or take other cost reduction actions. Any decline in our Net sales would cause our profitability to be adversely affected. Moreover, a key element of our strategy is managing our assets, including our substantial fixed assets, more effectively, including through sales or other disposals of excess assets. Our failure to rationalize our fixed assets in the time, and within the costs, we expect could have an adverse effect on our results of operations and financial condition.
A change in our product mix could adversely affect our results of operations.
Our results may be affected by a change in our product mix. Our outlook, budgeting and strategic planning assume a certain product mix of sales. If actual results vary from this projected product mix of sales, our financial results could be negatively impacted.
The impairment or failure of financial institutions may adversely affect us.
We have exposure to counterparties with which we execute transactions, including U.S. and foreign commercial banks, insurance companies, investment banks, investment funds and other financial institutions. Many of these transactions could expose us to risk in the event of the bankruptcy, receivership, default or similar event involving a counterparty. While we have not realized any significant losses to date, the bankruptcy, receivership, default or similar event involving one of our financial institution counterparties could have a material adverse impact on our access to funding or our ability to meet our financing agreement obligations.
The development of alternatives to distributors in the supply chain could cause a decrease in our sales and operating results and limit our ability to grow our business.
Our customers could begin purchasing more of their product needs directly from manufacturers, which would result in decreases in our Net sales and earnings. Our suppliers could invest in infrastructure to expand their own local sales force and sell more products directly to our customers, which also would negatively impact our business. For example, multiple municipalities may outsource their entire waterworks systems to a single company, thereby increasing such company's leverage in the marketplace and its ability to buy directly from suppliers, which may have a material adverse effect on our operating results.
23
In addition to these factors, our customers may elect to establish their own building products manufacturing and distribution facilities, or give advantages to manufacturing or distribution intermediaries in which they have an economic stake. These changes in the supply chain could adversely affect our financial condition, operating results and cash flows.
Because our business is working capital intensive, we rely on our ability to manage our product purchasing and customer credit policies.
Our operations are working capital intensive, and our inventories, accounts receivable and accounts payable are significant components of our net asset base. We manage our inventories and accounts payable through our purchasing policies and our accounts receivable through our customer credit policies. If we fail to adequately manage our product purchasing or customer credit policies, our working capital and financial condition may be adversely affected.
Anti-terrorism measures and other disruptions to the transportation network could impact our distribution system and our operations.
Our ability to provide efficient distribution of products to our customers is an integral component of our overall business strategy. In the aftermath of terrorist attacks in the United States, federal, state and local authorities have implemented and continue to implement various security measures that affect many parts of the transportation network in the United States and abroad. Our customers typically need quick delivery and rely on our on-time delivery capabilities. If security measures disrupt or impede the timing of our deliveries, we may fail to meet the needs of our customers, or may incur increased expenses to do so.
The implementation of our technology initiatives could disrupt our operations in the near term, and our technology initiatives might not provide the anticipated benefits or might fail.
We have made, and will continue to make, significant technology investments in each of our business units and in our administrative functions. Our technology initiatives are designed to streamline our operations to allow our associates to continue to provide high quality service to our customers and to provide our customers a better experience, while improving the quality of our internal control environment. The cost and potential problems and interruptions associated with the implementation of our technology initiatives could disrupt or reduce the efficiency of our operations in the near term. In addition, our new or upgraded technology might not provide the anticipated benefits, it might take longer than expected to realize the anticipated benefits or the technology might fail altogether.
Interruptions in the proper functioning of our information technology, or "IT" systems, including from cybersecurity threats, could disrupt operations and cause unanticipated increases in costs or decreases in revenues, or both.
We use our information systems to, among other things, manage inventories and accounts receivable, make purchasing decisions, manage our manufacturing operations and monitor our results of operations, and process, transmit and store sensitive electronic data, including employee, supplier and customer records. As a result, the proper functioning of our IT systems is critical to the successful operation of our business. Our information systems include proprietary systems developed and maintained by us. In addition, we depend on IT systems of third parties, such as suppliers, retailers and OEMs to, among other things, market and distribute products, develop new products and services, operate our website, host and manage our services, store data, process transactions, respond to customer inquiries and manage inventory and our supply chain. Although our IT systems are protected through physical and software safeguards and remote processing capabilities exist, our IT systems or those of third parties whom we depend upon are still vulnerable to natural disasters, power losses, unauthorized access, telecommunication failures and other problems. If critical proprietary or
24
third-party IT systems fail or are otherwise unavailable, including as a result of system upgrades and transitions, our ability to process orders, track credit risk, identify business opportunities, maintain proper levels of inventories, collect accounts receivable, pay expenses and otherwise manage our business would be adversely affected.
Cyber incidents can result from deliberate attacks or unintentional events. These incidents can include, but are not limited to, gaining unauthorized access to digital systems for purposes of misappropriating assets or sensitive information, corrupting data, or causing operational disruption. Cybersecurity attacks in particular are becoming more sophisticated and include, but are not limited to, malicious software, attempts to gain unauthorized access to data (either directly or through our vendors and customers) and other electronic security breaches. Despite our security measures, our IT systems and infrastructure or those of our third parties may be vulnerable to such cyber incidents. The result of these incidents could include, but are not limited to, disrupted operations, misstated or misappropriated financial data, theft of our intellectual property or other confidential information (including of our customers, suppliers and employees), liability for stolen assets or information, increased cyber security protection costs and reputational damage adversely affecting customer or investor confidence. In addition, if any information about our customers, including payment information, were the subject of a successful cybersecurity attack against us, we could be subject to litigation or other claims by the affected customers. We have incurred costs and may incur significant additional costs in order to implement the security measures we feel are appropriate to protect our IT systems.
Our costs of doing business could increase as a result of changes in U.S. federal, state or local regulations.
Our operations are principally affected by various statutes, regulations and laws in the 48 U.S. states and six Canadian provinces in which we operate. While we are not engaged in a regulated industry, we are subject to various laws applicable to businesses generally, including laws affecting land usage, zoning, the environment, health and safety, transportation, labor and employment practices, competition, immigration and other matters. Additionally, building codes may affect the products our customers are allowed to use, and consequently, changes in building codes may affect the saleability of our products. Changes in U.S. federal, state or local regulations governing the sale of some of our products could increase our costs of doing business. In addition, changes to U.S. federal, state and local tax regulations could increase our costs of doing business. We cannot provide assurance that we will not incur material costs or liabilities in connection with regulatory requirements.
We deliver products to many of our customers through our own fleet of vehicles. The U.S. Department of Transportation (the "DOT") regulates our operations in domestic interstate commerce. We are subject to safety requirements governing interstate operations prescribed by the DOT. Vehicle dimensions and driver hours of service also remain subject to both federal and state regulation. More restrictive limitations on vehicle weight and size, trailer length and configuration, or driver hours of service could increase our costs, which, if we are unable to pass these cost increases on to our customers, would reduce our gross margins, increase our Selling, general and administrative expenses and reduce our Net income (loss).
We cannot predict whether future developments in law and regulations concerning our business units will affect our business, financial condition and results of operations in a negative manner. Similarly, we cannot assess whether our business units will be successful in meeting future demands of regulatory agencies in a manner which will not materially adversely affect our business, financial condition or results of operations.
25
We are required to evaluate and, if applicable, disclose our use of 'conflict minerals' in certain of the products we distribute, which imposes costs on us and could raise reputational and other risks.
The SEC promulgated final rules in connection with the Dodd-Frank Wall Street Reform and Consumer Protection Act, regarding disclosure of the use of certain minerals, known as 'conflict minerals', that are mined from the Democratic Republic of the Congo and adjoining countries. Compliance with these rules requires due diligence efforts and disclosure in each fiscal year. There are costs associated with complying with these disclosure requirements, including costs to determine which of our products are subject to the new rules and the source of any 'conflict minerals' used in those products. In addition, the implementation of these rules could adversely affect the sourcing, supply, and pricing of materials used in those products. Also, we may face reputational challenges if we are unable to verify the origins for all metals used in products through the procedures we may implement. We may also encounter challenges to satisfy customers that may require all of the components of products purchased to be certified as conflict free. If we are not able to meet customer requirements, customers may choose to disqualify us as a distributor.
The nature of our business exposes us to construction defect and product liability claims as well as other legal proceedings.
We rely on manufacturers and other suppliers to provide us with the products we sell and distribute. As we do not have direct control over the quality of the products manufactured or supplied by such third-party suppliers, we are exposed to risks relating to the quality of the products we distribute and install. It is possible that inventory from a manufacturer or supplier could be sold to our customers and later be alleged to have quality problems or to have caused personal injury, subjecting us to potential claims from customers or third parties. We have been subject to such claims in the past, which have been resolved without material financial impact. We are currently involved in construction defect and product liability claims relating to our various construction trades and the products we distribute and manufacture and relating to products we have installed. In certain situations, we have undertaken to voluntarily remediate any defects, which can be a costly measure. We also operate a large fleet of trucks and other vehicles and therefore face the risk of traffic accidents.
While we currently maintain insurance coverage to address a portion of these types of liabilities, we cannot make assurances that we will be able to obtain such insurance on acceptable terms in the future, if at all, or that any such insurance will provide adequate coverage against potential claims. Further, while we seek indemnification against potential liability for product liability claims from relevant parties, including but not limited to manufacturers and suppliers, we cannot guarantee that we will be able to recover under such indemnification agreements. Moreover, as we increase the number of private label products we distribute, our exposure to potential liability for products liability claims may increase. Product liability claims can be expensive to defend and can divert the attention of management and other personnel for significant time periods, regardless of the ultimate outcome. An unsuccessful product liability defense could be highly costly and accordingly result in a decline in profitability. In addition, uncertainties with respect to the Chinese legal system may adversely affect us in resolving claims arising from our proprietary brand products manufactured in China. Because many laws and regulations are relatively new and the Chinese legal system is still evolving, the interpretations of many laws, regulations and rules are not always uniform. Finally, even if we are successful in defending any claim relating to the products we distribute, claims of this nature could negatively impact customer confidence in our products and our Company.
From time to time, we are also involved in government inquiries and investigations, as well as class action, consumer, employment and tort proceedings, and other litigation. We cannot predict with certainty the outcomes of these legal proceedings and other contingencies, including environmental remediation and other proceedings commenced by government authorities. The outcome of some of these legal proceedings and other contingencies could require us to take, or refrain from taking, actions
26
which could adversely affect our operations or could require us to pay substantial amounts of money. Additionally, defending against these lawsuits and proceedings may involve significant expense and diversion of management's attention and resources from other matters. For example, as previously disclosed, the Company entered into an Administrative Settlement and Compliance Agreement with the Federal Highway Administration ("FHWA") in 2015 pursuant to which our Waterworks business unit agreed to undertake certain remedial measures in connection with the Company's business dealings with disadvantaged business enterprises, including (a) continuing to be bound by our Code of Business Conduct and Ethics; (b) implementing and maintaining a corporate compliance program; (c) appointing a Corporate Compliance Officer; and (d) retaining an independent monitor to evaluate and report on Waterworks' compliance with the agreement. While the Company currently expects that Waterworks will not materially breach its obligations under the agreement, there can be no assurances that the FHWA will not initiate or pursue any suspension or debarment proceedings in the future.
If we become subject to material liabilities under our self-insured programs, our financial results may be adversely affected.
We provide workers' compensation, automobile and product/general liability coverage through a high deductible insurance program. In addition, we are self-insured for our health benefits and maintain per employee stop-loss coverage. Although we believe that we have adequate stop-loss coverage for catastrophic claims to cap the risk of loss, our results of operations and financial condition may be adversely affected if the number and severity of claims that are not covered by stop-loss insurance increases.
We may see increased costs arising from healthcare reform.
In March 2010, the United States government enacted comprehensive healthcare reform legislation which, among other things, includes guaranteed coverage requirements, eliminates pre-existing condition exclusions and annual and lifetime maximum limits, restricts the extent to which policies can be rescinded and imposes new and significant taxes on health insurers and healthcare benefits. Although the current United States administration has indicated its desire and intent to repeal and/or replace the current healthcare reform legislation, there can be no assurance that any such action will be achieved. The March 2010 legislation imposes implementation effective dates which began in 2010 and extend through 2020, and many of the changes require additional guidance from government agencies or federal regulations. Therefore, due to the phased-in nature of the implementation and limited interpretive guidance, and the legislations possible repeal and/or replacement, it is difficult to determine at this time what impact the health care reform legislation, or any possible replacement, if any, will have on our financial results. Possible adverse effects of the health reform legislation, and any possible replacement, if any, include increased costs, exposure to expanded liability and requirements for us to revise ways in which we provide healthcare and other benefits to our employees. As a result, our results of operations, financial condition and cash flows could be materially adversely affected.
Our success depends upon our ability to attract, train and retain highly qualified associates and key personnel.
To be successful, we must attract, train and retain a large number of highly qualified associates while controlling related labor costs. Our ability to control labor costs is subject to numerous external factors, including prevailing wage rates and health and other insurance costs. We compete with other businesses for these associates and invest significant resources in training and motivating them. There is no assurance that we will be able to attract or retain highly qualified associates in the future, including, in particular, those employed by companies we acquire. A very small proportion of our employees are currently covered by collective bargaining or other similar labor agreements. Historically, the effects of collective bargaining and other similar labor agreements on us have not been significant. However, if a
27
larger number of our employees were to unionize, including in the wake of any future legislation that makes it easier for employees to unionize, the effect on us may be negative. Any inability by us to negotiate acceptable new contracts under these collective bargaining arrangements could cause strikes or other work stoppages, and new contracts could result in increased operating costs. If any such strikes or other work stoppages occur, or if other employees become represented by a union, we could experience a disruption of our operations and higher labor costs. Labor relations matters affecting our suppliers of products and services could also adversely affect our business from time to time.
In addition, our business results depend largely upon our chief executive officer and senior management team as well as our branch managers and sales personnel and their experience, knowledge of local market dynamics and specifications and long-standing customer relationships. We customarily sign employment letters providing for an agreement not to compete with key personnel of companies we acquire in order to maintain key customer relationships and manage the transition of the acquired business. Our inability to retain or hire qualified branch managers or sales personnel at economically reasonable compensation levels would restrict our ability to grow our business, limit our ability to continue to successfully operate our business and result in lower operating results and profitability.
Fluctuations in foreign currency exchange rates may significantly reduce our revenues and profitability.
As an industrial distributor of manufactured products, our profitability is tied to the prices we pay to the manufacturers from which we purchase our products. Some of our suppliers price their products in currencies other than the U.S. dollar or incur costs of production in non-U.S. currencies. Accordingly, depreciation of the U.S. dollar against foreign currencies increases the prices we pay for these products. Even short-term currency fluctuations could adversely impact revenues and profitability if we are unable to pass higher supply costs on to our customers. Our delayed ability to pass on material price increases to our customers could adversely impact our financial condition, operating results and cash flows.
If we are unable to protect our intellectual property rights, or we infringe on the intellectual property rights of others, our ability to compete could be negatively impacted.
Our ability to compete effectively depends, in part, upon our ability to protect and preserve proprietary aspects of our intellectual property, including our trademarks and customer lists. The use of our intellectual property or similar intellectual property by others could adversely impact our ability to compete, cause us to lose Net sales or otherwise harm our business. If it became necessary for us to resort to litigation to protect these rights, any proceedings could be burdensome and costly, and we may not prevail.
Also, we cannot be certain that the products that we sell do not and will not infringe issued patents or other intellectual property rights of others. Further, we are subject to legal proceedings and claims in the ordinary course of our business, including claims of alleged infringement of the trademarks, patents and other intellectual property rights of third parties by us or our customers in connection with their use of the products that we distribute. Should we be found liable for infringement, we (or our suppliers) may be required to enter into licensing agreements (if available on acceptable terms or at all) or pay damages and cease making or selling certain products. Moreover, we may need to redesign or sell different products to avoid future infringement liability. Any of the foregoing could cause us to incur significant costs, prevent us from selling our products or negatively impact our ability to compete.
28
Income tax payments may ultimately differ from amounts currently recorded by us. Future tax law changes may materially increase our prospective income tax expense.
We are subject to income taxation in many jurisdictions in the U.S. as well as foreign jurisdictions. Judgment is required in determining our worldwide income tax provision and, accordingly, there are many transactions and computations for which our final income tax determination is uncertain. We are routinely audited by income tax authorities in many tax jurisdictions. Although we believe the recorded tax estimates are reasonable, the ultimate outcome from any audit (or related litigation) could be materially different from amounts reflected in our income tax provisions and accruals. Future settlements of income tax audits may have a material effect on earnings between the period of initial recognition of tax estimates in the financial statements and the point of ultimate tax audit settlement. Additionally, it is possible that future income tax legislation in any jurisdiction to which we are subject may be enacted that could have a material impact on our worldwide income tax provision beginning with the period that such legislation becomes effective. The current U.S. administration has listed tax reform among its top policy priorities, and the U.S. Congress is reviewing various legislative tax proposals. Certain versions of recent U.S. tax reform proposals could, if enacted, significantly impact the taxation of the Company and could have a material impact on the Company's tax expense, tax attributes and cash flows. Proposed import tariffs and/or border adjustment proposals could also significantly impact tax expense and cash flow, as well as sourcing and supply chain strategies.
Our NOL carryforwards could be limited if we experience an ownership change as defined in the Internal Revenue Code.
As of January 29, 2017, we had U.S. federal NOL carryforwards of $1,779 million ($623 million on a tax-effected basis). Such NOL carryforwards begin to expire in fiscal 2031. We also had significant state NOL carryforwards, which expire in various years through fiscal 2036. Our ability to deduct these NOL carryforwards against future taxable income could be limited if we experience an "ownership change," as defined in Section 382 of the Internal Revenue Code of 1986, as amended. In general, an ownership change may result from transactions increasing the aggregate direct or indirect ownership of certain persons (or groups of persons) in our stock by more than 50 percentage points over a testing period (generally three years). Future direct or indirect changes in the ownership of our common stock, including sales or acquisitions of our common stock by stockholders and purchases and issuances of our common stock by us, some of which are not in our control, could result in an ownership change. Any resulting limitation on the use of our NOL carryforwards could result in the payment of taxes above the amounts currently anticipated and have a negative effect on our future results of operations and financial position.
We may not be able to identify new products and new product lines and integrate them into our distribution network, which may impact our ability to compete.
Our business depends in part on our ability to identify future products and product lines that complement existing products and product lines and that respond to our customers' needs. We may not be able to compete effectively unless our product selection keeps up with trends in the markets in which we compete or trends in new products. In addition, our ability to integrate new products and product lines into our distribution network could impact our ability to compete. Furthermore, the success of new products and new product lines will depend on market demand and there is a risk that new products and new product lines will not deliver expected results, which could negatively impact our future sales and results of operations. Our expansion into new markets may present competitive, distribution and regulatory challenges that differ from current ones. We may be less familiar with the target customers and may face different or additional risks, as well as increased or unexpected costs, compared to existing operations. Growth into new markets may also bring us into direct competition with companies with whom we have little or no past experience as competitors. To the extent we are
29
reliant upon expansion into new geographic, industry and product markets for growth and do not meet the new challenges posed by such expansion, our future sales growth could be negatively impacted, our operating costs could increase, and our business operations and financial results could be negatively affected.
We could incur significant costs in complying with environmental, health and safety laws or permits or as a result of satisfying any liability or obligation imposed under such laws or permits.
Our operations are subject to various federal, state, local and foreign environmental, health and safety laws and regulations. Among other things, these laws regulate the emission or discharge of materials into the environment, govern the use, storage, treatment, disposal and management of hazardous substances and wastes, protect the health and safety of our employees and the end users of our products, regulate the materials used in and the recycling of products and impose liability for the costs of investigating and remediating, and damages resulting from, present and past releases of hazardous substances. Violations of these laws and regulations or non-compliance with any conditions contained in any environmental permit can result in substantial fines or penalties, injunctive relief, requirements to install pollution or other controls or equipment, civil and criminal sanctions, permit revocations and/or facility shutdowns. We could be held liable for the costs to address contamination of any real property we have ever owned, operated or used as a disposal site. We could also incur fines, penalties, sanctions or be subject to third-party claims for property damage, personal injury or nuisance or otherwise as a result of violations of or liabilities under environmental laws in connection with releases of hazardous or other materials. In addition, changes in, or new interpretations of, existing laws, regulations or enforcement policies, the discovery of previously unknown contamination, or the imposition of other environmental liabilities or obligations in the future, including additional investigation or other obligations with respect to any potential health hazards of our products or business activities or the imposition of new permit requirements, may lead to additional compliance or other costs that could have material adverse effect on our business, financial condition or results of operations.
We may be affected by global climate change or by legal, regulatory or market responses to such potential change.
Concern over climate change, including the impact of global warming, has led to significant federal, state, and international legislative and regulatory efforts to limit greenhouse gas ("GHG") emissions. For example, in the past several years, the U.S. Congress has considered various bills that would regulate GHG emissions. While these bills have not yet received sufficient Congressional support for enactment, some form of federal climate change legislation is possible in the future. Even in the absence of such legislation, the Environmental Protection Agency, spurred by judicial interpretation of the Clean Air Act, may regulate GHG emissions, especially diesel engine emissions, and this could impose substantial costs on us. These costs include an increase in the cost of the fuel and other energy we purchase and capital costs associated with updating or replacing our internal fleet of trucks and other vehicles prematurely. In addition, new laws or future regulation could directly and indirectly affect our customers and suppliers (through an increase in the cost of production or their ability to produce satisfactory products) and our business (through the impact on our inventory availability, cost of sales, operations or demands for the products we sell). Until the timing, scope and extent of any future regulation becomes known, we cannot predict its effect on our cost structure or our operating results. Notwithstanding our dedication to being a responsible corporate citizen, it is reasonably possible that such legislation or regulation could impose material costs on us. Moreover, even without such legislation or regulation, increased awareness and any adverse publicity in the global marketplace about the GHGs emitted by companies involved in the transportation of goods could harm our reputation and reduce customer demand for our products and services.
30
Our failure to maintain effective disclosure controls and procedures and internal control over financial reporting could adversely affect our business, financial position and results of operations.
We are required to evaluate the effectiveness of our disclosure controls and procedures and internal control over financial reporting on a periodic basis and publicly disclose the results of these evaluations and related matters, in accordance with the requirements of Section 404 of the Sarbanes-Oxley Act of 2002. These reporting and other obligations place significant additional demands on our management and administrative and operational resources, including our accounting resources, which could adversely affect our operations among other things. To comply with these requirements, we have upgraded, and are continuing to upgrade, our systems, including information technology, and we have implemented additional financial and management controls, reporting systems and procedures. We cannot be certain that we will be successful in maintaining adequate control over our financial reporting and financial processes. Furthermore, as we grow our business, our disclosure controls and procedures and internal control over financial reporting will become more complex, and we may require significantly more resources to ensure that these controls and procedures remain effective. If we are unable to continue upgrading our financial and management controls, reporting systems, information technology and procedures in a timely and effective fashion, additional management and other resources of the Company may need to be devoted to assist in compliance with the disclosure and financial reporting requirements and other rules that apply to reporting companies, which could adversely affect our business, financial position and results of operations.
Future changes in financial accounting standards may significantly change our reported results of operations.
The accounting principles generally accepted in the United States of America ("GAAP") are subject to interpretation by the Financial Accounting Standards Board ("FASB"), the American Institute of Certified Public Accountants, the SEC and various bodies formed to promulgate and interpret appropriate accounting principles. A change in these principles or interpretations could have a significant effect on our reported financial results and could affect the reporting of transactions completed before the announcement of a change. In addition, the SEC has announced a multi-year plan that could ultimately lead to the use of International Financial Reporting Standards by U.S. issuers in their SEC filings. Any such change could have a significant effect on our reported financial results.
Additionally, our assumptions, estimates and judgments related to complex accounting matters could significantly affect our financial results. GAAP and related accounting pronouncements, implementation guidelines and interpretations with regard to a wide range of matters that are relevant to our business, including, but not limited to, revenue recognition, impairment of long-lived assets, leases and related economic transactions, intangibles, self-insurance, income taxes, property and equipment, litigation and stock-based compensation are highly complex and involve many subjective assumptions, estimates and judgments by us. Changes in these rules or their interpretation or changes in underlying assumptions, estimates or judgments by us (i) could require us to make changes to our accounting systems to implement these changes that could increase our operating costs and (ii) could significantly change our reported or expected financial performance.
On February 25, 2016, the FASB issued Accounting Standards Update ("ASU") 2016-02, "Leases (Topic 842)" ("ASU 2016-02"). ASU 2016-02 is effective for annual and interim periods beginning after December 15, 2018. The lease accounting model is a "right of use" model that assumes that each lease creates an asset (the lessee's right to use the leased asset) and a liability (the future rent payment obligations) which should be reflected on a lessee's balance sheet to fairly represent the lease transaction and the lessee's related financial obligations. We conduct operations primarily under leases that are accounted for as operating leases, with no related assets and liabilities on our balance sheet. ASU 2016-02 requires that substantially all of our operating leases be recognized as assets and liabilities on our balance sheet. Adoption of ASU 2016-02 could have a material impact on our
31
reported results of operations. Interpretations of the new lease accounting rules or changes in underlying assumptions, estimates or judgments by us could significantly change our reported or expected financial performance.
Fulfilling the obligations incident to being a public company, including with respect to the requirements of and related rules under the Sarbanes-Oxley Act of 2002, is expensive and time-consuming, and any delays or difficulties in satisfying these obligations could have a material adverse effect on our future results of operations.
As an issuer of publicly listed equity, we are subject to certain reporting and corporate governance requirements, NASDAQ listing standards and the Sarbanes-Oxley Act of 2002, which impose certain compliance costs and obligations upon us. These requirements result in a significant commitment of additional resources and management oversight which increases our operating costs. These requirements also place significant demands on our finance and accounting and legal staffs and on our financial accounting and information systems. Other expenses associated with being a public company include costs associated with auditing, accounting and legal fees and expenses, investor relations expenses, increased directors' fees and director and officer liability insurance costs, registrar and transfer agent fees and listing fees, as well as other expenses.
In addition, our independent registered public accounting firm is required to provide an attestation report on the effectiveness of internal controls over financial reporting pursuant to Section 404(b) of the Sarbanes-Oxley Act of 2002. If our independent registered public accounting firm is unable to provide an unqualified report regarding the effectiveness of our internal controls over financial reporting, investors could lose confidence in the reliability of our financial statements. Failure to comply with the Sarbanes-Oxley Act of 2002 could potentially subject us to sanctions or investigations by the SEC, or other regulatory authorities.
Risks Relating to Our Indebtedness
We have substantial debt and may incur substantial additional debt, which could adversely affect our financial health, reduce our profitability, limit our ability to obtain financing in the future and pursue certain business opportunities and reduce the value of your investment.
As of January 29, 2017, we had an aggregate principal amount of $3,812 million of outstanding debt, net of unamortized discounts and unamortized deferred financing costs of $9 million and $38 million, respectively. In fiscal 2016 we incurred $269 million of interest expense.
The amount of our debt or such other obligations could have important consequences for holders of our common stock, including, but not limited to:
- •
- a substantial portion of our cash flow from operations must be dedicated to the payment of principal and interest on our indebtedness, thereby
reducing the funds available to us for other purposes;
- •
- our ability to obtain additional financing for working capital, capital expenditures, acquisitions, debt service requirements or general
corporate purposes and other purposes may be impaired in the future;
- •
- we are exposed to the risk of increased interest rates because a portion of our borrowings is at variable rates of interest;
- •
- we may be at a competitive disadvantage compared to our competitors with less debt or with comparable debt at more favorable interest rates and
that, as a result, may be better positioned to withstand economic downturns;
- •
- our ability to refinance indebtedness may be limited or the associated costs may increase;
32
- •
- our ability to engage in acquisitions without raising additional equity or obtaining additional debt financing may be impaired in the future;
- •
- it may be more difficult for us to satisfy our obligations to our creditors, resulting in possible defaults on and acceleration of such
indebtedness;
- •
- we may be more vulnerable to general adverse economic and industry conditions; and
- •
- our flexibility to adjust to changing market conditions and our ability to withstand competitive pressures could be limited, or we may be prevented from making capital investments that are necessary or important to our operations in general, growth strategy and efforts to improve operating margins of our business units.
If our cash flow and capital resources are insufficient to fund our debt service obligations, we may be forced to reduce or delay capital expenditures, sell assets, seek to obtain additional equity capital or refinance our debt. We cannot make assurances that we will be able to refinance our debt on terms acceptable to us, or at all. In the future, our cash flow and capital resources may not be sufficient for payments of interest on and principal of our debt, and such alternative measures may not be successful and may not permit us to meet our scheduled debt service obligations.
We cannot make assurances that we will be able to refinance any of our indebtedness, or obtain additional financing, particularly because of our high levels of debt and the debt incurrence restrictions imposed by the agreements governing our debt, as well as prevailing market conditions. In the absence of such operating results and resources, we could face substantial liquidity problems and might be required to dispose of material assets or operations to meet our debt service and other obligations. The credit agreements governing our Senior Credit Facilities and the indentures governing our outstanding notes restrict our ability to dispose of assets and how we use the proceeds from any such dispositions. We cannot make assurances that we will be able to consummate those dispositions, or if we do, what the timing of the dispositions will be or whether the proceeds that we realize will be adequate to meet our debt service obligations when due.
Despite our current level of indebtedness, we may still be able to incur substantially more debt. This could further exacerbate the risks to our financial condition.
We may be able to incur significant additional indebtedness in the future, including secured debt. Although the agreements governing our indebtedness contain restrictions on the incurrence of additional indebtedness, these restrictions are subject to a number of qualifications and exceptions, and the additional indebtedness incurred in compliance with these restrictions could be substantial. These restrictions also will not prevent us from incurring obligations that do not constitute indebtedness, including obligations under lease arrangements that are currently recorded as operating leases even if operating leases were to be treated as debt under GAAP. In addition, the Senior ABL Facility provides a commitment of up to $1,500 million subject to a borrowing base. As of January 29, 2017, we were able to borrow an additional $680 million under the Senior ABL Facility. If new debt is added to our current debt levels, the related risks that we now face could intensify.
The agreements and instruments governing our debt contain restrictions and limitations that could significantly impact our ability to operate our business and adversely affect the holders of our common stock.
Our Senior ABL Facility and our Term Loan Facility contain covenants that, among other things, restrict or limit our subsidiaries' ability to:
- •
- dispose of assets;
- •
- incur additional indebtedness (including guarantees of additional indebtedness);
- •
- prepay or amend our various debt instruments;
33
- •
- pay dividends and make certain payments;
- •
- create liens on assets;
- •
- engage in certain asset sales, mergers, acquisitions, consolidations or sales of all, or substantially all, of our assets;
- •
- engage in certain transactions with affiliates; and
- •
- permit consensual restrictions on our subsidiaries' ability to pay dividends.
The indentures governing our outstanding notes contain restrictive covenants that, among other things, limit the ability of our subsidiaries to:
- •
- incur additional debt;
- •
- pay dividends, redeem stock or make other distributions;
- •
- make certain investments;
- •
- create liens;
- •
- transfer or sell assets;
- •
- merge or consolidate with other companies; and
- •
- enter into certain transactions with our affiliates.
Our ability to comply with the covenants and restrictions contained in the Senior Credit Facilities and the indentures governing our outstanding notes may be affected by economic, financial and industry conditions beyond our control. The breach of any of these covenants or restrictions could result in a default under either the Senior Credit Facilities or the indentures governing our outstanding notes that would permit the applicable lenders or noteholders, as the case may be, to declare all amounts outstanding thereunder to be due and payable, together with accrued and unpaid interest. If we are unable to repay indebtedness, lenders having secured obligations, such as the lenders under the Senior Credit Facilities, could proceed against the collateral securing the secured obligations. This could have serious consequences to our financial condition and results of operations and could cause us to become bankrupt or insolvent.
We may have future capital needs and may not be able to obtain additional financing on acceptable terms.
Although we believe that our current cash position and the additional committed funding available under our Senior ABL Facility is sufficient for our current operations, any reductions in our available borrowing capacity, or our inability to renew or replace our debt facilities, when required or when business conditions warrant, could have a material adverse effect on our business, financial condition and results of operations. The economic conditions, credit market conditions and economic climate affecting our industry, as well as other factors, may constrain our financing abilities. Our ability to secure additional financing, if available, and to satisfy our financial obligations under indebtedness outstanding from time to time will depend upon our future operating performance, the availability of credit generally, economic conditions and financial, business and other factors, many of which are beyond our control. The market conditions and the macroeconomic conditions that affect our industry could have a material adverse effect on our ability to secure financing on favorable terms, if at all.
We may be unable to secure additional financing or financing on favorable terms or our operating cash flow may be insufficient to satisfy our financial obligations under the indebtedness outstanding from time to time. Furthermore, if financing is not available when needed, or is available on unfavorable terms, we may be unable to take advantage of business opportunities or respond to competitive pressures, any of which could have a material adverse effect on our business, financial
34
condition and results of operations. If we raise additional funds through further issuances of equity, convertible debt securities or other securities convertible into equity, our existing stockholders could suffer significant dilution in their percentage ownership of the Company, and any new securities we issue could have rights, preferences and privileges senior to those of holders of our common stock.
Increases in interest rates would increase the cost of servicing our debt and could reduce our profitability.
A significant portion of our outstanding debt, including under the Senior Credit Facilities, bears interest at variable rates. As a result, increases in interest rates would increase the cost of servicing our debt and could materially reduce our profitability and cash flows. Each one percentage point increase in interest rates on our variable-rate debt would increase our annual forecasted interest expense by approximately $16 million based on balances as of January 29, 2017. Assuming all revolving loans were fully drawn, each one percentage point increase in interest rates would result in a $27 million increase in annual cash interest expense on our Senior Credit Facilities. The impact of increases in interest rates could be more significant for us than it would be for some other companies because of our substantial indebtedness.
We may not be able to repurchase our existing notes upon a change of control.
Upon the occurrence of specific kinds of change of control events, we will be required to offer to repurchase all outstanding notes, including our December 2014 First Priority Notes and April 2016 Senior Unsecured Notes, until such notes are redeemed in full. Additionally, under the Term Loan Facility and the Senior ABL Facility, a change of control (as defined therein) constitutes an event of default that permits the lenders to accelerate the maturity of borrowings under the respective agreements and terminate their commitments to lend. We may not be able to satisfy the obligations upon a change of control because we may not have sufficient financial resources to purchase all of the debt securities that are tendered upon a change of control and repay our other indebtedness that will become due. Consequently, we may require additional financing from third parties to fund any such purchases, and we may be unable to obtain financing on satisfactory terms or at all. Further, our ability to repurchase our existing notes may be limited by law. In order to avoid the obligations to repurchase our existing notes and events of default and potential breaches of the credit agreement governing the Term Loan Facility, and the credit agreement governing the Senior ABL Facility, we may have to avoid certain change of control transactions that would otherwise be beneficial to us.
Risks Relating to Our Common Stock
Holdings is a holding company with no operations of its own, and it depends on its subsidiaries for cash to fund all of its operations and expenses, including to make future dividend payments, if any.
Our operations are conducted almost entirely through our subsidiaries and our ability to generate cash to meet our debt service obligations or to pay dividends is highly dependent on the earnings and the receipt of funds from our subsidiaries via dividends or intercompany loans. We do not currently expect to declare or pay dividends on our common stock for the foreseeable future. However, to the extent that we determine in the future to pay dividends on our common stock, our Senior Credit Facilities significantly restrict the ability of our subsidiaries to pay dividends or otherwise transfer assets to us. In addition, Delaware law may impose requirements that may restrict our ability to pay dividends to holders of our common stock.
The market price of our common stock may be volatile and could decline in the future.
We cannot assure you that an active public market for our common stock will be sustained. In the absence of a public trading market, you may not be able to liquidate your investment in our common
35
stock. In addition, the market price of our common stock may fluctuate significantly. Among the factors that could affect our stock price are:
- •
- industry or general market conditions;
- •
- domestic and international economic factors unrelated to our performance;
- •
- changes in our customers' preferences;
- •
- new regulatory pronouncements and changes in regulatory guidelines;
- •
- actual or anticipated fluctuations in our quarterly operating results;
- •
- changes in securities analysts' estimates of our financial performance or lack of research and reports by industry analysts;
- •
- actions by institutional stockholders or other large stockholders, including future sales by them of shares of our common stock;
- •
- speculation in the press or investment community;
- •
- investor perception of us and our industry;
- •
- changes in market valuations or earnings of similar companies;
- •
- announcements by us or our competitors of significant products, contracts, acquisitions, divestitures or strategic partnerships;
- •
- developments or disputes concerning patents or proprietary rights, including increases or decreases in litigation expenses associated with
intellectual property lawsuits we may initiate, or in which we may be named as defendants;
- •
- failure to complete significant sales;
- •
- any future sales of our common stock or other securities; and
- •
- additions or departures of key Company personnel.
In particular, we cannot assure you that you will be able to resell your shares of our common stock at or above the price you paid for them. The stock markets have experienced extreme volatility in recent years that has been unrelated to the operating performance of particular companies. These broad market fluctuations may adversely affect the trading price of our common stock. In the past, following periods of volatility in the market price of a company's securities, class action litigation has often been instituted against such company. Any litigation of this type brought against us could result in substantial costs and a diversion of our management's attention and resources, which would harm our business, operating results and financial condition.
Future sales of shares by existing stockholders could cause our stock price to decline.
Sales of substantial amounts of our common stock in the public market, or the perception that these sales could occur, could cause the market price of our common stock to decline. As of January 29, 2017 we had 201,393,841 outstanding shares of common stock, a large portion of which are freely tradeable without restriction under the Securities Act unless held by "affiliates," as that term is defined in Rule 144 under the Securities Act. The remaining shares of common stock outstanding as of January 29, 2017 are restricted securities within the meaning of Rule 144 under the Securities Act, but will be eligible for resale subject, in certain cases, to applicable volume, means of sale, holding period and other limitations of Rule 144 or pursuant to an exception from registration under Rule 701 under the Securities Act. In connection with our initial public offering, we filed registration statements under the Securities Act to register the shares of common stock to be issued under our equity compensation
36
plans and, as a result, all shares of common stock acquired upon exercise of stock options granted under our plans are also freely tradable under the Securities Act, unless purchased by our affiliates. As of January 29, 2017, there were stock options outstanding to purchase a total of approximately 4 million shares of our common stock. In addition, approximately 9.5 million shares of common stock are reserved for issuance under our omnibus incentive plan and our employee stock purchase plan.
In the future, we may issue additional shares of common stock or other equity or debt securities convertible into common stock in connection with a financing, acquisition, litigation settlement or employee arrangement or otherwise. Any of these issuances could result in substantial dilution to our existing stockholders and could cause the trading price of our common stock to decline.
If securities or industry analysts do not publish research or publish misleading or unfavorable research about our business, our stock price and trading volume could decline.
The trading market for our common stock depends in part on the research and reports that securities or industry analysts publish about us or our business. If one or more of these analysts downgrades our stock or publishes misleading or unfavorable research about our business, our stock price would likely decline. If one or more of these analysts ceases coverage of the Company or fails to publish reports on us regularly, demand for our common stock could decrease, which could cause our stock price or trading volume to decline.
Anti-takeover provisions in our charter documents and Delaware law could discourage, delay or prevent a change in control of our company and may affect the trading price of our common stock.
Our amended and restated certificate of incorporation and amended and restated by-laws include a number of provisions that may discourage, delay or prevent a change in our management or control over us that stockholders may consider favorable. For example, our amended and restated certificate of incorporation and amended and restated by-laws:
- •
- authorize the issuance of "blank check" preferred stock that could be issued by our Board of Directors to thwart a takeover attempt;
- •
- establish a classified board of directors, as a result of which our Board of Directors is divided into three classes, with each class serving
for staggered three-year terms, which prevents stockholders from electing an entirely new board at an annual meeting;
- •
- limit the ability of stockholders to remove directors;
- •
- provide that vacancies on our Board of Directors, including newly-created directorships, may be filled only by a majority vote of directors
then in office;
- •
- prohibit stockholders from calling special meetings of stockholders;
- •
- prohibit stockholder action by written consent, thereby requiring all actions to be taken at a meeting of the stockholders;
- •
- establish advance notice requirements for nominations for election to our Board of Directors or for proposing matters that can be acted upon by
stockholders at stockholder meetings; and
- •
- require the approval of holders of at least 75% of the outstanding shares of our voting common stock to amend our amended and restated by-laws and certain provisions of our amended and restated certificate of incorporation.
These provisions may prevent our stockholders from receiving the benefit from any premium to the market price of our common stock offered by a bidder in a takeover context. Even in the absence of a takeover attempt, the existence of these provisions may adversely affect the prevailing market price of our common stock if the provisions are viewed as discouraging takeover attempts in the future.
37
Our amended and restated certificate of incorporation and amended and restated by-laws may also make it difficult for stockholders to replace or remove our management. These provisions may facilitate management entrenchment that may delay, deter, render more difficult or prevent a change in our control, which may not be in the best interests of our stockholders.
We may not determine to pay dividends on our common stock and, consequently, your ability to achieve a return on your investment will depend on appreciation in the price of our common stock.
We may not declare and pay dividends on our common stock in the near future. In the absence of a dividend, the success of an investment in shares of our common stock would depend upon any future appreciation in their value. There is no guarantee that shares of our common stock will appreciate in value or even maintain the price at which our stockholders have purchased their shares.
38
Properties
As of January 29, 2017, we had a network of approximately 500 locations, of which approximately 50 were owned and 450 were leased. We generally prefer to lease our locations, as it provides the flexibility to expand or relocate our sites as needed to serve evolving markets. Our leased locations comprise approximately 15 million square feet while our owned locations comprise approximately 1 million square feet. Our leases typically have an initial term that ranges from 3 to 5 years, and the leases usually provide for the option to renew. We currently lease approximately 110,000 square feet of office space in both Atlanta, Georgia and Orlando, Florida, for our corporate headquarters. On February 4, 2016, the Company entered into an agreement for the lease of a leadership development and headquarters facility currently under construction in Atlanta, Georgia. The lease commences upon completion of construction of the facility, which is anticipated to be early 2018. For additional information, see "Note 10—Supplemental Balance Sheet and Cash Flow Information," in the Notes to the Consolidated Financial Statements within "Part II. Item 8. Financial Statements and Supplementary Data" of this annual report on Form 10-K. We believe our locations meet our current needs and that additional locations will be available as we expand in the future.
HD Supply is involved in various legal proceedings arising in the normal course of its business. The Company establishes reserves for litigation and similar matters when those matters present loss contingencies that it determines to be both probable and reasonably estimable in accordance with ASC 450, "Contingencies." In the opinion of management, based on current knowledge, all reasonably estimable and probable matters are believed to be adequately reserved for or covered by insurance and are not expected to have a material adverse effect on the Company's consolidated financial condition, results of operations or cash flows. For all other matters management believes the possibility of losses from such matters is not probable, the potential loss from such matters is not reasonably estimable, or such matters are of such kind or involve such amounts that would not have a material adverse effect on the financial position, results of operations or cash flows of the Company if disposed of unfavorably. For material matters that are reasonably possible and reasonably estimable, including matters that are probable and estimable but for which the amount that is reasonably possible is in excess of the amount that the Company has accrued for, management has estimated the aggregate range of potential loss as $0 to $15 million. If a material loss is probable or reasonably possible, and in either case estimable, the Company has considered it in the analysis and it is included in the discussion set forth above.
39
ITEM 5. MARKET FOR REGISTRANT'S COMMON EQUITY, RELATED STOCKHOLDER MATTERS AND ISSUER PURCHASES OF EQUITY SECURITIES
Stock Exchange Information
Holdings' common stock is listed on The NASDAQ Stock Market LLC ("NASDAQ"). As of March 7, 2017, there were approximately 17 holders of record and 292 restricted stock holders of Holdings' common stock. No dividends were declared during fiscal 2016 or fiscal 2015. Holdings' common stock began trading on June 27, 2013.
Holdings' common stock market prices*:
| |
First Quarter | Second Quarter | Third Quarter | Fourth Quarter | |||||||||
|---|---|---|---|---|---|---|---|---|---|---|---|---|---|
Fiscal Year 2016 |
|||||||||||||
High |
$ | 35.29 | $ | 36.84 | $ | 36.78 | $ | 43.73 | |||||
Low |
$ | 22.40 | $ | 32.77 | $ | 30.54 | $ | 31.95 | |||||
Fiscal Year 2015 |
|||||||||||||
High |
$ | 33.74 | $ | 36.69 | $ | 34.99 | $ | 32.17 | |||||
Low |
$ | 28.06 | $ | 32.23 | $ | 28.10 | $ | 24.84 | |||||
- *
- Price as of close of business
Stock Performance Graph
The graph below presents Holdings' cumulative total shareholder returns relative to the performance of the Standard & Poor's 500 Composite Stock Index and the Industrial Select Sector SPDR® Fund (XLI) for our fiscal 2016, 2015, and 2014 years, commencing June 27, 2013, Holdings' initial day of trading. The graph assumes $100 invested at the opening price of Holdings' common stock on NASDAQ and each index on June 27, 2013 and assumes all dividends were reinvested on the
40
date paid. The points on the graph represent fiscal year-end amounts based on the last trading day in each fiscal year.
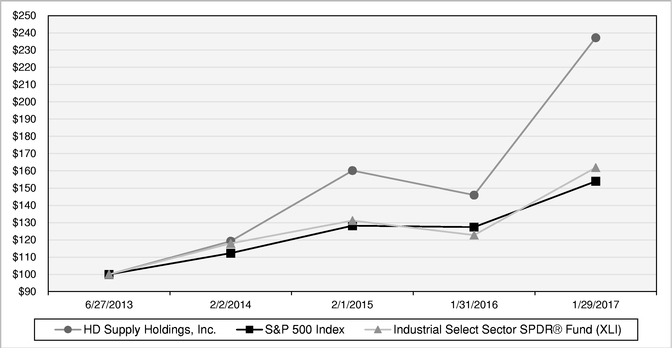
| |
HD Supply Holdings, Inc. |
S&P 500 Index | Industrial Select SPDR® Fund (XLI) |
|||||||
|---|---|---|---|---|---|---|---|---|---|---|
June 27, 2013, IPO |
$ | 100 | $ | 100 | $ | 100 | ||||
February 2, 2014 |
$ | 119 | $ | 112 | $ | 118 | ||||
February 1, 2015 |
$ | 160 | $ | 128 | $ | 131 | ||||
January 31, 2016 |
$ | 146 | $ | 127 | $ | 123 | ||||
January 29, 2017 |
$ | 237 | $ | 154 | $ | 162 | ||||
Issuer Purchases of Equity Securities
In the first quarter of fiscal 2014, Holdings' Board of Directors authorized a share repurchase program to be funded from cash proceeds received from exercises of employee stock options. This share repurchase program does not obligate Holdings to acquire any particular amount of common stock, and it may be terminated at any time at Holdings' discretion. During fiscal 2016, Holdings repurchased approximately 1.0 million shares of its common stock under this program for approximately $33 million.
During fiscal 2016, Holdings retired 449,717 shares of its common stock ("Retired Shares") held as Treasury Shares by Holdings in the amount of $14 million. All of these shares were repurchased by Holdings pursuant to the share repurchase program, discussed above, under which proceeds of employee stock option exercises are used to buy back Holdings common stock in the open market. Holdings reinstated the Retired Shares to the status of authorized but unissued shares of common stock, par value $0.01 per share, effective as of the date of retirement. In accordance with Accounting Standards Codification 505-30, "Equity-Treasury Stock," Holdings reversed the $0.01 par value of the Retired Shares and the excess of the cost of the Retired Shares over par value to Retained Earnings.
41
The number and average price of shares repurchased in each fiscal month of the fourth quarter of fiscal 2016 are set forth in the table below:
ISSUER PURCHASES OF EQUITY SECURITIES
Period
|
Total Number of Shares Purchased |
Average Price Paid per Share |
Total Number of Shares Purchased as Part of a Publicly Announced Program |
Approximate Dollar Value of Shares that May Yet Be Purchased Under the Plans or Programs(1) |
|||||||||
|---|---|---|---|---|---|---|---|---|---|---|---|---|---|
October 31 - November 27 |
80,880 | $ | 37.40 | 80,880 | $ | 3,569,384 | |||||||
November 28 - December 25 |
126,195 | $ | 40.07 | 126,195 | $ | 135,663 | |||||||
December 26 - January 29 |
13,379 | $ | 41.84 | 13,379 | $ | 1,860,061 | |||||||
| | | | | | | | | | | | | | |
Total |
220,454 | $ | 39.20 | 220,454 | |||||||||
- (1)
- The total dollar value of shares that may yet be purchased increases by the amount of cash proceeds received from the exercise of employee stock options as they occur.
HDS Securities
There is no established public trading market for HDS's common stock. HDS had one record holder of common stock on January 29, 2017, and no equity securities of HDS are authorized for issuance under any equity compensation plan.
ITEM 6. SELECTED FINANCIAL DATA
The selected consolidated financial data set forth below should be read in conjunction with "Management's Discussion and Analysis of Financial Condition and Results of Operations" and the audited consolidated financial statements and related notes appearing elsewhere in this annual report on Form 10-K. Our consolidated financial information may not be indicative of our future performance.
HDS has omitted the information required by this Item pursuant to General Instruction I to the Form 10-K.
In fiscal 2016, HD Supply sold its Interior Solutions business. In fiscal 2015, HD Supply sold its Power Solutions business. In fiscal 2014, HD Supply sold substantially all of the assets of its Hardware Solutions business and finalized the disposal of Litemor through liquidation. In fiscal 2012, HD Supply sold its IPVF business. In accordance with Accounting Standards Codification ("ASC") 205-20, "Discontinued Operations," the results of the Interior Solutions, Power Solutions, Hardware Solutions, Litemor, and IPVF operations and the gain/loss on disposition of the businesses are classified as discontinued operations. The presentation of discontinued operations includes revenues and expenses of the discontinued operations and gain/loss on the disposition of the businesses, net of tax, as one line item on the Consolidated Statements of Operations. All prior period Consolidated Statements of Operations have been revised to reflect this presentation. For additional information on the discontinued operations, see Note 2, "Discontinued Operations," within "Part II. Item 8. Financial Statements and Supplementary Data."
42
Selected consolidated financial information
| |
Fiscal Year Ended | |||||||||||||||
|---|---|---|---|---|---|---|---|---|---|---|---|---|---|---|---|---|
| |
January 29, 2017 |
January 31, 2016 |
February 1, 2015 |
February 2, 2014 |
February 3, 2013 |
|||||||||||
| |
(Dollars in millions, except per share amounts) |
|||||||||||||||
Statement of income data: |
||||||||||||||||
Net sales |
$ | 7,439 | $ | 7,123 | $ | 6,682 | $ | 6,103 | $ | 5,629 | ||||||
Cost of sales |
4,907 | 4,734 | 4,487 | 4,086 | 3,806 | |||||||||||
| | | | | | | | | | | | | | | | | |
Gross profit |
2,532 | 2,389 | 2,195 | 2,017 | 1,823 | |||||||||||
Operating expenses: |
||||||||||||||||
Selling, general and administrative |
1,637 | 1,535 | 1,446 | 1,383 | 1,295 | |||||||||||
Depreciation and amortization |
95 | 108 | 178 | 198 | 274 | |||||||||||
Restructuring |
9 | 9 | 6 | 6 | — | |||||||||||
| | | | | | | | | | | | | | | | | |
Total operating expenses |
1,741 | 1,652 | 1,630 | 1,587 | 1,569 | |||||||||||
Operating income |
791 | 737 | 565 | 430 | 254 | |||||||||||
Interest expense |
269 | 394 | 462 | 528 | 658 | |||||||||||
Loss on extinguishment & modification of debt |
179 | 100 | 108 | 87 | 709 | |||||||||||
Other (income) expense, net |
— | 1 | (3 | ) | 20 | — | ||||||||||
| | | | | | | | | | | | | | | | | |
Income (loss) from continuing operations before provision for income taxes and discontinued operations |
343 | 242 | (2 | ) | (205 | ) | (1,113 | ) | ||||||||
Provision (benefit) for income taxes |
139 | (1,084 | ) | 36 | 38 | 20 | ||||||||||
| | | | | | | | | | | | | | | | | |
Income (loss) from continuing operations |
204 | 1,326 | (38 | ) | (243 | ) | (1,133 | ) | ||||||||
Income (loss) from discontinued operations, net of tax |
(8 | ) | 146 | 41 | 25 | (46 | ) | |||||||||
| | | | | | | | | | | | | | | | | |
Net income (loss) |
$ | 196 | $ | 1,472 | $ | 3 | $ | (218 | ) | $ | (1,179 | ) | ||||
| | | | | | | | | | | | | | | | | |
| | | | | | | | | | | | | | | | | |
| | | | | | | | | | | | | | | | | |
Weighted Average Common Shares Outstanding(1): |
||||||||||||||||
Basic (thousands) |
199,385 | 197,011 | 193,962 | 166,905 | 130,561 | |||||||||||
Diluted (thousands) |
202,000 | 201,308 | 193,962 | 166,905 | 130,561 | |||||||||||
Basic Earnings Per Share(1): |
||||||||||||||||
Income (loss) from continuing operations |
$ | 1.02 | $ | 6.73 | $ | (0.20 | ) | $ | (1.46 | ) | $ | (8.68 | ) | |||
Income (loss) from discontinued operations |
(0.04 | ) | 0.74 | 0.21 | 0.15 | (0.35 | ) | |||||||||
| | | | | | | | | | | | | | | | | |
Net income (loss) |
$ | 0.98 | $ | 7.47 | $ | 0.02 | $ | (1.31 | ) | $ | (9.03 | ) | ||||
| | | | | | | | | | | | | | | | | |
| | | | | | | | | | | | | | | | | |
| | | | | | | | | | | | | | | | | |
Diluted Earnings Per Share(1): |
||||||||||||||||
Income (loss) from continuing operations |
$ | 1.01 | $ | 6.59 | $ | (0.20 | ) | $ | (1.46 | ) | $ | (8.68 | ) | |||
Income (loss) from discontinued operations |
(0.04 | ) | 0.73 | 0.21 | 0.15 | (0.35 | ) | |||||||||
| | | | | | | | | | | | | | | | | |
Net income (loss) |
$ | 0.97 | $ | 7.31 | $ | 0.02 | $ | (1.31 | ) | $ | (9.03 | ) | ||||
| | | | | | | | | | | | | | | | | |
| | | | | | | | | | | | | | | | | |
| | | | | | | | | | | | | | | | | |
Balance sheet data (end of period): |
||||||||||||||||
Cash and cash equivalents(2) |
$ | 75 | $ | 269 | $ | 85 | $ | 115 | $ | 141 | ||||||
Total assets |
5,707 | 6,016 | 5,977 | 6,227 | 7,224 | |||||||||||
Total debt(3) |
3,812 | 4,311 | 5,174 | 5,447 | 7,219 | |||||||||||
Total stockholders' equity (deficit) |
960 | 744 | (760 | ) | (764 | ) | (1,591 | ) | ||||||||
Other financial data (unaudited): |
||||||||||||||||
Working capital(4) |
$ | 1,004 | $ | 1,112 | $ | 1,163 | $ | 1,210 | $ | 1,120 | ||||||
Weighted average effective interest rate less deferred financing costs |
6.3 | % | 7.9 | % | 8.2 | % | 8.6 | % | 11.3 | % | ||||||
Adjusted EBITDA(5) |
921 | 876 | 769 | 656 | 552 | |||||||||||
Adjusted net income (loss)(5) |
532 | 351 | 177 | 10 | (204 | ) | ||||||||||
Capital expenditures |
81 | 86 | 119 | 131 | 115 | |||||||||||
Depreciation & amortization(6) |
95 | 108 | 178 | 198 | 274 | |||||||||||
Amortization of acquisition-related intangibles (other than software) |
14 | 15 | 80 | 110 | 201 | |||||||||||
Statement of cash flows data: |
||||||||||||||||
Cash flows provided by (used in) operating activities, net |
$ | 513 | $ | 422 | $ | 295 | $ | (367 | ) | $ | (681 | ) | ||||
Cash flows provided by (used in) investing activities, net |
(21 | ) | 726 | 84 | 820 | (800 | ) | |||||||||
Cash flows provided by (used in) financing activities, net |
(687 | ) | (962 | ) | (404 | ) | (474 | ) | 1,511 | |||||||
- (1)
- Weighted average shares and earnings per share are for Holdings. May not foot due to rounding.
43
- (2)
- Cash
and cash equivalents as of February 3, 2013 excludes $936 million of cash equivalents that were restricted for the redemption of debt.
- (3)
- Total
debt includes current and non-current installments of long-term debt, capital leases and associated discounts, premiums, and deferred financing costs. As of
February 3, 2013, debt includes $889 million of 2007 Senior Subordinated Notes that we committed to redeem and did redeem on February 8, 2013.
- (4)
- We
define working capital as current assets (including cash) minus current liabilities, which include the current portion of long-term debt and accrued interest
thereon.
- (5)
- Adjusted
EBITDA and Adjusted net income (loss) are not recognized terms under GAAP and do not purport to be alternatives to net income (loss) as measures of
operating performance. For additional detail, including a reconciliation from net income (loss), the most directly comparable financial measure under GAAP, to Adjusted EBITDA and Adjusted net income
(loss) for the periods presented, see "Part II, Item 7. Management's Discussion and Analysis of Financial Condition and Results of Operations—Key Business
Metrics—Adjusted EBITDA and Adjusted Net Income (Loss)."
- (6)
- Depreciation and amortization includes amounts recorded within Cost of sales in the Consolidated Statements of Operations.
44
Item 7. Management's Discussion and Analysis of Financial Condition and Results of Operations
Overview
This Management's Discussion and Analysis of Financial Condition and Results of Operations is combined for two registrants: HD Supply Holdings, Inc. and HD Supply, Inc. Unless the context indicates otherwise, any reference in this discussion and analysis to "Holdings" refers to HD Supply Holdings, Inc., any reference to "HDS" refers to HD Supply, Inc., the indirect wholly-owned subsidiary of Holdings, and any references to "HD Supply," the "Company," "we," "us" and "our" refer to Holdings together with its direct and indirect subsidiaries, including HDS.
HD Supply is one of the largest industrial distributors in North America. We believe we have leading positions in the three distinct market sectors in which we specialize: Maintenance, Repair & Operations; Infrastructure; and Specialty Construction. We serve these markets with an integrated go-to-market strategy. We operate through approximately 500 locations across 48 U.S. states and six Canadian provinces. We have approximately 14,000 associates delivering localized, customer-tailored products, services and expertise. We serve approximately 530,000 customers, which include contractors, maintenance professionals, home builders, industrial businesses, and government entities. Our broad range of end-to-end product lines and services include approximately 845,000 stock-keeping units ("SKUs") of quality, name-brand and proprietary-brand products as well as value-add services supporting the entire lifecycle of a project from infrastructure and construction to maintenance, repair and operations.
Description of segments
We operate our Company through three reportable segments: Facilities Maintenance, Waterworks, and Construction & Industrial.
Facilities Maintenance. Facilities Maintenance distributes MRO products, provides value-add services and fabricates custom products. The markets that Facilities Maintenance serves include multifamily, hospitality, healthcare and institutional facilities. Products include electrical and lighting items, plumbing, HVAC products, appliances, janitorial supplies, hardware, kitchen and bath cabinets, window coverings, textiles and guest amenities, healthcare maintenance and water and wastewater treatment products.
Waterworks. Waterworks distributes complete lines of water and wastewater transmission products, serving contractors and municipalities in the water and wastewater industries for residential and non-residential uses. Waterworks serves non-residential, residential, water systems, sewage systems and other markets. Products include pipes, fittings, valves, hydrants and meters for use in the construction, maintenance and repair of water and wastewater systems as well as fire-protection systems. Waterworks has complemented its core products through additional offerings, including smart meters (AMR/AMI), HDPE pipes and specific engineered treatment plant products and services.
Construction & Industrial. Construction & Industrial distributes specialized hardware, tools and engineered materials to non-residential and residential contractors. Products include tilt-up brace systems, forming and shoring systems, concrete chemicals, hand and power tools, cutting tools, rebar, ladders, safety and fall arrest equipment, specialty screws and fasteners, sealants and adhesives, drainage pipe, geo-synthetics, erosion and sediment control equipment and other engineered materials used broadly across all types of non-residential and residential construction. Construction & Industrial also includes Home Improvement Solutions which offers light remodeling and construction supplies, kitchen and bath cabinets, windows, plumbing materials, electrical equipment and other products, primarily to small remodeling contractors and trade professionals.
45
In addition to the reportable segments, our consolidated financial results include "Corporate." Corporate includes costs related to our centralized support functions, which are comprised of finance, information technology, human resources, legal, supply chain and other support services, and removes inter-segment transactions.
Beginning in the fourth quarter of fiscal 2016, we combined the Home Improvement Solutions business unit with the Construction & Industrial business unit. Prior to the sale of our Interior Solutions business unit (as discussed below), Interior Solutions was under common management with Home Improvement Solutions with both included in the Corporate segment. As a result of the sale, management elected to realign Home Improvement Solutions into the Construction & Industrial operating segment. The realignment benefits Home Improvement Solutions with the strong leadership, proven category management processes, and customer-centricity at Construction & Industrial. All periods presented have been revised to reflect the combined business unit.
Discontinued operations
In May 2016, the Company completed the sale of its Interior Solutions business. Including the final working capital settlement in September 2016, the Company received cash proceeds of approximately $26 million, net of $2 million of transaction costs. As a result of the sale, the Company recorded a $10 million pre-tax loss.
In October 2015, the Company completed the sale of its Power Solutions business. Including the final working capital settlement in May 2016, the Company received cash proceeds of approximately $812 million, net of $16 million of transaction costs. As a result of the sale, the Company recorded a $189 million pre-tax gain.
In January 2015, the Company completed the sale of substantially all of the assets of its Hardware Solutions business. The Company received cash proceeds of approximately $198 million, net of $2 million of transaction costs. As a result of the sale, the Company recorded an $8 million pre-tax gain in fiscal 2014.
In January 2014, the Company initiated the disposal of Litemor, a specialty lighting distributor. During fiscal 2014, the Company completed the disposal of Litemor through liquidation and branch sales, resulting in a pre-tax loss on disposal of $15 million, which includes cash and non-cash charges.
In accordance with Accounting Standards Codification ("ASC") 205-20, "Discontinued Operations," the results of the Interior Solutions, Power Solutions, Hardware Solutions, and Litemor, operations and the gain/loss on the sales and disposal of the businesses are classified as discontinued operations. The presentation of discontinued operations includes revenues and expenses of the discontinued operations and gain on the sales of the businesses, net of tax, as one line item on the Consolidated Statements of Operations and Comprehensive Income (Loss). All Consolidated Statements of Operations and Comprehensive Income (Loss) presented have been revised to reflect this presentation. For additional detail related to the results of operations of the discontinued operations, see "Note 2, Discontinued Operations," in the Notes to the Consolidated Financial Statements within Item 8. Financial Statements and Supplementary Data of this annual report on Form 10-K.
Seasonality
In a typical year, our operating results are impacted by seasonality. Historically, sales of our products have been higher in the second and third quarters of each fiscal year due to favorable weather and longer daylight conditions during these periods. Seasonal variations in operating results may also be significantly impacted by inclement weather conditions, such as cold or wet weather, which can delay construction projects.
46
Fiscal Year
Our fiscal year is a 52- or 53-week period ending on the Sunday nearest to January 31. Fiscal year ending January 29, 2017 ("fiscal 2016"), fiscal year ended January 31, 2016 ("fiscal 2015"), and fiscal year ended February 1, 2015 ("fiscal 2014") each included 52 weeks.
Key business metrics
Net sales
We earn our Net sales primarily from the sale of construction, infrastructure, maintenance and renovation and improvement related products and our provision of related services to approximately 530,000 customers, including contractors, government entities, maintenance professionals, home builders and industrial businesses. We recognize sales, net of sales tax and allowances for returns and discounts, when persuasive evidence of an agreement exists, delivery has occurred or services have been rendered, price to the buyer is fixed and determinable and collectability is reasonably assured. Net sales in certain business units, particularly Waterworks, fluctuate with the price of commodities as we seek to minimize the effects of changing commodities prices by passing such increases in the prices of certain commodity-based products to our customers.
We ship products to customers by internal fleet and third-party carriers. Net sales are recognized from product sales when title to the products is passed to the customer, which generally occurs at the point of destination for products shipped by internal fleet and at the point of shipping for products shipped by third-party carriers.
We include shipping and handling fees billed to customers in Net sales. Shipping and handling costs associated with inbound freight are capitalized to inventories and relieved through Cost of sales as inventories are sold. Shipping and handling costs associated with outbound freight are included in Selling, general and administrative expenses.
Gross profit
Gross profit primarily represents the difference between the product cost from our suppliers (net of earned rebates and discounts) including the cost of inbound freight and the sale price to our customers. The cost of outbound freight (including internal transfers), purchasing, receiving and warehousing are included in Selling, general and administrative expenses within operating expenses. Our Gross profits may not be comparable to those of other companies, as other companies may include all of the costs related to their distribution network in Cost of sales.
Operating expenses
Operating expenses are primarily comprised of selling, general and administrative costs, which include payroll expenses (salaries, wages, employee benefits, payroll taxes and bonuses), rent, insurance, utilities, repair and maintenance and professional fees. In addition, operating expenses include depreciation and amortization, and restructuring charges.
Adjusted EBITDA and Adjusted net income (loss)
Adjusted EBITDA and Adjusted net income (loss) are not recognized terms under generally accepted accounting principles in the United States of America ("GAAP") and do not purport to be alternatives to Net income (loss) as a measure of operating performance. We present Adjusted EBITDA and Adjusted net income (loss) because each is a primary measure used by management to evaluate operating performance. In addition, we present Adjusted net income to measure our overall profitability as we believe it is an important measure of our performance. We believe the presentation of Adjusted EBITDA and Adjusted net income (loss) enhances our investors' overall understanding of
47
the financial performance of our business. We believe Adjusted EBITDA and Adjusted net income (loss) are helpful in highlighting operating trends, because each excludes the results of decisions that are outside the control of operating management and that can differ significantly from company to company depending on long-term strategic decisions regarding capital structure, the tax jurisdictions in which companies operate, age and book depreciation of facilities and capital investments.
Adjusted EBITDA is based on "Consolidated EBITDA," a measure which is defined in HDS's Senior Credit Facilities and used in calculating financial ratios in several material debt covenants. Borrowings under these facilities are a key source of liquidity and our ability to borrow under these facilities depends upon, among other things, our compliance with such financial ratio covenants. In particular, both facilities contain restrictive covenants that can restrict our activities if we do not maintain financial ratios calculated based on Consolidated EBITDA. Our Senior ABL Facility requires us to maintain a minimum fixed charge coverage ratio of 1:1 if our specified excess availability (including an amount by which our borrowing base exceeds the outstanding amounts) under the Senior ABL Facility falls below the greater of $150 million and 10% of the aggregate commitments. Adjusted EBITDA is defined as Net income (loss) less Income from discontinued operations, net of tax, plus (i) Interest expense and Interest income, net, (ii) Provision (benefit) for income taxes, (iii) Depreciation and amortization and further adjusted to exclude loss on extinguishment of debt, non-cash items and certain other adjustments to Consolidated Net Income, including costs associated with capital structure enhancements, permitted in calculating Consolidated EBITDA under our Senior Credit Facilities. We believe that presenting Adjusted EBITDA is appropriate to provide additional information to investors about how the covenants in those agreements operate and about certain non-cash and other items. The Term Loan Facility and Senior ABL Facility permit us to make certain additional adjustments to Consolidated Net Income in calculating Consolidated EBITDA, such as projected net cost savings, which are not reflected in the Adjusted EBITDA data presented in this annual report on Form 10-K. We may in the future reflect such permitted adjustments in our calculations of Adjusted EBITDA. These covenants are important to the Company as failure to comply with certain covenants would result in a default under our Senior Credit Facilities. The material covenants in our Senior Credit Facilities are discussed in "Item 7. Management's Discussion and Analysis of Financial Condition and Results of Operations—Liquidity, capital resources and financial condition—External Financing."
Adjusted net income (loss) is defined as Net income (loss) less Income from discontinued operations, net of tax, further adjusted for loss on extinguishment of debt and certain non-cash, non-recurring, non-operational, or unusual items, net of tax.
We believe that Adjusted EBITDA and Adjusted net income (loss) are frequently used by securities analysts, investors and other interested parties in their evaluation of companies, many of which present an Adjusted EBITDA or Adjusted net income (loss) measure when reporting their results. We compensate for the limitations of using non-GAAP financial measures by using them to supplement GAAP results to provide a more complete understanding of the factors and trends affecting the business than GAAP results alone. Because not all companies use identical calculations, our presentation of Adjusted EBITDA and Adjusted net income (loss) may not be comparable to other similarly titled measures of other companies.
Adjusted EBITDA and Adjusted net income (loss) have limitations as analytical tools and should not be considered in isolation or as substitutes for analyzing our results as reported under GAAP. Some of these limitations are:
- •
- Adjusted EBITDA and Adjusted net income (loss) do not reflect changes in, or cash requirements for, our working capital needs;
- •
- Adjusted EBITDA does not reflect our interest expense, or the requirements necessary to service interest or principal payments on our debt;
48
- •
- Adjusted EBITDA does not reflect our income tax expenses or the cash requirements to pay our taxes;
- •
- Adjusted EBITDA and Adjusted net income (loss) do not reflect historical cash expenditures or future requirements for capital expenditures or
contractual commitments; and
- •
- although depreciation and amortization charges are non-cash charges, the assets being depreciated and amortized will often have to be replaced in the future, and Adjusted EBITDA does not reflect any cash requirements for such replacements.
The following table presents a reconciliation of Net income (loss) and Income from continuing operations, the most directly comparable financial measures under GAAP, to Adjusted EBITDA for the periods presented (amounts in millions):
| |
Fiscal Year Ended | |||||||||||||||
|---|---|---|---|---|---|---|---|---|---|---|---|---|---|---|---|---|
| |
January 29, 2017 |
January 31, 2016 |
February 1, 2015 |
February 2, 2014 |
February 3, 2013 |
|||||||||||
Net income (loss) |
$ | 196 | $ | 1,472 | $ | 3 | $ | (218 | ) | $ | (1,179 | ) | ||||
Less income (loss) from discontinued operations, net of tax |
(8 | ) | 146 | 41 | 25 | (46 | ) | |||||||||
| | | | | | | | | | | | | | | | | |
Income (loss) from continuing operations |
204 | 1,326 | (38 | ) | (243 | ) | (1,133 | ) | ||||||||
| | | | | | | | | | | | | | | | | |
Interest expense, net |
269 | 394 | 462 | 528 | 658 | |||||||||||
Provision (benefit) for income taxes(i) |
139 | (1,084 | ) | 36 | 38 | 20 | ||||||||||
Depreciation and amortization(ii) |
101 | 113 | 182 | 202 | 277 | |||||||||||
Loss on extinguishment & modification of debt(iii) |
179 | 100 | 108 | 87 | 709 | |||||||||||
Restructuring charges(iv) |
9 | 9 | 6 | 6 | — | |||||||||||
Stock-based compensation |
20 | 16 | 17 | 16 | 16 | |||||||||||
Management fee & related expenses paid to Equity Sponsors(v) |
— | — | — | 2 | 5 | |||||||||||
Costs related to public offerings(vi) |
— | 1 | 2 | 20 | — | |||||||||||
Other |
— | 1 | (6 | ) | — | — | ||||||||||
| | | | | | | | | | | | | | | | | |
Adjusted EBITDA |
$ | 921 | $ | 876 | $ | 769 | $ | 656 | $ | 552 | ||||||
| | | | | | | | | | | | | | | | | |
| | | | | | | | | | | | | | | | | |
| | | | | | | | | | | | | | | | | |
- (i)
- During
the fiscal year ended January 31, 2016, the Company recorded a $1,007 million tax benefit for the reversal of substantially all of the valuation
allowance on its U.S. net deferred tax assets and a $189 million tax benefit for the reduction in unrecognized tax benefits as a result of IRS and state audit settlements.
- (ii)
- Depreciation
and amortization includes amounts recorded within Cost of sales in the Consolidated Statements of Operations.
- (iii)
- Represents
the loss on extinguishment of debt including the premium paid to repurchase or call the debt as well as the write-off of unamortized deferred financing
costs, original issue discount, and other assets or liabilities associated with such debt. Also includes the costs of debt modification.
- (iv)
- Represents
the costs incurred for strategic alignment of workforce and branch closures or consolidations. These costs include occupancy costs, severance, relocation
costs, and other costs incurred to exit a location.
- (v)
- The Company entered into consulting agreements with the Company's former owners (the "Equity Sponsors") whereby the Company paid the Equity Sponsors a $5 million annual aggregate management fee and related expenses. These consulting agreements were terminated in conjunction with Holdings' initial public offering in the second quarter of fiscal 2013.
49
- (vi)
- Represents the costs expensed in connection with the Company's public offerings. All of the shares of common stock sold in fiscal 2015 and fiscal 2014 public offerings were sold by certain of the Company's stockholders. The Company did not receive any proceeds from the sale of such shares. Amount in fiscal 2013 represents the costs expensed in connection with the Company's initial public offering, including approximately $18 million paid to the Equity Sponsors in the second quarter of fiscal 2013 for termination of the consulting agreements.
The following table presents a reconciliation of Net income (loss) and Income from continuing operations, the most directly comparable financial measures under GAAP, to Adjusted net income (loss) for the periods presented (amounts in millions):
| |
Fiscal Year Ended | |||||||||||||||
|---|---|---|---|---|---|---|---|---|---|---|---|---|---|---|---|---|
| |
January 29, 2017 |
January 31, 2016 |
February 1, 2015 |
February 2, 2014 |
February 3, 2013 |
|||||||||||
Net income (loss) |
$ | 196 | $ | 1,472 | $ | 3 | $ | (218 | ) | $ | (1,179 | ) | ||||
Less income (loss) from discontinued operations, net of tax |
(8 | ) | 146 | 41 | 25 | (46 | ) | |||||||||
| | | | | | | | | | | | | | | | | |
Income (loss) from continuing operations |
204 | 1,326 | (38 | ) | (243 | ) | (1,133 | ) | ||||||||
| | | | | | | | | | | | | | | | | |
Plus: Provision (benefit) for income taxes(i) |
139 | (1,084 | ) | 36 | 38 | 20 | ||||||||||
Less: Cash income taxes(ii) |
(13 | ) | (16 | ) | (12 | ) | (8 | ) | (1 | ) | ||||||
Plus: Amortization of acquisition-related intangible assets (other than software) |
14 | 15 | 80 | 110 | 201 | |||||||||||
Plus: Loss on extinguishment & modification of debt(iii) |
179 | 100 | 108 | 87 | 709 | |||||||||||
Restructuring charges(iv) |
9 | 9 | 6 | 6 | — | |||||||||||
Costs related to public offering(v) |
— | 1 | 2 | 20 | — | |||||||||||
Other |
— | — | (5 | ) | — | — | ||||||||||
| | | | | | | | | | | | | | | | | |
Adjusted Net Income (Loss) |
$ | 532 | $ | 351 | $ | 177 | $ | 10 | $ | (204 | ) | |||||
| | | | | | | | | | | | | | | | | |
| | | | | | | | | | | | | | | | | |
| | | | | | | | | | | | | | | | | |
- (i)
- During
the fiscal year ended January 31, 2016, the Company recorded a $1,007 million tax benefit for the reversal of substantially all of the valuation
allowance on its U.S. net deferred tax assets and a $189 million tax benefit for the reduction in unrecognized tax benefits as a result of IRS and state audit settlements.
- (ii)
- Cash
paid for income taxes in fiscal 2014 excludes a $27 million payment for the settlement of the IRS's audit of the Company's U.S. federal income tax
returns filed for the tax years ended on February 3, 2008 and February 1, 2009.
- (iii)
- Represents
the loss on extinguishment of debt including the premium paid to repurchase or call the debt as well as the write-off of unamortized deferred financing
costs, original issue discount, and other assets or liabilities associated with such debt. Also includes the costs of debt modifications.
- (iv)
- Represents
the costs incurred for strategic alignment of workforce and branch closures or consolidations. These costs include occupancy costs, severance, relocation
costs, and other costs incurred to exit a location.
- (v)
- Represents the costs expensed in connection with the Company's public offerings. All of the shares of common stock sold in fiscal 2015 and fiscal 2014 public offerings were sold by certain of the Company's stockholders. The Company did not receive any proceeds from the sale of such shares. Amount in fiscal 2013 represents the costs expensed in connection with the Company's initial public offering, including approximately $18 million paid to the Equity Sponsors in the second quarter of fiscal 2013 for termination of the consulting agreements.
50
Consolidated results of operations
| |
|
|
|
Percentage Increase (Decrease) |
||||||||||||
|---|---|---|---|---|---|---|---|---|---|---|---|---|---|---|---|---|
| |
Fiscal Year | |||||||||||||||
| |
2016 vs. 2015 |
2015 vs. 2014 |
||||||||||||||
| Dollars in millions |
2016 | 2015 | 2014 | |||||||||||||
Net sales |
$ | 7,439 | $ | 7,123 | $ | 6,682 | 4.4 | 6.6 | ||||||||
Gross profit |
2,532 | 2,389 | 2,195 | 6.0 | 8.8 | |||||||||||
Operating expenses: |
||||||||||||||||
Selling, general & administrative |
1,637 | 1,535 | 1,446 | 6.6 | 6.2 | |||||||||||
Depreciation & amortization |
95 | 108 | 178 | (12.0 | ) | (39.3 | ) | |||||||||
Restructuring |
9 | 9 | 6 | — | 50.0 | |||||||||||
| | | | | | | | | | | | | | | | | |
Total operating expenses |
1,741 | 1,652 | 1,630 | 5.4 | 1.3 | |||||||||||
Operating income |
791 | 737 | 565 | 7.3 | 30.4 | |||||||||||
Interest expense |
269 | 394 | 462 | (31.7 | ) | (14.7 | ) | |||||||||
Loss on extinguishment & modification of debt |
179 | 100 | 108 | 79.0 | (7.4 | ) | ||||||||||
Other (income) expense, net |
— | 1 | (3 | ) | * | * | ||||||||||
| | | | | | | | | | | | | | | | | |
Income (loss) from continuing operations before provision (benefit) for income taxes |
343 | 242 | (2 | ) | 41.7 | * | ||||||||||
Provision (benefit) for income taxes |
139 | (1,084 | ) | 36 | * | * | ||||||||||
| | | | | | | | | | | | | | | | | |
Income (loss) from continuing operations |
204 | 1,326 | (38 | ) | (84.6 | ) | * | |||||||||
Income (loss) from discontinued operations, net of tax |
(8 | ) | 146 | 41 | * | * | ||||||||||
| | | | | | | | | | | | | | | | | |
Net Income |
$ | 196 | $ | 1,472 | $ | 3 | (86.7 | ) | * | |||||||
| | | | | | | | | | | | | | | | | |
| | | | | | | | | | | | | | | | | |
| | | | | | | | | | | | | | | | | |
Non-GAAP Financial Data: |
||||||||||||||||
Adjusted EBITDA |
$ | 921 | $ | 876 | $ | 769 | 5.1 | 13.9 | ||||||||
Adjusted net income |
$ | 532 | $ | 351 | $ | 177 | 51.6 | 98.3 | ||||||||
- *
- not meaningful
| |
% of Net sales | Basis Point Increase (Decrease) |
||||||||||||||
|---|---|---|---|---|---|---|---|---|---|---|---|---|---|---|---|---|
| |
Fiscal Year | |||||||||||||||
| |
2016 vs. 2015 |
2015 vs. 2014 |
||||||||||||||
| |
2016 | 2015 | 2014 | |||||||||||||
Net sales |
100.0 | % | 100.0 | % | 100.0 | % | — | — | ||||||||
Gross profit |
34.0 | 33.5 | 32.8 | 50 | 70 | |||||||||||
Operating expenses: |
||||||||||||||||
Selling, general & administrative |
22.0 | 21.5 | 21.6 | 50 | (10 | ) | ||||||||||
Depreciation & amortization |
1.3 | 1.5 | 2.6 | (20 | ) | (110 | ) | |||||||||
Restructuring |
0.1 | 0.2 | 0.1 | (10 | ) | 10 | ||||||||||
| | | | | | | | | | | | | | | | | |
Total operating expenses |
23.4 | 23.2 | 24.3 | 20 | (110 | ) | ||||||||||
Operating income |
10.6 | 10.3 | 8.5 | 30 | 180 | |||||||||||
Interest expense |
3.6 | 5.5 | 6.9 | (190 | ) | (140 | ) | |||||||||
Loss on extinguishment & modification of debt |
2.4 | 1.4 | 1.6 | 100 | (20 | ) | ||||||||||
Other (income) expense, net |
— | — | — | — | — | |||||||||||
| | | | | | | | | | | | | | | | | |
Income (loss) from continuing operations before provision (benefit) for income taxes |
4.6 | 3.4 | — | 120 | 340 | |||||||||||
Provision (benefit) for income taxes |
1.9 | (15.2 | ) | 0.6 | * | * | ||||||||||
| | | | | | | | | | | | | | | | | |
Income (loss) from continuing operations |
2.7 | 18.6 | (0.6 | ) | * | * | ||||||||||
Income (loss) from discontinued operations, net of tax |
(0.1 | ) | 2.1 | 0.6 | (220 | ) | 150 | |||||||||
| | | | | | | | | | | | | | | | | |
Net Income |
2.6 | 20.7 | — | * | * | |||||||||||
| | | | | | | | | | | | | | | | | |
| | | | | | | | | | | | | | | | | |
| | | | | | | | | | | | | | | | | |
Non-GAAP Financial Data: |
||||||||||||||||
Adjusted EBITDA |
12.4 | 12.3 | 11.5 | 10 | 80 | |||||||||||
Adjusted net income |
7.2 | 4.9 | 2.6 | 230 | 230 | |||||||||||
- *
- Not meaningful
51
Fiscal 2016 compared to fiscal 2015
Highlights
Net sales in fiscal 2016 increased $316 million, or 4.4%, compared to fiscal 2015. Each of our three reportable segments realized increases in Net sales. Operating income in fiscal 2016 increased $54 million, or 7.3% to $791 million during fiscal 2016 as compared to fiscal 2015. Net income in fiscal 2016 decreased $1,276 million, or 86.7%, to $196 million as compared to fiscal 2015. Fiscal 2015 Net income included a $1,007 million tax benefit for the reversal of substantially all of the Company's valuation allowance on its U.S. net deferred tax assets and a $189 million tax benefit for the reduction in unrecognized tax benefits as a results of IRS and state audit settlements. Adjusted EBITDA in fiscal 2016 increased $45 million, or 5.1%, as compared to fiscal 2015. Adjusted net income in fiscal 2016 increased $181 million, or 51.6%, as compared to fiscal 2015 as a result of the improvement in operating income and decline in interest expense. As of January 29, 2017, our liquidity was $729 million. See "Liquidity, capital resources and financial condition" for further information.
In May 2016, the Company completed the sale of its Interior Solutions business, a provider of turnkey supply and installation services for multiple interior finish options. Including the final working capital settlement in September 2016, the Company received cash proceeds of approximately $26 million, net of $2 million of transaction costs. As a result of the sale, the Company recorded a $10 million pre-tax loss, reflected in Income from discontinued operations, net of tax, in the Consolidated Statement of Operations.
For additional information, see "Note 2, Discontinued Operations," in the Notes to the Consolidated Financial Statements within Part II, Item 8 of this annual report on Form 10-K.
As a result of the sale of the Power Solutions business unit in October 2015, management evaluated our talent alignment and functional support strategies. Consequently, during fiscal 2015, we initiated a restructuring plan to strategically align our leadership and functional support teams. During fiscal 2015, we incurred $9 million of restructuring charges under this plan. During fiscal 2016, we accelerated and expanded the restructuring plan, incurring $20 million of restructuring charges, offset by a net gain of approximately $11 million related to real estate transactions under the plan. In total the Company incurred net restructuring charges of $18 million and expects the plan to deliver a payback of approximately two years via a reduction in costs. The Company completed the activities under the plan in fiscal 2016 and does not expect to incur additional charges. For additional information, see "Note 11, Restructuring Activities," in the Notes to Consolidated Financial Statements within Part II, Item 8 of this annual report on Form 10-K.
Net sales
Net sales increased $316 million, or 4.4% to $7,439 million during fiscal 2016 as compared to fiscal 2015.
Each of our reportable segments reported an increase in Net sales during fiscal 2016 as compared to fiscal 2015. The Net sales increases were primarily due to growth initiatives at each of our businesses and increases in market volume. Growth initiatives contributed approximately $148 million in fiscal 2016. The Net sales increase was partially offset by an unfavorable Canadian exchange rate impact, resulting in a $2 million reduction to Net sales in fiscal 2016.
Gross profit
Gross profit increased $143 million, or 6.0%, to $2,532 million during fiscal 2016 as compared to fiscal 2015.
52
Each of our reportable segments experienced an increase in Gross profit in fiscal 2016 as compared to fiscal 2015. The increase in Gross profit is primarily due to sales growth from initiatives and increased market volume.
Gross profit as a percentage of Net sales ("gross margin") increased approximately 50 basis points to 34.0% in fiscal 2016 as compared to 33.5% in fiscal 2015. The improvement in gross margin was primarily driven by our category management initiatives and mix of products and services, partially offset by the competitive environment.
Operating expenses
Operating expenses increased $89 million, or 5.4%, to $1,741 million during fiscal 2016 as compared to fiscal 2015.
Selling, general and administrative expenses increased $102 million, or 6.6%, to $1,637 million during fiscal 2016 as compared to fiscal 2015. The increase was primarily a result of increases in variable expenses due to higher sales volume, increased investments in growth initiatives, primarily additional personnel, increased healthcare costs, and supply chain investments at Facilities Maintenance. Depreciation and amortization expense decreased $13 million, or 12.0%, to $95 million in fiscal 2016 as compared to fiscal 2015 as certain acquisition-related intangible assets became fully amortized during fiscal 2016 and due to timing of in-service projects. Restructuring charges were flat in fiscal 2016 as compared to fiscal 2015, as the Company completed restructuring activities to strategically align its workforce, initiated during the fourth quarter of fiscal 2015 in conjunction with the sale of Power Solutions.
Operating expenses as a percentage of Net sales increased approximately 20 basis points to 23.4%, in fiscal 2016 as compared to fiscal 2015. Selling, general and administrative expenses as a percentage of Net sales, increased approximately 50 basis points to 22.0% in fiscal 2016 as compared to fiscal 2015. The increase was primarily a result of the increased investments in growth initiatives, increased healthcare costs, and supply chain corrective action at Facilities Maintenance, partially offset by the decline in depreciation and amortization expense.
Operating income
Operating income increased $54 million, or 7.3%, to $791 million during fiscal 2016 as compared to fiscal 2015, primarily due to higher Net sales and Gross profit partially offset by higher operating expenses.
Operating income as a percentage of Net sales increased approximately 30 basis points in fiscal 2016 as compared to fiscal 2015. The improvement was driven by improvements in gross margins offset by the increase in Selling, general and administrative expenses.
Interest expense
Interest expense decreased $125 million, or 31.7%, during fiscal 2016 as compared to fiscal 2015. The decrease was due to a lower average interest rate on our outstanding indebtedness due to debt refinancing transactions in fiscal 2016 and fiscal 2015, and a lower average outstanding balance as we continue to use cash flow from operations and proceeds from the sale of businesses to reduce indebtedness.
Loss on extinguishment & modification of debt
During fiscal 2016, our debt refinancing and redemption activities resulted in charges of $179 million recorded in accordance with ASC 470-50, "Debt-Modifications and Extinguishments."
53
On January 26, 2017, HDS paid $200 million to reduce its aggregate principal of approximately $842 million tranche of Term Loans (the "Term B-1 Loans"), incurring a $5 million loss on extinguishment on debt, which included write-offs of $2 million and $3 million of unamortized original issue discount and unamortized deferred financing costs, respectively.
On October 17, 2016, HDS redeemed all of the outstanding $1,275 million aggregate principal of the 7.5% Senior Unsecured Notes due 2020 (the "February 2013 Senior Unsecured Notes"), incurring a $59 million loss on extinguishment of debt, which included a $48 million premium payment and a write-off of $11 million of unamortized deferred financing costs. HDS incurred an immaterial loss on the modification of the Term B-1 Loans as a result of this transaction.
On April 27, 2016, HDS redeemed all of the outstanding $1,000 million aggregate principal of its 11.5% Senior Unsecured Notes due 2020 (the "October 2012 Senior Unsecured Notes"), incurring a $115 million loss on extinguishment of debt, which included a $106 million make-whole premium payment and a write-off of $9 million of unamortized deferred financing costs.
During fiscal 2015, our debt refinancing and redemption activities resulted in charges of $100 million recorded in accordance with ASC 470-50, "Debt-Modifications and Extinguishments."
On October 13, 2015, HDS redeemed all of the outstanding $675 million aggregate principal of its 11% Senior Secured Second Priority Notes due 2020 (the "April 2012 Second Priority Notes"), incurring an $80 million loss on extinguishment of debt, which included a $72 million make-whole premium payment and a write-off of $8 million of unamortized deferred financing costs.
On August 13, 2015, HDS amended its Term Loan Facility to reduce the applicable margin for borrowing by 25 basis points, with the London Interbank Offered Rate ("LIBOR") floor to remain at 1.00%. The amendment also extended the maturity of the Term Loans by approximately three years to August 13, 2021. As a result of the amendment, the Company recorded a $20 million loss on extinguishment and modification of debt, which included a $15 million write-off of pro-rata portions of the unamortized original issue discount and the unamortized deferred financing costs for the portion of the amendment considered an extinguishment in accordance with GAAP. See "Liquidity, capital resources and financial condition—External financing" for further information.
Provision (benefit) for income taxes
The provision for income taxes from continuing operations in fiscal 2016 was an expense of $139 million compared to a benefit of $1,084 million in fiscal 2015. The effective rate for continuing operations for fiscal 2016 was an expense of 40.5% which was primarily impacted by the geographical mix of where income was generated. The provision for income taxes from continuing operations for fiscal 2015 was a benefit of $1,007 million related to a release of substantially all of the valuation allowance on the Company's U.S. net deferred tax assets, as discussed further below. All of the income tax benefit generated by the release of the valuation allowance was recorded to continuing operations since the valuation allowance decrease was from our change in the assessment that the beginning-of-year deferred tax assets would be realized. The benefit from releasing the valuation allowance was partially offset by the utilization of $104 million of such deferred assets to offset current year income. The effective rate was further impacted by a decrease of $189 million in the Company's unrecognized U.S. federal and state tax benefits related to the February 19, 2015 approval and finalization of the Tentative Settlement (as defined in "Note 12, Commitment and Contingencies," in the Notes to the Consolidated Financial Statements within Part II, Item 8 of this annual report on Form 10-K) by the Joint Committee of Taxation.
At January 31, 2016, our U.S. operations were in a position of cumulative pre-tax income for the most recent three-year period. We concluded that as a consequence of our three-year cumulative pre-tax income, generating taxable income in fiscal 2014 and 2015, our long net operating loss
54
carryforward periods, a significant reduction in our recent interest expense, a projected further reduction in our future interest expense, and our business plan for fiscal 2016 and beyond showing continued profitability, that it is more likely than not that a significant portion of our U.S. deferred tax assets will be realized. Accordingly, in the fourth quarter of 2015, we released substantially all of our valuation allowance on our net U.S. deferred tax assets, resulting in a $1,007 million benefit in our provision for income taxes. The benefit from releasing the valuation allowance was partially offset by the utilization of $104 million of such deferred assets to offset current year income. As of the end of fiscal 2016, the minimum amount of future taxable income that needs to be generated to realize the deferred tax assets is approximately $1,957 million for U.S. Federal tax purposes and $2,944 million for U.S. State tax purposes. The current level of pre-tax earnings for financial reporting purposes is sufficient to generate the minimum amount of future taxable income to realize our U.S. Federal and State tax deferred assets prior to their expiration. At January 31, 2016, after the release of the valuation allowance, the Company's remaining valuation allowance on its U.S. deferred tax assets was approximately $6 million.
As of January 29, 2017, we have more than $723 million of tax-effected Federal and State NOL carryforwards that can be used to offset cash income taxes due on future earnings.
Adjusted EBITDA
Adjusted EBITDA increased $45 million, or 5.1%, in fiscal 2016 as compared to fiscal 2015. Waterworks and Construction & Industrial both experienced an increase in Adjusted EBITDA in fiscal 2016 as compared to fiscal 2015. Facilities Maintenance experienced a decrease in Adjusted EBITDA in fiscal 2016 as compared to fiscal 2015.
Adjusted EBITDA as a percentage of Net sales increased approximately 10 basis points to 12.4% in fiscal 2016 as compared to fiscal 2015, primarily due to the increase in Gross margin partially offset by an increase in Selling, general and administrative expenses as a percentage of Net sales.
Adjusted net income
Adjusted net income increased $181 million, to $532 million, in fiscal 2016 as compared to fiscal 2015. The increase in Adjusted net income was attributable to sales growth, improving gross margins, and lower interest expense.
Fiscal 2015 compared to fiscal 2014
Highlights
Net sales in fiscal 2015 increased $441 million, or 6.6%, compared to fiscal 2014. Each of our three reportable segments realized increases in Net sales. Operating income in fiscal 2015 increased $172 million, or 30.4% to $737 million during fiscal 2015 as compared to fiscal 2014. Net income in fiscal 2015 was $1,472 million, as compared to $3 million in fiscal 2014. Fiscal 2015 Net income included a $1,007 million tax benefit for the reversal of substantially all of the Company's valuation allowance on its U.S. net deferred tax assets and a $189 million tax benefit for the reduction in unrecognized tax benefits as a result of IRS and state audit settlements. Our growth initiatives, cost control efforts and the leverage of fixed costs, resulted in an increase to Adjusted EBITDA of $107 million, or 13.9%, in fiscal 2015 as compared to fiscal 2014. Adjusted net income in fiscal 2015 increased $174 million to $351 million, as compared to $177 million in fiscal 2014. As of January 31, 2016, our liquidity was $1.3 billion.
In October 2015, we completed the sale of our Power Solutions business. We received cash proceeds of approximately $809 million, net of $15 million of transaction costs. As a result of the sale, we recorded a $186 million pre-tax gain, reflected in Income from discontinued operations, net of tax,
55
in the Consolidated Statement of Operations. See "Note 2, Discontinued Operations," in the Notes to the Consolidated Financial Statements within Part II, Item 8 of this annual report on Form 10-K.
As a result of the sale of the Power Solutions business unit, management evaluated our talent alignment and functional support strategies. Consequently, during fiscal 2015 we initiated a restructuring plan to strategically align our leadership and functional support teams, recording a restructuring charge of $9 million, primarily for severance, relocation, and related costs at Facilities Maintenance and Waterworks. For additional information, see "Note 11, Restructuring Activities," in the Notes to the Consolidated Financial Statements within Part II, Item 8 of this annual report on Form 10-K.
Net sales
Net sales increased $441 million, or 6.6%, to $7,123 million during fiscal 2015 as compared to fiscal 2014.
Each of our reportable segments reported an increase in Net sales during fiscal 2015 as compared to fiscal 2014. The Net sales increases were primarily due to growth initiatives at each of our businesses and, to a lesser extent, increases in market volume. Growth initiatives contributed approximately $276 million in fiscal 2015. The Net sales increase was partially offset by an unfavorable Canadian exchange rate impact, resulting in a $19 million reduction to Net sales in fiscal 2015.
Gross profit
Gross profit increased $194 million, or 8.8%, to $2,389 million during fiscal 2015 as compared to fiscal 2014.
Each of our reportable segments experienced an increase in Gross profit in fiscal 2015 as compared to fiscal 2014. The increase in Gross profit is primarily due to sales growth from initiatives and market volume.
Gross profit as a percentage of Net sales ("gross margin") increased approximately 70 basis points to 33.5% in fiscal 2015 as compared to 32.8% in fiscal 2014. The improvement in gross margin was primarily driven by our category management initiatives and mix of products and services, partially offset by the competitive environment.
Operating expenses
Operating expenses increased $22 million, or 1.3%, to $1,652 million during fiscal 2015 as compared to fiscal 2014.
Selling, general and administrative expenses increased $89 million, or 6.2%, to $1,535 million during fiscal 2015 as compared to fiscal 2014. The increase was primarily a result of increases in variable expenses due to higher sales volume and investments in growth initiatives. Depreciation and amortization expense decreased $70 million, or 39.3%, to $108 million in fiscal 2015 as compared to fiscal 2014 as certain acquisition-related intangible assets became fully amortized during fiscal 2014. Restructuring charges increased $3 million, to $9 million during fiscal 2015 as compared to fiscal 2014, as the Company initiated restructuring activities to strategically align its workforce during fiscal 2015 in conjunction with the sale of Power Solutions.
Operating expenses as a percentage of Net sales decreased approximately 110 basis points to 23.2%, in fiscal 2015 as compared to fiscal 2014. The decrease was driven by a reduction in Depreciation and amortization expense as a percentage of Net sales, which decreased approximately 110 basis points to 1.5%.
56
Operating income
Operating income increased $172 million, or 30.4% to $737 million during fiscal 2015 as compared to fiscal 2014, primarily due to higher Net sales and Gross profit partially offset by higher operating expenses.
Operating income as a percentage of Net sales increased approximately 180 basis points in fiscal 2015 as compared to fiscal 2014. The improvement was driven by a reduction in operating expenses as a percentage of Net sales and improvements in gross margins.
Interest expense
Interest expense decreased $68 million, or 14.7%, during fiscal 2015 as compared to fiscal 2014. The decrease in fiscal 2015 was due to a lower average interest rate on our outstanding indebtedness and a lower average outstanding balance due to the redemption of debt in fiscal 2015.
Loss on extinguishment & modification of debt
During fiscal 2015, our debt refinancing and redemption activities resulted in charges of $100 million recorded in accordance with ASC 470-50, "Debt-Modifications and Extinguishments."
In the third quarter of fiscal 2015, HDS redeemed all of the outstanding $675 million aggregate principal of its April 2012 Second Priority Notes, incurring an $80 million loss on extinguishment of debt, which includes a $72 million make-whole premium payment and a write-off of $8 million of unamortized deferred financing costs.
Also in the third quarter of fiscal 2015, HDS amended its Term Loan Facility to reduce the applicable margin for borrowings by 25 basis points, with the LIBOR floor to remain at 1.00%. The amendment also extended the maturity of the Term Loans by approximately three years, to August 13, 2021
As a result of the amendment, the Company recorded a $20 million loss on extinguishment and modification of debt, which included a $15 million write-off of pro-rata portions of the unamortized original issue discount and the unamortized deferred financing costs for the portion of the amendment considered an extinguishment in accordance with GAAP.
During fiscal 2014, our debt refinancing and redemption activities resulted in charges of $108 million recorded in accordance with ASC 470-50, "Debt-Modifications and Extinguishments."
In the fourth quarter of fiscal 2014, HDS redeemed all of the outstanding $1,250 million aggregate principal amount of its 2012 First Priority Notes. As a result, in the fourth quarter of fiscal 2014 HDS incurred a $106 million loss on extinguishment of debt, which includes a $106 million make-whole premium payment to redeem the 2012 First Priority Notes and the write-off of $15 million of unamortized deferred financing costs, offset by the write-off of $15 million of unamortized premium on the 2012 First Priority Notes.
In the first quarter of fiscal 2014, HDS amended its Term Loan Facility to reduce the applicable margin for borrowings by 25 basis points and reduce the LIBOR floor from 1.25% to 1.00%. The amendment also added a new soft call provision applicable to optional prepayment of the Term Loans and extended the maturity of the Term Loans by approximately nine months, to June 28, 2018. A portion of the amendment was considered an extinguishment, resulting in a $1 million loss on extinguishment of debt for the write-off of pro-rata portions of the unamortized original issue discount and the unamortized deferred financing costs. The portion of the amendment considered a modification resulted in a charge of approximately $1 million. See "Liquidity, capital resources and financial condition—External financing" for further information.
57
Other (income) expense, net
During fiscal 2015, in connection with secondary public offerings by certain of Holdings' stockholders, we incurred approximately $1 million in related fees and expenses. During fiscal 2014, in connection with secondary public offerings by certain of Holdings' stockholders, we incurred approximately $2 million in related fees and expenses.
Provision (benefit) for income taxes
The provision for income taxes from continuing operations in fiscal 2015 was a benefit of $1,084 million compared to an expense of $36 million in fiscal 2014. The effective rate for continuing operations for fiscal 2015 was a benefit of 447.9% which was primarily due to a tax benefit of $1,007 million related to a release of substantially all of the valuation allowance on the Company's U.S. net deferred tax assets, as discussed further below. All of the income tax benefit generated by the release of the valuation allowance was recorded to continuing operations since the valuation allowance decrease was from our change in the assessment that the beginning-of-year deferred tax assets would be realized. The benefit from releasing the valuation allowance was partially offset by the utilization of $104 million of such deferred assets to offset fiscal 2015 income. The effective rate was further impacted by a decrease of $189 million in the Company's unrecognized U.S. federal and state tax benefits related to the February 19, 2015 approval and finalization of the Tentative Settlement (as defined in "Note 12, Commitment and Contingencies," in the Notes to the Consolidated Financial Statements within Part II, Item 8 of this annual report on Form 10-K) by the Joint Committee of Taxation.
The provision for income taxes from continuing operations in fiscal 2014 was an expense of $36 million. Since pre-tax income was minimal, the effective rate for continuing operations for fiscal 2014 was not meaningful. The tax expense on continuing operations reflects an increase in the valuation allowance, which was partially offset by the utilization of deferred tax assets which had previously been subject to a valuation allowance, the increasing of the deferred tax liability for U.S. goodwill amortization for tax purposes, and the accrual of income taxes for foreign and certain state jurisdictions. The U.S. valuation allowance for fiscal 2014 includes an increase of $28 million related to deferred tax liabilities generated by indefinite life intangibles. The deferred tax liability associated with indefinite life intangibles is not available as a source of taxable income to support the realization of deferred tax assets created by other deductible temporary timing differences.
At February 1, 2015, the valuation allowance on our U.S. deferred tax assets was approximately $1,013 million. Since fiscal 2010, we have maintained a full valuation allowance on our U.S. net deferred tax asset position. In each reporting period we have assessed the available positive and negative evidence to estimate if sufficient future taxable income would be generated to utilize the existing deferred tax assets. Through fiscal 2014, our history of U.S. operating losses limited the weight we applied to other subjective evidence such as our projections for future profitability.
In the fourth quarter of 2015, we released substantially all of our valuation allowance on our net U.S. deferred tax assets, resulting in a $1,007 million benefit in our provision for income taxes. The benefit from releasing the valuation allowance was partially offset by the utilization of $104 million of such deferred assets to offset fiscal 2015 income.
Adjusted EBITDA
Adjusted EBITDA increased $107 million, or 13.9%, in fiscal 2015 as compared to fiscal 2014. Each of our reportable segments experienced an increase in Adjusted EBITDA in fiscal 2015 as compared to fiscal 2014.
58
The increase in Adjusted EBITDA in fiscal 2015 was primarily due to the increases in Net sales and Gross profit. Adjusted EBITDA as a percentage of Net sales increased approximately 80 basis points to 12.3% in fiscal 2015 as compared to fiscal 2014, primarily due to gross margin improvements and, to a lesser extent, a reduction in Selling, general and administrative expenses as a percentage of Net sales.
Adjusted net income
Adjusted net income increased $174 million, to $351 million, in fiscal 2015 as compared to fiscal 2014. The increase in Adjusted net income was attributable to sales growth, improving gross margins, and lower interest expense.
Results of operations by reportable segment
Facilities Maintenance
| |
|
|
|
Increase (Decrease) | ||||||||||||
|---|---|---|---|---|---|---|---|---|---|---|---|---|---|---|---|---|
| |
Fiscal Year | |||||||||||||||
| |
2016 vs. 2015 | 2015 vs. 2014 | ||||||||||||||
| |
2016 | 2015 | 2014 | |||||||||||||
| |
(Dollars in millions) |
|
|
|||||||||||||
Net sales |
$ | 2,762 | $ | 2,690 | $ | 2,510 | 2.7 | % | 7.2 | % | ||||||
Operating income (loss) |
$ | 488 | $ | 474 | $ | 382 | 3.0 | % | 24.1 | % | ||||||
% of Net sales |
17.7 | % | 17.6 | % | 15.2 | % | 10 bps | 240 bps | ||||||||
Depreciation and amortization |
35 | 49 | 107 | (28.6 | )% | (54.2 | )% | |||||||||
Restructuring |
— | 6 | 2 | * | * | |||||||||||
| | | | | | | | | | | | | | | | | |
Adjusted EBITDA |
$ | 523 | $ | 529 | $ | 491 | (1.1 | )% | 7.7 | % | ||||||
% of Net sales |
18.9 | % | 19.7 | % | 19.6 | % | (80 | ) bps | 10 bps | |||||||
- *
- not meaningful
Fiscal 2016 compared to fiscal 2015
Net Sales
Net sales increased $72 million, or 2.7%, in fiscal 2016 as compared to fiscal 2015.
The increase in Net sales was primarily due to market growth and growth initiatives. These growth initiatives consist of investments in sales personnel, products, and technology aligned with our customers' multifamily, hospitality, and healthcare industries. The Net sales increase was partially offset by the impact of suboptimal inventory forecasting, and certain operational and distribution challenges from the second half of fiscal 2015. Management implemented improvements within the supply chain and expects to see improved results beginning with the first quarter of 2017. In addition, the Net sales increase was partially offset by an unfavorable Canadian exchange rate impact, resulting in a $1 million reduction to Net sales in fiscal 2016.
Adjusted EBITDA
Adjusted EBITDA decreased $6 million, or 1.1%, in fiscal 2016 as compared to fiscal 2015.
The decrease was primarily due to increased Selling, general and administrative expenses related to expenses incurred for supply chain investments and the hiring of additional associates to support the expanding business and future growth.
Adjusted EBITDA as a percentage of Net sales decreased approximately 80 basis points in fiscal 2016 as compared to fiscal 2015. The decrease was primarily driven by an increase in Selling, general
59
and administrative expenses as a percentage of Net sales due to expenses incurred for supply chain corrective action.
Fiscal 2015 compared to fiscal 2014
Net Sales
Net sales increased $180 million, or 7.2%, in fiscal 2015 as compared to fiscal 2014.
The increase in Net sales was primarily due to growth initiatives. These growth initiatives consist of investments in sales personnel, products, and technology aligned with our customers' multifamily, hospitality, and healthcare industries. The Net sales increase was partially offset by an unfavorable Canadian exchange rate impact, resulting in a $6 million reduction to Net sales in fiscal 2015. In addition, fiscal 2015 was negatively affected by unfavorable weather impacts during the first quarter.
Adjusted EBITDA
Adjusted EBITDA increased $38 million, or 7.7%, in fiscal 2015 as compared to fiscal 2014.
The increase was primarily due to the increase in Net sales and operating leverage through productivity, partially offset by increased Selling, general and administrative expenses related to the hiring of additional associates to support the expanding business and to drive future growth.
Adjusted EBITDA as a percentage of Net sales increased approximately 10 basis points in fiscal 2015 as compared to fiscal 2014. The increase was primarily driven by a decline in Selling, general and administrative expenses as a percentage of Net sales, partially offset by a $5 million inventory impairment charge recorded in the fourth quarter of fiscal 2015. Selling, general and administrative expenses as a percentage of Net sales declined slightly in fiscal 2015 as compared to fiscal 2014 due to the leverage of fixed costs through sales volume increases and cost control efforts. The inventory impairment charge was recorded based on management's intent to reduce excess inventory thereby decongesting the Company's distribution centers and improving the efficiency of the supply chain.
Waterworks
| |
|
|
|
Increase (Decrease) | ||||||||||||
|---|---|---|---|---|---|---|---|---|---|---|---|---|---|---|---|---|
| |
Fiscal Year | |||||||||||||||
| |
2016 vs. 2015 | 2015 vs. 2014 | ||||||||||||||
| |
2016 | 2015 | 2014 | |||||||||||||
| |
(Dollars in millions) |
|
|
|||||||||||||
Net sales |
$ | 2,622 | $ | 2,510 | $ | 2,427 | 4.5 | % | 3.4 | % | ||||||
Operating income (loss) |
$ | 219 | $ | 208 | $ | 184 | 5.3 | % | 13.0 | % | ||||||
% of Net sales |
8.4 | % | 8.3 | % | 7.6 | % | 10 bps | 70 bps | ||||||||
Depreciation and amortization |
13 | 13 | 14 | — | (7.1 | )% | ||||||||||
Restructuring |
2 | 1 | — | * | * | |||||||||||
| | | | | | | | | | | | | | | | | |
Adjusted EBITDA |
$ | 234 | $ | 222 | $ | 198 | 5.4 | % | 12.1 | % | ||||||
% of Net sales |
8.9 | % | 8.8 | % | 8.2 | % | 10 bps | 60 bps | ||||||||
- *
- not meaningful
Fiscal 2016 compared to fiscal 2015
Net Sales
Net sales increased $112 million, or 4.5%, during fiscal 2016 as compared to fiscal 2015.
Growth initiatives, including meters, storm drainage, and treatment plants contributed to the increase in fiscal 2016. Net sales was also positively impacted by higher sales volume due to
60
improvements in the non-residential and residential construction markets, partially offset by a decline in Polyvinyl chlorides ("PVC") pipe pricing.
Adjusted EBITDA
Adjusted EBITDA increased $12 million, or 5.4%, in fiscal 2016 as compared to fiscal 2015.
The increase in fiscal 2016 was due to growth initiatives, partially offset by increased Selling, general and administrative expenses. The increase in Selling, general and administrative expenses was primarily driven by personnel related to hiring additional associates to support growth initiatives, variable costs due to the increased volume, and inflation.
Adjusted EBITDA as a percentage of Net sales increased approximately 10 basis points in fiscal 2016 as compared to fiscal 2015. The increase in Adjusted EBITDA as a percentage of Net Sales is the result of improvements in gross margin partially offset by an increase in Selling, general and administrative expenses as a percentage of Net sales, due to investments in growth initiatives.
Fiscal 2015 compared to fiscal 2014
Net Sales
Net sales increased $83 million, or 3.4%, during fiscal 2015 as compared to fiscal 2014.
Growth initiatives, including fusible piping solutions, storm drainage, treatment plant initiatives, and new locations ("greenfields"), contributed to the increase in fiscal 2015. Net sales was also positively impacted by higher sales volume due to end-market improvements.
Adjusted EBITDA
Adjusted EBITDA increased $24 million, or 12.1%, in fiscal 2015 as compared to fiscal 2014.
The increase in fiscal 2015, was due to growth initiatives, partially offset by increased Selling, general and administrative expenses, primarily personnel related to growth initiative investments and variable costs due to the increased volume and inflation.
Adjusted EBITDA as a percentage of Net sales increased approximately 60 basis points in fiscal 2015 as compared to fiscal 2014. The improvement was primarily a result of improvements in gross margins due to our category management initiatives and product mix, including fewer large low margin projects as a result of a sluggish municipal market, partially offset by an increase in Selling, general and administrative expenses as a percentage of Net sales as we continue to invest for future growth.
Construction & Industrial
| |
|
|
|
Increase (Decrease) | ||||||||||||
|---|---|---|---|---|---|---|---|---|---|---|---|---|---|---|---|---|
| |
Fiscal Year | |||||||||||||||
| |
2016 vs. 2015 | |
||||||||||||||
| |
2016 | 2015 | 2014 | 2015 vs. 2014 | ||||||||||||
| |
(Dollars in millions) |
|
|
|||||||||||||
Net sales |
$ | 2,063 | $ | 1,932 | $ | 1,753 | 6.8 | % | 10.2 | % | ||||||
Operating income |
$ | 190 | $ | 153 | $ | 98 | 24.2 | % | 56.1 | % | ||||||
% of Net sales |
9.2 | % | 7.9 | % | 5.6 | % | 130 bps | 230 bps | ||||||||
Depreciation and amortization |
34 | 31 | 39 | 9.7 | % | (20.5) | % | |||||||||
Restructuring |
— | — | 2 | — | * | |||||||||||
| | | | | | | | | | | | | | | | | |
Adjusted EBITDA |
$ | 224 | $ | 184 | $ | 139 | 21.7 | % | 32.4 | % | ||||||
% of Net sales |
10.9 | % | 9.5 | % | 7.9 | % | 140 bps | 160 bps | ||||||||
- *
- not meaningful
61
Fiscal 2016 compared to fiscal 2015
Net Sales
Net sales increased $131 million, or 6.8%, in fiscal 2016 as compared to fiscal 2015.
Growth initiatives contributed to the increase in Net sales in in fiscal 2016 driven by our greenfields, Managed Sales Approach ("MSA") and direct marketing initiatives. MSA is a structured approach to drive revenue at a regional level through analysis, tools and sales management. In addition, Net sales were positively impacted by end-market improvement in both non-residential and residential housing markets. The Net sales increase was partially offset by an unfavorable Canadian exchange rate impact, resulting in a $1 million reduction to Net sales in fiscal 2016.
Adjusted EBITDA
Adjusted EBITDA increased $40 million, or 21.7%, in fiscal 2016 as compared to fiscal 2015.
The increase in Adjusted EBITDA in fiscal 2016 as compared to fiscal 2015 was primarily driven by growth initiatives and market volume. This increase was partially offset by increased Selling, general and administrative expenses related to variable expenses and the hiring of additional associates to support the expanding business and drive future growth.
Adjusted EBITDA as a percentage of Net sales increased approximately 140 basis points in fiscal 2016 as compared to fiscal 2015. The increase was driven by improvements in gross margins, due to product mix and category management initiatives, and a decrease in Selling, general and administrative expenses as a percentage of Net sales due to the leverage of fixed costs through sales volume increases and cost control efforts.
Fiscal 2015 compared to fiscal 2014
Net Sales
Net sales increased $179 million, or 10.2%, in fiscal 2015 as compared to fiscal 2014.
Growth initiatives contributed to the increase in Net sales in fiscal 2015 driven by our greenfields, MSA and direct marketing initiatives. In addition, Net sales were positively impacted by end-market improvement in both non-residential and residential housing markets. The Net sales increase was partially offset by an unfavorable Canadian exchange rate impact, resulting in a $13 million reduction to Net sales in fiscal 2015.
Adjusted EBITDA
Adjusted EBITDA increased $45 million, or 32.4%, in fiscal 2015 as compared to fiscal 2014.
The increase in Adjusted EBITDA in fiscal 2015 as compared to fiscal 2014 was primarily driven by growth initiatives and market volume. This increase was partially offset by increased Selling, general and administrative expenses related to variable expenses and the hiring of additional associates to support the expanding business and drive future growth.
Adjusted EBITDA as a percentage of Net sales increased approximately 160 basis points in fiscal 2015 as compared to fiscal 2014. This improvement was primarily driven by improvements in gross margins, due to product mix and category management initiatives, and a decrease in Selling, general and administrative expenses as a percentage of Net sales due to the leverage of fixed costs through sales volume increases and cost control efforts.
62
Liquidity, capital resources and financial condition
Sources and uses of cash
Our sources of funds, primarily from operations, cash on-hand, and, to the extent necessary, from readily available external financing arrangements, are sufficient to meet all current obligations on a timely basis. We believe that these sources of funds will be sufficient to meet the operating needs of our business for at least the next twelve months.
During fiscal 2016, the Company's receipt of cash was primarily driven by cash receipts from operations, the sale of a business, and proceeds from stock option exercises, partially offset by net debt repayments including premiums and make-whole payments to call or redeem debt prior to maturity, the payment of interest on debt, capital expenditures and purchases of treasury shares.
As of January 29, 2017, our combined liquidity of approximately $729 million was comprised of $75 million in cash and cash equivalents and $654 million of additional available borrowings (excluding $26 million of borrowings on available cash balances) under our Senior ABL Facility, based on qualifying inventory and receivables.
Information about the Company's cash flows, by category, is presented in the Consolidated Statements of Cash Flows and is summarized as follows:
Net cash provided by (used for):
| |
Fiscal 2016 | Fiscal 2015 | Fiscal 2014 | |||||||
|---|---|---|---|---|---|---|---|---|---|---|
| |
Amounts in millions |
|||||||||
Operating activities |
$ | 513 | $ | 422 | $ | 295 | ||||
Investing activities |
(21 | ) | 726 | 84 | ||||||
Financing activities |
(687 | ) | (962 | ) | (404 | ) | ||||
Working capital
Working capital, excluding cash and cash equivalents, was $929 million as of January 29, 2017, increasing $86 million as compared to $843 million as of January 31, 2016. Working capital, excluding the impact of discontinued operations and cash and cash equivalents, increased $99 million. The increase was primarily driven by business growth, resulting in increases in Receivables and Inventory, offset by increases in Accounts Payable. Additionally, working capital increased due to lower Accrued Interest as a result of debt refinancings and extinguishments.
Operating activities
During fiscal 2016 cash provided by operating activities was $513 million compared to $422 million in fiscal 2015. Cash interest paid in fiscal 2016 was $296 million, compared to $397 million in fiscal 2015. Cash flows from operating activities included a payment of $7 million of original issue discount related to the extinguishment of a portion of the Term Loans in fiscal 2016. Cash flows from operating activities in fiscal 2015 included a payment of $12 million of original issue discount related to the extinguishment of a portion of the Term Loans. Cash flows used by operating activities for discontinued operations were $1 million in fiscal 2016 and cash flows provided by discontinued operations were $5 million in fiscal 2015. Excluding the cash interest payments in both periods and original issue discounts paid, cash flows from operating activities for continuing operations decreased approximately $9 million in fiscal 2016 as compared to fiscal 2015. The decrease in operating cash flows excluding interest, original issue discount, and discontinued operations is attributable investment in working capital, restructuring payments, and supply chain corrective action at Facilities Maintenance.
63
During fiscal 2015 cash provided by operating activities was $422 million compared to $295 million in fiscal 2014. Cash interest paid in fiscal 2015 was $397 million, compared to $456 million in fiscal 2014. Cash flows from operating activities during fiscal 2014 included a payment of $1 million of original issue discount related to the extinguishment of a portion of the Term Loans. Cash flows from operating activities for discontinued operations were $5 million and $85 million during the fiscal 2015 and fiscal 2014, respectively. Excluding the cash interest payments in both periods and original issue discounts paid, cash flows from operating activities for continuing operations increased approximately $159 million in fiscal 2015 as compared to fiscal 2014. The increase in operating cash flows excluding interest, original issue discount, and discontinued operations is attributable to growth in earnings of continuing operations and working capital efficiency.
Investing activities
During fiscal 2016, cash used by investing activities was $21 million, primarily comprised of $81 million of capital expenditures, offset by $32 million of cash received from the sales of property and equipment and $28 million of cash received from the sales of businesses, net of transaction costs.
During fiscal 2015, cash provided by investing activities was $726 million, primarily comprised of $809 million of cash received from the sale of our Power Solutions business, net of transaction costs, offset by $86 million of capital expenditures.
During fiscal 2014, cash provided by investing activities was $84 million, primarily due to the net proceeds of $198 million from the sale of our Hardware Solutions business, partially offset by $119 million of capital expenditures.
Financing activities
During fiscal 2016, cash used in financing activities was $687 million, primarily due to net debt repayments of $664 million, including premiums and make-whole payments to call or redeem debt prior to maturity, purchase of treasury shares of $34 million, and payments of $19 million for debt issuance and modification costs, partially offset by $33 million of proceeds from employee stock option exercises.
During fiscal 2015, cash used in financing activities was $962 million, primarily due to net debt repayments of $961 million, including $72 million of contractually required premiums to extinguish the April 2012 Second Priority Notes prior to maturity and purchase of treasury shares of $71 million partially offset by $74 million of proceeds from employee stock option exercises.
During fiscal 2014, cash used in financing activities was $404 million, primarily due to net debt repayments of $379 million, including $106 million of contractually required premiums paid to extinguish the 2012 First Priority Notes prior to maturity, purchases of $52 million of treasury shares and payments of $21 million for debt issuance and modification costs, partially offset by proceeds of $48 million from employee stock option exercises.
External financing
As of January 29, 2017, HDS had an aggregate principal amount of $3,812 million of outstanding debt, net of unamortized discounts and unamortized deferred financing costs of $9 million and $38 million, respectively, and an additional $680 million of available borrowings under its Senior ABL Facility (after giving effect to the borrowing base limitations and approximately $30 million in letters of credit issued and including $26 million of borrowings available on qualifying cash balances). We may from time to time repurchase or otherwise retire or extend our debt and/or take other steps to reduce our debt or otherwise improve our financial position. These actions may include open market debt repurchases, negotiated repurchases, other retirements of outstanding debt, and/or opportunistic refinancing of debt. The amount of debt that may be repurchased or otherwise retired or refinanced, if
64
any, will depend on market conditions, trading levels of our debt, our cash position, compliance with debt covenants and other considerations. Our affiliates may also purchase our debt from time to time, through open market purchases or other transactions. In such cases, our debt may not be retired, in which case we would continue to pay interest in accordance with the terms of the debt, and we would continue to reflect the debt as outstanding in our consolidated statements of financial position.
On January 26, 2017, HDS used cash and available borrowings under HDS's Senior ABL Facility, to repay $200 million aggregate principal of its Term B-1 Loans. As a result, the Company incurred a $5 million loss on extinguishment of debt, which includes write-offs of $2 million and $3 million of unamortized original issue discount and unamortized deferred financing costs, respectively, in accordance with ASC 470-50, "Debt—Modifications and Extinguishments."
On October 14, 2016, HDS entered into a Fourth Amendment (the "Fourth Amendment") to the credit agreement governing HDS's existing Term Loan Facility. Pursuant to the Fourth Amendment, HDS amended its existing Term Loan Facility to, among other things, (i) eliminate its LIBOR floor by means of a replacement tranche that replaced all of the Company's outstanding term loans in an aggregate principal amount of approximately $842 million and (ii) issue a new tranche of term loans in an aggregate principal amount of $550 million (the "Term B-2 Loans").
Pursuant to the Fourth Amendment, the Term B-1 Loans bear interest at the applicable margin for borrowings of 2.75% for LIBOR borrowings and 1.75% for base rate borrowings, with no LIBOR floor. The Term B-1 Loans amortize in equal quarterly installments in aggregate annual amounts equal to 1.00% of the original principal amount of the replaced tranche with the balance payable on the maturity date, August 13, 2021.
The Term B-2 Loans bear interest at the applicable margin for borrowings of 2.75% for LIBOR borrowings and 1.75% for base rate borrowings, with no LIBOR floor. The Term Loan Facility allows for a reduction to the applicable margin on the Term B-2 Loans from 2.75% per annum to 2.50% per annum upon the Company reaching a consolidated total leverage ratio of 3.0x or less. The Term B-2 Loans will amortize in equal quarterly installments in aggregate annual amounts equal to 1.00% of the original principal amount and will mature on October 17, 2023.
On October 17, 2016 HDS used the proceeds from the Term B-2 Loans, together with cash on hand and available borrowings under HDS's Senior ABL Facility, to redeem all of the outstanding $1,275 million aggregate principal of the February 2013 Senior Unsecured Notes, and pay a $48 million premium in accordance with the terms of the indenture governing such notes. As a result, the Company incurred a $59 million loss on extinguishment of the debt, which includes the $48 million premium and write-off of $11 million of unamortized deferred financing costs, in accordance with ASC 470-50, "Debt—Modifications and Extinguishments."
On April 11, 2016, HDS issued $1,000 million of 5.75% Senior Unsecured Notes due 2024 (the "April 2016 Senior Unsecured Notes") at par. HDS received approximately $985 million, net of transaction fees. The transaction fees of $15 million are reflected as deferred financing costs in the Consolidated Balance Sheets and will be amortized into interest expense over the term of the notes.
On April 27, 2016, HDS used the net proceeds from the April 2016 Senior Unsecured Notes issuance, together with available cash, to redeem all of the outstanding $1,000 million aggregate principal of the October 2012 Senior Unsecured Notes, and pay a $106 million make-whole premium calculated in accordance with the terms of the indenture governing such notes and pay $4 million of accrued but unpaid interest to the redemption date. As a result, the Company incurred a $115 million loss on extinguishment of debt, which includes the $106 million make-whole premium and the write-off of $9 million of unamortized deferred financing costs, in accordance with ASC 470-50, "Debt—Modifications and Extinguishments."
65
For additional information, see "Note 5, Debt," in the Notes to the Consolidated Financial Statements within "Part II. Item 8. Financial Statements and Supplementary Data" of this annual report on Form 10-K.
Rating agency actions
In December 2016, S&P downgraded HDS's Term B-1 Loans, Term B-2 Loans, and its 5.25% Senior Secured First Priority Notes due 2021 ("the December 2014 First Priority Notes") from BB to BB-. S&P cited its revised ratings criteria for companies within the capital goods sector for the downgrade.
In September 2016, Moody's downgraded HDS's secured debt to B1 from Ba3. Moody's cited our reconfigured capital debt structure due to the October 2016 refinancing actions taken. Moody's maintained its Speculative Grade Liquidity Rating at SGL-1, citing their expectations that operating cash flows are sufficient to fund normal operating requirements and capital expenditures to support ongoing demand and growth initiatives. Also in September 2016, S&P assigned a BB issue-level rating for our Term B-2 Loans. S&P maintained its overall outlook as positive.
In March 2016, Moody's Investor Service ("Moody's") upgraded HDS's corporate family rating to B1, from B2. Moody's cited our solid operating performance and lower level of balance sheet debt. In a related rating action, Moody's raised HDS's Speculative Grade Liquidity Rating to SGL-1 from SGL-2, citing their expectations of increasing free cash flows and the amount of revolving credit facility availability. Moody's rating outlook remains at positive. Also in March 2016, Standard & Poor's ("S&P") raised HDS's corporate credit rating to 'BB-' from 'B+', and revised its rating outlook to positive from stable.
Commodity and interest rate risk
Commodity risk
We are aware of the potentially unfavorable effects inflationary pressures may create through higher asset replacement costs and related depreciation, higher interest rates and higher material costs. In addition, our operating performance is affected by price fluctuations in the commodity based products that we purchase and sell, which contain commodities such as steel, PVC, ductile iron and other commodities. We are also exposed to fluctuations in petroleum costs as we deliver a substantial portion of the products we sell by truck. We seek to minimize the effects of inflation and changing prices through economies of purchasing and inventory management resulting in cost reductions and productivity improvements as well as price increases to maintain reasonable gross margins.
As discussed above, our results of operations were favorably or negatively impacted by fluctuating commodity prices based on our ability or inability to pass increases in the prices of certain commodity based products to our customers. Such commodity price fluctuations have from time to time produced volatility in our financial performance and could do so in the future.
Interest rate risk related to debt
We are subject to interest rate risk associated with our debt. While changes in interest rates impact the fair value of the fixed-rate debt, there is no impact to earnings and cash flow. Alternatively, while changes in interest rates do not affect the fair value of our variable-rate debt, they do affect future earnings and cash flows.
HDS's Senior ABL Facility and Term Loan Facility bear variable interest rates.
- •
- The Senior ABL Facility bears interest (i) in the case of U.S. dollar denominated loans, either at LIBOR or the Prime Rate, at the option of the Company, plus applicable borrowing margins
66
- •
- The Term Loans bear interest at the applicable margin for borrowings of 2.75% for LIBOR borrowings and 1.75% for base rate borrowings, with no LIBOR floor.
and (ii) in the case of Canadian dollar denominated loans, either at the BA Rate or the Canadian Prime Rate, at the option of the Company, plus applicable borrowing margins. The borrowing margins are defined by a pricing grid, as included in the ABL Facility agreement, based on average excess availability for the previous quarter.
A 1% increase in interest rates on our variable-rate debt would increase our annual forecasted interest expense by approximately $16 million (based on our borrowings as of January 29, 2017).
Off-balance sheet arrangements
In accordance with generally accepted accounting principles in the United States of America, operating leases for a portion of our real estate and other assets are not reflected in our Consolidated Balance Sheets.
Contractual obligations
The following table discloses aggregate information about our contractual obligations as of January 29, 2017 and the periods in which payments are due (amounts in millions):
| |
|
Payments due by period | ||||||||||||||
|---|---|---|---|---|---|---|---|---|---|---|---|---|---|---|---|---|
| |
Total | Fiscal 2017 |
Fiscal 2018 - 2019 |
Fiscal 2020 - 2021 |
Fiscal years after 2021 |
|||||||||||
Long-term debt |
$ | 3,859 | $ | 14 | $ | 449 | $ | 1,875 | $ | 1,521 | ||||||
Interest on long-term debt(i) |
997 | 182 | 339 | 314 | 162 | |||||||||||
Build-to-suit Lease(ii) |
127 | — | 10 | 12 | 105 | |||||||||||
Operating leases |
555 | 147 | 237 | 115 | 56 | |||||||||||
Purchase obligations(iii) |
382 | 382 | — | — | — | |||||||||||
| | | | | | | | | | | | | | | | | |
Total contractual cash obligations(iv) |
$ | 5,920 | $ | 725 | $ | 1,035 | $ | 2,316 | $ | 1,844 | ||||||
| | | | | | | | | | | | | | | | | |
| | | | | | | | | | | | | | | | | |
| | | | | | | | | | | | | | | | | |
- (i)
- The
interest rates for the Senior ABL Facility are calculated based on the rates as of January 29, 2017.
- (ii)
- On
February 4, 2016, the Company entered into an agreement for the lease of a leadership development and headquarters facility in Atlanta, Georgia. The lease
commences upon completion of construction of the facility, which is anticipated to be early 2018. For additional information, see "Note 10—Supplemental Balance Sheet and Cash Flow
Information," in the Notes to the Consolidated Financial Statements within "Part II. Item 8. Financial Statements and Supplementary Data" of this annual report on Form 10-K.
- (iii)
- Purchase
obligations include various commitments with vendors to purchase goods and services, primarily inventory. These purchase obligations are generally
cancelable, but the Company has no intent to cancel.
- (iv)
- The contractual obligations table excludes $2 million of unrecognized tax benefits due to uncertainty regarding the timing of future cash payments, if any, related to the liabilities recorded in accordance with the GAAP guidance for uncertain tax positions.
67
Recent accounting pronouncements
See "Note 1, Nature of Business and Summary of Significant Accounting Policies—Reccent Accounting Pronouncements," in the Notes to the Consolidated Financial Statements within "Part II. Item 8. Financial Statements and Supplementary Data" of this annual report on Form 10-K.
Our critical accounting policies include:
Revenue recognition
We recognize revenue when persuasive evidence of an agreement exists, delivery has occurred or services have been rendered, the price to the buyer is fixed and determinable and collectability is reasonably assured. We ship products to customers by internal fleet and third-party carriers. Revenues, net of sales tax and allowances for returns and discounts, are recognized from product sales when title to the products is passed to the customer, which generally occurs at the point of destination for products shipped by internal fleet and at the point of shipping for products shipped by third-party carriers.
Allowance for doubtful accounts
We evaluate the collectability of accounts receivable based on numerous factors, including past transaction history with customers, their credit worthiness and an assessment of our lien and bond rights. Initially, we estimate an allowance for doubtful accounts as a percentage of aged receivables. This estimate is periodically adjusted when we become aware of a specific customer's inability to meet its financial obligations (e.g., bankruptcy filing) or as a result of changes in our historical collection patterns. While we have a large customer base that is geographically dispersed, a slowdown in the markets in which we operate may result in higher than expected uncollectible accounts, and therefore, the need to revise estimates for bad debts. To the extent historical credit experience is not indicative of future performance or other assumptions used by management do not prevail, the allowance for doubtful accounts could differ significantly, resulting in either higher or lower future provisions for doubtful accounts.
Inventories
Inventories consist primarily of finished goods and are carried at the lower of cost or market. The cost of substantially all of our inventories is determined by the moving or weighted average cost method. We evaluate our inventory value at the end of each quarter to ensure that it is carried at the lower of cost or market. This evaluation includes an analysis of historical physical inventory results, a review of potential excess and obsolete inventories based on inventory aging and anticipated future demand. Periodically, each branch's perpetual inventory records are adjusted to reflect any declines in net realizable value below inventory carrying cost. To the extent historical physical inventory results are not indicative of future results and if future events impact, either favorably or unfavorably, the saleability of our products or our relationship with certain key vendors, our inventory reserves could differ significantly, resulting in either higher or lower future inventory provisions.
Consideration received from vendors
We enter into agreements with many of our vendors providing for inventory purchase rebates ("vendor rebates") upon achievement of specified volume purchasing levels. We accrue the receipt of vendor rebates as part of our cost of sales for products sold based on progress towards earning the vendor rebates, taking into consideration cumulative purchases of inventory to date and projected purchases through the end of the year. An estimate of vendor rebates is included in the carrying value of inventory at each period end for vendor rebates to be received on products not yet sold. While we believe we will continue to receive consideration from vendors in fiscal 2017 and thereafter, there can
68
be no assurance that vendors will continue to provide comparable amounts of vendor rebates in the future.
Impairment of long-lived assets
Long-lived assets, including property and equipment, are reviewed for possible impairment whenever events or circumstances indicate that the carrying amount of an asset may not be recoverable. To analyze recoverability, we project undiscounted future cash flows over the remaining life of the asset. If these projected cash flows are less than the carrying amount, an impairment loss is recognized based on the fair value of the asset less any costs of disposition. Our judgment regarding the existence of impairment indicators are based on market and operational performance. Future events could cause us to conclude that impairment indicators exist and that assets are impaired. Evaluating the impairment also requires us to estimate future operating results and cash flows that require judgment by management. If different estimates were used, the amount and timing of asset impairments could be affected.
Goodwill
Goodwill represents the excess of the purchase price paid over the fair value of the net assets acquired in connection with business acquisitions. ASC 350, "Intangibles—Goodwill and Other," requires entities to periodically assess the carrying value of goodwill by reviewing the fair value of the net assets underlying all acquisition-related goodwill on a reporting unit basis, as defined by ASC 350. We assess the recoverability of goodwill in the fourth quarter of each fiscal year.
We also use judgment in assessing whether we need to test goodwill more frequently for impairment than annually given factors such as unexpected adverse economic conditions, competition, product changes and other events. If the carrying amount of a reporting unit that contains goodwill exceeds fair value, a possible impairment would be indicated.
We determine the fair value of a reporting unit using a discounted cash flow ("DCF") analysis and a market comparable method, with each method being equally weighted in the calculation.
Determining fair value requires the exercise of significant judgment, including judgment about appropriate discount rates, the amount and timing of expected future cash flows, as well as relevant comparable company earnings multiples for the market comparable approach. The cash flows employed in the DCF analyses are based on the Company's most recent long-range forecast and, for years beyond the forecast, the Company's estimates, which are based on estimated exit multiples times the final forecasted year earnings before interest, taxes, depreciation and amortization. The discount rates used in the DCF analyses are intended to reflect the risks inherent in the future cash flows of the respective reporting units. For the market comparable approach, the Company evaluated comparable company public trading values, using earnings multiples and sales multiples that are used to value the reporting units.
For our annual goodwill impairment testing during the fourth quarter of fiscal 2016, we tested the four reporting units with goodwill balances. In accordance with ASC 350, we elected to first assess qualitative factors on all four reporting units: Facilities Maintenance, Waterworks, Construction & Industrial, and Home Improvement Solutions, to determine whether it is more likely than not that the fair value of each of these reporting units is less than its carrying amount. Based on this assessment, we determined that it was not necessary to calculate the fair value using the DCF and market comparable approach for these four reporting units. There was no indication of impairment in any of the Company's reporting units in the fourth quarter 2016 goodwill impairment test.
There was no indication of impairment in any of the Company's reporting units in the fiscal 2015 and fiscal 2014 annual tests.
69
The Company's DCF model is based on our expectation of future market conditions for each of the reporting units, as well as discount rates that would be used by market participants in an arms-length transaction. Future events could cause the Company to conclude that market conditions have declined or discount rates have increased to the extent that the Company's goodwill could be further impaired. It is not possible at this time to determine if any such future impairment charge would result.
Income Taxes
Income taxes are determined under the asset and liability method as required by ASC 740, "Income Taxes." Income tax expense or benefit is based on pre-tax financial accounting income. Deferred tax assets and liabilities are recognized for the expected tax consequences of temporary differences between the tax bases of assets and liabilities and their reported amounts. Deferred tax assets and liabilities are measured using enacted tax rates expected to apply to taxable income in the years in which those temporary differences are expected to be recovered or settled.
At January 29, 2017, Company's U.S. operations continued to have cumulative consolidated pre-tax income for the most recent three-year period. Management concluded that as a consequence of the Company's three-year cumulative consolidated pre-tax income, generation of taxable income in fiscal 2014, 2015, and 2016, long net operating loss carryforward periods, significant reduction in recent interest expense, a projected further reduction in future interest expense, and the business plan for fiscal 2017 and beyond showing continued profitability, that it is more likely than not that substantially all of the Company's U.S. deferred tax assets will be realized. As a result, the Company concluded that no additional valuation on its U.S. deferred assets was necessary. In addition, the Company reduced its valuation allowance related to its U.S. continuing operations by $1 million in fiscal 2016 as it determined it is "more likely than not" certain deferred income tax assets would be realized.
At the end of fiscal 2015, the Company concluded that it is more likely than not that substantially all of our U.S. deferred tax assets would be realized. The conclusion was based upon the Company achieving three-year cumulative consolidated pre-tax income, generating taxable income in fiscal 2014 and fiscal 2015, long net operating loss carryforward periods, a reduction in current and future interest expense, and our business plan for fiscal 2016 and beyond showing continued profitability. Accordingly, in the fourth quarter of fiscal 2015, the Company reversed substantially all of our valuation allowance on our net U.S. deferred tax assets, resulting in a $1,007 million benefit in our provision for income taxes. Consistent with ASC 740, the Company evaluated the sources of realization for the deferred tax assets and considered the appropriate component of income to record the income tax benefit. Based on such analysis, approximately $1,007 million was recorded to continuing operations since the valuation allowance decrease was from our change in the assessment that the beginning-of-year deferred tax assets would be realized.
This measurement is reduced, if necessary, by a valuation allowance based on the amount of tax benefits that, based on available evidence, are not "more likely than not" to be realized. The Company recorded a valuation allowance related to its U.S. continuing operations of $28 million in fiscal 2014 as it believed it is "more likely than not" all of the U.S. deferred income tax assets will not be realized. In addition, the Company recorded a $9 million valuation allowance increase related to its U.S. discontinued operations for fiscal 2014.
The Company follows the GAAP guidance for uncertain tax positions within ASC 740, "Income Taxes". ASC 740 provides guidance related to the financial statement recognition and measurement of tax positions taken or expected to be taken in a tax return. The standard prescribes the minimum recognition threshold that a tax position is required to meet before being recognized in the financial statements. ASC 740 also provides guidance on derecognition, classification, interest and penalties, accounting in interim periods and disclosure. Initial recognition, derecognition and measurement is
70
based on management's judgment given the facts, circumstances and information available at the reporting date. If these judgments are not accurate then future income tax expense or benefit could be different.
In November 2015, the FASB issued authoritative guidance on the balance sheet classification of deferred tax assets (ASU 2015-17). The new guidance requires that deferred tax assets and liabilities be classified as non-current on the balance sheet, as opposed to previous guidance which required a net current asset or liability and net non-current asset or liability on the balance sheet. The Company adopted this new standard as of January 31, 2016 (last day of fiscal 2015) and applied the new guidance on a prospective basis.
Self-insurance
We have a high deductible insurance program for most losses related to general liability, product liability, environmental liability, automobile liability, workers' compensation, and we are self-insured for medical claims and certain legal claims. The expected ultimate cost for claims incurred as of the balance sheet date is not discounted and is recognized as a liability. Self-insurance losses for claims filed and claims incurred but not reported are accrued based upon estimates of the aggregate liability for uninsured claims using loss development factors and actuarial assumptions followed in the insurance industry and historical loss development experience. To the extent the projected future development of the losses resulting from environmental, workers' compensation, automobile, general and product liability claims incurred as of January 29, 2017 differs from the actual development of such losses in future periods, our insurance reserves could differ significantly, resulting in either higher or lower future insurance expense.
Management estimates
Management believes the assumptions and other considerations used to estimate amounts reflected in our consolidated financial statements are appropriate. However, if actual experience differs from the assumptions and other considerations used in estimating amounts reflected in our consolidated financial statements, the resulting changes could have a material adverse effect on our consolidated results of operations, and in certain situations, could have a material adverse effect on our financial condition.
Stock-Based Compensation
Our stock option expense is estimated at the grant date based on an award's fair value as calculated by the Black-Scholes option-pricing model and is recognized as an expense over the requisite service period. The Black-Scholes model requires various highly judgmental assumptions including expected volatility and option life. If any of the assumptions used in the Black-Scholes model change significantly, stock-based compensation expense may differ materially in the future from that recorded in the current period. In addition, we estimate an expected forfeiture rate on all of our stock-based compensation awards and only recognize expense for those awards expected to vest. We estimate the forfeiture rate based on historical experience. To the extent our actual forfeiture rate is different from our estimate, stock-based compensation expense is adjusted accordingly. See "Note 8—Stock Based Compensation and Employee Benefit Plans" in the Notes to the Consolidated Financial Statements within Item 8. Financial Statements and Supplementary Data of this annual report on Form 10-K.
Item 7A. Quantitative and Qualitative Disclosures about Market Risk
The information required by this Item is included under "Item 7. Management's Discussion and Analysis of Financial Condition and Results of Operations" under the caption "Commodity and interest rate risk."
71
ITEM 8. FINANCIAL STATEMENTS AND SUPPLEMENTARY DATA
Index to financial statements
72
REPORT OF INDEPENDENT REGISTERED PUBLIC ACCOUNTING FIRM
To
the Board of Directors and Stockholders of
HD Supply Holdings, Inc.:
In our opinion, the accompanying consolidated balance sheets and the related consolidated statements of operations and comprehensive income (loss), of stockholder' equity (deficit) and of cash flows present fairly, in all material respects, the financial position of HD Supply Holdings, Inc. and its subsidiaries at January 29, 2017 and January 31, 2016, and the results of their operations and their cash flows for each of the three years in the period ended January 29, 2017 in conformity with accounting principles generally accepted in the United States of America. In addition, in our opinion, the financial statement schedule listed in the index appearing under Item 15(c) presents fairly, in all material respects, the information set forth therein when read in conjunction with the related consolidated financial statements. Also in our opinion, the Company maintained, in all material respects, effective internal control over financial reporting as of January 29, 2017, based on criteria established in Internal Control—Integrated Framework (2013) issued by the Committee of Sponsoring Organizations of the Treadway Commission (COSO). The Company's management is responsible for these financial statements and financial statement schedule, for maintaining effective internal control over financial reporting and for its assessment of the effectiveness of internal control over financial reporting, included in Management's Report on Internal Control over Financial Reporting appearing under Item 9A. Our responsibility is to express opinions on these financial statements, on the financial statement schedule, and on the Company's internal control over financial reporting based on our integrated audits. We conducted our audits in accordance with the standards of the Public Company Accounting Oversight Board (United States). Those standards require that we plan and perform the audits to obtain reasonable assurance about whether the financial statements are free of material misstatement and whether effective internal control over financial reporting was maintained in all material respects. Our audits of the financial statements included examining, on a test basis, evidence supporting the amounts and disclosures in the financial statements, assessing the accounting principles used and significant estimates made by management, and evaluating the overall financial statement presentation. Our audit of internal control over financial reporting included obtaining an understanding of internal control over financial reporting, assessing the risk that a material weakness exists, and testing and evaluating the design and operating effectiveness of internal control based on the assessed risk. Our audits also included performing such other procedures as we considered necessary in the circumstances. We believe that our audits provide a reasonable basis for our opinions.
A company's internal control over financial reporting is a process designed to provide reasonable assurance regarding the reliability of financial reporting and the preparation of financial statements for external purposes in accordance with generally accepted accounting principles. A company's internal control over financial reporting includes those policies and procedures that (i) pertain to the maintenance of records that, in reasonable detail, accurately and fairly reflect the transactions and dispositions of the assets of the company; (ii) provide reasonable assurance that transactions are recorded as necessary to permit preparation of financial statements in accordance with generally accepted accounting principles, and that receipts and expenditures of the company are being made only in accordance with authorizations of management and directors of the company; and (iii) provide reasonable assurance regarding prevention or timely detection of unauthorized acquisition, use, or disposition of the company's assets that could have a material effect on the financial statements.
73
Because of its inherent limitations, internal control over financial reporting may not prevent or detect misstatements. Also, projections of any evaluation of effectiveness to future periods are subject to the risk that controls may become inadequate because of changes in conditions, or that the degree of compliance with the policies or procedures may deteriorate.
/s/
PricewaterhouseCoopers LLP
Atlanta, Georgia
March 13, 2017
74
REPORT OF INDEPENDENT REGISTERED PUBLIC ACCOUNTING FIRM
To
the Board of Directors and Stockholder of
HD Supply, Inc.:
In our opinion, the accompanying consolidated balance sheets and the related consolidated statements of operations and comprehensive income (loss), of stockholders' equity (deficit) and of cash flows present fairly, in all material respects, the financial position of HD Supply, Inc. and its subsidiaries at January 29, 2017 and January 31, 2016, and the results of their operations and their cash flows for each of the three years in the period ended January 29, 2017 in conformity with accounting principles generally accepted in the United States of America. In addition, in our opinion, the financial statement schedule listed in the index appearing under Item 15(c) presents fairly, in all material respects, the information set forth therein when read in conjunction with the related consolidated financial statements. Also in our opinion, the Company maintained, in all material respects, effective internal control over financial reporting as of January 29, 2017, based on criteria established in Internal Control—Integrated Framework (2013) issued by the Committee of Sponsoring Organizations of the Treadway Commission (COSO). The Company's management is responsible for these financial statements and financial statement schedule, for maintaining effective internal control over financial reporting and for its assessment of the effectiveness of internal control over financial reporting, included in Management's Report on Internal Control over Financial Reporting appearing under Item 9A. Our responsibility is to express opinions on these financial statements, on the financial statement schedule, and on the Company's internal control over financial reporting based on our integrated audits. We conducted our audits in accordance with the standards of the Public Company Accounting Oversight Board (United States). Those standards require that we plan and perform the audits to obtain reasonable assurance about whether the financial statements are free of material misstatement and whether effective internal control over financial reporting was maintained in all material respects. Our audits of the financial statements included examining, on a test basis, evidence supporting the amounts and disclosures in the financial statements, assessing the accounting principles used and significant estimates made by management, and evaluating the overall financial statement presentation. Our audit of internal control over financial reporting included obtaining an understanding of internal control over financial reporting, assessing the risk that a material weakness exists, and testing and evaluating the design and operating effectiveness of internal control based on the assessed risk. Our audits also included performing such other procedures as we considered necessary in the circumstances. We believe that our audits provide a reasonable basis for our opinions.
A company's internal control over financial reporting is a process designed to provide reasonable assurance regarding the reliability of financial reporting and the preparation of financial statements for external purposes in accordance with generally accepted accounting principles. A company's internal control over financial reporting includes those policies and procedures that (i) pertain to the maintenance of records that, in reasonable detail, accurately and fairly reflect the transactions and dispositions of the assets of the company; (ii) provide reasonable assurance that transactions are recorded as necessary to permit preparation of financial statements in accordance with generally accepted accounting principles, and that receipts and expenditures of the company are being made only in accordance with authorizations of management and directors of the company; and (iii) provide reasonable assurance regarding prevention or timely detection of unauthorized acquisition, use, or disposition of the company's assets that could have a material effect on the financial statements.
75
Because of its inherent limitations, internal control over financial reporting may not prevent or detect misstatements. Also, projections of any evaluation of effectiveness to future periods are subject to the risk that controls may become inadequate because of changes in conditions, or that the degree of compliance with the policies or procedures may deteriorate.
/s/
PricewaterhouseCoopers LLP
Atlanta, Georgia
March 13, 2017
76
HD SUPPLY HOLDINGS, INC.
CONSOLIDATED STATEMENTS OF OPERATIONS AND COMPREHENSIVE INCOME (LOSS)
Amounts in millions, except share and per share data
| |
Fiscal Year Ended | |||||||||
|---|---|---|---|---|---|---|---|---|---|---|
| |
January 29, 2017 |
January 31, 2016 |
February 1, 2015 |
|||||||
Net Sales |
$ | 7,439 | $ | 7,123 | $ | 6,682 | ||||
Cost of sales |
4,907 | 4,734 | 4,487 | |||||||
| | | | | | | | | | | |
Gross Profit |
2,532 | 2,389 | 2,195 | |||||||
Operating expenses: |
||||||||||
Selling, general and administrative |
1,637 | 1,535 | 1,446 | |||||||
Depreciation and amortization |
95 | 108 | 178 | |||||||
Restructuring |
9 | 9 | 6 | |||||||
| | | | | | | | | | | |
Total operating expenses |
1,741 | 1,652 | 1,630 | |||||||
Operating Income |
791 | 737 | 565 | |||||||
Interest expense |
269 | 394 | 462 | |||||||
Loss on extinguishment & modification of debt |
179 | 100 | 108 | |||||||
Other (income) expense, net |
— | 1 | (3 | ) | ||||||
| | | | | | | | | | | |
Income (Loss) from Continuing Operations Before Provision (Benefit) for Income Taxes |
343 | 242 | (2 | ) | ||||||
Provision (benefit) for income taxes |
139 | (1,084 | ) | 36 | ||||||
| | | | | | | | | | | |
Income (Loss) from Continuing Operations |
204 | 1,326 | (38 | ) | ||||||
Income (Loss) from discontinued operations, net of tax |
(8 | ) | 146 | 41 | ||||||
| | | | | | | | | | | |
Net Income |
$ | 196 | $ | 1,472 | $ | 3 | ||||
| | | | | | | | | | | |
| | | | | | | | | | | |
| | | | | | | | | | | |
Other comprehensive income (loss)—foreign currency translation adjustment |
1 | 12 | (13 | ) | ||||||
| | | | | | | | | | | |
Total Comprehensive Income (Loss) |
$ | 197 | $ | 1,484 | $ | (10 | ) | |||
| | | | | | | | | | | |
| | | | | | | | | | | |
| | | | | | | | | | | |
Weighted Average Common Shares Outstanding (thousands) |
||||||||||
Basic |
199,385 | 197,011 | 193,962 | |||||||
Diluted |
202,000 | 201,308 | 193,962 | |||||||
Basic Earnings Per Share(1): |
||||||||||
Income (Loss) from Continuing Operations |
$ | 1.02 | $ | 6.73 | $ | (0.20 | ) | |||
Income (Loss) from Discontinued Operations |
$ | (0.04 | ) | $ | 0.74 | $ | 0.21 | |||
| | | | | | | | | | | |
Net Income |
$ | 0.98 | $ | 7.47 | $ | 0.02 | ||||
| | | | | | | | | | | |
| | | | | | | | | | | |
| | | | | | | | | | | |
Diluted Earnings Per Share(1): |
||||||||||
Income (Loss) from Continuing Operations |
$ | 1.01 | $ | 6.59 | $ | (0.20 | ) | |||
Income (Loss) from Discontinued Operations |
$ | (0.04 | ) | $ | 0.73 | $ | 0.21 | |||
| | | | | | | | | | | |
Net Income |
$ | 0.97 | $ | 7.31 | $ | 0.02 | ||||
| | | | | | | | | | | |
| | | | | | | | | | | |
| | | | | | | | | | | |
- (1)
- May not foot due to rounding.
The accompanying notes are an integral part of these consolidated financial statements.
77
HD SUPPLY HOLDINGS, INC.
CONSOLIDATED BALANCE SHEETS
Amounts in millions, except share and per share data
| |
January 29, 2017 |
January 31, 2016 |
|||||
|---|---|---|---|---|---|---|---|
ASSETS |
|||||||
Current assets: |
|||||||
Cash and cash equivalents |
$ | 75 | $ | 269 | |||
Receivables, less allowance for doubtful accounts of $13 and $13 |
904 | 872 | |||||
Inventories |
831 | 770 | |||||
Current assets of discontinued operations |
— | 43 | |||||
Other current assets |
37 | 29 | |||||
| | | | | | | | |
Total current assets |
1,847 | 1,983 | |||||
| | | | | | | | |
Property and equipment, net |
303 | 310 | |||||
Goodwill |
2,869 | 2,869 | |||||
Intangible assets, net |
112 | 127 | |||||
Deferred tax asset |
556 | 685 | |||||
Non-current assets of discontinued operations |
— | 20 | |||||
Other assets |
20 | 22 | |||||
| | | | | | | | |
Total assets |
$ | 5,707 | $ | 6,016 | |||
| | | | | | | | |
| | | | | | | | |
| | | | | | | | |
LIABILITIES AND STOCKHOLDERS' EQUITY |
|||||||
Current liabilities: |
|||||||
Accounts payable |
$ | 532 | $ | 490 | |||
Accrued compensation and benefits |
140 | 142 | |||||
Current installments of long-term debt |
14 | 9 | |||||
Current liabilities of discontinued operations |
— | 30 | |||||
Other current liabilities |
157 | 200 | |||||
| | | | | | | | |
Total current liabilities |
843 | 871 | |||||
| | | | | | | | |
Long-term debt, excluding current installments |
3,798 | 4,302 | |||||
Non-current liabilities of discontinued operations |
— | 1 | |||||
Other liabilities |
106 | 98 | |||||
| | | | | | | | |
Total liabilities |
4,747 | 5,272 | |||||
| | | | | | | | |
Stockholders' equity: |
|||||||
Common stock, par value $0.01; 1 billion shares authorized; 201.4 million and 200.1 million shares issued and outstanding at January 29, 2017 and January 31, 2016, respectively |
2 | 2 | |||||
Paid-in capital |
3,962 | 3,909 | |||||
Accumulated deficit |
(2,969 | ) | (3,150 | ) | |||
Accumulated other comprehensive loss |
(15 | ) | (16 | ) | |||
Treasury stock, at cost, 0.6 million and 0.06 million shares at January 29, 2017 and January 31, 2016, respectively |
(20 | ) | (1 | ) | |||
| | | | | | | | |
Total stockholders' equity |
960 | 744 | |||||
| | | | | | | | |
Total liabilities and stockholders' equity |
$ | 5,707 | $ | 6,016 | |||
| | | | | | | | |
| | | | | | | | |
| | | | | | | | |
The accompanying notes are an integral part of these consolidated financial statements.
78
HD SUPPLY HOLDINGS, INC.
CONSOLIDATED STATEMENTS OF STOCKHOLDERS' EQUITY (DEFICIT)
Dollars in millions, shares in thousands
| |
|
|
Amounts | ||||||||||||||||||||||
|---|---|---|---|---|---|---|---|---|---|---|---|---|---|---|---|---|---|---|---|---|---|---|---|---|---|
| |
Shares | ||||||||||||||||||||||||
| |
|
|
|
|
Accumulated Other Comprehensive Income (Loss)(1) |
|
|||||||||||||||||||
| |
Common Stock |
Treasury | Common Stock |
Treasury Stock |
Paid-in Capital |
Accumulated Deficit |
Total Equity |
||||||||||||||||||
Balance at February 2, 2014 |
192,382 | (6 | ) | $ | 2 | $ | — | $ | 3,752 | $ | (4,503 | ) | $ | (15 | ) | $ | (764 | ) | |||||||
| | | | | | | | | | | | | | | | | | | | | | | | | | |
Net income |
3 | 3 | |||||||||||||||||||||||
Other comprehensive income (loss): |
|||||||||||||||||||||||||
Foreign currency translation adjustment |
(13 | ) | (13 | ) | |||||||||||||||||||||
Purchase of common stock |
(1,870 | ) | (52 | ) | (52 | ) | |||||||||||||||||||
Shares issued under employee benefit plans |
5,539 | — | 48 | 48 | |||||||||||||||||||||
Stock-based compensation |
17 | 17 | |||||||||||||||||||||||
Share retirement(2) |
(1,470 | ) | 1,470 | 40 | (40 | ) | — | ||||||||||||||||||
Other |
1 | 1 | |||||||||||||||||||||||
| | | | | | | | | | | | | | | | | | | | | | | | | | |
Balance at February 1, 2015 |
196,451 | (406 | ) | $ | 2 | $ | (12 | ) | $ | 3,818 | $ | (4,540 | ) | $ | (28 | ) | $ | (760 | ) | ||||||
| | | | | | | | | | | | | | | | | | | | | | | | | | |
Net income |
1,472 | 1,472 | |||||||||||||||||||||||
Other comprehensive income (loss): |
|||||||||||||||||||||||||
Foreign currency translation adjustment |
12 | 12 | |||||||||||||||||||||||
Purchase of common stock |
(2,282 | ) | (72 | ) | (72 | ) | |||||||||||||||||||
Shares issued under employee benefit plans |
6,351 | — | 74 | 74 | |||||||||||||||||||||
Stock-based compensation |
16 | 16 | |||||||||||||||||||||||
Share retirement(2) |
(2,630 | ) | 2,630 | 82 | (82 | ) | — | ||||||||||||||||||
Other |
1 | 1 | 2 | ||||||||||||||||||||||
| | | | | | | | | | | | | | | | | | | | | | | | | | |
Balance at January 31, 2016 |
200,172 | (58 | ) | $ | 2 | $ | (1 | ) | $ | 3,909 | $ | (3,150 | ) | $ | (16 | ) | $ | 744 | |||||||
| | | | | | | | | | | | | | | | | | | | | | | | | | |
Net income |
196 | 196 | |||||||||||||||||||||||
Other comprehensive income (loss): |
|||||||||||||||||||||||||
Foreign currency translation adjustment |
1 | 1 | |||||||||||||||||||||||
Purchase of common stock |
(953 | ) | (33 | ) | (33 | ) | |||||||||||||||||||
Shares issued under employee benefit plans |
2,232 | — | 33 | 33 | |||||||||||||||||||||
Stock-based compensation |
20 | 20 | |||||||||||||||||||||||
Share retirement(2) |
(450 | ) | 450 | 14 | (14 | ) | — | ||||||||||||||||||
Other |
— | — | (1 | ) | (1 | ) | |||||||||||||||||||
| | | | | | | | | | | | | | | | | | | | | | | | | | |
Balance at January 29, 2017 |
201,954 | (561 | ) | $ | 2 | $ | (20 | ) | $ | 3,962 | $ | (2,969 | ) | $ | (15 | ) | $ | 960 | |||||||
| | | | | | | | | | | | | | | | | | | | | | | | | | |
| | | | | | | | | | | | | | | | | | | | | | | | | | |
| | | | | | | | | | | | | | | | | | | | | | | | | | |
- (1)
- Accumulated
Other Comprehensive Income (Loss) is comprised of cumulative foreign currency translation adjustments, net.
- (2)
- The majority of these retired shares were re-acquired by Holdings, pursuant to its previously announced share repurchase program. Holdings reinstated the Retired Shares to the status of authorized but unissued shares of the Company's common stock, par value $0.01 per share, effective as of the date of retirement.
The accompanying notes are an integral part of these consolidated financial statements.
79
HD SUPPLY HOLDINGS, INC.
CONSOLIDATED STATEMENTS OF CASH FLOWS
Amounts in millions
| |
Fiscal Year Ended | |||||||||
|---|---|---|---|---|---|---|---|---|---|---|
| |
January 29, 2017 |
January 31, 2016 |
February 1, 2015 |
|||||||
CASH FLOWS FROM OPERATING ACTIVITIES: |
||||||||||
Net income |
$ | 196 | $ | 1,472 | $ | 3 | ||||
Reconciliation of net income to net cash provided by (used in) operating activities: |
||||||||||
Depreciation and amortization |
102 | 134 | 226 | |||||||
Provision for uncollectibles |
6 | 8 | 7 | |||||||
Non-cash interest expense |
17 | 23 | 25 | |||||||
Payment of discounts upon extinguishment of debt |
(7 | ) | (12 | ) | (1 | ) | ||||
Loss on extinguishment & modification of debt |
179 | 100 | 108 | |||||||
(Gain) loss on sales of businesses, net |
6 | (186 | ) | (8 | ) | |||||
Stock-based compensation expense |
20 | 16 | 17 | |||||||
Deferred income taxes |
129 | (839 | ) | 55 | ||||||
Other |
(11 | ) | (4 | ) | — | |||||
Changes in assets and liabilities, net of the effects of acquisitions & dispositions: |
||||||||||
(Increase) decrease in receivables |
(38 | ) | (63 | ) | (90 | ) | ||||
(Increase) decrease in inventories |
(62 | ) | (38 | ) | (71 | ) | ||||
(Increase) decrease in other current assets |
3 | 11 | 18 | |||||||
(Increase) decrease in other assets |
(2 | ) | — | — | ||||||
Increase (decrease) in accounts payable and accrued liabilities |
(16 | ) | (14 | ) | 1 | |||||
Increase (decrease) in other long-term liabilities |
(9 | ) | (186 | ) | 5 | |||||
| | | | | | | | | | | |
Net cash provided by (used in) operating activities |
513 | 422 | 295 | |||||||
| | | | | | | | | | | |
CASH FLOWS FROM INVESTING ACTIVITIES: |
||||||||||
Capital expenditures |
(81 | ) | (86 | ) | (119 | ) | ||||
Proceeds from sales of property and equipment |
32 | 3 | 5 | |||||||
Proceeds from sales of businesses, net |
28 | 809 | 198 | |||||||
| | | | | | | | | | | |
Net cash provided by (used in) investing activities |
(21 | ) | 726 | 84 | ||||||
| | | | | | | | | | | |
CASH FLOWS FROM FINANCING ACTIVITIES: |
||||||||||
Proceeds from issuance of common stock under employee benefit plans |
33 | 74 | 48 | |||||||
Purchase of treasury shares |
(34 | ) | (71 | ) | (52 | ) | ||||
Borrowings of long-term debt |
1,547 | 287 | 1,270 | |||||||
Repayments of long-term debt |
(2,631 | ) | (1,152 | ) | (1,385 | ) | ||||
Borrowings on long-term revolver debt |
689 | 784 | 878 | |||||||
Repayments on long-term revolver debt |
(269 | ) | (880 | ) | (1,142 | ) | ||||
Debt issuance and modification costs |
(19 | ) | (6 | ) | (21 | ) | ||||
Other financing activities |
(3 | ) | 2 | — | ||||||
| | | | | | | | | | | |
Net cash provided by (used in) financing activities |
(687 | ) | (962 | ) | (404 | ) | ||||
| | | | | | | | | | | |
Effect of exchange rates on cash and cash equivalents |
1 | (2 | ) | (5 | ) | |||||
| | | | | | | | | | | |
Increase (decrease) in cash and cash equivalents |
$ | (194 | ) | $ | 184 | $ | (30 | ) | ||
Cash and cash equivalents at beginning of period |
269 | 85 | 115 | |||||||
| | | | | | | | | | | |
Cash and cash equivalents at end of period |
$ | 75 | $ | 269 | $ | 85 | ||||
| | | | | | | | | | | |
| | | | | | | | | | | |
| | | | | | | | | | | |
The accompanying notes are an integral part of these consolidated financial statements.
80
HD SUPPLY, INC.
CONSOLIDATED STATEMENTS OF OPERATIONS AND COMPREHENSIVE INCOME (LOSS)
Amounts in millions
| |
Fiscal Year Ended | |||||||||
|---|---|---|---|---|---|---|---|---|---|---|
| |
January 29, 2017 |
January 31, 2016 |
February 1, 2015 |
|||||||
Net Sales |
$ | 7,439 | $ | 7,123 | $ | 6,682 | ||||
Cost of sales |
4,907 | 4,734 | 4,487 | |||||||
| | | | | | | | | | | |
Gross Profit |
2,532 | 2,389 | 2,195 | |||||||
Operating expenses: |
||||||||||
Selling, general and administrative |
1,637 | 1,535 | 1,446 | |||||||
Depreciation and amortization |
95 | 108 | 178 | |||||||
Restructuring |
9 | 9 | 6 | |||||||
| | | | | | | | | | | |
Total operating expenses |
1,741 | 1,652 | 1,630 | |||||||
Operating Income |
791 | 737 | 565 | |||||||
Interest expense |
269 | 394 | 462 | |||||||
Loss on extinguishment & modification of debt |
179 | 100 | 108 | |||||||
Other (income) expense, net |
— | 1 | (3 | ) | ||||||
| | | | | | | | | | | |
Income (Loss) from Continuing Operations Before Provision (Benefit) for Income Taxes |
343 | 242 | (2 | ) | ||||||
Provision (benefit) for income taxes |
139 | (1,084 | ) | 36 | ||||||
| | | | | | | | | | | |
Income (Loss) from Continuing Operations |
204 | 1,326 | (38 | ) | ||||||
Income (Loss) from discontinued operations, net of tax |
(8 | ) | 146 | 41 | ||||||
| | | | | | | | | | | |
Net Income |
$ | 196 | $ | 1,472 | $ | 3 | ||||
| | | | | | | | | | | |
| | | | | | | | | | | |
| | | | | | | | | | | |
Other comprehensive income (loss)—foreign currency translation adjustment |
1 | 12 | (13 | ) | ||||||
| | | | | | | | | | | |
Total Comprehensive Income (Loss) |
$ | 197 | $ | 1,484 | $ | (10 | ) | |||
| | | | | | | | | | | |
| | | | | | | | | | | |
| | | | | | | | | | | |
The accompanying notes are an integral part of these consolidated financial statements.
81
HD SUPPLY, INC.
CONSOLIDATED BALANCE SHEETS
Amounts in millions, except share and per share data
| |
January 29, 2017 |
January 31, 2016 |
|||||
|---|---|---|---|---|---|---|---|
ASSETS |
|||||||
Current assets: |
|||||||
Cash and cash equivalents |
$ | 73 | $ | 266 | |||
Receivables, less allowance for doubtful accounts of $13 and $13 |
904 | 872 | |||||
Inventories |
831 | 770 | |||||
Current assets of discontinued operations |
— | 43 | |||||
Other current assets |
37 | 29 | |||||
| | | | | | | | |
Total current assets |
1,845 | 1,980 | |||||
| | | | | | | | |
Property and equipment, net |
303 | 310 | |||||
Goodwill |
2,869 | 2,869 | |||||
Intangible assets, net |
112 | 127 | |||||
Deferred tax asset |
556 | 685 | |||||
Non-current assets of discontinued operations |
— | 20 | |||||
Other assets |
20 | 22 | |||||
| | | | | | | | |
Total assets |
$ | 5,705 | $ | 6,013 | |||
| | | | | | | | |
| | | | | | | | |
| | | | | | | | |
LIABILITIES AND STOCKHOLDER'S EQUITY |
|||||||
Current liabilities: |
|||||||
Accounts payable |
$ | 532 | $ | 490 | |||
Accrued compensation and benefits |
140 | 142 | |||||
Current installments of long-term debt |
14 | 9 | |||||
Current liabilities of discontinued operations |
— | 30 | |||||
Other current liabilities |
157 | 199 | |||||
| | | | | | | | |
Total current liabilities |
843 | 870 | |||||
| | | | | | | | |
Long-term debt, excluding current installments |
3,798 | 4,302 | |||||
Non-current liabilities of discontinued operations |
— | 1 | |||||
Other liabilities |
106 | 98 | |||||
| | | | | | | | |
Total liabilities |
4,747 | 5,271 | |||||
| | | | | | | | |
Stockholder's equity: |
|||||||
Common stock, par value $0.01; authorized 1,000 shares; issued and outstanding 1,000 shares at January 29, 2017 and January 31, 2016 |
— | — | |||||
Paid-in capital |
3,806 | 3,786 | |||||
Accumulated deficit |
(2,833 | ) | (3,028 | ) | |||
Accumulated other comprehensive loss |
(15 | ) | (16 | ) | |||
| | | | | | | | |
Total stockholder's equity |
958 | 742 | |||||
| | | | | | | | |
Total liabilities and stockholder's equity |
$ | 5,705 | $ | 6,013 | |||
| | | | | | | | |
| | | | | | | | |
| | | | | | | | |
The accompanying notes are an integral part of these consolidated financial statements.
82
HD SUPPLY, INC.
CONSOLIDATED STATEMENTS OF STOCKHOLDER'S EQUITY (DEFICIT)
Amounts in millions
| |
Common Stock |
Paid-in Capital |
Accumulated Deficit |
Accumulated Other Comprehensive Income (Loss)(1) |
Total Equity |
|||||||||||
|---|---|---|---|---|---|---|---|---|---|---|---|---|---|---|---|---|
Balance at February 2, 2014 |
$ | — | $ | 3,750 | $ | (4,503 | ) | $ | (15 | ) | $ | (768 | ) | |||
| | | | | | | | | | | | | | | | | |
Net income |
3 | 3 | ||||||||||||||
Other comprehensive income (loss): |
||||||||||||||||
Foreign currency translation adjustment |
(13 | ) | (13 | ) | ||||||||||||
Stock-based compensation |
17 | 17 | ||||||||||||||
Other |
1 | 1 | ||||||||||||||
| | | | | | | | | | | | | | | | | |
Balance at February 1, 2015 |
$ | — | $ | 3,768 | $ | (4,500 | ) | $ | (28 | ) | $ | (760 | ) | |||
| | | | | | | | | | | | | | | | | |
| | | | | | | | | | | | | | | | | |
| | | | | | | | | | | | | | | | | |
Net income |
1,472 | 1,472 | ||||||||||||||
Other comprehensive income (loss): |
||||||||||||||||
Foreign currency translation adjustment |
12 | 12 | ||||||||||||||
Stock-based compensation |
16 | 16 | ||||||||||||||
Other |
2 | 2 | ||||||||||||||
| | | | | | | | | | | | | | | | | |
Balance at January 31, 2016 |
$ | — | $ | 3,786 | $ | (3,028 | ) | $ | (16 | ) | $ | 742 | ||||
| | | | | | | | | | | | | | | | | |
| | | | | | | | | | | | | | | | | |
| | | | | | | | | | | | | | | | | |
Net income |
196 | 196 | ||||||||||||||
Other comprehensive income (loss): |
||||||||||||||||
Foreign currency translation adjustment |
1 | 1 | ||||||||||||||
Stock-based compensation |
20 | 20 | ||||||||||||||
Other |
(1 | ) | (1 | ) | ||||||||||||
| | | | | | | | | | | | | | | | | |
Balance at January 29, 2017 |
$ | — | $ | 3,806 | $ | (2,833 | ) | $ | (15 | ) | $ | 958 | ||||
| | | | | | | | | | | | | | | | | |
| | | | | | | | | | | | | | | | | |
| | | | | | | | | | | | | | | | | |
- (1)
- Accumulated Other Comprehensive Income (Loss) is comprised of cumulative foreign currency translation adjustments, net.
The accompanying notes are an integral part of these consolidated financial statements.
83
HD SUPPLY, INC.
CONSOLIDATED STATEMENTS OF CASH FLOWS
Amounts in millions
| |
Fiscal Year Ended | |||||||||
|---|---|---|---|---|---|---|---|---|---|---|
| |
January 29, 2017 |
January 31, 2016 |
February 1, 2015 |
|||||||
CASH FLOWS FROM OPERATING ACTIVITIES: |
||||||||||
Net income |
$ | 196 | $ | 1,472 | $ | 3 | ||||
Reconciliation of net income to net cash provided by (used in) operating activities: |
||||||||||
Depreciation and amortization |
102 | 134 | 226 | |||||||
Provision for uncollectibles |
6 | 8 | 7 | |||||||
Non-cash interest expense |
17 | 23 | 25 | |||||||
Payment of discounts upon extinguishment of debt |
(7 | ) | (12 | ) | (1 | ) | ||||
Loss on extinguishment & modification of debt |
179 | 100 | 108 | |||||||
(Gain) loss on sales of businesses, net |
6 | (186 | ) | (8 | ) | |||||
Stock-based compensation expense |
20 | 16 | 17 | |||||||
Deferred income taxes |
129 | (839 | ) | 55 | ||||||
Other |
(11 | ) | (4 | ) | — | |||||
Changes in assets and liabilities, net of the effects of acquisitions & dispositions: |
||||||||||
(Increase) decrease in receivables |
(38 | ) | (63 | ) | (90 | ) | ||||
(Increase) decrease in inventories |
(62 | ) | (38 | ) | (71 | ) | ||||
(Increase) decrease in other current assets |
3 | 11 | 18 | |||||||
(Increase) decrease in other assets |
(2 | ) | — | — | ||||||
Increase (decrease) in accounts payable and accrued liabilities |
(16 | ) | (14 | ) | 1 | |||||
Increase (decrease) in other long-term liabilities |
(9 | ) | (186 | ) | 5 | |||||
| | | | | | | | | | | |
Net cash provided by (used in) operating activities |
513 | 422 | 295 | |||||||
| | | | | | | | | | | |
CASH FLOWS FROM INVESTING ACTIVITIES: |
||||||||||
Capital expenditures |
(81 | ) | (86 | ) | (119 | ) | ||||
Proceeds from sales of property and equipment |
32 | 3 | 5 | |||||||
Proceeds from sales of businesses, net |
28 | 809 | 198 | |||||||
| | | | | | | | | | | |
Net cash provided by (used in) investing activities |
(21 | ) | 726 | 84 | ||||||
| | | | | | | | | | | |
CASH FLOWS FROM FINANCING ACTIVITIES: |
||||||||||
Borrowings of long-term debt |
1,547 | 287 | 1,270 | |||||||
Repayments of long-term debt |
(2,631 | ) | (1,152 | ) | (1,385 | ) | ||||
Borrowings on long-term revolver debt |
689 | 784 | 878 | |||||||
Repayments on long-term revolver debt |
(269 | ) | (880 | ) | (1,142 | ) | ||||
Debt issuance and modification costs |
(19 | ) | (6 | ) | (21 | ) | ||||
Other financing activities |
(3 | ) | 2 | — | ||||||
| | | | | | | | | | | |
Net cash provided by (used in) financing activities |
(686 | ) | (965 | ) | (400 | ) | ||||
| | | | | | | | | | | |
Effect of exchange rates on cash and cash equivalents |
1 | (2 | ) | (5 | ) | |||||
| | | | | | | | | | | |
Increase (decrease) in cash and cash equivalents |
$ | (193 | ) | $ | 181 | $ | (26 | ) | ||
Cash and cash equivalents at beginning of period |
266 | 85 | 111 | |||||||
| | | | | | | | | | | |
Cash and cash equivalents at end of period |
$ | 73 | $ | 266 | $ | 85 | ||||
| | | | | | | | | | | |
| | | | | | | | | | | |
| | | | | | | | | | | |
The accompanying notes are an integral part of these consolidated financial statements.
84
HD SUPPLY HOLDINGS, INC. AND SUBSIDIARIES
HD SUPPLY, INC. AND SUBSIDIARIES
NOTES TO CONSOLIDATED FINANCIAL STATEMENTS
NOTE 1—NATURE OF BUSINESS AND SUMMARY OF SIGNIFICANT ACCOUNTING POLICIES
Nature of Business
HD Supply Holdings, Inc. ("Holdings") indirectly owns all of the outstanding common stock of HD Supply, Inc. ("HDS").
Holdings, together with its direct and indirect subsidiaries, including HDS ("HD Supply" or the "Company"), is one of the largest industrial distribution companies in North America. The Company specializes in three distinct market sectors: Maintenance, Repair & Operations; Infrastructure; and Specialty Construction. Through approximately 500 locations across 48 U.S. states and six Canadian provinces, the Company serves these markets with an integrated go-to-market strategy. HD Supply has approximately 14,000 associates delivering localized, customer-tailored products, services and expertise. The Company serves approximately 530,000 customers, which include contractors, maintenance professionals, home builders, industrial businesses, and government entities. HD Supply's broad range of end-to-end product lines and services includes approximately 845,000 stock-keeping units ("SKUs") of quality, name-brand and proprietary-brand products as well as value-add services supporting the entire life-cycle of a project from infrastructure and construction to maintenance, repair and operations.
HD Supply is managed primarily on a product line basis and reports results of operations in three reportable segments. The reportable segments are Facilities Maintenance, Waterworks, and Construction & Industrial. In addition, the consolidated financial statements include Corporate, which is comprised of enterprise-wide functional departments.
Principles of Consolidation
The consolidated financial statements of HD Supply Holdings, Inc. present the results of operations, financial position and cash flows of HD Supply Holdings, Inc. and its wholly-owned subsidiaries, including HD Supply, Inc. The consolidated financial statements of HD Supply, Inc. present the results of operations, financial position and cash flows of HD Supply, Inc. and its wholly-owned subsidiaries. All material intercompany balances and transactions are eliminated. Results of operations of businesses acquired are included from their respective dates of acquisition. The results of operations of all discontinued operations have been separately reported as discontinued operations for all periods presented.
Fiscal Year
HD Supply's fiscal year is a 52- or 53-week period ending on the Sunday nearest to January 31. Fiscal year ended January 29, 2017 ("fiscal 2016"), fiscal year ended January 31, 2016 ("fiscal 2015"), and fiscal year ended February 1, 2015 ("fiscal 2014") each included 52 weeks.
Estimates
Management has made a number of estimates and assumptions relating to the reporting of assets and liabilities, the disclosure of contingent assets and liabilities, and reported amounts of revenues and expenses in preparing these consolidated financial statements in conformity with accounting principles generally accepted in the United States of America ("GAAP"). Actual results could differ from these estimates.
85
HD SUPPLY HOLDINGS, INC. AND SUBSIDIARIES
HD SUPPLY, INC. AND SUBSIDIARIES
NOTES TO CONSOLIDATED FINANCIAL STATEMENTS (Continued)
NOTE 1—NATURE OF BUSINESS AND SUMMARY OF SIGNIFICANT ACCOUNTING POLICIES (Continued)
Cash and Cash Equivalents
HD Supply considers all highly liquid investments with maturities of three months or less when purchased to be cash equivalents.
Allowance for Doubtful Accounts
Accounts receivable are evaluated for collectability based on numerous factors, including past transaction history with customers, their credit worthiness, and an assessment of lien and bond rights. An allowance for doubtful accounts is estimated as a percentage of aged receivables. This estimate is periodically adjusted when management becomes aware of specific customer's inability to meet its financial obligations (e.g., bankruptcy filing) or as a result of changes in historical collection patterns.
Inventories
Inventories consist primarily of finished goods and are carried at the lower of cost or market. The cost of substantially all inventories is determined by the moving or weighted average cost method. Inventory value is evaluated at each balance sheet date to ensure that it is carried at the lower of cost or market. This evaluation includes an analysis of historical physical inventory results, a review of excess and obsolete inventories based on inventory aging, and anticipated future demand. Periodically, perpetual inventory records are adjusted to reflect declines in net realizable value below inventory carrying cost.
Consideration Received From Vendors
HD Supply enters into agreements with many of its vendors providing for inventory purchase rebates ("vendor rebates") upon achievement of specified volume purchasing levels. Vendor rebates are accrued as part of cost of sales for products sold based on progress towards earning the vendor rebates, taking into consideration cumulative purchases of inventory to date and projected purchases through the end of the year. An estimate of unearned vendor rebates is included in the carrying value of inventory at each period end for vendor rebates recognized on products not yet sold. At January 29, 2017 and January 31, 2016, vendor rebates due to HD Supply were $89 million and $76 million, respectively. These receivables are included in Receivables in the accompanying Consolidated Balance Sheets.
Property and Equipment
Property and equipment are recorded at cost and depreciated using the straight-line method based on the following estimated useful lives of the assets:
Buildings and improvements |
5 - 45 years | |
Transportation equipment |
5 - 7 years | |
Furniture, fixtures and equipment |
2 - 10 years |
86
HD SUPPLY HOLDINGS, INC. AND SUBSIDIARIES
HD SUPPLY, INC. AND SUBSIDIARIES
NOTES TO CONSOLIDATED FINANCIAL STATEMENTS (Continued)
NOTE 1—NATURE OF BUSINESS AND SUMMARY OF SIGNIFICANT ACCOUNTING POLICIES (Continued)
Capitalized Software Costs
HD Supply capitalizes certain software costs, which are being amortized on a straight-line basis over the estimated useful lives of the software, ranging from three to seven years. At January 29, 2017 and January 31, 2016, capitalized software costs totaled $34 million and $40 million, respectively, net of accumulated amortization of $210 million and $186 million, respectively. Amortization of capitalized software costs totaled $27 million, $38 million, and $39 million, in fiscal 2016, fiscal 2015, and fiscal 2014, respectively.
Goodwill
Goodwill represents the excess of purchase price over fair value of net assets acquired. HD Supply does not amortize goodwill, but does assess the recoverability of goodwill on an annual basis or whenever events or circumstances indicate that it is "more likely than not" that the fair value of a reporting unit has dropped below its carrying value. The Company determines the fair values of its identified reporting units using a discounted cash flow ("DCF") analysis and a market comparable method, with each method being equally weighted in the calculation. Determining fair value requires the exercise of significant judgment, including judgment about appropriate discount rates, the amount and timing of expected future cash flows, as well as relevant comparable company earnings multiples for the market comparable approach. There were no goodwill impairment charges recorded in fiscal 2016, fiscal 2015, or fiscal 2014.
Impairment of Long-Lived Assets
Long-lived assets, including property and equipment, are reviewed for possible impairment whenever events or circumstances indicate that the carrying amount of an asset may not be recoverable. To analyze recoverability, undiscounted future cash flows over the remaining life of the asset are projected. If these projected cash flows are less than the carrying amount, an impairment loss is recognized to the extent the fair value of the asset less any costs of disposition is less than the carrying amount of the asset. Judgments regarding the existence of impairment indicators are based on market and operational performance. Evaluating potential impairment also requires estimates of future operating results and cash flows.
Self-Insurance
HD Supply has a high deductible insurance program for most losses related to general liability, product liability, environmental liability, automobile liability, workers' compensation, and is self-insured for medical claims and certain legal claims. The expected ultimate cost for claims incurred as of the balance sheet date is not discounted and is recognized as a liability. Self-insurance losses for claims filed and claims incurred but not reported are accrued based upon estimates of the aggregate liability for uninsured claims using loss development factors and actuarial assumptions followed in the insurance industry and historical loss development experience. At January 29, 2017 and January 31, 2016, reserves totaled approximately $79 million and $84 million, respectively.
87
HD SUPPLY HOLDINGS, INC. AND SUBSIDIARIES
HD SUPPLY, INC. AND SUBSIDIARIES
NOTES TO CONSOLIDATED FINANCIAL STATEMENTS (Continued)
NOTE 1—NATURE OF BUSINESS AND SUMMARY OF SIGNIFICANT ACCOUNTING POLICIES (Continued)
Fair Value of Financial Instruments
The carrying amounts of cash and cash equivalents, accounts receivable and accounts payable, accrued compensation and benefits and other current liabilities approximate fair value due to the short-term nature of these financial instruments. The Company's long-term financial assets and liabilities are recorded at historical costs. See "Note 6, Fair Value Measurements," for information on the fair value of long-term financial instruments.
Revenue Recognition
HD Supply recognizes revenue when persuasive evidence of an agreement exists, delivery has occurred or services have been rendered, the price to the buyer is fixed and determinable and collectability is reasonably assured.
HD Supply ships products to customers by internal fleet and third party carriers. Revenues, net of sales tax and allowances for returns and discounts, are recognized from product sales when title to the products is passed to the customer, which generally occurs at the point of destination for products shipped by internal fleet and at the point of shipping for products shipped by third party carriers. Revenues related to services are recognized in the period the services are performed and totaled $33 million, $30 million, and $23 million in fiscal 2016, fiscal 2015 and fiscal 2014, respectively.
Shipping and Handling Fees and Costs
HD Supply includes shipping and handling fees billed to customers in Net sales. Shipping and handling costs associated with inbound freight are capitalized to inventories and relieved through Cost of sales as inventories are sold. Shipping and handling costs associated with outbound freight are included in Selling, general and administrative expenses and totaled $109 million, $99 million, and $98 million in fiscal 2016, fiscal 2015, and fiscal 2014, respectively.
Concentration of Credit Risk
The majority of HD Supply's sales are credit sales which are made primarily to customers whose ability to pay is dependent, in part, upon the economic strength of industries and the areas where they operate. Concentration of credit risk with respect to trade accounts receivable is limited by the large number of customers comprising HD Supply's customer base. HD Supply performs ongoing credit evaluations of its customers.
Leases
Leases are reviewed for capital or operating classification at their inception under the guidance of Accounting Standards Codification ("ASC") 840, "Leases." The Company uses its incremental borrowing rate in the assessment of lease classification and assumes the initial lease term includes renewal options that are reasonably assured. HD Supply conducts operations primarily under operating leases. For leases classified as operating leases, the Company records rent expense on a straight-line basis, over the lease term beginning with the date the Company has access to the property which in some cases is prior to commencement of lease payments. Accordingly, the amount of rental expense
88
HD SUPPLY HOLDINGS, INC. AND SUBSIDIARIES
HD SUPPLY, INC. AND SUBSIDIARIES
NOTES TO CONSOLIDATED FINANCIAL STATEMENTS (Continued)
NOTE 1—NATURE OF BUSINESS AND SUMMARY OF SIGNIFICANT ACCOUNTING POLICIES (Continued)
recognized in excess of lease payments is recorded as a deferred rent liability and is amortized to rental expense over the remaining term of the lease.
Advertising
Advertising costs are charged to expense as incurred except for the costs of producing and distributing certain direct response sales catalogs, which are capitalized and charged to expense over the life of the related catalog. Advertising expenses were approximately $34 million, $35 million, and $32 million in fiscal 2016, fiscal 2015, and fiscal 2014, respectively. Capitalized advertising costs related to direct response advertising were not material.
Income Taxes
The Company provides for federal, state and foreign income taxes currently payable, as well as for those deferred due to temporary differences between reporting income and expenses for financial statement purposes versus tax purposes. Federal, state and foreign tax benefits are recorded as a reduction of income taxes. Deferred tax assets and liabilities are recognized for the future tax consequences attributable to temporary differences between the financial statement carrying amounts of existing assets and liabilities and their respective tax bases. Deferred tax assets and liabilities are measured using enacted income tax rates expected to apply to taxable income in the years in which those temporary differences are expected to be recovered or settled. The effect of a change in income tax rates is recognized as income or expense in the period that includes the enactment date.
The Company consists of corporations, limited liability companies and partnerships. All income tax expense (benefit) of the Company is recorded in the accompanying Consolidated Statements of Operations and Comprehensive Income (Loss) with the offset recorded through the Company's current tax accounts, deferred tax accounts, or stockholder's equity account as appropriate.
Comprehensive Income (Loss)
Comprehensive income (loss) includes Net income (loss) adjusted for certain revenues, expenses, gains and losses that are excluded from net income under GAAP. Adjustments to net income are for foreign currency translation adjustments.
Foreign Currency Translation
Assets and liabilities of foreign subsidiaries with a functional currency other than the U.S. dollar, primarily Canadian dollars, are translated into U.S. dollars at the current rate of exchange on the last day of the reporting period. Revenues and expenses are translated at a monthly average exchange rate and equity transactions are translated using either the actual exchange rate on the day of the transaction or a monthly average exchange rate.
Stock-Based Compensation
The HD Supply Holdings, Inc. 2013 Omnibus Incentive Plan (the "Plan") provides for stock-based awards to employees, consultants and directors, including stock options, stock purchase rights, restricted
89
HD SUPPLY HOLDINGS, INC. AND SUBSIDIARIES
HD SUPPLY, INC. AND SUBSIDIARIES
NOTES TO CONSOLIDATED FINANCIAL STATEMENTS (Continued)
NOTE 1—NATURE OF BUSINESS AND SUMMARY OF SIGNIFICANT ACCOUNTING POLICIES (Continued)
stock, restricted stock units, deferred stock units, performance shares, performance units, stock appreciation rights, dividend equivalents and other stock-based awards. The Plan replaces and succeeds the HDS Investment Holding, Inc. Stock Incentive Plan, as amended effective April 11, 2011 (the "Stock Incentive Plan"), and, from and after June 26, 2013, no further awards will be made under the Stock Incentive Plan. Both plans are accounted for under ASC 718, "Compensation—Stock Compensation," which requires the recognition of share-based compensation costs in the financial statements. The Company includes these costs in Selling, general and administrative expense in the Consolidated Statements of Operations and Comprehensive Income (Loss).
Recent Accounting Pronouncements
Goodwill—In January 2017, the Financial Accounting Standards Board ("FASB") issued Accounting Standards Update ("ASU") No. 2017-04, "Intangibles—Goodwill and Other (Topic 350): Simplifying the Test for Goodwill Impairment" ("ASU 2017-04"). The new guidance eliminates the requirement to calculate the implied fair value of goodwill to measure a goodwill impairment charge. Instead, entities will record an impairment charge based on the excess of a reporting unit's carrying amount over its fair value. The ASU is effective for annual and interim impairment tests performed in periods beginning after December 15, 2019. Early adoption is permitted for annual and interim goodwill impairment testing dates after January 1, 2017. The amendments in this update should be applied on a prospective basis. The adoption of ASU 2017-04 is not expected to have a material impact on the Company's financial position, results of operations or cash flows.
Statement of Cash Flows—In November 2016, the FASB issued ASU No. 2016-18, "Statement of Cash Flows (Topic 230): Restricted Cash" ("ASU 2016-18"). The new guidance is intended to reduce diversity in practice by adding or clarifying guidance on classification and presentation of changes in restricted cash on the statement of cash flows. ASU 2016-18 is effective for annual and interim periods beginning after December 15, 2017. Early adoption is permitted. The amendments in this update should be applied retrospectively to all periods presented. On a prospective basis, the ASU will only impact the Company to the extent it has restricted cash.
Income Taxes—In October 2016, the FASB issued ASU No. 2016-16, "Income Taxes (Topic 740): Intra-entity Transfers of Assets Other than Inventory" ("ASU 2016-16"). The new guidance is intended to improve the accounting for intra-entity transfers of assets other than inventory by requiring recognition of income tax consequences of intra-entity transfers of assets other than inventory when the transfer occurs. ASU 2016-16 is effective for annual and interim periods beginning after December 15, 2017. Early adoption is permitted. The amendments in this update should be applied on a modified retrospective basis through a cumulative-effect adjustment directly to retained earnings as of the beginning of the period of adoption. The Company is currently evaluating the impact of adopting ASU 2016-16.
Statement of Cash Flows—In August 2016, the FASB issued ASU No. 2016-15, "Statement of Cash Flows (Topic 230): Clarification of Certain Cash Receipts and Cash Payments" ("ASU 2016-15"). The new guidance is intended to reduce diversity in practice related to certain cash receipts and payments in the statement of cash flows by adding or clarifying guidance on eight specific cash flow issues.
90
HD SUPPLY HOLDINGS, INC. AND SUBSIDIARIES
HD SUPPLY, INC. AND SUBSIDIARIES
NOTES TO CONSOLIDATED FINANCIAL STATEMENTS (Continued)
NOTE 1—NATURE OF BUSINESS AND SUMMARY OF SIGNIFICANT ACCOUNTING POLICIES (Continued)
ASU 2016-15 is effective for annual and interim periods beginning after December 15, 2017. Early adoption is permitted. The amendments in this update should be applied retrospectively to all periods presented, unless deemed impracticable, in which case, prospective application is permitted. The adoption of ASU 2016-15 is not expected to have a material impact on the Company's financial position, results of operations or cash flows.
Stock Compensation—In March 2016, the FASB issued ASU No. 2016-09, "Compensation—Stock Compensation (Topic 718): Improvements to Employee Share-Based Payment Accounting" ("ASU 2016-09"). The new guidance identifies areas for simplification involving several aspects of accounting for share-based payment transactions, including the income tax consequences, classification of awards as either equity or liabilities as well as certain classifications on the statement of cash flows. ASU 2016-09 is effective for annual and interim periods beginning after December 15, 2016.
The Company adopted the guidance from this amendment on January 30, 2017 (the first day of fiscal 2017) recording a $56 million cumulative-effect adjustment to retained earnings in order to recognize a deferred tax asset on the excess deduction for stock option exercises over the expense recorded for book purposes. On an ongoing basis, the impact to the Company will be through a credit to charge the tax provision reflecting the difference between the amount deductible for tax purposes and the amount expensed for book purposes as options are exercised.
Leases—In February 2016, the FASB issued ASU No. 2016-02, "Leases (Topic 842)" ("ASU 2016-02"). The new guidance requires companies to recognize all leases as assets and liabilities for the rights and obligations created by leased assets on the consolidated balance sheet. ASU 2016-02 is effective for annual and interim periods beginning after December 15, 2018. Early adoption is permitted. It is to be adopted using a modified retrospective approach. The Company is currently evaluating the impact of adopting ASU 2016-02.
Inventory—In July 2015, the FASB issued ASU No. 2015-11, "Inventory, Simplifying the Measurement of Inventory" ("ASU 2015-11"). The amended guidance requires that inventory be measured at the lower of cost and net realizable value. The amended guidance is limited to inventory measured using the first-in, first-out ("FIFO") or average cost methods and excludes inventory measured using last-in, first-out ("LIFO") or retail inventory methods. ASU 2015-11 is effective for fiscal years, and interim periods, beginning after December 15, 2016. Early adoption is permitted. The adoption of ASU 2015-11 is not expected to have a material impact on the Company's financial position, results of operations or cash flows.
Going Concern—In August 2014, the FASB issued ASU No. 2014-15, "Presentation of Financial Statements—Going Concern (Subtopic 205-40): Disclosure of Uncertainties about an Entity's Ability to Continue as a Going Concern" ("ASU 2014-15"). The amendments in the Update provide guidance about management's responsibility to evaluate whether there is substantial doubt about an entity's ability to continue as a going concern and to provide related footnote disclosures. For each reporting period, management is required to evaluate whether there are conditions or events that raise substantial doubt about a company's ability to continue as a going concern within one year from when the financial statements are issued. The amendments in ASU 2014-15 are effective for annual periods ending after December 15, 2016, and interim periods within annual periods beginning after
91
HD SUPPLY HOLDINGS, INC. AND SUBSIDIARIES
HD SUPPLY, INC. AND SUBSIDIARIES
NOTES TO CONSOLIDATED FINANCIAL STATEMENTS (Continued)
NOTE 1—NATURE OF BUSINESS AND SUMMARY OF SIGNIFICANT ACCOUNTING POLICIES (Continued)
December 15, 2016. The Company adopted the guidance from the amendment in the fourth quarter of fiscal 2016. The adoption did not result in any impact on the Company's financial position, results of operations or cash flows.
Revenue recognition—In May 2014, the FASB issued ASU No. 2014-09, "Revenue from contracts with customers" ("ASU 2014-09"), amended by ASU 2016-10, "Revenue from contracts with customers (Topic 606): Identifying Performance Obligations and Licensing," ASU 2016-12, "Revenue from contracts with customers (Topic 606): Narrow-Scope Improvements and Practical Expedients," and ASU 2016-20, "Technical Corrections and Improvements to Topic 606, Revenue from Contracts with Customers." The amended guidance outlines a single comprehensive revenue model for entities to use in accounting for revenue arising from contracts with customers. The guidance supersedes most current revenue recognition guidance, including industry-specific guidance. The core principle of the revenue model is that "an entity recognizes revenue to depict the transfer of promised goods or services to customers in an amount that reflects the consideration to which the entity expects to be entitled in exchange for those goods or services." The update requires significant additional disclosure about the nature, amount, timing and uncertainty of revenue and cash flows arising from customer contracts, including significant judgments and changes in judgements. Entities have the option of using either a full retrospective or modified approach to adopt the guidance. In July 2015, the FASB provided a one-year delay in the effective date of ASU 2014-09, to be effective for annual reporting periods beginning after December 15, 2017, including interim periods within that reporting period, and a permission to early adopt for interim and annual periods beginning after December 15, 2016.
The Company has performed a review of the new revenue standard and is monitoring the activity of the FASB and the transition resource group as it relates to specific interpretative guidance. The Company is reviewing customer contracts and is in the process of applying the five-step model of the new standard to each contract category identified and will compare the results to current accounting practice. The Company plans to adopt ASU 2014-09, as well as other clarifications and technical guidance issued by the FASB related to this new revenue standard on January 29, 2018 (the first day of fiscal 2018). The Company has not yet determined whether it will adopt the provisions of ASU 2014-09 on a retrospective basis or through a cumulative adjustment to equity.
The new standard could change the amount and timing of revenue and costs under certain arrangement types and could increase the administrative burden on Company operations to properly account for customer contracts and provide the more expansive required disclosures. The Company is currently evaluating the impact of adopting ASU 2014-09, but has not yet determined what effect, if any, the new guidance will have on its financial position, results of operations or cash flows.
NOTE 2—DISCONTINUED OPERATIONS
In May 2016, the Company completed the sale of its Interior Solutions business. Including the final working capital settlement in September 2016, the Company received cash proceeds of approximately $26 million, net of $2 million of transaction costs. As a result of the sale, the Company recorded a $10 million pre-tax loss.
92
HD SUPPLY HOLDINGS, INC. AND SUBSIDIARIES
HD SUPPLY, INC. AND SUBSIDIARIES
NOTES TO CONSOLIDATED FINANCIAL STATEMENTS (Continued)
NOTE 2—DISCONTINUED OPERATIONS (Continued)
In October 2015, the Company completed the sale of its Power Solutions business. Including the final working capital settlement in May 2016, the Company received cash proceeds of approximately $812 million, net of $16 million of transaction costs. As a result of the sale, the Company recorded a $189 million pre-tax gain.
In January 2015, the Company completed the sale of substantially all of the assets of its Hardware Solutions business. The Company received cash proceeds of approximately $198 million, net of $2 million of transaction costs. As a result of the sale, the Company recorded an $8 million pre-tax gain in fiscal 2014.
In January 2014, the Company initiated the disposal of Litemor, a specialty lighting distributor within the Company's HD Supply Canada business. During fiscal 2014, the Company completed the disposal of Litemor through liquidation and branch sales, resulting in a pre-tax loss on disposal of $15 million, which includes cash and non-cash charges.
Summary Financial Information
In accordance with ASC 205-20, "Discontinued Operations" and ASU 2014-08, "Reporting discontinued operations and disclosure of disposals of components of an entity," the results of Interior Solutions, Power Solutions, Hardware Solutions, and Litemor operations and the gains/losses on sales of the businesses are classified as discontinued operations. The presentation of discontinued operations includes revenues and expenses of the discontinued operations and gain/loss on the disposition of businesses, net of tax, as one line item on the Consolidated Statements of Operations and Comprehensive Income (Loss). All Consolidated Statements of Operations and Comprehensive Income (Loss) presented have been revised to reflect this presentation.
93
HD SUPPLY HOLDINGS, INC. AND SUBSIDIARIES
HD SUPPLY, INC. AND SUBSIDIARIES
NOTES TO CONSOLIDATED FINANCIAL STATEMENTS (Continued)
NOTE 2—DISCONTINUED OPERATIONS (Continued)
The following table provides additional detail related to the results of operations of the discontinued operations (amounts in millions):
| |
Fiscal Year Ended | |||||||||
|---|---|---|---|---|---|---|---|---|---|---|
| |
January 29, 2017 |
January 31, 2016 |
February 1, 2015 |
|||||||
Net sales |
$ | 85 | $ | 1,656 | $ | 2,485 | ||||
Cost of sales |
64 | 1,383 | 2,002 | |||||||
| | | | | | | | | | | |
Gross Profit |
21 | 273 | 483 | |||||||
Operating expenses: |
||||||||||
Selling, general and administrative |
24 | 218 | 366 | |||||||
Depreciation and amortization |
1 | 21 | 44 | |||||||
Restructuring |
— | — | 1 | |||||||
| | | | | | | | | | | |
Total operating expenses |
25 | 239 | 411 | |||||||
Operating Income (Loss) |
(4 | ) | 34 | 72 | ||||||
(Gain) loss on disposal of discontinued operations |
6 | (186 | ) | 7 | ||||||
Other (income) expense, net |
— | 1 | (3 | ) | ||||||
| | | | | | | | | | | |
Income (loss) before provision for income taxes |
(10 | ) | 219 | 68 | ||||||
Provision (benefit) for income taxes |
(2 | ) | 73 | 27 | ||||||
| | | | | | | | | | | |
Income (loss) from discontinued operations, net of tax |
$ | (8 | ) | $ | 146 | $ | 41 | |||
| | | | | | | | | | | |
| | | | | | | | | | | |
| | | | | | | | | | | |
94
HD SUPPLY HOLDINGS, INC. AND SUBSIDIARIES
HD SUPPLY, INC. AND SUBSIDIARIES
NOTES TO CONSOLIDATED FINANCIAL STATEMENTS (Continued)
NOTE 2—DISCONTINUED OPERATIONS (Continued)
At January 29, 2017 and January 31, 2016, the carrying amounts of major classes of assets and liabilities of discontinued operations in the Consolidated Balance Sheets were as follows (amounts in millions):
| |
January 29, 2017 |
January 31, 2016 |
|||||
|---|---|---|---|---|---|---|---|
Current assets: |
|||||||
Receivables, less allowance for doubtful accounts of $—and $1 |
$ | — | $ | 31 | |||
Inventories |
— | 12 | |||||
| | | | | | | | |
Total current assets |
— | 43 | |||||
| | | | | | | | |
Intangible assets, net |
— | 3 | |||||
Other non-current assets |
— | 17 | |||||
| | | | | | | | |
Total assets of discontinued operations |
$ | — | $ | 63 | |||
| | | | | | | | |
| | | | | | | | |
| | | | | | | | |
Current Liabilities: |
|||||||
Accounts payable |
$ | — | $ | 19 | |||
Accrued compensation and benefits |
— | 2 | |||||
Other current liabilities |
— | 9 | |||||
| | | | | | | | |
Total current liabilities |
— | 30 | |||||
| | | | | | | | |
Other non-current liabilities |
— | 1 | |||||
| | | | | | | | |
Total liabilities of discontinued operations |
$ | — | $ | 31 | |||
| | | | | | | | |
| | | | | | | | |
| | | | | | | | |
The following table provides additional detail related to the net cash provided by (used in) operating and investing activities of the discontinued operations (amounts in millions):
| |
Fiscal Year Ended | |||||||||
|---|---|---|---|---|---|---|---|---|---|---|
| |
January 29, 2017 |
January 31, 2016 |
February 1, 2015 |
|||||||
Net cash flows provided by (used in) operating activities |
$ | (1 | ) | $ | 5 | $ | 85 | |||
| | | | | | | | | | | |
Cash flows from investing activities: |
||||||||||
Capital expenditures |
— | (4 | ) | (22 | ) | |||||
Proceeds from sales of businesses, net |
28 | 809 | 198 | |||||||
| | | | | | | | | | | |
Net cash flows provided by (used in) investing activities |
$ | 28 | $ | 805 | $ | 176 | ||||
| | | | | | | | | | | |
NOTE 3—RELATED PARTIES
On August 30, 2007, investment funds associated with Clayton, Dubilier & Rice, LLC ("CD&R"), The Carlyle Group ("Carlyle") and Bain Capital Partners, LLC ("Bain", and together with CD&R and Carlyle the "Equity Sponsors") formed Holdings (previously named HDS Investment Holding, Inc.)
95
HD SUPPLY HOLDINGS, INC. AND SUBSIDIARIES
HD SUPPLY, INC. AND SUBSIDIARIES
NOTES TO CONSOLIDATED FINANCIAL STATEMENTS (Continued)
NOTE 3—RELATED PARTIES (Continued)
and entered into a stock purchase agreement with The Home Depot Inc. ("Home Depot") pursuant to which Home Depot agreed to sell to Holdings, or to a wholly-owned subsidiary of Holdings, certain intellectual property and all the outstanding common stock of HDS and the Canadian subsidiary CND Holdings, Inc. On August 30, 2007, through a series of transactions, Holdings' direct wholly-owned subsidiary, HDS Holding Corporation, acquired direct control of HDS through the merger of its wholly-owned subsidiary, HDS Acquisition Corp., with and into HDS and CND Holdings, Inc. Through these transactions (the "2007 Transactions"), Home Depot was paid cash of $8.2 billion and 12.5% of Holdings' then outstanding common stock.
Upon completion of Holdings' secondary public offerings in fiscal 2015 and fiscal 2014, Home Depot and the Equity Sponsors sold all of their remaining original investments in Holdings.
Purchases—HD Supply purchased product from affiliates of Bain for $8 million in fiscal 2015. HD Supply purchased product from affiliates of the Equity Sponsors for approximately $52 million in fiscal 2014. Management believes these transactions were conducted at prices that an unrelated third party would pay.
Sales—In May 2015, an independent Board member of the Company acquired a minority interest in an HD Supply customer. HD Supply sold product to the customer totaling $4 million, $4 million, and $3 million in fiscal 2016, fiscal 2015, and fiscal 2014, respectively. Management believes these transactions were conducted at prices that an unrelated third party would pay.
NOTE 4—GOODWILL AND INTANGIBLE ASSETS
Goodwill
The carrying amount of goodwill by reporting unit is as follows (amounts in millions):
| |
As of January 29, 2017 | As of January 31, 2016 | |||||||||||||||||
|---|---|---|---|---|---|---|---|---|---|---|---|---|---|---|---|---|---|---|---|
| |
Gross Goodwill |
Accumulated Impairments |
Net Goodwill |
Gross Goodwill |
Accumulated Impairments |
Net Goodwill |
|||||||||||||
Facilities Maintenance |
$ | 1,603 | $ | — | $ | 1,603 | $ | 1,603 | $ | — | $ | 1,603 | |||||||
Waterworks |
1,877 | (815 | ) | 1,062 | 1,877 | (815 | ) | 1,062 | |||||||||||
Construction & Industrial |
183 | (74 | ) | 109 | 183 | (74 | ) | 109 | |||||||||||
Home Improvement Solutions |
125 | (30 | ) | 95 | 125 | (30 | ) | 95 | |||||||||||
| | | | | | | | | | | | | | | | | | | | |
Total goodwill |
$ | 3,788 | $ | (919 | ) | $ | 2,869 | $ | 3,788 | $ | (919 | ) | $ | 2,869 | |||||
| | | | | | | | | | | | | | | | | | | | |
| | | | | | | | | | | | | | | | | | | | |
| | | | | | | | | | | | | | | | | | | | |
Goodwill represents the excess of purchase price over fair value of net assets acquired. HD Supply does not amortize goodwill, but does assess the recoverability of goodwill on an annual basis, in the fourth quarter of each fiscal year. If an event occurs or circumstances change that would more likely than not reduce the fair value of a reporting unit below its carrying value, an interim impairment test would be performed between annual tests.
HD Supply performed the annual goodwill impairment testing during the fourth quarter of fiscal 2016 (as of October 30, 2016). There was no indication of impairment in any of the Company's reporting units in the fiscal 2016 annual test or in the fiscal 2015 and fiscal 2014 annual tests. The
96
HD SUPPLY HOLDINGS, INC. AND SUBSIDIARIES
HD SUPPLY, INC. AND SUBSIDIARIES
NOTES TO CONSOLIDATED FINANCIAL STATEMENTS (Continued)
NOTE 4—GOODWILL AND INTANGIBLE ASSETS (Continued)
Company's analysis was based, in part, on HD Supply's expectation of future market conditions for each of the reporting units, as well as, discount rates that would be used by market participants in an arms-length transaction. Future events could cause the Company to conclude that market conditions have declined to the extent that the Company's goodwill could be impaired.
Intangible Assets
HD Supply's intangible assets as of January 29, 2017 and January 31, 2016 consisted of the following (amounts in millions):
| |
As of January 29, 2017 | As of January 31, 2016 | |||||||||||||||||
|---|---|---|---|---|---|---|---|---|---|---|---|---|---|---|---|---|---|---|---|
| |
Gross Intangible |
Accumulated Amortization |
Net Intangible |
Gross Intangible |
Accumulated Amortization |
Net Intangible |
|||||||||||||
Customer relationships |
$ | 67 | $ | (28 | ) | $ | 39 | $ | 69 | $ | (24 | ) | $ | 45 | |||||
Trade names |
141 | (68 | ) | 73 | 142 | (60 | ) | 82 | |||||||||||
Other |
1 | (1 | ) | — | 2 | (2 | ) | — | |||||||||||
| | | | | | | | | | | | | | | | | | | | |
Total |
$ | 209 | $ | (97 | ) | $ | 112 | $ | 213 | $ | (86 | ) | $ | 127 | |||||
| | | | | | | | | | | | | | | | | | | | |
| | | | | | | | | | | | | | | | | | | | |
| | | | | | | | | | | | | | | | | | | | |
During fiscal 2016, the Company wrote-off approximately $3 million of gross, fully amortized intangible assets.
Amortization expense for continuing operations related to intangible assets was $14 million, $15 million, and $80 million, in fiscal 2016, fiscal 2015, and fiscal 2014, respectively. Estimated future amortization expense for continuing operations for intangible assets recorded as of January 29, 2017 is $13 million each year for fiscal years 2017 through 2021.
NOTE 5—DEBT
On January 26, 2017, HDS used cash and available borrowings under its Senior ABL Facility, to repay $200 million aggregate principal of its Term B-1 Loans, as defined below. As a result, the Company incurred a $5 million loss on extinguishment of debt, which includes write-offs of $2 million and $3 million of unamortized original issue discount and unamortized deferred financing costs, respectively, in accordance with ASC 470-50, "Debt—Modifications and Extinguishments."
On October 14, 2016, HDS entered into a Fourth Amendment (the "Fourth Amendment") to the credit agreement governing its existing Term Loan Facility, as defined below. Pursuant to the Fourth Amendment, HDS amended its existing Term Loan Facility to, among other things, (i) eliminate its London Interbank Offered Rate ("LIBOR") floor by means of a replacement tranche that replaced all of the Company's outstanding term loans in an aggregate principal amount of approximately $842 million (the "Term B-1 Loans") and (ii) issue a new tranche of term loans in an aggregate principal amount of $550 million (the "Term B-2 Loans").
Pursuant to the Fourth Amendment, the Term B-1 Loans bear interest at the applicable margin for borrowings of 2.75% for LIBOR borrowings and 1.75% for base rate borrowings, with no LIBOR floor. The Term B-1 Loans amortize in equal quarterly installments in aggregate annual amounts equal to
97
HD SUPPLY HOLDINGS, INC. AND SUBSIDIARIES
HD SUPPLY, INC. AND SUBSIDIARIES
NOTES TO CONSOLIDATED FINANCIAL STATEMENTS (Continued)
NOTE 5—DEBT (Continued)
1.00% of the original principal amount of the replaced tranche with the balance payable on the maturity date, August 13, 2021.
The Term B-2 Loans bear interest at the applicable margin for borrowings of 2.75% for LIBOR borrowings and 1.75% for base rate borrowings, with no LIBOR floor. The Term Loan Facility allows for a reduction in the applicable margin on the Term B-2 Loans from 2.75% per annum to 2.50% per annum upon the Company reaching a consolidated total leverage ratio, as defined in the agreement, of 3.0x or less. The Term B-2 Loans will amortize in equal quarterly installments in aggregate annual amounts equal to 1.00% of the original principal amount and will mature on October 17, 2023.
On October 17, 2016, HDS used the proceeds from the Term B-2 Loans, together with available cash and available borrowings under its Senior ABL Facility, to redeem all of the outstanding $1,275 million aggregate principal of its 7.5% Senior Unsecured Notes due 2020 (the "February 2013 Senior Unsecured Notes"), and pay a $48 million premium in accordance with the terms of the indenture governing such notes. As a result, the Company incurred a $59 million loss on extinguishment of debt, which includes the $48 million premium and write-off of $11 million of unamortized deferred financing costs, in accordance with ASC 470-50, "Debt—Modifications and Extinguishments."
On April 11, 2016, HDS issued $1,000 million of 5.75% Senior Unsecured Notes due 2024 (the "April 2016 Senior Unsecured Notes") at par. HDS received approximately $985 million, net of transaction fees. The transaction fees of $15 million are reflected as deferred financing costs on the Consolidated Balance Sheets and will be amortized into interest expense over the term of the notes.
On April 27, 2016, HDS used the net proceeds from the April 2016 Senior Unsecured Notes issuance, together with available cash, to redeem all of the outstanding $1,000 million aggregate principal of its 11.5% Senior Unsecured Notes due 2020 (the "October 2012 Senior Unsecured Notes"), and pay a $106 million make-whole premium calculated in accordance with the terms of the indenture governing such notes and pay $4 million of accrued but unpaid interest to the redemption date. As a result, the Company incurred a $115 million loss on extinguishment of debt, which includes the $106 million make-whole premium and the write-off of $9 million of unamortized deferred financing costs, in accordance with ASC 470-50, "Debt—Modifications and Extinguishments."
98
HD SUPPLY HOLDINGS, INC. AND SUBSIDIARIES
HD SUPPLY, INC. AND SUBSIDIARIES
NOTES TO CONSOLIDATED FINANCIAL STATEMENTS (Continued)
NOTE 5—DEBT (Continued)
HDS's long-term debt as of January 29, 2017 and January 31, 2016 consisted of the following (dollars in millions):
| |
January 29, 2017 | January 31, 2016 | |||||||||||
|---|---|---|---|---|---|---|---|---|---|---|---|---|---|
| |
Outstanding Principal |
Interest Rate %(1) |
Outstanding Principal |
Interest Rate %(1) |
|||||||||
Senior ABL Facility due 2018 |
$ | 421 | 2.38 | $ | — | — | |||||||
Term Loans due 2021 |
— | — | 848 | 3.75 | |||||||||
Term B-1 Loans due 2021 |
639 | 3.75 | — | — | |||||||||
Term B-2 Loans due 2023 |
549 | 3.75 | — | — | |||||||||
December 2014 First Priority Notes due 2021 |
1,250 | 5.25 | 1,250 | 5.25 | |||||||||
April 2016 Senior Unsecured Notes due 2024 |
1,000 | 5.75 | — | — | |||||||||
October 2012 Senior Unsecured Notes due 2020 |
— | — | 1,000 | 11.50 | |||||||||
February 2013 Senior Unsecured Notes due 2020 |
— | — | 1,275 | 7.50 | |||||||||
| | | | | | | | | | | | | | |
Total gross long-term debt |
$ | 3,859 | $ | 4,373 | |||||||||
| | | | | | | | | | | | | | |
Less unamortized discount |
(9 | ) | (11 | ) | |||||||||
Less unamortized deferred financing costs |
(38 | ) | (51 | ) | |||||||||
| | | | | | | | | | | | | | |
Total net long-term debt |
$ | 3,812 | $ | 4,311 | |||||||||
Less current installments |
(14 | ) | (9 | ) | |||||||||
| | | | | | | | | | | | | | |
Total net long-term debt, excluding current installments |
$ | 3,798 | $ | 4,302 | |||||||||
| | | | | | | | | | | | | | |
| | | | | | | | | | | | | | |
| | | | | | | | | | | | | | |
- (1)
- Represents the stated rate of interest, without including the effect of discounts or premiums.
Senior Credit Facilities
Asset Based Lending Facility
The Senior ABL Facility provides for senior secured revolving loans and letters of credit of up to a maximum aggregate principal amount of $1,500 million (subject to availability under a borrowing base). Extensions of credit under the Senior ABL Facility will be limited by a borrowing base calculated periodically based on specified percentages of the value of eligible inventory and eligible accounts receivable, subject to certain reserves and other adjustments. As of January 29, 2017, HDS had $680 million of additional available borrowings under the Senior ABL Facility (after giving effect to the borrowing base limitations and approximately $30 million in letters of credit issued and including $26 million of borrowings available on qualifying cash balances). Of the approximately $421 million borrowed on the Senior ABL Facility as of January 29, 2017, approximately $61 million represents Canadian borrowings with the remainder in the U.S.
99
HD SUPPLY HOLDINGS, INC. AND SUBSIDIARIES
HD SUPPLY, INC. AND SUBSIDIARIES
NOTES TO CONSOLIDATED FINANCIAL STATEMENTS (Continued)
NOTE 5—DEBT (Continued)
A portion of the Senior ABL Facility is available for letters of credit and swingline loans. The Senior ABL Facility also includes a sub-facility for loans and letters of credit in Canadian dollars. The Senior ABL Facility also permits HDS to add one or more incremental term loans, revolving or letter of credit facilities to be included in the Senior ABL Facility up to an aggregate maximum amount of $1,900 million for the total commitments under the Senior ABL Facility (including all incremental commitments).
At HDS's option, the interest rates applicable to the loans under the Senior ABL Facility are based (i) in the case of U.S. dollar-denominated loans, either at LIBOR plus an applicable margin or Prime Rate plus an applicable margin and (ii) in the case of Canadian dollar-denominated loans, either the banker's acceptance ("BA") rate plus an applicable margin or the Canadian Prime Rate plus an applicable margin. The margins applicable for each elected interest rate are subject to a pricing grid, as defined in the Senior ABL Facility agreement, based on average excess availability for the previous fiscal quarter. The Senior ABL Facility also contains a letter of credit fee computed at a rate per annum equal to the Applicable Margin (as defined in the agreement) then in effect for LIBOR Loans and an unused commitment fee subject to a pricing grid, as included in the Senior ABL Facility agreement, based on the Average Daily Used Percentage (as defined in the agreement).
The Senior ABL Facility will mature on June 28, 2018, unless the individual applicable lenders agree to extend the maturity of their respective loans under the Senior ABL Facility upon HDS's request and without the consent of any other applicable lender.
Prepayments
The Senior ABL Facility may be prepaid at HDS's option at any time without premium or penalty and will be subject to mandatory prepayment if the outstanding Senior ABL Facility exceeds either the aggregate commitments with respect thereto or the current borrowing base, in an amount equal to such excess. Mandatory prepayments do not result in a permanent reduction of the lenders' commitments under the Senior ABL Facility.
Guarantees; Security
The Senior ABL Facility is senior secured indebtedness of HDS and ranks equal in right of payment with all of HDS's existing and future senior indebtedness and senior in right of payment to all of HDS's existing and future subordinated indebtedness.
HDS, and at HDS's option, certain of HDS's subsidiaries, including HD Supply Canada, Inc., a Canadian subsidiary (the "Canadian Borrower"), are the borrowers under the Senior ABL Facility. Each of HDS's existing and future direct and indirect wholly owned domestic subsidiaries, in each case to the extent permitted by applicable law, regulation and contractual provision and subject to certain exceptions (the "Subsidiary Guarantors") guarantees HDS's payment obligations under the Senior ABL Facility (and, in the case of Canadian obligations, each existing and future direct and indirect wholly owned Canadian subsidiary, in each case to the extent permitted by applicable law, regulation and contractual provision and subject to certain exceptions (the "Canadian Guarantors") guarantee the Canadian Borrower's payment obligations under the Senior ABL Facility).
100
HD SUPPLY HOLDINGS, INC. AND SUBSIDIARIES
HD SUPPLY, INC. AND SUBSIDIARIES
NOTES TO CONSOLIDATED FINANCIAL STATEMENTS (Continued)
NOTE 5—DEBT (Continued)
HDS's obligations under the Senior ABL Facility and the guarantees thereof are secured in favor of the U.S. ABL collateral agent (i) on a first-priority basis by substantially all accounts receivable, inventory and other related assets owned by HDS and each Subsidiary Guarantor and all proceeds thereof, in each case to the extent permitted by applicable law and subject to certain exceptions (the "ABL Priority Collateral"), subject to permitted liens, and (ii) (x) all of the capital stock of HDS, all capital stock of all domestic subsidiaries directly owned by HDS and the Subsidiary Guarantors and 65% of the capital stock of any foreign subsidiary held directly by HDS or any Subsidiary Guarantor (with foreign subsidiary holding companies being deemed foreign subsidiaries) and (y) substantially all tangible and intangible assets owned by HDS and each Subsidiary Guarantor, other than the ABL Priority Collateral, and all proceeds thereof, in each case to the extent permitted by applicable law and subject to certain exceptions (the "Cash Flow Priority Collateral" and, together with the ABL Priority Collateral, the "Collateral"); in each case, subject to the priority of liens among the Term Loan Facility (as defined below), the December 2014 First Priority Notes (as defined below), and the Senior ABL Facility.
The Canadian obligations under the Senior ABL Facility are also secured by liens on substantially all assets of the Canadian Borrower and the Canadian Guarantors, subject to certain exceptions.
Covenants
The Senior ABL Facility contains a number of covenants that, among other things, limit or restrict HDS's ability and, in certain cases, HDS's subsidiaries to make acquisitions, mergers, consolidations, dividends, and to prepay certain indebtedness (including the December 2014 First Priority Notes), in each case to the extent any such transaction would reduce availability under the Senior ABL Facility below a specified amount.
In addition, if HDS's specified excess availability (including an amount by which HDS's borrowing base exceeds the existing commitments) under the Senior ABL Facility falls below the greater of $150 million and 10% of the aggregate commitments (a "Liquidity Event"), HDS will be required to maintain a Fixed Charge Coverage Ratio of at least 1.0:1.0, as defined in the credit agreement governing the Senior ABL Facility.
The Senior ABL Facility also contains certain affirmative covenants, including financial and other reporting requirements. HDS is in compliance with all such covenants.
Senior Secured Term Loan Facility
The Term Loan Facility consists of a senior secured term loan facility (the "Term Loan Facility"; the term loans thereunder, the "Term Loans") providing for Term Loans in an original aggregate principal amount of $1,392 million, comprised of two tranches, Term B-1 Loans and Term B-2 Loans, with original aggregate principal amounts of $842 million and $550 million, respectively. Term B-1 Loans will mature on August 13, 2021 (the "Term B-1 Loans Maturity Date") and Term B-2 Loans will mature on October 17, 2023 (the "Term B-2 Loans Maturity Date"). Both Term B-1 Loans and Term B-2 Loans amortize in equal quarterly installments in aggregate principal amounts equal to 1.00% of the original principal amount of the Term Loans with the balances payable on their respective Maturity Dates. Both Term B-1 Loans and Term B-2 Loans bear interest at the applicable margin for borrowings
101
HD SUPPLY HOLDINGS, INC. AND SUBSIDIARIES
HD SUPPLY, INC. AND SUBSIDIARIES
NOTES TO CONSOLIDATED FINANCIAL STATEMENTS (Continued)
NOTE 5—DEBT (Continued)
of 2.75% for LIBOR borrowings and 1.75% for base rate borrowings. The Term Loan Facility allows for a reduction to the applicable margin on the Term B-2 Loans from 2.75% per annum to 2.50% per annum upon the Company reaching a consolidated total leverage ratio of 3.0x or less.
In accordance with the Fourth Amendment, annual excess cash flow ("ECF") provisions are applicable beginning with the fiscal year ending on January 28, 2018 (fiscal 2017) and each fiscal year thereafter. The ECF provision is not applicable to fiscal 2016.
During the first quarter of fiscal 2015 and in accordance with the annual ECF provisions of the Term Loan Facility prior to the Fourth Amendment, the Company offered a prepayment of $34 million based on the ECF calculation for fiscal 2014. The lenders of the Term Loan Facility accepted $16 million, which the Company paid on March 30, 2015.
The Term Loan Facility is senior secured indebtedness of HDS and ranks equal in right of payment with all of HDS's existing and future senior indebtedness and senior in right of payment to all of HDS's existing and future subordinated indebtedness.
The Term Loan Facility is guaranteed, on a senior secured basis, by the Subsidiary Guarantors. These guarantees are subject to release under customary circumstances. The guarantee of each Subsidiary Guarantor is a senior secured obligation of that Subsidiary Guarantor and ranks equal in right of payment with all existing and future senior indebtedness of that Subsidiary Guarantor and senior in right of payment to all existing and future subordinated indebtedness of such Subsidiary Guarantor.
Collateral
The Term Loan Facility and the related guarantees are secured by a first-priority security interest in substantially all of the tangible and intangible assets of HDS and the Subsidiary Guarantors (other than the ABL Priority Collateral, in which the Term Loan Facility and the related guarantees have a second priority security interest), including pledges of all Capital Stock of the Restricted Subsidiaries directly owned by HDS and the Subsidiary Guarantors (but only up to 65% of each series of Capital Stock of each direct Foreign Subsidiary owned by HDS or any Subsidiary Guarantor), subject to certain thresholds, exceptions and permitted liens, and excluding any Excluded Assets (as defined in the credit agreement governing the Term Loan Facility (the "Term Loan Credit Agreement")) and Excluded Subsidiary Securities (as defined in the Term Loan Credit Agreement) (the "Cash Flow Priority Collateral"), subject to permitted liens. In addition, the Term Loan Facility and the related guarantees are secured by a second-priority security interest in the ABL Priority Collateral, subject to permitted liens.
Prepayment
Term B-1 Loans may be prepaid at any time without premium or penalty. Term B-2 Loans may be prepaid at any time during the first six months after October 14, 2016 subject to a prepayment penalty of 1% of the aggregate principal amount outstanding and may be prepaid at any time after the first six months after October 14, 2016 without premium or penalty. Under certain circumstances and subject to
102
HD SUPPLY HOLDINGS, INC. AND SUBSIDIARIES
HD SUPPLY, INC. AND SUBSIDIARIES
NOTES TO CONSOLIDATED FINANCIAL STATEMENTS (Continued)
NOTE 5—DEBT (Continued)
certain exceptions, the Term Loan Facility will be subject to mandatory prepayment in an amount equal to:
- •
- 100% of the net proceeds (other than those that are used to purchase certain assets or to repay certain other indebtedness) of certain asset
sales and certain insurance recovery events; and
- •
- 50% of annual excess cash flow for any fiscal year, such percentage to decrease to 0% depending on the attainment of certain secured leverage ratio targets.
Guarantee
HDS is the borrower under the Term Loan Facility. The Subsidiary Guarantors guarantee HDS's payment obligations under the Term Loan Facility.
HDS's obligations under the Term Loan Facility and the guarantees thereof are secured in favor of the collateral agent by (i) all of the capital stock of HDS, all capital stock of all domestic subsidiaries directly owned by HDS and the Subsidiary Guarantors and 65% of the capital stock of any foreign subsidiary owned directly by HDS or any Subsidiary Guarantors (it being understood that a foreign subsidiary holding company will be deemed a foreign subsidiary) and (ii) substantially all other tangible and intangible assets owned by HDS and each Subsidiary Guarantor, in each case to the extent permitted by applicable law and subject to certain exceptions and subject to the priority of liens between the Term Loan Facility, the December 2014 First Priority Notes, and the Senior ABL Facility.
Covenants
The Term Loan Facility contains a number of covenants that, among other things, limit the ability of HDS and its restricted subsidiaries, as described in the Term Loan Credit Agreement, to: incur more indebtedness; pay dividends, redeem stock or make other distributions; make investments; create restrictions on the ability of HDS's restricted subsidiaries to pay dividends to HDS or make other intercompany transfers; create liens securing indebtedness; transfer or sell assets; merge or consolidate; enter into certain transactions with HDS's affiliates; and prepay or amend the terms of certain indebtedness.
The Term Loan Facility also contains certain affirmative covenants, including financial and other reporting requirements. HDS is in compliance with all such covenants.
Events of Default under the Senior ABL Facility and Term Loan Facility
The Senior ABL Facility and Term Loan Facility also provide for customary events of default, including non-payment of principal, interest or fees, violation of covenants, material inaccuracy of representations or warranties, specified cross default and cross acceleration to other material indebtedness, certain bankruptcy events, certain ERISA events, material invalidity of guarantees or security interest, material judgments and changes of control.
103
HD SUPPLY HOLDINGS, INC. AND SUBSIDIARIES
HD SUPPLY, INC. AND SUBSIDIARIES
NOTES TO CONSOLIDATED FINANCIAL STATEMENTS (Continued)
NOTE 5—DEBT (Continued)
Secured Notes
5.25% Senior Secured First Priority Notes due 2021
HDS issued $1,250 million of 5.25% Senior Secured First Priority Notes ("December 2014 First Priority Notes") due 2021 under an Indenture, dated December 4, 2014 (the "December 2014 First Priority Indenture") among HDS, the Subsidiary Guarantors, the Trustee, and the Note Collateral Agent. The December 2014 First Priority Notes bear interest at a rate of 5.25% per annum and will mature on December 15, 2021. Interest is paid semi-annually in arrears on June 15th and December 15th of each year.
The December 2014 First Priority Indenture and the applicable collateral documents provide that any capital stock and other securities of any of HDS's subsidiaries will be excluded from the collateral to the extent the pledge of such capital stock or other securities to secure the December 2014 First Priority Notes would cause such subsidiary to be required to file separate financial statements with the SEC pursuant to Rule 3-16 of Regulation S-X (as in effect from time to time).
The December 2014 First Priority Notes are senior secured indebtedness of HDS and rank equal in right of payment with all of HDS's existing and future senior indebtedness and senior in right of payment to all of HDS's existing and future subordinated indebtedness.
The December 2014 First Priority Notes are guaranteed, on a senior secured basis, by each of HDS's Wholly Owned Domestic Subsidiaries (as defined in the December 2014 First Priority Indenture) (other than an Excluded Subsidiary (as defined in the December 2014 First Priority Indenture)), and each other Domestic Subsidiary (as defined in the December 2014 First Priority Indenture) that is a borrower under the Senior ABL Facility or that guarantees payment of HDS's indebtedness under any Credit Facility or Capital Markets Securities (each as defined in the December 2014 First Priority Indenture). The guarantees are subject to release under customary circumstances as stipulated in the December 2014 First Priority Indenture.
Collateral
The December 2014 First Priority Notes and the related guarantees are secured by a first priority security interest in the Cash Flow Priority Collateral.
In addition, the December 2014 First Priority Notes and the related guarantees are secured by a second priority security interest in the ABL Priority Collateral.
The security interests in the Collateral may be released without the consent of the holders of the December 2014 First Priority Notes if Collateral is disposed of in a transaction that complies with the December 2014 First Priority Indenture and security documents, and will be released: (i) so long as any ABL Obligations are outstanding, with respect to the ABL Priority Collateral, upon the release of all liens thereon securing the ABL Obligations (as defined in the December 2014 First Priority Indenture) and (ii) so long as any Term Obligations are outstanding, with respect to the Cash Flow Priority Collateral, upon the release of all liens thereon securing the Term Obligations (as defined in the December 2014 First Priority Indenture).
104
HD SUPPLY HOLDINGS, INC. AND SUBSIDIARIES
HD SUPPLY, INC. AND SUBSIDIARIES
NOTES TO CONSOLIDATED FINANCIAL STATEMENTS (Continued)
NOTE 5—DEBT (Continued)
Redemption
HDS may redeem the December 2014 First Priority Notes, in whole or in part, at any time after December 15, 2017, at the applicable redemption price set forth below (expressed as a percentage of principal amount), plus accrued and unpaid interest, if any, to the relevant redemption date, if redeemed during the 12-month period commencing on December 15 of the year set forth below.
Year
|
Percentage | |||
|---|---|---|---|---|
2017 |
103.398 | % | ||
2018 |
102.625 | % | ||
2019 |
101.313 | % | ||
2020 and thereafter |
100.000 | % | ||
Unsecured Notes
5.75% Senior Unsecured Notes due 2024
HDS issued $1,000 aggregate principal amount of April 2016 Senior Unsecured Notes under an Indenture, dated as of April 11, 2016 ("April 2016 Senior Unsecured Notes Indenture") among HDS, certain subsidiaries of HDS as guarantors and the Trustee. The April 2016 Senior Unsecured Notes bear interest at a rate of 5.75% per annum and will mature on April 15, 2024. Interest is paid semi-annually on April 15th and October 15th of each year.
The April 2016 Senior Unsecured Notes are unsecured senior indebtedness of HDS and rank equal in right of payment with all of HDS's existing and future senior indebtedness, senior in right of payment to all of HDS's existing and future subordinated indebtedness, and effectively subordinated to all of HDS's existing and future indebtedness, including, without limitation, indebtedness under the Senior Credit Facilities and December 2014 First Priority Notes, to the extent of the value of the collateral securing each indebtedness.
The April 2016 Senior Unsecured Notes are guaranteed, on a senior unsecured basis, by each of HDS's direct and indirect domestic existing and future subsidiaries that is a wholly owned domestic subsidiary (other than certain excluded subsidiaries), and by each other domestic subsidiary that is a borrower under the Senior ABL Facility or that guarantees HDS's obligations under any credit facility or capital markets securities. These guarantees are subject to release under customary circumstances as stipulated in the April 2016 Senior Unsecured Notes Indenture.
Redemption
HDS may redeem the April 2016 Senior Unsecured Notes, in whole or in part, at any time (1) prior to April 15, 2019, at a price equal to 100% of the principal amount thereof, plus accrued and unpaid interest, if any, to the redemption date, plus the applicable make-whole premium set forth in the April 2016 Senior Unsecured Notes Indenture and (2) on or after April 15, 2019, at the applicable redemption price set forth below (expressed as a percentage of principal amount), plus accrued and
105
HD SUPPLY HOLDINGS, INC. AND SUBSIDIARIES
HD SUPPLY, INC. AND SUBSIDIARIES
NOTES TO CONSOLIDATED FINANCIAL STATEMENTS (Continued)
NOTE 5—DEBT (Continued)
unpaid interest, if any, to the relevant redemption date, if redeemed during the 12-month period commencing on April 15 of the year set forth below.
Year
|
Percentage | |||
|---|---|---|---|---|
2019 |
104.313 | % | ||
2020 |
102.875 | % | ||
2021 |
101.438 | % | ||
2022 and thereafter |
100.000 | % | ||
In addition, at any time prior to April 15, 2019, HDS may redeem on one or more occasions up to 40% of the aggregate principal amount of the April 2016 Senior Unsecured Notes with the proceeds of certain equity offerings at a redemption price of 105.75% of the principal amount in respect of the April 2016 Senior Unsecured Notes being redeemed, plus accrued and unpaid interest to the redemption date, provided, however, that if the April 2016 Senior Unsecured Notes are redeemed, an aggregate principal amount of April 2016 Senior Unsecured Notes equal to at least 50% of the original aggregate principal amount of April 2016 Senior Unsecured Notes must remain outstanding immediately after each such redemption of April 2016 Senior Unsecured Notes.
11.5% Senior Unsecured Notes due 2020
HDS's October 2012 Senior Unsecured Notes bore interest at 11.5% per annum with a maturity date of July 15, 2020. Interest was paid semi-annually in arrears on April 15th and October 15th of each year, prior to the April 27, 2016 redemption of all the outstanding $1,000 million aggregate principal amount of the October 2012 Senior Unsecured Notes.
7.5% Senior Unsecured Notes due 2020
HDS's February 2013 Senior Unsecured Notes bore interest at 7.5% per annum with a maturity date of July 15, 2020. Interest was paid semi-annually in arrears on April 15th and October 15th of each year, prior to the redemption on October 17, 2016 of all the outstanding $1,275 million aggregate principal of the February 2013 Senior Unsecured Notes.
December 2014 First Priority Notes
Offer to Repurchase
In the event of certain events that constitute a Change of Control (as defined in the December 2014 First Priority Indenture, HDS must offer to repurchase all of the December 2014 First Priority Notes (unless otherwise redeemed) at a price equal to 101% of their principal amount, plus accrued and unpaid interest, if any, to the repurchase date. If HDS sells assets under certain circumstances, HDS must use the proceeds to make an offer to purchase the Senior Notes at a price equal to 100% of their principal amount, plus accrued and unpaid interest, if any, to the date of purchase.
Covenants
The December 2014 First Priority Indenture contains covenants that, among other things, limit the ability of HDS and its restricted subsidiaries to: incur more indebtedness; pay dividends, redeem stock
106
HD SUPPLY HOLDINGS, INC. AND SUBSIDIARIES
HD SUPPLY, INC. AND SUBSIDIARIES
NOTES TO CONSOLIDATED FINANCIAL STATEMENTS (Continued)
NOTE 5—DEBT (Continued)
or make other distributions; make investments; create restrictions on the ability of HDS's restricted subsidiaries to pay dividends to HDS or make other intercompany transfers; create liens securing indebtedness; transfer or sell assets; merge or consolidate; and enter into certain transactions with HDS's affiliates. Most of these covenants will cease to apply for so long as the December 2014 First Priority Notes have investment grade ratings from both Moody's Investment Services, Inc. and Standard & Poor's. HDS is in compliance with all such covenants.
Events of Default
The December 2014 First Priority Indenture also provides for events of default, which, if any of them occurs, would permit or require the principal, premium, if any, interest and other monetary obligations on all the then outstanding December 2014 First Priority Notes to be due and payable immediately. The December 2014 First Priority Indenture also provides for specified cross default and cross acceleration to other material indebtedness.
Debt Maturities
Maturities of long-term debt outstanding, in principal amounts, at January 29, 2017 are summarized below (amounts in millions):
| |
Fiscal Year | |
|
|||||||||||||||||||
|---|---|---|---|---|---|---|---|---|---|---|---|---|---|---|---|---|---|---|---|---|---|---|
| |
2017 | 2018 | 2019 | 2020 | 2021 | Thereafter | Total | |||||||||||||||
Principal maturities |
$ | 14 | $ | 435 | $ | 14 | $ | 14 | $ | 1,861 | $ | 1,521 | $ | 3,859 | ||||||||
Fiscal 2015 and Fiscal 2014 Transactions
On October 13, 2015, HDS used proceeds from the sale of the Power Solutions business unit to redeem all of the outstanding $675 million aggregate principal amount of its 11% Senior Secured Second Priority Notes due 2020 (the "April 2012 Second Priority Notes") and paid a $72 million make-whole premium calculated in accordance with the terms of the indenture governing such notes and $37 million of accrued but unpaid interest to the redemption date. As a result, the Company recorded an $80 million loss on extinguishment of debt, which includes the $72 million make-whole premium and the write-off of $8 million of unamortized deferred financing costs, in accordance with ASC 470-50, "Debt—Modifications and Extinguishments."
On August 13, 2015, HDS entered into an incremental amendment (the "Incremental Agreement") to the credit agreement governing its Term Loan Facility, as defined above, pursuant to which HDS requested a borrowing of a new $850 million tranche of senior secured term loans, the proceeds of which, together with cash on hand and available borrowings under HDS's Senior ABL Facility, were used to prepay in full the tranche of senior secured term loans outstanding under the Term Loan Facility, as defined above, as of the date of the Incremental Agreement. Pursuant to the Incremental Agreement, the Term Loans will mature on August 13, 2021 and bear interest at the reduced applicable margin for borrowings of 2.75% for LIBOR borrowings and 1.75% for base rate borrowings (down from, respectively, 3.00% and 2.00% applicable to the redeemed term loans), with the LIBOR floor to remain at 1.00%. The Term Loans amortize in equal quarterly installments in
107
HD SUPPLY HOLDINGS, INC. AND SUBSIDIARIES
HD SUPPLY, INC. AND SUBSIDIARIES
NOTES TO CONSOLIDATED FINANCIAL STATEMENTS (Continued)
NOTE 5—DEBT (Continued)
aggregate annual amounts equal to 1.00% of the original principal amount of such Term Loans, beginning in December 2015 with the balance payable on such Term Loans' maturity date.
In connection with the amendment, the Company recorded a modification and extinguishment charge of $20 million, which includes financing fees of $5 million and $15 million to write off a portion of the related unamortized discount and deferred financing costs, in accordance with ASC 470-50, "Debt—Modifications and Extinguishments."
On December 19, 2014, HDS used the net proceeds from the December 2014 First Priority Notes issuance, together with available cash, to redeem all of the outstanding $1,250 million aggregate principal amount of 81/8% Senior Secured First Priority Notes due 2019 ("2012 First Priority Notes"), and pay a $106 million make-whole premium calculated in accordance with the terms of the indenture governing such notes and $18 million of accrued but unpaid interest to the redemption date. As a result, the Company incurred a $106 million loss on extinguishment of debt, which includes the $106 million make-whole premium payment to redeem the 2012 First Priority Notes and the write-off of $15 million of unamortized deferred financing costs, offset by the write-off of $15 million of unamortized premium on the 2012 First Priority Notes.
On December 4, 2014, HDS issued $1,250 million of the December 2014 First Priority Notes at par. At closing, HDS received approximately $1,232 million, net of transaction fees. As a result of the issuance, HDS incurred and paid $18 million in deferred financing costs, which will be amortized into interest expense over the term of the notes.
On February 6, 2014, HDS amended its Term Loan Facility, as defined above, to reduce the applicable margin for borrowings from 3.25% for LIBOR borrowings and 2.25% for base rate borrowings to 3.00% for LIBOR borrowings and 2.00% for base rate borrowings, and reduced the LIBOR floor to 1.00%. In addition, the amendment provided that HDS may withhold up to $150 million from repayments otherwise required to be made with the proceeds of asset sales and use such proceeds to repay any debt, including debt that is junior to the Term Loans. The amendment also extended the maturity of the Term Loans by approximately nine months, to June 28, 2018.
In connection with the amendment, HDS paid approximately $1 million in financing costs, which will be amortized into interest expense over the remaining term of the amended facility in accordance with ASC 470-50, "Debt-Modifications and Extinguishments." A portion of the amendment was considered an extinguishment, resulting in a $1 million loss on extinguishment of debt for the write-off of pro-rata portions of the unamortized original issue discount and the unamortized deferred financing costs. The portion of the amendment considered a modification resulted in a charge of approximately $1 million.
NOTE 6—FAIR VALUE MEASUREMENTS
The fair value measurements and disclosure principles of GAAP (ASC 820, "Fair Value Measurements and Disclosures") define fair value, establish a framework for measuring fair value and
108
HD SUPPLY HOLDINGS, INC. AND SUBSIDIARIES
HD SUPPLY, INC. AND SUBSIDIARIES
NOTES TO CONSOLIDATED FINANCIAL STATEMENTS (Continued)
NOTE 6—FAIR VALUE MEASUREMENTS (Continued)
provide disclosure requirements about fair value measurements. These principles define a three-tier fair value hierarchy, which prioritizes the inputs used in measuring fair value as follows:
| Level 1 | — | Quoted prices (unadjusted) in active markets for identical assets or liabilities; | ||
Level 2 |
— |
Quoted prices for similar assets or liabilities in active markets, quoted prices for identical or similar assets or liabilities in markets that are not active, and inputs (other than quoted prices) that are observable for the asset or liability, either directly or indirectly; |
||
Level 3 |
— |
Unobservable inputs in which little or no market activity exists. |
The Company's financial instruments that are not reflected at fair value on the balance sheet were as follows as of January 29, 2017 and January 31, 2016 (amounts in millions):
| |
As of January 29, 2017 | As of January 31, 2016 | |||||||||||
|---|---|---|---|---|---|---|---|---|---|---|---|---|---|
| |
Recorded Amount(1) |
Estimated Fair Value |
Recorded Amount(1) |
Estimated Fair Value |
|||||||||
Senior ABL Facility |
$ | 421 | $ | 410 | $ | — | $ | — | |||||
Term Loans and Notes |
3,438 | 3,572 | 4,373 | 4,560 | |||||||||
| | | | | | | | | | | | | | |
Total |
$ | 3,859 | $ | 3,982 | $ | 4,373 | $ | 4,560 | |||||
| | | | | | | | | | | | | | |
| | | | | | | | | | | | | | |
| | | | | | | | | | | | | | |
- (1)
- These amounts do not include accrued interest; accrued interest is classified as Other current liabilities in the accompanying Consolidated Balance Sheets. These amounts do not include any related discounts, premiums, or deferred financing costs.
The Company utilized Level 2 inputs, as defined in the fair value hierarchy, to measure the fair value of the long-term debt. Management's fair value estimates were based on quoted prices for recent trades of HDS's long-term debt, recent similar credit facilities initiated by companies with like credit quality in similar industries, quoted prices for similar instruments, and inquiries with certain investment communities.
NOTE 7—INCOME TAXES
The components of Income (Loss) from Continuing Operations before Provision (Benefit) for Income Taxes are as follows (amounts in millions):
| |
Fiscal Year Ended | |||||||||
|---|---|---|---|---|---|---|---|---|---|---|
| |
January 29, 2017 |
January 31, 2016 |
February 1, 2015 |
|||||||
United States |
$ | 338 | $ | 233 | $ | (2 | ) | |||
Foreign |
5 | 9 | — | |||||||
| | | | | | | | | | | |
Total |
$ | 343 | $ | 242 | $ | (2 | ) | |||
| | | | | | | | | | | |
| | | | | | | | | | | |
| | | | | | | | | | | |
109
HD SUPPLY HOLDINGS, INC. AND SUBSIDIARIES
HD SUPPLY, INC. AND SUBSIDIARIES
NOTES TO CONSOLIDATED FINANCIAL STATEMENTS (Continued)
NOTE 7—INCOME TAXES (Continued)
The Provision (Benefit) for Income Taxes consisted of the following (amounts in millions):
| |
Fiscal Year Ended | |||||||||
|---|---|---|---|---|---|---|---|---|---|---|
| |
January 29, 2017 | January 31, 2016 | February 1, 2015 | |||||||
Current: |
||||||||||
Federal |
$ | 3 | $ | (165 | ) | $ | 9 | |||
State |
2 | (12 | ) | (1 | ) | |||||
Foreign |
5 | 4 | — | |||||||
| | | | | | | | | | | |
|
10 | (173 | ) | 8 | ||||||
Deferred: |
||||||||||
Federal |
118 | (828 | ) | 26 | ||||||
State |
11 | (84 | ) | 2 | ||||||
Foreign |
— | 1 | — | |||||||
| | | | | | | | | | | |
|
129 | (911 | ) | 28 | ||||||
| | | | | | | | | | | |
Total |
$ | 139 | $ | (1,084 | ) | $ | 36 | |||
| | | | | | | | | | | |
| | | | | | | | | | | |
| | | | | | | | | | | |
The Company's combined federal, state and foreign effective tax rate for continuing operations for fiscal 2016, fiscal 2015, and fiscal 2014 was approximately 40.5%, (447.9%), and not meaningful since pretax loss was minimal, respectively.
The Company's effective tax rate will vary based on a variety of factors, including overall profitability, the geographical mix of income before taxes and the related tax rates in the jurisdictions where it operates, restructuring and other one-time charges, as well as discrete events, such as settlements of future audits. The Company's fiscal 2016 effective rate was impacted by the geographical mix of where income was generated. The Company's fiscal 2015 effective rate was impacted by reversing substantially all of the valuation allowance on its net U.S. deferred income taxes and a decrease in the Company's unrecognized tax position. The Company's fiscal 2014 effective tax rate was significantly impacted by the recording of a valuation allowance on its net U.S. deferred tax assets. The fiscal 2014 valuation allowance was directly impacted by the increasing of the deferred tax liability for U.S. goodwill amortization for tax purposes. The deferred tax liability related to the Company's U.S. tax deductible goodwill must be considered as a liability related to an asset with an indefinite life. Therefore, the deferred tax liability does not amortize and is not available as a source of taxable income to support the realization of deferred tax assets created by other deductible temporary timing differences.
110
HD SUPPLY HOLDINGS, INC. AND SUBSIDIARIES
HD SUPPLY, INC. AND SUBSIDIARIES
NOTES TO CONSOLIDATED FINANCIAL STATEMENTS (Continued)
NOTE 7—INCOME TAXES (Continued)
The reconciliation of the provision (benefit) for income taxes from continuing operations at the federal statutory rate of 35% to the actual tax provision (benefit) for fiscal 2016, fiscal 2015, and fiscal 2014 is as follows (amounts in millions):
| |
Fiscal year Ended | |||||||||
|---|---|---|---|---|---|---|---|---|---|---|
| |
January 29, 2017 | January 31, 2016 | February 1, 2015 | |||||||
Income taxes at federal statutory rate |
$ | 120 | $ | 84 | $ | — | ||||
State income taxes, net of federal income tax benefit |
13 | 13 | — | |||||||
Foreign rate differential |
(1 | ) | (1 | ) | — | |||||
Legal entity restructuring |
1 | 14 | — | |||||||
Valuation allowance |
(1 | ) | (1,007 | ) | 28 | |||||
Adjustments to tax reserves |
2 | (189 | ) | 7 | ||||||
Other, net |
5 | 2 | 1 | |||||||
| | | | | | | | | | | |
Total provision (benefit) |
$ | 139 | $ | (1,084 | ) | $ | 36 | |||
| | | | | | | | | | | |
| | | | | | | | | | | |
| | | | | | | | | | | |
The tax effects of temporary differences that give rise to significant portions of the deferred tax assets and deferred tax liabilities as of January 29, 2017 and January 31, 2016 were as follows (amounts in millions):
| |
January 29, 2017 |
January 31, 2016 |
|||||
|---|---|---|---|---|---|---|---|
Deferred Tax Assets: |
|||||||
Accrued compensation |
$ | 23 | $ | 26 | |||
Accrued self-insurance liabilities |
18 | 17 | |||||
Other accrued liabilities |
21 | 24 | |||||
Restructuring liabilities |
18 | 23 | |||||
Net operating loss carryforward |
660 | 751 | |||||
Fixed assets |
10 | 25 | |||||
Allowance for doubtful accounts |
6 | 6 | |||||
Inventory |
35 | 35 | |||||
Tax credit carryforward |
19 | 14 | |||||
Other |
4 | 5 | |||||
Valuation allowance |
(5 | ) | (6 | ) | |||
| | | | | | | | |
Noncurrent deferred tax assets |
809 | 920 | |||||
Deferred Tax Liabilities: |
|||||||
Prepaid expense |
$ | (1 | ) | $ | (1 | ) | |
Deferred financing costs |
(5 | ) | (9 | ) | |||
Software costs |
(11 | ) | (12 | ) | |||
Intangible assets |
(205 | ) | (166 | ) | |||
Income from discharge of indebtedness |
(31 | ) | (47 | ) | |||
| | | | | | | | |
Noncurrent deferred tax liabilities |
(253 | ) | (235 | ) | |||
| | | | | | | | |
Deferred tax assets (liabilities), net |
$ | 556 | $ | 685 | |||
| | | | | | | | |
| | | | | | | | |
| | | | | | | | |
111
HD SUPPLY HOLDINGS, INC. AND SUBSIDIARIES
HD SUPPLY, INC. AND SUBSIDIARIES
NOTES TO CONSOLIDATED FINANCIAL STATEMENTS (Continued)
NOTE 7—INCOME TAXES (Continued)
The Company has designated the undistributed earnings of certain aspects of its foreign operations as not permanently reinvested. As of January 29, 2017, deferred taxes have not been provided as the Company's tax basis exceeds its financial reporting book basis with respect to its foreign subsidiary. In fiscal 2016, the Company repatriated $72 million of cash to the U.S., which, to the extent of current earnings and profits, and foreign withholding taxes resulted in $4 million of tax expense. In fiscal 2015, the Company repatriated $92 million of cash and property to the U.S., which, to the extent of current earnings and profits, resulted in $10 million income tax expense in the U.S. Beginning in fiscal 2017, the Company anticipates that all of its Canadian earnings will be permanently reinvested until such time the Canadian borrowings under the Senior ABL Facility, which was initially drawn on during fiscal 2016, are paid off.
As of January 29, 2017 the Company had tax-effected U.S. federal net operating loss carryforwards of $623 million which expires beginning in fiscal 2031. The Company also had $100 million of tax effected state net operating loss carryforwards which expire in various years between fiscal 2017 and fiscal 2036. The Company also had $11 million of U.S. federal alternative minimum tax credits which have an indefinite carryforward period, $4 million of U.S. federal research and development credits which expire between fiscal 2031 and fiscal 2036, and $4 million of tax-effected state tax credits which expire in various years between fiscal 2019 and fiscal 2025.
At January 29, 2017, the Company's U.S. operations continued to have cumulative consolidated pre-tax income for the most recent three-year period. Management concluded that as a consequence of the Company's three-year cumulative consolidated pre-tax income, generation of taxable income in fiscal 2014, 2015, and 2016, long net operating loss carryforward periods, a significant reduction in recent interest expense, a projected further reduction in future interest expense, and the business plan for fiscal 2017 and beyond showing continued profitability, that it is more likely than not that substantially all of the Company's U.S. deferred tax assets will be realized. As a result, the Company concluded that no additional valuation on its U.S. deferred assets was necessary. In addition, the Company reduced its valuation allowance related to its U.S. continuing operations by $1 million in fiscal 2016 as it determined it is "more likely than not" certain deferred income tax assets would be realized.
At January 31, 2016, the Company's U.S. operations were in a position of cumulative consolidated pre-tax income for the most recent three-year period. Management concluded that as a consequence of the Company's three-year cumulative consolidated pre-tax income, generation of taxable income in fiscal 2014 and 2015, long net operating loss carryforward periods, a significant reduction in recent interest expense, a projected further reduction in future interest expense, and the business plan for fiscal 2016 and beyond showing continued profitability, that it is more likely than not that substantially all of the Company's U.S. deferred tax assets will be realized. Accordingly, in the fourth quarter of fiscal 2015, the Company reversed substantially all of its valuation allowance on its net U.S. deferred tax assets, resulting in a $1,007 million benefit in its provision for income taxes. The benefit from reversing the valuation allowance was partially offset by the utilization of $104 million of such deferred tax assets to offset current year income. At January 31, 2016, after the reverse of the valuation allowance, the Company's remaining valuation allowance on its U.S. deferred tax assets was approximately $6 million.
112
HD SUPPLY HOLDINGS, INC. AND SUBSIDIARIES
HD SUPPLY, INC. AND SUBSIDIARIES
NOTES TO CONSOLIDATED FINANCIAL STATEMENTS (Continued)
NOTE 7—INCOME TAXES (Continued)
In fiscal 2014, the Company recorded a valuation allowance on its total U.S. operations of $28 million net income tax expense related to continuing operations and $9 million net income tax benefit related to discontinued operations.
The future utilization of the Company's Net Operating Loss carryforwards could be limited if the Company experiences an "ownership change," as defined in Section 382 of the Internal Revenue Code of 1986, as amended. In general, an ownership change may result from transactions increasing the aggregate direct or indirect ownership of certain persons (or groups of persons) in the Company's stock by more than 50 percentage points over a testing period (generally 3 years). Future direct or indirect changes in the ownership of the Company's common stock, including sales or acquisitions of the Company's common stock by stockholders and purchases and issuances of the Company's common stock by the Company, some of which are not in our control, could result in an ownership change. Any resulting limitation on the use of the Company's NOL carryforwards could result in the payment of taxes above the amounts currently anticipated and have a negative effect on the Company's future results of operations and financial position.
Deferred tax assets relating to tax benefits of employee stock option grants have been reduced to reflect exercises in fiscal 2016 and fiscal 2015. Some exercises resulted in tax deductions in excess of previously recorded benefits based on the option value at the time of grant ("windfalls"). Although these additional tax benefits or "windfalls" are reflected in the Company's net operating taxable loss carryforwards, pursuant to ASC 718, the additional tax benefit associated with the windfall is not recognized until the deduction reduces taxes payable. Accordingly, since the tax benefit did not reduce the Company's current taxes payable in fiscal 2016 or fiscal 2015 due to net operating loss carryforwards, these "windfall" tax benefits are not reflected in the Company's net operating losses in deferred tax assets for fiscal 2016 or fiscal 2015. Windfalls included in net operating loss carryforwards but not reflected in deferred tax assets for fiscal 2016 and fiscal 2015 were $56 million and $48 million, respectively. See "Note 1, Nature of Business and Summary of Significant Accounting Policies—Recent Accounting Pronouncements—Stock Compensation," for further information.
For fiscal 2016, the Company recorded a $2 million net income tax benefit related to its U.S. business in discontinued operations. For fiscal 2015, the Company recorded a $69 million net income tax expense related to its U.S. business and a $4 million net income tax expense related to its Canadian business in discontinued operations. For fiscal 2014, the Company recorded a $24 million net income tax expense related to its U.S. business and a $3 million net income tax expense related to its Canadian business in discontinued operations.
Federal, state and foreign income taxes net current receivable total $7 million and $3 million as of fiscal 2016 and fiscal 2015, respectively.
Accounting for uncertain tax positions
The Company follows the U.S. GAAP guidance for uncertain tax positions within ASC 740, "Income Taxes." ASC 740 requires application of a "more likely than not" threshold to the recognition and de-recognition of tax positions. It further requires that a change in judgment related to prior years' tax positions be recognized in the quarter of such change. A reconciliation of the beginning and ending
113
HD SUPPLY HOLDINGS, INC. AND SUBSIDIARIES
HD SUPPLY, INC. AND SUBSIDIARIES
NOTES TO CONSOLIDATED FINANCIAL STATEMENTS (Continued)
NOTE 7—INCOME TAXES (Continued)
amount of unrecognized tax benefits for continuing operations for fiscal 2016, fiscal 2015, and fiscal 2014 is as follows (amounts in millions):
| |
Fiscal Year Ended | |||||||||
|---|---|---|---|---|---|---|---|---|---|---|
| |
January 29, 2017 | January 31, 2016 | February 1, 2015 | |||||||
Unrecognized Tax Benefits beginning of period |
$ | 9 | $ | 187 | $ | 192 | ||||
Gross increases for tax positions in current period |
— | 1 | 1 | |||||||
Gross increases for tax positions in prior period |
1 | 5 | — | |||||||
Gross decreases for tax positions in prior period |
— | (2 | ) | (1 | ) | |||||
Settlements |
— | (181 | ) | (5 | ) | |||||
Lapse of statutes |
— | (1 | ) | — | ||||||
| | | | | | | | | | | |
Unrecognized Tax Benefits end of period |
$ | 10 | $ | 9 | $ | 187 | ||||
| | | | | | | | | | | |
| | | | | | | | | | | |
| | | | | | | | | | | |
The resolution of the unrecognized tax benefits could affect the annual effective income tax rate.
The Company did not change its accrual for net interest and penalties related to unrecognized tax benefits for fiscal 2016. For fiscal 2015, the Company decreased by $29 million its accrual for net interest and penalties related to unrecognized tax benefits. For fiscal 2014, the Company accrued $2 million of net interest and penalties related to unrecognized tax benefits. The Company's ending net accrual for interest and penalties related to unrecognized tax benefits at fiscal 2016, fiscal 2015, and fiscal 2014, was zero, zero, and $29 million, respectively. The Company's accounting policy is to classify interest and penalties as components of income tax expense. Accrued interest and penalties from unrecognized tax benefits are included as a component of other liabilities on the Consolidated Balance Sheet.
The Company is subject to audits and examinations of its tax returns by tax authorities in various jurisdictions, including the Internal Revenue Service ("IRS"). Management regularly assesses the likelihood of adverse outcomes resulting from these examinations to determine the adequacy of provisions for income taxes. Certain of the Company's tax years from 2007 and forward remain open for audit by the IRS and various state governments.
The decrease in the Company's fiscal 2015 unrecognized U.S. federal and state tax benefits including gross interest accrual was driven by an income tax benefit of approximately $189 million from the approval and finalization of the Tentative Settlement (as defined in Note 12, Commitments and Contingencies).
NOTE 8—STOCK-BASED COMPENSATION AND EMPLOYEE BENEFIT PLANS
Stock-Based Compensation Plans
The HD Supply Holdings, Inc. 2013 Omnibus Incentive Plan (the "Plan") provides for stock-based awards to employees, consultants and directors, including stock options, stock purchase rights, restricted stock, restricted stock units, deferred stock units, performance shares, performance units, stock appreciation rights, dividend equivalents and other stock-based awards. The Plan replaces and succeeds the HDS Investment Holding, Inc. Stock Incentive Plan, as amended effective April 11, 2011 (the "Stock Incentive Plan"), and, from and after June 26, 2013, no further awards will be made under the
114
HD SUPPLY HOLDINGS, INC. AND SUBSIDIARIES
HD SUPPLY, INC. AND SUBSIDIARIES
NOTES TO CONSOLIDATED FINANCIAL STATEMENTS (Continued)
NOTE 8—STOCK-BASED COMPENSATION AND EMPLOYEE BENEFIT PLANS (Continued)
Stock Incentive Plan. As of January 29, 2017, approximately 7.8 million registered shares were available for issuance under the Plan.
The HD Supply Holdings, Inc. Employee Stock Purchase Plan (the "ESPP") permits HD Supply's eligible associates to purchase Holdings common stock at a 5% discount on the closing stock price at the end of each offering period. There are two six-month offering periods during a calendar year beginning each January and July, with the first offering period commenced on January 1, 2014. During fiscal 2016, fiscal 2015, and fiscal 2014, eligible associates purchased approximately 96,000 shares, 117,000 shares, and 114,000 shares, respectively, under the ESPP. As of January 29, 2017, approximately 1.7 million registered shares were available for issuance under the ESPP.
Stock Options
Under the terms of the Plan and the Stock Incentive Plan (collectively, the "HDS Plans"), non-qualified stock options are to carry exercise prices at, or above, the fair market value of Holdings' stock on the date of the grant.
The non-qualified stock options under the HDS Plans generally vest at the rate of 25% per year commencing on the first anniversary date of the grant or 100% on the third anniversary of the grant and expire on the tenth anniversary date of the grant.
A summary of option activity under the HDS Plans is presented below (shares in thousands):
| |
Number of Shares |
Weighted Average Option Price |
|||||
|---|---|---|---|---|---|---|---|
Outstanding at February 2, 2014 |
15,010 | $ | 13.30 | ||||
Granted |
— | — | |||||
Exercised |
(4,076 | ) | 10.97 | ||||
Forfeited |
(495 | ) | 15.94 | ||||
| | | | | | | | |
Outstanding at February 1, 2015 |
10,439 | $ | 14.08 | ||||
| | | | | | | | |
Granted |
— | — | |||||
Exercised |
(5,647 | ) | 12.50 | ||||
Forfeited |
(55 | ) | 15.28 | ||||
| | | | | | | | |
Outstanding at January 31, 2016 |
4,737 | $ | 15.95 | ||||
| | | | | | | | |
Granted |
1,362 | 28.22 | |||||
Exercised |
(1,782 | ) | 16.44 | ||||
Forfeited |
(154 | ) | 24.83 | ||||
| | | | | | | | |
Outstanding at January 29, 2017 |
4,163 | $ | 19.42 | ||||
| | | | | | | | |
The total intrinsic value of options exercised was approximately $33 million, $110 million, and $65 million in fiscal 2016, fiscal 2015, and fiscal 2014, respectively. As of January 29, 2017, there were approximately 4.2 million stock options outstanding with a weighted-average remaining life of 5.5 years and an aggregate intrinsic value of approximately $97 million. As of January 29, 2017, there were approximately 2.8 million options exercisable with a weighted-average exercise price of $15.62, a
115
HD SUPPLY HOLDINGS, INC. AND SUBSIDIARIES
HD SUPPLY, INC. AND SUBSIDIARIES
NOTES TO CONSOLIDATED FINANCIAL STATEMENTS (Continued)
NOTE 8—STOCK-BASED COMPENSATION AND EMPLOYEE BENEFIT PLANS (Continued)
weighted-average remaining life of 3.9 years and an aggregate intrinsic value of approximately $76 million. As of January 29, 2017, there were approximately 3.8 million options vested or expected to ultimately vest with a weighted-average exercise price of $18.75, a weighted-average remaining life of 5.2 years and an aggregate intrinsic value of approximately $92 million.
The estimated fair value of the options when granted is amortized to expense over the options' vesting or required service period. The fair value for these options was estimated by management, after considering a third-party valuation specialist's assessment, at the date of grant based on the expected life of the option and historical exercise experience, using a Black-Scholes option pricing model with the following weighted-average assumptions:
| |
Fiscal Year Ended | |||||||||
|---|---|---|---|---|---|---|---|---|---|---|
| |
January 29, 2017 | January 31, 2016 | February 1, 2015 | |||||||
Risk-free interest rate |
1.54 | % | — | — | ||||||
Dividend yield |
0.0 | % | — | — | ||||||
Expected volatility factor |
36.2 | % | — | — | ||||||
Expected option life in years |
6.25 | — | — | |||||||
The risk free interest rate was determined based on an analysis of U.S. Treasury zero-coupon market yields as of the date of the option grant for issues having expiration lives similar to the expected option life. The expected volatility was based on an analysis of the historical volatility of Holdings and HD Supply's competitors over the expected life of the HD Supply options. These competitors' volatilities were adjusted to reflect the leverage of HD Supply. As insufficient data exists to determine the historical life of options issued under the HDS Plans, the expected option life was determined based on the vesting schedule of the options and their contractual life taking into consideration the expected time in which the share price of Holdings would exceed the exercise price of the option. No options were granted during fiscal 2015 or fiscal 2014. The weighted-average fair value of each option granted during fiscal 2016 was $10.74. HD Supply recognized $5 million, $5 million, and $8 million of stock-based compensation expense related to stock options during fiscal 2016, fiscal 2015, and fiscal 2014, respectively. As of January 29, 2017 the unamortized compensation expense related to stock options was $10 million, which is expected to be recognized over a weighted-average period of 2.8 years.
Restricted Stock and Restricted Stock Units
Restricted stock awards ("RSAs") and restricted stock unit awards ("RSUs") granted under the Plan are settled by issuing shares of common stock at the vesting date. Generally, the RSAs and RSUs granted to employees vest on a pro rata basis on each of the first four or five anniversaries of the grant, except in the case of death or disability, in which case the RSAs and RSUs vest as of the date of the event. Generally, the RSAs granted to members of the Company's Board of Directors vest on the earliest of the one-year anniversary of the grant date, the next annual meeting after the grant date, or a change in control. The grant date fair value of the RSAs and RSUs is expensed over the vesting period. The shares represented by restricted stock awards are considered outstanding at the grant date, as the recipients are entitled to dividends and voting rights, which are subject to the same restrictions (including the risk of forfeiture) as the restricted stock awards.
116
HD SUPPLY HOLDINGS, INC. AND SUBSIDIARIES
HD SUPPLY, INC. AND SUBSIDIARIES
NOTES TO CONSOLIDATED FINANCIAL STATEMENTS (Continued)
NOTE 8—STOCK-BASED COMPENSATION AND EMPLOYEE BENEFIT PLANS (Continued)
A summary of RSA and RSU activity under the HDS Plans is presented below (shares in thousands):
| |
Number of Shares | Weighted Average Grant Date Fair Value |
|||||
|---|---|---|---|---|---|---|---|
Non-vested at February 2, 2014 |
353 | $ | 18.18 | ||||
Granted |
1,508 | 24.32 | |||||
Vested |
(131 | ) | 20.04 | ||||
Forfeited |
(125 | ) | 24.40 | ||||
| | | | | | | | |
Non-vested at February 1, 2015 |
1,605 | $ | 23.32 | ||||
| | | | | | | | |
Granted |
1,147 | 29.05 | |||||
Vested |
(440 | ) | 23.59 | ||||
Forfeited |
(581 | ) | 26.02 | ||||
| | | | | | | | |
Non-vested at January 31, 2016 |
1,731 | $ | 26.08 | ||||
| | | | | | | | |
Granted |
590 | 28.46 | |||||
Vested |
(539 | ) | 26.03 | ||||
Forfeited |
(232 | ) | 27.33 | ||||
| | | | | | | | |
Non-vested at January 29, 2017 |
1,550 | $ | 27.07 | ||||
| | | | | | | | |
The total fair value of RSAs and RSUs vested during the year was $16 million, $13 million, and $3 million for fiscal 2016, fiscal 2015, and fiscal 2014, respectively. HD Supply recognized $15 million, $11 million, and $9 million of stock-based compensation expense related to RSAs and RSUs during fiscal 2016, fiscal 2015, and fiscal 2014, respectively. As of January 29, 2017 the unamortized compensation expense related to RSAs and RSUs was $26 million, which is expected to be recognized over a weighted-average period of 1.8 years.
Employee Benefit Plans
HD Supply offers a comprehensive Health & Welfare Benefits Program which allows employees who satisfy certain eligibility requirements to choose among different levels and types of coverage. The Health & Welfare Benefits program provides employees healthcare coverage in which the employer and employee share costs. In addition, the program offers employees the opportunity to participate in various voluntary coverages, including flexible spending accounts.
HD Supply maintains a 401(k) defined contribution plan that is qualified under Sections 401(a) and 501(a) of the Internal Revenue Code. Employees who satisfy the plan's eligibility requirements may elect to contribute a portion of their compensation to the plan on a pre-tax basis. HD Supply may match a percentage of the employees' contributions to the plan. A portion of the matching contributions are generally made shortly after the end of each pay period with the remaining portion made after the Company's fiscal year-end if an additional annual matching contribution based on the Company's fiscal-year financial results is approved. HD Supply paid matching contributions of $17 million, $19 million, and $19 million during fiscal 2016, fiscal 2015, and fiscal 2014, respectively.
117
HD SUPPLY HOLDINGS, INC. AND SUBSIDIARIES
HD SUPPLY, INC. AND SUBSIDIARIES
NOTES TO CONSOLIDATED FINANCIAL STATEMENTS (Continued)
NOTE 9—BASIC AND DILUTED WEIGHTED-AVERAGE COMMON SHARES
Basic earnings (loss) per common share is computed by dividing net income (loss) by the weighted-average common shares outstanding during the respective periods. Diluted earnings (loss) per common share is computed by dividing net income (loss) by the sum of the weighted-average common shares outstanding and all dilutive potential common shares outstanding during the respective periods. Diluted earnings (loss) per common share equals basic earnings (loss) per common share for certain periods, as the effect of stock options, restricted stock, and restricted stock units (collectively "stock plan securities") are anti-dilutive because the Company incurred losses from continuing operations in those periods.
The following basic and diluted weighted-average common shares information is provided for Holdings.
The reconciliation of basic to diluted weighted-average common shares for fiscal 2016, fiscal 2015, and fiscal 2014 is as follows (in thousands):
| |
Fiscal Year Ended | |||||||||
|---|---|---|---|---|---|---|---|---|---|---|
| |
January 29, 2017 | January 31, 2016 | February 1, 2015 | |||||||
Weighted-average common shares |
199,385 | 197,011 | 193,962 | |||||||
Effect of potentially dilutive stock plan securities |
2,615 | 4,297 | — | |||||||
| | | | | | | | | | | |
Diluted weighted-average common shares |
202,000 | 201,308 | 193,962 | |||||||
Stock plan securities excluded from dilution(1) |
1,856 | 792 | 12,044 | |||||||
| | | | | | | | | | | |
- (1)
- Represents securities not included in the computation of diluted earnings per share because their effect would have been anti-dilutive.
NOTE 10—SUPPLEMENTAL BALANCE SHEET AND CASH FLOW INFORMATION
Receivables
Receivables as of January 29, 2017 and January 31, 2016 consisted of the following (amounts in millions):
| |
January 29, 2017 |
January 31, 2016 |
|||||
|---|---|---|---|---|---|---|---|
Trade receivables, net of allowance for doubtful accounts |
$ | 804 | $ | 784 | |||
Vendor rebate receivables |
89 | 76 | |||||
Other receivables |
11 | 12 | |||||
| | | | | | | | |
Total receivables, net |
$ | 904 | $ | 872 | |||
| | | | | | | | |
| | | | | | | | |
| | | | | | | | |
118
HD SUPPLY HOLDINGS, INC. AND SUBSIDIARIES
HD SUPPLY, INC. AND SUBSIDIARIES
NOTES TO CONSOLIDATED FINANCIAL STATEMENTS (Continued)
NOTE 10—SUPPLEMENTAL BALANCE SHEET AND CASH FLOW INFORMATION (Continued)
Property and Equipment
Property and equipment as of January 29, 2017 and January 31, 2016 consisted of the following (amounts in millions):
| |
January 29, 2017 |
January 31, 2016 |
|||||
|---|---|---|---|---|---|---|---|
Land |
$ | 21 | $ | 30 | |||
Buildings and improvements |
208 | 221 | |||||
Transportation equipment |
77 | 73 | |||||
Furniture, fixtures and equipment |
265 | 262 | |||||
Capitalized software |
244 | 226 | |||||
Construction in progress |
51 | 34 | |||||
| | | | | | | | |
Property and equipment |
866 | 846 | |||||
Less accumulated depreciation & amortization |
(563 | ) | (536 | ) | |||
| | | | | | | | |
Property and equipment, net |
$ | 303 | $ | 310 | |||
| | | | | | | | |
| | | | | | | | |
| | | | | | | | |
Build-to-Suit Lease
On February 4, 2016, the Company entered into a build-to-suit arrangement for a leadership development and headquarters facility in Atlanta, Georgia, which began construction in 2016. The lease commences upon completion of construction which is anticipated to be early 2018.
In accordance with ASC 840, "Leases," for build-to-suit arrangements where the Company is involved in the construction of structural improvements prior to the commencement of the lease or takes some level of construction risk, the Company is considered the owner of the assets and land during the construction period. Accordingly, during construction activities, the Company recorded a Construction in progress asset within Property and equipment and a corresponding financing liability on the Consolidated Balance Sheet for contributions by the landlord toward construction. Once the construction is completed, if the lease meets certain "sales-leaseback" criteria, the Company will remove the asset and related financial obligation from the Consolidated Balance Sheet and treat the building lease as an operating lease. If upon completion of construction, the lease does not meet the "sales-leaseback" criteria, the leased property will be treated as a capital lease and included in Property and equipment on the Consolidated Balance Sheet. As of January 29, 2017, the Consolidated Balance Sheet includes $21 million of build-to-suit assets in Construction in progress, and the corresponding financial obligation of $21 million in Other long-term liabilities in the Consolidated Balance Sheet.
119
HD SUPPLY HOLDINGS, INC. AND SUBSIDIARIES
HD SUPPLY, INC. AND SUBSIDIARIES
NOTES TO CONSOLIDATED FINANCIAL STATEMENTS (Continued)
NOTE 10—SUPPLEMENTAL BALANCE SHEET AND CASH FLOW INFORMATION (Continued)
Other Current Liabilities
Other current liabilities as of January 29, 2017 and January 31, 2016 consisted of the following (amounts in millions):
| |
HD Supply Holdings, Inc. | HD Supply, Inc. | |||||||||||
|---|---|---|---|---|---|---|---|---|---|---|---|---|---|
| |
January 29, 2017 |
January 31, 2016 |
January 29, 2017 |
January 31, 2016 |
|||||||||
Accrued interest |
$ | 30 | $ | 73 | $ | 30 | $ | 73 | |||||
Accrued non-income taxes |
31 | 30 | 31 | 30 | |||||||||
Other |
96 | 97 | 96 | 96 | |||||||||
| | | | | | | | | | | | | | |
Total other current liabilities |
$ | 157 | $ | 200 | $ | 157 | $ | 199 | |||||
| | | | | | | | | | | | | | |
| | | | | | | | | | | | | | |
| | | | | | | | | | | | | | |
Supplemental Cash Flow Information
Cash paid for interest in fiscal 2016, fiscal 2015, and fiscal 2014 was approximately $296 million, $397 million, and $456 million, respectively. During fiscal 2016, the Company paid $7 million of original issue discounts related to the portion of the $200 million payment on Term Loans B-1 considered an extinguishment under ASC 470-50, "Debt—Modifications and Extinguishments." During fiscal 2015, the Company paid $12 million of original issue discounts related to the portion of the Incremental Agreement considered an extinguishment under ASC 470-50. During fiscal 2014, the Company paid $1 million of original issue discounts related to the portion of the Term Loan amendment considered an extinguishment under ASC 470-50.
Cash paid for income taxes, net of refunds, in fiscal 2016, fiscal 2015, and fiscal 2014 was approximately $13 million, $16 million, and $39 million, respectively. Cash paid for income taxes in fiscal 2014 includes a $27 million payment for the tentative settlement of the IRS's audit of the Company's U.S. federal income tax returns filed for the tax years ended on February 3, 2008 and February 1, 2009.
NOTE 11—RESTRUCTURING ACTIVITIES
Fiscal 2015 Plan
As a result of the sale of the Power Solutions business unit in October 2015, management evaluated our talent alignment and functional support strategies. Consequently, during fiscal 2015, we initiated a restructuring plan to strategically align our leadership and functional support teams. During fiscal 2015, we incurred $9 million of restructuring charges under this plan. During fiscal 2016, we accelerated and expanded the restructuring plan, incurring $20 million of restructuring charges, offset by a net gain of $11 million related to real estate transactions under the plan. In total the Company incurred net restructuring charges of $18 million and expects the plan to deliver a payback of approximately two years via a reduction in costs. The Company completed the activities under the plan in fiscal 2016 and does not expect to incur additional charges.
120
HD SUPPLY HOLDINGS, INC. AND SUBSIDIARIES
HD SUPPLY, INC. AND SUBSIDIARIES
NOTES TO CONSOLIDATED FINANCIAL STATEMENTS (Continued)
NOTE 11—RESTRUCTURING ACTIVITIES (Continued)
As of January 29, 2017, the liability balances for these restructuring activities were $5 million and are included in Other current liabilities in the Consolidated Balance Sheet. Payments for these initial charges are expected to be substantially complete in the next twelve months.
The following table presents the activity for the liability balance (amounts in millions):
| |
Severance | Relocation & Other Costs |
Total | |||||||
|---|---|---|---|---|---|---|---|---|---|---|
Balance—January 31, 2016 |
$ | 6 | $ | 1 | $ | 7 | ||||
Charges |
8 | 12 | 20 | |||||||
Cash payments |
(9 | ) | (13 | ) | (22 | ) | ||||
| | | | | | | | | | | |
Balance—January 29, 2017 |
$ | 5 | $ | — | $ | 5 | ||||
| | | | | | | | | | | |
| | | | | | | | | | | |
| | | | | | | | | | | |
Fiscal 2013 Plan
During the fourth quarter of fiscal 2013, management evaluated the cost structure of the Company and identified opportunities to reduce costs across its businesses, primarily through a workforce reduction in the global support center and, to a lesser extent, its business units. During fiscal 2014, the Company continued restructuring activities under this plan, resulting in a restructuring charge of $6 million in fiscal 2014 for additional workforce reductions of approximately 130 employees, primarily at Facilities Maintenance, and the consolidation of six Construction & Industrial branches into three branches. These charges were recorded to operating expenses within the Consolidated Statements of Operations and Comprehensive Income (Loss). During fiscal 2014, the Company completed the restructuring activities under this plan. No further charges are expected under this plan.
NOTE 12—COMMITMENTS AND CONTINGENCIES
Lease Commitments
HD Supply occupies certain facilities and operates certain equipment and vehicles under leases that expire at various dates through the year 2037. In addition to minimum rentals, there are certain executory costs such as real estate taxes, insurance, and common area maintenance on most of its facility leases. Expense under these leases totaled $154 million, $139 million, and $125 million in fiscal 2016, fiscal 2015, and fiscal 2014, respectively.
Future minimum aggregate rental payments under non-cancelable operating leases as of January 29, 2017 are as follows (amounts in millions):
| |
Fiscal Year | |
|
|||||||||||||||||||
|---|---|---|---|---|---|---|---|---|---|---|---|---|---|---|---|---|---|---|---|---|---|---|
| |
2017 | 2018 | 2019 | 2020 | 2021 | Thereafter | Total | |||||||||||||||
Operating Leases |
$ | 147 | 131 | 106 | 70 | 45 | 56 | $ | 555 | |||||||||||||
Build-to-Suit Lease(i) |
$ | — | 5 | 5 | 6 | 6 | 105 | $ | 127 | |||||||||||||
- (i)
- Represents the future cash payments for the leadership development and headquarters facility currently under construction in Atlanta, Georgia. See "Note 10, Supplemental Balance Sheet and Cash Flow Information" for further information.
121
HD SUPPLY HOLDINGS, INC. AND SUBSIDIARIES
HD SUPPLY, INC. AND SUBSIDIARIES
NOTES TO CONSOLIDATED FINANCIAL STATEMENTS (Continued)
NOTE 12—COMMITMENTS AND CONTINGENCIES (Continued)
The Company subleases certain leased facilities to third parties. In addition, the Company leases certain owned facilities to third parties. Total future minimum rentals to be received under non-cancelable subleases and leases as of January 29, 2017 are approximately $34 million. These subleases and leases expire at various dates through the year 2025.
Purchase Obligations
As of January 29, 2017, the Company has agreements in place with various vendors to purchase goods and services, primarily inventory, in the aggregate amount of $382 million. These purchase obligations are generally cancelable, but the Company has no intent to cancel. Payment is due during fiscal 2017 for these obligations.
Internal Revenue Service
The Company carried back tax net operating losses ("NOL") from its tax years ended on February 3, 2008 and February 1, 2009 to tax years during which it was a member of The Home Depot Inc.'s ("Home Depot") U.S. federal consolidated tax group. As a result of those NOL carrybacks, Home Depot received cash refunds from the IRS in the amount of approximately $354 million. Under an agreement (the "Agreement") between the Company and Home Depot, Home Depot paid the Company the refund proceeds resulting from the NOL carrybacks.
In January 2013 in connection with an audit of the Company's U.S. federal income tax returns filed for the tax years ended on February 3, 2008 and February 1, 2009, the IRS issued a Revenue Agent's Report ("RAR") which proposed to disallow certain deductions claimed by the Company and a significant portion of the corresponding cash refunds resulting from the Company's NOL carrybacks. Pursuant to the terms of the Agreement, the Company would be required to reimburse Home Depot an amount equal to the disallowed refunds plus related interest. In collaboration with Home Depot, the Company challenged the proposed adjustments of the RAR by filing a formal protest with the IRS Office of Appeals. In July 2014, the Company reached a tentative settlement ("Tentative Settlement") for approximately $27 million with the IRS Office of Appeals on the outstanding RAR. In order to stop the accrual of interest on the Tentative Settlement amount and as required under the Agreement, in August 2014 the Company made a payment of approximately $27 million to Home Depot which Home Depot then paid to the IRS. As a result of the Tentative Settlement, the Company's deferred tax assets increased by approximately $12 million before the impact of the valuation allowance.
The Tentative Settlement and the carryback claims were subject to review by the Joint Committee on Taxation ("JCT") and the Tentative Settlement does not become effective nor are the carryback claims finalized until the JCT reviews them without objection or the IRS Office of Appeals executes such settlement, whichever comes first. The JCT is required to review refunds in excess of $2 million.
On February 19, 2015, the Company received notification the Tentative Settlement was approved by the JCT. As a result of the approval and finalization of the Tentative Settlement, the tax years ending February 3, 2008 and February 1, 2009 are settled and closed to any further adjustments.
See "Note 7, Income Taxes," for further disclosures on the Company's income taxes.
122
HD SUPPLY HOLDINGS, INC. AND SUBSIDIARIES
HD SUPPLY, INC. AND SUBSIDIARIES
NOTES TO CONSOLIDATED FINANCIAL STATEMENTS (Continued)
NOTE 12—COMMITMENTS AND CONTINGENCIES (Continued)
Legal Matters
HD Supply is involved in various legal proceedings arising in the normal course of its business. The Company establishes reserves for litigation and similar matters when those matters present loss contingencies that it determines to be both probable and reasonably estimable in accordance with ASC 450, "Contingencies." In the opinion of management, based on current knowledge, all reasonably estimable and probable matters are believed to be adequately reserved for or covered by insurance and are not expected to have a material adverse effect on the Company's consolidated financial condition, results of operations or cash flows. For all other matters management believes the possibility of losses from such matters is not probable, the potential loss from such matters is not reasonably estimable, or such matters, if disposed of unfavorably to the Company, are of such kind or involve such amounts that would not have a material adverse effect on the financial position, results of operations or cash flows of the Company. For material matters that are reasonably possible and reasonably estimable, including matters that are probable and estimable but for which the amount that is reasonably possible is in excess of the amount that the Company has accrued for, management has estimated the aggregate range of potential loss as $0 to $15 million. If a material loss is probable or reasonably possible, and in either case estimable, the Company has considered it in the analysis and it is included in the discussion set forth above.
NOTE 13—SEGMENT INFORMATION
HD Supply's operating segments are based on management structure and internal reporting. Each segment offers different products and services to the end customer, except for Corporate, which provides general corporate overhead support. The Company determines the reportable segments in accordance with the principles of segment reporting within ASC 280, "Segment Reporting." For purposes of evaluation under these segment reporting principles, the Chief Operating Decision Maker for HD Supply assesses HD Supply's ongoing performance, based on the periodic review and evaluation of Net sales, Adjusted EBITDA, and certain other measures for each of the operating segments.
HD Supply has three reportable segments, each of which is presented below:
- •
- Facilities Maintenance—Facilities Maintenance distributes maintenance, repair and
operations ("MRO") products, provides value-add services and fabricates custom products to multifamily, hospitality, healthcare and institutional facilities.
- •
- Waterworks—Waterworks distributes complete lines of water and wastewater
transmission products, serving contractors and municipalities in the water and wastewater industries for non-residential and residential uses.
- •
- Construction & Industrial—Construction & Industrial distributes specialized hardware, tools, engineered materials and safety products to non-residential and residential contractors. Construction & Industrial also offers light remodeling and construction supplies, kitchen and bath cabinets, windows, plumbing materials, electrical equipment and other products, primarily to small remodeling contractors and trade professionals.
123
HD SUPPLY HOLDINGS, INC. AND SUBSIDIARIES
HD SUPPLY, INC. AND SUBSIDIARIES
NOTES TO CONSOLIDATED FINANCIAL STATEMENTS (Continued)
NOTE 13—SEGMENT INFORMATION (Continued)
In addition to the reportable segments, the Company's consolidated financial results include "Corporate" which includes costs related to our centralized support functions, which are comprised of finance, information technology, human resources, legal, supply chain and other support services, and removes inter-segment transactions.
Beginning in the fourth quarter of fiscal 2016, we combined the Home Improvement Solutions business unit with the Construction & Industrial business unit. Prior to the sale of our Interior Solutions business unit, Interior Solutions was under common management with Home Improvement Solutions, with both included in the Corporate segment. As a result of the sale, management elected to realign Home Improvement Solutions into the Construction & Industrial operating segment. The realignment benefits Home Improvement Solutions with the strong leadership, proven category management processes, and customer-centricity at Construction & Industrial. All periods presented have been revised to reflect the combined business unit.
The following tables present Net sales, Adjusted EBITDA, and certain other measures for each of the reportable segments and total continuing operations for the periods indicated (amounts in millions):
| |
Fiscal Year 2016 | |||||||||||||||
|---|---|---|---|---|---|---|---|---|---|---|---|---|---|---|---|---|
| |
Facilities Maintenance |
Waterworks | Construction & Industrial |
Corporate | Total Continuing Operations |
|||||||||||
Net sales |
$ | 2,762 | 2,622 | 2,063 | (8 | ) | $ | 7,439 | ||||||||
Adjusted EBITDA |
$ | 523 | 234 | 224 | (60 | ) | $ | 921 | ||||||||
Depreciation(1) & Software Amortization |
$ | 29 | 11 | 33 | 14 | $ | 87 | |||||||||
Other Intangible Amortization |
$ | 6 | 2 | 1 | 5 | $ | 14 | |||||||||
Total Assets(2) |
$ | 2,358 | 1,663 | 808 | 878 | $ | 5,707 | |||||||||
Capital Expenditures(2) |
$ | 22 | 10 | 32 | 17 | $ | 81 | |||||||||
| |
Fiscal Year 2015 | |||||||||||||||
|---|---|---|---|---|---|---|---|---|---|---|---|---|---|---|---|---|
| |
Facilities Maintenance |
Waterworks | Construction & Industrial |
Corporate | Total Continuing Operations |
|||||||||||
Net sales |
$ | 2,690 | 2,510 | 1,932 | (9 | ) | $ | 7,123 | ||||||||
Adjusted EBITDA |
$ | 529 | 222 | 184 | (59 | ) | $ | 876 | ||||||||
Depreciation(1) & Software Amortization |
$ | 43 | 11 | 30 | 14 | $ | 98 | |||||||||
Other Intangible Amortization |
$ | 6 | 2 | 1 | 6 | $ | 15 | |||||||||
Total Assets(2) |
$ | 2,358 | 1,636 | 788 | 1,234 | $ | 6,016 | |||||||||
Capital Expenditures(2) |
$ | 20 | 10 | 34 | 22 | $ | 86 | |||||||||
124
HD SUPPLY HOLDINGS, INC. AND SUBSIDIARIES
HD SUPPLY, INC. AND SUBSIDIARIES
NOTES TO CONSOLIDATED FINANCIAL STATEMENTS (Continued)
NOTE 13—SEGMENT INFORMATION (Continued)
| |
Fiscal Year 2014 | |||||||||||||||
|---|---|---|---|---|---|---|---|---|---|---|---|---|---|---|---|---|
| |
Facilities Maintenance |
Waterworks | Construction & Industrial |
Corporate | Total Continuing Operations |
|||||||||||
Net sales |
$ | 2,510 | 2,427 | 1,753 | (8 | ) | $ | 6,682 | ||||||||
Adjusted EBITDA |
$ | 491 | 198 | 139 | (59 | ) | $ | 769 | ||||||||
Depreciation(1) & Software Amortization |
$ | 50 | 11 | 25 | 16 | $ | 102 | |||||||||
Other Intangible Amortization |
$ | 57 | 3 | 14 | 6 | $ | 80 | |||||||||
Total Assets(2) |
$ | 2,390 | 1,640 | 768 | 1,179 | $ | 5,977 | |||||||||
Capital Expenditures(2) |
$ | 32 | 15 | 35 | 37 | $ | 119 | |||||||||
- (1)
- Depreciation
includes amounts recorded within Cost of sales in the Consolidated Statements of Operations.
- (2)
- Total Assets and capital expenditures include amounts attributable to discontinued operations for the periods prior to the dispositions.
Reconciliation to Consolidated Financial Statements
| |
Fiscal 2016 | Fiscal 2015 | Fiscal 2014 | |||||||
|---|---|---|---|---|---|---|---|---|---|---|
Total Adjusted EBITDA |
$ | 921 | $ | 876 | $ | 769 | ||||
Depreciation and amortization |
101 | 113 | 182 | |||||||
Stock-based compensation |
20 | 16 | 17 | |||||||
Restructuring |
9 | 9 | 6 | |||||||
Other |
— | 1 | (1 | ) | ||||||
| | | | | | | | | | | |
Operating income |
791 | 737 | 565 | |||||||
Interest expense |
269 | 394 | 462 | |||||||
Loss on extinguishment & modification of debt |
179 | 100 | 108 | |||||||
Other (income) expense, net |
— | 1 | (3 | ) | ||||||
| | | | | | | | | | | |
Income (Loss) from Continuing Operations Before Provision (Benefit) for Income Taxes |
343 | 242 | (2 | ) | ||||||
Provision (benefit) for income taxes |
139 | (1,084 | ) | 36 | ||||||
| | | | | | | | | | | |
Income (loss) from continuing operations |
$ | 204 | $ | 1,326 | $ | (38 | ) | |||
| | | | | | | | | | | |
| | | | | | | | | | | |
| | | | | | | | | | | |
Net sales for HD Supply outside the United States, primarily Canada, were $124 million, $125 million, and $130 million in fiscal 2016, fiscal 2015, and fiscal 2014, respectively. Long-lived assets of HD Supply outside the United States, primarily Canada, were $5 million and $6 million as of January 29, 2017 and January 31, 2016, respectively.
NOTE 14—GUARANTOR SUBSIDIARIES
As of January 29, 2017, HDS (the "Debt Issuer") had outstanding December 2014 First Priority Notes and April 2016 Senior Unsecured Notes (collectively the "Notes") guaranteed by certain of its
125
HD SUPPLY HOLDINGS, INC. AND SUBSIDIARIES
HD SUPPLY, INC. AND SUBSIDIARIES
NOTES TO CONSOLIDATED FINANCIAL STATEMENTS (Continued)
NOTE 14—GUARANTOR SUBSIDIARIES (Continued)
subsidiaries (the "Subsidiary Guarantors"). The Subsidiary Guarantors are direct or indirect wholly-owned domestic subsidiaries of HDS. The subsidiaries of HDS that do not guarantee the Notes ("Non-guarantor Subsidiaries") are direct or indirect wholly-owned subsidiaries of HDS and primarily include HDS's operations in Canada.
The Debt Issuer's payment obligations under the Notes are jointly and severally guaranteed by the guarantors and all guarantees are full and unconditional.
These guarantees are subject to release under the circumstances as described below:
- (i)
- concurrently
with any direct or indirect sale or disposition (by merger or otherwise) of any Subsidiary Guarantor or any interest therein in accordance with the
terms of the applicable indebtedness by HDS or a restricted subsidiary, following which such Subsidiary Guarantor is no longer a restricted subsidiary of HDS;
- (ii)
- at
any time that such Subsidiary Guarantor is released from all of its obligations under all of its guarantees of payment of any indebtedness of HDS or any
Subsidiary Guarantor under all other indebtedness and is not a borrower under the Senior ABL Facility;
- (iii)
- upon
the merger or consolidation of any Subsidiary Guarantor with and into HDS or another Subsidiary Guarantor that is the surviving entity in such merger or
consolidation, or upon the liquidation of such Subsidiary Guarantor following the transfer of all of its assets to HDS or another Subsidiary Guarantor;
- (iv)
- concurrently
with any Subsidiary Guarantor becoming an unrestricted subsidiary;
- (v)
- during
the period when the rating on the notes is changed to investment grade and certain covenants cease to apply while such investment grade rating is maintained,
upon the merger or consolidation of any Subsidiary Guarantor with and into another subsidiary that is not a Subsidiary Guarantor with such other subsidiary being the surviving entity in such merger or
consolidation, or upon liquidation of such Subsidiary Guarantor following the transfer of all of its assets to a subsidiary that is not a Subsidiary Guarantor;
- (vi)
- upon
legal or covenant defeasance of HDS's obligations under the applicable indebtedness, or satisfaction and discharge of the indenture governing the applicable
indebtedness; or
- (vii)
- subject to customary contingent reinstatement provisions, upon payment in full of the aggregate principal amount of all applicable indebtedness then outstanding and all other obligations guaranteed by a Subsidiary Guarantor then due and owing.
In addition, HDS has the right, upon 30 days' notice to the applicable trustee, to cause any Subsidiary Guarantor that has not guaranteed payment of any indebtedness of HDS or any Subsidiary Guarantor under all other indebtedness and is not a borrower under the Senior ABL Facility to be unconditionally released from all obligations under its Subsidiary Guarantee, and such Subsidiary Guarantee shall thereupon terminate and be discharged and of no further force or effect.
In connection with the issuance of the Notes, HDS determined the need for compliance with Rule 3-10 of SEC Regulation S-X. In lieu of providing separate audited financial statements for the Guarantor Subsidiaries, HDS has included the accompanying Condensed Consolidating Financial
126
HD SUPPLY HOLDINGS, INC. AND SUBSIDIARIES
HD SUPPLY, INC. AND SUBSIDIARIES
NOTES TO CONSOLIDATED FINANCIAL STATEMENTS (Continued)
NOTE 14—GUARANTOR SUBSIDIARIES (Continued)
Statements in accordance with Rule 3-10(f) of SEC Regulation S-X. The following supplemental financial information sets forth, on a consolidating basis under the equity method of accounting, the condensed statements of operations and comprehensive income (loss), the condensed balance sheets, and the condensed statements of cash flows for the parent company issuer of the Notes, HDS, for the Subsidiary Guarantors and for the Non-guarantor Subsidiaries and total consolidated HDS and subsidiaries.
Holdings
Under the terms of the agreements governing the Notes issued by HDS, the Term Loan Facility entered into by HDS, and the Senior ABL Facility entered into by HDS and certain of its subsidiaries, HDS and substantially all of its existing and future 100%-owned U.S. subsidiaries are significantly restricted from making dividend payments, loans or advances to Holdings. These restrictions result in substantially all of the net assets of Holdings' 100%-owned U.S. subsidiaries being restricted (as defined in Rule 4-08(e)(3) of Regulation S-X).
In lieu of Schedule I, the condensed statements of operations and comprehensive income (loss), the condensed balance sheets, and the condensed statements of cash flows of Holdings are included in the tables below.
The condensed parent company financial information of Holdings has been provided in accordance with the rules and regulations of the SEC and should be read in conjunction with the Consolidated Financial Statements of Holdings and its subsidiaries. Pursuant to the SEC rules and regulations, the condensed parent company financial information does not include all of the financial information and notes normally included with financial statements prepared in accordance with GAAP.
The condensed parent company financial information has been prepared using the same accounting policies as described in Note 1 of Notes to Consolidated Financial Statements of Holdings and subsidiaries included herein, except for the investment in subsidiary. For the purposes of this schedule, Holdings' investment in HDS, its indirect wholly-owned subsidiary, is stated at cost plus equity in undistributed earnings of subsidiaries since the date of acquisition. Holdings' share of net income of its unconsolidated subsidiaries is included in consolidated income using the equity method. Holdings did not receive any dividends or distributions from subsidiaries during fiscal 2016, fiscal 2015 or fiscal 2014.
127
HD SUPPLY HOLDINGS, INC. AND SUBSIDIARIES
HD SUPPLY, INC. AND SUBSIDIARIES
NOTES TO CONSOLIDATED FINANCIAL STATEMENTS (Continued)
NOTE 14—GUARANTOR SUBSIDIARIES (Continued)
CONDENSED CONSOLIDATING STATEMENTS OF OPERATIONS AND COMPREHENSIVE INCOME (LOSS)
Amounts in millions
| |
Fiscal Year 2016 | ||||||||||||||||||||
|---|---|---|---|---|---|---|---|---|---|---|---|---|---|---|---|---|---|---|---|---|---|
| |
Debt Issuer |
Subsidiary Guarantors |
Non- Guarantor Subsidiaries |
Eliminations | Total HDS |
|
Holdings | ||||||||||||||
Net Sales |
$ | — | $ | 7,319 | $ | 122 | $ | (2 | ) | $ | 7,439 | $ | — | ||||||||
Cost of sales |
— | 4,843 | 65 | (1 | ) | 4,907 | — | ||||||||||||||
| | | | | | | | | | | | | | | | | | | | | | |
Gross Profit |
— | 2,476 | 57 | (1 | ) | 2,532 | — | ||||||||||||||
Operating expenses: |
|||||||||||||||||||||
Selling, general and administrative |
71 | 1,518 | 49 | (1 | ) | 1,637 | — | ||||||||||||||
Depreciation and amortization |
13 | 80 | 2 | — | 95 | — | |||||||||||||||
Restructuring |
6 | 3 | — | — | 9 | — | |||||||||||||||
| | | | | | | | | | | | | | | | | | | | | | |
Total operating expenses |
90 | 1,601 | 51 | (1 | ) | 1,741 | — | ||||||||||||||
Operating Income (Loss) |
(90 | ) | 875 | 6 | — | 791 | — | ||||||||||||||
Interest expense |
287 | 243 | 1 | (262 | ) | 269 | — | ||||||||||||||
Interest (income) |
(244 | ) | (18 | ) | — | 262 | — | — | |||||||||||||
Net (earnings) loss of equity affiliates |
(598 | ) | — | — | 598 | — | (196 | ) | |||||||||||||
Loss on extinguishment & modification of debt |
179 | — | — | — | 179 | — | |||||||||||||||
Other income (expense), net |
— | — | — | — | — | — | |||||||||||||||
| | | | | | | | | | | | | | | | | | | | | | |
Income (Loss) from Continuing Operations Before Provision (Benefit) for Income Taxes |
286 | 650 | 5 | (598 | ) | 343 | 196 | ||||||||||||||
Provision (benefit) for income taxes |
83 | 52 | 4 | — | 139 | — | |||||||||||||||
| | | | | | | | | | | | | | | | | | | | | | |
Income (Loss) from Continuing Operations |
203 | 598 | 1 | (598 | ) | 204 | 196 | ||||||||||||||
Income (loss) from discontinued operations, net of tax |
(7 | ) | (1 | ) | — | — | (8 | ) | — | ||||||||||||
| | | | | | | | | | | | | | | | | | | | | | |
Net Income (Loss) |
$ | 196 | $ | 597 | $ | 1 | $ | (598 | ) | $ | 196 | $ | 196 | ||||||||
Other comprehensive income—foreign currency translation adjustment |
1 | — | 1 | (1 | ) | 1 | 1 | ||||||||||||||
| | | | | | | | | | | | | | | | | | | | | | |
Total Comprehensive Income (Loss) |
$ | 197 | $ | 597 | $ | 2 | $ | (599 | ) | $ | 197 | $ | 197 | ||||||||
| | | | | | | | | | | | | | | | | | | | | | |
| | | | | | | | | | | | | | | | | | | | | | |
| | | | | | | | | | | | | | | | | | | | | | |
128
HD SUPPLY HOLDINGS, INC. AND SUBSIDIARIES
HD SUPPLY, INC. AND SUBSIDIARIES
NOTES TO CONSOLIDATED FINANCIAL STATEMENTS (Continued)
NOTE 14—GUARANTOR SUBSIDIARIES (Continued)
Amounts in millions
| |
Fiscal Year 2015 | ||||||||||||||||||||
|---|---|---|---|---|---|---|---|---|---|---|---|---|---|---|---|---|---|---|---|---|---|
| |
Debt Issuer |
Subsidiary Guarantors |
Non- Guarantor Subsidiaries |
Eliminations | Total HDS |
|
Holdings | ||||||||||||||
Net Sales |
$ | — | $ | 7,004 | $ | 121 | $ | (2 | ) | $ | 7,123 | $ | — | ||||||||
Cost of sales |
— | 4,670 | 65 | (1 | ) | 4,734 | — | ||||||||||||||
| | | | | | | | | | | | | | | | | | | | | | |
Gross Profit |
— | 2,334 | 56 | (1 | ) | 2,389 | — | ||||||||||||||
Operating expenses: |
|||||||||||||||||||||
Selling, general and administrative |
73 | 1,418 | 45 | (1 | ) | 1,535 | — | ||||||||||||||
Depreciation and amortization |
15 | 92 | 1 | — | 108 | ||||||||||||||||
Restructuring charge |
2 | 7 | — | — | 9 | — | |||||||||||||||
| | | | | | | | | | | | | | | | | | | | | | |
Total operating expenses |
90 | 1,517 | 46 | (1 | ) | 1,652 | — | ||||||||||||||
Operating Income (Loss) |
(90 | ) | 817 | 10 | — | 737 | — | ||||||||||||||
Interest expense |
399 | 243 | 1 | (249 | ) | 394 | — | ||||||||||||||
Interest (income) |
(243 | ) | (6 | ) | — | 249 | — | — | |||||||||||||
Net (earnings) loss of equity affiliates |
(365 | ) | — | — | 365 | — | (1,472 | ) | |||||||||||||
Loss on extinguishment & modification of debt |
100 | — | — | — | 100 | — | |||||||||||||||
Other income (expense), net |
1 | — | — | — | 1 | — | |||||||||||||||
| | | | | | | | | | | | | | | | | | | | | | |
Income (Loss) from Continuing Operations Before Provision (Benefit) for Income Taxes |
18 | 580 | 9 | (365 | ) | 242 | 1,472 | ||||||||||||||
Provision (benefit) for income taxes |
(1,337 | ) | 249 | 4 | — | (1,084 | ) | — | |||||||||||||
| | | | | | | | | | | | | | | | | | | | | | |
Income (Loss) from Continuing Operations |
1,355 | 331 | 5 | (365 | ) | 1,326 | 1,472 | ||||||||||||||
Income (loss) from discontinued operations, net of tax |
117 | 21 | 8 | — | 146 | — | |||||||||||||||
| | | | | | | | | | | | | | | | | | | | | | |
Net Income (Loss) |
$ | 1,472 | $ | 352 | $ | 13 | $ | (365 | ) | $ | 1,472 | $ | 1,472 | ||||||||
Other comprehensive income—foreign currency translation adjustment |
12 | — | 12 | (12 | ) | 12 | 12 | ||||||||||||||
| | | | | | | | | | | | | | | | | | | | | | |
Total Comprehensive Income (Loss) |
$ | 1,484 | $ | 352 | $ | 25 | $ | (377 | ) | $ | 1,484 | $ | 1,484 | ||||||||
| | | | | | | | | | | | | | | | | | | | | | |
| | | | | | | | | | | | | | | | | | | | | | |
| | | | | | | | | | | | | | | | | | | | | | |
129
HD SUPPLY HOLDINGS, INC. AND SUBSIDIARIES
HD SUPPLY, INC. AND SUBSIDIARIES
NOTES TO CONSOLIDATED FINANCIAL STATEMENTS (Continued)
NOTE 14—GUARANTOR SUBSIDIARIES (Continued)
Amounts in millions
| |
Fiscal Year 2014 | ||||||||||||||||||||
|---|---|---|---|---|---|---|---|---|---|---|---|---|---|---|---|---|---|---|---|---|---|
| |
Debt Issuer |
Subsidiary Guarantors |
Non- Guarantor Subsidiaries |
Eliminations | Total HDS |
|
Holdings | ||||||||||||||
Net Sales |
$ | — | $ | 6,555 | $ | 129 | $ | (2 | ) | $ | 6,682 | $ | — | ||||||||
Cost of sales |
— | 4,417 | 71 | (1 | ) | 4,487 | — | ||||||||||||||
| | | | | | | | | | | | | | | | | | | | | | |
Gross Profit |
— | 2,138 | 58 | (1 | ) | 2,195 | — | ||||||||||||||
Operating expenses: |
|||||||||||||||||||||
Selling, general and administrative |
61 | 1,331 | 55 | (1 | ) | 1,446 | — | ||||||||||||||
Depreciation and amortization |
17 | 160 | 1 | — | 178 | — | |||||||||||||||
Restructuring |
1 | 5 | — | — | 6 | — | |||||||||||||||
| | | | | | | | | | | | | | | | | | | | | | |
Total operating expenses |
79 | 1,496 | 56 | (1 | ) | 1,630 | — | ||||||||||||||
Operating Income (Loss) |
(79 | ) | 642 | 2 | — | 565 | — | ||||||||||||||
Interest expense |
464 | 242 | 1 | (245 | ) | 462 | — | ||||||||||||||
Interest (income) |
(241 | ) | (4 | ) | — | 245 | — | — | |||||||||||||
Net (earnings) loss of equity affiliates |
(427 | ) | — | — | 427 | — | (3 | ) | |||||||||||||
Loss on extinguishment & modification of debt |
108 | — | — | — | 108 | — | |||||||||||||||
Other (income) expense, net |
(3 | ) | — | — | — | (3 | ) | — | |||||||||||||
| | | | | | | | | | | | | | | | | | | | | | |
Income (Loss) from Continuing Operations Before Provision (Benefit) for Income Taxes |
20 | 404 | 1 | (427 | ) | (2 | ) | 3 | |||||||||||||
Provision (benefit) for income taxes |
8 | 28 | — | — | 36 | — | |||||||||||||||
| | | | | | | | | | | | | | | | | | | | | | |
Income (Loss) from Continuing Operations |
12 | 376 | 1 | (427 | ) | (38 | ) | 3 | |||||||||||||
Income (loss) from discontinued operations, net of tax |
(9 | ) | 45 | 5 | — | 41 | — | ||||||||||||||
| | | | | | | | | | | | | | | | | | | | | | |
Net Income (Loss) |
$ | 3 | $ | 421 | $ | 6 | $ | (427 | ) | $ | 3 | $ | 3 | ||||||||
Other comprehensive income—foreign currency translation adjustment |
(13 | ) | — | (13 | ) | 13 | (13 | ) | (13 | ) | |||||||||||
| | | | | | | | | | | | | | | | | | | | | | |
Total Comprehensive Income (Loss) |
$ | (10 | ) | $ | 421 | $ | (7 | ) | $ | (414 | ) | $ | (10 | ) | $ | (10 | ) | ||||
| | | | | | | | | | | | | | | | | | | | | | |
| | | | | | | | | | | | | | | | | | | | | | |
| | | | | | | | | | | | | | | | | | | | | | |
130
HD SUPPLY HOLDINGS, INC. AND SUBSIDIARIES
HD SUPPLY, INC. AND SUBSIDIARIES
NOTES TO CONSOLIDATED FINANCIAL STATEMENTS (Continued)
NOTE 14—GUARANTOR SUBSIDIARIES (Continued)
CONDENSED CONSOLIDATING BALANCE SHEETS
Amounts in millions
| |
As of January 29, 2017 | ||||||||||||||||||||
|---|---|---|---|---|---|---|---|---|---|---|---|---|---|---|---|---|---|---|---|---|---|
| |
Debt Issuer |
Subsidiary Guarantors |
Non- Guarantor Subsidiaries |
Eliminations | Total HDS |
|
Holdings | ||||||||||||||
ASSETS |
|||||||||||||||||||||
Current assets: |
|||||||||||||||||||||
Cash and cash equivalents |
$ | 51 | $ | 17 | $ | 5 | $ | — | $ | 73 | $ | 2 | |||||||||
Receivables, net |
3 | 885 | 16 | — | 904 | — | |||||||||||||||
Inventories |
— | 813 | 18 | — | 831 | — | |||||||||||||||
Intercompany receivables |
— | 1 | — | (1 | ) | — | — | ||||||||||||||
Other current assets |
13 | 22 | 2 | — | 37 | — | |||||||||||||||
| | | | | | | | | | | | | | | | | | | | | | |
Total current assets |
67 | 1,738 | 41 | (1 | ) | 1,845 | 2 | ||||||||||||||
| | | | | | | | | | | | | | | | | | | | | | |
Property and equipment, net |
76 | 225 | 2 | — | 303 | — | |||||||||||||||
Goodwill |
— | 2,869 | — | — | 2,869 | — | |||||||||||||||
Intangible assets, net |
— | 111 | 1 | — | 112 | — | |||||||||||||||
Deferred tax asset |
681 | — | 2 | (127 | ) | 556 | — | ||||||||||||||
Investment in subsidiaries |
2,451 | — | — | (2,451 | ) | — | 958 | ||||||||||||||
Intercompany notes receivable |
2,192 | 584 | — | (2,776 | ) | — | — | ||||||||||||||
Other assets |
16 | 4 | — | — | 20 | — | |||||||||||||||
| | | | | | | | | | | | | | | | | | | | | | |
Total assets |
$ | 5,483 | $ | 5,531 | $ | 46 | $ | (5,355 | ) | $ | 5,705 | $ | 960 | ||||||||
| | | | | | | | | | | | | | | | | | | | | | |
| | | | | | | | | | | | | | | | | | | | | | |
| | | | | | | | | | | | | | | | | | | | | | |
LIABILITIES AND STOCKHOLDER'S EQUITY (DEFICIT) |
|||||||||||||||||||||
Current liabilities: |
|||||||||||||||||||||
Accounts payable |
$ | 13 | $ | 508 | $ | 11 | $ | — | $ | 532 | $ | — | |||||||||
Accrued compensation and benefits |
38 | 100 | 2 | — | 140 | — | |||||||||||||||
Current installments of long-term debt |
14 | — | — | — | 14 | — | |||||||||||||||
Intercompany payables |
— | — | 1 | (1 | ) | — | — | ||||||||||||||
Other current liabilities |
52 | 99 | 6 | — | 157 | — | |||||||||||||||
| | | | | | | | | | | | | | | | | | | | | | |
Total current liabilities |
117 | 707 | 20 | (1 | ) | 843 | — | ||||||||||||||
| | | | | | | | | | | | | | | | | | | | | | |
Long-term debt, excluding current installments |
3,737 | — | 61 | — | 3,798 | — | |||||||||||||||
Deferred tax liabilities |
— | 127 | — | (127 | ) | — | — | ||||||||||||||
Intercompany notes payable |
584 | 2,192 | — | (2,776 | ) | — | — | ||||||||||||||
Other liabilities |
87 | 17 | 2 | — | 106 | — | |||||||||||||||
| | | | | | | | | | | | | | | | | | | | | | |
Total liabilities |
4,525 | 3,043 | 83 | (2,904 | ) | 4,747 | — | ||||||||||||||
| | | | | | | | | | | | | | | | | | | | | | |
Stockholders' equity (deficit) |
958 | 2,488 | (37 | ) | (2,451 | ) | 958 | 960 | |||||||||||||
| | | | | | | | | | | | | | | | | | | | | | |
Total liabilities and stockholders' equity (deficit) |
$ | 5,483 | $ | 5,531 | $ | 46 | $ | (5,355 | ) | $ | 5,705 | $ | 960 | ||||||||
| | | | | | | | | | | | | | | | | | | | | | |
| | | | | | | | | | | | | | | | | | | | | | |
| | | | | | | | | | | | | | | | | | | | | | |
131
HD SUPPLY HOLDINGS, INC. AND SUBSIDIARIES
HD SUPPLY, INC. AND SUBSIDIARIES
NOTES TO CONSOLIDATED FINANCIAL STATEMENTS (Continued)
NOTE 14—GUARANTOR SUBSIDIARIES (Continued)
Amounts in millions
| |
As of January 31, 2016 | ||||||||||||||||||||
|---|---|---|---|---|---|---|---|---|---|---|---|---|---|---|---|---|---|---|---|---|---|
| |
Debt Issuer |
Subsidiary Guarantors |
Non- Guarantor Subsidiaries |
Eliminations | Total HDS |
|
Holdings | ||||||||||||||
ASSETS |
|||||||||||||||||||||
Current assets: |
|||||||||||||||||||||
Cash and cash equivalents |
$ | 233 | $ | 18 | $ | 15 | $ | — | $ | 266 | $ | 3 | |||||||||
Receivables, net |
5 | 852 | 15 | — | 872 | — | |||||||||||||||
Inventories |
— | 753 | 17 | — | 770 | — | |||||||||||||||
Current assets of discontinued operations |
— | 43 | — | — | 43 | — | |||||||||||||||
Other current assets |
9 | 19 | 1 | — | 29 | — | |||||||||||||||
| | | | | | | | | | | | | | | | | | | | | | |
Total current assets |
247 | 1,685 | 48 | — | 1,980 | 3 | |||||||||||||||
| | | | | | | | | | | | | | | | | | | | | | |
Property and equipment, net |
55 | 253 | 2 | — | 310 | — | |||||||||||||||
Goodwill |
— | 2,869 | — | — | 2,869 | — | |||||||||||||||
Intangible assets, net |
— | 125 | 2 | — | 127 | — | |||||||||||||||
Deferred tax asset |
759 | — | 2 | (76 | ) | 685 | — | ||||||||||||||
Non-current assets of discontinued operations |
— | 20 | — | — | 20 | — | |||||||||||||||
Investment in subsidiaries |
2,623 | — | — | (2,623 | ) | — | 742 | ||||||||||||||
Intercompany notes receivable |
2,192 | 627 | — | (2,819 | ) | — | — | ||||||||||||||
Other assets |
20 | 2 | — | — | 22 | — | |||||||||||||||
| | | | | | | | | | | | | | | | | | | | | | |
Total assets |
$ | 5,896 | $ | 5,581 | $ | 54 | $ | (5,518 | ) | $ | 6,013 | $ | 745 | ||||||||
| | | | | | | | | | | | | | | | | | | | | | |
| | | | | | | | | | | | | | | | | | | | | | |
| | | | | | | | | | | | | | | | | | | | | | |
LIABILITIES AND STOCKHOLDER'S EQUITY (DEFICIT) |
|||||||||||||||||||||
Current liabilities: |
|||||||||||||||||||||
Accounts payable |
$ | 12 | $ | 469 | $ | 9 | $ | — | $ | 490 | $ | — | |||||||||
Accrued compensation and benefits |
38 | 101 | 3 | — | 142 | — | |||||||||||||||
Current installments of long-term debt |
9 | — | — | — | 9 | — | |||||||||||||||
Current liabilities of discontinued operations |
— | 30 | — | — | 30 | — | |||||||||||||||
Other current liabilities |
93 | 99 | 7 | — | 199 | — | |||||||||||||||
| | | | | | | | | | | | | | | | | | | | | | |
Total current liabilities |
152 | 699 | 19 | — | 870 | — | |||||||||||||||
| | | | | | | | | | | | | | | | | | | | | | |
Long-term debt, excluding current installments |
4,302 | — | — | — | 4,302 | — | |||||||||||||||
Deferred tax liabilities |
— | 76 | — | (76 | ) | — | — | ||||||||||||||
Non-current liabilities of discontinued operations |
— | 1 | — | — | 1 | — | |||||||||||||||
Intercompany notes payable |
627 | 2,192 | — | (2,819 | ) | — | — | ||||||||||||||
Other liabilities |
73 | 22 | 3 | — | 98 | — | |||||||||||||||
| | | | | | | | | | | | | | | | | | | | | | |
Total liabilities |
5,154 | 2,990 | 22 | (2,895 | ) | 5,271 | — | ||||||||||||||
| | | | | | | | | | | | | | | | | | | | | | |
Stockholders' equity (deficit) |
742 | 2,591 | 32 | (2,623 | ) | 742 | 745 | ||||||||||||||
| | | | | | | | | | | | | | | | | | | | | | |
Total liabilities and stockholders' equity (deficit) |
$ | 5,896 | $ | 5,581 | $ | 54 | $ | (5,518 | ) | $ | 6,013 | $ | 745 | ||||||||
| | | | | | | | | | | | | | | | | | | | | | |
| | | | | | | | | | | | | | | | | | | | | | |
| | | | | | | | | | | | | | | | | | | | | | |
132
HD SUPPLY HOLDINGS, INC. AND SUBSIDIARIES
HD SUPPLY, INC. AND SUBSIDIARIES
NOTES TO CONSOLIDATED FINANCIAL STATEMENTS (Continued)
NOTE 14—GUARANTOR SUBSIDIARIES (Continued)
CONDENSED CONSOLIDATING STATEMENTS OF CASH FLOWS
Amounts in millions
| |
Fiscal Year 2016 | ||||||||||||||||||||
|---|---|---|---|---|---|---|---|---|---|---|---|---|---|---|---|---|---|---|---|---|---|
| |
Debt Issuer |
Subsidiary Guarantors |
Non- Guarantor Subsidiaries |
Eliminations | Total HDS |
|
Holdings | ||||||||||||||
Net cash flows from operating activities |
$ | 524 | $ | (12 | ) | $ | 1 | $ | — | $ | 513 | $ | — | ||||||||
| | | | | | | | | | | | | | | | | | | | | | |
Cash flows from investing activities |
|||||||||||||||||||||
Capital expenditures |
(17 | ) | (63 | ) | (1 | ) | — | (81 | ) | — | |||||||||||
Proceeds from sale of property and equipment |
— | 32 | — | — | 32 | — | |||||||||||||||
Proceeds from sale of businesses, net |
28 | — | — | — | 28 | — | |||||||||||||||
(Investments in) return of capital in equity affiliates |
71 | — | — | (71 | ) | — | — | ||||||||||||||
Proceeds from (payments of) intercompany notes |
— | 43 | — | (43 | ) | — | — | ||||||||||||||
Other investing activities |
— | — | — | — | — | — | |||||||||||||||
| | | | | | | | | | | | | | | | | | | | | | |
Net cash flows from investing activities |
$ | 82 | $ | 12 | $ | (1 | ) | $ | (114 | ) | $ | (21 | ) | $ | — | ||||||
| | | | | | | | | | | | | | | | | | | | | | |
Cash flows from financing activities |
|||||||||||||||||||||
Proceeds from stock options exercised |
— | — | — | — | — | 33 | |||||||||||||||
Purchase of treasury shares |
— | — | — | — | — | (34 | ) | ||||||||||||||
Equity contribution (return of capital) |
— | — | (71 | ) | 71 | — | — | ||||||||||||||
Borrowings from (repayments to) intercompany notes |
(43 | ) | — | — | 43 | — | — | ||||||||||||||
Borrowings of long-term debt |
1,547 | — | — | — | 1,547 | — | |||||||||||||||
Repayments of long-term debt |
(2,631 | ) | — | — | — | (2,631 | ) | — | |||||||||||||
Borrowings on long-term revolver |
629 | — | 60 | — | 689 | — | |||||||||||||||
Repayments on long-term revolver |
(269 | ) | — | — | — | (269 | ) | — | |||||||||||||
Debt issuance and modification fees |
(19 | ) | — | — | — | (19 | ) | — | |||||||||||||
Other financing activities |
(2 | ) | (1 | ) | — | — | (3 | ) | — | ||||||||||||
| | | | | | | | | | | | | | | | | | | | | | |
Net cash flows from financing activities |
(788 | ) | (1 | ) | (11 | ) | 114 | (686 | ) | $ | (1 | ) | |||||||||
| | | | | | | | | | | | | | | | | | | | | | |
Effect of exchange rates on cash |
— | — | 1 | — | 1 | — | |||||||||||||||
| | | | | | | | | | | | | | | | | | | | | | |
Net increase (decrease) in cash & cash equivalents |
$ | (182 | ) | $ | (1 | ) | $ | (10 | ) | $ | — | $ | (193 | ) | $ | (1 | ) | ||||
Cash and cash equivalents at beginning of period |
233 | 18 | 15 | — | 266 | — | |||||||||||||||
| | | | | | | | | | | | | | | | | | | | | | |
Cash and cash equivalents at end of period |
$ | 51 | $ | 17 | $ | 5 | $ | — | $ | 73 | $ | (1 | ) | ||||||||
| | | | | | | | | | | | | | | | | | | | | | |
| | | | | | | | | | | | | | | | | | | | | | |
| | | | | | | | | | | | | | | | | | | | | | |
133
HD SUPPLY HOLDINGS, INC. AND SUBSIDIARIES
HD SUPPLY, INC. AND SUBSIDIARIES
NOTES TO CONSOLIDATED FINANCIAL STATEMENTS (Continued)
NOTE 14—GUARANTOR SUBSIDIARIES (Continued)
Amounts in millions
| |
Fiscal Year 2015 | ||||||||||||||||||||
|---|---|---|---|---|---|---|---|---|---|---|---|---|---|---|---|---|---|---|---|---|---|
| |
Debt Issuer |
Subsidiary Guarantors |
Non- Guarantor Subsidiaries |
Eliminations | Total HDS |
|
Holdings | ||||||||||||||
Net cash flows from operating activities |
$ | 329 | $ | 75 | $ | 18 | $ | — | $ | 422 | $ | — | |||||||||
Cash flows from investing activities |
|||||||||||||||||||||
Capital expenditures |
(18 | ) | (67 | ) | (1 | ) | — | (86 | ) | — | |||||||||||
Proceeds from sale of property and equipment |
— | 3 | — | — | 3 | — | |||||||||||||||
Proceeds from sale of a business, net |
809 | — | — | — | 809 | — | |||||||||||||||
(Investments in) return of capital in equity affiliates |
34 | — | — | (34 | ) | — | — | ||||||||||||||
Proceeds from (payments of) intercompany notes |
— | (16 | ) | — | 16 | — | — | ||||||||||||||
| | | | | | | | | | | | | | | | | | | | | | |
Net cash flows from investing activities |
$ | 825 | $ | (80 | ) | $ | (1 | ) | $ | (18 | ) | $ | 726 | $ | — | ||||||
| | | | | | | | | | | | | | | | | | | | | | |
Cash flows from financing activities |
|||||||||||||||||||||
Proceeds from stock options exercised |
— | — | — | — | — | 74 | |||||||||||||||
Purchase of treasury shares |
— | — | — | — | — | (71 | ) | ||||||||||||||
Equity contribution (return of capital) |
— | (2 | ) | (32 | ) | 34 | — | — | |||||||||||||
Borrowings (repayments) of intercompany notes |
16 | — | — | (16 | ) | — | — | ||||||||||||||
Borrowings of long-term debt |
287 | — | — | — | 287 | — | |||||||||||||||
Repayments of long-term debt |
(1,152 | ) | — | — | — | (1,152 | ) | — | |||||||||||||
Borrowings on long-term revolver |
784 | — | — | — | 784 | — | |||||||||||||||
Repayments of long-term revolver |
(880 | ) | — | — | — | (880 | ) | — | |||||||||||||
Debt issuance and modification fees |
(6 | ) | — | — | — | (6 | ) | — | |||||||||||||
Other financing activities |
2 | — | — | — | 2 | — | |||||||||||||||
| | | | | | | | | | | | | | | | | | | | | | |
Net cash flows from financing activities |
(949 | ) | (2 | ) | (32 | ) | 18 | (965 | ) | $ | 3 | ||||||||||
| | | | | | | | | | | | | | | | | | | | | | |
Effect of exchange rates on cash |
— | — | (2 | ) | — | (2 | ) | — | |||||||||||||
| | | | | | | | | | | | | | | | | | | | | | |
Net increase (decrease) in cash & cash equivalents |
$ | 205 | $ | (7 | ) | $ | (17 | ) | $ | — | $ | 181 | $ | 3 | |||||||
Cash and cash equivalents at beginning of period |
28 | 25 | 32 | — | 85 | — | |||||||||||||||
| | | | | | | | | | | | | | | | | | | | | | |
Cash and cash equivalents at end of period |
$ | 233 | $ | 18 | $ | 15 | $ | — | $ | 266 | $ | 3 | |||||||||
| | | | | | | | | | | | | | | | | | | | | | |
| | | | | | | | | | | | | | | | | | | | | | |
| | | | | | | | | | | | | | | | | | | | | | |
134
HD SUPPLY HOLDINGS, INC. AND SUBSIDIARIES
HD SUPPLY, INC. AND SUBSIDIARIES
NOTES TO CONSOLIDATED FINANCIAL STATEMENTS (Continued)
NOTE 14—GUARANTOR SUBSIDIARIES (Continued)
Amounts in millions
| |
Fiscal Year 2014 | ||||||||||||||||||||
|---|---|---|---|---|---|---|---|---|---|---|---|---|---|---|---|---|---|---|---|---|---|
| |
Debt Issuer |
Subsidiary Guarantors |
Non- Guarantor Subsidiaries |
Eliminations | Total HDS |
|
Holdings | ||||||||||||||
Net cash flows from operating activities |
$ | 191 | $ | 81 | $ | 23 | $ | — | $ | 295 | $ | — | |||||||||
| | | | | | | | | | | | | | | | | | | | | | |
Cash flows from investing activities |
|||||||||||||||||||||
Capital expenditures |
(17 | ) | (102 | ) | — | — | (119 | ) | — | ||||||||||||
Proceeds from sale of property and equipment |
1 | 4 | — | — | 5 | — | |||||||||||||||
Proceeds from sale of a business, net |
198 | — | — | — | 198 | — | |||||||||||||||
(Investments in) return of capital of equity affiliates |
27 | — | — | (27 | ) | — | — | ||||||||||||||
Proceeds from (payments of) intercompany notes |
— | 25 | — | (25 | ) | — | — | ||||||||||||||
| | | | | | | | | | | | | | | | | | | | | | |
Net cash flows from investing activities |
$ | 209 | $ | (73 | ) | $ | — | $ | (52 | ) | $ | 84 | $ | — | |||||||
| | | | | | | | | | | | | | | | | | | | | | |
Cash flows from financing activities |
|||||||||||||||||||||
Proceeds from stock options exercised |
— | — | — | — | — | 48 | |||||||||||||||
Purchase of treasury shares |
— | — | — | — | — | (52 | ) | ||||||||||||||
Equity contribution (return of capital) |
— | — | (27 | ) | 27 | — | — | ||||||||||||||
Borrowings (repayments) of intercompany notes |
(25 | ) | — | — | 25 | — | — | ||||||||||||||
Borrowings of long-term debt |
1,270 | — | — | — | 1,270 | — | |||||||||||||||
Repayments of long-term debt |
(1,385 | ) | — | — | — | (1,385 | ) | — | |||||||||||||
Borrowings on long-term revolver |
878 | — | — | — | 878 | — | |||||||||||||||
Repayments of long-term revolver |
(1,142 | ) | — | — | — | (1,142 | ) | — | |||||||||||||
Debt issuance and modification fees |
(21 | ) | — | — | — | (21 | ) | — | |||||||||||||
| | | | | | | | | | | | | | | | | | | | | | |
Net cash flows from financing activities |
$ | (425 | ) | $ | — | $ | (27 | ) | $ | 52 | $ | (400 | ) | $ | (4 | ) | |||||
| | | | | | | | | | | | | | | | | | | | | | |
Effect of exchange rates on cash |
— | — | (5 | ) | — | (5 | ) | — | |||||||||||||
| | | | | | | | | | | | | | | | | | | | | | |
Net increase (decrease) in cash & cash equivalents |
$ | (25 | ) | $ | 8 | $ | (9 | ) | $ | — | $ | (26 | ) | $ | (4 | ) | |||||
Cash and cash equivalents at beginning of period |
53 | 17 | 41 | — | 111 | 4 | |||||||||||||||
| | | | | | | | | | | | | | | | | | | | | | |
Cash and cash equivalents at end of period |
$ | 28 | $ | 25 | $ | 32 | $ | — | $ | 85 | $ | — | |||||||||
| | | | | | | | | | | | | | | | | | | | | | |
| | | | | | | | | | | | | | | | | | | | | | |
| | | | | | | | | | | | | | | | | | | | | | |
135
HD SUPPLY HOLDINGS, INC. AND SUBSIDIARIES
HD SUPPLY, INC. AND SUBSIDIARIES
NOTES TO CONSOLIDATED FINANCIAL STATEMENTS (Continued)
NOTE 15—QUARTERLY FINANCIAL DATA (UNAUDITED)
The following is a summary of the quarterly consolidated results of operations for the fiscal years ended January 29, 2017 and January 31, 2016 (amounts in millions):
| |
First Quarter |
Second Quarter |
Third Quarter |
Fourth Quarter |
TOTAL | |||||||||||
|---|---|---|---|---|---|---|---|---|---|---|---|---|---|---|---|---|
Fiscal Year 2016 |
||||||||||||||||
Net sales |
$ | 1,781 | $ | 2,016 | $ | 2,008 | $ | 1,634 | $ | 7,439 | ||||||
Gross profit |
609 | 680 | 683 | 560 | 2,532 | |||||||||||
Income (loss) from continuing operations |
(22 | ) | 168 | 107 | 90 | 204 | ||||||||||
Income (loss) from discontinued operations |
— | (4 | ) | (4 | ) | — | (8 | ) | ||||||||
Net income (loss) |
(14 | ) | 98 | 60 | 52 | 196 | ||||||||||
Basic earnings (loss) per share(1) |
||||||||||||||||
Income (loss) from continuing operations |
$ | (0.07 | ) | $ | 0.51 | $ | 0.32 | $ | 0.26 | $ | 1.02 | |||||
Income (loss) from discontinued operations |
— | (0.02 | ) | (0.02 | ) | — | (0.04 | ) | ||||||||
Net income (loss) |
(0.07 | ) | 0.49 | 0.30 | 0.26 | 0.98 | ||||||||||
Diluted earnings (loss) per share(1) |
||||||||||||||||
Income (loss) from continuing operations |
$ | (0.07 | ) | $ | 0.51 | $ | 0.32 | $ | 0.26 | $ | 1.01 | |||||
Income (loss) from discontinued operations |
— | (0.02 | ) | (0.02 | ) | — | (0.04 | ) | ||||||||
Net income (loss) |
(0.07 | ) | 0.49 | 0.30 | 0.26 | 0.97 | ||||||||||
Fiscal Year 2015 |
||||||||||||||||
Net sales |
$ | 1,660 | $ | 1,937 | $ | 1,942 | $ | 1,584 | $ | 7,123 | ||||||
Gross profit |
559 | 648 | 648 | 534 | 2,389 | |||||||||||
Income (loss) from continuing operations |
234 | 104 | 15 | 973 | 1,326 | |||||||||||
Income (loss) from discontinued operations |
8 | 5 | 235 | (102 | ) | 146 | ||||||||||
Net income (loss) |
242 | 109 | 250 | 871 | 1,472 | |||||||||||
Basic earnings (loss) per share(1) |
||||||||||||||||
Income (loss) from continuing operations |
$ | 1.20 | $ | 0.53 | $ | 0.08 | $ | 4.91 | $ | 6.73 | ||||||
Income (loss) from discontinued operations |
0.04 | 0.03 | 1.19 | (0.51 | ) | 0.74 | ||||||||||
Net income (loss) |
1.24 | 0.55 | 1.27 | 4.39 | 7.47 | |||||||||||
Diluted earnings (loss) per share(1) |
||||||||||||||||
Income (loss) from continuing operations |
$ | 1.17 | $ | 0.52 | $ | 0.07 | $ | 4.84 | $ | 6.59 | ||||||
Income (loss) from discontinued operations |
0.04 | 0.02 | 1.17 | (0.51 | ) | 0.73 | ||||||||||
Net income (loss) |
1.21 | 0.54 | 1.24 | 4.33 | 7.31 | |||||||||||
- (1)
- Basic and Diluted earnings (loss) per share are based on shares outstanding for Holdings. Quarterly earnings per share amounts may not foot due to rounding. In addition, quarterly earnings per share amounts may not add to full-year earnings per share amounts due to the difference in weighted-average common shares for the quarters versus the weighted-average common shares for the year.
Income (loss) from continuing operations and Net income (loss) in the first quarter of fiscal 2016 includes a loss on extinguishment of debt of $115 million. Income (loss) from continuing operations and Net income (loss) in the third quarter of fiscal 2016 includes a loss on extinguishment of debt of $59 million.
136
HD SUPPLY HOLDINGS, INC. AND SUBSIDIARIES
HD SUPPLY, INC. AND SUBSIDIARIES
NOTES TO CONSOLIDATED FINANCIAL STATEMENTS (Continued)
NOTE 15—QUARTERLY FINANCIAL DATA (UNAUDITED) (Continued)
Income (loss) from continuing operations and Net income (loss) in the first quarter of fiscal 2015 includes a $189 million tax settlement with the IRS. Income (loss) from continuing operations and Net income (loss) in the second quarter of fiscal 2015 includes a loss on extinguishment and modification of debt of $100 million. Income (loss) from continuing operations and Net income (loss) in the fourth quarter of fiscal 2015 includes a $1,007 million benefit in provision for income taxes from the reversal of the valuation allowance on the Company's net U.S. deferred tax assets.
137
ITEM 9. CHANGES IN AND DISAGREEMENTS WITH ACCOUNTANTS ON ACCOUNTING AND FINANCIAL DISCLOSURE
None.
ITEM 9A. CONTROLS AND PROCEDURES
Disclosure Controls and Procedures
HD Supply Holdings, Inc.
Under the supervision and with the participation of our management, including the Chief Executive Officer and Chief Financial Officer of HD Supply Holdings, Inc., we have evaluated the effectiveness of our disclosure controls and procedures as required by Exchange Act Rule 13a-15(b) as of the end of the period covered by this report. Based on that evaluation, the Chief Executive Officer and Chief Financial Officer have concluded that the HD Supply Holdings, Inc. disclosure controls and procedures were effective as of January 29, 2017 (the end of the period covered by this report).
HD Supply, Inc.
Under the supervision and with the participation of our management, including the Chief Executive Officer and Chief Financial Officer of HD Supply, Inc., we have evaluated the effectiveness of our disclosure controls and procedures as required by Exchange Act Rule 13a-15(b) as of the end of the period covered by this report. Based on that evaluation, the Chief Executive Officer and Chief Financial Officer have concluded that the HD Supply, Inc. disclosure controls and procedures were effective as of January 29, 2017 (the end of the period covered by this report).
Change in Internal Control over Financial Reporting
There were no changes in Holdings' or HDS's internal control over financial reporting, as defined in the Exchange Act Rules 13a-15(f) or 15d- 15(f), during the fourth quarter of fiscal 2016 that have materially affected, or are reasonably likely to materially affect, Holdings' or HDS's internal control over financial reporting.
Management's Report on Internal Control over Financial Reporting
Management of Holdings and HDS are responsible for establishing and maintaining adequate internal control over financial reporting, as such term is defined in Securities Exchange Act of 1934 Rule 13a-15(f). Holdings' and HDS' internal control over financial reporting is a process designed to provide reasonable assurance regarding the reliability of financial reporting and the preparation of financial statements for external purposes in accordance with generally accepted accounting principles. Holdings' and HDS' internal control over financial reporting includes those policies and procedures that: (i) pertain to the maintenance of records that, in reasonable detail, accurately and fairly reflect the transactions and dispositions of the assets of Holdings and HDS; (ii) provide reasonable assurance that transactions are recorded as necessary to permit preparation of financial statements in accordance with generally accepted accounting principles, and that receipts and expenditures of Holdings and HDS are being made only in accordance with authorizations of management and directors of Holdings and HDS; and (iii) provide reasonable assurance regarding prevention or timely detection of unauthorized acquisition, use, or disposition of Holdings' and HDS' assets that could have a material effect on the financial statements.
Because of its inherent limitations, internal control over financial reporting may not prevent or detect misstatements. Also, projections of any evaluation of effectiveness to future periods are subject to the risk that controls may become inadequate because of changes in conditions, or that the degree of compliance with the policies or procedures may deteriorate.
138
The management of Holdings and HDS assessed the effectiveness of Holdings' and HDS' internal control over financial reporting as of January 29, 2017 based on the framework set forth by the Committee of Sponsoring Organizations of the Treadway Commission in Internal Control—Integrated Framework (2013). Based on that assessment, management concluded that, as of January 29, 2017, Holdings' and HDS' internal control over financial reporting is effective based on the criteria established in Internal Control—Integrated Framework (2013).
Holdings' and HDS' internal control over financial reporting as of January 29, 2017 has been audited by PricewaterhouseCoopers, LLP, an independent registered public accounting firm, as stated in their accompanying report which expresses an unqualified opinion on the effectiveness of the Company's internal control over financial reporting as of January 29, 2017.
None.
139
Item 10. DIRECTORS, EXECUTIVE OFFICERS AND CORPORATE GOVERNANCE
The information required by this Item for Holdings will be set forth in Holdings' Proxy Statement for the 2017 Annual Meeting of Stockholders which information is hereby incorporated herein by reference.
HDS has omitted the information required by this Item pursuant to General Instruction I to the Form 10-K.
Item 11. EXECUTIVE COMPENSATION
The information required by this Item for Holdings will be set forth in Holdings' Proxy Statement for the 2017 Annual Meeting of Stockholders which information is hereby incorporated herein by reference.
HDS has omitted the information required by this Item pursuant to General Instruction I to the Form 10-K.
Item 12. SECURITY OWNERSHIP OF CERTAIN BENEFICIAL OWNERS AND MANAGEMENT AND RELATED STOCKHOLDER MATTERS
The information required by this Item for Holdings will be set forth in Holdings' Proxy Statement for the 2017 Annual Meeting of Stockholders which information is hereby incorporated herein by reference.
HDS has omitted the information required by this Item pursuant to General Instruction I to the Form 10-K.
Item 13. CERTAIN RELATIONSHIPS AND RELATED TRANSACTIONS, AND DIRECTOR INDEPENDENCE
The information required by this Item for Holdings will be set forth in Holdings' Proxy Statement for the 2017 Annual Meeting of Stockholders which information is hereby incorporated herein by reference.
HDS has omitted the information required by this Item pursuant to General Instruction I to the Form 10-K.
Item 14. PRINCIPAL ACCOUNTING FEES AND SERVICES
Aggregate fees billed to us for the fiscal years ended January 29, 2017 and January 31, 2016 by our independent registered public accountants, PricewaterhouseCoopers LLP and its respective affiliates were:
Fees Billed
|
Fiscal 2016 | Fiscal 2015 | |||||
|---|---|---|---|---|---|---|---|
Audit Fee(1) |
$ | 3.2 million | $ | 3.1 million | |||
Audited-Related Fees(2) |
$ | — | $ | 2.6 million | |||
Tax Fees(3) |
$ | 0.5 million | $ | 1.0 million | |||
All Other Fees(4) |
$ | — | $ | 0.2 million | |||
Total |
$ | 3.7 million | $ | 6.9 million | |||
- (1)
- Includes fees and expenses for the audit of our annual financial statements, review of our quarterly financial statements, statutory audits of foreign subsidiary financial statements and services associated with securities filings.
140
- (2)
- Includes
fees and expenses for assurance and related services that are not included in Audit Fees. These fees principally include services in connection with the
divestiture of certain businesses.
- (3)
- Includes
fees and expenses for tax planning, consultation, and compliance services.
- (4)
- Includes fees and expenses for services related to due diligence and other permissible advisory services not included in in the above categories.
The Audit Committee's policy is to pre-approve all audit and permissible non-audit services (including the fees and terms thereof) performed for us by the independent registered certified public accounting firm, subject to the de minimis exceptions for non-audit services described by the Exchange Act and the rules and regulations thereunder which are approved by the Audit Committee prior to the completion of the audit. The Audit Committee approved all services provided by PricewaterhouseCoopers LLP during fiscal 2016 and fiscal 2015.
141
ITEM 15. EXHIBITS AND FINANCIAL STATEMENT SCHEDULES
(a)(1) Financial Statements
The following financial statements are set forth in Item 8 hereof:
142
(b) Exhibit Index
The following exhibits are filed or furnished with this annual report:
| Exhibit Number |
Exhibit Description | ||
|---|---|---|---|
| 2.1 | Purchase and Sale Agreement, dated as of June 19, 2007, among The Home Depot, Inc., THD Holdings, LLC, Home Depot International, Inc., Homer TLC, Inc. and Pro Acquisition Corporation.(1) | ||
| 2.2 | Letter Agreement, dated August 14, 2007, among The Home Depot, Inc., THD Holdings, LLC, Home Depot International, Inc., Homer TLC, Inc. and Pro Acquisition Corporation.(1) | ||
| 2.3 | Amendment, dated as of August 27, 2007, among The Home Depot, Inc., THD Holdings, LLC, Home Depot International, Inc., Homer TLC, Inc. and HDS Investment Holding, Inc. and HDS Acquisition Subsidiary, Inc.(1) | ||
| 3.1 | Second Amended and Restated Certificate of Incorporation of HD Supply Holdings, Inc.(8) | ||
| 3.2 | Third Amended and Restated By-Laws of HD Supply Holdings, Inc.(8) | ||
| 3.3 | Certificate of Incorporation of HD Supply, Inc.(1) | ||
| 3.4 | Certificate of Amendment of Certificate of Incorporation of HD Supply, Inc.(10) | ||
| 3.5 | Amended and Restated By-Laws of HD Supply, Inc.(10) | ||
| 4.1 | Indenture, dated as of December 4, 2014, among HD Supply, Inc., as issuer, the Subsidiary Guarantors from time to time parties thereto, and Wilmington Trust, National Association, as trustee and note collateral agent, relating to the 5.25% Senior Secured First Priority Notes due 2021.(12) | ||
| 4.2 | First Supplemental Indenture, dated as of December 4, 2014, among HD Supply, Inc., as issuer, the Subsidiary Guarantors named therein, and Wilmington Trust, National Association, as trustee, relating to the 5.25% Senior Secured First Priority Notes due 2021.(12) | ||
| 4.3 | Indenture, dated as of April 11, 2016, among HD Supply, Inc., as issuer, the Subsidiary Guarantors from time to time parties thereto, and Wells Fargo Bank, National Association, as trustee, relating to the 5.75% Senior Notes due 2024.(16) | ||
| 4.4 | First Supplemental Indenture, dated as of April 11, 2016, among HD Supply, Inc., as issuer, the Subsidiary Guarantors from time to time parties thereto, and Wells Fargo Bank, National Association, as trustee, relating to the 5.75% Senior Notes due 2024.(16) | ||
| 4.5 | Form of 5.25% Senior Secured First Priority Note due 2021.(12) | ||
| 4.6 | Form of 5.75% Senior Note due 2024.(16) | ||
| 4.7 | Form of Common Stock Certificate.(7) | ||
| 10.1 | Credit Agreement, dated as of April 12, 2012, among HD Supply, Inc., as borrower, the several lenders and financial institutions from time to time parties thereto, Bank of America, N.A., as administrative agent and collateral agent for the lenders party thereto, and the other parties thereto.(4) | ||
| 10.2 | Amendment No. 1 to Credit Agreement, dated as of February 15, 2013, among HD Supply, Inc., as borrower, Bank of America, N.A., as administrative agent and the several lenders and financial institutions party thereto.(6) | ||
143
| Exhibit Number |
Exhibit Description | ||
|---|---|---|---|
| 10.3 | Amendment No. 2 to Credit Agreement, dated as of February 6, 2014, among HD Supply, Inc., as borrower, Bank of America, N.A., as administrative agent and the several lenders and financial institutions party thereto.(11) | ||
| 10.4 | Incremental Agreement No. 1, dated as of August 13, 2015, among HD Supply, Inc., as borrower, the subsidiary guarantor parties named therein, Bank of America, N.A., as administrative agent and incremental term loan lender, and the other lender parties thereto.(14) | ||
| 10.5 | Fourth Amendment to Credit Agreement, dated as of October 14, 2016, among HD Supply, Inc., as borrower, Bank of America, N.A., as administrative agent, Term B-1 Lender and Term B-2 Lender, and the several lenders and financial institutions party thereto.(18) | ||
| 10.6 | Guarantee and Collateral Agreement, dated as of April 12, 2012 among HD Supply, Inc., the Subsidiary Guarantors named therein, in favor of Bank of America, N.A., as administrative agent and collateral agent for the banks and other financial institutions from time to time parties to the Credit Agreement.(4) | ||
| 10.7 | Assumption Agreement, dated as of July 27, 2012, made by Varsity AP Holding Corporation, GCP Amerifile Coinvest Inc., Varsity AP Holdings LLC, Amerifile, LLC, Peachtree Business Products, LLC and AP RE LLC in favor of Bank of America, N.A., as collateral agent and administrative for the lenders party to the Credit Agreement, and the other parties thereto.(5) | ||
| 10.8 | Supplemental Agreement, dated as of July 27, 2012, made by HD Supply Holdings, LLC in favor of Bank of America, N.A., as collateral agent and administrative for the lenders party to the Credit Agreement, and the other parties thereto.(5) | ||
| 10.9 | Assumption Agreement, dated as of February 6, 2014, made by HD Supply FM Services, LLC in favor of Bank of America, N.A., as collateral agent and administrative for the lenders party to the Credit Agreement, and the other parties thereto.(11) | ||
| 10.10 | Supplemental Agreement, dated as of February 6, 2014, made by HD Supply Holdings, LLC and HD Supply Facilities Maintenance, Ltd.in favor of Bank of America, N.A., as collateral agent and administrative for the lenders party to the Credit Agreement, and the other parties thereto.(11) | ||
| 10.11 | Holding Pledge Agreement, dated as of April 12, 2012, by HDS Holding Corporation in favor of Bank of America, N.A., as collateral agent and administrative agent for the banks and other financial institutions from time to time parties to the Credit Agreement.(4) | ||
| 10.12 | ABL Credit Agreement, dated as of April 12, 2012, among HD Supply, Inc., as parent borrower, the Subsidiary Borrowers from time to time parties thereto, HD Supply Canada, Inc., as Canadian borrower, the several lenders and financial institutions from time to time parties thereto, Wells Fargo Bank, National Association (as successor in interest to General Electric Capital Corporation), as administrative agent and U.S. ABL collateral agent for the lenders party thereto, Wells Fargo Capital Finance Corporation Canada (as successor in interest to GE Canada Finance Holding Company), as Canadian agent and Canadian collateral agent for the lenders party thereto, and the other parties thereto.(4) | ||
144
| Exhibit Number |
Exhibit Description | ||
|---|---|---|---|
| 10.13 | Amendment No. 1 to ABL Credit Agreement, dated as of June 28, 2013, by and among the HD Supply, Inc., the other borrowers party thereto, the lenders party thereto, Wells Fargo Bank, National Association (as successor in interest to General Electric Capital Corporation), as administrative agent and U.S. ABL collateral agent, and Wells Fargo Capital Finance Corporation Canada (as successor in interest to GE Canada Finance Holding Company), as Canadian agent and Canadian collateral agent.(9) | ||
| 10.14 | ABL Joinder Agreement, dated as of July 27, 2012, among HD Supply, Inc., as parent borrower, certain operating subsidiaries of the Parent Borrower signatory thereto and consented to by the other Loan Parties, Wells Fargo Bank, National Association (as successor in interest to General Electric Capital Corporation), as administrative agent and U.S. ABL collateral agent for the lenders party to the ABL Credit Agreement, Wells Fargo Capital Finance Corporation Canada (as successor in interest to GE Canada Finance Holding Company), as Canadian agent and Canadian collateral agent for the lenders party to the ABL Credit Agreement.(5) | ||
| 10.15 | ABL Joinder Agreement, dated as of February 6, 2014, among HD Supply, Inc., as parent borrower, HD Supply FM Services, LLC and consented to by the other Loan Parties, Wells Fargo Bank, National Association (as successor in interest to General Electric Capital Corporation), as administrative agent and U.S. ABL collateral agent for the lenders party to the ABL Credit Agreement, Wells Fargo Capital Finance Corporation Canada (as successor in interest to GE Canada Finance Holding Company), as Canadian agent and Canadian collateral agent for the lenders party to the ABL Credit Agreement.(11) | ||
| 10.16 | U.S. Guarantee and Collateral Agreement, dated as of April 12, 2012, among HD Supply, Inc., the Subsidiary Borrowers named therein, the Subsidiary Guarantors named therein, in favor of Wells Fargo Bank, National Association (as successor in interest to General Electric Capital Corporation), as U.S. ABL administrative agent and U.S. ABL collateral agent for the banks and other financial institutions from time to time parties to the ABL Credit Agreement.(4) | ||
| 10.17 | Assumption Agreement, dated as of July 27, 2012, made by Varsity AP Holding Corporation, GCP Amerifile Coinvest Inc., Varsity AP Holdings LLC, Amerifile, LLC, Peachtree Business Products, LLC and AP RE LLC in favor of Wells Fargo Bank, National Association (as successor in interest to General Electric Capital Corporation), as administrative agent and U.S. ABL collateral agent for the lenders party to the ABL Credit Agreement, and the other parties thereto.(5) | ||
| 10.18 | Supplemental Agreement, dated as of July 27, 2012, made by HD Supply Holdings, LLC in favor of Wells Fargo Bank, National Association (as successor in interest to General Electric Capital Corporation), as administrative agent and U.S. ABL collateral agent for the lenders party to the ABL Credit Agreement, and the other parties thereto.(5) | ||
| 10.19 | Assumption Agreement, dated as of February 6, 2014, made by HD Supply FM Services, LLC in favor of Wells Fargo Bank, National Association (as successor in interest to General Electric Capital Corporation), as administrative agent and U.S. ABL collateral agent for the lenders party to the ABL Credit Agreement, and the other parties thereto.(11) | ||
| 10.20 | Supplemental Agreement, dated as of February 6, 2014, made by HD Supply Holdings, LLC and HD Supply Facilities Maintenance, Ltd. in favor of Wells Fargo Bank, National Association (as successor in interest to General Electric Capital Corporation), as administrative agent and U.S. ABL collateral agent for the lenders party to the ABL Credit Agreement, and the other parties thereto.(11) | ||
145
| Exhibit Number |
Exhibit Description | ||
|---|---|---|---|
| 10.21 | ABL Holding Pledge Agreement, dated as of April 12, 2012, by HDS Holding Corporation in favor of Wells Fargo Bank, National Association (as successor in interest to General Electric Capital Corporation), as administrative agent and collateral agent for the banks and other financial institutions from time to time parties to the ABL Credit Agreement.(4) | ||
| 10.22 | Collateral Agreement, dated as of December 4, 2014, made by HD Supply, Inc. and the Subsidiaries named therein in favor of Wilmington Trust, National Association, as note collateral agent, relating to the 5.25% Senior Secured First Priority Notes due 2021.(12) | ||
| 10.23 | Intercreditor Agreement, dated as of April 12, 2012, among the Bank of America, N.A., as collateral agent for the banks and other financial institutions party to the Credit Agreement, Wells Fargo Bank, National Association (as successor in interest to General Electric Capital Corporation), as collateral agent for the banks and other financial institutions party to the ABL Credit Agreement, Wilmington Trust, National Association, as note collateral agent for the 81/8% Senior Secured First Priority Notes due 2019, and Wilmington Trust, National Association, as note collateral agent for the 11% Senior Secured Second Priority Notes due 2020.(4) | ||
| 10.24 | Joinder to the Intercreditor Agreement, dated as of December 4, 2014, among Bank of America, N.A., as collateral agent for the banks and other financial institutions party to the Credit Agreement, Wilmington Trust, National Association, as note collateral agent for the 81/8% Senior Secured First Priority Notes due 2019, Wilmington Trust, National Association, as note collateral agent for the 11% Senior Secured Second Priority Notes due 2020, and Wilmington Trust, National Association, as note collateral agent for the 5.25% Senior Secured First Priority Notes due 2012.(12) | ||
| 10.25 | Cash Flow Intercreditor Agreement, dated as of April 12, 2012, among Bank of America, N.A., as collateral agent for the banks and other financial institutions party to the Credit Agreement, Wilmington Trust, National Association, as note collateral agent for the 81/8% Senior Secured First Priority Notes due 2019, and Wilmington Trust, National Association, as note collateral agent for the 11% Senior Secured Second Priority Notes due 2020.(4) | ||
| 10.26 | Joinder to the Cash Flow Intercreditor Agreement, dated as of December 4, 2014, among Bank of America, N.A., as collateral agent for the banks and other financial institutions party to the Credit Agreement, Wilmington Trust, National Association, as note collateral agent for the 81/8% Senior Secured First Priority Notes due 2019, Wilmington Trust, National Association, as note collateral agent for the 11% Senior Secured Second Priority Notes due 2020, and Wilmington Trust, National Association, as note collateral agent for the 5.25% Senior Secured First Priority Notes due 2021.(12) | ||
| 10.27 | Notice and Confirmation of Grant of Security Interest in Trademarks, dated as of December 4, 2014, made by subsidiaries of HD Supply, Inc. named therein in favor of Bank of America, N.A., as administrative agent and collateral agent for the banks and other financial institutions that are parties to the Credit Agreement.(12) | ||
| 10.28 | Grant of Security Interest in Copyrights, dated as of April 12, 2012, made by subsidiaries of HD Supply, Inc. named therein in favor of Bank of America, N.A., as administrative agent and collateral agent for the banks and other financial institutions that are parties to the Credit Agreement.(4) | ||
146
| Exhibit Number |
Exhibit Description | ||
|---|---|---|---|
| 10.29 | ABL Notice and Confirmation of Grant of Security Interest in Trademarks, dated as of December 4, 2014, made by subsidiaries of HD Supply, Inc. named therein in favor of Wells Fargo Bank, National Association (as successor in interest to General Electric Capital Corporation), as administrative agent and collateral agent for the banks and other financial institutions that are parties to the ABL Credit Agreement.(12) | ||
| 10.30 | ABL Grant of Security Interest in Copyrights, dated as of April 12, 2012, made by subsidiaries of HD Supply, Inc. named therein in favor of Wells Fargo Bank, National Association (as successor in interest to General Electric Capital Corporation), as administrative agent and collateral agent for the banks and other financial institutions that are parties to the ABL Credit Agreement.(4) | ||
| 10.31 | First Lien Secured Note Notice and Confirmation of Grant of Security Interest in Trademarks, dated as of December 4, 2014, made by subsidiaries of HD Supply, Inc. named therein in favor of Wilmington Trust, National Association, as note collateral agent, relating to the 5.25% Senior Secured First Priority Notes due 2021.(12) | ||
| 10.32 | First Lien Secured Note Grant of Security Interest in Copyrights, dated as of December 4, 2014, made by subsidiaries of HD Supply, Inc. named therein in favor of Wilmington Trust, National Association, as note collateral agent, relating to the 5.25% Senior Secured First Priority Notes due 2021.(12) | ||
| 10.33 | # | HDS Investment Holding, Inc. Stock Incentive Plan.(3) | |
| 10.34 | # | Home Depot Retention Agreement with Joseph DeAngelo, effective August 30, 2007.(1) | |
| 10.35 | # | Letter of Continued Employment, dated as of August 10, 2007, by Pro Acquisition Corporation in favor of Joseph J. DeAngelo.(2) | |
| 10.36 | # | Separation Agreement & Release of Claims, dated as of January 4, 2017, among HD Supply, Inc., HD Supply Holdings, Inc. and Margaret M. Newman.(19) | |
| 10.37 | # | Letter of Employment, dated as of December 9, 2013, by and between HD Supply, Inc. and Evan J. Levitt.(11) | |
| 10.38 | # | Letter of Employment, dated as of March 27, 2010, by and between HD Supply, Inc. and John Stegeman.(2) | |
| 10.39 | Tax Sharing Agreement, dated as of August 30, 2007, by and among HDS Investment Holding, Inc., HDS Acquisition Subsidiary, Inc. (which has been merged into HD Supply, Inc.), HDS Holding Corporation and HD Supply, Inc.(1) | ||
| 10.40 | Indemnification Agreement, dated as of August 30, 2007, by and among The Home Depot, Inc., HDS Investment Holding, Inc. and HD Supply, Inc.(1) | ||
| 10.41 | Form of Director Indemnification Agreement.(9) | ||
| 10.42 | Form of Director Indemnification Agreement (March 2017).(27) | ||
| 10.43 | Schedule of Signatories to a Director Indemnification Agreement.(19) | ||
| 10.44 | # | Form of Employee Stock Option Agreement.(2) | |
| 10.45 | # | Form of HD Supply Holdings, Inc. Employee Stock Option Agreement.(7) | |
| 10.46 | # | Form of Employee Stock Option Agreement (November 2015).(13) | |
| 10.47 | # | Form of Change of Control Agreement.(17) | |
147
| Exhibit Number |
Exhibit Description | ||
|---|---|---|---|
| 10.48 | # | HD Supply Holdings, Inc. 2013 Omnibus Incentive Plan.(7) | |
| 10.49 | # | HD Supply Holdings, Inc. Annual Incentive Plan.(7) | |
| 10.50 | # | HD Supply Holdings, Inc. Employee Stock Purchase Plan.(7) | |
| 10.51 | # | Form of Director Restricted Stock Unit Agreement.(7) | |
| 10.52 | # | Form of Director Deferred Stock Unit Agreement.(7) | |
| 10.53 | # | Board of Directors Compensation Policy (March 2015).(12) | |
| 10.54 | # | Form of Restricted Stock Agreement for Executive Officers And Associates.(11) | |
| 10.55 | # | Form of Employee Restricted Stock Agreement (November 2015).(13) | |
| 12.1 | Computation of Ratio of Earnings to Fixed Charges.(19) | ||
| 18.1 | Preferability Letters.(12) | ||
| 21.1 | List of Subsidiaries.(19) | ||
| 23.1 | Consent of PricewaterhouseCoopers LLP.(19) | ||
| 31.1 | Certification of President and Chief Executive Officer of HD Supply Holdings, Inc. pursuant to Section 302(a) of the Sarbanes-Oxley Act of 2002.(19) | ||
| 31.2 | Certification of Senior Vice President and Chief Financial Officer of HD Supply Holdings, Inc. pursuant to Section 302(a) of the Sarbanes-Oxley Act of 2002.(19) | ||
| 31.3 | Certification of President and Chief Executive Officer of HD Supply, Inc. pursuant to Section 302(a) of the Sarbanes-Oxley Act of 2002.(19) | ||
| 31.4 | Certification of Senior Vice President and Chief Financial Officer of HD Supply, Inc. pursuant to Section 302(a) of the Sarbanes-Oxley Act of 2002.(19) | ||
| 32.1 | Certification of President and Chief Executive Officer of HD Supply Holdings, Inc. pursuant to 18 U.S.C. Section 1350, as adopted pursuant to Section 906 of the Sarbanes-Oxley Act of 2002.(19) | ||
| 32.2 | Certification of Senior Vice President and Chief Financial Officer of HD Supply Holdings, Inc. pursuant to 18 U.S.C. Section 1350, as adopted pursuant to Section 906 of the Sarbanes-Oxley Act of 2002.(19) | ||
| 32.3 | Certification of President and Chief Executive Officer of HD Supply, Inc. pursuant to 18 U.S.C. Section 1350, as adopted pursuant to Section 906 of the Sarbanes-Oxley Act of 2002.(19) | ||
| 32.4 | Certification of Senior Vice President and Chief Financial Officer of HD Supply, Inc. pursuant to 18 U.S.C. Section 1350, as adopted pursuant to Section 906 of the Sarbanes-Oxley Act of 2002.(19) | ||
| 101 | Interactive data files pursuant to Rule 405 of Regulation S-T.(19) | ||
- 1)
- Previously
filed in Amendment No. 1 to Form S-4 of HD Supply, Inc. (File No. 333-159809) filed on July 10, 2009.
- (2)
- Previously
filed in Form 10-K of HD Supply, Inc. (File No. 333-159809) filed on April 13, 2010.
- (3)
- Previously filed in Form 10-K of HD Supply, Inc. (File No. 333-159809) filed on April 14, 2011.
148
- (4)
- Previously
filed in Form 10-Q of HD Supply, Inc. (File No. 333-159809) filed on June 7, 2012.
- (5)
- Previously
filed in Form 10-Q of HD Supply, Inc. (File No. 333-159809) filed on September 4, 2012.
- (6)
- Previously
filed in Form 10-K of HD Supply, Inc. (File No. 333-159809) filed on April 16, 2013.
- (7)
- Previously
filed in Amendment No. 3 to Form S-1 of HD Supply Holdings, Inc. (File No. 333-187-872) filed on June 13, 2013.
- (8)
- Previously
filed in Form S-8 of HD Supply Holdings, Inc. (File No. 333-189771) filed on July 2, 2013.
- (9)
- Previously
filed in Form 10-Q of HD Supply Holdings, Inc. (File No. 001-35979) and HD Supply, Inc. (File No. 333-159809) filed on
September 10, 2013.
- (10)
- Previously
filed in Form 8-K of HD Supply, Inc. (File No. 333-159809) filed on July 9, 2013.
- (11)
- Previously
filed in Form 10-K of HD Supply Holdings, Inc. (File No. 001-35979) and HD Supply, Inc. (File No. 333-159809) filed on
March 25, 2014.
- (12)
- Previously
filed in Form 10-K of HD Supply Holdings, Inc. (File No. 001-35979) and HD Supply, Inc. (File No. 333-159809) filed on
March 25, 2015.
- (13)
- Previously
filed in Form 10-Q of HD Supply Holdings, Inc. (File No. 001-35979) and HD Supply, Inc. (File No. 333-159809) filed on
December 8, 2015.
- (14)
- Previously
filed in Form 10-Q of HD Supply Holdings, Inc. (File No. 001-35979) and HD Supply, Inc. (File No. 333-159809) filed on
September 9, 2015.
- (15)
- Previously
filed in Form 10-K of HD Supply Holdings, Inc. (File No. 001-35979) and HD Supply, Inc. (File No. 333-159809) filed on
March 18, 2016.
- (16)
- Previously
filed in Form 10-Q of HD Supply Holdings, Inc. (File No. 001-35979) and HD Supply, Inc. (File No. 333-159809) filed on
June 7, 2016.
- (17)
- Previously
filed in Form 8-K of HD Supply Holdings, Inc. (File No. 001-35979) and HD Supply, Inc. (File No. 333-159809) filed on
November 14, 2016.
- (18)
- Previously
filed in Form 10-Q of HD Supply Holdings, Inc. (File No. 001-35979) and HD Supply, Inc. (File No. 333-159809) filed on
December 6, 2016.
- (19)
- Filed
herewith.
- #
- Management contract or compensatory plan or arrangement.
149
(c) Financial Statement Schedules
HD SUPPLY
SCHEDULE II—VALUATION AND QUALIFYING ACCOUNTS
(Amounts in millions)
Accounts Receivable Allowance for Doubtful Accounts:
| |
Balance at Beginning of Period |
Acquisition or Disposition of Business Adjustment |
Charges to Expense / (Income) |
Doubtful Accounts Written Off, Net |
Other Adjustments |
Balance at End of Period |
|||||||||||||
|---|---|---|---|---|---|---|---|---|---|---|---|---|---|---|---|---|---|---|---|
Fiscal Year ended: |
|||||||||||||||||||
February 1, 2015 |
$ | 18 | — | 6 | (8 | ) | — | $ | 16 | ||||||||||
January 31, 2016 |
$ | 16 | (1 | ) | 7 | (8 | ) | — | $ | 14 | |||||||||
January 29, 2017 |
$ | 14 | (1 | ) | 6 | (6 | ) | — | $ | 13 | |||||||||
Deferred Tax Valuation Allowances:
| |
Balance at Beginning of Period |
Charges to Expense (Benefit) |
Balance at End of Period |
|||||||
|---|---|---|---|---|---|---|---|---|---|---|
Fiscal Year ended: |
||||||||||
February 1, 2015 |
$ | 996 | 17 | $ | 1,013 | |||||
January 31, 2016 |
$ | 1,013 | (1,007 | ) | $ | 6 | ||||
January 29, 2017 |
$ | 6 | (1 | ) | $ | 5 | ||||
150
Pursuant to the requirements of Section 13 or 15(d) of the Securities Exchange Act of 1934, the registrant has duly caused this report to be signed on its behalf by the undersigned, hereunto duly authorized.
| HD Supply Holdings, Inc. | ||||||
By: |
/s/ JOSEPH J. DEANGELO |
|||||
| Name: | Joseph J. DeAngelo | |||||
| Title: | President and Chief Executive Officer | |||||
| Date: March 13, 2017 |
||||||
Pursuant to the requirements of the Securities Exchange Act of 1934, this report has been signed below by the following persons on behalf of the registrant and in the capacities and on the dates indicated.
Signature
|
Capacity
|
Date
|
||
|---|---|---|---|---|
| /s/ JOSEPH J. DEANGELO Joseph J. DeAngelo |
President and Chief Executive Officer, Chairman (Principal Executive Officer) | March 13, 2017 | ||
/s/ EVAN J. LEVITT Evan J. Levitt |
Senior Vice President and Chief Financial Officer (Principal Financial Officer & Principal Accounting Officer) |
March 13, 2017 |
||
/s/ KATHLEEN J. AFFELDT Kathleen J. Affeldt |
Director |
March 13, 2017 |
||
/s/ JOHN W. ALDEN John W. Alden |
Director |
March 13, 2017 |
||
/s/ BETSY S. ATKINS Betsy S. Atkins |
Independent Lead Director |
March 13, 2017 |
||
/s/ PETER A. DORSMAN Peter A. Dorsman |
Director |
March 13, 2017 |
||
/s/ PETER A. LEAV Peter A. Leav |
Director |
March 13, 2017 |
151
Signature
|
Capacity
|
Date
|
||
|---|---|---|---|---|
| /s/ PATRICK R. MCNAMEE Patrick R. McNamee |
Director | March 13, 2017 | ||
/s/ CHARLES W. PEFFER Charles W. Peffer |
Director |
March 13, 2017 |
||
/s/ JAMES A. RUBRIGHT James A. Rubright |
Director |
March 13, 2017 |
||
/s/ LAUREN TAYLOR WOLFE Lauren Taylor Wolfe |
Director |
March 13, 2017 |
152
Pursuant to the requirements of Section 13 or 15(d) of the Securities Exchange Act of 1934, the registrant has duly caused this report to be signed on its behalf by the undersigned, hereunto duly authorized.
| HD Supply, Inc. | ||||||
By: |
/s/ JOSEPH J. DEANGELO |
|||||
| Name: | Joseph J. DeAngelo | |||||
| Title: | President and Chief Executive Officer | |||||
| Date: March 13, 2017 |
||||||
Pursuant to the requirements of the Securities Exchange Act of 1934, this report has been signed below by the following persons on behalf of the registrant and in the capacities and on the dates indicated.
Signature
|
Capacity
|
Date
|
||
|---|---|---|---|---|
| /s/ JOSEPH J. DEANGELO Joseph J. DeAngelo |
President and Chief Executive Officer, Chairman (Principal Executive Officer) | March 13, 2017 | ||
/s/ EVAN J. LEVITT Evan J. Levitt |
Senior Vice President and Chief Financial Officer (Principal Financial Officer & Principal Accounting Officer) |
March 13, 2017 |
||
/s/ KATHLEEN J. AFFELDT Kathleen J. Affeldt |
Director |
March 13, 2017 |
||
/s/ JOHN W. ALDEN John W. Alden |
Director |
March 13, 2017 |
||
/s/ BETSY S. ATKINS Betsy S. Atkins |
Independent Lead Director |
March 13, 2017 |
||
/s/ PETER A. DORSMAN Peter A. Dorsman |
Director |
March 13, 2017 |
||
/s/ PETER A. LEAV Peter A. Leav |
Director |
March 13, 2017 |
153
Signature
|
Capacity
|
Date
|
||
|---|---|---|---|---|
| /s/ PATRICK R. MCNAMEE Patrick R. McNamee |
Director | March 13, 2017 | ||
/s/ CHARLES W. PEFFER Charles W. Peffer |
Director |
March 13, 2017 |
||
/s/ JAMES A. RUBRIGHT James A. Rubright |
Director |
March 13, 2017 |
||
/s/ LAUREN TAYLOR WOLFE Lauren Taylor Wolfe |
Director |
March 13, 2017 |
154