Attached files
| file | filename |
|---|---|
| 8-K - FORM 8-K - Riverview Financial Corp | d594242d8k.htm |

Annual Shareholder Meeting 2018 June 14, 2018 Exhibit 99.1
FORWARD-LOOKING STATEMENTS: We make statements in this presentation, and we may from time to time make other statements, regarding our outlook or expectations for future financial or operating results and/or other matters regarding or affecting Riverview Financial Corporation or its subsidiaries (collectively, the “Company” or “we”) that are considered “forward-looking statements” as defined in the Private Securities Litigation Reform Act of 1995 (the “PSLRA”). Such forward-looking statements may be identified by the use of such words as “believe,” “expect,” “anticipate,” “should,” “planned,” “estimated,” “intend” and “potential”. For these statements, the Company claims the protection of the safe harbor for forward-looking statements contained in the PSLRA. The Company cautions you that a number of important risk factors could cause actual results to differ materially from those currently anticipated in any forward-looking statement. Such risk factors include, but are not limited to: prevailing economic and political conditions, particularly in our market area; credit risk associated with our lending activities; changes in interest rates, loan demand, real estate values and competition; changes in accounting principles, policies, and guidelines; changes in any applicable law, rule, regulation or practice with respect to tax or legal issues; and other economic, competitive, governmental, regulatory and technological factors affecting the Company’s operations, pricing, products and services and other factors that may be described in the Company’s Annual Reports on Form 10-K and Quarterly Reports on Form 10-Q as filed with the Securities and Exchange Commission (“SEC”) from time to time. In light of risks, uncertainties and assumptions, you should not place undue reliance on any forward-looking statements in this presentation. The forward-looking statements are made as of the date of this presentation, and, except as may be required by applicable law or regulation, the Company assumes no obligation to update the forward-looking statements or to update the reasons why actual results could differ from those projected in the forward-looking statements.
NON-GAAP FINANCIAL MEASURES: In addition to evaluating its results of operations in accordance with accounting principles generally accepted in the United States of America ("GAAP"), Riverview routinely presents and supplements its evaluation with an analysis of certain non-GAAP financial measures, such as tangible stockholders' equity and core net income ratios. The reported results for the three months ended March 31, 2018 and December 31, 2017 and 2016, contain items which Riverview considers non-core, namely net gains on sales of investment securities available-for-sale, acquisition related expenses and the adjustment to tax expense due to the enactment of the Tax Act. Riverview presents the non-GAAP financial measures because it believes that these measures provide useful and comparative information to assess trends in Riverview’s results of operation. Presentation of these non-GAAP financial measures is consistent with how Riverview evaluates its performance internally and these non-GAAP financial measures are frequently used by securities analysts, investors and other interested parties in evaluation of companies in Riverview’s industry. Where non-GAAP measures are used in this press release, reconciliations to the comparable GAAP measures are provided in the accompanying tables. The non-GAAP financial measures Riverview uses may differ from similarly titled non-GAAP financial measures of other financial institutions. These non-GAAP financial measures would not be considered a substitute for GAAP basis measures, and Riverview strongly encourages a review of its condensed consolidated financial statements in their entirety. Reconciliations of these non-GAAP financial measures to the most directly comparable GAAP measures are presented in the tabular material that follows.

2017 STRATEGIC INITIATIVES During the 4th quarter of 2016 we developed a strategic plan to generate significant organic and inorganic growth in 2017 and beyond. This plan included the following: Capital Raise. We issued $17 million through the private placement of common stock to support significant asset growth. Team Liftouts. Targeted and hired teams of experienced and established lenders with material books of business that were more than willing to join Riverview due to the financial institution disruption throughout the Capital and Central PA region (Added 10 lenders and 3 support staff). These teams generated organic net loan growth of $164 million in 2017. Deposit Generation. Increased deposits to fund loan growth from leveraging new lending teams relationships, opening two new community banking offices and aggressively soliciting municipal deposits. Inorganic Growth. Successfully acquired CBT Financial on October 1, 2017. Information Technology Enhancements. Successfully completed the conversion of core data processing system in April 2018.
STRATEGIC BENEFITS FROM THE MERGER Acquired assets, loans and assumed deposits of $487 million, $383 million and $439 million. Solved ensuing needs for enhanced data processing solution. Increased size and scale enables Riverview to invest in new markets, employees, technology and marketing. Expanded wealth management operation and allowed new offering of trust services. Wealth management assets under management totaled $190 million at December 31, 2017 and trust division assets under management totaled $158 million at December 31, 2017. Increased ability to offer more diverse and profitable products and services to strengthen customer relationships. Strengthens financial and services commitment to communities served In 2017, CBT and Riverview contributed $456 thousand to local charities, schools and nonprofit organizations. Offered a broader base and geographically diversified branch system to enhance deposit collection and lower funding costs.
STRATEGIC BENEFITS FROM THE MERGER CONT’D. Larger capital base increased legal lending limit allowing Riverview to compete with larger institutions Enhanced depth of Board of Directors and executive management team. Increased ability of Riverview to meet regulatory burdens and costs. Improved efficiencies and provided material cost saving opportunities. Provided stronger financial condition and earnings potential and improve stock valuations. Provided low cost core funding with the ability to be redeployed to higher loan growth region. Improved liquidity in stock for shareholders due to larger market capitalization and opportunity to list on NASDAQ which increases trading volumes. Larger shareholder base and market capitalization leads to a more reliable value as the stock price will more accurately reflect financial performance. Provided expanded career opportunities and education for our employees.

STRATEGIC INITIATIVES 2017 RESULTS
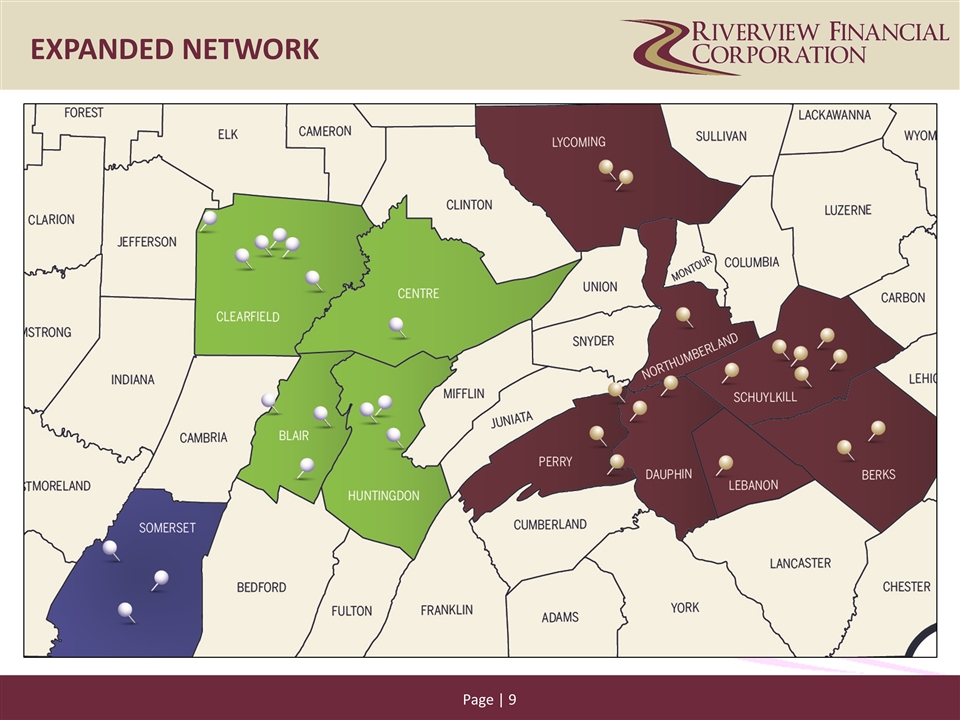
EXPANDED NETWORK
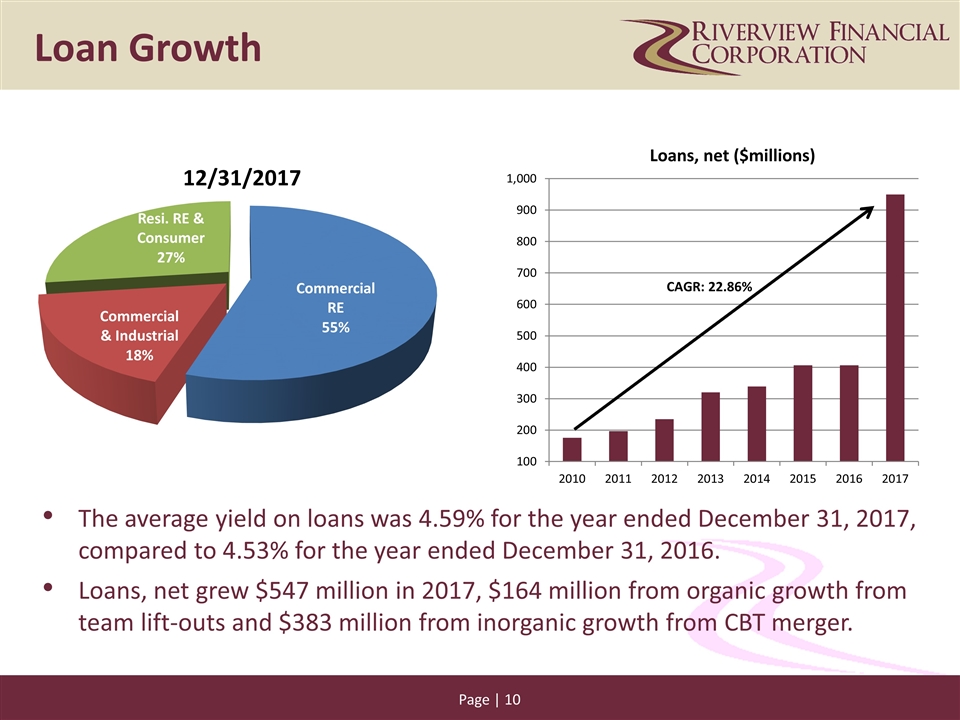
The average yield on loans was 4.59% for the year ended December 31, 2017, compared to 4.53% for the year ended December 31, 2016. Loans, net grew $547 million in 2017, $164 million from organic growth from team lift-outs and $383 million from inorganic growth from CBT merger. Loan Growth
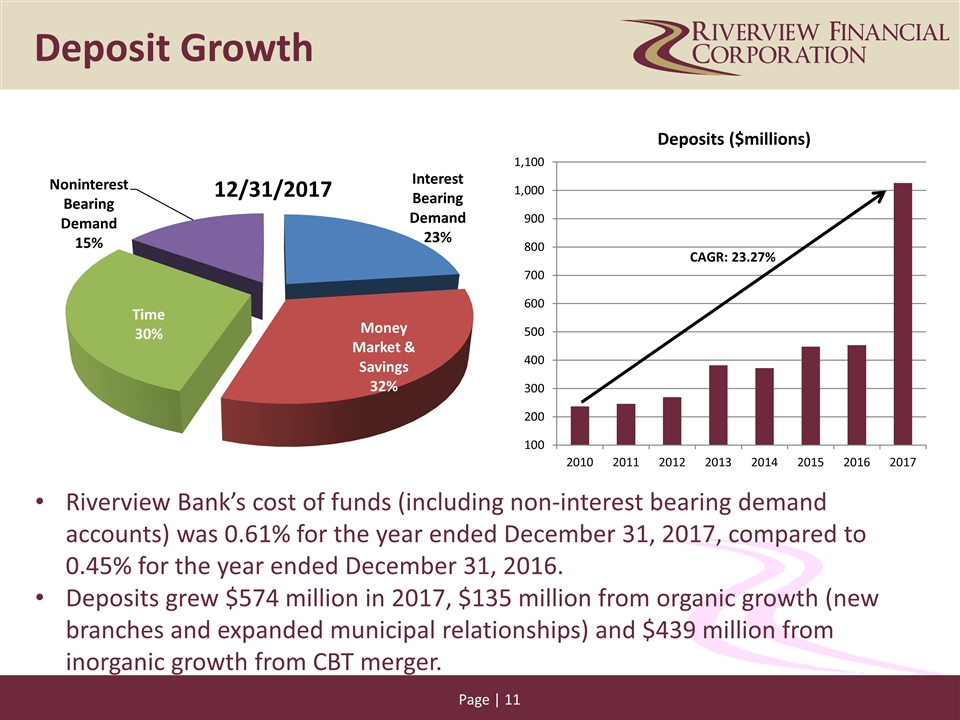
Riverview Bank’s cost of funds (including non-interest bearing demand accounts) was 0.61% for the year ended December 31, 2017, compared to 0.45% for the year ended December 31, 2016. Deposits grew $574 million in 2017, $135 million from organic growth (new branches and expanded municipal relationships) and $439 million from inorganic growth from CBT merger. Deposit Growth
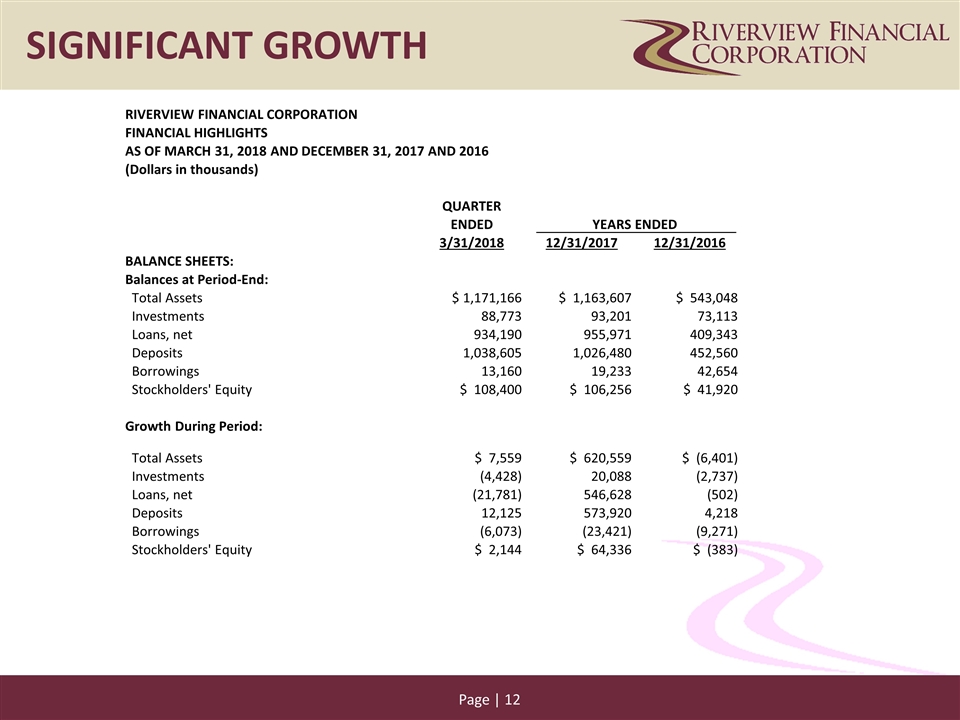
SIGNIFICANT GROWTH RIVERVIEW FINANCIAL CORPORATION FINANCIAL HIGHLIGHTS AS OF MARCH 31, 2018 AND DECEMBER 31, 2017 AND 2016 (Dollars in thousands) QUARTER ENDED YEARS ENDED 3/31/2018 12/31/2017 12/31/2016 BALANCE SHEETS: Balances at Period-End: Total Assets $ 1,171,166 $ 1,163,607 $ 543,048 Investments 88,773 93,201 73,113 Loans, net 934,190 955,971 409,343 Deposits 1,038,605 1,026,480 452,560 Borrowings 13,160 19,233 42,654 Stockholders' Equity $ 108,400 $ 106,256 $ 41,920 Growth During Period: Total Assets $ 7,559 $ 620,559 $ (6,401) Investments (4,428) 20,088 (2,737) Loans, net (21,781) 546,628 (502) Deposits 12,125 573,920 4,218 Borrowings (6,073) (23,421) (9,271) Stockholders' Equity $ 2,144 $ 64,336 $ (383)
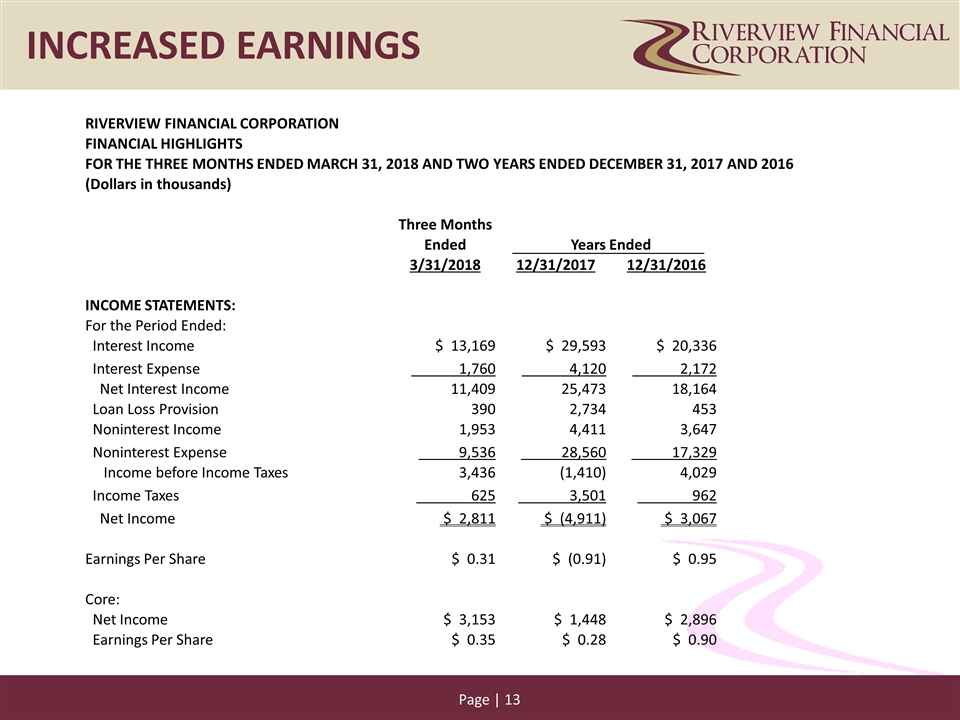
INCREASED EARNINGS RIVERVIEW FINANCIAL CORPORATION FINANCIAL HIGHLIGHTS FOR THE THREE MONTHS ENDED MARCH 31, 2018 AND TWO YEARS ENDED DECEMBER 31, 2017 AND 2016 (Dollars in thousands) Three Months Ended Years Ended 3/31/2018 12/31/2017 12/31/2016 INCOME STATEMENTS: For the Period Ended: Interest Income $ 13,169 $ 29,593 $ 20,336 Interest Expense 1,760 4,120 2,172 Net Interest Income 11,409 25,473 18,164 Loan Loss Provision 390 2,734 453 Noninterest Income 1,953 4,411 3,647 Noninterest Expense 9,536 28,560 17,329 Income before Income Taxes 3,436 (1,410) 4,029 Income Taxes 625 3,501 962 Net Income $ 2,811 $ (4,911) $ 3,067 Earnings Per Share $ 0.31 $ (0.91) $ 0.95 Core: Net Income $ 3,153 $ 1,448 $ 2,896 Earnings Per Share $ 0.35 $ 0.28 $ 0.90
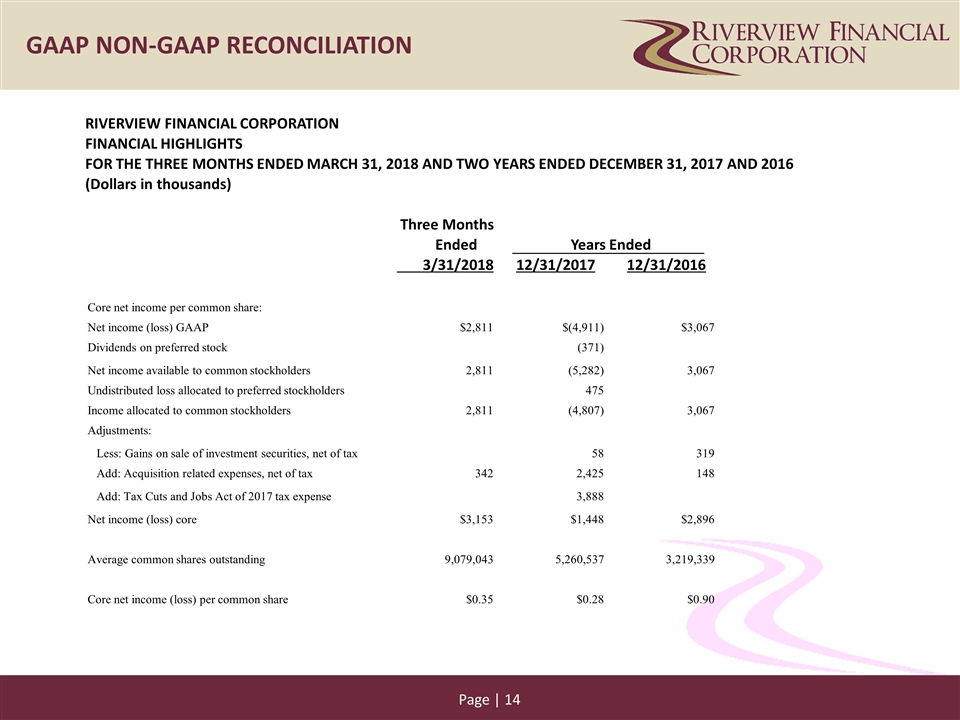
GAAP NON-GAAP RECONCILIATION RIVERVIEW FINANCIAL CORPORATION FINANCIAL HIGHLIGHTS FOR THE THREE MONTHS ENDED MARCH 31, 2018 AND TWO YEARS ENDED DECEMBER 31, 2017 AND 2016 (Dollars in thousands) Three Months Ended Years Ended 3/31/2018 12/31/2017 12/31/2016 Core net income per common share: Net income (loss) GAAP $2,811 $(4,911) $3,067 Dividends on preferred stock (371) Net income available to common stockholders 2,811 (5,282) 3,067 Undistributed loss allocated to preferred stockholders 475 Income allocated to common stockholders 2,811 (4,807) 3,067 Adjustments: Less: Gains on sale of investment securities, net of tax 58 319 Add: Acquisition related expenses, net of tax 342 2,425 148 Add: Tax Cuts and Jobs Act of 2017 tax expense 3,888 Net income (loss) core $3,153 $1,448 $2,896 Average common shares outstanding 9,079,043 5,260,537 3,219,339 Core net income (loss) per common share $0.35 $0.28 $0.90
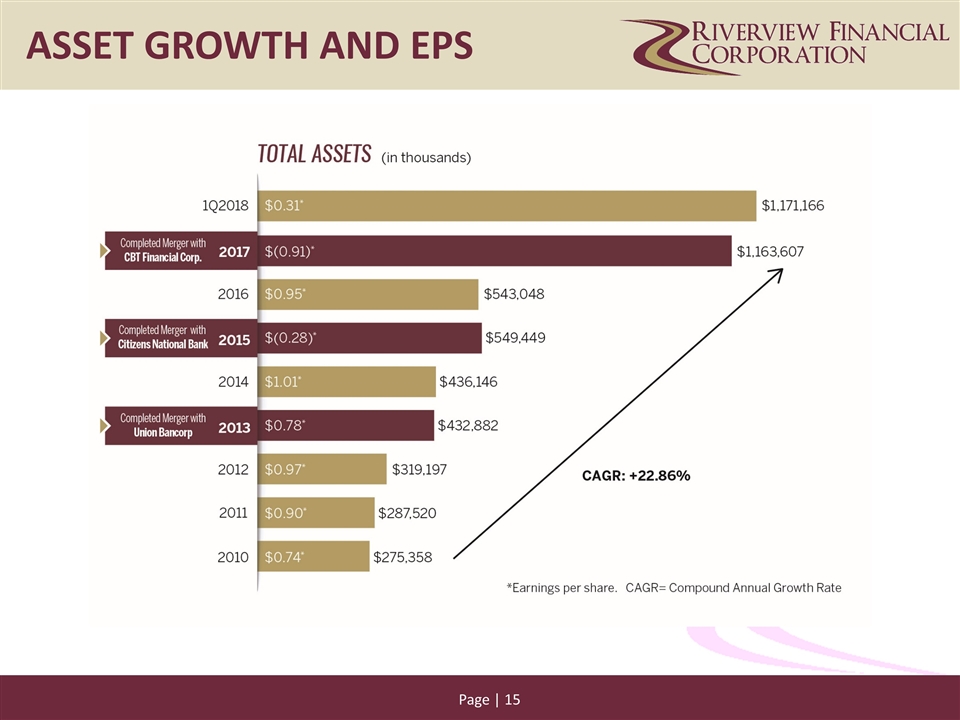
ASSET GROWTH AND EPS
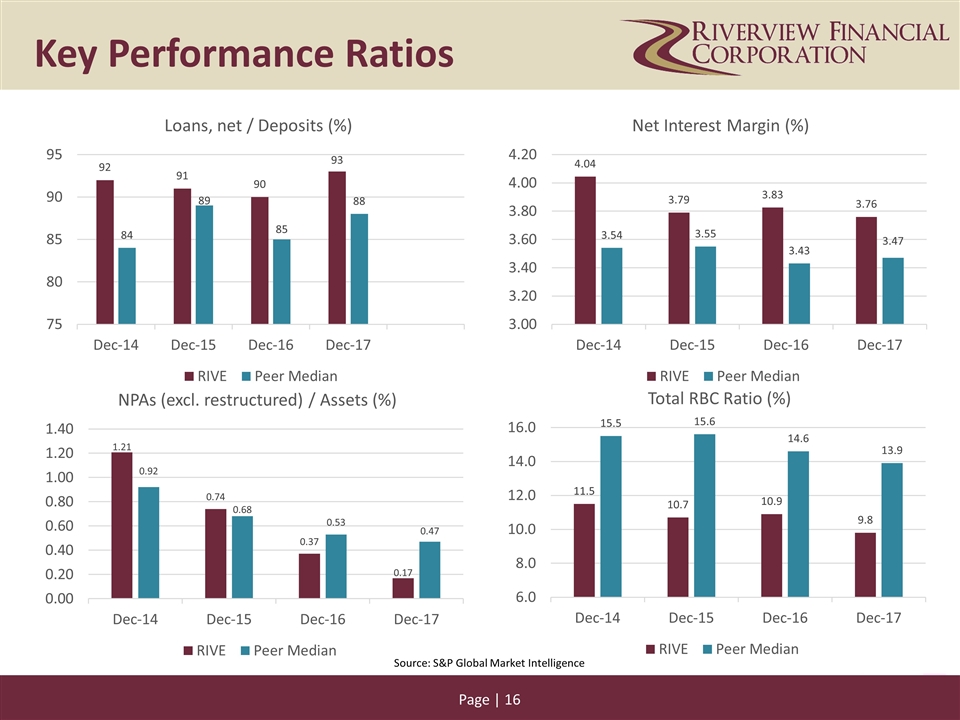
Key Performance Ratios Source: S&P Global Market Intelligence
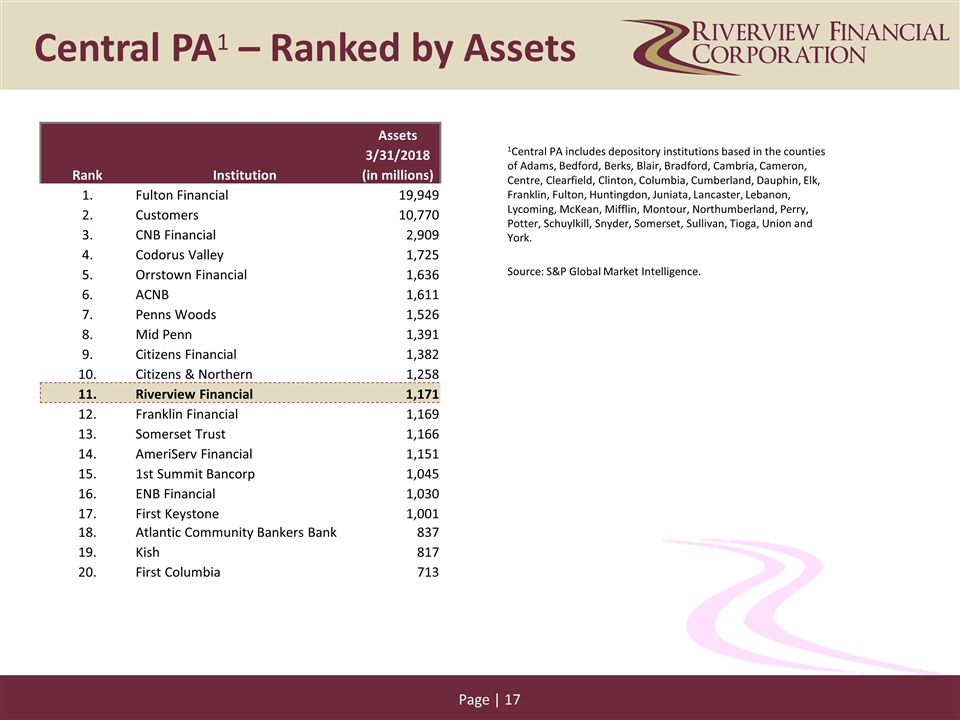
1Central PA includes depository institutions based in the counties of Adams, Bedford, Berks, Blair, Bradford, Cambria, Cameron, Centre, Clearfield, Clinton, Columbia, Cumberland, Dauphin, Elk, Franklin, Fulton, Huntingdon, Juniata, Lancaster, Lebanon, Lycoming, McKean, Mifflin, Montour, Northumberland, Perry, Potter, Schuylkill, Snyder, Somerset, Sullivan, Tioga, Union and York. Source: S&P Global Market Intelligence. Central PA1 – Ranked by Assets Assets 3/31/2018 Rank Institution (in millions) 1. Fulton Financial 19,949 2. Customers 10,770 3. CNB Financial 2,909 4. Codorus Valley 1,725 5. Orrstown Financial 1,636 6. ACNB 1,611 7. Penns Woods 1,526 8. Mid Penn 1,391 9. Citizens Financial 1,382 10. Citizens & Northern 1,258 11. Riverview Financial 1,171 12. Franklin Financial 1,169 13. Somerset Trust 1,166 14. AmeriServ Financial 1,151 15. 1st Summit Bancorp 1,045 16. ENB Financial 1,030 17. First Keystone 1,001 18. Atlantic Community Bankers Bank 837 19. Kish 817 20. First Columbia 713
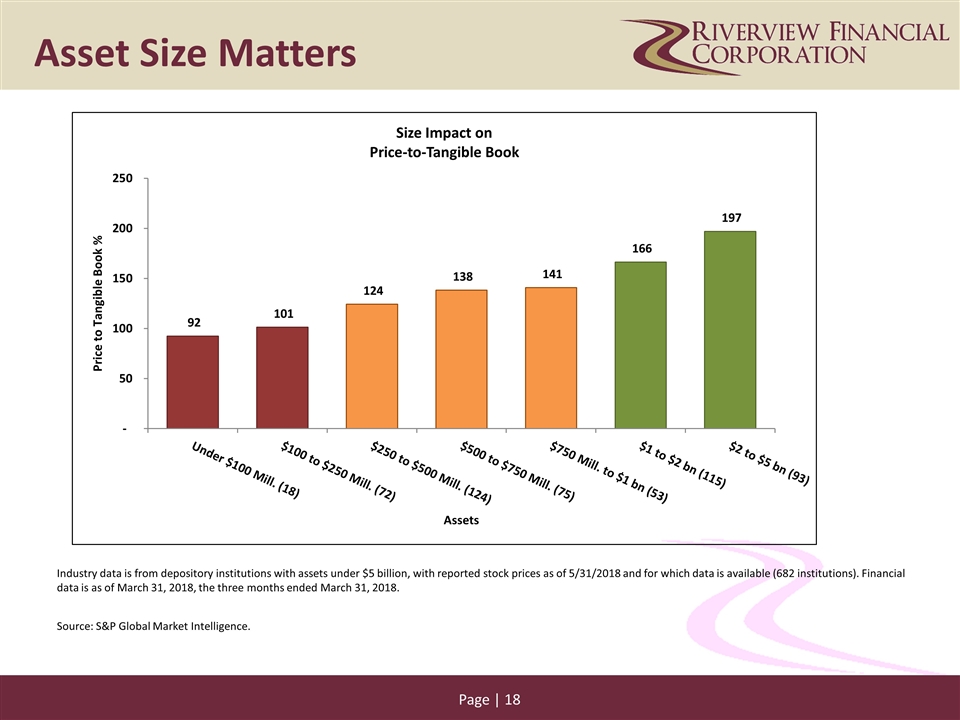
Asset Size Matters Industry data is from depository institutions with assets under $5 billion, with reported stock prices as of 5/31/2018 and for which data is available (682 institutions). Financial data is as of March 31, 2018, the three months ended March 31, 2018. Source: S&P Global Market Intelligence.
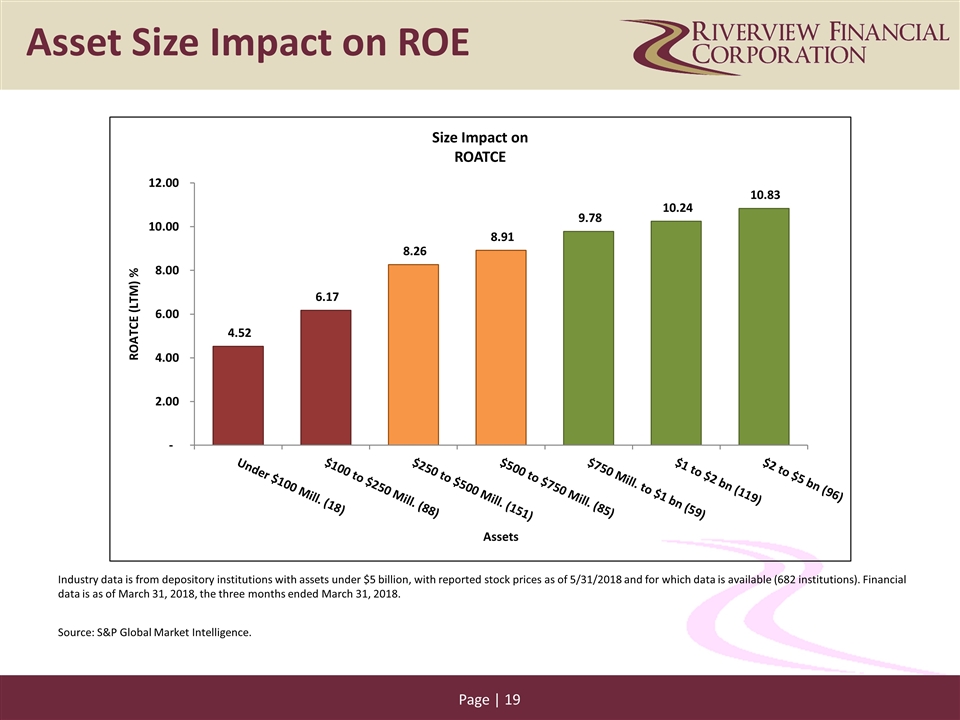
Asset Size Impact on ROE Industry data is from depository institutions with assets under $5 billion, with reported stock prices as of 5/31/2018 and for which data is available (682 institutions). Financial data is as of March 31, 2018, the three months ended March 31, 2018. Source: S&P Global Market Intelligence.
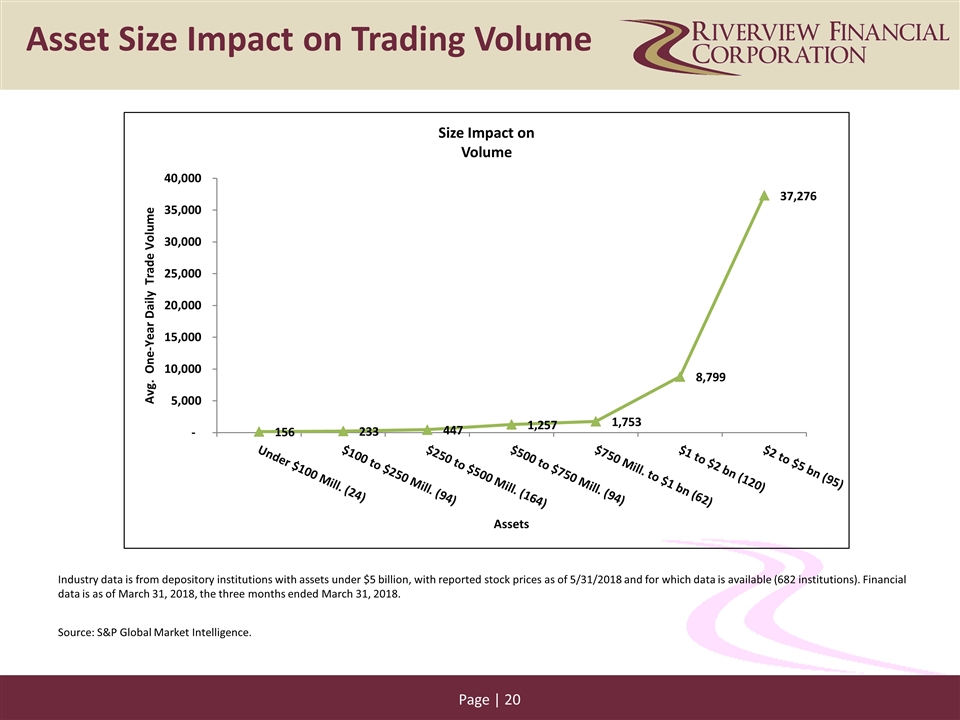
Asset Size Impact on Trading Volume Industry data is from depository institutions with assets under $5 billion, with reported stock prices as of 5/31/2018 and for which data is available (682 institutions). Financial data is as of March 31, 2018, the three months ended March 31, 2018. Source: S&P Global Market Intelligence.
NONRECURRING COSTS INCURRED DURING 2017 IMPACTING EARNINGS AND DIVIDENDS Merger costs: In connection with the acquisition, Riverview incurred merger-related expenses of $3.7 million consisting largely of costs related to professional and consulting services, employment severance and early retirement charges, termination of contractual agreements and conversion of systems and/or integration of operations, initial communication expenses, printing and filing costs of completing the transaction and investment banking charges. Tax legislation change: Another significant event impacting the financial results of Riverview in 2017 was the enactment of the Tax Cuts and Jobs Act of 2017. For businesses, the Act reduces the corporate federal tax rate from a maximum rate of 35% to a flat rate of 21%. As of a result of the reduction in the corporate income tax to 21%, Riverview reduced its deferred tax asset by recording an adjustment in tax expense of $3.9 million during the quarter ended December 31, 2017.
Impact on dividend payment: The Board of Directors and Executive Management made the decision to suspend the dividend in the first quarter of 2018 in order to conserve capital given the magnitude of expenses incurred in the fourth quarter of 2017. The Board reinstated the dividend for the second quarter of 2018 with the goal to continue to pay a reasonable dividend without disrupting the delicate balance that must be maintained between the payment of a dividend to shareholders and remaining a well-capitalized institution. The payment of a second quarter cash dividend represents an annualized yield of 3.2% based on the closing price of our stock on the dividend declaration date.
Investor Relations Contacts and Information Sources INFORMATION SOURCES: Riverview website www.riverviewbankpa.com under “Investor Relations” Sec.gov - Current filings with the Securities and Exchange Commission Fdic.gov - Call Reports, Uniform Bank Performance Reports, Summary of Branch Deposits Investor Services: Transfer Agent: American Stock Transfer and Trust, LLC (800) 937-5449 Dividend Reinvestment Direct Deposit Market Makers Boenning & Scattergood (610) 862-5368 Monroe Financial Partners (312) 327-2530 Scott A. Seasock Telephone: 717-827-4039 E-mail: sseasock@riverviewbankpa.com
