Attached files
| file | filename |
|---|---|
| EX-32.2 - EXHIBIT 32.2 - FINISAR CORP | fnsrex-322fy18.htm |
| EX-32.1 - EXHIBIT 32.1 - FINISAR CORP | fnsrex-321fy18.htm |
| EX-31.2 - EXHIBIT 31.2 - FINISAR CORP | fnsrex-312fy18.htm |
| EX-31.1 - EXHIBIT 31.1 - FINISAR CORP | fnsrex-311fy18.htm |
| EX-23.1 - EXHIBIT 23.1 - FINISAR CORP | fnsrex-231fy18.htm |
| EX-21 - EXHIBIT 21 - FINISAR CORP | fnsrex-21fy18.htm |
UNITED STATES SECURITIES AND EXCHANGE COMMISSION
Washington, D.C. 20549
_____________________________________________
Form 10-K
x | ANNUAL REPORT PURSUANT TO SECTION 13 OR 15(d) OF THE SECURITIES EXCHANGE ACT OF 1934 | |
For the fiscal year ended April 29, 2018 | ||
OR | ||
o | TRANSITION REPORT PURSUANT TO SECTION 13 OR 15(d) OF THE SECURITIES EXCHANGE ACT OF 1934 | |
For the transition period from to | ||
000-27999
(Commission File No.)
Finisar Corporation
(Exact name of Registrant as specified in its charter)
Delaware (State or other jurisdiction of incorporation or organization) | 94-3038428 (I.R.S. Employer Identification No.) | |
1389 Moffett Park Drive, Sunnyvale, California (Address of principal executive offices) | 94089 (Zip Code) | |
Registrant’s telephone number, including area code: 408-548-1000
_____________________________________________
Securities registered pursuant to Section 12(b) of the Act: | ||
Title of each class | Name of each exchange on which registered | |
Common stock, $.001 par value | NASDAQ Stock Market | |
(NASDAQ Global Select Market) | ||
Securities registered pursuant to Section 12(g) of the Act: None
_____________________________________________
Indicate by check mark if the registrant is a well-known seasoned issuer, as defined in Rule 405 of the Securities Act.
Yes x No o
Indicate by check mark if the registrant is not required to file reports pursuant to Section 13 or Section 15(d) of the Act.
Yes o No x
Indicate by check mark whether the registrant (1) has filed all reports required to be filed by Section 13 or 15(d) of the Securities Exchange Act of 1934 during the preceding 12 months (or for such shorter period that the registrant was required to file such reports), and (2) has been subject to such filing requirements for the past 90 days. Yes x No o
Indicate by check mark whether the registrant has submitted electronically and posted on its corporate Web site, if any, every Interactive Data File required to be submitted and posted pursuant to Rule 405 of Regulation S-T (§ 229.405 of this chapter) during the preceding 12 months (or for such shorter period that the registrant was required to submit and post such files). Yes x No o
Indicate by check mark if disclosure of delinquent filers pursuant to Item 405 of Regulation S-K is not contained herein, and will not be contained, to the best of registrant’s knowledge, in definitive proxy or information statements incorporated by reference in Part III of this Form 10-K or any amendment to this Form 10-K. x
Indicate by check mark whether the registrant is a large accelerated filer, an accelerated filer, a non-accelerated filer, smaller reporting company, or an emerging growth company. See the definitions of “large accelerated filer,” “accelerated filer”, “smaller reporting company”, and "emerging growth company" in Rule 12b-2 of the Exchange Act.
Large accelerated filer x | Accelerated filer o | Non-accelerated filer o | Smaller reporting company o | |||
(Do not check if a smaller reporting company) | ||||||
Emerging growth company o | ||||||
If an emerging growth company, indicate by check mark if the registrant has elected not to use the extended transition period for complying with any new or revised financial accounting standards provided pursuant to Section 13(a) of the Exchange Act. o
Indicate by check mark whether the registrant is a shell company (as defined in Rule 12b-2 of the Exchange Act) Yes o No x
As of October 29, 2017, the aggregate market value of the voting and non-voting common equity held by non-affiliates of the registrant was approximately $2.2 billion based on the closing sales price of the registrant’s common stock as reported on the NASDAQ Stock Market on October 27, 2017 of $21.81 per share. Shares of common stock held by officers, directors and holders of more than ten percent of the outstanding common stock have been excluded from this calculation because such persons may be deemed to be affiliates. This determination of affiliate status is not necessarily a conclusive determination for other purposes.
Number of shares of the registrant's common stock, $.001 par value, outstanding as of June 8, 2018: 114,923,568.
DOCUMENTS INCORPORATED BY REFERENCE
Portions of the registrant’s definitive proxy statement for its 2018 annual meeting of stockholders are incorporated by reference in Part III hereof.
INDEX TO ANNUAL REPORT ON FORM 10-K
FOR THE FISCAL YEAR ENDED APRIL 29, 2018
Page | |||
i
FORWARD LOOKING STATEMENTS
This report contains forward-looking statements within the meaning of the Private Securities Litigation Reform Act of 1995. We use words like “anticipates,” “believes,” “plans,” “expects,” “future,” “intends” and similar expressions to identify these forward-looking statements. We have based these forward-looking statements on our current expectations and projections about future events; however, our business and operations are subject to a variety of risks and uncertainties, and, consequently, actual results may materially differ from those projected by any forward-looking statements. As a result, you should not place undue reliance on these forward-looking statements since they may not occur.
Certain factors that could cause actual results to differ from those projected are discussed in “Item 1A. Risk Factors.” We undertake no obligation to publicly update or revise any forward-looking statements, whether as a result of new information or future events.
1
PART I
Item 1. | Business |
Overview
We are a global technology leader in optical communications, providing components and subsystems to networking equipment manufacturers, data center operators, telecom service providers, consumer electronics and automotive companies. We design products that meet the increasing demands for network bandwidth, data storage and 3D sensing subsystems. Our optical subsystems consist primarily of transmitters, receivers, transceivers, transponders and active optical cables, which provide the fundamental optical-electrical, or optoelectronic interface for interconnecting the electronic equipment used in these networks, including the switches, routers, and servers used in wireline networks as well as the antennas and base stations used in wireless networks. These products rely on the use of semiconductor lasers and photodetectors in conjunction with integrated circuits and novel optoelectronic packaging to provide a cost-effective means for transmitting and receiving digital signals over fiber optic cable at speeds ranging from less than 1 gigabit per second, or Gbps, to more than 400 Gbps, over distances of less than 10 meters to more than 2,000 kilometers, using a wide range of network protocols and physical configurations.
We also provide products known as wavelength selective switches, or WSS. In long-haul and metro networks, each fiber may carry 50 to more than 100 different high-speed optical wavelengths. WSS are switches that are used to dynamically switch network traffic from one optical fiber to multiple other fibers without first converting to an electronic signal. The wavelength selective feature means that WSS enable any wavelength or combination of wavelengths to be switched from the input fiber to the output fibers. WSS products are sometimes combined with other components and sold as linecards that plug into a system chassis referred to as a reconfigurable optical add/drop multiplexers, or ROADM.
Finally, we have entered the high-growth 3D Sensing market. 3D Sensing enables features such as facial recognition, gaming and virtual reality. In addition, there are applications in the automotive market such as LiDAR and in-cabin recognition. Today, VCSELs (Vertical Cavity Surface Emitting Lasers) are core to 3D Sensing and we are able to leverage multiple years of experience in technology in these emerging applications. We both design and manufacture these lasers and continue to expand our capacity in order to meet demand.
Our line of optical components also includes packaged lasers and photodetectors for data communication and telecommunication applications.
Demand for our products is largely driven by the continually growing need for additional network bandwidth created by the ongoing proliferation of data and video traffic from video downloads, Internet protocol TV, social networking, on-line gaming, file sharing, enterprise IP/Internet traffic, cloud computing, and data center virtualization that must be handled by both wireline and wireless networks. Mobile traffic is increasing as the result of proliferation of smartphones, tablet computers, and other mobile devices.
Our manufacturing operations are vertically integrated and we produce many of the key components used in making our products, including lasers, photodetectors and integrated circuits, or ICs, designed by our internal IC engineering teams. We also have internal assembly and test capabilities that make use of internally designed equipment for the automated testing of our optical subsystems and components.
We sell our products primarily to manufacturers of storage systems, networking equipment and telecommunication equipment such as Broadcom, Ciena, Cisco Systems, Dell EMC, Ericsson, FiberHome, Fujitsu, Hewlett Packard Enterprise, Huawei, IBM, Juniper, Nokia, QLogic, and ZTE, and to their contract manufacturers. These customers, in turn, sell their systems to businesses and to wireline and wireless telecommunication service providers and cable TV operators, collectively referred to as carriers. We also sell products to end-users.
We were incorporated in California in April 1987 and reincorporated in Delaware in November 1999. Our principal executive offices are located at 1389 Moffett Park Drive, Sunnyvale, California 94089, and our telephone number at that location is +1-408-548-1000.
All references to “Finisar,” “the Company,” “we,” “us” or “our” are references to Finisar Corporation and its consolidated subsidiaries, collectively, except as otherwise indicated or where the context otherwise requires.
2
Products
Our optical subsystems and components are integrated into our customers’ systems and used for fiber optics-based data communication and telecommunication networks.
Our family of optical subsystem products consists of transmitters, receivers, transceivers, transponders, and active optical cables principally based on the Ethernet, Fibre Channel, OTN and SONET/SDH protocols. A transmitter uses a laser plus direct or indirect modulation to convert electrical signals into optical signals for transmission over optical fiber. Receivers incorporating photo detectors convert incoming optical signals into electrical signals. A transceiver combines both transmitter and receiver functions in a single device. An active optical cable combines two transceivers and a fiber optic cable that are built into an integrated, connectorized cable assembly that is sold in various cable lengths. Our optical subsystem products perform these functions with high reliability and data integrity and support a wide range of protocols, transmission speeds, fiber types, wavelengths, transmission distances, physical configurations, and software enhancements.
Our high-speed optical subsystems are engineered to deliver value-added functionality and intelligence. Our optical subsystem products typically include a microprocessor with proprietary embedded software that provides customers real-time monitoring of transmitted and received optical power, temperature, drive current, and other link parameters for each port in their systems.
For data communication applications that rely on the Fibre Channel standard, we currently provide a wide range of optical subsystems for transmission applications at 1 to 28 Gbps. For data communication applications that rely on the Ethernet standard, we provide a broad range of optical subsystems for transmitting signals at 1 to 400 Gbps using the SFP, SFP+, XFP, X2, QSFP, QSFP28, QSFP56-DD, CXP, CFP, CFP2, CFP4, and proprietary form factors. For OTN and SONET/SDH-based telecommunication applications, we supply optical subsystems that are capable of transmitting at 0.155, 0.622, 2.5, 10, 40,100, and 200 Gbps.
We also offer a full line of optical subsystems for telecommunication applications using wavelength division multiplexing, or WDM technologies. Our products include coarse wavelength division multiplexing, or CWDM, transceivers in the SFP form factor and dense wavelength division multiplexing, or DWDM, transceivers in the SFP, SFP+, XFP, CFP2, CFP4, and proprietary form factors. These products include both fixed wavelength transceivers and tunable transceivers that are capable of dynamically tuning across a range of wavelengths in the C- and L-Bands.
As a result of several acquisitions, we have gained access to leading-edge technology for the manufacture of a number of active and passive optical components including vertical cavity surface emitting lasers, or VCSELs; Fabry-Perot, or FP, lasers; distributed feedback, or DFB, lasers; tunable lasers; positive intrinsic negative, or PIN, detectors; high-speed integrated waveguide detectors; Mach Zehnder Modulators; fused fiber couplers; isolators; filters; polarization beam combiners; and amplifiers. Most of these optical components are used internally in the manufacture of our optical subsystems. We currently sell some of these components in the so-called “merchant market” to other subsystems manufacturers. We are also producing laser and photodetector products for use in emerging consumer and auto applications.
We also offer products used in building access networks including optics for wireless infrastructure and fiber-to-the-home/curb networks and for parallel optics applications such as inter-chassis connections for switches, routers, and high-speed computing systems.
We offer WSS and ROADM linecard products for wavelength management in DWDM telecommunication networks. These capabilities are made possible in part through the use of our liquid crystal on silicon, or LCoS, technology, similar to that used in miniature projectors. This technology provides a highly flexible WSS capable of operating on both 50 and 100 GHz International Telecommunications Union, or ITU, grids, based on our patented FlexgridTM technology. In addition, this LCoS-based architecture offers the capability for in-service upgrades of functionality and integration of additional system functionality, including route and select, drop and continue, channel monitoring, and channel contouring features. Our WSS and ROADM linecard product offering ranges from 1x2, 1x4 and 1x9 products up to higher output fiber port counts in our latest 1x23 and 2x1x20 products.
Customers
Our revenues are principally derived from sales of optical subsystems and components to a broad base of networking equipment manufacturers, data center operators, telecom service providers, consumer electronics, automotive companies, distributors, end customers, and system integrators. Sales of products for data communication applications represented 78%,
3
72%, and 74% of our total revenues in fiscal 2018, 2017 and 2016, respectively. Sales of products for telecommunication applications represented 22%, 28%, and 26% of our total revenues in fiscal 2018, 2017 and 2016, respectively.
Sales to our ten largest customers represented 59%, 56%, and 56% of our total revenues during fiscal 2018, 2017 and 2016, respectively. Two customers, Cisco Systems and Google, represented more than 10% of our total revenues during fiscal 2018. Two customers, Cisco Systems and Huawei, represented more than 10% of our total revenues during each fiscal 2017 and fiscal 2016. No other customer accounted for more than 10% of our total revenues in any of these years.
Technology
The development of high quality optical subsystems and components for high-speed communications requires multidisciplinary expertise in the following technology areas:
High Frequency Integrated Circuit Design. Our optical subsystems development efforts are supported by an engineering team that specializes in analog/digital IC design. This group utilizes semiconductor technologies such as silicon complementary-metal-oxide-semiconductor, or Si CMOS, and silicon germanium bipolar CMOS, or SiGe BiCMOS, to design high-speed, high performance proprietary ICs such as laser drivers, receiver pre-and post-amplifiers, and microprocessors. These proprietary ICs are incorporated across our transceiver and transponder product portfolio at data rates from 1 to 100 Gbps. We also design the advanced LCoS controller ICs for our WSS and ROADM linecard products. Our internally developed ICs provide significant cost and performance advantages throughout our current product portfolio. Our in-house IC design capabilities are critical to our ongoing development of future products with even faster data rates, higher performance, and lower cost.
Optical Subassembly and Mechanical Design. We established ourselves as a low-cost design leader beginning with our initial optical subsystems in 1992. From that base we have developed single-mode laser alignment approaches and low-cost, all-metal packaging techniques for improved electromagnetic interference, or EMI, performance and environmental tolerance. We develop our own component and packaging designs and integrate these designs with proprietary manufacturing processes that allow our products to be manufactured in high volume.
System Design. The design of all of our products requires a combination of sophisticated technical competencies, including optical engineering, high-speed electrical design, digital and analog application specific IC, or ASIC, design, and firmware and software engineering. We have built a substantial organization of engineers and scientists with skills in all of these areas. It is the integration and combination of these technical competencies that enables us to design and manufacture optical subsystem and component products that meet the needs of our customers.
Manufacturing System Design. Hardware, firmware, and software design skills are utilized to provide specialized manufacturing test systems for our internal use. These test systems are optimized for test capacity and broad test coverage. We use automated, software-controlled testing to enhance the field reliability of all Finisar products and to reduce the level of capital expenditures that would otherwise be required to purchase these test systems.
Optoelectronic Device Design and Wafer Fabrication. The ability to manufacture our own optical components provides significant cost savings as well as the ability to create unique, high performance components that are not commercially available. This enhances our competitive position in terms of performance, time-to-market, and intellectual property. Most significantly, we design and manufacture a number of active components that are used in our optical subsystems. Certain of our past acquisitions provided us with wafer fabrication capability for designing and manufacturing VCSEL components, used in our shorter distance transceivers for data communication applications, PIN detectors and 1310 nm FP and DFB lasers used in our longer distance transceivers, although we continue to rely on third-party suppliers for a portion of our DFB laser requirements, and tunable lasers for use in our tunable XFP and SFP+ transceivers for telecommunication applications.
Competition
The market for optical subsystems and components for use in data communication and telecommunication applications remains highly competitive. We believe the principal competitive factors in these markets are:
• | product performance, features, functionality, and reliability; |
• | price/performance characteristics; |
• | timeliness of new product introductions; |
• | breadth of product line; |
• | adoption of emerging industry standards; |
4
• | service and support; |
• | size and scope of distribution network; |
• | brand name; |
• | access to customers; and |
• | size of installed customer base. |
Competition in the market for optical subsystems and components varies by market segment. Our principal competitors for optical transceivers sold for data communication applications include Applied Optoelectronics, Foxconn, Innolight, Lumentum Holdings (former communications and optical products business of JDS Uniphase), Oclaro, and Sumitomo. Our principal competitors for optical transceivers sold for telecommunication applications include Acacia Communications, Fujitsu Optical Components, Lumentum, Oclaro, and Sumitomo. Our principal competitors for WSS ROADM products include CoAdna, Lumentum, Oplink, and Nistica. We believe we compete favorably with our competitors with respect to most of the foregoing factors based, in part, upon our broad product line, our sizeable installed base, our significant vertical integration, and our lower-cost manufacturing facilities in Ipoh, Malaysia and Wuxi, China.
Sales, Marketing and Technical Support
For sales of our optical subsystems and components, we utilize a direct sales force augmented by five world-wide distributors, 11 international distributors, six domestic distributors, 17 domestic manufacturers’ representatives, and eight international manufacturers’ representatives. Our direct sales force maintains close contact with our customers and provides technical support to our manufacturers’ representatives. In our international markets, our direct sales force works with local resellers who assist us in providing support and maintenance in the territories they cover.
Our marketing efforts are focused on increasing awareness of our product offerings for optical subsystems and our brand name. Key components of our marketing efforts include:
• | continuing our active participation in industry associations and standards committees to promote and further enhance Ethernet, Fibre Channel and SONET/SDH/OTN technologies, promote standardization in the data communication and telecommunication markets, and increase our visibility as industry experts; and |
• | leveraging major trade show events and conferences to promote our broad product lines. |
In addition, our marketing group focuses on product management and product strategy and also provides marketing support services for our direct sales force and our manufacturers’ representatives and resellers. Through our marketing activities, we provide technical and strategic sales support to our direct sales personnel and resellers, including in-depth product presentations, technical manuals, sales tools, pricing, marketing communications, marketing research, trademark administration, and other support functions.
A high level of continuing service and support is critical to our objective of developing long-term customer relationships. We emphasize customer service and technical support in order to provide our customers and their end users with the knowledge and resources necessary to successfully utilize our product line. Our customer service organization utilizes a technical team of field and factory applications engineers, technical marketing personnel and, when required, product design engineers. We provide extensive customer support throughout the qualification and sale process. In addition, we provide many resources through our World Wide Web site, including product documentation and technical information. We intend to continue to provide our customers with comprehensive product support and believe it is critical to remaining competitive.
Backlog
A substantial portion of our revenues is derived from sales to customers through hub arrangements where revenue is generated as inventory that resides at these customers or their contract manufacturers is drawn down. Visibility as to future customer demand is limited in these situations. Most of our other revenues are derived from sales pursuant to individual purchase orders that remain subject to negotiation with respect to delivery schedules and are generally cancelable without significant penalties. Manufacturing capacity and availability of key components can also impact the timing and amount of revenue ultimately recognized under such sale arrangements. Accordingly, we do not believe that the backlog of undelivered product under these purchase orders at a particular time is a meaningful indicator of our future financial performance.
5
Manufacturing
We manufacture our optical subsystems at our production facility in Ipoh, Malaysia. This facility consists of 640,000 square feet, of which 240,000 square feet is suitable for clean room operations. We also conduct a portion of our new product introduction operations at our Ipoh facility. This facility is located on 840,000 square feet of land that we are leasing for 60 years, through June 28, 2055. In 2012, we entered into a 50-year lease for 550,000 square feet of land in Wuxi, China, where we built a 800,000 square foot facility. At this facility, we manufacture tunable and parallel transceivers, WSS components, ROADM line cards, passive optical components, coherent receivers, and high-end optical subassemblies used in VCSELs and detectors. In 2017, we entered into a 50-year lease for an additional 280,000 square feet of land adjacent to the above location in Wuxi, China, where we have begun the process of constructing an additional 300,000 square foot manufacturing facility. We manufacture WSS products at our 100,000 square foot facility in Sydney, Australia. We continue to conduct a substantial portion of our new product introduction activities at our Sunnyvale, California, Horsham, Pennsylvania, Sydney, Australia, and Shanghai, China facilities. In Sunnyvale, we also conduct supply chain management for certain components as well as quality assurance and documentation control operations. We maintain an international purchasing office in Shenzhen, China. We conduct wafer fabrication operations for the manufacture of VCSELs used in short wavelength transceiver products at our facility in Allen, Texas. In 2017, we purchased a 700,000 square foot manufacturing facility in Sherman, Texas, where we will conduct wafer fabrication operations for the manufacture of VCSELs used in short wavelength transceiver products and 3D sensing products. We conduct wafer fabrication operations for the manufacture of long wavelength FP and DFB lasers at our facility in Fremont, California. We conduct wafer fabrication operations for the manufacturing of tunable lasers and photonic integrated circuits, or PICs, at our facility in Jarfalla, Sweden. We manufacture high speed optical receivers and photodetectors at our facility in Berlin, Germany. We expect to continue to use contract manufacturers for a portion of our manufacturing needs, primarily printed circuit board assemblies.
We design and develop a number of the key components of our products, including photodetectors, lasers, ASICs, printed circuit boards, and software. In addition, our manufacturing team works closely with our engineers to manage the supply chain. To assure the quality and reliability of our products, we conduct product testing and burn-in at our facilities in conjunction with inspection and the use of testing and statistical process controls. In addition, most of our optical subsystems have an intelligent interface that allows us to monitor product quality during the manufacturing process. Our facilities in Sunnyvale and Fremont, California; Allen, Texas; Horsham, Pennsylvania; Shanghai, China; Ipoh, Malaysia; Sydney, Australia; Jarfalla, Sweden; and Berlin, Germany are qualified under ISO 9001-9002.
Although we use standard parts and components for our products wherever possible, we currently purchase several key components from single or limited sources. Our principal single source components purchased from external suppliers include ASICs and certain DFB lasers that we do not manufacture internally. Generally, purchase commitments with our single or limited source suppliers are on a purchase order basis. We generally try to maintain a buffer inventory of key components. However, any interruption or delay in the supply of any of these components, or the inability to procure these components from alternate sources at acceptable prices and within a reasonable time, would substantially harm our business. In addition, qualifying additional suppliers can be time-consuming and expensive and may increase the likelihood of errors.
We use a rolling 12-month forecast of anticipated product orders to determine our material requirements. Lead times for materials and components we order vary significantly and depend on factors such as the demand for such components in relation to each supplier’s manufacturing capacity, internal manufacturing capacity, contract terms, and demand for a component at a given time.
Research and Development
In fiscal 2018, 2017 and 2016, our research and development expenses were $239.0 million, $217.9 million, and $203.4 million, respectively. We believe that our future success depends on our ability to continue to enhance the performance and reduce the cost of our existing products and to develop new products that maintain technological and business competitiveness. We focus our product development activities on addressing the evolving needs of our customers within the data communication and telecommunication markets. We also seek opportunities to leverage the technical and product competencies created for our core markets to develop products for other applications, especially products using active optical components that we design and manufacture. We work closely with our customers to monitor changes in the marketplace. We design our products around current industry standards and will continue to support emerging standards that are consistent with our product strategy. Our research and development groups are aligned with our various product lines, and we also have specific groups devoted to ASIC design and test, subsystem design, and software design. Our product development operations include the active involvement of our manufacturing engineers who examine each product for its manufacturability, predicted reliability, expected lifetime, and manufacturing costs.
6
We believe that our research and development efforts are key to our ability to maintain technical and business competitiveness and to deliver innovative products that address the needs of the market. However, there can be no assurance that our product development efforts will result in commercially successful products, or that our products will not be rendered obsolete by changing technology or new product announcements by other companies.
Intellectual Property
Our success and ability to compete is dependent in part on our proprietary technology. We rely on a combination of patent, copyright, trademark and trade secret laws, as well as confidentiality agreements and licensing arrangements, to establish and protect our proprietary rights. We currently own approximately 2,000 issued U.S. and foreign patents and have approximately 400 pending U.S. and foreign patent applications. We cannot assure that any patents will be issued as a result of pending patent applications or that our issued patents will be upheld. Any infringement of our proprietary rights could result in significant litigation costs, and any failure to adequately protect our proprietary rights could result in our competitors offering similar products, potentially resulting in loss of a competitive advantage and decreased revenues. Despite our efforts to protect our proprietary rights, existing patent, copyright, trademark, and trade secret laws afford only limited protection. In addition, the laws of some foreign countries do not protect our proprietary rights to the same extent as the laws of the United States. Attempts may be made to copy or reverse engineer aspects of our products or to obtain and use information that we regard as proprietary. Accordingly, we may not be able to prevent misappropriation of our technology or to deter others from developing similar technology. Furthermore, policing the unauthorized use of our products is difficult. We have been involved in extensive litigation to enforce certain of our patents and are currently engaged in such litigation. Additional litigation may be necessary in the future to enforce our intellectual property rights. This litigation could result in substantial costs and diversion of resources and could significantly harm our business.
The optical networking and communications industry is characterized by the existence of a large number of patents and frequent litigation based on allegations of patent infringement. We have been involved in extensive litigation to protect our products against accusations of infringement. See "Item 3. Legal Proceedings." From time to time, other parties may assert patent, copyright, trademark, and other intellectual property rights to technologies in various jurisdictions that are important to our business, and such claims could result in additional litigation. Any claims asserting that our products infringe or may infringe proprietary rights of third parties, if determined adversely to us, could significantly harm our business. Any such claims, with or without merit, could be time-consuming, result in costly litigation, divert the efforts of our technical and management personnel, cause product shipment delays, or require us to enter into royalty or licensing agreements, any of which could significantly harm our business. Royalty or licensing agreements, if required, may not be available on terms acceptable to us, if at all. In addition, our agreements with our customers typically require us to indemnify our customers from any expense or liability resulting from claimed infringement of third party intellectual property rights. In the event a claim against us was successful and we could not obtain a license to the relevant technology on acceptable terms or license a substitute technology or redesign our products to avoid infringement, our business would be significantly harmed.
Employees
As of April 29, 2018, we employed approximately 13,000 full-time employees and contractors, of whom approximately 1,200 were located in the United States and approximately 11,000 were located at our production facilities in Ipoh, Malaysia, and Wuxi, China. We also, from time to time, employ part-time employees. Our employees are not represented by any union, and we have never experienced a work stoppage. Certain of our employees in our Sydney, Australia facility are subject to a collective agreement not involving a union. In addition, we have a works council in our Berlin, Germany facility. We believe that there is a positive employee relations environment within our company.
Segment and Geography Information
The material set forth in Note 14 of Notes to Consolidated Financial Statements in Item 8 of this Annual Report on Form 10-K is incorporated herein by reference.
Available Information
Our website is located at www.finisar.com. Electronic copies of our annual reports on Form 10-K, quarterly reports on Form 10-Q, current reports on Form 8-K, and any amendments to those reports filed or furnished pursuant to Section 13(a) or 15(d) of the Securities Exchange Act of 1934 are available, free of charge, on our website as soon as practicable after we electronically file such material with the U.S. Securities and Exchange Commission ("SEC"). The contents of our website are not incorporated by reference in this Annual Report on Form 10-K.
7
Item 1A. | Risk Factors |
OUR FUTURE PERFORMANCE IS SUBJECT TO A VARIETY OF RISKS, INCLUDING THOSE DESCRIBED BELOW. IF ANY OF THE FOLLOWING RISKS ACTUALLY OCCUR, OUR BUSINESS COULD BE HARMED AND THE TRADING PRICE OF OUR COMMON STOCK COULD DECLINE. YOU SHOULD ALSO REFER TO THE OTHER INFORMATION CONTAINED IN THIS REPORT, INCLUDING OUR CONSOLIDATED FINANCIAL STATEMENTS AND THE RELATED NOTES.
Our quarterly revenues and operating results fluctuate due to a variety of factors, which may result in volatility or a decline in the price of our stock.
Our quarterly operating results have varied significantly due to a number of factors, including:
• | fluctuation in demand for our products; |
• | the timing of new product introductions or enhancements by us and our competitors; |
• | the level of market acceptance of new and enhanced versions of our products; |
• | the timing of acquisitions that we have undertaken; |
• | the timing or cancellation of large customer orders; |
• | the timing of capital expenditures associated with our new manufacturing facility in Sherman, Texas; |
• | changes in levels of our customers' forecasted demand; |
• | the length and variability of the sales cycle for our products; |
• | pricing policy changes by us and our competitors and suppliers; |
• | the availability of development funding; |
• | changes in the mix of products sold; |
• | inventory changes; |
• | increased competition in product lines, and competitive pricing pressures; and |
• | the evolving and unpredictable nature of the markets for products incorporating our optical components and subsystems. |
We expect that our operating results will continue to fluctuate in the future as a result of these factors and a variety of other factors, including:
• | fluctuations in manufacturing yields; |
• | the emergence of new industry standards; |
• | failure to anticipate changing customer product requirements; |
• | the loss or gain of important customers; |
• | product obsolescence; and |
• | the amount of research and development expenses associated with new product introductions. |
Our operating results could also be harmed by:
• | adverse changes in economic conditions in various geographic areas where we or our customers do business; |
• | acts of terrorism and international conflicts or domestic crises; |
• | other conditions affecting the timing of customer orders or our ability to fill orders of customers subject to export control or U.S. economic sanctions; or |
• | a downturn in the markets for our customers' products, particularly the data storage and networking and telecommunication components markets. |
We may experience a delay in generating or recognizing revenues for a number of reasons. Open orders at the beginning of each quarter are typically lower than expected revenues for that quarter and are generally cancelable with minimal notice. Accordingly, we depend on obtaining orders during each quarter for shipment in that quarter to achieve our revenue objectives. Failure to ship these products by the end of a quarter may adversely affect our operating results. Furthermore, our customer agreements typically provide that the customer may delay scheduled delivery dates and cancel orders within specified timeframes without significant penalty. Because we base our operating expenses on anticipated revenue trends and a high percentage of our expenses are fixed in the short term, any delay in generating or recognizing forecasted revenues or changes in levels of our customers' forecasted demand could significantly harm our business. It is likely that in some future quarters our operating results will again decrease from the previous quarter or fall below the expectations of securities analysts and investors.
8
As a result of these factors, our operating results may vary significantly from quarter to quarter. Accordingly, we believe that period-to-period comparisons of our results of operations should not be relied upon as indications of future performance. Any shortfall in revenues or net income from the previous quarter or from levels expected by the investment community could cause a decline in the trading price of our stock.
We may lose sales if our suppliers or independent contract manufacturers fail to meet our needs or go out of business.
We currently purchase a number of key components used in the manufacture of our products from single or limited sources, and we rely on several independent contract manufacturers to supply us with certain key components and subassemblies, including lasers, modulators, and printed circuit boards. We depend on these sources to meet our production needs. Moreover, we depend on the quality of the components and subassemblies that they supply to us, over which we have limited control. Several of our suppliers are or may become financially unstable as the result of current global market conditions. In addition, from time to time we have encountered shortages and delays in obtaining components, and we may encounter additional shortages and delays in the future. If we cannot supply products due to a lack of components, or are unable to redesign products with other components in a timely manner, our business will be significantly harmed. We generally have no long-term contracts with any of our component suppliers or contract manufacturers. As a result, a supplier or contract manufacturer can discontinue supplying components or subassemblies to us without penalty. If a supplier were to discontinue supplying a key component or cease operations, the resulting product manufacturing and delivery delays could be lengthy, and our business could be substantially harmed. We are also subject to potential delays in the development by our suppliers of key components which may affect our ability to introduce new products. Similarly, disruptions in the operations of our key suppliers or in the services provided by our contract manufacturers, including disruptions due to natural disasters, or the transition to other suppliers of these key components or services could lead to supply chain problems or delays in the delivery of our products. These problems or delays could damage our relationships with our customers and adversely affect our business.
We use rolling forecasts based on anticipated product orders to determine our component and subassembly requirements. Lead times for materials and components that we order vary significantly and depend on factors such as specific supplier requirements, contract terms and current market demand for particular components. If we overestimate our component requirements, we may have excess inventory, which would increase our costs. If we underestimate our component requirements, we may have inadequate inventory, which could interrupt our manufacturing and delay delivery of our products to our customers. Any of these occurrences could significantly harm our business.
If we are unable to realize anticipated cost savings from the transfer of certain manufacturing operations to our overseas locations and increased use of internally-manufactured components our results of operations could be harmed.
As part of our ongoing initiatives to reduce the cost of revenues, we expect to realize significant cost savings through (i) the transfer of certain product manufacturing operations to lower cost off-shore locations and (ii) product engineering changes to enable the broader use of internally-manufactured components. The transfer of production to overseas locations may be more difficult and costly than we currently anticipate which could result in increased transfer costs and time delays. Further, following transfer, we may experience lower manufacturing yields than those historically achieved in our U.S. manufacturing locations. In addition, the engineering changes required for the use of internally-manufactured components may be more technically-challenging than we anticipate and customer acceptance of such changes could be delayed. Adverse changes in currency exchange rates between the U.S. dollar and the applicable local currency and/or unanticipated increases in labor costs at our lower cost manufacturing locations could limit the anticipated benefits of the transfer of certain product manufacturing operations to such lower cost locations. If we fail to achieve the planned product manufacturing transfer and increase in internally-manufactured component use within our currently anticipated timeframe, or if our manufacturing yields decrease as a result, we may be unsuccessful in achieving cost savings or such savings will be less than anticipated, and our results of operations could be harmed.
Continued competition in our markets may lead to an accelerated reduction in our prices, revenues and market share.
The end markets for optical products have experienced significant industry consolidation during the past few years while the industry that supplies these customers has experienced less consolidation. As a result, the markets for optical subsystems and components are highly competitive. Our current competitors include a number of domestic and international companies, many of which have substantially greater financial, technical, marketing and distribution resources and brand name recognition than we have. Increased consolidation in our industry, should it occur, will reduce the number of our competitors, but would be likely to further strengthen surviving industry participants. We may not be able to compete successfully against either current or future competitors. Companies competing with us may introduce products that are competitively priced, have increased performance or functionality, or incorporate technological advances and may be able to react quicker to changing customer
9
requirements and expectations. There is also the risk that network systems vendors may re-enter the subsystem market and begin to manufacture the optical subsystems incorporated in their network systems. Increased competition could result in significant price erosion, reduced revenue, lower margins or loss of market share, any of which would significantly harm our business. Our principal competitors for data communication applications include Applied Optoelectronics, Foxconn, Innolight, Lumentum, Oclaro, and Sumitomo. Our principal competitors for telecommunication applications include Acacia Communications, Fujitsu Optical Components, Lumentum, Oclaro, and Sumitomo. Our competitors continue to introduce improved products and we will have to do the same to remain competitive.
Decreases in average selling prices of our products may reduce our gross margins.
The market for optical subsystems is characterized by declining average selling prices resulting from factors such as increased competition, overcapacity, the introduction of new products and increased unit volumes as manufacturers continue to deploy network and storage systems. We have in the past experienced, and in the future may experience, substantial period-to-period fluctuations in operating results due to declining average selling prices. We anticipate that average selling prices will decrease in the future in response to product introductions by competitors or us, or by other factors, including pricing pressures from significant customers. In particular, we typically conduct pricing negotiations for our existing products with some of our largest telecommunication OEM customers in the last several months of the calendar year. Decreases in our average selling prices resulting from these negotiations typically become effective at the beginning of the next calendar year and generally have an adverse impact on our gross margins in future quarters. This impact is typically most pronounced in our fourth fiscal quarter ending in April, when the impact of the new pricing is first felt over a full quarter. In order to sustain profitable operations, we must continue to develop and introduce on a timely basis new products that incorporate features that can be sold at higher average selling prices. Failure to do so could cause our revenues and gross margins to decline, which would result in additional operating losses and significantly harm our business.
We may be unable to reduce the cost of our products sufficiently to enable us to compete with others. Our cost reduction efforts may not allow us to keep pace with competitive pricing pressures and could adversely affect our margins. In order to remain competitive, we must continually reduce the cost of manufacturing our products through design and engineering changes. We may not be successful in redesigning our products or delivering our products to market in a timely manner. We cannot assure you that any redesign will result in sufficient cost reductions to allow us to reduce the price of our products to remain competitive or improve our gross margins.
Shifts in our product mix may result in declines in gross margins.
Gross margins on individual products fluctuate over the product's life cycle. Our overall gross margins have fluctuated from period to period as a result of shifts in product mix, the introduction of new products, decreases in average selling prices for older products and our ability to reduce product costs. These fluctuations are expected to continue in the future.
Failure to accurately forecast our revenues could result in additional charges for obsolete or excess inventories or non-cancelable purchase commitments.
We base many of our operating decisions, and enter into purchase commitments, on the basis of anticipated revenue trends which are highly unpredictable. Some of our purchase commitments are not cancelable, and in some cases we are required to recognize a charge representing the amount of material or capital equipment purchased or ordered which exceeds our actual requirements. In the past, we have periodically experienced significant growth followed by a significant decrease in customer demand such as occurred in fiscal 2001, when revenues increased by 181% followed by a decrease of 22% in fiscal 2002. Based on projected revenue trends during these periods, we acquired inventories and entered into purchase commitments in order to meet anticipated increases in demand for our products, which did not materialize. As a result, we recorded significant charges for obsolete and excess inventories and non-cancelable purchase commitments which contributed to substantial operating losses in fiscal 2002. Should revenues in future periods again fall substantially below our expectations, or should we fail again to accurately forecast changes in demand mix, we could again be required to record substantial charges for obsolete or excess inventories or non-cancelable purchase commitments.
If we encounter sustained yield problems or other delays in the production or delivery of our internally-manufactured components or in the final assembly and test of our products, we may lose sales and damage our customer relationships.
Our manufacturing operations are highly vertically integrated. In order to reduce our manufacturing costs, we have acquired a number of companies, and business units of other companies that manufacture optical components incorporated in our optical subsystem products and have developed our own facilities for the final assembly and testing of our products. For example, we design and manufacture many critical components incorporated in transceivers used for data communication and
10
telecommunication applications, including all of the short wavelength VCSEL lasers, at our wafer fabrication facility in Allen, Texas and manufacture a portion of our internal requirements for longer wavelength lasers at our wafer fabrication facility in Fremont, California. We assemble and test most of our transceiver products at our facilities in Ipoh, Malaysia and Wuxi, China. As a result of this vertical integration, we have become increasingly dependent on our internal production capabilities. The manufacture of critical components, including the fabrication of wafers, and the assembly and testing of our products, involve highly complex processes. For example, minute levels of contaminants in the manufacturing environment, difficulties in the fabrication process or other factors can cause a substantial portion of the components on a wafer to be nonfunctional. These problems may be difficult to detect at an early stage of the manufacturing process and often are time-consuming and expensive to correct. From time to time, we have experienced problems achieving acceptable yields at our wafer fabrication facilities, resulting in delays in the availability of components. Moreover, an increase in the rejection rate of products during the quality control process before, during or after manufacture, results in lower yields and margins. In addition, changes in manufacturing processes required as a result of changes in product specifications, changing customer needs and the introduction of new product lines have historically significantly reduced our manufacturing yields, resulting in low or negative margins on those products. Poor manufacturing yields over a prolonged period of time could adversely affect our ability to deliver our subsystem products to our customers and could also affect our sale of components to customers in the merchant market. Our inability to supply components to meet our internal needs could harm our relationships with customers and have an adverse effect on our business.
The markets for our products are subject to rapid technological change, and to compete effectively we must continually introduce new products that achieve market acceptance.
The markets for our products are characterized by rapid technological change, frequent new product introductions, substantial capital investment, changes in customer requirements and evolving industry standards with respect to the protocols used in data communication and telecommunication networks. Our future performance will depend on the successful development, introduction and market acceptance of new and enhanced products that address these changes as well as current and potential customer requirements. For example, the market for optical subsystems is currently characterized by a trend toward the adoption of “pluggable” modules and subsystems that do not require customized interconnections and by the development of more complex and integrated optical subsystems. We expect that new technologies will emerge as competition and the need for higher and more cost-effective bandwidth increases. The introduction of new and enhanced products may cause our customers to defer or cancel orders for existing products. In addition, a slowdown in demand for existing products ahead of a new product introduction could result in a write-down in the value of inventory on hand related to existing products and/or a charge for the impairment of long-lived assets related to such products. We have in the past experienced a slowdown in demand for existing products and delays in new product development and such slowdown in demand and delays may occur in the future. To the extent customers defer or cancel orders for existing products due to a slowdown in demand or in the expectation of a new product release or if there is any delay in development or introduction of our new products or enhancements of our products, our operating results would be adversely affected. We also may not be able to develop the underlying core technologies necessary to create new products and enhancements, or to license these technologies from third parties. Product development delays may result from numerous factors, including:
• | changing product specifications and customer requirements; |
• | unanticipated engineering complexities; |
• | expense reduction measures we have implemented, and others we may implement, to conserve our cash and attempt to achieve and sustain profitability; |
• | difficulties in hiring and retaining necessary technical personnel; |
• | difficulties in reallocating engineering resources and overcoming resource limitations; and |
• | changing market or competitive product requirements. |
The development of new, technologically advanced products is a complex and uncertain process, requiring high levels of innovation and highly skilled engineering and development personnel, as well as the accurate prediction of technological and market trends. The introduction of new products also requires significant investment to ramp up production capacity, for which benefit will not be realized if customer demand does not develop as expected. Ramping of production capacity also entails risks of delays which can limit our ability to realize the full benefit of the new product introduction. We cannot assure you that we will be able to identify, develop, manufacture, market or support new or enhanced products successfully, if at all, or on a timely basis. Further, we cannot assure you that our new products will gain market acceptance or that we will be able to respond effectively to product announcements by competitors, technological changes or emerging industry standards. Many of these factors are beyond our control. Any failure to respond to technological change would significantly harm our business.
In addition, in order to achieve widespread market acceptance, we must differentiate ourselves from our competition through product offerings and brand name recognition. We cannot assure you that we will be successful in making this
11
differentiation or achieving widespread acceptance of our products. Failure of our existing or future products to maintain and achieve widespread levels of market acceptance will significantly impair our revenue growth.
Our entry into the market for components for consumer electronic products, specifically our VCSEL array products for 3D sensing, involves special risks.
We have recently entered into the market for components for consumer electronic products with our VCSEL array products for 3D sensing. We have purchased a facility in Sherman, Texas to expand our production capacity for these products and expect to make significant investments in this expansion during calendar year 2018. We have not previously participated in this market. The market for components for consumer electronics products and our expansion involve additional risks, including:
• | We expect our customer base for these products to be highly concentrated. If we are not able to meet the needs of our customers in this area, including with respect to timing and volume of production, performance and quality, we could lose business with our customers. Loss of business with any one customer could have a materially negative impact on our revenue and gross margin. |
• | We are making significant investment in the expansion of our production capacity for our VCSEL arrays for 3D sensing, including the development of a high-volume production facility in Sherman, Texas. If we are unable to complete our production expansion plan and have our new production lines qualified by our customers on a timely basis, we could harm our customer relationships and lose business, which could have a materially negative impact on our revenue and gross margin. |
• | We expect revenue from our components for consumer electronic products to have significant seasonal variance due to the timing of new customer product introductions and demand. |
Our future success ultimately depends on the continued growth of the communications industry and, in particular, the continued expansion of global information networks, particularly those directly or indirectly dependent upon a fiber optics infrastructure.
We are relying on increasing demand for voice, video and other data delivered over high-bandwidth network systems as well as commitments by network systems vendors to invest in the expansion of the global information network. As network usage and bandwidth demand increase, so does the need for advanced optical networks to provide the required bandwidth. Without network and bandwidth growth, the need for optical subsystems and components, and hence our future growth as a manufacturer of these products, will be jeopardized, and our business would be significantly harmed.
We depend on large purchases from a few significant customers, and any loss, cancellation, reduction or delay in purchases by these customers could harm our business.
A small number of customers have consistently accounted for a significant portion of our revenues. Our success will depend on our continued ability to develop and manage relationships with our major customers. Although we are attempting to expand our customer base, we expect that significant customer concentration will continue for the foreseeable future. We may not be able to offset any decline in revenues from our existing major customers with revenues from new customers, and our quarterly results may be volatile because we are dependent on large orders from these customers that may be reduced, delayed, or cancelled.
The markets in which we have historically sold our optical subsystems and components products are dominated by a relatively small number of systems manufacturers, thereby limiting the number of our potential customers. Recent consolidation of portions of our customer base, including telecommunication systems manufacturers, and potential future consolidation, may have a material adverse impact on our business. Our dependence on large orders from a relatively small number of customers makes our relationship with each customer critically important to our business. We cannot assure you that we will be able to retain our major customers, attract additional customers, or that our customers will be successful in selling their products that incorporate our products. We have in the past experienced delays and reductions in orders from some of our major customers. In addition, our customers have in the past sought price concessions from us, and we expect that they will continue to do so in the future. Expense reduction measures that we have implemented over the past several years, and additional action we are taking to reduce costs, may adversely affect our ability to introduce new and improved products which may, in turn, adversely affect our relationships with some of our key customers. Further, some of our customers may in the future shift their purchases of products from us to our competitors or to joint ventures between these customers and our competitors, or may in certain circumstances produce competitive products themselves. The loss of one or more of our major customers, any reduction or delay in sales to these customers, our inability to successfully develop relationships with additional customers, or future price concessions that we may make could significantly harm our business.
12
Because we do not have long-term contracts with our customers, our customers may cease purchasing our products at any time if we fail to meet our customers' needs.
Typically, we do not have long-term contracts with our customers. As a result, our agreements with our customers do not provide any assurance of future sales. Accordingly:
• | our customers can stop purchasing our products at any time without penalty; |
• | our customers are free to purchase products from our competitors; and |
• | our customers are not required to make minimum purchases. |
Sales are typically made pursuant to inventory hub arrangements under which customers may draw down inventory to satisfy their demand as needed or pursuant to individual purchase orders, often with extremely short lead times. If we are unable to fulfill these orders in a timely manner, it is likely that we will lose sales and customers. If our major customers stop purchasing our products for any reason, our business, financial condition, and results of operations would be harmed.
Our customers often evaluate our products for long and variable periods, which causes the timing of our revenues and results of operations to be unpredictable.
The period of time between our initial contact with a customer and the receipt of an actual purchase order typically spans over a year. During this time, customers may perform, or require us to perform, extensive and lengthy evaluation and testing of our products before purchasing and using the products in their equipment. These products often take substantial time to develop because of their complexity and because customer specifications sometimes change during the development cycle. Our customers do not typically share information on the duration or magnitude of these qualification procedures. The length of these qualification processes also may vary substantially by product and customer, and, thus, cause our results of operations to be unpredictable. While our potential customers are qualifying our products and before they place an order with us, we may incur substantial research and development and sales and marketing expenses and expend significant management effort. Even after incurring such costs, we ultimately may not be able to sell any products to such potential customers. In addition, these qualification processes often make it difficult to obtain new customers, as customers are reluctant to expend the resources necessary to qualify a new supplier if they have one or more existing qualified sources. Once our products have been qualified, the agreements that we enter into with our customers typically contain no minimum purchase commitments. Failure of our customers to incorporate our products into their systems would significantly harm our business.
Our products may contain defects that may cause us to incur significant costs, divert our attention from product development efforts and result in a loss of customers.
Our products are complex and defects may be found from time to time. Networking products frequently contain undetected software or hardware defects when first introduced or as new versions are released. In addition, our products are often embedded in or deployed in conjunction with our customers' products, which incorporate a variety of components produced by third parties. As a result, when problems occur, it may be difficult to identify the source of the problem. These problems may cause us to incur significant damages or warranty and repair costs, divert the attention of our engineering personnel from our product development efforts and cause significant customer relation problems or loss of customers, all of which would harm our business.
We may not be able to obtain additional capital in the future, and failure to do so may harm our business.
We believe that our existing balances of cash and cash equivalents, together with the cash expected to be generated from future operations, will be sufficient to meet our cash needs for working capital and capital expenditures for at least the next 12 months. We may, however, require additional financing to fund our operations in the future, to finance future acquisitions that we may propose to undertake or to repay or otherwise retire our outstanding 2033 Notes, in the aggregate principal amount of $258.8 million, which are subject to redemption by the holders in December 2018, 2023 and 2028, or our 2036 Notes, in the aggregate principal amount of $575.0 million, which are subject to redemption by the holders in December 2021, 2026 and 2031. Due to the unpredictable nature of the capital markets, particularly in the technology sector, we cannot assure you that we will be able to raise additional capital if and when it is required, especially if we experience disappointing operating results. If adequate capital is not available to us as required, or is not available on favorable terms, we could be required to significantly reduce or restructure our business operations. If we do raise additional funds through the issuance of equity or convertible debt securities, the percentage ownership of our existing stockholders could be significantly diluted, and these newly-issued securities may have rights, preferences or privileges senior to those of existing stockholders.
Our international business and operations expose us to additional risks.
13
Products shipped to customers located outside the United States account for a majority of our revenues. In addition, we have significant tangible assets located outside the United States. Our principal manufacturing facilities are located in Malaysia and China. We currently operate smaller facilities in Australia, Israel, Korea, Sweden and Germany, and we are further expanding one of our manufacturing facilities in China. We also rely on several contract manufacturers located in Asia for our supply of key subassemblies. Conducting business outside the United States subjects us to a number of additional risks and challenges, including:
• | periodic changes in a specific country's or region's economic conditions, such as recession; |
• | compliance with a wide variety of domestic and foreign laws and regulations (including those of municipalities or provinces where we have operations) and unexpected changes in those laws and regulatory requirements, including uncertainties regarding taxes, social insurance contributions and other payroll taxes and fees to governmental entities, tariffs, quotas, export controls, export licenses and other trade barriers; |
• | unanticipated restrictions on our ability to sell to foreign customers where sales of products and the provision of services may require export licenses or are prohibited by government action (for example, in early 2018, the U.S. Department of Commerce prohibited the export and sale of a broad category of U.S. products, as well as the provision of services, to ZTE Corporation, one of our customers in China); |
• | certification requirements; |
• | environmental regulations; |
• | fluctuations in foreign currency exchange rates; |
• | inadequate protection of intellectual property rights in some countries; |
• | potential political, legal and economic instability, foreign conflicts, and the impact of regional and global infectious illnesses in the countries in which we and our customers, suppliers and contract manufacturers are located; |
• | preferences of certain customers for locally produced products; |
• | difficulties and costs of staffing and managing international operations across different geographic areas and cultures, including assuring compliance with the U.S. Foreign Corrupt Practices Act and other U. S. and foreign anticorruption laws; |
• | seasonal reductions in business activities in certain countries or regions; and |
• | fluctuations in freight rates and transportation disruptions. |
These factors, individually or in combination, could impair our ability to effectively operate one or more of our foreign facilities or deliver our products, result in unexpected and material expenses, or cause an unexpected decline in the demand for our products in certain countries or regions. Our failure to manage the risks and challenges associated with our international business and operations could have a material adverse effect on our business.
Rising threats of international tariffs, including tariffs applied to goods traded between the United States and China, could materially and adversely affect our business and results of operations.
Since the beginning of 2018, there has been increasing rhetoric, in some cases coupled with legislative or executive action, from several U.S. and foreign leaders regarding the possibility of instituting tariffs against foreign imports of certain materials. More specifically, in March and April of 2018, the U.S. and China have applied tariffs to certain of each other’s exports. The institution of trade tariffs both globally and between the U.S. and China specifically carries the risk of negatively impacting China’s overall economic condition, which could have negative repercussions on the Company. Furthermore, imposition of tariffs could cause a decrease in the sales of our products to customers located in China or other customers selling to Chinese end users, which would directly impact our business.
The current U.S. President, members of his Administration, and other public officials, including members of the current U.S. Congress, have made public statements indicating possible significant changes in U.S. trade policy and have taken certain actions that may impact U.S. trade policy, including new or increased tariffs on certain goods imported into the United States. Since we rely primarily upon non-U.S. manufacturers to make our products, such changes, if adopted, could have a disproportionate impact and make our products more expensive and less competitive in domestic markets. Further, changes in U.S. trade policy could trigger retaliatory actions by affected countries, which could impose restrictions on our ability to do business in or with affected countries or prohibit, reduce or discourage purchases of our products by foreign customers, leading to increased costs of components contained in our products, increased costs of manufacturing our products, and higher prices for our products in foreign markets. For example, there are risks that the Chinese government may, among other things, require the use of local suppliers, compel companies that do business in China to partner with local companies to conduct business and provide incentives to government-backed local customers to buy from local suppliers rather than companies like ours. Changes in, and responses to, U.S. trade policy could reduce the competitiveness of our products and cause our sales and revenues to drop, which could materially and adversely impact our business and results of operations.
14
Our ability to hire and retain employees may be negatively impacted by changes in immigration laws, regulations and procedures.
Foreign nationals who are not U.S. citizens or permanent residents constitute an important part of our U.S. workforce, particularly in the areas of engineering and product development. Our ability to hire and retain these workers and their ability to remain and work in the United States are impacted by laws and regulations, as well as by procedures and enforcement practices of various government agencies. Changes in immigration laws, regulations or procedures, including those that may be enacted by the new U.S. presidential administration, may adversely affect our ability to hire or retain such workers, increase our operating expenses and negatively impact our ability to deliver our products and services.
Our future operating results may be subject to volatility, as a result of exposure to foreign exchange risks.
We are exposed to foreign exchange risks. Foreign currency fluctuations may affect both our revenues and our costs and expenses, which would significantly affect our operating results. More than 99% of our sales worldwide are denominated in U.S. dollars. If there is a significant devaluation of the currency in a specific country relative to the dollar, the prices of our products will increase relative to that country's currency, our products may be less competitive in that country and our revenues may be adversely affected.
Although we price our products in U.S. dollars, portions of both our cost of revenues and operating expenses are incurred in foreign currencies, principally the Malaysian ringgit, the Chinese yuan, the Australian dollar, the Israeli shekel, the Swedish krona, and the Euro. As a result, we bear the risk that the rate of inflation in one or more countries will exceed the rate of the devaluation of that country's currency in relation to the U.S. dollar, which would increase our costs as expressed in U.S. dollars. To date, we have not engaged in currency hedging transactions to decrease the risk of financial exposure from fluctuations in foreign exchange rates.
Our failure to protect our intellectual property may significantly harm our business.
Our success and ability to compete is dependent in part on our proprietary technology. We rely on a combination of patent, copyright, trademark and trade secret laws, as well as confidentiality agreements to establish and protect our proprietary rights. We license certain of our proprietary technology, including our digital diagnostics technology, to customers who include current and potential competitors, and we rely largely on provisions of our licensing agreements to protect our intellectual property rights in this technology. We have obtained a number of issued patents, acquired certain other patents as a result of our acquisitions, and we have filed applications for additional patents; however, we cannot assure you that any pending patent applications will result in issued patents, any issued patents will include claims that are sufficiently broad to cover our products and technologies or to provide sufficient protection from our competitors, or that our issued patents will be upheld. Additionally, significant technology used in our product lines is not the subject of any patent protection, and we may be unable to obtain patent protection on such technology in the future. Any infringement of our proprietary rights could result in significant litigation costs, and any failure to adequately protect our proprietary rights could result in our competitors offering similar products, which could result in loss of competitive advantages and decreased revenues to us.
Despite our efforts to protect our proprietary rights, existing patent, copyright, trademark and trade secret laws afford only limited protection. In addition, the laws of some foreign countries do not protect our proprietary rights to the same extent as do the laws of the United States. Attempts may be made to copy or reverse engineer aspects of our products or to obtain and use information that we regard as proprietary. Accordingly, we may not be able to prevent misappropriation of our technology or deter others from developing similar technology. Furthermore, policing the unauthorized use of our products is difficult and expensive. We are currently engaged in pending litigation to enforce certain of our patents, and additional litigation may be necessary in the future to enforce our intellectual property rights or to determine the validity and scope of the proprietary rights of others. In connection with the pending litigation, substantial management time has been, and will continue to be, expended. In addition, we have incurred, and we expect to continue to incur, substantial legal expenses in connection with these pending lawsuits. These costs and this diversion of resources could significantly harm our business.
Claims that we or any user of our products infringe third-party intellectual property rights could result in significant expenses or restrictions on our ability to sell our products.
Our industry is characterized by the existence of a large number of patents and frequent litigation based on allegations of patent infringement. We are currently involved as a defendant in patent infringement litigation and have been involved in the past as a defendant in such lawsuits. From time to time, we have also been accused of patent infringement that is not subject to current lawsuit, some of which accusations are unresolved. In the future, we may be subject to additional litigation alleging
15
infringement of patent, copyright, trademark and other intellectual property rights to technologies and in various jurisdictions that are important to our business. Any claims asserting that our products infringe or may infringe proprietary rights of third parties, if determined adversely to us, could significantly harm our business. Further, claims against a customer and/or end user of our products that the re-sale or use of our products, either alone or in combination with other products, infringes proprietary rights of third parties could cause customers or users to choose to not or be required to not utilize our products alone or in such combination, which could harm our sales of such products. Any claims, against us or any customer or user of our products, with or without merit, could be time-consuming, result in costly litigation, divert the efforts of our technical and management personnel, cause product shipment delays or require us to enter into royalty or licensing agreements, any of which could significantly harm our business. In addition, our agreements with our customers typically require us to indemnify our customers from any expense or liability resulting from claimed infringement of third party intellectual property rights. In the event a claim against us was successful and we could not obtain a license to the relevant technology on acceptable terms or license a substitute technology or redesign our products to avoid infringement, our business would be significantly harmed.
Numerous patents in our industry are held by others, including academic institutions, competitors and non-practicing entities. Optical subsystem suppliers may seek to gain a competitive advantage or other third parties may seek an economic return on their intellectual property portfolios by making infringement claims against us. In the future, we may need to obtain license rights to patents or other intellectual property held by others to the extent necessary for our business. Unless we are able to obtain those licenses on commercially reasonable terms, patents or other intellectual property held by others could inhibit our development of new products. Licenses granting us the right to use third party technology may not be available on commercially reasonable terms, if at all. Generally, a license, if granted, would include payments of up-front fees, ongoing royalties or both. These payments or other terms could have a significant adverse impact on our operating results.
If we are unable to retain our key management and technical personnel and attract and retain additional key personnel as required, our business could be significantly harmed.
Our future success is substantially dependent upon the continued contributions of the members of our senior management team, many of whom have years of management, engineering, sales, marketing and manufacturing experience that would be difficult to replace. We also believe our future success will depend in large part upon our ability to attract and retain additional highly skilled managerial, technical, sales and marketing, finance and manufacturing personnel. In particular, we will need to increase the number of our technical staff members with experience in high-speed networking applications as we further develop our product lines. Competition for these highly skilled employees in our industry is intense. In making employment decisions, particularly in the high-technology industries, job candidates often consider the value of the equity they are to receive in connection with their employment. Therefore, significant volatility in the price of our common stock may adversely affect our ability to attract or retain key management and technical personnel. The loss of service of any our key management or technical employees, our inability to attract or retain qualified personnel in the future or delays in hiring key personnel, as required, could significantly harm our business. In addition, employees may leave our company and subsequently compete against us. Moreover, companies in our industry whose employees accept positions with competitors frequently claim that their competitors have engaged in unfair hiring practices. We have been subject to claims of this type and may be subject to such claims in the future as we seek to hire qualified personnel. Some of these claims may result in material litigation. We could incur substantial costs in defending ourselves against these claims, regardless of their merits.
Our business and future operating results are subject to a wide range of uncertainties arising out of the continuing threat of terrorist attacks and ongoing military actions in the Middle East.
Like other U.S. companies, our business and operating results are subject to uncertainties arising out of the continuing threat of terrorist attacks on United States' interests, including U.S. companies, in locations worldwide and ongoing military actions in the Middle East, including the economic consequences of the war in Afghanistan or additional terrorist activities and associated political instability, and the impact of heightened security concerns on domestic and international travel and commerce. In particular, due to these uncertainties we are subject to:
• | increased risks related to the operations of our manufacturing facilities in Malaysia; |
• | greater risks of disruption in the operations of our China, Singapore and Israeli facilities and our Asian contract manufacturers, including contract manufacturers located in Thailand, and more frequent instances of shipping delays; and |
• | the risk that future tightening of immigration controls may adversely affect the residence status of non-U.S. engineers and other key technical employees in our U.S. facilities or our ability to hire new non-U.S. employees in such facilities. |
16
Future acquisitions could be difficult to integrate, disrupt our business, dilute stockholder value and harm our operating results.
In addition to our combination with Optium in August 2008 and our acquisitions of Ignis in May 2011, Red-C in July 2012 and u2t Photonics AG ("u2t") in January 2014, we have completed the acquisition of 11 privately-held companies and certain businesses and assets from seven other companies since October 2000. We continue to review opportunities to acquire other businesses, product lines or technologies that would complement our current products, expand the breadth of our markets or enhance our technical capabilities, or that may otherwise offer growth opportunities, and we from time to time make proposals and offers, and take other steps, to acquire businesses, products and technologies.
The Optium merger and several of our other past acquisitions have been material, and acquisitions that we may complete in the future may be material. In 13 of our 22 acquisitions, we issued common stock or notes convertible into common stock as all or a portion of the consideration. The issuance of common stock or other equity securities by us in connection with any future acquisition would dilute our stockholders' percentage ownership.
Other risks associated with acquiring the operations of other companies include:
• | problems assimilating the purchased operations, technologies or products; |
• | unanticipated costs associated with the acquisition; |
• | diversion of management's attention from our core business; |
• | adverse effects on existing business relationships with suppliers and customers; |
• | risks associated with entering markets in which we have no or limited prior experience; and |
• | potential loss of key employees of purchased organizations. |
Not all of our past acquisitions have been successful. In the past, we have subsequently sold some of the assets acquired in prior acquisitions, discontinued product lines and closed acquired facilities. As a result of these activities, we incurred significant restructuring charges and charges for the write-down of assets associated with those acquisitions. Through fiscal 2018, we have written off all of the goodwill associated with our past acquisitions with the exception of the more recently completed acquisitions of Ignis, Red-C and u2t. We cannot assure you that we will be successful in overcoming problems encountered in connection with our past acquisitions or potential future acquisitions, and our inability to do so could significantly harm our business. In addition, to the extent that the economic benefits associated with our past acquisitions or any of our future acquisitions diminish in the future, we may be required to record additional write downs of goodwill, intangible assets or other assets associated with such acquisitions, which would adversely affect our operating results.
We have made and may continue to make strategic investments which may not be successful, may result in the loss of all or part of our invested capital and may adversely affect our operating results.
Since inception, we have made minority equity investments in a number of early-stage technology companies, totaling approximately $61.9 million. Our investments in these early stage companies were primarily motivated by our desire to gain early access to new technology. We intend to review additional opportunities to make strategic equity investments in pre-public companies where we believe such investments will provide us with opportunities to gain access to important technologies or otherwise enhance important commercial relationships. We have little or no influence over the early-stage companies in which we have made or may make these strategic, minority equity investments. Each of these investments in pre-public companies involves a high degree of risk. We may not be successful in achieving the financial, technological or commercial advantage upon which any given investment is premised, and failure by the early-stage company to achieve its own business objectives or to raise capital needed on acceptable economic terms could result in a loss of all or part of our invested capital. Between fiscal 2003 and 2018, we wrote off an aggregate of $28.6 million in eight investments which became impaired and reclassified $4.2 million of another investment to goodwill as the investment was deemed to have no value. We may be required to write off all or a portion of the $604,000 of such equity investments remaining on our balance sheet as of April 29, 2018 in future periods.
Our ability to utilize certain net operating loss carryforwards and tax credit carryforwards may be limited under Sections 382 and 383 of the Internal Revenue Code.
As of April 29, 2018, the Company had federal, state and foreign net operating loss carryforwards of approximately $236.5 million, $13.8 million and $22.9 million, respectively, and federal and state tax credit carryforwards of approximately $38.8 million and 31.4 million, respectively. With the exception of California R&D credit, which can be carried forward indefinitely, the net operating loss and tax credit carryforwards will expire at various dates beginning in fiscal 2020 through 2037, if not utilized. $78.0 million of such net operating loss carryforwards and $3.0 million of such tax credit carryforwards will expire in the next five years. Utilization of the Company's U.S. net operating loss and tax credit carryforwards may be subject to a
17
substantial annual limitation due to the ownership change limitations set forth in Internal Revenue Code Section 382 and similar state provisions. Such an annual limitation could result in the expiration of the net operating loss and tax credit carryforwards before utilization.
On December 22, 2017, H.R.1, commonly referred to as the Tax Cuts and Jobs Act ("TCJA"), was signed into law. The TCJA is complex and includes amendments that significantly change the taxation of offshore earnings and the deductibility of interest. The TCJA had a material impact on the value of our deferred tax assets and could increase our future U.S. tax expense. The TCJA implements a territorial tax system, which includes a mandatory deemed repatriation of all undistributed foreign earnings that are subject to a U.S. income tax. The mandatory deemed repatriation of these undistributed earnings has been offset by federal and state net operating loss carryforwards, and state credit carryforwards. Additionally, TCJA introduces new international tax provisions that will be effective for our fiscal year 2019, including (i) a new provision designed to currently tax the global low-taxed income of our foreign subsidiaries, together with a deduction of up to 50 percent and a partial credit for foreign taxes incurred by the foreign subsidiaries; (ii) limitations on the deductibility of certain base eroding payments to foreign entities; and (iii) limitations on the use of foreign tax credits to reduce U.S. income tax liability. While each of these provisions may have an impact on our tax expense for fiscal year 2019 and future periods, we expect the minimum tax on certain base erosion payments to have the most significant impact. We are currently assessing the effect of the TCJA on our business and consolidated financial statements. Reference is made to "Part II, Item 8, Financial Statements - Note 13. Income Taxes" for further discussion of the TCJA.
Changes in the application of tax policies may harm our results of operations.
A number of factors may negatively impact the manner in which our existing NOLs are applied as well as our future effective tax rates including, but not limited to:
• | the jurisdictions in which profits are determined to be earned and taxed; |
• | changes in valuation of our deferred tax assets and liabilities; |
• | increases in expenses not deductible for tax purposes; |
• | changes in available tax credits; |
• | changes in stock-based compensation; |
• | changes in tax laws or the interpretation of such tax laws, including by authorities in municipalities where we are subject to social insurance and other payroll taxes and fees, and changes in generally accepted accounting principles in the United States or other countries in which we operate; and |
• | potential changes in IRS's clarification on TCJA. |
An adverse change that impacts our tax position could negatively impact our operating results. In addition, we are the recipient of tax incentives that provide that certain income earned by our subsidiary in Malaysia is subject to a tax holiday for a limited period of time under the laws of that country. This Malaysian tax holiday is subject to expiration in August 2021. Our ability to realize benefits from tax initiatives could be materially affected if, among other things, applicable requirements are not met, the incentives are substantially modified, or if we incur losses for which we cannot take a deduction. In addition, although we have successfully received tax holiday extensions in the past, there can be no assurance that future extensions will be granted. If we are not able to extend a tax holiday, our total tax paid on a consolidated basis would be materially increased.
We will lose sales if we are unable to obtain government authorization to export certain of our products, and we would be subject to legal and regulatory consequences if we do not comply with applicable export control laws and regulations.
Exports of certain of our products are subject to export controls imposed by the U.S. Government and administered by the United States Departments of State and Commerce. In certain instances, these regulations may require pre-shipment authorization from the administering department. For products subject to the Export Administration Regulations, or EAR, administered by the Department of Commerce's Bureau of Industry and Security, the requirement for a license is dependent on the type and end use of the product, the final destination, the identity of the end user and whether a license exception might apply. Virtually all exports of products subject to the International Traffic in Arms Regulations, or ITAR, administered by the Department of State's Directorate of Defense Trade Controls, require a license. Certain of our fiber optics products are subject to EAR and we historically have sold some products, including certain products developed with government funding, subject to ITAR. Products developed and manufactured in our foreign locations are subject to export controls of the applicable foreign nation.
Given the current global political climate, obtaining export licenses can be difficult and time-consuming. Failure to obtain export licenses for these shipments or having one or more of our customers be restricted from receiving exports from us could significantly reduce our revenue and materially adversely affect our business, financial condition and results of operations.
18
Compliance with regulations of the U.S. and other governments also subjects us to additional fees and costs. The absence of comparable restrictions on competitors in other countries may adversely affect our competitive position.
We have previously been the subject of inquiries from the Department of State and the Department of Justice regarding compliance with ITAR. Although these inquiries were closed with no action being taken, we expended significant time and resources to resolve them, and future inquiries of this type could also be costly to resolve.
Privacy concerns and compliance with domestic or foreign privacy laws and regulations may increase our expenses, result in legal or regulatory proceedings against us and may harm our business.
In the ordinary course of our business, we maintain sensitive personal data on our networks, including confidential information relating to our customers, employees and business partners. Global privacy legislation, enforcement, and policy activity are rapidly expanding and creating a complex compliance regulatory environment regarding the collection, use, storage and disclosure of such information. These laws and regulations are still evolving and are likely to be in flux and subject to uncertain interpretation for the foreseeable future. In particular, the political, legal and economic climate in China, both nationally and regionally, is fluid and unpredictable. Further, personal privacy, cyber security, and data protection are becoming increasingly significant issues in China. To address these issues, the Standing Committee of the National People’s Congress promulgated the Cyber Security Law of the People’s Republic of China (the “Cyber Security Law”), which took effect on June 1, 2017. The Cyber Security Law sets forth various requirements relating to the collection, use, storage, disclosure and security of data, among other things. Various Chinese agencies are expected to issue additional regulations in the future to define these requirements more precisely. These requirements may increase our costs of compliance.
Additionally, the European Union recently adopted the General Data Protection Regulation (the “GDPR”), which comprehensively reforms the EU’s data protection laws and is expected to take effect in May 2018. The GDPR imposes strict data protection requirements that may necessitate changes to our business practices to comply with the new requirements or to address the concerns of our customers or business partners relating to the GDPR. The GDPR also includes severe financial penalties for non-compliance. Complying with any new regulatory requirements could force us to incur substantial expenses or require us to change our business practices in a manner that could harm our business and any non-compliance may result in lawsuits, regulatory fines, or other actions or liability. Our business may also be harmed if these privacy-related laws or any newly adopted privacy-related laws are interpreted or implemented in a manner that is inconsistent from country to country and inconsistent with our current policies and practices, or those of our customers or business partners. Costs to comply with rapidly changing global privacy-related laws and regulations and to implement related data protection measures could be significant. We may also have to change the manner in which we contract with our business partners, store and transfer information and otherwise conduct our business, which could increase our costs and harm our financial results. In addition, even inadvertent failure to comply with federal, state, or international privacy-related or data protection laws and regulations could result in proceedings against us by governmental entities or others, resulting in fines, penalties, restrictions on or prohibitions on our operations in certain jurisdictions, increased compliance costs and other adverse effects.
We are subject to pending securities class action and shareholder derivative legal proceedings.
Several purported securities class action lawsuits were filed against us and our Chairman of the Board, Chief Executive Officer and Chief Financial Officer following our March 8, 2011 announcement of unaudited financial results for the third quarter of fiscal 2011 and our financial outlook for the fourth quarter of fiscal 2011. We also have been named as a nominal defendant in several shareholder derivative lawsuits filed in 2011 concerning our March 8, 2011 earnings announcement. No specific amounts of damages have been alleged in the class action lawsuits and, by the nature of the lawsuits, no damages will be alleged against Finisar in the derivative lawsuits.
We will continue to incur legal fees in connection with these pending cases, including expenses for the reimbursement of legal fees of present and former officers and directors under indemnification obligations. The expense of continuing to defend such litigation may be significant. We intend to defend these lawsuits vigorously, however there can be no assurance that we will be successful in any defense. If any of the lawsuits related to our earnings announcement are adversely decided, we may be liable for significant damages directly or under our indemnification obligations, which could adversely affect our business, results of operations and cash flows. Further, the amount of time that will be required to resolve these lawsuits is unpredictable and these actions may divert management's attention from the day-to-day operations of our business, which could adversely affect our business, results of operations and cash flows.
Our business and future operating results may be adversely affected by events outside our control.
19
Our business and operating results are vulnerable to events outside of our control, such as earthquakes, floods, fire, power loss, telecommunication failures and uncertainties arising out of terrorist attacks in the United States and overseas. Our corporate headquarters and a portion of our manufacturing operations are located in California, and our principal manufacturing operations and those of most of our key suppliers and contract manufacturers are located in Asia. These areas have been vulnerable to natural disasters, such as earthquakes, floods and fires, and other risks which at times have disrupted the local economy and posed physical risks to our property. We are also dependent on communications links with our overseas manufacturing locations and would be significantly harmed if these links were interrupted for any significant length of time. We presently do not have adequate redundant, multiple site capacity if any of these events were to occur, nor can we be certain that the insurance we maintain against these events would be adequate.
The conversion of our outstanding convertible notes would result in substantial dilution to our current stockholders.
As of April 29, 2018, we had outstanding an aggregate principal amount of $258.8 million of our 2033 Notes and an aggregate principal amount of $575.0 million of our 2036 Notes. The 2033 Notes are convertible at the option of the holder, under certain circumstances, into shares of our common stock at an initial conversion price of $30.18 per share, subject to adjustments, and the 2036 Notes are convertible at the option of the holder, under certain circumstances, into shares of our common stock at an initial conversion price of $44.17 per share, subject to adjustments. An aggregate of approximately 8,572,413 and 13,017,885 shares of common stock would be issued upon the conversion of all outstanding 2033 Notes and all outstanding 2036 Notes, respectively, at these conversion prices, which would dilute the voting power and ownership percentage of our existing stockholders. We have previously entered into privately negotiated transactions with certain holders of our convertible notes for the repurchase of notes in exchange for a greater number of shares of our common stock than would have been issued had the principal amount of the notes been converted at the original conversion rate specified in the notes, thus resulting in more dilution. We may enter into similar transactions in the future and, if we do so, there will be additional dilution to the voting power and percentage ownership of our existing stockholders.
Delaware law, our charter documents and our stockholder rights plan contain provisions that could discourage or prevent a potential takeover, even if such a transaction would be beneficial to our stockholders.
Some provisions of our certificate of incorporation and bylaws, as well as provisions of Delaware law, may discourage, delay or prevent a merger or acquisition that a stockholder may consider favorable. These include provisions:
• | authorizing the board of directors to issue additional preferred stock; |
• | prohibiting cumulative voting in the election of directors; |
• | limiting the persons who may call special meetings of stockholders; |
• | prohibiting stockholder actions by written consent; |
• | creating a classified board of directors pursuant to which our directors are elected for staggered three-year terms; |
• | permitting the board of directors to increase the size of the board and to fill vacancies; |
• | requiring a super-majority vote of our stockholders to amend our bylaws and certain provisions of our certificate of incorporation; and |
• | establishing advance notice requirements for nominations for election to the board of directors or for proposing matters that can be acted on by stockholders at stockholder meetings. |
We are subject to the provisions of Section 203 of the Delaware General Corporation Law which limit the right of a corporation to engage in a business combination with a holder of 15% or more of the corporation's outstanding voting securities, or certain affiliated persons.
Although we believe that these charter and bylaw provisions and provisions of Delaware law provide an opportunity for the board to assure that our stockholders realize full value for their investment, they could have the effect of delaying or preventing a change of control, even under circumstances that some stockholders may consider beneficial.
We do not currently intend to pay dividends on Finisar common stock and, consequently, a stockholder's ability to achieve a return on such stockholder's investment will depend on appreciation in the price of the common stock.
We have never declared or paid any cash dividends on Finisar common stock and we do not currently intend to do so for the foreseeable future. We currently intend to invest our future earnings, if any, to fund our growth. Therefore, a stockholder is not likely to receive any dividends on such stockholder's common stock for the foreseeable future.
Our stock price has been and is likely to continue to be volatile.
20
The trading price of our common stock has been and is likely to continue to be subject to large fluctuations. Our stock price may increase or decrease in response to a number of events and factors, including:
• | trends in our industry and the markets in which we operate; |
• | changes in the market price of the products we sell; |
• | changes in financial estimates and recommendations by securities analysts; |
• | acquisitions and financings; |
• | quarterly variations in our operating results; |
• | the operating and stock price performance of other companies that investors in our common stock may deem comparable; and |
• | purchases or sales of blocks of our common stock. |
Part of this volatility is attributable to the current state of the stock market, in which wide price swings are common. This volatility may adversely affect the prices of our common stock, regardless of our operating performance. If any of the foregoing occurs, our stock price could fall and we may be exposed to class action lawsuits that, even if unsuccessful, could be costly to defend and a distraction to management.
Our business and operations would be adversely impacted in the event of a failure of our information technology infrastructure.
We rely upon the capacity, reliability and security of our information technology infrastructure and our ability to expand and continually update this infrastructure in response to our changing needs. In some cases, we may rely upon third-party hosting and support services to meet these needs. Any failure to manage, expand and update our information technology infrastructure, including our Enterprise Resource Planning ("ERP") system and other applications, any failure in the extension or operation of this infrastructure, or any failure by our hosting and support partners in the performance of their services could materially and adversely harm our business. Despite our implementation of security measures, our systems are vulnerable to damage from computer viruses, natural disasters, unauthorized access and other similar disruptions. Any system failure, accident or security breach could result in disruptions to our operations. To the extent that any disruption or security breach results in a loss or damage to our data or in inappropriate disclosure of confidential information, it could cause significant damage to our reputation, affect our relationships with our customers, and ultimately harm our business. In addition, we may be required to incur significant costs to protect against or mitigate damage caused by these disruptions or security breaches in the future.
Item 1B. | Unresolved Staff Comments |
None.
21
Item 2. Properties
Our principal facilities are located in California, Pennsylvania, Texas, Malaysia, and China.
Information regarding our properties as of April 29, 2018 is as follows:
Location | Use | Size |
(Square Feet) | ||
Owned | ||
Wuxi, China | Manufacturing operations | 800,000 |
Sherman, Texas | Wafer fabrication operations and administrative operations | 700,000 |
Ipoh, Malaysia | Manufacturing operations | 640,000 |
Shenzhen, China | Administrative operations | 50,000 |
Daejeon, Korea | Research and development | 12,800 |
Leased | ||
Shanghai, China | Research and development, general and administrative, and limited manufacturing operations | 180,000 |
Allen, Texas | Wafer fabrication operations. A portion of this facility is currently subleased. | 160,000 |
Sydney, Australia | Manufacturing, research and development and administrative operations | 100,000 |
Fremont, California | Research and development and manufacturing operations | 121,000 |
Sunnyvale, California | Corporate headquarters, research and development, sales and marketing, general and administrative and NPI manufacturing operations | 92,000 |
Horsham, Pennsylvania | NPI manufacturing, research and development, sales and administration | 64,000 |
Jarfalla, Sweden | Wafer fabrication operations and research and development | 63,000 |
Holon, Israel | Research and development | 34,000 |
Berlin, Germany | Research and development and manufacturing operations | 22,000 |
Hyderabad, India | Information technology support center | 22,000 |
Singapore | Research and development | 16,000 |
Eugene, Oregon | Research and development and manufacturing operations | 9,000 |
San Diego, California | Research and development | 5,000 |
Champaign, Illinois | Research and development | 3,000 |
The owned property in Wuxi, China, consists of 550,000 square feet of land leased for 50 years where we built a 800,000 square foot manufacturing operations facility and an additional 280,000 square feet of land leased for 50 years where we have begun the process of constructing an additional 300,000 square foot manufacturing operations facility expected to be completed in the second half of calendar year 2018. The owned property in Ipoh, Malaysia, consists of 840,000 square feet of land leased for 60 years where our 640,000 square foot manufacturing operations facility is located. The owned property in Daejeon, Korea, includes 4,200 square feet of land owned by our subsidiary, Finisar Daejeon Co. Ltd. We believe our properties are in good condition and are suitable for their present uses. We also believe that our existing facilities, combined with the additional facility being constructed in Wuxi, China, will be adequate to accommodate our needs for the foreseeable future.
Item 3. | Legal Proceedings |
The material set forth in Note 15 of Notes to Consolidated Financial Statements in Item 8 of this Annual Report on Form 10-K is incorporated herein by reference.
Item 4. | Mine Safety Disclosures |
Not applicable.
22
PART II
Item 5. | Market for Registrant’s Common Equity, Related Stockholder Matters and Issuer Purchases of Equity Securities |
Since our initial public offering on November 11, 1999, our common stock has traded on the NASDAQ Stock Market under the symbol “FNSR.” The following table sets forth the range of high and low sales prices of our common stock for the periods indicated:
High | Low | ||
Fiscal 2018 Quarter Ended: | |||
April 29, 2018 | $21.73 | $14.25 | |
January 28, 2018 | $25.41 | $17.20 | |
October 29, 2017 | $27.97 | $20.16 | |
July 30, 2017 | $28.99 | $22.31 | |
Fiscal 2017 Quarter Ended: | |||
April 30, 2017 | $36.41 | $21.53 | |
January 29, 2017 | $36.85 | $27.13 | |
October 30, 2016 | $31.42 | $18.00 | |
July 31, 2016 | $19.53 | $15.21 | |
According to records of our transfer agent, we had 191 stockholders of record as of June 8, 2018 and we believe there is a substantially greater number of beneficial holders. We have never declared or paid dividends on our common stock and currently do not intend to pay dividends in the foreseeable future so that we may reinvest our earnings in the development of our business. The payment of dividends in the future will be at the discretion of the Board of Directors.
23
COMPARISON OF STOCKHOLDER RETURN
Set forth below is a line graph comparing the yearly percentage change in the cumulative total return on our common stock with the cumulative total returns of the Nasdaq Stock Market (U.S. Companies) and the NYSE Arca Networking Index for the period commencing on April 29, 2013 and ending on April 29, 2018, assuming the reinvestment of dividends, if any.
The graph and table below assume that on April 29, 2013, $100.00 was invested in our common stock (at the market price of our stock on such date) and each index. No cash dividends have been declared on our common stock. Stockholder returns over the indicated period should not be considered indicative of future stockholder returns.
COMPARISON OF CUMULATIVE TOTAL RETURN FROM
APRIL 28, 2013 THROUGH APRIL 29, 2018 FOR
FINISAR, NASDAQ STOCK MARKET AND NYSE ARCA NETWORKING INDEX
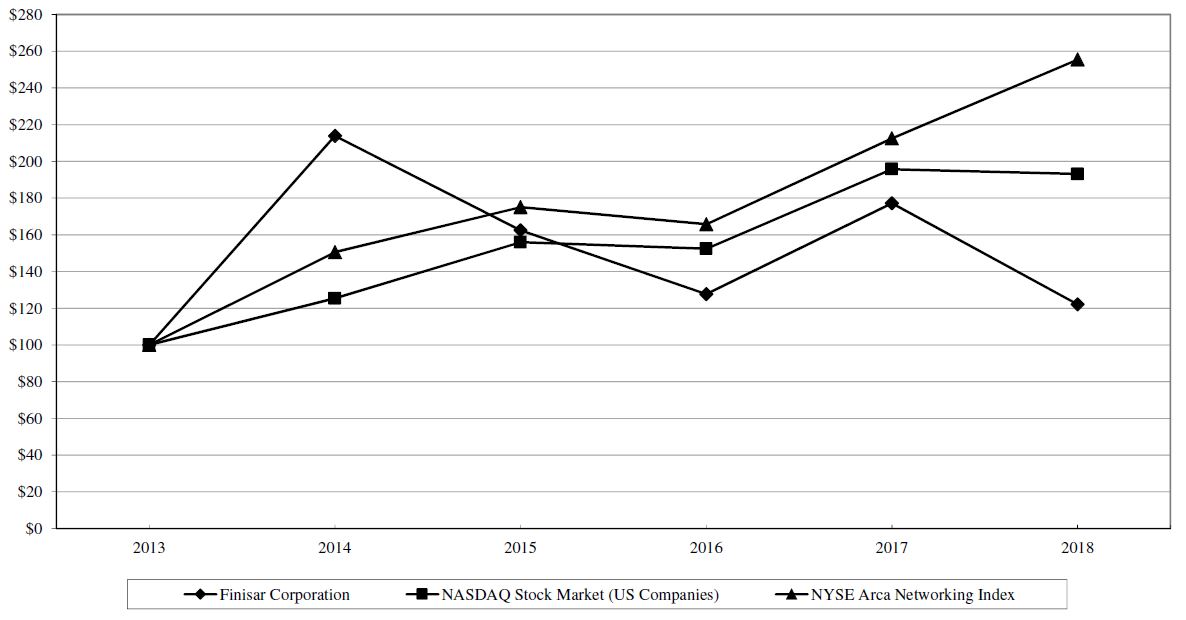
2013 | 2014 | 2015 | 2016 | 2017 | 2018 | ||||||
Finisar Corporation | 113.89 | % | (24.05 | )% | (21.39 | )% | 38.76 | % | (31.09 | )% | |
$100.00 | $213.89 | $162.45 | $127.70 | $177.19 | $122.11 | ||||||
NASDAQ Stock Market (U.S. Companies) | 25.35 | % | 24.42 | % | (2.27 | )% | 28.43 | % | (1.35 | )% | |
$100.00 | $125.35 | $155.95 | $152.41 | $195.73 | $193.09 | ||||||
NYSE Arca Networking Index | 50.55 | % | 16.25 | % | (5.35 | )% | 28.28 | % | 20.19 | % | |
$100.00 | $150.55 | $175.02 | $165.66 | $212.51 | $255.41 | ||||||
24
Item 6. | Selected Financial Data |
You should read the following selected financial data in conjunction with “Item 7. Management’s Discussion and Analysis of Financial Condition and Results of Operation” and our consolidated financial statements and the notes thereto included elsewhere in this report. The statement of operations data set forth below for the fiscal years ended April 29, 2018, April 30, 2017 and May 1, 2016 and the balance sheet data as of April 29, 2018 and April 30, 2017 are derived from, and are qualified by reference to, our audited consolidated financial statements included elsewhere in this report. The statement of operations data set forth below for the fiscal years ended May 3, 2015 and April 27, 2014 and the balance sheet data as of May 1, 2016, May 3, 2015 and April 27, 2014 are derived from our audited consolidated financial statements not included in this report.
Fiscal Years Ended | |||||||||
April 29, 2018 | April 30, 2017 | May 1, 2016 | May 3, 2015 | April 27, 2014 | |||||
(In thousands, except per share data) | |||||||||
Statement of Operations Data: | |||||||||
Revenues | $1,316,483 | $1,449,303 | $1,263,166 | $1,250,944 | $1,156,833 | ||||
Consolidated net income (loss) | $(48,286) | $249,346 | $35,193 | $11,887 | $111,537 | ||||
Net income (loss) per share attributable to Finisar Corporation common stockholders: | |||||||||
Basic | $(0.42) | $2.26 | $0.33 | $0.12 | $1.16 | ||||
Diluted | $(0.42) | $2.19 | $0.32 | $0.11 | $1.09 | ||||
Balance Sheet Data: | |||||||||
Total assets | $2,583,185 | $2,539,882 | $1,645,371 | $1,551,882 | $1,497,546 | ||||
Long-term portion of convertible notes | $488,877 | $707,782 | $229,393 | $221,406 | $252,268 | ||||
25
Item 7. | Management’s Discussion and Analysis of Financial Condition and Results of Operation |
Management’s discussion and analysis of financial condition and results of operation, or MD&A, is provided as a supplement to the accompanying consolidated financial statements and footnotes to help provide an understanding of our financial condition, changes in our financial condition and results of operations. The MD&A is organized as follows:
• | Forward-looking statements. This section discusses how forward-looking statements made by us in the MD&A and elsewhere in this report are based on management’s present expectations about future events and are inherently susceptible to uncertainty and changes in circumstances. |
• | Business Overview. This section provides an introductory overview and context for the discussion and analysis that follows in MD&A. |
• | Critical Accounting Estimates. This section discusses those accounting estimates that are both considered to have significant impact on our financial condition and operating results and require significant judgment on the part of management regarding matters that are inherently uncertain. |
• | Results of Operations. This section provides analysis of the Company’s results of operations for the three fiscal years period ended April 29, 2018. A brief description is provided of transactions and events that impact comparability of the results being analyzed. |
• | Financial Condition and Liquidity. This section provides an analysis of our cash position and cash flows, as well as a discussion of our financing arrangements and financial commitments. |
Forward Looking Statements
The following discussion contains forward-looking statements that involve risks and uncertainties. Our actual results could differ substantially from those anticipated in these forward-looking statements as a result of many factors, including those set forth under “Item 1A. Risk Factors.” The following discussion should be read together with our consolidated financial statements and related notes thereto included elsewhere in this report.
Business Overview
We are a global technology leader in optical communications, providing components and subsystems to networking equipment manufacturers, data center operators, telecom service providers, consumer electronics and automotive companies. We design products that meet the increasing demands for network bandwidth, data storage and 3D sensing subsystems. Our optical subsystems consist primarily of transmitters, receivers, transceivers, transponders and active optical cables, which provide the fundamental optical-electrical, or optoelectronic interface for interconnecting the electronic equipment used in these networks, including the switches, routers, and servers used in wireline networks as well as the antennas and base stations used in wireless networks. These products rely on the use of semiconductor lasers and photodetectors in conjunction with integrated circuits and novel optoelectronic packaging to provide a cost-effective means for transmitting and receiving digital signals over fiber optic cable at speeds ranging from less than 1 gigabit per second, or Gbps, to more than 400 Gbps, over distances of less than 10 meters to more than 2,000 kilometers, using a wide range of network protocols and physical configurations.
We also provide products known as wavelength selective switches, or WSS. In long-haul and metro networks, each fiber may carry 50 to more than 100 different high-speed optical wavelengths. WSS are switches that are used to dynamically switch network traffic from one optical fiber to multiple other fibers without first converting to an electronic signal. The wavelength selective feature means that WSS enable any wavelength or combination of wavelengths to be switched from the input fiber to the output fibers. WSS products are sometimes combined with other components and sold as linecards that plug into a system chassis referred to as a reconfigurable optical add/drop multiplexers, or ROADM.
Finally, we have entered the high-growth 3D Sensing market. 3D Sensing enables features such as facial recognition, gaming and virtual reality. In addition, there are applications in the automotive market such as LiDAR and in-cabin recognition. Today, VCSELs (Vertical Cavity Surface Emitting Lasers) are core to 3D Sensing and we are able to leverage multiple years of experience in technology in these emerging applications. We both design and manufacture these lasers and continue to expand our capacity in order to meet demand.
26
Our line of optical components also includes packaged lasers and photodetectors for data communication and telecommunication applications.
Demand for our products is largely driven by the continually growing need for additional network bandwidth created by the ongoing proliferation of data and video traffic from video downloads, Internet protocol TV, social networking, on-line gaming, file sharing, enterprise IP/Internet traffic, cloud computing, and data center virtualization that must be handled by both wireline and wireless networks. Mobile traffic is increasing as the result of proliferation of smartphones, tablet computers, and other mobile devices.
Our manufacturing operations are vertically integrated and we produce many of the key components used in making our products, including lasers, photodetectors and integrated circuits, or ICs, designed by our internal IC engineering teams. We also have internal assembly and test capabilities that make use of internally designed equipment for the automated testing of our optical subsystems and components.
We sell our products primarily to manufacturers of storage systems, networking equipment and telecommunication equipment such as Broadcom, Ciena, Cisco Systems, Dell EMC, Ericsson, FiberHome, Fujitsu, Hewlett Packard Enterprise, Huawei, IBM, Juniper, Nokia, QLogic, and ZTE, and to their contract manufacturers. These customers, in turn, sell their systems to businesses and to wireline and wireless telecommunication service providers and cable TV operators, collectively referred to as carriers. We also sell products to end-users.
Our cost of revenues consists of materials, salaries and related expenses for manufacturing personnel, manufacturing overhead, warranty expense, inventory adjustments for obsolete and excess inventory and the amortization of acquired developed technology associated with acquisitions that we have made. As a result of building a vertically integrated business model, our manufacturing cost structure has become more fixed. While this can be beneficial during periods when demand is strong, it can be more difficult to reduce costs during periods when demand for our products is weak, product mix is unfavorable or selling prices are generally lower. While we have undertaken measures to reduce our operating costs, there can be no assurance that we will be able to reduce our cost of revenues sufficiently to achieve or sustain profitability.
Since October 2000, we have completed the acquisition of two publicly-held companies. We have also completed the acquisition of 13 privately-held companies and certain businesses and assets from seven other companies in order to broaden our product offerings and provide new sources of revenue, production capabilities and access to advanced technologies that we believe will enable us to reduce our product costs and develop innovative and more highly integrated product platforms while accelerating the timeframe required to develop such products.
Critical Accounting Estimates
The preparation of our financial statements and related disclosures require that we make estimates, assumptions and judgments that can have a significant impact on our revenue and operating results, as well as on the value of certain assets and contingent liabilities on our balance sheet. The methods, assumptions, and estimates that we use in applying our accounting policies may require us to apply judgments regarding matters that are inherently uncertain. We consider an accounting policy to be a critical estimate if: (1) we must make assumptions that were uncertain when the judgment was made, and (2) changes in the estimate assumptions, or selection of a different estimate methodology could have a significant impact on our financial position and the results that we report in our consolidated financial statements. While we believe that our estimates, assumptions, and judgments are reasonable, they are based on information available when the estimate was made.
Refer to "Part II, Item 8, Financial Statements and Supplementary Data - Note 2. Summary of Significant Accounting Policies." for further information on our critical accounting policies, and estimates, which are as follows:
• | Inventories - estimation of future demand for inventory on hand; |
• | Property, equipment and improvements - the useful life determination; |
• | Long-lived assets - estimation of projected cash flows associated with impaired long-lived assets; |
• | Income taxes - the identification and measurement of deferred tax assets and liabilities and the provisional estimates associated with the Tax Cuts and Jobs Act. |
Recent Accounting Pronouncements
For a description of recently issued accounting pronouncements, including the expected dates of adoption and estimated effects, if any, on our consolidated financial statements, see "Part II, Item 8, Financial Statements and Supplementary Data - Note 2. Summary of Significant Accounting Policies."
27
Results of Operations
Comparison of Fiscal Years Ended April 29, 2018 and April 30, 2017
Revenues
The following table sets forth the changes in revenues by market application:
Fiscal Years Ended | ||||||||||||||
(in thousands, except percentages) | April 29, 2018 | April 30, 2017 | Change | % Change | ||||||||||
Datacom revenue | $ | 1,029,037 | $ | 1,041,854 | $ | (12,817 | ) | (1 | )% | |||||
Telecom revenue | 287,446 | 407,449 | (120,003 | ) | (29 | )% | ||||||||
Total revenues | $ | 1,316,483 | $ | 1,449,303 | $ | (132,820 | ) | (9 | )% | |||||
Datacom revenue for the year ended April 29, 2018 decreased approximately $12.8 million compared to the year ended April 30, 2017. During the period, 100 Gbps datacom transceiver revenue increased approximately $100.0 million offset by an approximately $103.1 million decline in 10 and 40 Gbps datacom transceiver revenue. We believe that datacom revenue declined during the most recent year due to lower demand for our datacom products from our Chinese OEM customers.
Telecom revenue for the year ended April 29, 2018 decreased approximately $120.0 million compared to the year ended April 30, 2017. During the period, 10 Gbps telecom transceiver revenue declined approximately $24.3 million, 100 Gbps telecom transceiver revenue declined approximately $46.0 million, and ROADM line card revenue declined approximately $21.5 million. We believe that telecom revenue declined during the most recent year due to lower demand for our telecom products from our Chinese OEM customers.
Amortization of Acquired Developed Technology | ||||||||||||||
Fiscal Years Ended | ||||||||||||||
(in thousands, except percentage) | April 29, 2018 | April 30, 2017 | Change | % Change | ||||||||||
Amortization of acquired developed technology | $ | 2,436 | $ | 4,492 | $ | (2,056 | ) | (46 | )% | |||||
Amortization of acquired developed technology for the year ended April 29, 2018 decreased compared to the year ended April 30, 2017 due to the roll-off of amortization of certain intangible assets related to our prior acquisitions.
Gross Profit | ||||||||||||||
Fiscal Years Ended | ||||||||||||||
(in thousands, except percentages) | April 29, 2018 | April 30, 2017 | Change | % Change | ||||||||||
Gross profit | $ | 362,166 | $ | 503,647 | $ | (141,481 | ) | (28 | )% | |||||
As a percentage of revenues | 28 | % | 35 | % | ||||||||||
Gross profit is calculated as revenues less cost of revenues, amortization of acquired developed technology, and, if applicable, impairment of long-lived assets. The gross profit decline for the year ended April 29, 2018 compared to the year ended April 30, 2017 was attributable to the combination of overall lower revenue and the decline in gross margin.
Gross margin is gross profit reflected as a percentage of revenues. Our cost of revenues consists of materials, salaries and related expenses for manufacturing personnel, manufacturing overhead, warranty expense, and inventory adjustments for excess and obsolete inventory. Gross margin for the year ended April 29, 2018 decreased compared to the year ended April 30, 2017 mostly due to decreases in the average selling prices for our products. In addition, gross margin percentage declined approximately 500 basis points due to the negative impact of fixed manufacturing costs relative to lower revenue in the current year and approximately 200 basis points due to increased charges for excess and obsolete inventory.
Our industry is characterized by products with average selling prices that decrease over time and we expect this trend to continue. Future decreases in average selling prices may have an unfavorable impact on our future gross profit, which may be partially or fully offset in any period in the event that we are successful in increasing the number of units sold and/or increasing the sales of products with higher gross margins. Future decreases in average selling prices also may have an unfavorable impact on our future gross margin, which may be partially or fully offset in any period in the event that we are successful in decreasing the cost of manufacturing our products being sold and/or increasing the sales of products with higher gross margins.
28
Research and Development Expenses | ||||||||||||||
Fiscal Years Ended | ||||||||||||||
(in thousands, except percentage) | April 29, 2018 | April 30, 2017 | Change | % Change | ||||||||||
Research and development expenses | $ | 239,008 | $ | 217,914 | $ | 21,094 | 10 | % | ||||||
Research and development expenses consist primarily of salaries and related costs of employees engaged in research and design activities, including stock-based compensation charges related to those employees, costs of design tools and computer hardware, costs related to prototyping, and allocated facilities and IT support costs. Research and development expenses for the year ended April 29, 2018 increased compared to the year ended April 30, 2017 due to an increase in employee compensation related expenses.
Sales and Marketing Expenses | ||||||||||||||
Fiscal Years Ended | ||||||||||||||
(in thousands, except percentage) | April 29, 2018 | April 30, 2017 | Change | % Change | ||||||||||
Sales and marketing expenses | $ | 49,024 | $ | 50,644 | $ | (1,620 | ) | (3 | )% | |||||
Sales and marketing expenses consist primarily of salaries and related costs of employees engaged in sales and marketing functions, including stock-based compensation charges related to those employees, commissions for our external sales representatives, costs related to marketing and promotional activities, and allocated facilities and IT support costs. Sales and marketing expenses for the year ended April 29, 2018 decreased compared to the year ended April 30, 2017 due to decrease in commissions for our external sales representatives resulting from lower revenue levels.
General and Administrative Expenses | ||||||||||||||
Fiscal Years Ended | ||||||||||||||
(in thousands, except percentage) | April 29, 2018 | April 30, 2017 | Change | % Change | ||||||||||
General and administrative expenses | $ | 59,518 | $ | 55,442 | $ | 4,076 | 7 | % | ||||||
General and administrative expenses consist primarily of salaries and related costs of employees engaged in general and administrative functions, including stock-based compensation charges related to those employees, legal, audit and other professional fees, insurance costs, human resources and other corporate costs, and allocated facilities and IT support costs. General and administrative expenses for the year ended April 29, 2018 increased compared to the year ended April 30, 2017 primarily due to approximately $7.5 million of stock based compensation expense related to the modification of equity awards for our former Chief Executive Officer upon his retirement during the third quarter of fiscal 2018 partially offset by lower legal service fees related to on-going litigation in fiscal 2018.
Start-Up Costs | ||||||||||||||
Fiscal Years Ended | ||||||||||||||
(in thousands, except percentage) | April 29, 2018 | April 30, 2017 | Change | % Change | ||||||||||
Start-up costs | $ | 3,535 | $ | — | $ | 3,535 | 100 | % | ||||||
Start-up costs consist of operating expenses, including employee compensation, facility maintenance and other expenses, related to our recently purchased 700,000 square foot manufacturing facility in Sherman, Texas during the period while it is being brought to its intended use.
Impairment of Long-lived Assets | ||||||||||||||
Fiscal Years Ended | ||||||||||||||
(in thousands, except percentage) | April 29, 2018 | April 30, 2017 | Change | % Change | ||||||||||
Impairment of long-lived assets | $ | 2,233 | $ | — | $ | 2,233 | 100 | % | ||||||
During the fiscal 2018, we recorded a $2.2 million charge for the impairment of certain long-lived assets due to the projected cash flows associated with these assets not supporting the carrying values of these assets.
29
Interest Income | ||||||||||||||
Fiscal Years Ended | ||||||||||||||
(in thousands, except percentage) | April 29, 2018 | April 30, 2017 | Change | % Change | ||||||||||
Interest income | $ | 16,084 | $ | 6,763 | $ | 9,321 | 138 | % | ||||||
Interest income for the year ended April 29, 2018 increased compared to the year ended April 30, 2017 due to higher balances of cash and short-term investments primarily as a result of the issuance of $575.0 million in aggregate principal amount of our 0.50% Convertible Senior Notes due 2036 in December 2016.
Interest Expense | ||||||||||||||
Fiscal Years Ended | ||||||||||||||
(in thousands, except percentage) | April 29, 2018 | April 30, 2017 | Change | % Change | ||||||||||
Interest expense | $ | 36,656 | $ | 20,363 | $ | 16,293 | 80 | % | ||||||
Interest expense for the year ended April 29, 2018 increased compared to the year ended April 30, 2017 due to the amortization of the discount on our 0.50% Convertible Senior Notes due 2036 issued in December 2016.
Other Income (Expense), Net | ||||||||||||||
Fiscal Years Ended | ||||||||||||||
(in thousands, except percentage) | April 29, 2018 | April 30, 2017 | Change | % Change | ||||||||||
Other income (expense), net | $ | (945 | ) | $ | (91 | ) | $ | (854 | ) | 938 | % | |||
The change in other income (expense), net for the year ended April 29, 2018 as compared to the year ended April 30, 2017 was due to a $2.3 million impairment of one of our minority investments, recognized during fiscal 2018 as a result of this investee's negative results of operations and cash flows, partially offset by fluctuations of foreign currency exchange rates.
Provision for (Benefit from) Income Taxes | ||||||||||||||
Fiscal Years Ended | ||||||||||||||
(in thousands, except percentage) | April 29, 2018 | April 30, 2017 | Change | % Change | ||||||||||
Provision for (benefit from) income taxes | $ | 33,283 | $ | (86,152 | ) | $ | 119,435 | (139 | )% | |||||
The provision for income taxes for the year ended April 29, 2018 increased compared to the benefit from income taxes for the year ended April 30, 2017 primarily due to approximately $49.4 million of the deferred tax expense associated with the revaluation of our net deferred tax assets and the inclusion of the one-time deemed repatriation of accumulated foreign earnings, both as the result of the Tax Cuts and Jobs Act, enacted on December 22, 2017, and an approximately $103.3 million release of valuation allowance related to a majority of our U.S. deferred tax assets during the fourth quarter of fiscal 2017, based on sufficient positive objective evidence that we would generate sufficient taxable income in the U.S. to realize the deferred tax assets. The positive evidence as of April 30, 2017 included fiscal 2017 and three year cumulative profitability driven by strong demand of certain new generation products, availability of resources to expand manufacturing capacity, and forecasted U.S. operating profits in the future periods. Realization of our deferred tax assets is primarily dependent upon future taxable income in related tax jurisdictions. If our assumptions and consequently our estimates change in the future, the valuation allowances may be increased or decreased, resulting in a respective increase or decrease in income tax expense.
30
Comparison of Fiscal Years Ended April 30, 2017 and May 1, 2016
Revenues
The following table sets forth the changes in revenues by market application:
Fiscal Years Ended | ||||||||||||||
(in thousands, except percentages) | April 30, 2017 | May 1, 2016 | Change | % Change | ||||||||||
Datacom revenue | $ | 1,041,854 | $ | 929,247 | $ | 112,607 | 12 | % | ||||||
Telecom revenue | 407,449 | 333,919 | 73,530 | 22 | % | |||||||||
Total revenues | $ | 1,449,303 | $ | 1,263,166 | $ | 186,137 | 15 | % | ||||||
Datacom revenue for the year ended April 30, 2017 increased compared to the year ended May 1, 2016 primarily due to an increase in market demand for our 100 Gbps transceivers. Telecom revenue for the year ended April 30, 2017 increased compared to the year ended May 1, 2016 primarily due to an increase in market demand for our 100G products.
Amortization of Acquired Developed Technology | ||||||||||||||
Fiscal Years Ended | ||||||||||||||
(in thousands, except percentage) | April 30, 2017 | May 1, 2016 | Change | % Change | ||||||||||
Amortization of acquired developed technology | $ | 4,492 | $ | 6,129 | $ | (1,637 | ) | (27 | )% | |||||
Amortization of acquired developed technology for the year ended April 30, 2017 decreased compared to the year ended May 1, 2016 primarily due to the roll-off of amortization of certain intangible assets related to our prior acquisitions.
Impairment of Long-lived Assets | ||||||||||||||
Fiscal Years Ended | ||||||||||||||
(in thousands, except percentage) | April 30, 2017 | May 1, 2016 | Change | % Change | ||||||||||
Impairment of long-lived assets | $ | — | $ | 1,901 | $ | (1,901 | ) | (100 | )% | |||||
During the first quarter of fiscal 2016, we recorded a $1.9 million charge for the impairment of certain long-lived assets due to the projected cash flows associated with these assets not supporting the carrying values of these assets.
Gross Profit | ||||||||||||||
Fiscal Years Ended | ||||||||||||||
(in thousands, except percentages) | April 30, 2017 | May 1, 2016 | Change | % Change | ||||||||||
Gross profit | $ | 503,647 | $ | 354,650 | $ | 148,997 | 42 | % | ||||||
As a percentage of revenues | 35 | % | 28 | % | ||||||||||
Gross profit is calculated as revenues less cost of revenues, amortization of acquired developed technology, and, if applicable, impairment of long-lived assets. Gross margin is gross profit reflected as a percentage of revenues. Our cost of revenues consists of materials, salaries and related expenses for manufacturing personnel, manufacturing overhead, warranty expense, and inventory adjustments for excess and obsolete inventory. Gross margin for the year ended April 30, 2017 increased compared to the year ended May 1, 2016 primarily due to a more favorable product mix, primarily 100 Gbps transceivers.
Research and Development Expenses | ||||||||||||||
Fiscal Years Ended | ||||||||||||||
(in thousands, except percentage) | April 30, 2017 | May 1, 2016 | Change | % Change | ||||||||||
Research and development expenses | $ | 217,914 | $ | 203,389 | $ | 14,525 | 7 | % | ||||||
Research and development expenses consist primarily of salaries and related costs of employees engaged in research and design activities, including stock-based compensation charges related to those employees, costs of design tools and computer hardware, costs related to prototyping, and allocated facilities and IT support costs. Research and development expenses for the
31
year ended April 30, 2017 increased compared to the year ended May 1, 2016 primarily due to an increase in employee compensation related expenses.
Sales and Marketing Expenses | ||||||||||||||
Fiscal Years Ended | ||||||||||||||
(in thousands, except percentage) | April 30, 2017 | May 1, 2016 | Change | % Change | ||||||||||
Sales and marketing expenses | $ | 50,644 | $ | 46,619 | $ | 4,025 | 9 | % | ||||||
Sales and marketing expenses consist primarily of salaries and related costs of employees engaged in sales and marketing functions, including stock-based compensation charges related to those employees, commissions for our external sales representatives, costs related to marketing and promotional activities, and allocated facilities and IT support costs. Sales and marketing expenses for the year ended April 30, 2017 increased compared to the year ended May 1, 2016 primarily due to an increase in employee compensation related expenses.
General and Administrative Expenses | ||||||||||||||
Fiscal Years Ended | ||||||||||||||
(in thousands, except percentage) | April 30, 2017 | May 1, 2016 | Change | % Change | ||||||||||
General and administrative expenses | $ | 55,442 | $ | 60,117 | $ | (4,675 | ) | (8 | )% | |||||
General and administrative expenses consist primarily of salaries and related costs of employees engaged in general and administrative functions, including stock-based compensation charges related to those employees, legal, audit and other professional fees, insurance costs, human resources and other corporate costs, and allocated facilities and IT support costs. General and administrative expenses for the year ended April 30, 2017 decreased compared to the year ended May 1, 2016 primarily due to higher legal service fees related to on-going litigations in fiscal 2016.
Interest Income | ||||||||||||||
Fiscal Years Ended | ||||||||||||||
(in thousands, except percentage) | April 30, 2017 | May 1, 2016 | Change | % Change | ||||||||||
Interest income | $ | 6,763 | $ | 2,345 | $ | 4,418 | 188 | % | ||||||
Interest income for the year ended April 30, 2017 increased compared to the year ended May 1, 2016 primarily due to an increase in cash and short-term investments balances during fiscal 2017 primarily as a result of issuance of $575.0 million in aggregate principal amount of our 0.50% Convertible Senior Notes due 2036 in December 2016.
Interest Expense | ||||||||||||||
Fiscal Years Ended | ||||||||||||||
(in thousands, except percentage) | April 30, 2017 | May 1, 2016 | Change | % Change | ||||||||||
Interest expense | $ | 20,363 | $ | 11,750 | $ | 8,613 | 73 | % | ||||||
Interest expense for the year ended April 30, 2017 increased compared to the year ended May 1, 2016 primarily due to the amortization of the debt discount on our 0.50% Convertible Senior Notes due 2036 issued in December 2016.
Other Income (Expense), Net | ||||||||||||||
Fiscal Years Ended | ||||||||||||||
(in thousands, except percentage) | April 30, 2017 | May 1, 2016 | Change | % Change | ||||||||||
Other income (expense), net | $ | (91 | ) | $ | 3,213 | $ | (3,304 | ) | (103 | )% | ||||
Other income (expense), net for the year ended April 30, 2017 decreased compared to the year ended May 1, 2016 primarily due to fluctuations of foreign currency exchange rates.
32
Provision for (Benefit from) Income Taxes | ||||||||||||||
Fiscal Years Ended | ||||||||||||||
(in thousands, except percentage) | April 30, 2017 | May 1, 2016 | Change | % Change | ||||||||||
Provision for (benefit from) income taxes | $ | (86,152 | ) | $ | (362 | ) | $ | (85,790 | ) | 23,699 | % | |||
The increase in benefit was primarily due to a release of valuation allowance related to a majority of our U.S. deferred tax assets during the fourth quarter of fiscal 2017, based on sufficient positive objective evidence that we would generate sufficient taxable income in the U.S. to realize the deferred tax assets.
Liquidity and Capital Resources
Fiscal Years Ended | |||||
(in thousands) | April 29, 2018 | April 30, 2017 | May 1, 2016 | ||
Net cash provided by operating activities | $171,637 | $227,832 | $183,600 | ||
Net cash used in investing activities | $(121,107) | $(852,783) | $(88,618) | ||
Net cash provided by financing activities | $1,499 | $585,958 | $6,796 | ||
Cash Flows - Operating Activities
Net cash provided by operating activities in fiscal 2018 primarily consisted of our net loss, as adjusted to exclude depreciation, amortization and other non-cash items totaling $221.6 million.
Net cash provided by operating activities in fiscal 2017 primarily consisted of our net income, as adjusted to exclude depreciation, amortization and other non-cash items totaling $62.2 million, offset by a $83.7 million increase in working capital primarily related to increases in inventory. Inventory increased by $73.6 million due to increased purchases to support the increase in sales level.
Net cash provided by operating activities in fiscal 2016 primarily consisted of our net income, as adjusted to exclude depreciation, amortization and other non-cash items totaling $147.2 million.
Cash Flows - Investing Activities
Net cash used in investing activities in fiscal 2018 primarily consisted of expenditures of $221.5 million for long-lived assets (property, equipment and improvements), and $1,765.7 million related to purchases of short-term marketable securities offset by $1,866.1 million of proceeds from maturities of short-term marketable securities.
Net cash used in investing activities in fiscal 2017 primarily consisted of expenditures of $140.1 million for long-lived assets (property, equipment and improvements), and $1,032.5 million related to purchases of short-term marketable securities offset by $321.2 million of proceeds from maturities of short-term marketable securities.
Net cash used in investing activities in fiscal 2016 primarily consisted of expenditures of $118.8 million for long-lived assets (property, equipment and improvements), and $261.2 million related to purchases of short-term marketable securities offset by $290.5 million of proceeds from maturities of short-term marketable securities.
Cash Flows - Financing Activities
Net cash provided by financing activities in fiscal 2018 primarily consisted of proceeds from the issuance of shares under our employee stock option and stock purchase plans, offset by share repurchases for tax withholdings on vesting of restricted stock units.
Net cash provided by financing activities in fiscal 2017 primarily consisted of $569.3 million of proceeds, net of issuance costs, from the issuance of the 2036 Convertible Senior Notes.
Net cash provided by financing activities in fiscal 2016 primarily consisted of proceeds from the issuance of shares under our employee stock option and stock purchase plans, offset by share repurchases for tax withholdings on vesting of restricted stock units.
33
Contractual Obligations and Commercial Commitments
Our contractual obligations at April 29, 2018 were as follows (in thousands):
Payments Due by Period | |||||||||||||||||||
Less than | After | ||||||||||||||||||
Contractual Obligations | Total | 1 year | 1-3 Years | 4-5 Years | 5 Years | ||||||||||||||
0.5% Convertible Senior Notes due 2033 | $ | 258,750 | $ | 258,750 | $ | — | $ | — | $ | — | |||||||||
0.5% Convertible Senior Notes due 2036 | 575,000 | — | — | 575,000 | — | ||||||||||||||
Interest on 2033 Notes (a) | 809 | 809 | — | — | — | ||||||||||||||
Interest on 2036 Notes (b) | 10,422 | 2,875 | 5,750 | 1,797 | — | ||||||||||||||
Operating leases (c) | 36,883 | 10,691 | 13,433 | 7,022 | 5,737 | ||||||||||||||
Capital purchase obligations | 96,149 | 96,149 | — | — | — | ||||||||||||||
Other purchase obligations | 112,243 | 112,243 | — | — | — | ||||||||||||||
Total contractual obligations | $ | 1,090,256 | $ | 481,517 | $ | 19,183 | $ | 583,819 | $ | 5,737 | |||||||||
_________________
(a) | Includes interest on our 0.50% Convertible Senior Notes due 2033 through December 2018 as we have the right to redeem the notes in whole or in part at any time on or after December 22, 2018. |
(b) | Includes interest on our 0.50% Convertible Senior Notes due 2036 through December 2021 as we have the right to redeem the notes in whole or in part at any time on or after December 22, 2021. |
(c) | Includes operating lease obligations that have been accrued as restructuring charges. |
The 2033 Notes are convertible into shares of our common stock at specified conversion prices by the holders at their option prior to the close of business on the business day immediately preceding June 15, 2033 only under the following circumstances: (1) during any fiscal quarter commencing after the fiscal quarter ending on January 26, 2014 (and only during such fiscal quarter), if the last reported sale price of our common stock for at least 20 trading days (whether or not consecutive) during a period of 30 consecutive trading days ending on the last trading day of the immediately preceding fiscal quarter is greater than or equal to 130% of the applicable conversion price on each applicable trading day; (2) during the five business day period after any five consecutive trading day period ("measurement period"), in which the trading price per $1,000 principal amount of notes for each trading day of the measurement period was less than 98% of the product of the last reported sale price of our common stock and the applicable conversion rate on each such trading day; or (3) upon the occurrence of specified corporate events. On or after June 15, 2033 until the close of business on the second scheduled trading day immediately preceding the maturity date, holders may convert their notes at any time, regardless of whether any of the foregoing circumstances have occurred. The 2033 Notes are also subject to redemption by the holders in December 2018, 2023 and 2028. These notes are redeemable by us, in whole or in part, at any time on or after December 22, 2018.
The 2036 Notes are convertible into shares of our common stock at specified conversion prices by the holders at their option prior to the close of business on the business day immediately preceding June 15, 2036 only under the following circumstances: (1) during any fiscal quarter commencing after the fiscal quarter ending on January 29, 2017 (and only during such fiscal quarter), if the last reported sale price of our common stock for at least 20 trading days (whether or not consecutive) during a period of 30 consecutive trading days ending on the last trading day of the immediately preceding fiscal quarter is greater than or equal to 130% of the applicable conversion price on each applicable trading day; (2) during the five business day period after any five consecutive trading day period ("measurement period"), in which the trading price per $1,000 principal amount of notes for each trading day of the measurement period was less than 98% of the product of the last reported sale price of our common stock and the applicable conversion rate on each such trading day; or (3) upon the occurrence of specified corporate events. On or after June 15, 2036 until the close of business on the second scheduled trading day immediately preceding the maturity date, holders may convert their notes at any time, regardless of whether any of the foregoing circumstances have occurred. The 2036 Notes are also subject to redemption by the holders in December 2021, 2026 and 2031. These notes are redeemable by us, in whole or in part, at any time on or after December 22, 2021.
Operating lease obligations consist primarily of base rents for facilities we occupy at various locations.
Capital purchase obligations represent commitments for the construction or purchase of property, equipment and improvements. These capital purchase obligations were not recorded as liabilities on our consolidated balance sheets as of April 29, 2018, as we had not yet received the related goods or taken title to the property.
Other purchase obligations represent all open purchase orders and contractual obligations in the ordinary course of business for which we have not received the goods or services. Although open purchase orders are considered enforceable and legally binding, their terms generally allow us the option to cancel, reschedule and adjust our requirements based on our business needs prior to the delivery of goods or performance of services.
34
Sources of Liquidity and Capital Resource Requirements
At April 29, 2018, our principal sources of liquidity consisted of approximately $1.2 billion of cash and cash equivalents and short-term investments, of which approximately $157 million was held by our foreign subsidiaries.
We believe that our existing balances of cash, cash equivalents and short-term investments, together with the cash expected to be generated from future operations, will be sufficient to meet our cash needs for working capital and capital expenditures for at least the next 12 months. We may, however, require additional financing to fund our operations in the future, to finance future acquisitions that we may propose to undertake or to repay or otherwise retire all of our outstanding 2033 Notes, in the aggregate principal amount of $258.8 million, which are subject to redemption by the holders in December 2018, 2023 and 2028, or our 2036 Notes, in the aggregate principal amount of $575.0 million, which are subject to redemption by the holders in December 2021, 2026 and 2031. A significant contraction in the capital markets, particularly in the technology sector, may make it difficult for us to raise additional capital if and when it is required, especially if we experience disappointing operating results. If adequate capital is not available to us as required, or is not available on favorable terms, our business, financial condition and results of operations will be adversely affected.
Off-Balance-Sheet Arrangements
At April 29, 2018 and April 30, 2017, we did not have any off-balance sheet arrangements or relationships with unconsolidated entities or financial partnerships, such as entities often referred to as structured finance or special purpose entities, which are typically established for the purpose of facilitating off-balance sheet arrangements or other contractually narrow or limited purposes.
Item 7A. | Quantitative and Qualitative Disclosures About Market Risk |
As of April 29, 2018, we had $833.8 million of aggregate principal amount of convertible notes with a fixed interest rate of 0.5% outstanding. The fair value of this debt as of April 29, 2018 was approximately $776.0 million, based on the market price of the notes in the open market as of or close to April 29, 2018. The difference between the carrying value and the fair value is primarily due to the spread between the conversion price and the market value of the shares underlying the convertible notes. We are subject to significant fluctuations in fair market value of the debt due to the volatility of the stock market. We had no variable interest rate debt outstanding which would expose us to interest rate risk.
We invest in equity instruments of privately-held companies for business and strategic purposes. These investments are included in other long-term assets and are accounted for under the cost method when our ownership interest is less than 20% and we do not have the ability to exercise significant influence. At April 29, 2018, we had a total of $604,000 of investments in three privately-held companies accounted for under the cost method and one privately-held company accounted for under the equity method. For such non-quoted investments, our policy is to regularly review the assumptions underlying the operating performance and cash flow forecasts in assessing the carrying values. We identify and record impairment losses when events and circumstances indicate that such assets are impaired. During the first quarter of fiscal 2018, we recorded a $2.3 million impairment loss related to our equity method minority investment as a result of this investee's negative results of operations and cash flows. During the third quarter of fiscal 2017, we recorded a $643,000 impairment loss related to one of our cost method minority investments as a result of an equity transaction by the investee at a price per share lower than the value at which the investment was carried by us. No such impairment was recorded in fiscal 2016. If our investment in a privately-held company becomes readily marketable upon the company’s completion of an initial public offering or its acquisition by another company, our investment would be subject to significant fluctuations in fair market value due to the volatility of the stock market.
We have subsidiaries located in China, Malaysia, Israel, Australia, Korea, Sweden, Germany, India and Singapore. Due to the relative volume of transactions through these subsidiaries, we do not believe that we have significant exposure to foreign currency exchange risks. We currently do not use derivative financial instruments to mitigate this exposure. We continue to review this issue and may consider hedging certain foreign exchange risks through the use of currency forwards or options in future years.
35
Item 8. | Financial Statements and Supplementary Data |
FINISAR CORPORATION CONSOLIDATED FINANCIAL STATEMENTS INDEX
36
REPORT OF INDEPENDENT REGISTERED PUBLIC ACCOUNTING FIRM
The Board of Directors and Stockholders
Finisar Corporation
Sunnyvale, California
Opinion on the Consolidated Financial Statements
We have audited the accompanying consolidated balance sheets of Finisar Corporation (the “Company”) as of April 29, 2018 and April 30, 2017, and the related consolidated statements of operations, comprehensive income (loss), stockholders’ equity, and cash flows for each of the three years in the period ended April 29, 2018, and the related notes and financial statement schedule listed in the Index at Item 15(a) (collectively referred to as the “consolidated financial statements”). In our opinion, the consolidated financial statements present fairly, in all material respects, the financial position of the Company at April 29, 2018 and April 30, 2017, and the results of their operations and their cash flows for each of the three years in the period ended April 29, 2018, in conformity with accounting principles generally accepted in the United States of America.
We also have audited, in accordance with the standards of the Public Company Accounting Oversight Board (United States) (“PCAOB”), the Company's internal control over financial reporting as of April 29, 2018, based on criteria established in Internal Control - Integrated Framework (2013) issued by the Committee of Sponsoring Organizations of the Treadway Commission (“COSO”) and our report dated June 15, 2018 expressed an unqualified opinion thereon.
Basis for Opinion
These consolidated financial statements are the responsibility of the Company’s management. Our responsibility is to express an opinion on the Company’s consolidated financial statements based on our audits. We are a public accounting firm registered with the PCAOB and are required to be independent with respect to the Company in accordance with the U.S. federal securities laws and the applicable rules and regulations of the Securities and Exchange Commission and the PCAOB.
We conducted our audits in accordance with the standards of the PCAOB. Those standards require that we plan and perform the audits to obtain reasonable assurance about whether the consolidated financial statements are free of material misstatement, whether due to error or fraud.
Our audits included performing procedures to assess the risks of material misstatement of the consolidated financial statements, whether due to error or fraud, and performing procedures that respond to those risks. Such procedures included examining, on a test basis, evidence regarding the amounts and disclosures in the consolidated financial statements. Our audits also included evaluating the accounting principles used and significant estimates made by management, as well as evaluating the overall presentation of the consolidated financial statements. We believe that our audits provide a reasonable basis for our opinion.
/s/ BDO USA, LLP
We have served as the Company's auditor since 2015.
San Jose, California
June 15, 2018
37
REPORT OF INDEPENDENT REGISTERED PUBLIC ACCOUNTING FIRM
The Board of Directors and Stockholders
Finisar Corporation
Sunnyvale, California
Opinion on Internal Control over Financial Reporting
We have audited Finisar Corporation’s (the “Company’s”) internal control over financial reporting as of April 29, 2018, based on criteria established in Internal Control - Integrated Framework (2013) issued by the Committee of Sponsoring Organizations of the Treadway Commission (the “COSO criteria”). In our opinion, the Company maintained, in all material respects, effective internal control over financial reporting as of April 29, 2018, based on the COSO criteria.
We also have audited, in accordance with the standards of the Public Company Accounting Oversight Board (United States) (“PCAOB”), the consolidated balance sheets of the Company as of April 29, 2018 and April 30, 2017, the related consolidated statements of operations, comprehensive income (loss), stockholder’s equity, and cash flows for the each of the three years in the period ended April 29, 2018, and the related notes and financial statement schedule listed in the Index at Item 15(a), and our report dated June 15, 2018 expressed an unqualified opinion thereon.
Basis for Opinion
The Company’s management is responsible for maintaining effective internal control over financial reporting and for its assessment of the effectiveness of internal control over financial reporting, included in the accompanying “Item 9A, Management’s Report on Internal Control over Financial Reporting”. Our responsibility is to express an opinion on the Company’s internal control over financial reporting based on our audit. We are a public accounting firm registered with the PCAOB and are required to be independent with respect to the Company in accordance with U.S. federal securities laws and the applicable rules and regulations of the Securities and Exchange Commission and the PCAOB.
We conducted our audit of internal control over financial reporting in accordance with the standards of the PCAOB. Those standards require that we plan and perform the audit to obtain reasonable assurance about whether effective internal control over financial reporting was maintained in all material respects. Our audit included obtaining an understanding of internal control over financial reporting, assessing the risk that a material weakness exists, and testing and evaluating the design and operating effectiveness of internal control based on the assessed risk. Our audit also included performing such other procedures as we considered necessary in the circumstances. We believe that our audit provides a reasonable basis for our opinion.
Definition and Limitations of Internal Control over Financial Reporting
A company’s internal control over financial reporting is a process designed to provide reasonable assurance regarding the reliability of financial reporting and the preparation of financial statements for external purposes in accordance with generally accepted accounting principles. A company’s internal control over financial reporting includes those policies and procedures that (1) pertain to the maintenance of records that, in reasonable detail, accurately and fairly reflect the transactions and dispositions of the assets of the company; (2) provide reasonable assurance that transactions are recorded as necessary to permit preparation of financial statements in accordance with generally accepted accounting principles, and that receipts and expenditures of the company are being made only in accordance with authorizations of management and directors of the company; and (3) provide reasonable assurance regarding prevention or timely detection of unauthorized acquisition, use, or disposition of the company’s assets that could have a material effect on the financial statements.
Because of its inherent limitations, internal control over financial reporting may not prevent or detect misstatements. Also, projections of any evaluation of effectiveness to future periods are subject to the risk that controls may become inadequate because of changes in conditions, or that the degree of compliance with the policies or procedures may deteriorate.
/s/ BDO USA, LLP
San Jose, California
June 15, 2018
38
FINISAR CORPORATION
CONSOLIDATED BALANCE SHEETS
April 29, 2018 | April 30, 2017 | ||||||
(In thousands, except per share data) | |||||||
ASSETS | |||||||
Current assets: | |||||||
Cash and cash equivalents | $ | 312,257 | $ | 260,228 | |||
Short-term investments | 884,838 | 976,595 | |||||
Accounts receivable, net of allowance for doubtful accounts of $269 at April 29, 2018 and $756 at April 30, 2017 | 233,529 | 272,377 | |||||
Inventories | 348,527 | 331,388 | |||||
Other current assets | 56,001 | 68,269 | |||||
Total current assets | 1,835,152 | 1,908,857 | |||||
Property, equipment and improvements, net | 520,849 | 383,919 | |||||
Purchased intangible assets, net | 7,878 | 13,019 | |||||
Goodwill | 106,736 | 106,736 | |||||
Other assets | 31,720 | 20,126 | |||||
Deferred tax assets | 80,850 | 107,225 | |||||
Total assets | $ | 2,583,185 | $ | 2,539,882 | |||
LIABILITIES AND STOCKHOLDERS’ EQUITY | |||||||
Current liabilities: | |||||||
Accounts payable | $ | 132,161 | $ | 140,568 | |||
Accrued compensation | 32,525 | 54,520 | |||||
Other current liabilities | 32,824 | 43,698 | |||||
Deferred revenue | 9,535 | 13,015 | |||||
Current portion of convertible debt | 251,278 | — | |||||
Total current liabilities | 458,323 | 251,801 | |||||
Long-term liabilities: | |||||||
Convertible debt, net of current portion | 488,877 | 707,782 | |||||
Other non-current liabilities | 12,368 | 17,594 | |||||
Total liabilities | 959,568 | 977,177 | |||||
Commitments and contingencies | |||||||
Stockholders’ equity: | |||||||
Preferred stock, $0.001 par value, 5,000 shares authorized, no shares issued and outstanding at April 29, 2018 and April 30, 2017 | — | — | |||||
Common stock, $0.001 par value, 750,000 shares authorized, 114,813 shares issued and outstanding at April 29, 2018 and 111,519 shares issued and outstanding at April 30, 2017 | 115 | 112 | |||||
Additional paid-in capital | 2,850,195 | 2,784,204 | |||||
Accumulated other comprehensive loss | (14,660 | ) | (57,864 | ) | |||
Accumulated deficit | (1,212,033 | ) | (1,163,747 | ) | |||
Total stockholders' equity | 1,623,617 | 1,562,705 | |||||
Total liabilities and stockholders’ equity | $ | 2,583,185 | $ | 2,539,882 | |||
See accompanying notes.
39
FINISAR CORPORATION
CONSOLIDATED STATEMENTS OF OPERATIONS
Fiscal Years Ended | |||||||||||
April 29, 2018 | April 30, 2017 | May 1, 2016 | |||||||||
(In thousands, except per share data) | |||||||||||
Revenues | $ | 1,316,483 | $ | 1,449,303 | $ | 1,263,166 | |||||
Cost of revenues | 951,510 | 941,164 | 901,316 | ||||||||
Amortization of acquired developed technology | 2,436 | 4,492 | 6,129 | ||||||||
Impairment of long-lived assets | 371 | — | 1,071 | ||||||||
Gross profit | 362,166 | 503,647 | 354,650 | ||||||||
Operating expenses: | |||||||||||
Research and development | 239,008 | 217,914 | 203,389 | ||||||||
Sales and marketing | 49,024 | 50,644 | 46,619 | ||||||||
General and administrative | 59,518 | 55,442 | 60,117 | ||||||||
Start-up costs | 3,535 | — | — | ||||||||
Amortization of purchased intangibles | 2,705 | 2,762 | 2,672 | ||||||||
Impairment of long-lived assets | 1,862 | — | 830 | ||||||||
Total operating expenses | 355,652 | 326,762 | 313,627 | ||||||||
Income from operations | 6,514 | 176,885 | 41,023 | ||||||||
Interest income | 16,084 | 6,763 | 2,345 | ||||||||
Interest expense | (36,656 | ) | (20,363 | ) | (11,750 | ) | |||||
Other income (expense), net | (945 | ) | (91 | ) | 3,213 | ||||||
Income (loss) before income taxes | (15,003 | ) | 163,194 | 34,831 | |||||||
Provision for (benefit from) income taxes | 33,283 | (86,152 | ) | (362 | ) | ||||||
Net income (loss) | $ | (48,286 | ) | $ | 249,346 | $ | 35,193 | ||||
Net income (loss) per share: | |||||||||||
Basic | $ | (0.42 | ) | $ | 2.26 | $ | 0.33 | ||||
Diluted | $ | (0.42 | ) | $ | 2.19 | $ | 0.32 | ||||
Shares used in computing net income (loss) per share: | |||||||||||
Basic | 113,864 | 110,405 | 106,678 | ||||||||
Diluted | 113,864 | 114,097 | 108,870 | ||||||||
See accompanying notes.
40
FINISAR CORPORATION
CONSOLIDATED STATEMENTS OF COMPREHENSIVE INCOME (LOSS)
Fiscal Years Ended | ||||||||||||
April 29, 2018 | April 30, 2017 | May 1, 2016 | ||||||||||
(In thousands) | ||||||||||||
Net income (loss) | $ | (48,286 | ) | $ | 249,346 | $ | 35,193 | |||||
Other comprehensive income (loss), net of tax: | ||||||||||||
Change in cumulative foreign currency translation adjustment | 43,204 | (32,676 | ) | (26,049 | ) | |||||||
Total other comprehensive income (loss), net of tax | 43,204 | (32,676 | ) | (26,049 | ) | |||||||
Total comprehensive income (loss) | $ | (5,082 | ) | $ | 216,670 | $ | 9,144 | |||||
See accompanying notes.
41
FINISAR CORPORATION
CONSOLIDATED STATEMENTS OF STOCKHOLDERS’ EQUITY
Common Stock | Additional Paid-in Capital | Accumulated Other Comprehensive Income (Loss) | Accumulated Deficit | Total Finisar Stockholders’ Equity | ||||||||||||||||||
Shares | Amount | |||||||||||||||||||||
(In thousands, except share data) | ||||||||||||||||||||||
Balance at May 3, 2015 | 104,131,817 | $ | 104 | $ | 2,551,114 | $ | 861 | $ | (1,448,286 | ) | $ | 1,103,793 | ||||||||||
Net income | — | — | — | — | 35,193 | 35,193 | ||||||||||||||||
Other comprehensive loss, net | — | — | — | (26,049 | ) | — | (26,049 | ) | ||||||||||||||
Issuance of shares pursuant to employee stock purchase plan and equity plans, net of tax withholdings | 3,401,033 | 4 | 7,057 | — | — | 7,061 | ||||||||||||||||
Share-based compensation expense | — | — | 45,243 | — | — | 45,243 | ||||||||||||||||
Employer contribution to defined contribution retirement plan | 163,464 | — | 2,445 | — | — | 2,445 | ||||||||||||||||
Balance at May 1, 2016 | 107,696,314 | 108 | 2,605,859 | (25,188 | ) | (1,413,093 | ) | 1,167,686 | ||||||||||||||
Net income | — | — | — | — | 249,346 | 249,346 | ||||||||||||||||
Other comprehensive loss, net | — | — | — | (32,676 | ) | — | (32,676 | ) | ||||||||||||||
Issuance of shares pursuant to employee stock purchase plan and equity plans, net of tax withholdings | 3,737,832 | 4 | 16,886 | — | — | 16,890 | ||||||||||||||||
Share-based compensation expense | — | — | 49,879 | — | — | 49,879 | ||||||||||||||||
Employer contribution to defined contribution retirement plan | 85,040 | — | 2,782 | — | — | 2,782 | ||||||||||||||||
Equity component of senior convertible notes, net of allocated issuance costs | — | — | 108,798 | — | — | 108,798 | ||||||||||||||||
Balance at April 30, 2017 | 111,519,186 | 112 | 2,784,204 | (57,864 | ) | (1,163,747 | ) | 1,562,705 | ||||||||||||||
Net loss | — | — | — | — | (48,286 | ) | (48,286 | ) | ||||||||||||||
Other comprehensive income, net | — | — | — | 43,204 | — | 43,204 | ||||||||||||||||
Issuance of shares pursuant to employee stock purchase plan and equity plans, net of tax withholdings | 3,146,591 | 3 | 1,496 | — | — | 1,499 | ||||||||||||||||
Share-based compensation expense | — | — | 61,164 | — | — | 61,164 | ||||||||||||||||
Employer contribution to defined contribution retirement plan | 146,944 | — | 3,331 | — | — | 3,331 | ||||||||||||||||
Balance at April 29, 2018 | 114,812,721 | $ | 115 | $ | 2,850,195 | $ | (14,660 | ) | $ | (1,212,033 | ) | $ | 1,623,617 | |||||||||
See accompanying notes.
42
FINISAR CORPORATION
CONSOLIDATED STATEMENTS OF CASH FLOWS
Fiscal Years Ended | |||||||||||
April 29, 2018 | April 30, 2017 | May 1, 2016 | |||||||||
(In thousands) | |||||||||||
Operating activities | |||||||||||
Net income (loss) | $ | (48,286 | ) | $ | 249,346 | $ | 35,193 | ||||
Adjustments to reconcile net income (loss) to net cash provided by operating activities: | |||||||||||
Depreciation | 98,769 | 87,016 | 85,264 | ||||||||
Amortization | 6,680 | 8,203 | 9,416 | ||||||||
Stock-based compensation expense | 63,120 | 52,598 | 47,508 | ||||||||
Amortization of discount on held-to-maturity investments | (8,135 | ) | (2,045 | ) | — | ||||||
Equity in losses (earnings) of equity method investment | — | 250 | (1,200 | ) | |||||||
(Gain) loss on sale or retirement of assets and asset disposal groups | 103 | 149 | (405 | ) | |||||||
Impairment of long-lived assets | 2,233 | — | 1,901 | ||||||||
Impairment of minority investments | 2,347 | 643 | — | ||||||||
Amortization of discount on convertible debt | 30,834 | 16,935 | 9,604 | ||||||||
Deferred tax expense (benefit) | 25,614 | (101,534 | ) | (4,928 | ) | ||||||
Changes in operating assets and liabilities: | |||||||||||
Accounts receivable | 38,848 | (23,120 | ) | (36,023 | ) | ||||||
Inventories | 839 | (73,582 | ) | (4,221 | ) | ||||||
Other assets | (910 | ) | (8,365 | ) | 19,728 | ||||||
Accounts payable | 1,156 | (1,023 | ) | 10,081 | |||||||
Accrued compensation | (21,995 | ) | 18,436 | 11,166 | |||||||
Deferred revenue | (3,480 | ) | (514 | ) | 3,679 | ||||||
Other liabilities | (16,100 | ) | 4,439 | (3,163 | ) | ||||||
Net cash provided by operating activities | 171,637 | 227,832 | 183,600 | ||||||||
Investing activities | |||||||||||
Additions to property, equipment and improvements | (221,482 | ) | (140,106 | ) | (118,825 | ) | |||||
Proceeds from sale of property and equipment and asset disposal groups | — | 504 | 844 | ||||||||
Purchases of short-term investments | (1,765,687 | ) | (1,032,474 | ) | (261,179 | ) | |||||
Maturities of short-term investments | 1,866,062 | 321,178 | 290,542 | ||||||||
Purchase of intangible assets | — | (1,885 | ) | — | |||||||
Net cash used in investing activities | (121,107 | ) | (852,783 | ) | (88,618 | ) | |||||
Financing activities | |||||||||||
Repayments of term loans | — | (234 | ) | (265 | ) | ||||||
Proceeds from issuance of 0.50% Convertible Senior Notes due 2036, net of issuance costs | — | 569,302 | — | ||||||||
Proceeds from issuance of shares under equity plans and employee stock purchase plan | 11,680 | 20,773 | 11,598 | ||||||||
Shares repurchased for tax withholdings on vesting of restricted stock units | (10,181 | ) | (3,883 | ) | (4,537 | ) | |||||
Net cash provided by financing activities | 1,499 | 585,958 | 6,796 | ||||||||
Net increase (decrease) in cash and cash equivalents | 52,029 | (38,993 | ) | 101,778 | |||||||
Cash and cash equivalents at beginning of year | 260,228 | 299,221 | 197,443 | ||||||||
Cash and cash equivalents at end of year | $ | 312,257 | $ | 260,228 | $ | 299,221 | |||||
Supplemental disclosure of cash flow information | |||||||||||
Cash paid for interest | $ | 4,170 | $ | 1,298 | $ | 1,314 | |||||
Cash paid for taxes | $ | 11,594 | $ | 11,108 | $ | 9,590 | |||||
See accompanying notes
43
FINISAR CORPORATION
NOTES TO CONSOLIDATED FINANCIAL STATEMENTS
1. | Basis of Presentation |
The Company has a 52- or 53-week fiscal year ending on the Sunday closest to the last day of April in each calendar year. Each of fiscal 2018, 2017 and 2016 had 52 weeks, and fiscal 2019 will have 52 weeks. The consolidated financial statements include the accounts of Finisar Corporation and its controlled subsidiaries (collectively “Finisar” or the “Company”). Intercompany accounts and transactions have been eliminated in consolidation.
Use of Estimates
The preparation of financial statements in conformity with U.S. generally accepted accounting principles (U.S. GAAP) requires management to make estimates and assumptions that affect the amounts reported in the financial statements and accompanying notes. Actual results could differ from these estimates.
2. | Summary of Significant Accounting Policies |
Revenue Recognition
The Company’s revenue transactions consist predominately of sales of products to customers. Product revenues are generally recognized in the period in which persuasive evidence of an arrangement exists, title and risk of loss have passed to the customer, generally upon shipment, the price is fixed or determinable, and collectability is reasonably assured.
At the time revenue is recognized, the Company establishes an accrual for estimated warranty expenses associated with sales, recorded as a component of cost of revenues. The Company's standard warranty period usually covers 12 months from the date of sale, although it can be for longer periods for certain products. The Company’s customers generally do not have return rights. However, the Company has established an allowance for estimated customer returns, based on historical experience, which is netted against revenue.
Sales to certain distributors are made under agreements providing distributor price adjustments and rights of return under certain circumstances. Revenue and costs relating to sales to distributors with price protection and rights of return are deferred until products are sold by the distributors to end customers. Revenue recognition depends on notification from the distributor that product has been sold to the end customer. Also reported by the distributor are product resale price, quantity and end customer shipment information, as well as inventory on hand. Deferred revenue on shipments to distributors reflects the effects of distributor price adjustments and the amount of gross margin expected to be realized when distributors sell-through products purchased from the Company. Accounts receivable from distributors are recognized and inventory is relieved when title to inventories transfers, typically upon shipment from the Company at which point it has a legally enforceable right to collection under normal payment terms.
Segment Reporting
The Financial Accounting Standards Board's (FASB) authoritative guidance regarding segment reporting establishes standards for the way that public business enterprises report information about operating segments in annual financial statements and requires that those enterprises report selected information about operating segments in interim financial reports. It also establishes standards for related disclosures about products and services, geographic areas and major customers. The Company has determined that it operates in one reportable segment comprising optical subsystems and components. Optical subsystems consist primarily of transceivers sold to manufacturers of storage and networking equipment for data communication and telecommunication applications. Optical subsystems also include multiplexers, de-multiplexers and optical add/drop modules for use in telecommunication applications. Optical components consist primarily of packaged lasers and photo-detectors which are incorporated in transceivers for data communication and telecommunication applications.
Concentrations of Risk
Financial instruments which potentially subject the Company to concentrations of credit risk include cash and cash equivalents, short-term investment and accounts receivable. The Company invests only in high-quality credit instruments and maintains its cash, cash equivalents and short-term investments with several high-quality credit financial institutions. Deposits held with banks, including those held in foreign branches of global banks, may exceed the amount of insurance provided on such deposits.
44
FINISAR CORPORATION
NOTES TO CONSOLIDATED FINANCIAL STATEMENTS — (Continued)
Concentrations of credit risk, with respect to accounts receivable, exist to the extent of amounts presented in the financial statements. Generally, the Company does not require collateral or other security to support customer receivables. The Company performs periodic credit evaluations of its customers and maintains an allowance for potential credit losses based on historical experience and other information available to management. Losses to date have not been material. The Company’s ten largest customers represented 62% and 56% of total accounts receivable as of April 29, 2018 and April 30, 2017, respectively. Two customers, Google and Flextronics, represented 15% and 11% respectively, of total accounts receivable as of April 29, 2018. Two customers, Jabil and Flextronics, represented 12% and 11%, respectively, of total accounts receivable as of April 30, 2017.
Sales to the Company’s ten largest customers represented 59%, 56% and 56% of total revenues during fiscal 2018, 2017 and 2016, respectively. Two customers, Cisco Systems and Google, represented 14% and 11%, respectively, of total revenues during fiscal 2018. Two customers, Cisco Systems and Huawei, represented 12% and 11%, respectively, of total revenues during fiscal 2017. Two customers, Huawei and Cisco Systems, represented 12% and 11%, respectively, of total revenues during fiscal 2016.
The Company relies on single and limited suppliers for a number of key components. The Company relies primarily on a limited number of significant independent contract manufacturers for the production of certain key components and subassemblies, including lasers, modulators, and printed circuit boards.
Included in the Company’s consolidated balance sheet at April 29, 2018 are the net assets of the Company’s operations located at its overseas facilities totaling approximately $689.7 million.
Foreign Currency Translation and Transactions
The functional currency of the Company's foreign subsidiaries is the local currency. Assets and liabilities denominated in foreign currencies are translated using the exchange rate on the balance sheet date. Revenues and expenses are translated using average exchange rates prevailing during the year. Any translation adjustments resulting from this process are shown separately as a component of accumulated other comprehensive income (loss). Foreign currency transaction gains and losses are included in the determination of net income (loss). Included in the determination of net income (loss) for fiscal 2018, 2017 and 2016 were $1.0 million, $539,000 and $(1.2) million, respectively, of gains (losses) on foreign currency transactions.
Research and Development
Research and development expenditures are charged to operations as incurred.
Shipping and Handling Costs
The Company records costs related to shipping and handling in cost of sales for all periods presented.
Cash and Cash Equivalents
Finisar’s cash equivalents consist of money market funds. Finisar considers all highly liquid investments with an original maturity from the date of purchase of three months or less to be cash equivalents.
Minority Investments
The Company uses the cost method of accounting for investments in companies that do not have a readily determinable fair value in which it holds an interest of less than 20% and over which it does not have the ability to exercise significant influence. For entities in which the Company holds an interest of greater than 20% or in which the Company does have the ability to exercise significant influence, the Company uses the equity method. Under the equity method of accounting, investments are stated at initial cost and are adjusted for subsequent additional investments and the Company's proportionate share of earnings or losses and distributions. Such proportionate share of earnings or losses is included in other income (expense), net in the consolidated statement of operations. In determining if and when a decline in the market value of these investments below their carrying value is other-than-temporary, the Company evaluates the market conditions, offering prices, trends of earnings and cash flows, price multiples, prospects for liquidity and other key measures of performance. The Company’s policy is to recognize an impairment in the value of its minority equity investments when clear evidence of an impairment exists. Factors considered in this assessment include (a) the completion of a new equity financing that may indicate a new value for the investment, (b) the failure to complete a new equity financing arrangement after seeking to raise additional funds or (c) the commencement of proceedings under which the assets of the business may be placed in receivership or liquidated to satisfy the claims of debt and equity stakeholders. The Company’s minority investments in private companies are generally made in exchange for preferred stock with a liquidation preference that is intended to help protect the underlying value of its investment.
45
FINISAR CORPORATION
NOTES TO CONSOLIDATED FINANCIAL STATEMENTS — (Continued)
Fair Value Accounting
The FASB authoritative guidance regarding fair valuation defines fair value and establishes a framework for measuring fair value and expands the related disclosure requirements. The guidance requires or permits fair value measurements with certain exclusions. It provides that a fair value measurement assumes that the transaction to sell an asset or transfer a liability occurs in the principal market for the asset or liability or, in the absence of a principal market, the most advantageous market for the asset or liability in an orderly transaction between market participants on the measurement date. The guidance establishes a valuation hierarchy for disclosure of the inputs to valuation used to measure fair value. Valuation techniques used to measure fair value under this guidance must maximize the use of observable inputs and minimize the use of unobservable inputs. It describes a fair value hierarchy based on three levels of inputs, of which the first two are considered observable and the last unobservable, that may be used to measure fair value which are the following:
Level 1 inputs are unadjusted quoted prices in active markets for identical assets or liabilities;
Level 2 inputs are quoted prices for similar assets and liabilities in active markets or inputs that are observable for the asset or liability, either directly or indirectly through market corroboration, for substantially the full term of the financial instrument; and
Level 3 inputs are unobservable inputs based on the Company's own assumptions used to measure assets and liabilities at fair value. A financial asset or liability’s classification within the hierarchy is determined based on the lowest level input that is significant to the fair value measurement.
The Company’s financial instruments, including cash equivalents, accounts receivable, accounts payable and accrued liabilities have carrying amounts which approximate fair value due to the short-term maturity of these instruments. See Note 12 for additional details regarding the fair value of the Company’s financial instruments.
Allowance for Doubtful Accounts
The Company evaluates the collectability of its accounts receivable based on a combination of factors. In circumstances where, subsequent to delivery, the Company becomes aware of a customer’s potential inability to meet its obligations, it records a specific allowance for the doubtful account to reduce the net recognized receivable to the amount the Company reasonably believes will be collected. For all other customers, the Company recognizes an estimated allowance for doubtful accounts based on the length of time the receivables are past due and historical actual bad debt history. A material adverse change in a major customer’s ability to meet its financial obligations to the Company could result in a material reduction in the estimated amount of accounts receivable that can ultimately be collected and an increase in the Company’s general and administrative expenses for the shortfall. Accounts receivable are charged against the allowance for doubtful accounts when identified as fully uncollectable.
Inventories
Inventories are stated at the lower of cost (determined on a first-in, first-out basis) or market.
The Company permanently writes down the cost of inventory that the Company specifically identifies and considers obsolete or excessive to fulfill future sales estimates. The Company defines obsolete inventory as inventory that will no longer be used in the manufacturing process. Excess inventory is generally defined as inventory in excess of projected usage and is determined using management’s best estimate of future demand, based upon information then available to the Company. The Company also considers: (1) parts and subassemblies that can be used in alternative finished products, (2) parts and subassemblies that are unlikely to be engineered out of the Company’s products, and (3) known design changes which would reduce the Company’s ability to use the inventory as planned. Inventory on hand that is identified and considered to be excess or obsolete is written down to its estimated net realizable value.
Property, Equipment and Improvements
Property, equipment and improvements are stated at cost, net of accumulated depreciation and amortization. Property, equipment and improvements are depreciated on a straight-line basis over the estimated useful lives of the assets, generally three to ten years, except for buildings which are depreciated over 30 years. Land is carried at acquisition cost and not depreciated. Leased land is depreciated over the life of the lease. Management judgment is required in determining the estimated economic useful lives of our property, plant and equipment, which can materially impact the Company's depreciation expense. Accordingly, the Company evaluated the period over which it expects to recover the economic value of these assets. During the fourth quarter of fiscal 2018, based on considerations including asset replacement cycle, the Company revisited the useful life estimates of certain computer equipment, software, and building and leasehold fixtures. As a result, the Company
46
FINISAR CORPORATION
NOTES TO CONSOLIDATED FINANCIAL STATEMENTS — (Continued)
determined that the useful lives of computer equipment be extended from three to five years, the useful lives of certain software be extended from five to ten years, the useful lives of leasehold improvements be extended from seven to ten years, and the useful lives of certain building fixtures be extended from 15 to 30 years. These assets are depreciated through cost of revenues and operating expenses. The Company accounted for this as a change in estimate that was applied prospectively, effective as of January 29, 2018. This change in depreciable lives did not have a material impact for the quarter or the year ended April 29, 2018, and will result in a reduction of $4.6 million and $2.6 million in depreciation expense during the fiscal 2019 and 2020, respectively.
Goodwill and Other Intangible Assets
Goodwill, purchased technology and other intangible assets resulting from acquisitions are accounted for under the acquisition method. Intangible assets with finite lives are amortized over their estimated useful lives. Amortization of purchased technology and other intangibles has been recorded on a straight-line basis over periods ranging from three to 15 years.
Accounting for the Impairment of Long-Lived Assets
The Company periodically evaluates whether changes have occurred to long-lived assets that would require revision of the remaining estimated useful life of the property, improvements and finite-lived intangible assets or render them not recoverable. If such circumstances arise, the Company uses an estimate of the undiscounted value of expected future operating cash flows to determine whether the long-lived assets are impaired. If the aggregate undiscounted cash flows are less than the carrying amount of the assets, the resulting impairment charge to be recorded is calculated based on the excess of the carrying value of the assets over the fair value of such assets, with the fair value determined based on an estimate of discounted future cash flows. Goodwill is assessed for impairment annually or more frequently when an event occurs or circumstances change between annual impairment tests that would more likely than not reduce the fair value of the reporting unit holding the goodwill below its carrying value.
During fiscal 2018 and 2016, the Company recorded charges of $2.2 million and $1.9 million, respectively, for the impairment of certain long-lived assets due to the projected cash flows associated with these assets not supporting the carrying values of these assets. In accordance with the guidance for the impairment of long-lived assets, these assets were written down to their estimated fair value of zero, which was determined based on an income approach using the discounted cash flow method.
Stock-Based Compensation Expense
The Company measures and recognizes compensation expense for all stock-based payment awards made to employees and directors including restricted stock units, stock options, and employee stock purchases under the Company’s Employee Stock Purchase Plan based on estimated fair values. The Company uses the grant-date fair value of its common stock to determine the fair value of restricted stock units. The Company uses the Black-Scholes option pricing model to determine the fair value of stock options and employee stock purchase rights. The fair value of the awards is recognized as expense in the consolidated statements of operations under the single-option approach on a straight-line basis over the requisite service periods, which is generally the vesting period. Forfeitures are accounted for as they occur rather than estimating the number of awards that are expected to ultimately vest.
Income Taxes
The Company computes the provision for income taxes using the asset and liability method, under which deferred tax assets and liabilities are recognized for the expected future tax consequences of temporary differences between the financial reporting and tax bases of assets and liabilities, and for operating losses and tax credit carryforwards. The Company measures deferred tax assets and liabilities using the currently enacted tax rates that apply to taxable income in effect for the years in which those tax assets are expected to be realized or settled. The Company periodically assesses the likelihood that it will be able to recover its deferred tax assets. If recovery is not likely, the Company must increase its provision for taxes by recording a valuation allowance against the deferred tax assets that the Company estimates will not ultimately be recoverable. The Company recognizes tax benefits from uncertain tax positions only if (based on the technical merits of the position) it is more likely than not that the tax positions will be sustained on examination by the tax authority. The Company's assumptions, judgments and estimates relative to the current provision for income taxes take into account current tax laws, the Company's interpretation of current tax laws and possible outcomes of current and future audits conducted by foreign and domestic tax authorities. The Company has established reserves for income taxes to address potential exposures involving tax positions that could be challenged by tax authorities. Although the Company believes that its assumptions, judgments and estimates are reasonable, changes in tax laws or interpretation of tax laws and the resolution of any future tax audits could significantly impact the amounts provided for income taxes in the Company's consolidated financial statements. The Company's
47
FINISAR CORPORATION
NOTES TO CONSOLIDATED FINANCIAL STATEMENTS — (Continued)
assumptions, judgments and estimates relative to the value of a deferred tax asset take into account predictions of the amount and category of future taxable income, such as income from operations or capital gains income. Actual operating results and the underlying amount and category of income in future years could render current assumptions, judgments and estimates of recoverable net deferred taxes inaccurate, causing the Company's actual income tax obligations to differ from its estimates, thus materially impacting the Company's financial position and results of operations.
The Company has recorded provisional estimates associated with the December 22, 2017 enactment of the U.S. Tax Cuts and Jobs Act ("TCJA"). The SEC has provided accounting and reporting guidance that allows the Company to report provisional amounts within a measurement period up to one year due to the complexities inherent in adopting the changes. The Company considers both the recognition of the transition tax and the remeasurement of deferred income taxes incomplete. New guidance from regulators, interpretation of the law, and refinement of the Company's estimates from ongoing analysis of data and tax positions may change the provisional amounts. For more information about TCJA impacts, see "Note 13. Income Taxes."
Recent and Pending Adoption of New Accounting Standards
In May 2014, the FASB, jointly with the International Accounting Standards Board, issued a comprehensive new standard on revenue recognition from contracts with customers. The standard's core principle is that a reporting entity will recognize revenue when it transfers promised goods or services to customers in an amount that reflects the consideration to which the entity expects to be entitled in exchange for those goods or services. In applying this new guidance to contracts within its scope, an entity will: (1) identify the contract(s) with a customer, (2) identify the performance obligation in the contract, (3) determine the transaction price, (4) allocate the transaction price to the performance obligations in the contract, and (5) recognize revenue when (or as) the entity satisfies a performance obligation. Additionally, this new guidance would require significantly expanded disclosures about revenue recognition. Provisions of this new standard are effective for annual reporting periods (including interim reporting periods within those annual periods) beginning after December 15, 2017, with early adoption permitted. Entities have the option of using either a full retrospective or a modified retrospective approach to adopt this new guidance. The Company plans to adopt this standard on April 30, 2018, using a modified retrospective approach. The Company's assessment has identified a change in revenue recognition timing on sales made to distributors. The Company expects to recognize revenue upon delivery of products to the distributor (in accordance with established shipping and delivery terms) rather than deferring recognition until the distributor sells the product to the end customer. On April 30, 2018, the Company will remove the deferred revenue (and corresponding deferred cost of sales) on sales to distributors through a cumulative adjustment to accumulated deficit. The Company expects that adoption will result in approximately net $8.0 million reduction of accumulated deficit with corresponding approximately $9.5 million reduction of deferred revenue, approximately $535,000 reduction of other non-current liabilities and approximately $2.1 million reduction of deferred tax assets. The Company substantially completed its assessment and noted that only minimal changes were required to policies, processes, and controls to support the standard's measurement and disclosure requirements. During fiscal 2018, the Company and certain licensees agreed to modify terms of some of the Company's out-licensing agreements by granting licensees cancellation rights to cease future payments in the event that licensees cease using the licensed technology. At the onset, these licensing agreements provided for a settlement and release of any prior claims and licensing of the Company’s technology over a future period. Prior to the modification there were no termination rights. The Company plans to utilize one of the practical expedients for adoption provided in this new accounting standard that allows the Company to reflect the aggregate effect of all modifications that have occurred before the beginning of the earliest period presented in accordance with this new accounting standard. Absent these modifications, the Company would have recognized approximately $24.4 million of cumulative effect of adoption of new accounting standard in the earliest period presented in accordance with this new accounting standard, in addition to amounts described above. The Company may provide similar cancellation terms in comparable licensing agreements that may be executed in the future.
In February 2016, the FASB issued an accounting standards update which replaces the current lease accounting standard. The update will require, among other items, lessees to recognize a right-of-use asset and a lease liability for most leases. Extensive quantitative and qualitative disclosures, including significant judgments made by management, will be required to provide greater insight into the extent of revenue and expense recognized and expected to be recognized from existing contracts. The update is effective for fiscal years beginning after December 15, 2018, and interim periods within those fiscal years, with early adoption permitted. The new standard must be adopted using a modified retrospective transition, and provides for certain practical expedients. Transition will require application of the new guidance at the beginning of the earliest comparative period presented. The Company is currently evaluating the timing of adoption and potential effect on its consolidated financial position, results of operations and cash flows from adoption of this update.
From time to time, new accounting pronouncements are issued by the FASB or other standards setting bodies that are adopted by the Company as of the specified effective date. Unless otherwise discussed above, the Company believes the impact
48
FINISAR CORPORATION
NOTES TO CONSOLIDATED FINANCIAL STATEMENTS — (Continued)
of recently issued standards that are not yet effective will not have a material impact on its consolidated financial position, results of operations and cash flows upon adoption.
3. Earnings Per Share
Basic net income (loss) per share has been computed using the weighted-average number of shares of common stock outstanding during the period. Diluted net income (loss) per share has been computed using the weighted-average number of shares of common stock and dilutive potential common shares from stock options and restricted stock units (under the treasury stock method), 0.50% Convertible Senior Notes due 2033 (under the treasury stock method), and 0.50% Convertible Senior Notes due 2036 (under the treasury stock method) outstanding during the period.
The following table presents the calculation of basic and diluted net income (loss) per share:
Fiscal Years Ended | |||||||||||
(in thousands, except per share amounts) | April 29, 2018 | April 30, 2017 | May 1, 2016 | ||||||||
Numerator: | |||||||||||
Net income (loss) | $ | (48,286 | ) | $ | 249,346 | $ | 35,193 | ||||
Numerator for basic income (loss) per share | $ | (48,286 | ) | $ | 249,346 | $ | 35,193 | ||||
Numerator for diluted income (loss) per share | $ | (48,286 | ) | $ | 249,346 | $ | 35,193 | ||||
Denominator: | |||||||||||
Denominator for basic income (loss) per share | 113,864 | 110,405 | 106,678 | ||||||||
Effect of dilutive securities: | |||||||||||
Stock options and restricted stock units | — | 3,692 | 2,192 | ||||||||
Dilutive potential common shares | — | 3,692 | 2,192 | ||||||||
Denominator for diluted income (loss) per share | 113,864 | 114,097 | 108,870 | ||||||||
Net income (loss) per share: | |||||||||||
Basic | $ | (0.42 | ) | $ | 2.26 | $ | 0.33 | ||||
Diluted | $ | (0.42 | ) | $ | 2.19 | $ | 0.32 | ||||
The following table presents common shares related to potentially dilutive securities excluded from the calculation of diluted net income (loss) per share as their effect would have been anti-dilutive:
Fiscal Years Ended | ||||||||
(in thousands) | April 29, 2018 | April 30, 2017 | May 1, 2016 | |||||
Stock options and restricted stock units | 4,545 | 207 | 3,069 | |||||
0.50% Convertible Senior Notes due 2033 and 0.50% Convertible Senior Notes due 2036 are excluded from the calculation of diluted earnings per share under the treasury stock method for the periods when the conversion price exceeded the average market price for the Company's common stock.
4. Intangible Assets
The following tables reflect intangible assets as of April 29, 2018 and April 30, 2017:
April 29, 2018 | |||||||||||
(in thousands) | Gross Carrying Amount | Accumulated Amortization | Net Carrying Amount | ||||||||
Purchased technology | $ | 107,759 | $ | (103,803 | ) | $ | 3,956 | ||||
Purchased trade name | 1,172 | (1,172 | ) | — | |||||||
Purchased customer relationships | 21,344 | (19,798 | ) | 1,546 | |||||||
Purchased internal use software and backlog | 2,816 | (2,816 | ) | — | |||||||
Purchased patents | 4,505 | (2,129 | ) | 2,376 | |||||||
Total | $ | 137,596 | $ | (129,718 | ) | $ | 7,878 | ||||
49
FINISAR CORPORATION
NOTES TO CONSOLIDATED FINANCIAL STATEMENTS — (Continued)
April 30, 2017 | |||||||||||
(in thousands) | Gross Carrying Amount | Accumulated Amortization | Net Carrying Amount | ||||||||
Purchased technology | $ | 107,759 | $ | (101,367 | ) | $ | 6,392 | ||||
Purchased trade name | 1,172 | (1,172 | ) | — | |||||||
Purchased customer relationships | 21,344 | (17,752 | ) | 3,592 | |||||||
Purchased internal use software and backlog | 2,816 | (2,643 | ) | 173 | |||||||
Purchased patents | 4,505 | (1,643 | ) | 2,862 | |||||||
Total | $ | 137,596 | $ | (124,577 | ) | $ | 13,019 | ||||
Estimated amortization expense for each of the next five fiscal years and thereafter as of April 29, 2018 is as follows:
Year | Amount (in thousands) | ||
2019 | $ | 3,696 | |
2020 | 2,224 | ||
2021 | 704 | ||
2022 | 306 | ||
2023 | 306 | ||
Beyond 2023 | 642 | ||
Total | $ | 7,878 | |
5. Investments
Fixed Income Securities
The Company's portfolio of fixed income securities consists of commercial paper notes and term bank certificates of deposit. All of the Company's investments in fixed income securities have original maturity (maturity at the purchase date) of less than 12 months and are reported as short-term investments in the consolidated balance sheets as of April 29, 2018 and April 30, 2017. All of the Company's investments in fixed income securities are classified as held-to-maturity, since the Company has the positive intent and ability to hold these investments until maturity, and are carried at amortized cost.
The Company's investments in fixed income securities as of April 29, 2018 and April 30, 2017 were as follows:
April 29, 2018 | April 30, 2017 | ||||||||||||||||||||||||
Gross Unrealized | Gross Unrealized | ||||||||||||||||||||||||
(in thousands) | Amortized Cost | Gains | Losses | Fair Value | Amortized Cost | Gains | Losses | Fair Value | |||||||||||||||||
Commercial paper | $ | 548,010 | $ | — | $ | — | $ | 548,010 | $ | 571,592 | $ | — | $ | — | $ | 571,592 | |||||||||
Certificates of deposit | 336,828 | — | — | 336,828 | 405,003 | — | — | 405,003 | |||||||||||||||||
Total | $ | 884,838 | $ | — | $ | — | $ | 884,838 | $ | 976,595 | $ | — | $ | — | $ | 976,595 | |||||||||
The Company monitors its investment portfolio for impairment on a periodic basis. In order to determine whether a decline in fair value is other-than-temporary, the Company evaluates, among other factors: the duration and extent to which the fair value has been less than the carrying value; the Company's financial condition and business outlook, including key operational and cash flow metrics, current market conditions and future trends in its industry; the Company's relative competitive position within the industry; and the Company's intent and ability to retain the investment for a period of time sufficient to allow for any anticipated recovery in fair value. A decline in the fair value of the security below amortized cost that is deemed other-than-temporary is charged to earnings, resulting in the establishment of a new cost basis for the affected securities. During fiscal 2018, 2017 and 2016 there were no realized gains or losses, and the Company did not recognize any other-than-temporary impairments.
Minority Investments
The Company's portfolio of minority investments consists of investments in privately held early stage companies. These investments were primarily motivated by the Company's desire to gain early access to new technology. The Company’s
50
FINISAR CORPORATION
NOTES TO CONSOLIDATED FINANCIAL STATEMENTS — (Continued)
investments are passive in nature in that the Company generally does not obtain representation on the board of directors of the companies in which it invests.
The Company's minority investments as of April 29, 2018 and April 30, 2017 were as follows:
April 29, 2018 | April 30, 2017 | ||||||||
(dollars in thousands) | Number of Investments | Carrying Value | Number of Investments | Carrying Value | |||||
Cost method | three | $ | 604 | three | $ | 603 | |||
Equity method | one (*) | — | one | 2,559 | |||||
Total | $ | 604 | $ | 3,162 | |||||
(*) As of April 29, 2018, the Company had a 19.9% ownership interest in this company.
During the first quarter of fiscal 2018, the Company recorded a $2.3 million impairment loss (included in other income (expense) in the consolidated statement of operations) related to its equity method minority investment as a result of this investee's negative results of operations and cash flows. During the third quarter of fiscal 2017, the Company recorded a $643,000 impairment loss (included in other income (expense) in the consolidated statement of operations) related to one of its cost method minority investments as a result of an equity transaction by the investee at a price per share lower than the value at which the investment was carried by the Company.
6. Inventories
Inventories consist of the following (in thousands): | As of | ||||||
April 29, 2018 | April 30, 2017 | ||||||
Raw materials | $ | 84,441 | $ | 66,560 | |||
Work-in-process | 186,160 | 173,302 | |||||
Finished goods | 77,926 | 91,526 | |||||
Total inventories | $ | 348,527 | $ | 331,388 | |||
Including: inventory consigned to others | $ | 38,366 | $ | 40,363 | |||
7. Property, Equipment and Improvements, Net
Property, equipment and improvements consist of the following (in thousands): | As of | ||||||
April 29, 2018 | April 30, 2017 | ||||||
Land and buildings | $ | 113,390 | $ | 97,857 | |||
Computer equipment | 77,235 | 68,145 | |||||
Office equipment, furniture and fixtures | 6,604 | 5,723 | |||||
Machinery and equipment | 700,421 | 554,859 | |||||
Leasehold property and improvements | 52,135 | 44,298 | |||||
Construction-in-progress | 108,091 | 36,207 | |||||
1,057,876 | 807,089 | ||||||
Less: Accumulated depreciation and amortization | (537,027 | ) | (423,170 | ) | |||
Property, equipment and improvements, net | $ | 520,849 | $ | 383,919 | |||
8. Debt
0.50% Convertible Senior Notes Due 2036
In December 2016, the Company issued and sold $575.0 million in aggregate principal amount of 0.50% Convertible Senior Notes due 2036 (the "2036 Notes") at par. The terms of the 2036 Notes are governed by an indenture by and between the Company and Wells Fargo Bank, National Association, as Trustee. The 2036 Notes will mature on December 15, 2036, unless earlier repurchased, redeemed or converted. The 2036 Notes are senior unsecured and unsubordinated obligations of the Company, and are effectively subordinated to the Company's secured indebtedness and the indebtedness and other liabilities of the Company's subsidiaries. The 2036 Notes bear interest at a rate of 0.5% per year, payable semi-annually in arrears on June 15 and December 15 each year.
51
FINISAR CORPORATION
NOTES TO CONSOLIDATED FINANCIAL STATEMENTS — (Continued)
Holders of the 2036 Notes may convert their 2036 Notes at their option prior to the close of business on the business day immediately preceding June 15, 2036 only under the following circumstances: (1) during any fiscal quarter commencing after the fiscal quarter ending on January 29, 2017 (and only during such fiscal quarter), if the last reported sale price of the Company's common stock for at least 20 trading days (whether or not consecutive) during a period of 30 consecutive trading days ending on the last trading day of the immediately preceding fiscal quarter is greater than or equal to 130% of the applicable conversion price on each applicable trading day; (2) during the five business day period after any five consecutive trading day period ("measurement period"), in which the trading price per $1,000 principal amount of the 2036 Notes for each trading day of the measurement period was less than 98% of the product of the last reported sale price of the Company's common stock and the applicable conversion rate on each such trading day; or (3) upon the occurrence of specified corporate events. On or after June 15, 2036 until the close of business on the second scheduled trading day immediately preceding the maturity date, holders may convert their 2036 Notes at any time, regardless of whether any of the foregoing circumstances have occurred. The conversion rate will initially equal 22.6388 shares of common stock per $1,000 principal amount of the 2036 Notes (which is equivalent to an initial conversion price of approximately $44.17 per share of common stock), subject to adjustment. Upon conversion of a note, the Company will pay or deliver, as the case may be, either cash, shares of its common stock or a combination of cash and shares of its common stock, at the Company's election, as provided in the indenture. If holders elect to convert their 2036 Notes in connection with a "fundamental change" (as defined in the indenture) that occurs on or before December 22, 2021, the Company will, to the extent provided in the indenture, increase the conversion rate applicable to such 2036 Notes ("make-whole feature").
In the event of a fundamental change, holders will have the option to require the Company to redeem for cash any 2036 Notes held by them at a purchase price equal to 100% of the principal amount of the 2036 Notes plus accrued and unpaid interest to, but excluding, the redemption date. Holders also have the option to require the Company to redeem for cash any 2036 Notes held by them on December 15, 2021, December 15, 2026 and December 15, 2031 at a redemption price equal to 100% of the principal amount of the 2036 Notes plus accrued and unpaid interest to, but excluding, the redemption date. The Company may redeem the 2036 Notes in whole or in part at any time on or after December 22, 2021 at 100% of the principal amount, plus accrued and unpaid interest to, but excluding, the redemption date.
The Company considered the features embedded in the 2036 Notes, that is, the conversion feature, the holders' put feature, the Company's call feature, and the make-whole feature, and concluded that they are not required to be bifurcated and accounted for separately from the host debt instrument.
Because of its option to settle conversion of the 2036 Notes in cash, the Company separated the liability and equity components of the 2036 Notes. The carrying amount of the liability component at issuance date of $465.1 million was calculated by estimating the fair value of similar liabilities without a conversion feature. The residual principal amount of the 2036 Notes of $109.9 million was allocated to the equity component. The resulting debt discount is amortized as interest expense. As of April 29, 2018, the remaining debt discount amortization period was 44 months.
The 2036 Notes consisted of the following:
As of | |||||||
(in thousands) | April 29, 2018 | April 30, 2017 | |||||
Liability component: | |||||||
Principal | $ | 575,000 | $ | 575,000 | |||
Unamortized debt discount | (82,765 | ) | (103,022 | ) | |||
Unamortized debt issuance costs | (3,358 | ) | (4,281 | ) | |||
Net carrying amount of the liability component | $ | 488,877 | $ | 467,697 | |||
Carrying amount of the equity component | $ | 109,881 | $ | 109,881 | |||
The Company incurred approximately $5.7 million in transaction costs in connection with the issuance of the 2036 Notes. These costs were allocated to the liability and equity components in proportion to the allocation of proceeds. Transaction costs of $4.6 million, allocated to the liability component, were recognized as a non-current asset and are being amortized. Transaction costs of $1.1 million, allocated to the equity component, were recognized as a reduction of additional paid-in capital.
52
FINISAR CORPORATION
NOTES TO CONSOLIDATED FINANCIAL STATEMENTS — (Continued)
The following table sets forth interest expense information related to the 2036 Notes:
Fiscal Years Ended | |||||||||
(in thousands, except percentages) | April 29, 2018 | April 30, 2017 | May 1, 2016 | ||||||
Contractual interest expense | $ | 2,875 | $ | 1,001 | n/a | ||||
Amortization of the debt discount | 20,257 | 6,859 | n/a | ||||||
Amortization of issuance costs | 923 | 334 | n/a | ||||||
Total interest cost | $ | 24,055 | $ | 8,194 | n/a | ||||
Effective interest rate on the liability component | 4.85 | % | 4.85 | % | n/a | ||||
The Company applies the treasury stock method to determine the potential dilutive effect of the 2036 Notes on net income per share as a result of the Company's intent and stated policy to settle the principal amount of the 2036 Notes in cash.
0.50% Convertible Senior Notes Due 2033
In December 2013, the Company issued and sold $258.8 million in aggregate principal amount of 0.50% Convertible Senior Notes due 2033 (the "2033 Notes") at par. The terms of the 2033 Notes are governed by an indenture by and between the Company and Wells Fargo Bank, National Association, as Trustee. The 2033 Notes will mature on December 15, 2033, unless earlier repurchased, redeemed or converted. The 2033 Notes are senior unsecured and unsubordinated obligations of the Company, and are effectively subordinated to the Company's secured indebtedness and the indebtedness and other liabilities of the Company's subsidiaries. The 2033 Notes bear interest at a rate of 0.5% per year, payable semi-annually in arrears on June 15 and December 15 each year.
Holders of the 2033 Notes may convert their 2033 Notes at their option prior to the close of business on the business day immediately preceding June 15, 2033 only under the following circumstances: (1) during any fiscal quarter commencing after the fiscal quarter ending on January 26, 2014 (and only during such fiscal quarter), if the last reported sale price of the Company's common stock for at least 20 trading days (whether or not consecutive) during a period of 30 consecutive trading days ending on the last trading day of the immediately preceding fiscal quarter is greater than or equal to 130% of the applicable conversion price on each applicable trading day; (2) during the five business day period after any five consecutive trading day period ("measurement period"), in which the trading price per $1,000 principal amount of the 2033 Notes for each trading day of the measurement period was less than 98% of the product of the last reported sale price of the Company's common stock and the applicable conversion rate on each such trading day; or (3) upon the occurrence of specified corporate events. On or after June 15, 2033 until the close of business on the second scheduled trading day immediately preceding the maturity date, holders may convert their 2033 Notes at any time, regardless of whether any of the foregoing circumstances have occurred. The conversion rate will initially equal 33.1301 shares of common stock per $1,000 principal amount of the 2033 Notes (which is equivalent to an initial conversion price of approximately $30.18 per share of common stock), subject to adjustment. Upon conversion of a note, the Company will pay or deliver, as the case may be, either cash, shares of its common stock or a combination of cash and shares of its common stock, at the Company's election, as provided in the indenture. If holders elect to convert their 2033 Notes in connection with a "fundamental change" (as defined in the indenture) that occurs on or before December 22, 2018, the Company will, to the extent provided in the indenture, increase the conversion rate applicable to such 2033 Notes ("make-whole feature").
In the event of a fundamental change, holders will have the option to require the Company to redeem for cash any 2033 Notes held by them at a purchase price equal to 100% of the principal amount of the 2033 Notes plus accrued and unpaid interest to, but excluding, the redemption date. Holders also have the option to require the Company to redeem for cash any 2033 Notes held by them on December 15, 2018, December 15, 2023 and December 15, 2028 at a redemption price equal to 100% of the principal amount of the 2033 Notes plus accrued and unpaid interest to, but excluding, the redemption date. The Company may redeem the 2033 Notes in whole or in part at any time on or after December 22, 2018 at 100% of the principal amount, plus accrued and unpaid interest to, but excluding, the redemption date.
The Company considered the features embedded in the 2033 Notes, that is, the conversion feature, the holders' put feature, the Company's call feature, and the make-whole feature, and concluded that they are not required to be bifurcated and accounted for separately from the host debt instrument.
Because of its option to settle conversion of the 2033 Notes in cash, the Company separated the liability and equity components of the 2033 Notes. The carrying amount of the liability component at issuance date of $209.1 million was calculated by estimating the fair value of similar liabilities without a conversion feature. The residual principal amount of the 2033 Notes of $49.6 million was allocated to the equity component. The resulting debt discount is amortized as interest expense. As of April 29, 2018, the remaining debt discount amortization period was 7 months.
53
FINISAR CORPORATION
NOTES TO CONSOLIDATED FINANCIAL STATEMENTS — (Continued)
The 2033 Notes consisted of the following:
As of | |||||||
(in thousands) | April 29, 2018 | April 30, 2017 | |||||
Liability component: | |||||||
Principal | $ | 258,750 | $ | 258,750 | |||
Unamortized debt discount | (7,086 | ) | (17,663 | ) | |||
Unamortized debt issuance costs | (386 | ) | (1,002 | ) | |||
Net carrying amount of the liability component | $ | 251,278 | $ | 240,085 | |||
Carrying amount of the equity component | $ | 49,648 | $ | 49,648 | |||
The Company incurred approximately $3.8 million in transaction costs in connection with the issuance of the 2033 Notes. These costs were allocated to the liability and equity components in proportion to the allocation of proceeds. Transaction costs of $3.1 million, allocated to the liability component, were recognized as a non-current asset and are being amortized. Transaction costs of $725,000, allocated to the equity component, were recognized as a reduction of additional paid-in capital.
The following table sets forth interest expense information related to the 2033 Notes:
Fiscal Years Ended | |||||||||||
(in thousands, except percentages) | April 29, 2018 | April 30, 2017 | May 1, 2016 | ||||||||
Contractual interest expense | $ | 1,294 | $ | 1,294 | $ | 1,294 | |||||
Amortization of the debt discount | 10,577 | 10,076 | 9,604 | ||||||||
Amortization of issuance costs | 616 | 616 | 616 | ||||||||
Total interest cost | $ | 12,487 | $ | 11,986 | $ | 11,514 | |||||
Effective interest rate on the liability component | 4.87 | % | 4.87 | % | 4.87 | % | |||||
The Company applies the treasury stock method to determine the potential dilutive effect of the 2033 Notes on net income per share as a result of the Company's intent and stated policy to settle the principal amount of the 2033 Notes in cash.
As explained above, the terms of the 2033 Notes include a provision that allows the holders to require the Company to redeem any of their notes on December 15, 2018. Accordingly, all $251.3 million of the net carrying amount of the liability component of the 2033 Notes outstanding as of April 29, 2018 was classified as a current liability as of that date.
9. Commitments
The Company’s future commitments at April 29, 2018 included minimum payments under non-cancelable operating lease agreements, including operating lease obligations that have been accrued as restructuring charges, as follows (in thousands):
Payments Due by Period | |||||||||||||||||||
Total | Less Than 1 Year | 1-3 Years | 4-5 Years | After 5 Years | |||||||||||||||
Operating leases | $ | 36,883 | $ | 10,691 | $ | 13,433 | $ | 7,022 | $ | 5,737 | |||||||||
Rent expense under the non-cancelable operating leases was approximately $9.9 million, $9.0 million and $9.4 million for the years ended April 29, 2018, April 30, 2017 and May 1, 2016, respectively. The Company subleases a portion of its facilities that it considers to be in excess of its requirements. Sublease income was $292,000, $373,000 and $168,000 for the years ended April 29, 2018, April 30, 2017 and May 1, 2016, respectively. Certain leases have scheduled rent increases which have been included in the above table and recorded as rent expense on a straight-line basis. Other leases contain provisions to adjust rental rates for inflation during their terms, most of which are based on to-be-published indices. Rents subject to these adjustments are included in the above table based on current rates.
54
FINISAR CORPORATION
NOTES TO CONSOLIDATED FINANCIAL STATEMENTS — (Continued)
10. Fair Value of Financial Instruments
The Company's financial instruments not measured at fair value on a recurring basis as of April 29, 2018 and April 30, 2017 were as follows:
April 29, 2018 | April 30, 2017 | ||||||||||||||||||||||||||||||||
Carrying | Fair Value | Carrying | Fair Value | ||||||||||||||||||||||||||||||
(in thousands) | Amount | Level 1 | Level 2 | Level 3 | Total | Amount | Level 1 | Level 2 | Level 3 | Total | |||||||||||||||||||||||
Commercial paper | $ | 548,010 | $ | — | $ | 548,010 | $ | — | $ | 548,010 | $ | 571,592 | $ | — | $ | 571,592 | $ | — | $ | 571,592 | |||||||||||||
Certificates of deposit | $ | 336,828 | $ | — | $ | 336,828 | $ | — | $ | 336,828 | $ | 405,003 | $ | — | $ | 405,003 | $ | — | $ | 405,003 | |||||||||||||
2033 Notes | $ | 251,278 | $ | 256,001 | $ | — | $ | — | $ | 256,001 | $ | 240,085 | $ | 273,628 | $ | — | $ | — | $ | 273,628 | |||||||||||||
2036 Notes | $ | 488,877 | $ | 520,016 | $ | — | $ | — | $ | 520,016 | $ | 467,697 | $ | 534,391 | $ | — | $ | — | $ | 534,391 | |||||||||||||
The fair values of the Company's investments in commercial papers and certificates of deposit are based on quoted market prices for similar instruments or non-binding market prices that are corroborated by observable market data. The fair values of the 2033 Notes and the 2036 Notes are based on the price in the open market as of or close to the respective balance sheet dates. The difference between the carrying value and the fair value is primarily due to the spread between the conversion price and the market value of the shares underlying the conversion as of each respective balance sheet date.
11. Stockholders’ Equity
Accumulated Other Comprehensive Income
Cumulative foreign currency translation adjustment was the only component of the accumulated other comprehensive income as of April 29, 2018 and April 30, 2017.
Common Stock and Preferred Stock
As of April 29, 2018, Finisar is authorized to issue 750,000,000 shares of $0.001 par value common stock and 5,000,000 shares of $0.001 par value preferred stock. The holder of each share of common stock has the right to one vote and is entitled to receive dividends when and as declared by the Company’s Board of Directors. The Company has never declared or paid dividends on its common stock. The Company has authority to issue up to 5,000,000 shares of preferred stock, $0.001 par value. The preferred stock may be issued in one or more series having such rights, preferences and privileges as may be designated by the Company’s board of directors.
Common stock subject to future issuance as of April 29, 2018 is as follows:
Exercise of outstanding stock options | 1,097,091 | |
Vesting of restricted stock awards | 5,954,755 | |
Available for grant under employee stock incentive plan | 6,298,340 | |
Available for grant under employee stock purchase plan | 2,417,407 | |
Total | 15,767,593 | |
Employee Stock Purchase Plan
In September 2009, the Company’s board of directors adopted the 2009 Employee Stock Purchase Plan (the "ESPP"), which was approved by the stockholders in November 2009. An amended and restated version of ESPP was approved by the Company's board of directors in June 2014 and by the stockholders in September 2014. Under the restated ESPP, 7,000,000 shares of the Company’s common stock have been reserved for issuance, and the term of the ESPP is scheduled to expire on September 1, 2024. The ESPP permits eligible employees to purchase Finisar common stock through payroll deductions, which may not exceed 20% of the employee’s total compensation. Stock may be purchased under the plan at a price equal to 85% of the fair market value of Finisar common stock on either the first or the last day of the offering period, whichever is lower.
Employee Stock Plans
In September 1999, Finisar’s 1999 Stock Option Plan was adopted by the board of directors and approved by the stockholders. An amendment and restatement of the 1999 Stock Option Plan, including renaming it the 2005 Stock Incentive Plan (the “2005 Plan”), was approved by the board of directors in September 2005 and by the stockholders in October 2005. An
55
FINISAR CORPORATION
NOTES TO CONSOLIDATED FINANCIAL STATEMENTS — (Continued)
amended and restated version of the 2005 Plan was approved by the Company's board of directors in June 2014 and by the stockholders in September 2014. Under the restated 2005 Plan, a total of 22,500,000 shares of common stock have been reserved for issuance, and the term of the 2005 Plan is scheduled to expire on September 1, 2024. The types of stock-based awards available under the 2005 Plan includes stock options, stock appreciation rights, restricted stock units (“RSUs”) and other stock-based awards which vest upon the attainment of designated performance goals or the satisfaction of specified service requirements or, in the case of certain RSUs or other stock-based awards, become payable upon the expiration of a designated time period following such vesting events. Options generally vest over four or five years and have a maximum term of 10 years. RSUs generally vest over four years. As of April 29, 2018 and April 30, 2017, no shares were subject to repurchase.
Stock Options
Number of Shares | Weighted-Average Exercise Price | |||
Stock options outstanding as of April 30, 2017 | 581,172 | $9.85 | ||
Stock options granted | 740,000 | $22.26 | ||
Stock options exercised | (187,288 | ) | $12.79 | |
Stock options canceled | (36,793 | ) | $28.81 | |
Stock options outstanding as of April 29, 2018 | 1,097,091 | $17.08 | ||
Stock options outstanding and exercisable as of April 29, 2018 | 357,091 | $6.36 | ||
The weighted-average grant-date fair value of options granted during fiscal 2018 was $9.89. The total intrinsic value of stock options exercised during fiscal 2018, 2017 and 2016 was $1.7 million, $9.9 million and $3.3 million, respectively. The aggregate intrinsic value of stock options outstanding as of April 29, 2018 was $3.4 million. The aggregate intrinsic value of stock options outstanding and exercisable as of April 29, 2018 was $3.4 million. The weighted-average remaining contractual life of stock options outstanding as of April 29, 2018 was 6.9 years. The weighted-average remaining contractual life of stock options outstanding and exercisable as of April 29, 2018 was 1.1 years. As of April 29, 2018, the Company had $6.8 million of unrecognized compensation expense related to stock option grants. These expenses are expected to be recognized over a weighted-average period of approximately 4.1 years.
Restricted Stock Units
Number of Shares | Weighted-Average Grant-Date Fair Value | |||
RSUs unvested as of April 30, 2017 | 6,618,360 | $19.28 | ||
RSUs granted | 2,679,337 | $25.65 | ||
RSUs vested | (2,946,823 | ) | $18.99 | |
RSUs forfeited | (396,119 | ) | $21.63 | |
RSUs unvested as of April 29, 2018 | 5,954,755 | $21.96 | ||
The weighted-average grant-date fair value of RSUs granted during fiscal 2017 and 2016 was $19.77 and $19.02, respectively. The aggregate intrinsic value of RSUs outstanding as of April 29, 2018 was $93.7 million. The total grant-date fair value of RSUs vested during fiscal 2018, 2017 and 2016 was $56.0 million, $42.0 million and $41.7 million, respectively. As of April 29, 2018, the Company had $92.1 million of unrecognized compensation expense related to RSUs grants. These expenses are expected to be recognized over a weighted-average period of approximately 2.3 years.
Share-Based Compensation Cost
The following table sets forth the detailed allocation of the share-based compensation expense for the fiscal years ended April 29, 2018, April 30, 2017 and May 1, 2016 which was reflected in the Company’s operating results:
56
FINISAR CORPORATION
NOTES TO CONSOLIDATED FINANCIAL STATEMENTS — (Continued)
Fiscal Years Ended | ||||||||
(in thousands) | April 29, 2018 | April 30, 2017 | May 1, 2016 | |||||
Share-based compensation expense by caption: | ||||||||
Cost of revenues | $12,943 | $11,409 | $10,357 | |||||
Research and development | 22,767 | 20,425 | 18,245 | |||||
Sales and marketing | 7,619 | 7,170 | 6,667 | |||||
General and administrative | 17,835 | 10,875 | 9,974 | |||||
Total | $61,164 | $49,879 | $45,243 | |||||
Share-based compensation expense by type of award: | ||||||||
RSUs | $56,965 | $46,577 | $42,162 | |||||
Stock options | 490 | — | — | |||||
Employee stock purchase rights under ESPP | 3,709 | 3,302 | 3,081 | |||||
Total | $61,164 | $49,879 | $45,243 | |||||
Total share-based compensation cost capitalized as part of inventory was $3.9 million and $2.5 million as of April 29, 2018 and April 30, 2017, respectively.
The fair value of stock options and employee stock purchase rights under the ESPP granted in fiscal 2018, 2017 and 2016 was estimated at the date of grant using the Black-Scholes option-pricing model with the following assumptions:
Fiscal Years Ended | |||||||||
April 29, 2018 | April 30, 2017 | May 1, 2016 | |||||||
Stock Purchase Rights: | |||||||||
Expected term (in years) | 0.75 | 0.75 | 0.75 | ||||||
Volatility | 56% - 57% | 40% - 43% | 32% - 54% | ||||||
Risk-free interest rate | 1.48 - 1.70% | 0.36 - 0.89% | 0.11 - 0.70% | ||||||
Dividend yield | — | % | — | % | — | % | |||
Stock Options: | |||||||||
Expected term (in years) | 5.2 | n/a | n/a | ||||||
Volatility | 47 | % | n/a | n/a | |||||
Risk-free interest rate | 2.3 | % | n/a | n/a | |||||
Dividend yield | — | % | n/a | n/a | |||||
The expected term of employee stock purchase rights is the average of the remaining purchase periods under each offering period. The expected term of stock options is the average term from the Company's historical stock option exercise experience. The Company calculated the volatility factor based on the Company’s historical stock prices. The Company bases the risk-free interest rate used in the Black-Scholes option-pricing model on constant maturity bonds from the Federal Reserve in which the maturity approximates the expected terms. The Black-Scholes option-pricing model calls for a single expected dividend yield as an input. The Company has not issued and does not expect to issue any dividends.
The weighted-average estimated per share fair value of purchase rights granted under the ESPP in fiscal 2018, 2017 and 2016 was $4.43, $5.34 and $2.79, respectively.
The Black-Scholes option-pricing model requires the input of highly subjective assumptions, including the expected life of the stock-based award and the stock price volatility. The assumptions listed above represent management’s best estimates, but these estimates involve inherent uncertainties and the application of management judgment. As a result, if other assumptions had been used, recorded share-based compensation expense could have been materially different from that depicted above.
During the third quarter of fiscal 2018, Jerry S. Rawls resigned as the Company's Chief Executive Officer and as Chairman of the Company's Board of Directors (the “Board”). Mr. Rawls remains a member of the Board. In connection with Mr. Rawls’ resignation, and in accordance with the terms of the related separation and release agreement between Mr. Rawls and the Company, Mr. Rawls received a lump sum cash severance payment of $300,000, and the vesting of each of Mr. Rawls’ outstanding and unvested awards of restricted stock units granted by the Company was accelerated 100%. Accordingly, during
57
FINISAR CORPORATION
NOTES TO CONSOLIDATED FINANCIAL STATEMENTS — (Continued)
the third quarter of fiscal 2018, the Company recorded approximately $7.5 million of compensation expense related to this acceleration.
12. Employee Benefit Plan
The Company maintains a defined contribution retirement plan under the provisions of Section 401(k) of the Internal Revenue Code which covers all eligible employees. Employees are eligible to participate in the plan on the first day of the calendar year quarter immediately following completion of eligibility requirements as required by the plan.
Under the plan, each participant may contribute up to 20% of his or her pre-tax gross compensation up to a statutory limit, which is $18,500 for calendar 2018 and $18,000 for each calendar year 2017 and 2016. All amounts contributed by participants and earnings on participant contributions are fully vested at all times. The Company may contribute an amount equal to one-half of the first 6% of each participant’s contribution. The Company may make the matching contribution in shares of Finisar common stock in lieu of cash. Contributions made in shares will be allocated to each participant’s account using the share price on the date the Company matching contribution is made to the plan.
The Company made a discretionary matching contribution of 146,944 shares for a total contribution of $3.2 million during the year ended April 29, 2018. The Company’s expenses related to this plan were $3.3 million, $2.8 million and $2.4 million for the fiscal years ended April 29, 2018, April 30, 2017 and May 1, 2016, respectively.
13. Income Taxes
On December 22, 2017, the Tax Cuts and Jobs Act ("TCJA") was enacted, containing significant changes to the U.S. tax law, including lowering the U.S. corporate income tax rate, implementing a territorial tax system, and imposing a one-time tax on deemed repatriation of earnings of foreign subsidiaries.
The TCJA reduces the U.S. statutory corporate income tax rate from 35% to 21%, effective January 1, 2018. As a result of this rate reduction, the Company revalued its net deferred tax asset as of December 22, 2017, and recorded a reduction in its deferred tax assets and a corresponding deferred tax expense of approximately $30.3 million. For fiscal 2018, the Company's blended corporate income tax rate is 30.4%, which is based on the applicable tax rates before and after the TCJA enactment and the number of days in each period.
The TCJA allows 100% expensing of cost of qualified property acquired and placed in service after September 27, 2017 and before January 1, 2023. The bonus depreciation percentage is phased down from 100% beginning in 2023 through 2026. The Company elected to claim the 100% bonus depreciation for the assets placed into service after September 27, 2017. The net impact of this provision is not material to the Company's consolidated financial position, results of operations and cash flows.
The TCJA also implements a territorial tax system. In general, under the territorial tax system, the Company’s foreign earnings will no longer be subject to tax in the U.S. As part of transitioning to the territorial tax system, the TCJA includes a mandatory deemed repatriation of all undistributed foreign earnings that are subject to a U.S. income tax. As of December 31, 2017, the Company had approximately $123.0 million of undistributed earnings for certain non-U.S. subsidiaries that have been indefinitely reinvested outside the U.S. The mandatory deemed repatriation of these undistributed earnings resulted in a one-time deferred tax expense of approximately $19.1 million. This provisional estimate may be impacted by a number of additional considerations, including, but not limited to, the issuance of final regulations and the Company's ongoing analysis of the TCJA.
The Company has historically asserted its intent to reinvest these earnings in foreign operations indefinitely and continues to do so. The Company does not intend to repatriate these earnings to fund its U.S. operations and, accordingly, it does not provide for the U.S. state income and foreign withholding tax on these earnings.
While the TJCA provides for a territorial tax system, beginning in 2018, it also includes two new U.S. tax base erosion provisions - the global intangible low-taxed income ("GILTI") provision and the base-erosion and anti-abuse tax ("BEAT") provision. The GILTI provision requires the Company to include in its U.S. income tax return foreign subsidiary earnings in excess of an allowable return on the foreign subsidiary’s tangible assets. The BEAT provision eliminates the deduction of certain base-erosion payments made to related foreign corporations and imposes a minimum tax if greater than regular tax. The Company expects that the BEAT provision may result in significant U.S. tax in future periods. In addition, the Company intends to account for the GILTI tax in the period in which it is incurred, and therefore has not provided any deferred tax impacts of GILTI in its consolidated financial statements for the fiscal 2018.
On December 22, 2017, the SEC staff issued Staff Accounting Bulletin No. 118 to address the application of U.S. GAAP in situations when a registrant does not have the necessary information available, prepared, or analyzed (including
58
FINISAR CORPORATION
NOTES TO CONSOLIDATED FINANCIAL STATEMENTS — (Continued)
computations) in reasonable detail to complete the accounting for certain income tax effects of the TCJA. The Company has recognized the provisional tax impact related to deemed repatriated earnings and the revaluation of deferred tax assets and liabilities to the extent needed and included these amounts in its consolidated financial statements for fiscal 2018. The ultimate impact may differ from these provisional amounts, possibly materially, due to, among other things, additional analysis, changes in interpretations and assumptions the Company has made, additional regulatory guidance that may be issued, and actions the Company may take as a result of the TCJA.
The components of income tax expense (benefit) consist of the following (in thousands):
Fiscal Years Ended | |||||||||||
April 29, 2018 | April 30, 2017 | May 1, 2016 | |||||||||
Current: | |||||||||||
Federal | $ | — | $ | — | $ | — | |||||
State | 189 | 532 | (9 | ) | |||||||
Foreign | 7,480 | 14,850 | 4,575 | ||||||||
7,669 | 15,382 | 4,566 | |||||||||
Deferred: | |||||||||||
Federal | 29,532 | (102,305 | ) | — | |||||||
State | (999 | ) | (1,008 | ) | — | ||||||
Foreign | (2,919 | ) | 1,779 | (4,928 | ) | ||||||
25,614 | (101,534 | ) | (4,928 | ) | |||||||
Provision for (benefit from) income taxes | $ | 33,283 | $ | (86,152 | ) | $ | (362 | ) | |||
Income (loss) before income taxes consists of the following (in thousands):
Fiscal Years Ended | |||||||||||
April 29, 2018 | April 30, 2017 | May 1, 2016 | |||||||||
U.S. | $ | (72,730 | ) | $ | 96,648 | $ | (2,579 | ) | |||
Foreign | 57,727 | 66,546 | 37,410 | ||||||||
$ | (15,003 | ) | $ | 163,194 | $ | 34,831 | |||||
A reconciliation of the income tax provision at the federal statutory rate and the effective rate is as follows:
Fiscal Years Ended | ||||||||
April 29, 2018 | April 30, 2017 | May 1, 2016 | ||||||
Expected income tax provision (benefit) at U.S. federal statutory rate | 30.4 | % | 35.0 | % | 35.0 | % | ||
Foreign rate differential | 100.6 | (5.0 | ) | (40.5 | ) | |||
Share-based compensation expense | (5.3 | ) | 0.7 | 14.1 | ||||
Valuation allowance | (31.7 | ) | (83.0 | ) | (2.5 | ) | ||
Other permanent adjustments | (32.4 | ) | 0.7 | 4.4 | ||||
Research and development credits | 43.2 | (2.3 | ) | (12.6 | ) | |||
Impact of TCJA - rate reduction | (201.8 | ) | — | — | ||||
Impact of TCJA - transition tax | (127.1 | ) | — | — | ||||
Other | 2.4 | 1.0 | 1.1 | |||||
(221.7 | )% | (52.9 | )% | (1.0 | )% | |||
59
FINISAR CORPORATION
NOTES TO CONSOLIDATED FINANCIAL STATEMENTS — (Continued)
The components of deferred taxes consist of the following (in thousands):
As of | |||||||
April 29, 2018 | April 30, 2017 | ||||||
Deferred tax assets: | |||||||
Inventory adjustments | $ | 9,870 | $ | 9,161 | |||
Accruals and reserves | 4,827 | 12,731 | |||||
Tax credits | 49,657 | 38,092 | |||||
Net operating loss carryforwards | 55,926 | 106,297 | |||||
Gain/loss on investments under equity or cost method | 364 | 814 | |||||
Depreciation and amortization | 16,524 | 8,462 | |||||
Purchase accounting for intangible assets | 1,284 | 2,707 | |||||
Capital loss carryforward | 2,246 | 7,183 | |||||
Acquired intangibles | 1,497 | 4,343 | |||||
Stock compensation | 5,432 | 9,345 | |||||
Total deferred tax assets | 147,627 | 199,135 | |||||
Valuation allowance | (30,213 | ) | (30,804 | ) | |||
Net deferred tax assets | 117,414 | 168,331 | |||||
Deferred tax liabilities: | |||||||
Acquired intangibles | (1,493 | ) | (2,360 | ) | |||
Debt discount | (20,006 | ) | (43,796 | ) | |||
Depreciation and amortization | (15,590 | ) | (16,233 | ) | |||
Total deferred tax liabilities | (37,089 | ) | (62,389 | ) | |||
Total net deferred tax assets (liabilities) | $ | 80,325 | $ | 105,942 | |||
Reported as: | |||||||
Deferred tax assets | $ | 80,850 | $ | 107,225 | |||
Deferred tax liabilities | (525 | ) | (1,283 | ) | |||
Total net deferred tax assets (liabilities) | $ | 80,325 | $ | 105,942 | |||
Realization of deferred tax assets is dependent upon future taxable earnings in related tax jurisdictions. In the past, due to U.S. operating losses in previous years and continuing U.S. earnings volatility which did not allow sustainable profitability, management had established and maintained a full valuation allowance for the U.S. deferred tax assets. During the fourth quarter of fiscal 2017, the Company assessed that it is more likely than not that it will realize the majority of the U.S. deferred tax assets, except for deferred tax assets related to California research and development credits and capital losses. The positive evidence, which existed at that time, that outweighed the negative evidence to release the valuation allowance included the fiscal 2017 and three year cumulative profitability driven by strong demand of certain new generation products, availability of resources to expand manufacturing capacity, and forecasted U.S. operating profits in the future periods. Accordingly, during the fourth quarter of fiscal 2017, the Company released $103.3 million of valuation allowance on these deferred tax assets. As of April 29, 2018, the valuation allowance comprises approximately 20% of total deferred tax assets and relates to deferred tax assets, for which management believes it is not more likely than not to be realized in future periods. The Company's valuation allowance decreased from the prior year by approximately $(0.6) million, $(132.1) million and $(1.5) million in fiscal 2018, 2017 and 2016, respectively.
As of April 29, 2018, the Company had federal, state and foreign net operating loss carryforwards of approximately $236.5 million, $13.8 million and $22.9 million, respectively, and federal and state tax credit carryforwards of approximately $38.8 million and $31.4 million, respectively. With the exception of California R&D credit, which can be carried forward indefinitely, the net operating loss and tax credit carryforwards will expire at various dates beginning in fiscal 2020 through 2037, if not utilized. Utilization of the Company's U.S. net operating loss and tax credit carryforwards may be subject to a substantial annual limitation due to the ownership change limitations set forth in Internal Revenue Code Section 382 and similar state provisions. Such an annual limitation could result in the expiration of the net operating loss and tax credit carryforwards before utilization.
60
FINISAR CORPORATION
NOTES TO CONSOLIDATED FINANCIAL STATEMENTS — (Continued)
The Company's manufacturing operations in Malaysia operate under a tax holiday which will expire at the beginning of the second quarter of fiscal 2022. In fiscal 2018, the aggregate dollar and per share effect of the tax holiday was $6.8 million and $0.06 per share, respectively.
A reconciliation of the beginning and ending amount of the gross unrecognized tax benefits is as follows (in thousands):
Fiscal Years Ended | |||||||||||
April 29, 2018 | April 30, 2017 | May 1, 2016 | |||||||||
Beginning balance | $ | 21,458 | $ | 16,411 | $ | 14,653 | |||||
Additions for tax positions related to current year | 1,803 | 1,675 | 1,331 | ||||||||
Additions for tax positions related to prior years | 94 | 3,372 | 902 | ||||||||
Reductions for tax positions related to prior years (lapse of statute of limitations) | (2,777 | ) | — | (475 | ) | ||||||
Ending balance | $ | 20,578 | $ | 21,458 | $ | 16,411 | |||||
The reduction of the Company’s unrecognized tax benefits in fiscal 2018 is primarily related to a conclusion of a tax audit in Israel covering fiscal years through 2015.
Excluding the effects of recorded valuation allowances for deferred tax assets, $17.7 million of the unrecognized tax benefits would favorably impact the effective tax rate in future periods if recognized. It is the Company's belief that no significant changes in the unrecognized tax benefit positions will occur within 12 months from April 29, 2018. The Company records interest and penalties, if any, related to unrecognized tax benefits in income tax expense. As of April 29, 2018 and April 30, 2017, the Company had accrued $652,000 and $822,000, respectively, for interest and penalties related to uncertain tax positions.
The Company and its subsidiaries are subject to taxation in various state jurisdictions as well as the U.S. The Company's U.S. federal and state income tax returns are generally not subject to examination by the tax authorities for tax years before fiscal 2009. For all federal and state net operating loss and credit carryovers, the statute of limitations does not begin until the carryover items are utilized. The taxing authorities can examine the validity of the carryover items and if necessary, adjustments may be made to the carryover items. The Company's Malaysia, Singapore, China, Australia, Israel, and Sweden income tax returns are generally not subject to examination by the tax authorities for tax years before 2011, 2012, 2011, 2011, 2005 and 2010, respectively. The Company's Australia subsidiary is under audit for tax year 2011 and after. The Company's Sweden subsidiary is under audit for tax year 2016 and 2017.
14. Segments and Geography Information
The Company has one reportable segment consisting of optical subsystems and components. Optical subsystems consist primarily of transmitters, receivers, transceivers, transponders and active optical cables that provide the fundamental optical-electrical, or optoelectronic, interface for interconnecting the electronic equipment used in building communication networks, including the switches, routers and servers used in wireline networks as well as the antennas and base stations for wireless networks. Optical components consists primarily of packaged lasers, receivers and photodetectors for data communication and telecommunication applications and passive optical components used in telecommunication applications.
The following is a summary of revenues from sales to unaffiliated customers within geographic areas based on the location of the entity purchasing the Company’s products:
Fiscal Years Ended | |||||||||||
(in thousands) | April 29, 2018 | April 30, 2017 | May 1, 2016 | ||||||||
United States | $ | 482,601 | $ | 476,763 | $ | 408,700 | |||||
China | 270,040 | 358,561 | 307,327 | ||||||||
Malaysia | 122,548 | 122,699 | 123,057 | ||||||||
Rest of the world | 441,294 | 491,280 | 424,082 | ||||||||
Totals | $ | 1,316,483 | $ | 1,449,303 | $ | 1,263,166 | |||||
Revenues generated in the United States are all from sales to customers located in the United States.
61
FINISAR CORPORATION
NOTES TO CONSOLIDATED FINANCIAL STATEMENTS — (Continued)
The following is a summary of long-lived assets within geographic areas based on the location of the assets:
As of | |||||||
(in thousands) | April 29, 2018 | April 30, 2017 | |||||
United States | $ | 213,745 | $ | 133,426 | |||
China | 252,179 | 205,423 | |||||
Malaysia | 52,417 | 49,779 | |||||
Rest of the world | 45,850 | 36,105 | |||||
$ | 564,191 | $ | 424,733 | ||||
The increase in long-lived assets was primarily due to the additions of property, improvements and manufacturing equipment to the Company's manufacturing facilities in Sherman, Texas and China.
15. Legal Matters
The Company accrues a liability for legal contingencies when it believes that it is both probable that a liability has been incurred and that it can reasonably estimate the amount of the loss. The Company reviews these accruals and adjusts them to reflect ongoing negotiations, settlements, rulings, advice of legal counsel and other relevant information. To the extent new information is obtained and the Company's views on the probable outcomes of claims, suits, assessments, investigations or legal proceedings change, changes in the Company's accrued liabilities would be recorded in the period in which such determination is made. For the matters referenced below, the amount of liability is not probable or the amount cannot be reasonably estimated and, therefore, accruals have not been made. In addition, in accordance with the relevant authoritative guidance, for matters which the likelihood of material loss is at least reasonably possible, the Company provides disclosure of the possible loss or range of loss; however, if a reasonable estimate cannot be made, the Company will provide disclosure to that effect.
Due to the nature of the Company's business, it is subject to claims alleging infringement by various Company products and services. The Company believes that it has meritorious defenses to the allegations made in its pending cases and intends to vigorously defend these lawsuits; however, it is unable currently to determine the ultimate outcome of these or similar matters. In addition, the Company is a defendant in various litigation matters generally arising out of the normal course of business. Although it is difficult to predict the ultimate outcomes of these cases, the Company believes that it is not reasonably possible that the ultimate outcomes will materially and adversely affect its business, financial position, results of operations or cash flows.
Class Action and Shareholder Derivative Litigation
Several securities class action lawsuits related to the Company's March 8, 2011 earnings announcement alleging claims under Sections 10(b) and 20(a) of the Securities Exchange Act of 1934 have been filed in the United States District Court for the Northern District of California on behalf of a purported class of persons who purchased stock between December 2, 2010 through March 8, 2011. The named defendants are the Company and Jerry Rawls, its former Chief Executive Officer and former Chairman of the Board, and Eitan Gertel, its former Chief Executive Officer. To date, no specific amount of damages has been alleged. The cases were consolidated, lead plaintiff was appointed and a consolidated complaint was filed. The Company filed a motion to dismiss the case. On January 16, 2013, the District Court granted the Company's motion to dismiss and granted the lead plaintiffs leave to amend the consolidated complaint. An amended consolidated complaint was filed on February 6, 2013. Thereafter, the Company filed a renewed motion to dismiss the case. On September 30, 2013, the District Court granted the Company's motion and dismissed the case with prejudice, and plaintiff appealed. On January 8, 2016, the Ninth Circuit Court of Appeals reversed the judgment in part for further proceedings in the District Court. On July 15, 2016, lead plaintiff filed a Second Amended Complaint in the District Court. On August 19, 2016, the Company moved to dismiss. On May 1, 2017, the District Court denied the motion and a case scheduling order has been issued. On December 5, 2017, the District Court issued an order denying class certification. On February 1, 2018, the plaintiff filed a petition with the Ninth Circuit Court of Appeal for permission to appeal the denial of class certification.
In addition, two purported shareholder derivative lawsuits related to the Company's March 8, 2011 earnings announcement have been filed in the California Superior Court for the County of Santa Clara, and a third derivative lawsuit has been filed in the United States District Court for the Northern District of California. The complaints assert claims for alleged breach of fiduciary duty, unjust enrichment, and waste on behalf of the Company. Named as defendants are the members of the Company's board of directors at the time of the claim and certain officers, including Jerry Rawls, the Company's former Chief
62
FINISAR CORPORATION
NOTES TO CONSOLIDATED FINANCIAL STATEMENTS — (Continued)
Executive Officer and former Chairman of the Board, Eitan Gertel, the Company’s former Chief Executive Officer, and Kurt Adzema, the Company’s Chief Financial Officer. No specific amount of damages has been alleged and, by the derivative nature of the lawsuits, no damages will be alleged, against the Company. The state court cases have been consolidated and a lead plaintiff has been appointed to file a consolidated complaint. The derivative cases were stayed pending a ruling in the federal class action case. On August 7, 2017, the plaintiff in the federal case filed an amended complaint. On March 9, 2018, the Company filed a motion to dismiss the amended federal complaint.
Other
In the ordinary course of business, the Company is a party to litigation, claims and assessments in addition to those described above. Based on information currently available, management does not believe the impact of these other matters will have a material adverse effect on its business, financial condition, results of operations or cash flows of the Company.
16. Guarantees and Indemnifications
Upon issuance of a guarantee, the guarantor must recognize a liability for the fair value of the obligations it assumes under that guarantee. As permitted under Delaware law and in accordance with the Company’s Bylaws, the Company indemnifies its officers and directors for certain events or occurrences, subject to certain limits, while the officer or director is or was serving at the Company’s request in such capacity. The term of the indemnification period is for the officer’s or director’s lifetime. The Company may terminate the indemnification agreements with its officers and directors upon 90 days written notice, but termination will not affect claims for indemnification relating to events occurring prior to the effective date of termination. The maximum amount of potential future indemnification is unlimited; however, the Company has a director and officer liability insurance policy that may enable it to recover a portion of any future amounts paid.
The Company enters into indemnification obligations under its agreements with other companies in its ordinary course of business, including agreements with customers, business partners, and insurers. Under these provisions the Company generally indemnifies and holds harmless the indemnified party for losses suffered or incurred by the indemnified party as a result of the Company’s activities or the use of the Company’s products. These indemnification provisions generally survive termination of the underlying agreement. In some cases, the maximum potential amount of future payments the Company could be required to make under these indemnification provisions is unlimited.
The Company believes the fair value of these indemnification agreements is minimal. Accordingly, the Company has not recorded any liabilities for these agreements as of April 29, 2018. To date, the Company has not incurred material costs to defend lawsuits or settle claims related to these indemnification agreements.
17. Financial Information by Quarter (Unaudited)
Three Months Ended | |||||||||||||||||||||||
April 29, 2018 | January 28, 2018 (1) | October 29, 2017 | July 30, 2017 | April 30, 2017 (2) | January 29, 2017 | October 30, 2016 | July 31, 2016 | ||||||||||||||||
(In thousands, except per share data) | |||||||||||||||||||||||
Revenues | $310,069 | $332,403 | $332,205 | $341,806 | $357,527 | $380,588 | $369,863 | $341,325 | |||||||||||||||
Gross profit | $62,594 | $88,068 | $96,205 | $115,299 | $125,164 | $136,637 | $133,681 | $108,165 | |||||||||||||||
Income (loss) from operations | $(26,736) | $(6,129) | $9,467 | $29,912 | $40,841 | $54,906 | $52,828 | $28,311 | |||||||||||||||
Net income (loss) | $(18,343) | $(55,659) | $5,857 | $19,859 | $130,245 | $46,386 | $48,766 | $23,949 | |||||||||||||||
Net income (loss) per share: | |||||||||||||||||||||||
Basic | $(0.16) | $(0.49) | $0.05 | $0.18 | $1.17 | $0.42 | $0.44 | $0.22 | |||||||||||||||
Diluted | $(0.16) | $(0.49) | $0.05 | $0.17 | $1.13 | $0.40 | $0.43 | $0.22 | |||||||||||||||
Shares used in computing net income (loss) per share: | |||||||||||||||||||||||
Basic | 114,742 | 114,209 | 113,960 | 112,544 | 111,438 | 110,956 | 110,407 | 108,820 | |||||||||||||||
Diluted | 114,742 | 114,209 | 115,443 | 115,698 | 115,248 | 114,873 | 113,192 | 110,821 | |||||||||||||||
(1) Net loss in the third quarter of fiscal 2018 includes a $49.4 million deferred income tax expense as a result of the TCJA.
(2) Net income in the fourth quarter of fiscal 2017 includes a $103.3 million release of valuation allowance on U.S. deferred tax assets.
63
Item 9. | Changes in and Disagreements with Accountants on Accounting and Financial Disclosures |
None.
Item 9A. | Controls and Procedures |
Evaluation of Disclosure Controls and Procedures
Attached as exhibits to this report are certifications of our Chief Executive Officer and Chief Financial Officer, which are required in accordance with Rule 13a-14 under the Securities Exchange Act of 1934, as amended (the “Exchange Act”). This “Controls and Procedures” section includes information concerning the controls and controls evaluation referred to in the certifications, and it should be read in conjunction with the certifications for a more complete understanding of the topics presented.
Based on their evaluation of our disclosure controls and procedures (as defined in Rules 13a-15(e) and 15d-15(e) under the Exchange Act) as of April 29, 2018, our management, with the participation of our Chief Executive Officer and Chief Financial Officer, has concluded that our disclosure controls and procedures were effective as of the end of the period covered by this report for the purpose of ensuring that the information required to be disclosed by us in this report is made known to them by others on a timely basis, and that the information is accumulated and communicated to our management in order to allow timely decisions regarding required disclosure, and that such information is recorded, processed, summarized, and reported by us within the time periods specified in the SEC’s rules.
Management’s Annual Report on Internal Control Over Financial Reporting
Our management is responsible for establishing and maintaining adequate internal control over financial reporting (as defined in Rules 13a-15(f) and 15d-15(f) under the Exchange Act) to provide reasonable assurance regarding the reliability of our financial reporting and the preparation of financial statements for external purposes in accordance with generally accepted accounting principles, and includes those policies and procedures that:
• | pertain to the maintenance of records that, in reasonable detail, accurately and fairly reflect the transactions and dispositions of the assets of the company; |
• | provide reasonable assurance that transactions are recorded as necessary to permit preparation of financial statements in accordance with generally accepted accounting principles, and that receipts and expenditures of the company are being made only in accordance with authorizations of management and directors of the company; and |
• | provide reasonable assurance regarding prevention or timely detection of unauthorized acquisition, use or disposition of the company’s assets that could have a material effect on the financial statements. |
Because of its inherent limitations, internal control over financial reporting may not prevent or detect misstatements. Also, projections of any evaluation of effectiveness to future periods are subject to the risk that controls may become inadequate because of changes in conditions, or that the degree of compliance with the policies or procedures may deteriorate.
Under the supervision and with the participation of our management, including our Chief Executive Officer and Chief Financial Officer, we conducted an assessment of the effectiveness of our internal control over financial reporting as of April 29, 2018. Management based its assessment on the criteria set forth in Internal Control - Integrated Framework ("2013 framework") issued by the Committee of Sponsoring Organizations of the Treadway Commission (“COSO”). Based on this assessment, management determined that we maintained effective internal control over financial reporting as of April 29, 2018.
The effectiveness of internal control over financial reporting as of April 29, 2018 has been audited by BDO USA, LLP, an independent registered public accounting firm, as stated in their report which is included herein.
Changes in Internal Control
There were no changes in our internal control over financial reporting during the fiscal quarter ended April 29, 2018 that have materially affected, or are reasonably likely to materially affect, our internal control over financial reporting.
Item 9B. | Other Information |
None.
64
PART III
The SEC allows us to include information required in this report by referring to other documents or reports we have already filed or will soon be filing. This is called “incorporation by reference.” We intend to file our definitive proxy statement for our 2018 annual meeting of stockholders (the “Proxy Statement”) pursuant to Regulation 14A not later than 120 days after the end of the fiscal year covered by this report, and certain information to be contained therein is incorporated in this report by reference.
Item 10. | Directors, Executive Officers and Corporate Governance |
The information required by this item is incorporated by reference from the sections captioned “Proposal No. 1 – Election of Directors”, “Corporate Governance”, “Executive Officers of the Registrant” and “Section 16(a) Beneficial Ownership Reporting Compliance” to be contained in the Proxy Statement.
Item 11. | Executive Compensation |
The information required by this item is incorporated by reference from the sections captioned “Director Compensation” and “Executive Compensation and Related Matters” to be contained in the Proxy Statement.
Item 12. | Security Ownership of Certain Beneficial Owners and Management and Related Stockholder Matters |
The information required by this item is incorporated by reference from the sections captioned “Principal Stockholders and Share Ownership by Management” and “Equity Compensation Plan Information” to be contained in the Proxy Statement.
Item 13. | Certain Relationships and Related Transactions, and Director Independence |
The information required by this item is incorporated by reference from the sections captioned “Corporate Governance” and “Certain Relationships and Related Transactions” to be contained in the Proxy Statement.
Item 14. | Principal Accountant Fees and Services |
The information required by this item is incorporated by reference from the section captioned “Proposal No. 2 – Ratification of Appointment of Independent Registered Public Accounting Firm” to be contained in the Proxy Statement.
65
PART IV
Item 15. | Exhibits and Financial Statement Schedules |
(a)(1) Financial Statements:
See “Finisar Corporation Consolidated Financial Statements Index” in Part II, Item 8 of this report.
(2) Financial Statement Schedules:
Schedule II - Consolidated Valuation and Qualifying Accounts | |||||||
Allowance for Doubtful Accounts | |||||||
(in thousands) | |||||||
Fiscal Year Ended: | Balance at Beginning of Period | Additions Charged to (Recoveries Offset against) Costs and Expenses, Net | Write-Offs | Balance at End of Period | |||
April 29, 2018 | $756 | $(266) | $(221) | $269 | |||
April 30, 2017 | $727 | $33 | $(4) | $756 | |||
May 1, 2016 | $1,136 | $(403) | $(6) | $727 | |||
(3) Exhibits:
The exhibits listed in the accompanying Exhibit Index are filed or incorporated by reference as part of this report.
Certain of the agreements filed as exhibits to this Form 10-K contain representations and warranties by the parties to the agreements that have been made solely for the benefit of the parties to the agreement. These representations and warranties:
• | may have been qualified by disclosures that were made to the other parties in connection with the negotiation of the agreements, which disclosures are not necessarily reflected in the agreements; |
• | may apply standards of materiality that differ from those of a reasonable investor; and |
• | were made only as of specified dates contained in the agreements and are subject to subsequent developments and changed circumstances. |
Accordingly, these representations and warranties may not describe the actual state of affairs as of the date that these representations and warranties were made or at any other time. Investors should not rely on them as statements of fact.
66
SIGNATURES
Pursuant to the requirements of Section 13 or 15(d) of the Securities Exchange Act of 1934, the registrant has duly caused this report to be signed on its behalf by the undersigned, thereunto duly authorized.
FINISAR CORPORATION | ||
By | /s/ Michael E. Hurlston | |
Michael E. Hurlston | ||
Chief Executive Officer | ||
(Principal Executive Officer) | ||
June 15, 2018 | ||
POWER OF ATTORNEY
Know all persons by these presents, that each person whose signature appears below constitutes and appoints Michael E. Hurlston and Kurt Adzema, and each of them, as such person’s true and lawful attorneys-in-fact and agents, with full power of substitution and resubstitution, for such person and in such person’s name, place and stead, in any and all capacities, to sign any and all amendments to this report on Form 10-K, and to file same, with all exhibits thereto, and other documents in connection therewith, with the Securities and Exchange Commission, granting unto said attorneys-in-fact and agents, and each of them, full power and authority to do and perform each and every act and thing requisite and necessary to be done in connection therewith, as fully to all intents and purposes as such person might or could do in person, hereby ratifying and confirming all that said attorneys-in-fact and agents, or any of them, or their or his or her substitute or substitutes, may lawfully do or cause to be done by virtue hereof.
Pursuant to the requirements of the Securities Exchange Act of 1934, this report has been signed by the following persons in the capacities and on the dates indicated:
Signature | Title | Date | ||
/s/ Michael E. Hurlston | Chief Executive Officer (Principal Executive Officer) | June 15, 2018 | ||
Michael E. Hurlston | ||||
/s/ Kurt Adzema | Executive Vice President and Chief Financial Officer (Principal Financial and Accounting Officer) | June 15, 2018 | ||
Kurt Adzema | ||||
/s/ Michael C. Child | Director | June 15, 2018 | ||
Michael C. Child | ||||
/s/ Michael L. Dreyer | Director | June 15, 2018 | ||
Michael L. Dreyer | ||||
/s/ Roger C. Ferguson | Director | June 15, 2018 | ||
Roger C. Ferguson | ||||
/s/ Thomas E. Pardun | Director | June 15, 2018 | ||
Thomas E. Pardun | ||||
/s/ Jerry S. Rawls | Director | June 15, 2018 | ||
Jerry S. Rawls | ||||
/s/ Helene Simonet | Director | June 15, 2018 | ||
Helene Simonet | ||||
/s/ Robert N. Stephens | Chairman of the Board of Directors | June 15, 2018 | ||
Robert N. Stephens | ||||
67
EXHIBIT INDEX | ||
Number | Title | |
68
EXHIBIT INDEX | ||
Number | Title | |
101.INS^ | XBRL Instance Document | |
101.SCH^ | XBRL Taxonomy Extension Schema | |
101.CAL^ | XBRL Taxonomy Extension Calculation Linkbase | |
101.DEF^ | XBRL Taxonomy Extension Definition Linkbase | |
101.LAB^ | XBRL Taxonomy Extension Label Linkbase | |
101.PRE^ | XBRL Taxonomy Extension Presentation Linkbase | |
______________________________________
^ | XBRL information is furnished and not filed for the purposes of Sections 11 and 12 of the Securities Act of 1933 and Section 18 of the Securities Exchange Act of 1934, and is not subject to liability under those sections, is not part of any registration statement or prospectus to which it relates and is not incorporated or deemed to be incorporated by reference into any registration statement, prospectus or other document. |
* | Compensatory plan or management contract |
69
(1) | Incorporated by reference to Exhibit 2.1 to Registrant's Current Report on Form 8-K filed March 28, 2011. |
(2) | Incorporated by reference to Exhibit 3.1 to Registrant’s Current Report on Form 8-K filed December 5, 2014. |
(3) | Incorporated by reference to Exhibit 3.5 to Registrant’s Registration Statement on Form S-1/A filed October 19, 1999 (File No. 333-87017). |
(4) | Incorporated by reference to Exhibit 3.6 to Registrant’s Annual Report on Form 10-K filed July 18, 2001. |
(5) | Incorporated by reference to Exhibit 3.8 to Registrant’s Registration Statement on Form S-3 filed December 18, 2001 (File No. 333-75380). |
(6) | Incorporated by reference to Exhibit 99.2 to Registrant’s Registration Statement on Form 8-A12G filed on September 27, 2002. |
(7) | Incorporated by reference to Exhibit 3.3 to Registrant’s Registration Statement on Form S-3 filed May 18, 2005 (File No. 333-125034). |
(8) | Incorporated by reference to Exhibit 3.8 to Registrant’s Current Report on Form 8-K filed September 28, 2009. |
(9) | Incorporated by reference to Exhibit 3.8 to Registrant’s Annual Report on Form 10-K filed July 1, 2010. |
(10) | Incorporated by reference to the same numbered exhibit to Registrant’s Quarterly Report on Form 10-Q filed December 10, 2009. |
(11) | Incorporated by reference to Exhibit 4.1 to Registrant's Current Report on Form 8-K filed December 16, 2013. |
(12) | Incorporated by reference to Exhibit 4.1 to Registrant’s Current Report on Form 8-K filed December 21, 2016. |
(13) | Incorporated by reference to Exhibit 10.1 to Registrant’s Registration Statement on Form S-1/A filed October 19, 1999 (File No. 333-87017). |
(14) | Incorporated by reference to Exhibit 10.25 to Registrant’s Current Report on Form 8-K filed February 9, 2005. |
(15) | Incorporated by reference to Exhibit 10.1 to Registrant’s Current Report on Form 8-K filed September 8, 2014. |
(16) | Incorporated by reference to Exhibit 10.1 to Registrant’s Current Report on Form 8-K filed June 14, 2005. |
(17) | Incorporated by reference to Exhibit 99.1 to Registrant’s Registration Statement on Form S-8 filed on September 19, 2008. |
(18) | Incorporated by reference to Exhibit 99.2 to Registrant’s Registration Statement on Form S-8 filed on September 19, 2008. |
(19) | Incorporated by reference to Exhibit 10.6 to Optium Corporation’s Quarterly Report on Form 10-Q filed on March 13, 2008. |
(20) | Incorporated by reference to Exhibit 10.2 to Optium Corporation’s Quarterly Report on Form 10-Q filed on December 12, 2006. |
(21) | Incorporated by reference to Exhibit 10.2 to Optium Corporation’s Quarterly Report on Form 10-Q filed on March 7, 2007. |
(22) | Incorporated by reference to Exhibit 10.3 to Optium Corporation’s Quarterly Report on Form 10-Q filed on December 12, 2006. |
(23) | Incorporated by reference to Exhibit 10.4 to Optium Corporation’s Quarterly Report on Form 10-Q filed on December 12, 2006. |
(24) | Incorporated by reference to Exhibit 10.5 to Optium Corporation’s Quarterly Report on Form 10-Q filed on December 12, 2006. |
(25) | Incorporated by reference to Exhibit 10.3 to Optium Corporation’s Quarterly Report on Form 10-Q filed on March 7, 2007. |
(26) | Incorporated by reference to Exhibit 10.1 to Optium Corporation’s Current Report on Form 8-K filed on September 28, 2007. |
(27) | Incorporated by reference to Exhibit 10.3 to Optium Corporation’s Quarterly Report on Form 10-Q filed on December 13, 2007. |
(28) | Incorporated by reference to Exhibit 10.23 to Optium Corporation’s Registration Statement on Form S-1/A (File No.333-135472) filed on October 11, 2006. |
(29) | Incorporated by reference to Exhibit 10.4 to Optium Corporation’s, Quarterly Report on Form 10-Q filed on March 7, 2007. |
(30) | Incorporated by reference to Exhibit 10.5 to Optium Corporation’s Quarterly Report on Form 10-Q filed on March 7, 2007. |
(31) | Incorporated by reference to Exhibit 10.6 to Optium Corporation’s Quarterly Report on Form 10-Q filed on March 7, 2007. |
(32) | Incorporated by reference to Exhibit 10.36 to Optium Corporation’s Annual Report on Form 10-K filed on October 24, 2007. |
(33) | Incorporated by reference to Exhibit 10.38 to Optium Corporation’s Annual Report on Form 10-K filed on October 24, 2007. |
(34) | Incorporated by reference to Exhibit 10.2 to Registrant’s Quarterly Report on Form 10-Q filed March 10, 2011. |
(35) | Incorporated by reference to Exhibit 99.2 to Registrant’s Current Report on Form 8-K filed on January 7, 2009. |
70
(36) | Incorporated by reference to Exhibit 99.3 to Registrant’s Current Report on Form 8-K filed on January 7, 2009. |
(37) | Incorporated by reference to Exhibit 99.4 to Registrant’s Current Report on Form 8-K filed on January 7, 2009. |
(38) | Incorporated by reference to Exhibit 10.61 to Registrant’s Quarterly Report on Form 10-Q filed March 12, 2009. |
(39) | Incorporated by reference to Exhibit 10.1 to Registrant’s Quarterly Report on Form 10-Q filed September 8, 2016. |
(40) | Incorporated by reference to Exhibit 10.63 to Registrant’s Quarterly Report on Form 10-Q filed March 12, 2009. |
(41) | Incorporated by reference to Exhibit 10.64 to Registrant’s Quarterly Report on Form 10-Q filed March 12, 2009. |
(42) | Incorporated by reference to Exhibit 10.32 to Registrant’s Annual Report on Form 10-K filed June 26, 2014. |
(43) | Incorporated by reference to Exhibit 10.2 to Registrant’s Current Report on Form 8-K filed September 8, 2014. |
(44) | Incorporated by reference to Exhibit 10.2 to Registrant’s Quarterly Report on Form 10-Q filed March 8, 2013. |
(45) | Incorporated by reference to Exhibit 10.3 to Registrant’s Quarterly Report on Form 10-Q filed March 8, 2013. |
(46) | Incorporated by reference to Exhibit 10.4 to Registrant’s Quarterly Report on Form 10-Q filed March 8, 2013. |
(47) | Incorporated by reference to Exhibit 10.48 to Registrant’s Annual Report on Form 10-K filed June 24, 2013. |
(48) | Incorporated by reference to Exhibit 10.1 to Registrant’s Quarterly Report on Form 10-Q filed March 10, 2016. |
(49) | Incorporated by reference to Exhibit 10.1 to Registrant’s Quarterly Report on Form 10-Q filed December 5, 2013. |
(50) | Incorporated by reference to Exhibit 10.1 to Registrant’s Quarterly Report on Form 10-Q filed March 6, 2014. |
(51) | Incorporated by reference to Exhibit 10.1 to Registrant’s Quarterly Report on Form 10-Q filed December 10, 2015. |
(52) | Incorporated by reference to Exhibit 10.40 to Registrant’s Annual Report on Form 10-K filed June 16, 2017. |
(53) | Incorporated by reference to Exhibit 10.41 to Registrant’s Annual Report on Form 10-K filed June 16, 2017. |
(54) | Incorporated by reference to Exhibit 10.1 to Registrant’s Quarterly Report on Form 10-Q filed March 8, 2018. |
(55) | Incorporated by reference to Exhibit 10.2 to Registrant’s Quarterly Report on Form 10-Q filed March 8, 2018. |
71