Attached files
| file | filename |
|---|---|
| 8-K - 8-K - FIVE PRIME THERAPEUTICS, INC. | d588733d8k.htm |
Pharmacodynamics and Genomic Profiling of Patients Treated With Cabiralizumab + Nivolumab Provide Evidence of On-Target Tumor Immune Modulations and Support Future Clinical Applications Michael Carleton,1 Janine Powers,2 Penny Phillips,1 Muhammad Beg,3 James Lee,4 Osama Rahma,5 Sarina A. Piha-Paul,6 Ernestine Lee,2 Kevin Hestir,2 Ke Xu,1 Dimple Pandya,1 Sandeep Inamdar,2 Serena Perna,1 Shih-Min A. Huang,1 Zev A. Wainberg7 1Bristol-Myers Squibb, Princeton, NJ; 2FivePrime Therapeutics Inc., South San Francisco, CA; 3The University of Texas Southwestern Medical Center, Dallas, TX; 4University of Pittsburgh Cancer Institute, Pittsburgh, PA; 5Dana-Farber Cancer Institute, Harvard Medical School, Boston, MA; 6The University of Texas MD Anderson Cancer Center, Houston, TX; 7UCLA Medical Center, Los Angeles, CA ASCO, June 4, 2018 Exhibit 99.1
Background Immune checkpoint blockade with anti‒PD-1 therapies has demonstrated durable clinical benefit in patients with advanced malignancies1; however, antitumor responses are often dampened by an immunosuppressive tumor microenvironment (TME)2 Inhibiting signaling pathways that stimulate the development and activity of immunosuppressive cells, including tumor-associated macrophages (TAMs), may improve the antitumor immune response2 Monocytes polarize into M1 macrophages, which support pro-inflammatory, cytotoxic, and antitumor responses, or into M2 macrophages, which promote an anti-inflammatory protumor TME3 In pancreatic and other cancers, high levels of TAMs are associated with poor prognosis4-6
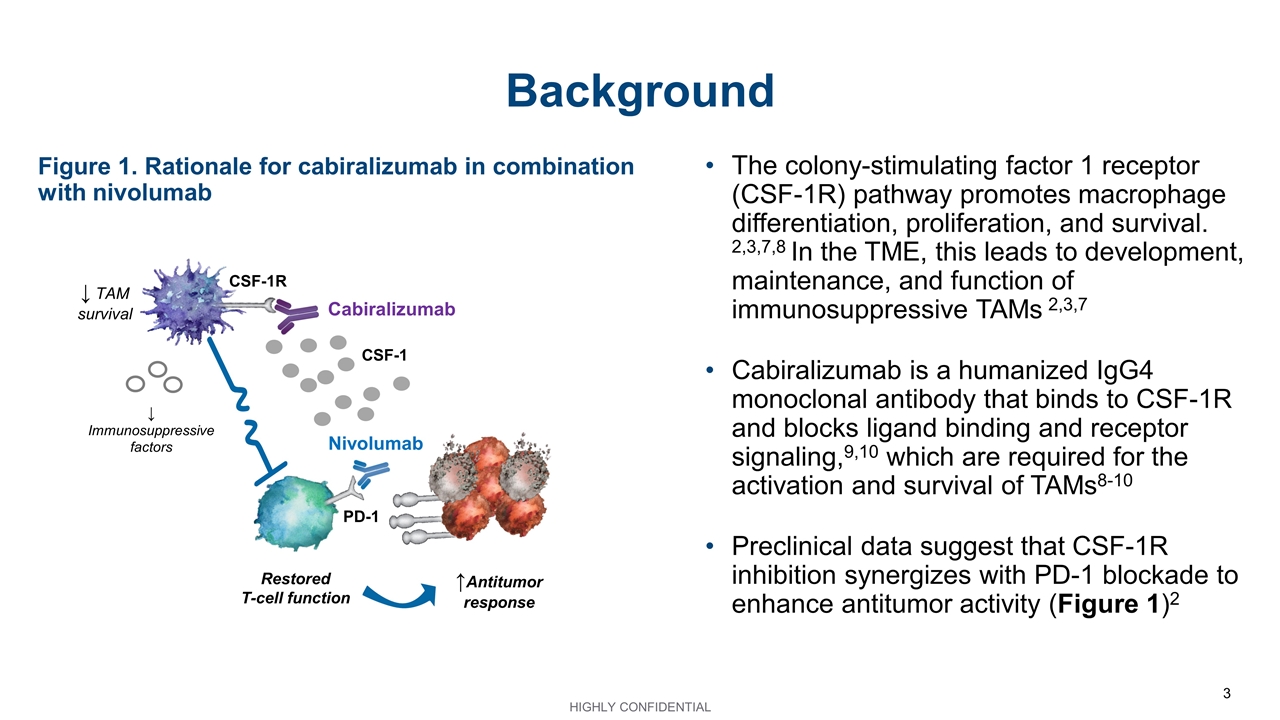
Background The colony-stimulating factor 1 receptor (CSF-1R) pathway promotes macrophage differentiation, proliferation, and survival. 2,3,7,8 In the TME, this leads to development, maintenance, and function of immunosuppressive TAMs 2,3,7 Cabiralizumab is a humanized IgG4 monoclonal antibody that binds to CSF-1R and blocks ligand binding and receptor signaling,9,10 which are required for the activation and survival of TAMs8-10 Preclinical data suggest that CSF-1R inhibition synergizes with PD-1 blockade to enhance antitumor activity (Figure 1)2 CSF-1 PD-1 CSF-1R Cabiralizumab Restored T-cell function Nivolumab ↑Antitumor response ↓ TAM survival ↓ Immunosuppressive factors Figure 1. Rationale for cabiralizumab in combination with nivolumab
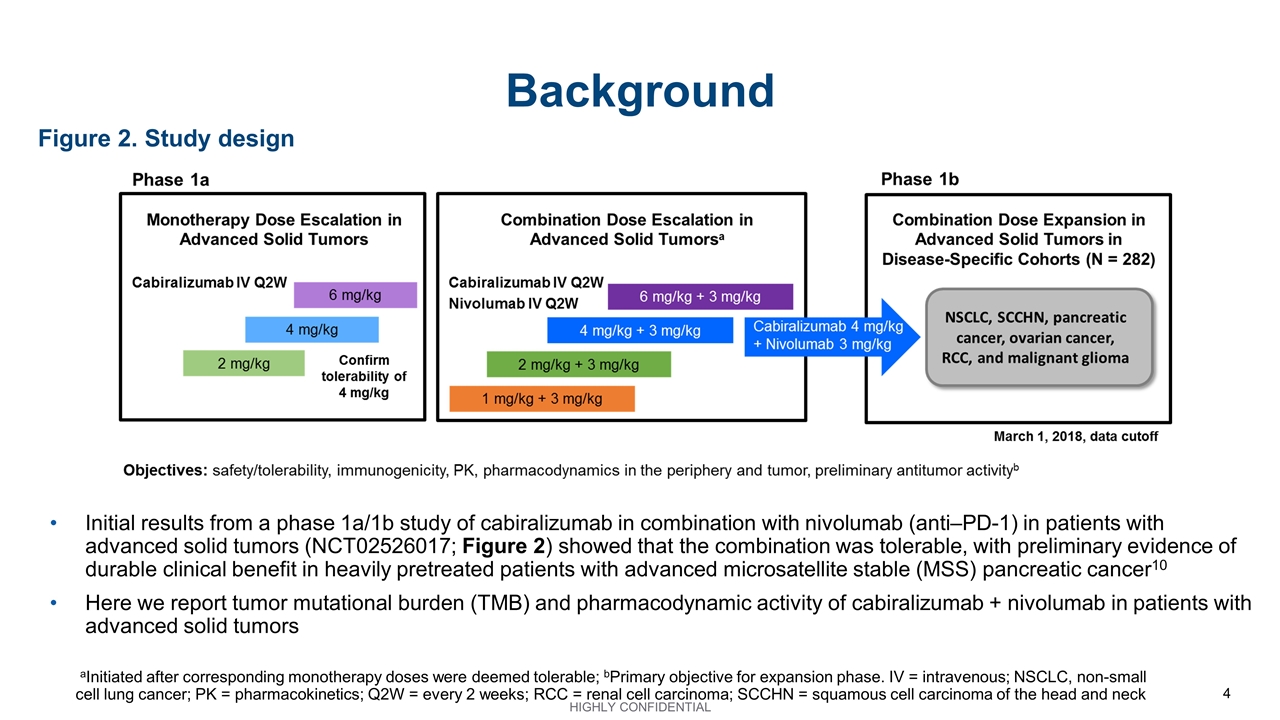
Background Initial results from a phase 1a/1b study of cabiralizumab in combination with nivolumab (anti‒PD-1) in patients with advanced solid tumors (NCT02526017; Figure 2) showed that the combination was tolerable, with preliminary evidence of durable clinical benefit in heavily pretreated patients with advanced microsatellite stable (MSS) pancreatic cancer10 Here we report tumor mutational burden (TMB) and pharmacodynamic activity of cabiralizumab + nivolumab in patients with advanced solid tumors Figure 2. Study design aInitiated after corresponding monotherapy doses were deemed tolerable; bPrimary objective for expansion phase. IV = intravenous; NSCLC, non-small cell lung cancer; PK = pharmacokinetics; Q2W = every 2 weeks; RCC = renal cell carcinoma; SCCHN = squamous cell carcinoma of the head and neck
Methods TMB was measured by whole exome sequencing of archival or fresh biopsy samples from patients treated during dose expansion Changes in peripheral concentrations of CSF-1R ligands (CSF-1 and IL-34) were measured by enzyme-linked immunosorbent assay (ELISA), and changes in nonclassical monocytes (CD14DIMCD16BRIGHT) were measured by flow cytometry Immunohistochemistry and gene expression analysis (RNASeq) were evaluated in pre- and on-treatment (≈ 4 weeks) tumor biopsy samples Analyses were performed using biopsy samples from patients treated with cabiralizumab 4 mg/kg + nivolumab 3 mg/kg every 2 weeks (Q2W) during dose expansion
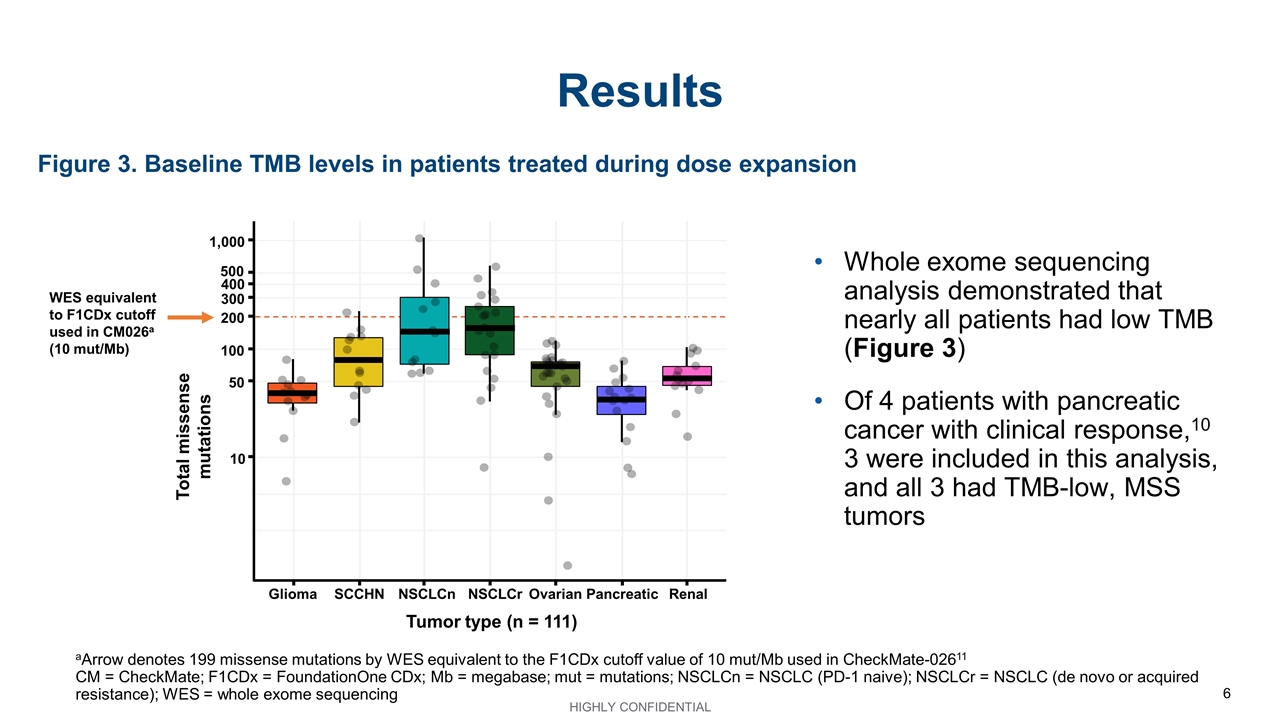
Figure 3. Baseline TMB levels in patients treated during dose expansion Results aArrow denotes 199 missense mutations by WES equivalent to the F1CDx cutoff value of 10 mut/Mb used in CheckMate-02611 CM = CheckMate; F1CDx = FoundationOne CDx; Mb = megabase; mut = mutations; NSCLCn = NSCLC (PD-1 naive); NSCLCr = NSCLC (de novo or acquired resistance); WES = whole exome sequencing Total missense mutations Glioma SCCHN NSCLCn NSCLCr Ovarian Tumor type (n = 111) Pancreatic Renal 1,000 500 400 300 200 100 50 10 WES equivalent to F1CDx cutoff used in CM026a (10 mut/Mb) Whole exome sequencing analysis demonstrated that nearly all patients had low TMB (Figure 3) Of 4 patients with pancreatic cancer with clinical response,10 3 were included in this analysis, and all 3 had TMB-low, MSS tumors
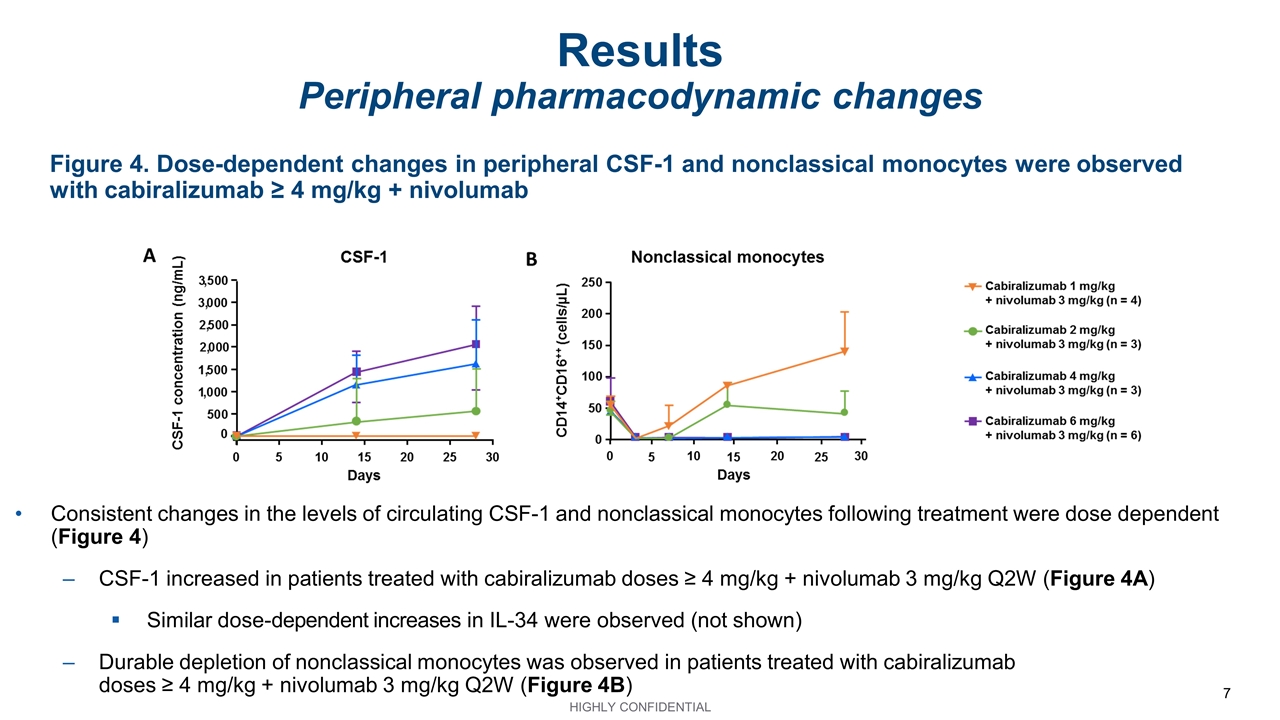
Figure 4. Dose-dependent changes in peripheral CSF-1 and nonclassical monocytes were observed with cabiralizumab ≥ 4 mg/kg + nivolumab Results Peripheral pharmacodynamic changes Consistent changes in the levels of circulating CSF-1 and nonclassical monocytes following treatment were dose dependent (Figure 4) CSF-1 increased in patients treated with cabiralizumab doses ≥ 4 mg/kg + nivolumab 3 mg/kg Q2W (Figure 4A) Similar dose-dependent increases in IL-34 were observed (not shown) Durable depletion of nonclassical monocytes was observed in patients treated with cabiralizumab doses ≥ 4 mg/kg + nivolumab 3 mg/kg Q2W (Figure 4B)
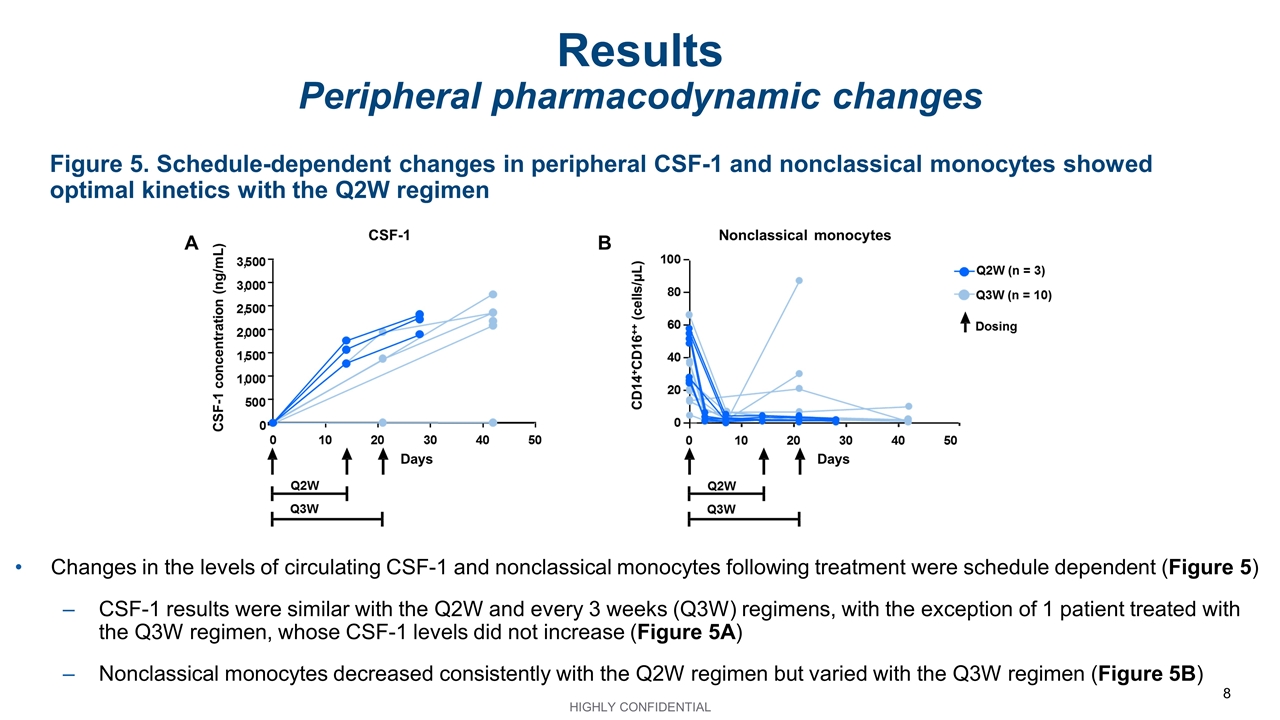
Figure 5. Schedule-dependent changes in peripheral CSF-1 and nonclassical monocytes showed optimal kinetics with the Q2W regimen Results Peripheral pharmacodynamic changes Changes in the levels of circulating CSF-1 and nonclassical monocytes following treatment were schedule dependent (Figure 5) CSF-1 results were similar with the Q2W and every 3 weeks (Q3W) regimens, with the exception of 1 patient treated with the Q3W regimen, whose CSF-1 levels did not increase (Figure 5A) Nonclassical monocytes decreased consistently with the Q2W regimen but varied with the Q3W regimen (Figure 5B)
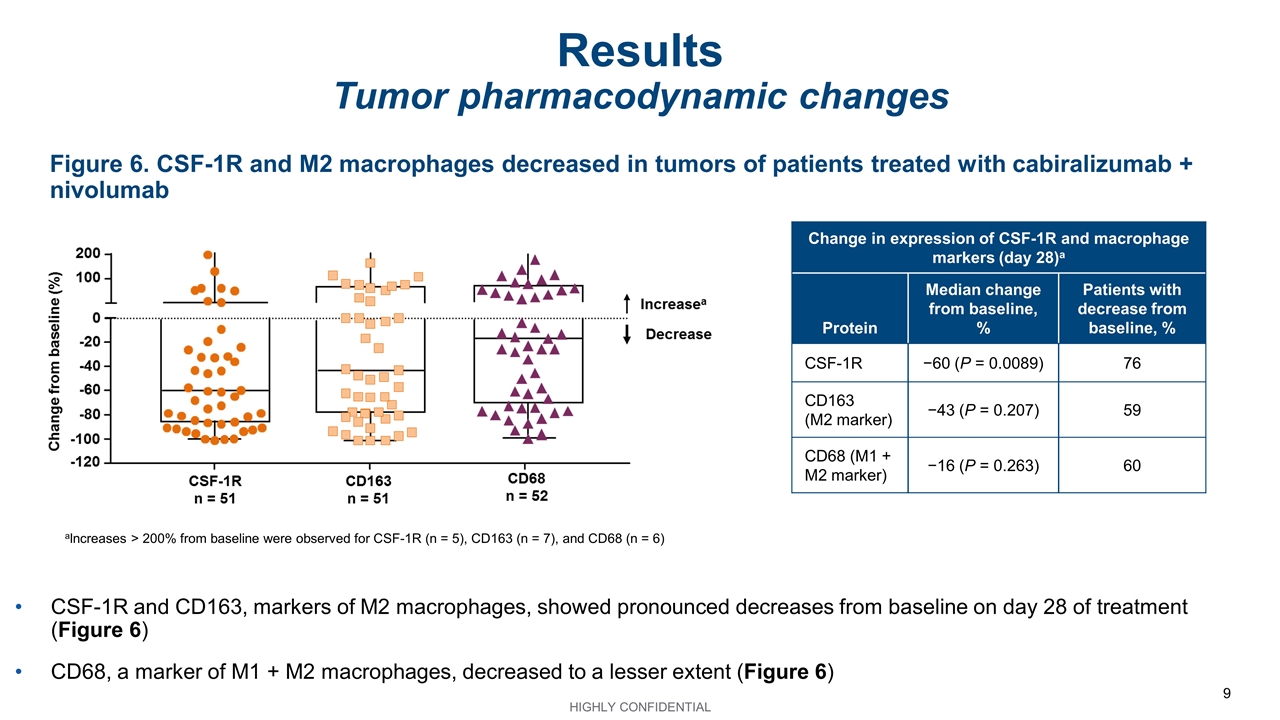
Figure 6. CSF-1R and M2 macrophages decreased in tumors of patients treated with cabiralizumab + nivolumab Results Tumor pharmacodynamic changes aIncreases > 200% from baseline were observed for CSF-1R (n = 5), CD163 (n = 7), and CD68 (n = 6) Change in expression of CSF-1R and macrophage markers (day 28)a Protein Median change from baseline, % Patients with decrease from baseline, % CSF-1R −60 (P = 0.0089) 76 CD163 (M2 marker) −43 (P = 0.207) 59 CD68 (M1 + M2 marker) −16 (P = 0.263) 60 CSF-1R and CD163, markers of M2 macrophages, showed pronounced decreases from baseline on day 28 of treatment (Figure 6) CD68, a marker of M1 + M2 macrophages, decreased to a lesser extent (Figure 6)
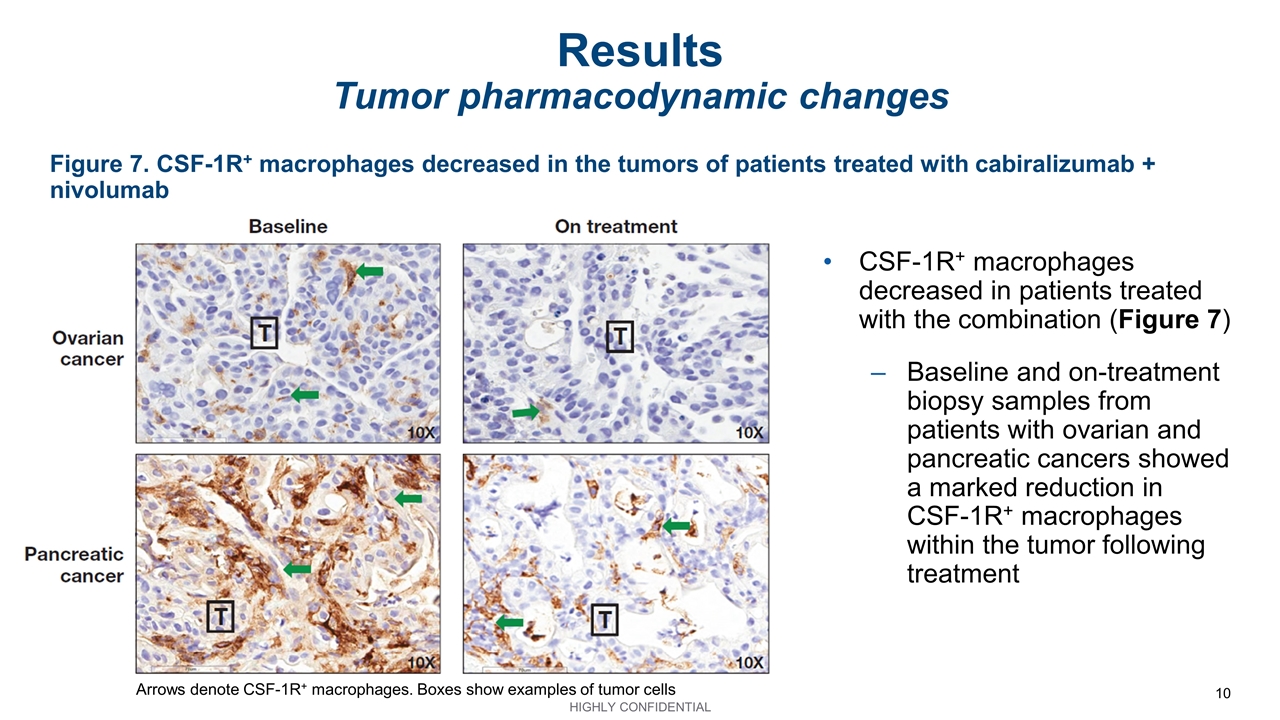
Figure 7. CSF-1R+ macrophages decreased in the tumors of patients treated with cabiralizumab + nivolumab Results Tumor pharmacodynamic changes CSF-1R+ macrophages decreased in patients treated with the combination (Figure 7) Baseline and on-treatment biopsy samples from patients with ovarian and pancreatic cancers showed a marked reduction in CSF-1R+ macrophages within the tumor following treatment Arrows denote CSF-1R+ macrophages. Boxes show examples of tumor cells
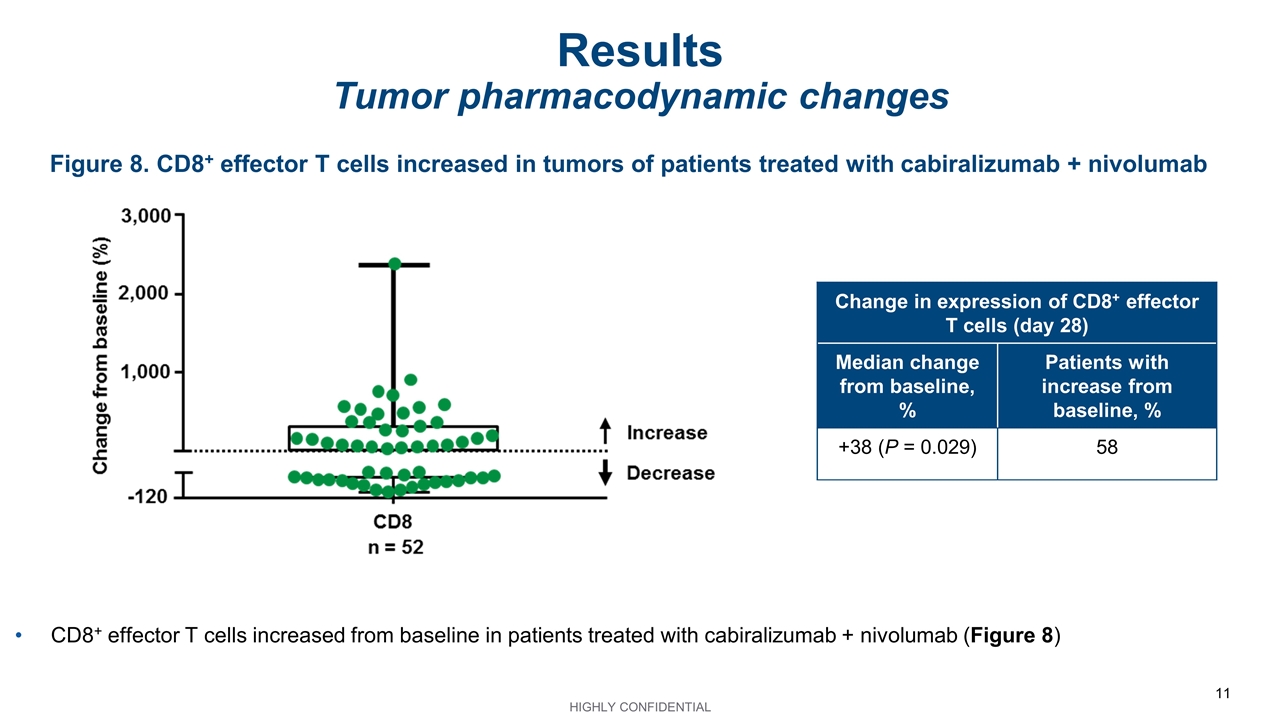
Figure 8. CD8+ effector T cells increased in tumors of patients treated with cabiralizumab + nivolumab Results Tumor pharmacodynamic changes Change in expression of CD8+ effector T cells (day 28) Median change from baseline, % Patients with increase from baseline, % +38 (P = 0.029) 58 CD8+ effector T cells increased from baseline in patients treated with cabiralizumab + nivolumab (Figure 8)
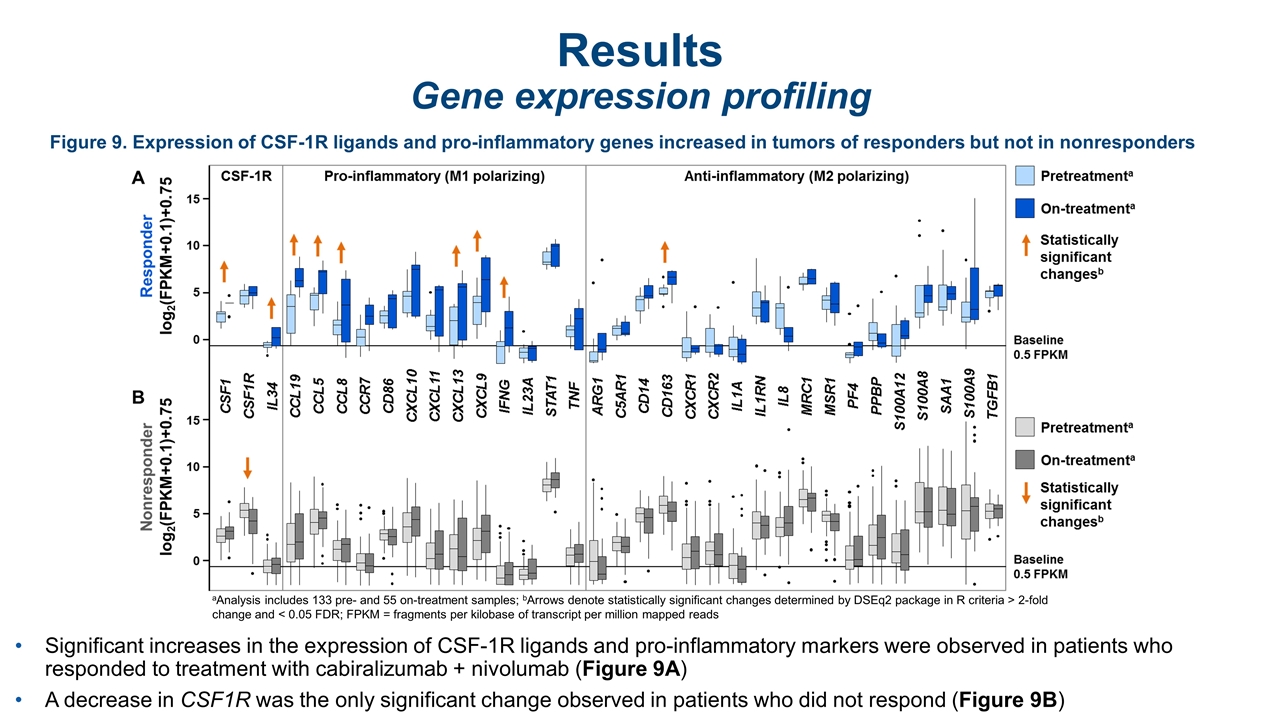
Figure 9. Expression of CSF-1R ligands and pro-inflammatory genes increased in tumors of responders but not in nonresponders Results Gene expression profiling Significant increases in the expression of CSF-1R ligands and pro-inflammatory markers were observed in patients who responded to treatment with cabiralizumab + nivolumab (Figure 9A) A decrease in CSF1R was the only significant change observed in patients who did not respond (Figure 9B) aAnalysis includes 133 pre- and 55 on-treatment samples; bArrows denote statistically significant changes determined by DSEq2 package in R criteria > 2-fold change and < 0.05 FDR; FPKM = fragments per kilobase of transcript per million mapped reads
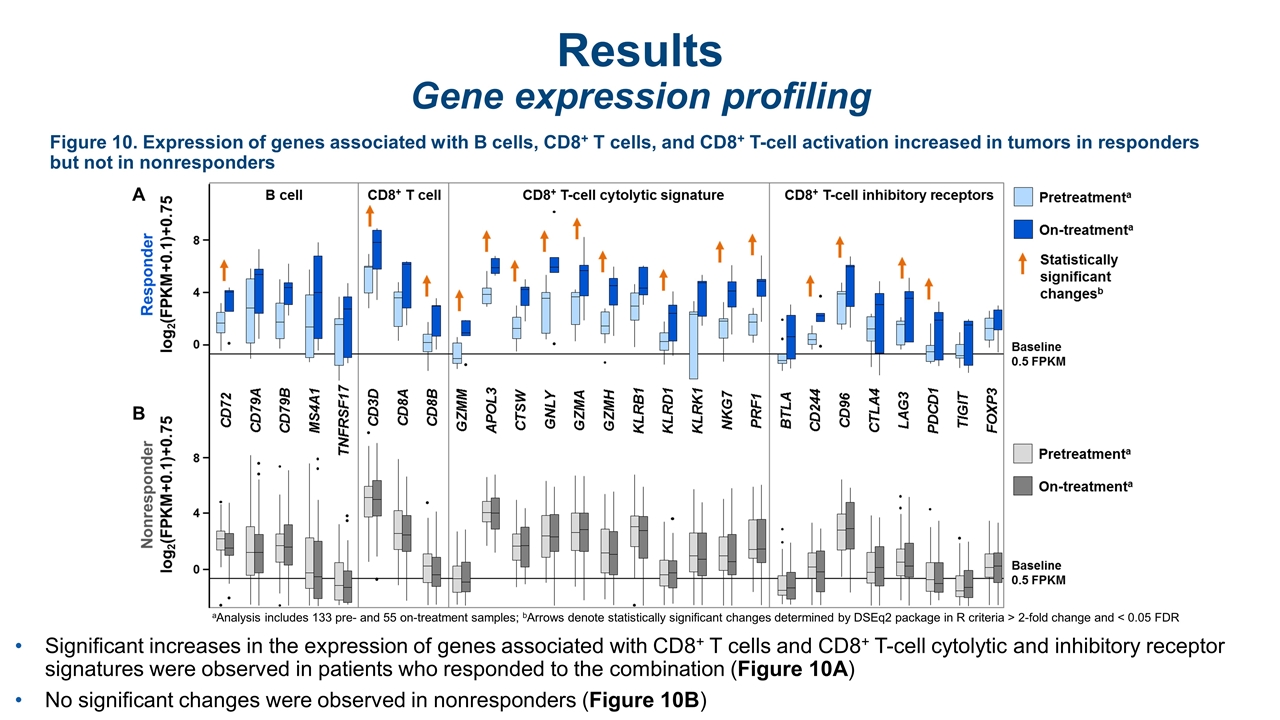
Results Gene expression profiling Significant increases in the expression of genes associated with CD8+ T cells and CD8+ T-cell cytolytic and inhibitory receptor signatures were observed in patients who responded to the combination (Figure 10A) No significant changes were observed in nonresponders (Figure 10B) Figure 10. Expression of genes associated with B cells, CD8+ T cells, and CD8+ T-cell activation increased in tumors in responders but not in nonresponders aAnalysis includes 133 pre- and 55 on-treatment samples; bArrows denote statistically significant changes determined by DSEq2 package in R criteria > 2-fold change and < 0.05 FDR
Conclusions Peripheral- and tumor-based analyses demonstrated cabiralizumab-mediated CSF-1R blockade in the periphery and TME in patients with advanced cancer treated with cabiralizumab 4 mg/kg + nivolumab 3 mg/kg Q2W Circulating CSF-1 increased, and nonclassical monocytes decreased In tumors, CSF-1R and M2 macrophages decreased while CD8+ effector T cells increased Tumor-based pharmacodynamic responses with the combination were consistent with cabiralizumab’s mechanism of action and correlated with increased expression of genes that promote a pro-inflammatory TME Analyses to identify transcriptomic signatures associated with response are ongoing These data, together with preliminary clinical response data observed in patients with TMB-low tumors,10 support further clinical development of cabiralizumab + nivolumab in multiple indications, including pancreatic cancer (NCT03336216)
References Sharma P, et al. Cell 2017;168:707–723. Zhu Y, et al. Cancer Res 2014;74:5057–5069. Chanmee T, et al. Cancers 2014;6:1570‒1690. Hu H, et al. Tumour Biol 2016;37:8657–8664. Kurahara H, et al. J Surg Res 2011;167:e211–e219. Yang L, Zhang Y. J Hematol Oncol 2017;10:58. Cannarile MA, et al. J Immunother Cancer 2017;5:53. Pixley FJ, Stanley ER. Trends Cell Biol 2004;14:628–638. Bellovin D, et al. Cancer Res 2017;77(13 suppl) [abstract 1599]. Wainberg ZA, et al. J Immunother Cancer 2017;5(suppl 3) [abstract O42]. Szustakowski JD, et al. Presented at the AACR 2018 Annual Meeting; April 14−18, 2018; Chicago. Abstract 5528.
