Attached files
| file | filename |
|---|---|
| EX-32.2 - EX-32.2 - FIVE PRIME THERAPEUTICS, INC. | fprx-ex322_8.htm |
| EX-32.1 - EX-32.1 - FIVE PRIME THERAPEUTICS, INC. | fprx-ex321_10.htm |
| EX-31.2 - EX-31.2 - FIVE PRIME THERAPEUTICS, INC. | fprx-ex312_6.htm |
| EX-31.1 - EX-31.1 - FIVE PRIME THERAPEUTICS, INC. | fprx-ex311_7.htm |
UNITED STATES
SECURITIES AND EXCHANGE COMMISSION
WASHINGTON, DC 20549
FORM 10-Q
|
☒ |
QUARTERLY REPORT PURSUANT TO SECTION 13 OR 15(d) OF THE SECURITIES EXCHANGE ACT OF 1934. |
For the quarterly period ended June 30, 2017
or
|
☐ |
TRANSITION REPORTS PURSUANT TO SECTION 13 OR 15(d) OF THE SECURITIES EXCHANGE ACT OF 1934. |
For the transition period from to
Commission File Number: 001-36070
Five Prime Therapeutics, Inc.
(Exact name of registrant as specified in its charter)
|
Delaware |
|
26-0038620 |
|
(State or other jurisdiction of incorporation or organization) |
|
(IRS Employer Identification No.) |
Two Corporate Drive
South San Francisco, California 94080
(415) 365-5600
(Address, including zip code, and telephone number, including area code, of registrant’s principal executive offices)
Indicate by check mark whether the registrant (1) has filed all reports required to be filed by Section 13 or 15(d) of the Securities Exchange Act of 1934 during the preceding 12 months (or for such shorter period that the registrant was required to file such reports), and (2) has been subject to such filing requirements for the past 90 days. Yes ☒ No ☐
Indicate by check mark whether the registrant has submitted electronically and posted on its corporate Web site, if any, every Interactive Data File required to be submitted and posted pursuant to Rule 405 of Regulation S-T (§ 232.405 of this chapter) during the preceding 12 months (or for such shorter period that the registrant was required to submit and post such files). Yes ☒ No ☐
Indicate by check mark whether the registrant is a large accelerated filer, an accelerated filer, a non-accelerated filer, a smaller reporting company, or an emerging growth company. See the definitions of “large accelerated filer,” “accelerated filer,” “smaller reporting company,” and “emerging growth company” in Rule 12b-2 of the Exchange Act.:
|
Large accelerated filer |
|
☒ |
|
Accelerated filer |
|
☐ |
|
|
|
|
|
|||
|
Non-accelerated filer |
|
☐ (Do not check if a smaller reporting company) |
|
Smaller reporting company |
|
☐ |
|
|
|
|
|
|||
|
Emerging growth company |
|
☐ |
|
|
|
|
If an emerging growth company, indicate by check mark if the registrant has elected not to use the extended transition period for complying with any new or revised financial accounting standards provided pursuant to Section 13(a) of the Exchange Act. ☐
Indicate by check mark whether the registrant is a shell company (as defined in Exchange Act Rule 12b-2) Yes ☐ No ☒
As of August 1, 2017, the number of outstanding shares of the registrant’s common stock was 28,902,102.
|
PART I. |
|
|
4 |
|||
|
|
|
Item 1. |
|
|
4 |
|
|
|
|
|
|
Condensed Balance Sheets as of June 30, 2017 and December 31, 2016 |
|
4 |
|
|
|
|
|
Condensed Statements of Operations for the Three and Six Months Ended June 30, 2017 and 2016 |
|
5 |
|
|
|
|
|
Condensed Statements of Comprehensive Loss for the Three and Six Months Ended June 30, 2017 and 2016 |
|
6 |
|
|
|
|
|
Condensed Statements of Cash Flows for the Six Months Ended June 30, 2017 and 2016 |
|
7 |
|
|
|
|
|
|
|
8 |
|
|
|
Item 2. |
|
Management’s Discussion and Analysis of Financial Condition and Results of Operations |
|
14 |
|
|
|
Item 3. |
|
|
|
24 |
|
|
|
Item 4. |
|
|
|
24 |
|
PART II. |
|
|
|
25 |
||
|
|
|
Item 1. |
|
|
|
25 |
|
|
|
Item 1A. |
|
|
|
25 |
|
|
|
Item 6. |
|
|
|
48 |
|
|
|
|
|
|
|
49 |
|
|
|
|
|
|
|
50 |
In this report, unless otherwise stated or the context otherwise indicates, references to “Five Prime,” “the company,” “we,” “us,” “our” and similar references refer to Five Prime Therapeutics, Inc. The Five Prime logo and RIPPS® are our registered trademarks. This report also contains registered marks, trademarks and trade names of other companies. All other trademarks, registered marks and trade names appearing in this report are the property of their respective holders.
2
SPECIAL NOTE REGARDING FORWARD-LOOKING STATEMENTS AND INDUSTRY DATA
This Quarterly Report on Form 10-Q contains forward-looking statements. In some cases you can identify these statements by forward-looking words such as “believe,” “may,” “will,” “estimate,” “continue,” “anticipate,” “intend,” “could,” “would,” “project,” “plan,” “expect,” or similar expressions, or the negative or plural of these words or expressions. These forward-looking statements include statements concerning the following:
|
|
• |
our estimates regarding our expenses, revenues, anticipated capital requirements and our needs for additional financing; |
|
|
• |
our receipt of future milestone payments and/or royalties, and the timing of such payments; |
|
|
• |
our or our partners’ ability to timely advance drug candidates into and through clinical data readouts and successful completion of clinical trials; |
|
|
• |
the timing of the initiation, progress and results of preclinical studies and research and development programs; |
|
|
• |
our expectations regarding the potential safety, efficacy or clinical utility of our product candidates; |
|
|
• |
the implementation, timing and likelihood of success of our plans to develop companion diagnostics for our product candidates; |
|
|
• |
our ability to establish and maintain collaborations and necessary licenses; |
|
|
• |
the implementation of our business model and strategic plans for our business, product candidates and technology; |
|
|
• |
the scope of protection we establish and maintain for intellectual property rights covering our product candidates and technology; |
|
|
• |
the size of patient populations targeted by products we or our partners develop and market adoption of such products by physicians and patients; |
|
|
• |
the timing or likelihood of regulatory filings and approvals; |
|
|
• |
the ability to negotiate adequate reimbursement and pricing for our drug candidates by third parties and government authorities; |
|
|
• |
developments relating to our competitors and our industry; and |
|
|
• |
our expectations regarding licensing, acquisitions and strategic operations. |
These statements are only current predictions and are subject to known and unknown risks, uncertainties and other factors that may cause our or our industry’s actual results, levels of activity, performance or achievements to be materially different from those anticipated by the forward-looking statements. We discuss many of these risks in this report in greater detail under the heading “Risk Factors” and elsewhere in this report. You should not rely upon forward-looking statements as predictions of future events.
Although we believe that the expectations reflected in the forward-looking statements are reasonable, we cannot guarantee future results, levels of activity, performance or achievements. Except as required by law, we are under no duty to update or revise any of the forward-looking statements, whether as a result of new information, future events or otherwise, after the date of this report.
We obtained the industry, market and competitive position data in this quarterly report from our own internal estimates and research as well as from industry and general publications and research surveys and studies conducted by third parties. While we believe that each of these studies and publications is reliable, we have not independently verified market and industry data from third-party sources. While we believe our internal company research is reliable and the market definitions we use are appropriate, neither such research nor these definitions have been verified by any independent source.
3
FIVE PRIME THERAPEUTICS, INC.
(In thousands)
|
|
June 30, |
|
|
December 31, |
|
||
|
|
2017 |
|
|
2016 |
|
||
|
Assets |
|
|
|
|
|
|
|
|
Current assets: |
|
|
|
|
|
|
|
|
Cash and cash equivalents |
$ |
59,709 |
|
|
$ |
7,653 |
|
|
Marketable securities |
|
291,009 |
|
|
|
414,095 |
|
|
Receivables from collaborative partners |
|
3,832 |
|
|
|
3,959 |
|
|
Income tax receivable |
|
— |
|
|
|
4,670 |
|
|
Prepaid and other current assets |
|
8,754 |
|
|
|
9,748 |
|
|
Total current assets |
|
363,304 |
|
|
|
440,125 |
|
|
Restricted cash |
|
1,543 |
|
|
|
1,543 |
|
|
Property and equipment, net |
|
15,227 |
|
|
|
6,207 |
|
|
Other long-term assets |
|
37 |
|
|
|
406 |
|
|
Total assets |
$ |
380,111 |
|
|
$ |
448,281 |
|
|
Liabilities and stockholders' equity |
|
|
|
|
|
|
|
|
Current liabilities: |
|
|
|
|
|
|
|
|
Accounts payable |
$ |
1,321 |
|
|
$ |
334 |
|
|
Accrued personnel-related expenses |
|
5,377 |
|
|
|
7,957 |
|
|
Other accrued liabilities |
|
15,113 |
|
|
|
15,435 |
|
|
Deferred revenue, current portion |
|
13,325 |
|
|
|
14,150 |
|
|
Deferred rent, current portion |
|
433 |
|
|
|
865 |
|
|
Total current liabilities |
|
35,569 |
|
|
|
38,741 |
|
|
Deferred revenue, long-term portion |
|
12,033 |
|
|
|
17,856 |
|
|
Deferred rent, long-term portion |
|
1,812 |
|
|
|
— |
|
|
Other long-term liabilities |
|
7,423 |
|
|
|
109 |
|
|
Commitments |
|
|
|
|
|
|
|
|
Stockholders' equity: |
|
|
|
|
|
|
|
|
Common stock, $0.001 par value; 100,000,000 shares authorized, 28,804,182 issued and 27,985,692 outstanding at June 30, 2017. 28,550,006 issued and 27,509,077 outstanding at December 31, 2016 |
|
28 |
|
|
|
27 |
|
|
Additional paid-in capital |
|
406,664 |
|
|
|
396,635 |
|
|
Accumulated other comprehensive loss |
|
(304 |
) |
|
|
(39 |
) |
|
Accumulated deficit |
|
(83,114 |
) |
|
|
(5,048 |
) |
|
Total stockholders' equity |
|
323,274 |
|
|
|
391,575 |
|
|
Total liabilities and stockholders' equity |
$ |
380,111 |
|
|
$ |
448,281 |
|
The accompanying notes are an integral part of these unaudited condensed financial statements.
4
Condensed Statements of Operations
(In thousands, except per share amounts)
|
|
Three Months Ended |
|
|
Six Months Ended |
|
||||||||||
|
|
June 30, |
|
|
June 30, |
|
||||||||||
|
|
2017 |
|
|
2016 |
|
|
2017 |
|
|
2016 |
|
||||
|
Collaboration revenue |
$ |
7,822 |
|
|
$ |
9,229 |
|
|
$ |
17,957 |
|
|
$ |
15,749 |
|
|
Operating expenses: |
|
|
|
|
|
|
|
|
|
|
|
|
|
|
|
|
Research and development |
|
41,744 |
|
|
|
22,177 |
|
|
|
75,504 |
|
|
|
41,033 |
|
|
General and administrative |
|
9,363 |
|
|
|
8,106 |
|
|
|
19,849 |
|
|
|
16,163 |
|
|
Total operating expenses |
|
51,107 |
|
|
|
30,283 |
|
|
|
95,353 |
|
|
|
57,196 |
|
|
Loss from operations |
|
(43,285 |
) |
|
|
(21,054 |
) |
|
|
(77,396 |
) |
|
|
(41,447 |
) |
|
Interest and other income, net |
|
702 |
|
|
|
646 |
|
|
|
1,370 |
|
|
|
1,182 |
|
|
Loss before income tax |
|
(42,583 |
) |
|
|
(20,408 |
) |
|
|
(76,026 |
) |
|
|
(40,265 |
) |
|
Income tax (provision) benefit |
|
(1,703 |
) |
|
|
7,271 |
|
|
|
(1,703 |
) |
|
|
14,088 |
|
|
Net loss |
$ |
(44,286 |
) |
|
$ |
(13,137 |
) |
|
$ |
(77,729 |
) |
|
$ |
(26,177 |
) |
|
Basic and diluted net loss per common share |
$ |
(1.58 |
) |
|
$ |
(0.49 |
) |
|
$ |
(2.79 |
) |
|
$ |
(0.98 |
) |
|
Weighted-average shares used to compute basic and diluted net loss per common share |
|
27,946 |
|
|
|
26,924 |
|
|
|
27,813 |
|
|
|
26,619 |
|
The accompanying notes are an integral part of these unaudited condensed financial statements.
5
Condensed Statements of Comprehensive Loss
(In thousands)
|
|
Three Months Ended |
|
|
Six Months Ended |
|
||||||||||
|
|
June 30, |
|
|
June 30, |
|
||||||||||
|
|
2017 |
|
|
2016 |
|
|
2017 |
|
|
2016 |
|
||||
|
Net loss |
$ |
(44,286 |
) |
|
$ |
(13,137 |
) |
|
$ |
(77,729 |
) |
|
$ |
(26,177 |
) |
|
Other comprehensive income (loss): |
|
|
|
|
|
|
|
|
|
|
|
|
|
|
|
|
Net unrealized gain (loss) on marketable securities, net of tax |
|
(60 |
) |
|
|
109 |
|
|
|
(265 |
) |
|
|
293 |
|
|
Comprehensive loss |
$ |
(44,346 |
) |
|
$ |
(13,028 |
) |
|
$ |
(77,994 |
) |
|
$ |
(25,884 |
) |
The accompanying notes are an integral part of these unaudited condensed financial statements.
6
Condensed Statements of Cash Flows
(In thousands)
|
|
Six Months Ended |
|
|||||
|
|
June 30, |
|
|||||
|
|
2017 |
|
|
2016 |
|
||
|
Operating activities |
|
|
|
|
|
|
|
|
Net loss |
$ |
(77,729 |
) |
|
$ |
(26,177 |
) |
|
Adjustments to reconcile net loss to net cash used in operating activities: |
|
|
|
|
|
|
|
|
Depreciation and amortization |
|
1,112 |
|
|
|
782 |
|
|
Stock-based compensation expense |
|
19,648 |
|
|
|
14,527 |
|
|
Excess tax benefits from employee equity incentive plans |
|
— |
|
|
|
(2,533 |
) |
|
Deferred income taxes |
|
— |
|
|
|
3,451 |
|
|
Amortization of premiums and discounts on marketable securities |
|
1,223 |
|
|
|
2,346 |
|
|
Loss (gain) on disposal of property and equipment |
|
2 |
|
|
|
(9 |
) |
|
Changes in operating assets and liabilities: |
|
|
|
|
|
|
|
|
Receivables from collaborative partners |
|
127 |
|
|
|
655 |
|
|
Income tax receivable |
|
4,670 |
|
|
|
(1,504 |
) |
|
Prepaid, other current assets, and other long-term assets |
|
1,363 |
|
|
|
770 |
|
|
Accounts payable |
|
987 |
|
|
|
(1,240 |
) |
|
Accrued personnel-related expenses |
|
(2,580 |
) |
|
|
(2,863 |
) |
|
Deferred revenue |
|
(6,648 |
) |
|
|
(8,618 |
) |
|
Deferred rent |
|
1,185 |
|
|
|
(383 |
) |
|
Income tax payable |
|
— |
|
|
|
(30,580 |
) |
|
Other accrued liabilities and other long-term liabilities |
|
(377 |
) |
|
|
2,210 |
|
|
Net cash used in operating activities |
|
(57,017 |
) |
|
|
(49,166 |
) |
|
Investing activities |
|
|
|
|
|
|
|
|
Purchases of marketable securities |
|
(220,652 |
) |
|
|
(339,880 |
) |
|
Maturities of marketable securities |
|
342,250 |
|
|
|
274,250 |
|
|
Purchases of property and equipment |
|
(2,581 |
) |
|
|
(1,868 |
) |
|
Proceeds from disposal of property and equipment |
|
12 |
|
|
|
— |
|
|
Net cash provided by (used in) investing activities |
|
119,029 |
|
|
|
(67,498 |
) |
|
Financing activities |
|
|
|
|
|
|
|
|
Proceeds from issuance of common stock under equity incentive plans |
|
2,230 |
|
|
|
5,916 |
|
|
Repurchase of shares to satisfy tax withholding obligations |
|
(12,186 |
) |
|
|
(3,602 |
) |
|
Excess tax benefits from employee equity incentive plans |
|
— |
|
|
|
2,533 |
|
|
Net cash (used in) provided by financing activities |
|
(9,956 |
) |
|
|
4,847 |
|
|
Net increase (decrease) in cash and cash equivalents |
|
52,056 |
|
|
|
(111,817 |
) |
|
Cash and cash equivalents at beginning of period |
|
7,653 |
|
|
|
149,971 |
|
|
Cash and cash equivalents at end of period |
$ |
59,709 |
|
|
$ |
38,154 |
|
|
|
|
|
|
|
|
|
|
|
Supplemental cash flow information |
|
|
|
|
|
|
|
|
Cash paid for income taxes |
$ |
— |
|
|
$ |
14,701 |
|
|
|
|
|
|
|
|
|
|
|
Non-cash investing activities |
|
|
|
|
|
|
|
|
Unpaid property and equipment purchases included in accrued liabilities |
$ |
403 |
|
|
$ |
— |
|
|
Tenant improvements provided by the landlord |
$ |
8,291 |
|
|
$ |
— |
|
The accompanying notes are an integral part of these unaudited condensed financial statements.
7
Notes to Condensed Financial Statements
June 30, 2017
|
1. |
Description of Business |
Five Prime Therapeutics, Inc. (we, us, our, or the Company) is a clinical-stage biotechnology company focused on discovering and developing innovative protein therapeutics. We were incorporated in December 2001 in Delaware. Our operations are based in South San Francisco, California and we operate in one segment.
Unaudited Interim Financial Information
The accompanying financial information as of June 30, 2017 is unaudited. The condensed financial statements included in this report reflect all adjustments (consisting only of normal recurring adjustments) that our management considers necessary for the fair statement of the results of operations for the interim periods covered and of the financial condition of the Company at the date of the interim balance sheet. The accompanying unaudited condensed consolidated financial statements have been prepared in accordance with U.S. generally accepted accounting principles, or GAAP, for interim financial information. Accordingly, they do not include all of the information and notes required by GAAP for complete financial statements. The results for interim periods are not necessarily indicative of the results for the entire year or any other interim period. The accompanying condensed financial statements and related financial information should be read in conjunction with the audited financial statements and the related notes thereto included in the Company’s Annual Report on Form 10-K for the year ended December 31, 2016 filed with the U.S. Securities and Exchange Commission.
|
2. |
Summary of Significant Accounting Policies |
Use of Estimates
The preparation of financial statements in conformity with GAAP requires management to make estimates and assumptions about future events that affect the amounts reported in the financial statements and accompanying notes. Actual results could differ materially from those estimates.
Fair Value of Financial Instruments
We determine the fair value of financial and nonfinancial assets and liabilities using the fair value hierarchy, which describes three levels of inputs that may be used to measure fair value, as follows:
Level 1—Quoted prices in active markets for identical assets or liabilities;
Level 2—Observable inputs other than Level 1 prices such as quoted prices for similar assets or liabilities, quoted prices for identical or similar assets or liabilities in markets that are not active, or other inputs that are observable or can be corroborated by observable market data for substantially the full term of the assets or liabilities; and
Level 3—Unobservable inputs that are supported by little or no market activity and that are significant to the fair value of the assets or liabilities.
We determine the fair value of Level 1 assets using quoted prices in active markets for identical assets. We review trading activity and pricing for Level 2 investments as of each measurement date. Level 2 inputs, which are obtained from various third-party data providers, represent quoted prices for similar assets in active markets and were derived from observable market data, or, if not directly observable, were derived from or corroborated by other observable market data. There were no transfers between Level 1 and Level 2 securities in the periods presented.
In certain cases where there is limited activity or less transparency around inputs to valuation, we classify securities as Level 3 within the valuation hierarchy. We do not have any assets or liabilities measured using Level 3 inputs as of June 30, 2017.
8
The following table summarizes our financial instruments that were measured at fair value on a recurring basis by level of input within the fair value hierarchy defined above (in thousands):
|
|
June 30, 2017 |
|
|||||||||||||
|
|
|
|
|
|
Basis of Fair Value |
|
|||||||||
|
|
|
|
|
|
Measurements |
|
|||||||||
|
|
Total |
|
|
Level 1 |
|
|
Level 2 |
|
|
Level 3 |
|
||||
|
Assets |
|
|
|
|
|
|
|
|
|
|
|
|
|
|
|
|
Money market funds |
$ |
44,600 |
|
|
$ |
44,600 |
|
|
$ |
— |
|
|
$ |
— |
|
|
U.S. Treasury securities |
|
291,009 |
|
|
|
291,009 |
|
|
|
— |
|
|
|
— |
|
|
Certificate of deposit |
|
1,543 |
|
|
|
— |
|
|
|
1,543 |
|
|
|
— |
|
|
Total cash equivalents and marketable securities |
$ |
337,152 |
|
|
$ |
335,609 |
|
|
$ |
1,543 |
|
|
$ |
— |
|
|
|
December 31, 2016 |
|
|||||||||||||
|
|
|
|
|
|
Basis of Fair Value |
|
|||||||||
|
|
|
|
|
|
Measurements |
|
|||||||||
|
|
Total |
|
|
Level 1 |
|
|
Level 2 |
|
|
Level 3 |
|
||||
|
Assets |
|
|
|
|
|
|
|
|
|
|
|
|
|
|
|
|
Money market funds |
$ |
432 |
|
|
$ |
432 |
|
|
$ |
— |
|
|
$ |
— |
|
|
U.S. Treasury securities |
|
414,095 |
|
|
|
414,095 |
|
|
|
— |
|
|
|
— |
|
|
Certificate of deposit |
|
1,543 |
|
|
|
— |
|
|
|
1,543 |
|
|
|
— |
|
|
Total cash equivalents and marketable securities |
$ |
416,070 |
|
|
$ |
414,527 |
|
|
$ |
1,543 |
|
|
$ |
— |
|
Net Loss Per Share of Common Stock
We compute basic net loss per common share by dividing net loss attributable to common stockholders by the weighted-average number of shares of common stock outstanding during the period.
We excluded the following securities from the calculation of diluted net loss per share as the effect would have been antidilutive (in thousands):
|
|
Three Months Ended |
|
|
Six Months Ended |
|
||||||||||
|
|
June 30, |
|
|
June 30, |
|
||||||||||
|
|
2017 |
|
|
2016 |
|
|
2017 |
|
|
2016 |
|
||||
|
Options to purchase common stock |
|
3,879 |
|
|
|
2,561 |
|
|
|
3,796 |
|
|
|
2,739 |
|
|
Restricted stock awards (RSAs) |
|
834 |
|
|
|
1,319 |
|
|
|
940 |
|
|
|
1,412 |
|
|
|
|
4,713 |
|
|
|
3,880 |
|
|
|
4,736 |
|
|
|
4,151 |
|
9
Accounting Pronouncements Adopted in 2017
In March 2016, the Financial Accounting Standards Board, or FASB, issued Accounting Standards Update, or ASU, 2016-09, Improvements to Employee Share-Based Payment Accounting, to simplify certain aspects of the accounting for share-based payment transactions to employees. The new standard requires excess tax benefits and tax deficiencies to be recorded as a component of the provision for income taxes in a company’s statements of income when stock awards vest or are settled. In addition, it eliminates the requirement to reclassify cash flows related to excess tax benefits from operating activities to financing activities on the consolidated statements of cash flows. The standard also provides an accounting policy election to account for forfeitures as they occur, allowing a company to withhold more of an employee’s vesting shares for tax withholding purposes without triggering liability accounting, and clarifies that all cash payments made to tax authorities on an employee’s behalf for withheld shares should be presented as a financing activity on a company’s cash flows statement. We adopted ASU 2016-09 as of January 1, 2017. Starting in the first quarter of 2017, we reflected excess tax benefits or deficiencies from share-based award activity in the consolidated statements of income as a component of the provision for income taxes, whereas we previously recognized them in equity. We have not adjusted prior periods. In addition, we adopted the aspects of the standard affecting the cash flow presentation prospectively. We will include the cash flow related to excess tax benefits within the operating activities. The presentation requirements for cash flows related to employee taxes paid for withheld shares has no impact on our consolidated statements of cash flows since such cash flows have historically been presented as a financing activity. Finally, we elected to account for forfeitures as they occur, rather than estimate expected forfeitures, on a modified retrospective basis. Our adoption of ASU 2016-09 resulted in a $337,000 decrease to retained earnings as of January 1, 2017 to record the additional stock compensation expense due to the elimination of the estimated forfeiture rate and a $3.1 million increase to deferred tax assets which is fully offset by a valuation allowance because we determined that it is more likely than not that the deferred tax asset will not be fully realized.
Accounting Pronouncements Not Yet Adopted
In May 2014, FASB issued ASU 2014-09, Revenue from Contracts with Customers: Topic 606, to supersede nearly all existing revenue recognition guidance under GAAP. The core principle of ASU 2014-09 is to recognize revenues when promised goods or services are transferred to customers in an amount that reflects the consideration that is expected to be received for those goods or services. ASU 2014-09 defines a five-step process to achieve this core principle and, in doing so, it is possible more judgment and estimates may be required within the revenue recognition process than are required under existing GAAP, including identifying performance obligations in a contract, estimating the amount of variable consideration to include in the transaction price and allocating the transaction price to each separate performance obligation. ASU 2014-09 will become effective for us in our first quarter of 2018 using either of two methods: (i) retrospective application of ASU 2014-09 to each prior reporting period presented with the option to elect certain practical expedients as defined within ASU 2014-09; or (ii) modified retrospective application of ASU 2014-09 with the cumulative effect of initially applying ASU 2014-09 recognized at the date of initial application and providing certain additional disclosures as defined per ASU 2014-09. In March, April, May and December 2016, the FASB issued ASU 2016-08, Revenue from Contracts with Customers: Principal versus Agent Considerations, ASU 2016-10, Revenue from Contracts with Customers: Identifying Performance Obligations and Licensing, ASU 2016-12, Revenue from Contracts with Customers: Narrow-Scope Improvements and Practical Expedients to provide supplemental adoption guidance and clarification to ASU 2014-09 and ASU 2016-20, Technical Corrections and Improvements to Topic 606, Revenue from Contracts with Customers, respectively. The effective date for these new standards is the same as the effective date and transition requirements for ASU 2014-09. We expect to adopt ASU 2014-09 in the first quarter of 2018 using the modified retrospective method.
Our adoption of ASU 2014-09 may have a material effect on our financial statements. To date, we have derived our revenues from license and collaboration agreements. The consideration we are eligible to receive under these agreements includes upfront payments, research and development funding, milestone payments and royalties. Each license and collaboration agreement is unique and will need to be assessed separately under the five-step process set forth in under the new standard. We are currently assessing our active license and collaboration agreements. We expect that our evaluation of the accounting for license and collaboration agreements under the new revenue standard could identify material changes from the current accounting treatment. ASU 2014-09 differs from the current accounting standard in many respects, such as in the accounting for variable consideration, including milestone payments. Under our current accounting policy, we recognize milestone revenue using the milestone method specified in ASC 605-28, which generally results in the recognition of the milestone payment as revenue in the period that the milestone is achieved. However, under the new accounting standard, it is possible to start to recognize milestone revenue before the milestone is achieved, subject to management’s assessment of whether it is probable that a significant reversal in the amount of cumulative revenue recognized will not occur when the uncertainty associated with the variable consideration is subsequently resolved. In addition, the current accounting standards include a presumption that revenue from up-front non-refundable fees would be recognized ratably over the performance period, unless another attribution method was determined to more closely approximate the delivery of the goods or services to the customer. The new accounting standard does not have a presumption that entities would default to a ratable attribution approach and will require entities to determine an appropriate attribution method using either output or input methods. As such, the amount and timing of revenue recognition for our license and collaboration agreements may change under the new revenue standard.
10
In February 2016, FASB issued ASU 2016-02, Leases, which amends existing guidance to require substantially all leases be recognized by lessees on their balance sheet as a right-of-use asset and corresponding lease liability, including leases currently accounted for as operating leases. ASU 2016-02 will become effective for our interim and annual reporting periods during the year ending December 31, 2019 and will apply to all annual and interim reporting periods thereafter. Early adoption is permitted. Under the new standard, we expect to record a right-to-use lease asset and a lease liability on our balance sheet. Under the new standard, we expect to recognize expense on our statement of operations in a manner similar to the current accounting standard.
In May 2017, FASB issued ASU 2017-09, Compensation-Stock Compensation (Topic 718) – Scope of Modification Accounting, which amends the scope of modification accounting for share-based payment arrangements. Specifically, an entity would not apply modification accounting if the fair value, vesting conditions, and classification of the awards are the same immediately before and after the modification. We will adopt the standard effective January 1, 2018. The adoption is not expected to have a material impact on our consolidated financial statements.
|
3. |
Cash Equivalents and Marketable Securities |
The following table summarizes our cash equivalents and marketable securities (in thousands):
|
|
June 30, 2017 |
|
|||||||||||||
|
|
Amortized |
|
|
Unrealized |
|
|
Unrealized |
|
|
Estimated |
|
||||
|
|
Cost Basis |
|
|
Gains |
|
|
Losses |
|
|
Fair Value |
|
||||
|
Money market funds |
$ |
44,600 |
|
|
$ |
— |
|
|
$ |
— |
|
|
$ |
44,600 |
|
|
U.S. Treasury securities |
|
291,313 |
|
|
|
— |
|
|
|
(304 |
) |
|
|
291,009 |
|
|
|
|
335,913 |
|
|
|
— |
|
|
|
(304 |
) |
|
|
335,609 |
|
|
Less: cash equivalents |
|
(44,600 |
) |
|
|
— |
|
|
|
— |
|
|
|
(44,600 |
) |
|
Total marketable securities |
$ |
291,313 |
|
|
$ |
— |
|
|
$ |
(304 |
) |
|
$ |
291,009 |
|
|
|
December 31, 2016 |
|
|||||||||||||
|
|
Amortized |
|
|
Unrealized |
|
|
Unrealized |
|
|
Estimated |
|
||||
|
|
Cost Basis |
|
|
Gains |
|
|
Losses |
|
|
Fair Value |
|
||||
|
Money market funds |
$ |
432 |
|
|
$ |
— |
|
|
$ |
— |
|
|
$ |
432 |
|
|
U.S. Treasury securities |
|
414,134 |
|
|
|
54 |
|
|
|
(93 |
) |
|
|
414,095 |
|
|
|
|
414,566 |
|
|
|
54 |
|
|
|
(93 |
) |
|
|
414,527 |
|
|
Less: cash equivalents |
|
(432 |
) |
|
|
— |
|
|
|
— |
|
|
|
(432 |
) |
|
Total marketable securities |
$ |
414,134 |
|
|
$ |
54 |
|
|
$ |
(93 |
) |
|
$ |
414,095 |
|
As of June 30, 2017, the amortized cost and estimated fair value of our available-for-sale securities by contractual maturity are shown below (in thousands):
|
|
Amortized |
|
|
Estimated |
|
||
|
|
Cost |
|
|
Fair Value |
|
||
|
Debt securities maturing: |
|
|
|
|
|
|
|
|
In one year or less |
$ |
286,339 |
|
|
$ |
286,042 |
|
|
In one to two years |
|
4,974 |
|
|
|
4,967 |
|
|
Total marketable securities |
$ |
291,313 |
|
|
$ |
291,009 |
|
We determined that the gross unrealized losses on our marketable securities as of June 30, 2017 were temporary in nature. We currently do not intend to sell these securities prior to maturity and do not consider these investments to be other-than-temporarily impaired at June 30, 2017. There were no sales of available-for-sale securities in any of the periods presented.
11
The following table summarizes option activity under our equity incentive plans and related information:
|
|
Options Outstanding |
|
|||||||||
|
|
|
|
|
|
|
|
|
|
Weighted |
|
|
|
|
|
|
|
|
Weighted |
|
|
Average |
|
||
|
|
|
|
|
|
Average |
|
|
Remaining |
|
||
|
|
Number of |
|
|
Exercise Price |
|
|
Contractual |
|
|||
|
|
Shares |
|
|
Per Share |
|
|
Term (years) |
|
|||
|
Balance at December 31, 2016 |
|
3,454,339 |
|
|
$ |
26.80 |
|
|
|
|
|
|
Options granted |
|
699,050 |
|
|
$ |
41.91 |
|
|
|
|
|
|
Options exercised |
|
(115,944 |
) |
|
$ |
12.37 |
|
|
|
|
|
|
Options forfeited |
|
(160,002 |
) |
|
$ |
37.87 |
|
|
|
|
|
|
Options expired |
|
(552 |
) |
|
$ |
43.93 |
|
|
|
|
|
|
Balance at June 30, 2017 |
|
3,876,891 |
|
|
$ |
29.50 |
|
|
|
|
|
|
Options exercisable as of June 30, 2017 |
|
1,748,719 |
|
|
$ |
19.87 |
|
|
|
6.00 |
|
We have granted RSAs to certain of our employees, some of which are subject to performance conditions. RSAs are share awards that entitle the holder to receive freely tradable shares of our common stock upon vesting and are not forfeitable once fully vested. We based the fair value of RSAs on the closing sale price of our common stock on the grant date. For awards subject to performance conditions, we recognize stock-based compensation expense using the accelerated attribution recognition method when it is probable that the performance condition will be achieved.
The following table summarizes RSA activity under our 2013 Omnibus Incentive Plan and related information:
|
|
RSAs Outstanding |
|
||||
|
|
|
|
|
Weighted-Average |
|
|
|
|
Number |
|
Grant-Date |
|
||
|
|
of Shares |
|
Fair Value |
|
||
|
Unvested balance at December 31, 2016 |
|
1,040,929 |
|
$ |
28.84 |
|
|
RSAs granted |
|
452,555 |
|
$ |
43.96 |
|
|
RSAs vested |
|
(602,467 |
) |
$ |
20.24 |
|
|
RSAs forfeited |
|
(72,527 |
) |
$ |
42.50 |
|
|
Unvested balance at June 30, 2017 |
|
818,490 |
|
$ |
42.32 |
|
|
|
|
|
|
|
|
|
As of June 30, 2017, there were 1,564,142 shares of common stock available for future issuance under our 2013 Omnibus Incentive Plan.
Stock-Based Compensation
Total stock-based compensation expense recognized was as follows (in thousands):
|
|
Three Months Ended |
|
|
Six Months Ended |
|
||||||||||
|
|
June 30, |
|
|
June 30, |
|
||||||||||
|
|
2017 |
|
|
2016 |
|
|
2017 |
|
|
2016 |
|
||||
|
Research and development |
$ |
5,930 |
|
|
$ |
3,868 |
|
|
$ |
11,216 |
|
|
$ |
8,143 |
|
|
General and administrative |
|
3,831 |
|
|
|
3,258 |
|
|
|
8,432 |
|
|
|
6,384 |
|
|
Total |
$ |
9,761 |
|
|
$ |
7,126 |
|
|
$ |
19,648 |
|
|
$ |
14,527 |
|
12
We estimated the fair value of stock options using the Black-Scholes option-pricing model based on the date of grant of such stock option with the following assumptions:
|
|
Three Months Ended |
|
Six Months Ended |
||||
|
|
June 30, |
|
June 30, |
||||
|
|
2017 |
|
2016 |
|
2017 |
|
2016 |
|
Expected term (years) |
5.5-6.3 |
|
5.5-6.3 |
|
5.5-6.3 |
|
5.5-6.3 |
|
Expected volatility |
66% |
|
72% |
|
66-68% |
|
72-74% |
|
Risk-free interest rate |
1.9% |
|
1.4% |
|
1.9-2.1 |
|
1.4-1.5% |
|
Expected dividend yield |
0% |
|
0% |
|
0% |
|
0% |
As of June 30, 2017, we had $46.4 million of total unrecognized compensation expense related to unvested employee and director stock options that we expect to recognize over a weighted-average period of 2.8 years. Additionally, we had $26.2 million of total unrecognized compensation expense related to employee and director RSAs that we expect to recognize over a weighted-average period of 2.2 years.
|
5. |
Income Taxes |
We recorded a provision for income taxes of $1.7 million for the three and six months ended June 30, 2017 based on our ongoing discussions with the Internal Revenue Service as to our tentative net operating loss carryback refund claim filed in March 2017. We realized an income tax benefit of $7.3 million and $14.1 million for the three and six months ended June 30, 2016, respectively. This income tax benefit represented our ability to recover taxes accrued in 2015 based on existing tax law that allowed us to carryback our 2016 tax losses and/or credits to recover prior taxes. The income tax benefit was based on the annual effective tax rate method and considered our forecasted 2016 pre-tax losses reduced by non-deductible stock based compensation expenses and other immaterial non-deductible permanent items. In addition, as a result of the forecasted loss, the income tax benefit was decreased by a valuation allowance recorded against certain deferred tax assets due to the uncertainty surrounding the realization of such assets in the future.
After the carryback of our full year 2016 net operating losses to 2015, we maximized our ability to obtain a refund of prior income taxes paid.
13
Item 2. Management’s Discussion and Analysis of Financial Condition and Results of Operations
You should read the following management’s discussion and analysis of our financial condition and results of operations in conjunction with our unaudited condensed financial statements and notes thereto included in Part I, Item 1 of this Quarterly Report on Form 10-Q and with our audited financial statements and related notes thereto for the year ended December 31, 2016, included in our Annual Report on Form 10-K as filed with the U.S. Securities and Exchange Commission, or the SEC, on February 24, 2017, or our Annual Report.
Overview
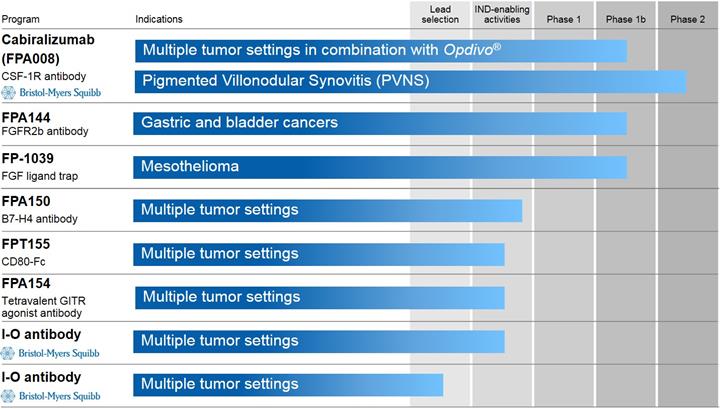
We are a clinical-stage biotechnology company focused on discovering and developing innovative protein therapeutics to improve the lives of patients with serious diseases. Each of our product candidates has an innovative mechanism of action and addresses patient populations for which better therapies are still needed. We have an emphasis in immuno-oncology, an area in which we have clinical, preclinical and discovery programs and product and discovery collaborations. In addition, we plan to use companion diagnostics where appropriate to allow us to select patients most likely to benefit from treatment. Our most advanced product candidates are identified below.
|
|
• |
Cabiralizumab (FPA008) is an antibody that inhibits colony stimulating factor-1, or CSF1, receptor, or CSF1R, that we are studying in clinical trials as a monotherapy in tenosynovial giant cell tumor, also known as diffuse pigmented villonodular synovitis, or PVNS, and in multiple cancers in combination with Bristol-Myers Squibb Company’s PD-1 immune checkpoint inhibitor, Opdivo® (nivolumab). In October 2015, we entered into a license and collaboration agreement, or the cabiralizumab collaboration agreement, with Bristol-Myers Squibb Company, or BMS, pursuant to which we granted BMS an exclusive worldwide license for the development and commercialization of cabiralizumab. |
|
|
• |
FPA144 is an antibody that inhibits fibroblast growth factor receptor 2b, or FGFR2b, that we are initially developing in Phase 1 clinical trials to treat patients with gastric (stomach) or gastroesophageal junction, or GEJ, cancer and bladder cancer. |
|
|
• |
FP-1039 is a fusion protein that “traps” and neutralizes cancer-promoting fibroblast growth factors, or FGFs, involved in cancer cell proliferation and new blood vessel formation that is in Phase 1b clinical development to treat patients with malignant pleural mesothelioma. |
We have a differentiated target discovery platform and library of more than 5,700 human transmembrane and extracellular soluble proteins that we believe encompasses substantially all of the body’s medically important targets for protein therapeutics. We have identified approximately 700 of these proteins, which we refer to as the immunome, that we believe modulate immune cell interactions and may be important in understanding and treating cancer patients using immuno-oncology therapeutics. Our target discovery platform and capabilities uniquely position us to explore pathways in cancer and inflammation and their intersection in immuno-oncology, an area of oncology with significant therapeutic potential and the focus of our research activities. We are applying all aspects of our biologics discovery platform, including cell-based screening, immunome-by-immunome screening, in vivo screening, receptor-ligand matching technologies and bioinformatics, in our immuno-oncology research program. We have identified several targets that we believe could be useful in immuno-oncology that we are actively validating, and we are also looking for additional targets. We generate and preclinically test therapeutic proteins, including antibodies and ligand traps containing or directed to the targets we identify. We plan to advance selected therapeutic candidates into clinical development, with a goal of filing at least one Investigational New Drug, or IND, application for a new molecule each year beginning in 2017.
We have no products approved for commercial sale and have not generated any revenue from product sales to date. We continue to incur significant research and development and other expenses related to our ongoing operations and we expect that our expenses will increase as we advance our product candidates into later stages of clinical development and increase the number of product candidates in clinical development. We have incurred losses in each period since our inception in 2002, with the exception of the fiscal year ended December 31, 2015, due primarily to the $350.0 million upfront payment we received from BMS from our cabiralizumab collaboration agreement, and the fiscal year ended December 31, 2011, due primarily to the $50.0 million upfront payment we received from GlaxoSmithKline, or GSK, from our license and collaboration agreement for FP-1039. For the six months ended June 30, 2017 and 2016, we reported a net loss of $77.7 million and $26.2 million, respectively.
Our management’s discussion and analysis of our financial condition and results of operations are based upon our unaudited consolidated financial statements included in this Quarterly Report on Form 10-Q, which we prepared in accordance with GAAP for interim periods and with Regulation S-X promulgated under the Securities and Exchange Act of 1934, as amended, or the Exchange Act.
14
The following table shows the stage of development of our most advanced product candidates:
Cabiralizumab (FPA008)
Cabiralizumab in Immuno-Oncology
We are conducting a Phase 1a/1b clinical trial with BMS to evaluate the safety, tolerability and preliminary efficacy of combining cabiralizumab with Opdivo as a potential treatment for a variety of cancers. We currently expect to enroll approximately 280 patients in the overall trial. In October 2016, we initiated the Phase 1b portion of the trial to evaluate the safety, tolerability and preliminary efficacy of the selected dose of cabiralizumab in combination with Opdivo in the following tumor settings:
|
|
• |
non-small cell lung cancer, or NSCLC (anti PD-1 therapy naïve); |
|
|
• |
anti PD-1 therapy resistant NSCLC (either de novo or acquired resistance); |
|
|
• |
squamous cell carcinoma of the head and neck; |
|
|
• |
pancreatic cancer; |
|
|
• |
renal cancer; |
|
|
• |
ovarian cancer; and |
|
|
• |
glioblastoma multiforme. |
We have completed enrollment in some of the Phase 1b cohorts and expect to complete enrollment in the Phase 1b portion of the trial in the second half of 2017.
We continue to enroll patients in the expansion of the Phase 1a portion of the trial to enable us to study the highest dose of cabiralizumab as monotherapy and as combination therapy with Opdivo. We are conducting these additional Phase 1a activities in parallel with our conduct of the Phase 1b portion of the trial.
We and BMS plan to announce certain initial clinical data for the Phase 1a/1b trial at Society of Immunotherapy of Cancer’s 2017 Annual Meeting.
15
We are conducting a Phase 2 clinical trial of cabiralizumab as a potential treatment for diffuse PVNS. During the Phase 2 expansion portion of the trial, we are evaluating tumor response rate and duration and measures of pain and joint function in PVNS patients.
We completed patient enrollment in the initially-planned 30-patient cohort of the Phase 2 portion of the trial in April 2017. We are in the process of amending the protocol for the Phase 2 portion of this study to enroll additional patients with diffuse PVNS to refine the dosing schedule of and optimize the therapeutic index of cabiralizumab in PVNS. Data from these additional patients are intended to support the design of our planned pivotal trial of cabiralizumab in PVNS.
In June 2017, we presented in a clinical poster presentation at the 2017 American Society of Clinical Oncology, or ASCO, Annual Meeting updated pharmacokinetics, or PK, pharmacodynamics, or PD, and safety data from the 21 patients enrolled and treated with cabiralizumab in our ongoing Phase 1/2 clinical trial following our August 2016 protocol amendment and efficacy data from the 11 patients treated with cabiralizumab prior to the protocol amendment.
Based on the data, we concluded that the PK and PD of cabiralizumab support dosing of up to 4 mg/kg. We did not observe any dose-limiting toxicities at doses up to 4 mg/kg. The most common treatment-related adverse events were periorbital and eyelid edema, rash and pruritis, which are all class effects for compounds targeting the CSF1R pathway.
We observed clinical benefit in patients with diffuse PVNS in doses up to 4mg/kg. Based on radiographic assessments by RECIST 1.1 of anti-tumor activity of the 11 patients treated with cabiralizumab at the 4mg/kg dose, we observed, as of the March 7, 2017 data cut-off date:
|
|
• |
four confirmed radiographic responses and one unconfirmed radiographic response; and |
|
|
• |
improvements in median Ogilvie-Harris composite score of pain and function in both responders and non-responders. |
FPA144
We are conducting a Phase 1 clinical trial of FPA144 as a potential treatment for gastric and GEJ cancer and bladder cancer. We are currently enrolling patients in the expansion portion of the trial in which we are evaluating the safety, PK, and efficacy of FPA144 in metastatic gastric and GEJ cancer patients, with the aim of exploring the correlation between efficacy and FGFR2b overexpression. We are conducting tumor testing for FGFR2b overexpression centrally using an immunohistochemistry, or IHC, assay to identify gastric and GEJ cancer patients that have tumors that overexpress FGFR2b protein.
We also have opened for enrollment a cohort in this Phase 1 clinical trial to test FPA144 as a treatment for bladder cancer patients whose tumors overexpress the FGFR2b protein.
In June 2017, we presented in a clinical poster presentation at the 2017 ASCO Annual Meeting updated safety and efficacy data from 64 patients from this Phase 1 clinical trial. In the trial, we tested FPA144 in advanced solid tumors up to 15mg/kg, including in patients with gastric or GEJ cancer and one patient with bladder cancer. As of the March 20, 2017 data cut-off date, we did not observe any dose-limiting toxicities or a maximum-tolerated dose. In addition, unlike small molecule FGF receptor kinase inhibitors, which block signaling through a broad number of FGF receptors and can lead to hyperphosphatemia, we did not observe any treatment-related hyperphosphatemia in patients treated with FPA144. All treatment-related adverse events were Grades 1, 2 or 3. All treatment-related ocular adverse events were Grades 1 or 2, and no retinal toxicity was reported.
We observed preliminary anti-tumor activity with FPA144 monotherapy in late-line gastric and GEJ cancer patients who had had a median of three prior therapies and whose tumors overexpress the FGFR2b protein. Based on radiographic assessments by RECIST 1.1 of anti-tumor activity in the 21 patients who had high FGFR2b+ overexpressing gastric or GEJ cancer, we observed, as of the March 20, 2017 data cut-off date:
|
|
• |
four confirmed partial responses (one each at the 3 mg/kg, 6 mg/kg, 10 mg/kg and 15 mg/kg dose levels); one unconfirmed partial response (at the 6 mg/kg dose level); |
|
|
• |
an objective response rate of 19.0%; |
|
|
• |
a median duration of response of 15.4 weeks; and |
|
|
• |
a disease control rate at 6 weeks of 57.1%. |
16
In addition, we observed anti-tumor activity with FPA144 monotherapy in a urothelial bladder cancer patient with FGFR2b overexpression, as determined by an IHC assay, who enrolled in the dose escalation portion of the Phase 1 clinical trial. Based on radiographic assessments by RECIST 1.1 of anti-tumor activity in the urothelial bladder cancer patient, we observed that the patient had a complete response at a dose of 3 mg/kg. To better understand the potential utility of FPA144 for the treatment of urothelial bladder cancer patients that overexpress FGFR2b, we analyzed 387 archival primary urothelial bladder cancer samples with an immunohistochemistry (IHC) assay for FGFR2b overexpression and determined that 11.6% of the primary tumor samples (n=342) overexpressed FGFR2b at a level of at least 1+ in at least 10% of the primary tumor sample and that 14.2% of the metastatic tumor samples (n=30) overexpressed FGFR2b at a level of at least 1+ in at least 10% of the metastatic tumor sample.
We have begun discussions with regulatory authorities regarding our plans to advance FPA144 in combination with standard of care chemotherapy to a global Phase 3 clinical trial in front-line gastric and GEJ cancer patients whose tumors overexpress FGFR2b. We also plan to continue evaluating whether FPA144 may be a potential treatment for bladder cancer and potentially other types of cancer.
Because the observed incidence of gastric and GEJ cancer is higher in Asian populations than in other populations, in July 2017, we initiated dosing in a Phase 1 clinical trial in Japan evaluating FPA144 as a monotherapy to treat patients with gastric or GEJ cancer. This trial is intended to enable the inclusion of Japanese patients in the global Phase 3 clinical trial that we are planning. In addition, we are actively evaluating the initiation of clinical development of FPA144 to potentially treat patients with gastric cancer in China.
In conjunction with developing FPA144 as a therapeutic for gastric and GEJ cancer, we are developing both an IHC assay and a blood-based (liquid biopsy) assay, in collaboration with diagnostic development partners, to use as companion diagnostics to identify gastric and GEJ cancer patients whose tumors overexpress FGFR2b or amplify the FGFR2 gene. Because the IHC-based companion diagnostic will allow us to determine FGFR2b overexpression in tumor tissue samples from gastric and GEJ cancer patients and the blood-based companion diagnostic will allow us to detect FGFR2 gene amplification by circulating tumor DNA, which is DNA shed from tumors that circulates in blood plasma outside of cells, from gastric and GEJ cancer patients, we plan to use both companion diagnostics concurrently to more effectively identify gastric and GEJ cancer patients whose tumors overexpress FGFR2b. We plan to develop both companion diagnostics in parallel with our clinical development of FPA144 and to pursue regulatory approval of each companion diagnostic concurrently with regulatory approval of FPA144.
FP-1039
In March 2011, we licensed to Human Genome Sciences, Inc., or HGS, rights to develop and commercialize FP-1039 in the United States, the European Union and Canada. In August 2012, GSK acquired HGS and HGS is now a wholly-owned subsidiary of GSK. HGS/GSK terminated its license to FP-1039 for convenience effective September 5, 2016.
Prior to GSK’s termination of the FP-1039 license, GSK had initiated a Phase 1b clinical trial of FP-1039 to evaluate the safety, tolerability, dosage, response rate and duration of response of FP-1039 in combination with front-line pemetrexed and cisplatin in malignant pleural mesothelioma, or MPM, patients. In June 2016, GSK completed enrollment of MPM patients at an expansion dose of 15 mg/kg in the Phase 1b clinical trial and GSK is currently dosing and following patients that remain on the study. Pursuant to the terms of the FP-1039 license, we elected to have GSK complete the conduct of the Phase 1b clinical trial of FP-1039 that GSK is currently conducting, at GSK’s expense.
Together with GSK, we plan to present updated response rate, duration of response and progression-free survival data from the Phase 1b clinical trial at the European Society for Medical Oncology’s 2017 Congress.
We will make decisions regarding any future development of FP-1039 in mesothelioma based on overall safety as well as the quantity and durability of responses in the Phase 1b clinical trial and other business considerations, such as drug supply and manufacturing.
Preclinical Programs
We are currently conducting IND-enabling activities in each of our FPA150 (B7H4 antibody), FPA154 (GITR antibody) and FPT155 (CD80 fusion protein) programs. We plan to file IND applications for the FPA150 in the fourth quarter of 2017 and for the FPA154 and FPT155 in 2018.
17
Immuno-Oncology Drug Discovery
We are currently focusing our internal research efforts in immuno-oncology. Cancers grow and spread because tumor cells have developed ways to evade elimination by the immune system. For example, cancer cells make proteins that apply the “brakes” to immune cells and prevent the immune cells from killing the tumor cells. One of the most exciting recent discoveries in cancer therapy has been the identification of ways to release these “brakes” and allow the immune cells to once again kill tumor cells. This new approach has the potential to not only reduce tumor growth like traditional therapies, but potentially to eliminate the cancer entirely in some patients. In addition to releasing the “brakes” on immune cells, other recent discoveries in cancer therapy have focused on identifying ways to “press on the gas” to amplify the anti-tumor immune response. This second approach targets stimulatory pathways on immune cells. Agents that agonize stimulatory pathways can help immune cells overcome inhibitory signals in the tumor microenvironment and kill tumor cells.
While checkpoint inhibitor therapies have been validated in the clinic with agents targeting the PD-1/PD-L1 and CTLA-4 pathways to release the “brakes,” a significant proportion of patients do not respond to these treatments. New targets for immuno-oncology are needed to address those patients who do not respond to or cannot tolerate traditional therapies or agents currently in development. We are applying all aspects of our biologics discovery platform to identify protein partners for molecules known to be involved in the anti-tumor immune response. We believe we have identified promising new antibody targets and ligand traps and are actively screening for and validating additional targets.
Financial Overview
Collaboration and License Revenue
We have not generated any revenue from product sales. We have derived our revenue to date from upfront payments, research and development funding and milestone payments under collaboration and license agreements with our collaboration partners and licensees. We currently have an active immuno-oncology research collaboration and cabiralizumab license and collaboration agreement with BMS. We completed the research term of our research collaboration in respiratory diseases with GSK and our fibrosis and CNS research collaboration with UCB Pharma S.A., or UCB, in July 2016 and March 2016, respectively.
Summary Revenue by Collaboration and License Agreements
The following is a comparison of collaboration and license revenue for the three and six months ended June 30, 2017 and 2016:
|
|
Three Months Ended |
|
|
Six Months Ended |
|
||||||||||
|
|
June 30, |
|
|
June 30, |
|
||||||||||
|
(in millions) |
2017 |
|
|
2016 |
|
|
2017 |
|
|
2016 |
|
||||
|
R&D Funding |
|
|
|
|
|
|
|
|
|
|
|
|
|
|
|
|
Cabiralizumab Collaboration - BMS |
$ |
3.9 |
|
|
$ |
1.7 |
|
|
$ |
9.6 |
|
|
$ |
2.8 |
|
|
Immuno-oncology Research Collaboration - BMS |
|
0.7 |
|
|
|
0.8 |
|
|
|
1.5 |
|
|
|
1.4 |
|
|
Respiratory Diseases Collaboration - GSK |
|
— |
|
|
|
1.4 |
|
|
|
— |
|
|
|
2.3 |
|
|
Fibrosis and CNS Collaboration - UCB |
|
— |
|
|
|
— |
|
|
|
— |
|
|
|
0.1 |
|
|
Ratable Revenue Recognition |
|
|
|
|
|
|
|
|
|
|
|
|
|
|
|
|
Cabiralizumab Collaboration - BMS |
|
1.5 |
|
|
|
1.5 |
|
|
|
3.0 |
|
|
|
2.9 |
|
|
Immuno-oncology Research Collaboration - BMS |
|
1.1 |
|
|
|
1.1 |
|
|
|
2.2 |
|
|
|
2.2 |
|
|
Respiratory Diseases Collaboration - GSK |
|
— |
|
|
|
0.4 |
|
|
|
— |
|
|
|
0.7 |
|
|
Fibrosis and CNS Collaboration - UCB |
|
0.7 |
|
|
|
0.7 |
|
|
|
1.5 |
|
|
|
1.5 |
|
|
Milestone and Contingent Payments |
|
|
|
|
|
|
|
|
|
|
|
|
|
|
|
|
Respiratory Diseases Collaboration - GSK |
|
— |
|
|
|
1.5 |
|
|
|
— |
|
|
|
1.5 |
|
|
Fibrosis and CNS Collaboration - UCB |
|
— |
|
|
|
— |
|
|
|
0.2 |
|
|
|
0.2 |
|
|
Other License Revenue |
|
|
|
|
|
|
|
|
|
|
|
|
|
|
|
|
bluebird bio License Agreement |
|
— |
|
|
|
0.1 |
|
|
|
— |
|
|
|
0.1 |
|
|
Total |
$ |
7.8 |
|
|
$ |
9.2 |
|
|
$ |
18.0 |
|
|
$ |
15.7 |
|
We expect that any revenue we generate will fluctuate from period to period as a result of the timing and amount of milestones and other payments from our existing collaborations and licenses or entry into any new collaborations and license agreements.
18
Research and development expenses consist of costs we incur for our own and for sponsored and collaborative research and development activities. Expenses we incur related to collaborative research and development agreements approximate the revenue we recognize under these agreements. We expense research and development costs as we incur them. Research and development costs consist of salaries and benefits, including associated stock-based compensation, laboratory supplies and facility costs, as well as fees we pay to other entities that conduct certain research and development activities on our behalf. We estimate preclinical study and clinical trial expenses based on the services performed pursuant to contracts with research institutions and contract research organizations, or CROs, and clinical manufacturing organizations, or CMOs, that conduct and manage preclinical studies and clinical trials on our behalf based on actual time and expenses incurred by them. Further, we accrue expenses related to clinical trials based on the level of patient enrollment and activity contemplated by the applicable agreement. We monitor patient enrollment levels and related activity to the extent reasonably possible and adjust estimates accordingly. If we do not identify costs that we have begun to incur or if we underestimate or overestimate the level of services performed or the costs of these services, our actual expenses could differ from our estimates. To date, we have not experienced significant changes in our estimates of preclinical studies and clinical trial accruals.
We expense payments for the acquisition and development of technology as research and development costs if, at the time of payment, the technology: is under development; is not approved by the U.S. Food and Drug Administration or other regulatory agencies for marketing; has not reached technical feasibility; or otherwise has no foreseeable alternative future use.
The following is a comparison of research and development expenses for the three and six months ended June 30, 2017 and 2016:
|
|
Three Months Ended |
|
|
Six Months Ended |
|
||||||||||
|
|
June 30, |
|
|
June 30, |
|
||||||||||
|
(in millions) |
2017 |
|
|
2016 |
|
|
2017 |
|
|
2016 |
|
||||
|
Development programs: |
|
|
|
|
|
|
|
|
|
|
|
|
|
|
|
|
Cabiralizumab |
$ |
6.4 |
|
|
$ |
3.9 |
|
|
$ |
16.5 |
|
|
$ |
7.4 |
|
|
FPA144 |
|
6.1 |
|
|
|
5.6 |
|
|
|
13.5 |
|
|
|
9.0 |
|
|
FP-1039 |
|
0.6 |
|
|
|
0.1 |
|
|
|
0.7 |
|
|
|
0.1 |
|
|
Subtotal development programs |
|
13.1 |
|
|
|
9.6 |
|
|
|
30.7 |
|
|
|
16.5 |
|
|
Preclinical programs |
|
19.2 |
|
|
|
4.9 |
|
|
|
26.6 |
|
|
|
7.2 |
|
|
Discovery collaborations |
|
1.1 |
|
|
|
1.7 |
|
|
|
2.5 |
|
|
|
5.7 |
|
|
Early research and discovery |
|
8.3 |
|
|
|
6.0 |
|
|
|
15.7 |
|
|
|
11.6 |
|
|
Total research and development expenses |
$ |
41.7 |
|
|
$ |
22.2 |
|
|
$ |
75.5 |
|
|
$ |
41.0 |
|
We expect our research and development expenses to continue to increase as we advance our development programs further and advance additional drug candidates into preclinical and clinical development, in particular as we increase the number and size of our clinical trials and as we expand our internal immuno-oncology preclinical, research and discovery efforts. We expect that by the end of 2017 and for the foreseeable future thereafter a majority of the research and development expenses we incur will relate to activities to support our clinical development programs, in particular our cabiralizumab and FPA144 programs. We expect the growth of our preclinical program-related expenses to taper as we complete preclinical activities for our FPA150, FPA154 and FPT155 programs and these programs enter clinical development. We expect that increases in our cabiralizumab and FPA144 development-related expenses will increase by a greater amount than our other development program-, preclinical program- and early research and discovery-related expenses as the cabiralizumab and FPA144 programs advance towards and into pivotal trials.
The process of conducting preclinical studies and clinical trials necessary to obtain regulatory approval is costly and time-consuming. We or our partners may never succeed in achieving marketing approval for any of our drug candidates. Numerous factors may affect the probability of success for each drug candidate, including preclinical data, clinical data, competition, manufacturing capability and commercial viability.
The successful development of our drug candidates is highly uncertain and may not result in approved products. Completion dates and completion costs can vary significantly for each drug candidate and are difficult to predict for each product. Given the uncertainty associated with clinical trial enrollments and the risks inherent in the development process, we are unable to determine the duration and completion costs of the current or future clinical trials of our drug candidates or if, or to what extent, we will generate revenues from the commercialization and sale of any of our drug candidates. We anticipate we will make determinations as to which programs to pursue and how much funding to direct to each program on an ongoing basis in response to the outcome of research, nonclinical and clinical activities of each drug candidate, as well as ongoing assessments as to each drug candidate’s commercial potential. We will need to raise additional capital or may seek additional product collaborations in the future to complete the development and commercialization of our drug candidates.
19
General and administrative expenses consist primarily of salaries and related benefits, including stock-based compensation, related to our executive, finance, legal, business development, human resource, and support functions. Other general and administrative expenses include allocated facility-related costs not otherwise included in research and development expenses, travel expenses and professional fees for auditing, tax and legal services, including intellectual property-related legal services.
We expect our general and administrative expenses to increase due to expanded operations to support our increased research and development activities, increased stock-based compensation, and increased facility costs as a result of relocating to a larger facility. Also, we expect our intellectual property-related legal expenses, including those related to preparing, filing and prosecuting patent applications, maintaining patents and opposing or otherwise challenging the intellectual property rights of others, to increase as the number of our preclinical and clinical programs increases and these programs advance.
Interest Income
Interest income consists of interest income earned on our cash and cash equivalents and marketable securities.
Critical Accounting Policies and Estimates
We based our management’s discussion and analysis of financial condition and results of operations upon our unaudited condensed financial statements, which we prepared in accordance with GAAP. The preparation of these financial statements requires us to make estimates and judgments that affect the reported amounts of assets, liabilities, revenues and expenses. We evaluate our critical accounting policies and estimates on an on-going basis. We base our estimates on historical experience and on various other assumptions that we believe to be reasonable under the circumstances, the results of which form the basis for making judgments about the carrying values of assets and liabilities that are not readily apparent from other sources. Actual results may differ from these estimates under different assumptions and conditions. Our significant accounting policies are more fully described in Note 2 of the accompanying unaudited condensed financial statements and in Note 2 of our audited financial statements contained in our Annual Report. There have been no significant or material changes in our critical accounting policies during the six months ended June 30, 2017 as compared to those disclosed in “Management’s Discussion and Analysis of Financial Condition and Results of Operations – Critical Accounting Policies and Use of Estimates” in our Annual Report.
Results of Operations
Comparison for the Three Months Ended June 30, 2017 and 2016
|
|
Three Months Ended |
|
|||||
|
|
June 30, |
|
|||||
|
(in millions) |
2017 |
|
|
2016 |
|
||
|
Collaboration and license revenue |
$ |
7.8 |
|
|
$ |
9.2 |
|
|
Operating expenses: |
|
|
|
|
|
|
|
|
Research and development |
|
41.7 |
|
|
|
22.2 |
|
|
General and administrative |
|
9.4 |
|
|
|
8.1 |
|
|
Total operating expenses |
|
51.1 |
|
|
|
30.3 |
|
|
Interest and other income, net |
|
0.7 |
|
|
|
0.6 |
|
|
Loss before income tax |
|
(42.6 |
) |
|
|
(20.5 |
) |
|
Income tax (provision) benefit |
|
(1.7 |
) |
|
|
7.3 |
|
|
Net loss |
$ |
(44.3 |
) |
|
$ |
(13.1 |
) |
Collaboration and License Revenue
Collaboration and license revenue decreased by $1.4 million, or 15%, to $7.8 million for the three months ended June 30, 2017 from $9.2 million for the three months ended June 30, 2016. This decrease was primarily due to a $3.3 million reduction in revenue recognized under the respiratory disease collaboration with GSK as the research term ended in July 2016. The decrease was partially offset by a $2.1 million increase in revenue from our cabiralizumab collaboration agreement with BMS.
Research and Development
Our research and development expenses increased by $19.5 million, or 88%, to $41.7 million for the three months ended June 30, 2017 from $22.2 million for the three months ended June 30, 2016. This increase was primarily due to an increase of $14.3 million to further advance our preclinical programs towards filing IND applications, including a $5 million milestone payment to Inhibrx for initiating manufacturing for FPA154. There was also an increase of $2.5 million to advance cabiralizumab in our Phase 2 clinical trial in PVNS and our Phase 1a/1b clinical trial in immuno-oncology and $2.3 million to advance our early research and discovery to discover and validate immuno-oncology targets and generate potential therapeutic candidates.
20
Our general and administrative expenses increased by $1.3 million, or 16%, to $9.4 million for the three months ended June 30, 2017 from $8.1 million for the three months ended June 30, 2016, primarily due to a $0.7 million increase in payroll and stock-based compensation costs and $0.3 million of rent expense related to the new corporate office and laboratory facility lease agreement executed in December 2016.
Income Tax Benefit
After the carryback of our full 2016 net operating losses to 2015, we maximized our ability to obtain a refund of prior income taxes paid. We did, however, record a provision for income tax of $1.7 million for the three months ended June 30, 2017 based on our ongoing discussions with the Internal Revenue Service as to our tentative net operating loss carryback refund claim filed in March 2017. We realized an income tax benefit of $7.3 million for the three months ended June 30, 2016. The income tax benefit represented our ability to recover taxes accrued in 2015 based on existing tax law that allowed us to carry back our 2016 tax losses and/or credits to recover prior taxes. The income tax benefit is based on the annual effective tax rate method and considers our forecasted 2016 pre-tax losses reduced by non-deductible stock-based compensation expenses and other immaterial non-deductible permanent items. In addition, as a result of the forecasted loss, the income tax benefit was decreased by a valuation allowance recorded against certain deferred tax assets due to the uncertainty surrounding the realization of such assets in the future.
Comparison for the Six Months Ended June 30, 2017 and 2016
|
|
Six Months Ended |
|
|||||
|
|
June 30, |
|
|||||
|
(in millions) |
2017 |
|
|
2016 |
|
||
|
Collaboration and license revenue |
$ |
18.0 |
|
|
$ |
15.7 |
|
|
Operating expenses: |
|
|
|
|
|
|
|
|
Research and development |
|
75.5 |
|
|
|
41.0 |
|
|
General and administrative |
|
19.8 |
|
|
|
16.2 |
|
|
Total operating expenses |
|
95.3 |
|
|
|
57.2 |
|
|
Interest income and other expense, net |
|
1.4 |
|
|
|
1.2 |
|
|
Loss before income tax |
|
(75.9 |
) |
|
|
(40.3 |
) |
|
Income tax (provision) benefit |
|
(1.7 |
) |
|
|
14.1 |
|
|
Net loss |
$ |
(77.7 |
) |
|
$ |
(26.2 |
) |
Collaboration and License Revenue
Collaboration and license revenue increased by $2.3 million, or 15%, to $18.0 million for the six months ended June 30, 2017 from $15.7 million for the six months ended June 30, 2016. This increase was primarily due to a $6.9 million increase in revenue from our cabiralizumab collaboration agreement with BMS, offset by a $4.5 million decrease in revenue recognized under the respiratory diseases collaboration with GSK, as the research term ended in July 2016.
Research and Development
Our research and development expenses increased by $34.5 million, or 84%, to $75.5 million for the six months ended June 30, 2017 from $41.0 million for the six months ended June 30, 2016. This increase was primarily due to an increase of $19.4 million to further advance our preclinical programs toward filing IND applications, including a $5 million milestone payment to Inhibrx for initiating manufacturing for FPA154. There was also an increase of $9.1 million to advance cabiralizumab in our Phase 2 clinical trial in PVNS and our Phase 1a/1b clinical trial in immuno-oncology and $4.5 million to advance our FPA144 development program.
General and Administrative
Our general and administrative expenses increased by $3.6 million, or 22%, to $19.8 million for the six months ended June 30, 2017 from $16.2 million for the six months ended June 30, 2016, primarily due to a $2.7 million increase in payroll and stock-based compensation costs and a $0.3 million increase due to additional rent expense related to the new corporate office and laboratory facility lease agreement executed in December 2016.
21
After the carryback of our full 2016 net operating losses to 2015, we maximized our ability to obtain a refund of prior income taxes paid. We did, however, record a provision for income tax of $1.7 million for the six months ended June 30, 2017 based on our ongoing discussions with the Internal Revenue Service as to our tentative net operating loss carryback refund claim filed in March 2017. We realized an income tax benefit of $14.1 million for the six months ended June 30, 2016. The income tax benefit represented our ability to recover taxes accrued in 2015 based on existing tax law that allowed us to carry back our 2016 tax losses and/or credits to recover prior taxes. The income tax benefit is based on the annual effective tax rate method and considers our forecasted 2016 pre-tax losses reduced by non-deductible stock-based compensation expenses and other immaterial non-deductible permanent items. In addition, as a result of the forecasted loss, the income tax benefit was decreased by a valuation allowance recorded against certain deferred tax assets due to the uncertainty surrounding the realization of such assets in the future.
Liquidity and Capital Resources
As of June 30, 2017, we had $350.7 million in cash and cash equivalents and marketable securities invested in a U.S. Treasury money market fund and U.S. Treasury securities with maturities of 14 months or less.
In addition to our existing cash and cash equivalents, we are eligible to receive research and development funding and to earn milestone and other contingent payments for the achievement of defined collaboration objectives and certain nonclinical, clinical, regulatory and sales-based events and royalty payments under our collaboration and license agreements. Our ability to earn these milestone and contingent payments and the timing of achieving these milestones is primarily dependent upon the outcome of our collaborators’ and licensees’ research and development activities and remain uncertain. Our rights to payment under our collaboration and license agreements are our only committed external sources of funds.
Funding Requirements
Our primary uses of capital are, and we expect will continue to be, compensation and related expenses, third party clinical and preclinical research and development services, including clinical trial, manufacturing, laboratory and related supplies, legal, patent and other regulatory expenses and general overhead costs. We believe our use of CROs and contract manufacturers provides us with flexibility in managing our spending and limits our cost commitments at any point in time.
Because our product candidates are in various stages of clinical and preclinical development and the outcome of these efforts is uncertain, we cannot estimate the actual amounts necessary to successfully complete the development and commercialization of our product candidates or whether or when we may achieve profitability. Until such time, if ever, that we can generate substantial product revenues, we expect to finance our cash needs through collaboration arrangements and, if necessary, equity or debt financings. Except for any obligations of our collaborators to reimburse us for research and development expenses or to make milestone or royalty payments under our agreements with them, we will not have any committed external sources of liquidity. To the extent that we raise additional capital through the future sale of equity or debt, the ownership interests of our stockholders will be diluted and the terms of these securities may include liquidation or other preferences that adversely affect the rights of our existing stockholders. If we raise additional funds through collaboration arrangements in the future, we may have to relinquish valuable rights to our technologies, future revenue streams or product candidates or grant licenses on terms that may not be favorable to us. If we are unable to raise additional funds through equity or debt financings when needed, we may be required to delay, limit, reduce or terminate our product development or future commercialization efforts or grant rights to develop and market product candidates that we would otherwise prefer to develop and market ourselves.
Based on our research and development plans and our timing expectations related to the progress of our programs, we expect that our existing cash and cash equivalents and marketable securities as of June 30, 2017 will be sufficient to fund our operating expenses and capital expenditure requirements for at least the next 12 months.
Cash Flows
The following is a summary of cash flows for the six months ended June 30, 2017 and 2016:
|
|
Six Months Ended |
|
|||||
|
|
June 30, |
|
|||||
|
(in millions) |
2017 |
|
|
2016 |
|
||
|
Net cash used in operating activities |
$ |
(57.0 |
) |
|
$ |
(49.2 |
) |
|
Net cash provided by (used in) investing activities |
|
119.0 |
|
|
|
(67.5 |
) |
|
Net cash (used in) provided by financing activities |
|
(10.0 |
) |
|
|
4.8 |
|
22
Net Cash Used in Operating Activities
Net cash used in operating activities was $57.0 million for the six months ended June 30, 2017 and consisted of our net loss of $77.7 million, offset by $22.0 million in net non-cash charges, and $1.3 million from changes in operating assets and liabilities. Net non-cash charges included $1.1 million of depreciation and amortization expenses, $19.6 million for stock-based compensation expense and $1.2 million for amortization of premiums and discounts on marketable securities.
Net cash used in operating activities was $49.2 million for the six months ended June 30, 2016 and consisted of our net loss of $26.2 million offset by $18.6 million in net non-cash charges, and $41.6 million from changes in operating assets and liabilities. Net non-cash charges included $0.8 million of depreciation and amortization expenses, $14.5 million for stock-based compensation expense, and $2.3 million for amortization of premiums and discounts on marketable securities. The change in operating assets and liabilities was primarily due to a $30.6 million reduction in income tax payable due to a $14.7 million income tax payment during the period and tax benefits from the carryback of the first half of 2016 net operating loss, and an $8.6 million reduction in deferred revenue from the recognition of revenue in the current period for cash received from collaboration partners in prior periods.
Net Cash Provided by (Used in) Investing Activities
Net cash provided by (used in) investing activities was $119.0 million and $(67.5) million for the six months ended June 30, 2017 and 2016, respectively. Net cash provided by investing activities for the periods presented primarily relates to the purchases and maturities of marketable securities. Payments for the purchases of property and equipment were $2.6 million and $1.9 million during the six months ended June 30, 2017 and 2016, respectively. The property and equipment purchases consisted primarily of purchases of laboratory equipment to support our research and development activities.
Net Cash (Used in) Provided by Financing Activities
Net cash used in financing activities was $10.0 million for the six months ended June 30, 2017, and consisted primarily of $12.2 million paid to satisfy tax withholding obligations from the net share issuance of RSAs offset by $2.2 million received from employee stock option exercises.
Net cash provided by financing activities was $4.8 million for the six months ended June 30, 2016, and consisted primarily of $5.9 million received from employee stock option exercises and $2.5 million from excess tax benefits from employee equity incentive plans offset by $3.6 million paid to satisfy tax withholding obligations from the net share issuance of RSAs.
Non-Cash Investing Activities
During the six months ended June 30, 2017, we recorded leasehold improvements totaling $8.3 million that were paid for by our landlord under the terms of our new corporate office and laboratory lease agreement executed in December 2016.
Contractual Obligations and Contingent Liabilities
During the three months ended June 30, 2017, there were no material changes to our contractual obligations and commitments described under Management’s Discussion and Analysis of Financial Condition and Results of Operations in our Annual Report.
Off-Balance Sheet Arrangements
We did not have during the periods presented, and we do not currently have, any off-balance sheet arrangements, as defined under SEC rules.
23
Item 3. Quantitative and Qualitative Disclosures About Market Risk
The market risk inherent in our financial instruments and in our financial position reflects the potential losses arising from adverse changes in interest rates and concentration of credit risk. As of June 30, 2017, we had cash and cash equivalents and marketable securities of $350.7 million, consisting of bank deposits, interest-bearing money market accounts and U.S. Treasury securities. Our primary exposure to market risk is interest rate sensitivity, which is affected by changes in the general level of U.S. interest rates. Our cash equivalents and marketable securities have an average maturity of approximately six months and the longest maturity is fourteen months. Due to the short-term maturities of our cash equivalents and marketable securities and the low risk profile of our marketable securities, an immediate 100 basis point change in interest rates would not have a material effect on the fair market value of our cash equivalents and marketable securities. We can hold our marketable securities until maturity, and we therefore do not expect a change in market interest rates to affect our operating results or cash flows to any significant degree.
Item 4. Controls and Procedures
Evaluation of disclosure controls and procedures. Management, including our President and Chief Executive Officer and Senior Vice President and Chief Financial Officer, evaluated the effectiveness of our disclosure controls and procedures (as defined in Exchange Act Rules 13a-15(e) and 15d-15(e)), as of the end of the period covered by this report. Based upon the evaluation, our President and Chief Executive Officer and Senior Vice President and Chief Financial Officer concluded that the disclosure controls and procedures were effective to ensure that information required to be disclosed in the reports we file and submit under the Exchange Act is (i) recorded, processed, summarized and reported as and when required and (ii) accumulated and communicated to our management, including our President and Chief Executive Officer and Senior Vice President and Chief Financial Officer, as appropriate to allow timely discussion regarding required disclosure.
Changes in internal control over financial reporting. There have been no significant changes in our internal control over financial reporting during our most recent fiscal quarter that materially affected or are reasonably likely to materially affect our internal control over financial reporting.
24
We are not currently subject to any material legal proceedings.
This Quarterly Report on Form 10-Q contains forward-looking information based on our current expectations. Because our business is subject to many risks and our actual results may differ materially from any forward-looking statements made by or on behalf of us, this section includes a discussion of important factors that could affect our business, operating results, financial condition and the trading price of our common stock. You should carefully consider these risk factors, together with all of the other information included in this Quarterly Report on Form 10-Q as well as our other publicly available filings with the SEC.
Risks Related to Our Financial Position and Capital Needs
We expect to incur net losses for the foreseeable future.
We are a clinical-stage biotechnology company with a limited operating history. Investment in biopharmaceutical product development is highly speculative because it entails substantial upfront capital expenditures and significant risk that any potential product candidate will fail to demonstrate adequate effect or an acceptable safety profile, gain regulatory approval and become commercially viable. We have no products approved for commercial sale and have not generated any revenue from product sales to date and we continue to incur significant research and development and other expenses related to our ongoing operations. As a result, we are not profitable and have incurred losses in each period since our inception in 2001, with the exception of the fiscal year ended December 31, 2015, due primarily to the $350.0 million upfront payment we received from BMS from our license and collaboration agreement for cabiralizumab, and the fiscal year ended December 31, 2011, due primarily to the $50.0 million upfront payment we received from GSK from our license and collaboration agreement for FP-1039. For the six months ended June 30, 2017, we reported a net loss of $77.7 million.
Although we may from time to time report profitable results, we generally expect to continue to incur significant expenses and increasing operating losses for the foreseeable future. The net losses we incur may fluctuate significantly from quarter to quarter. We expect our operating expenses to increase as we continue our research and development of, and seek regulatory approvals for, our product candidates. We may encounter unforeseen expenses, difficulties, complications, delays and other unknown circumstances that may adversely affect our business. The size of our future net losses will depend, in part, on the rate of future growth of our expenses and our ability to generate revenues. Our prior losses and expected future losses have had and will continue to have an adverse effect on our stockholders’ equity and working capital.
We currently have no source of product revenue and may never become consistently profitable.
To date, we have not generated any revenue from commercialization of our product candidates. Our ability to generate product revenue and ultimately become profitable depends upon our ability, alone or with our partners, to successfully commercialize products, including any of our current product candidates or other product candidates that we may develop, in-license or acquire in the future. We do not anticipate generating revenue from the sale of products for the foreseeable future. Our ability to generate future product revenue from our current or future product candidates also depends on additional factors, including our or our partners’ ability to:
|
|
• |
successfully complete research and clinical development of current and future product candidates; |
|
|
• |
establish and maintain supply and manufacturing relationships with third parties to ensure adequate, timely and compliant manufacturing of bulk drug substances and drug products to maintain that supply; |
|
|
• |
launch and commercialize future product candidates for which we obtain marketing approval, if any, and if launched independently or with certain partners, successfully establish a sales force, marketing and distribution infrastructure; |
|
|
• |
obtain coverage and adequate product reimbursement from third-party payors, including government payors; |
|
|
• |
successfully develop, validate and obtain any necessary regulatory approvals of companion diagnostics to our product candidates on a timely basis; |
|
|
• |
achieve market acceptance for our or our partners’ products, if any; |
25
|
|
• |
acquire rights to and otherwise establish, maintain and protect intellectual property necessary to develop and commercialize our product candidates; and |
|
|
• |
attract, hire and retain qualified personnel. |
In addition, because of the numerous risks and uncertainties associated with pharmaceutical product development, including that our product candidates may not advance through development or achieve the endpoints of applicable clinical trials, we are unable to predict the timing or amount of increased expenses, or if or when we will achieve or maintain profitability. In addition, our expenses could increase beyond our current expectations if we decide to or are required by the FDA or foreign regulatory authorities to perform studies or trials in addition to those that we currently anticipate. Even if we complete the development and regulatory processes described above, we anticipate incurring significant costs associated with launching and commercializing our products.
Even if we generate revenue from the sale of any of our products that may be approved, we may not become profitable and may need to obtain additional funding to continue operations. If we fail to become profitable or do not sustain profitability on a continuing basis, then we may be unable to continue our operations at planned levels and be forced to reduce our operations.
We will require additional capital to finance our operations, which may not be available to us on acceptable terms or at all. As a result, we may not complete the development and commercialization of our product candidates or develop new product candidates.
As a research and development company, our operations have consumed substantial amounts of cash since inception. Although we have sufficient cash and cash equivalents to fund our projected operating expenses and capital expenditure requirements for at least the next 12 months, we expect our research and development expenses to increase substantially in connection with our ongoing activities, particularly as we advance our product candidates further into clinical development, advance additional product candidates into clinical trials and increase the number and size of our clinical trials. In addition, circumstances may cause us to consume capital more rapidly than we currently anticipate. For example, as we move our product candidates through preclinical studies and into clinical development, we may have adverse results requiring us to acquire or develop new product candidates, or our product collaboration partners may not elect to pursue the development and commercialization of any of our product candidates that are subject to our respective agreements with them. Any of these events may increase our development costs more than we expect. We may need to raise additional funds or otherwise obtain funding through product collaborations if we choose to initiate additional clinical trials for product candidates beyond the programs we have currently partnered. In any event, we will require additional capital to obtain regulatory approval for, and to commercialize, future product candidates.
If we need to secure additional financing, such additional fundraising efforts may divert our management from our day-to-day activities, which may adversely affect our ability to develop and commercialize future product candidates. In addition, we cannot guarantee that future financing will be available in sufficient amounts or on terms acceptable to us, if at all. If we do not raise additional capital when required or on acceptable terms, we may need to:
|
|
• |
significantly delay, scale back or discontinue the development or commercialization of any product candidates or cease operations altogether; |
|
|
• |
seek strategic alliances for research and development programs at an earlier stage than we would otherwise desire or on terms less favorable than might otherwise be available; or |
|
|
• |
relinquish or license on unfavorable terms our rights to technologies or any future product candidates that we otherwise would seek to develop or commercialize ourselves. |
If we need to conduct additional fundraising activities and we do not raise additional capital in sufficient amounts or on terms acceptable to us, we may be prevented from pursuing development and commercialization efforts, which could have a material adverse effect on our business, operating results and prospects.
Our forecast of the time through which our financial resources will adequately support our operations could vary as a result of a number of factors, including the factors discussed elsewhere in this “Risk Factors” section. Our future funding requirements, both short- and long-term, will depend on many factors, including:
|
|
• |
the initiation, progress, timing, costs and results of preclinical and clinical studies for our product candidates and future product candidates we may develop; |
|
|
• |
the outcome, timing and cost of seeking and obtaining regulatory approvals from the FDA and comparable foreign regulatory authorities, including the potential for such authorities to require that we perform more studies than those that we currently expect; |
26
|
|
• |
the effect of competing technological and market developments; |
|
|
• |
market acceptance of any approved product candidates; |
|
|
• |
the costs of acquiring, licensing or investing in additional businesses, products, product candidates and technologies; |
|
|
• |
the cost and timing of selecting, auditing and potentially validating a manufacturing site for commercial-scale manufacturing; and |
|
|
• |
the cost of establishing sales, marketing and distribution capabilities for our product candidates for which we may receive regulatory approval and that we determine to commercialize ourselves or in collaboration with our partners. |
If a lack of available capital means that we cannot expand our operations or otherwise capitalize on our business opportunities, our business, financial condition and results of operations could be materially adversely affected.
Raising additional capital may cause dilution to our existing stockholders, restrict our operations or require us to relinquish rights to our technologies.
Until we generate sufficient product revenue, if ever, we expect to finance our future cash needs through public or private equity or debt offerings. Additional capital may not be available on reasonable terms, if at all. Raising additional funds through the issuance of additional debt or equity securities could dilute our existing stockholders or increase fixed payment obligations. Furthermore, these securities may have rights senior to those of our common stock and could contain covenants that restrict our operations and potentially impair our competitiveness, such as limitations on our ability to incur additional debt, limitations on our ability to acquire, sell or license intellectual property rights and other operating restrictions that could adversely impact our ability to conduct our business. Any of these events could significantly harm our business, financial condition and prospects.
Risks Related to Our Business and Industry
We may not advance additional product candidates into clinical development or identify or validate additional drug targets. If we do not advance additional product candidates into clinical development or identify or validate additional drug targets, or if we experience significant delays in doing any of the foregoing, our business will be materially harmed.
We have invested a significant portion of our efforts and financial resources in the identification and validation of new targets for protein therapeutics and the identification and preclinical development of product candidates to these targets. We have three clinical-stage product candidates, cabiralizumab, FPA144 and FP-1039, and three pre-clinical programs in IND-enabling studies, FPA150, FPA154 and FPT155. Our ability to generate product revenues, which we do not expect will occur for many years, if ever, will depend heavily on our ability to identify and validate new targets and identify and advance preclinical product candidates into and through clinical development. The outcome of preclinical studies of our product candidates may not predict the success of clinical trials. Moreover, preclinical data are often susceptible to varying interpretations and analyses and many companies that have believed their product candidates performed satisfactorily in preclinical studies have nonetheless failed in clinical development. Our inability to successfully complete preclinical development of our product candidates could result in additional costs to us or impair our ability to generate product revenues or receive development, regulatory, commercialization and sales milestone payments and royalties on product sales.
If clinical trials of our product candidates fail to demonstrate safety and efficacy to the satisfaction of regulatory authorities or do not otherwise produce meaningfully positive results, we may incur additional costs or experience delays in completing, or ultimately be unable to complete, the development and commercialization of our product candidates.
Before obtaining marketing approval from regulatory authorities for the sale of future product candidates, we or our partners must conduct extensive clinical trials to demonstrate the safety and efficacy of the product candidates in humans. Clinical testing is expensive and difficult to design and implement, can take many years to complete and is uncertain as to outcome. A failure of one or more clinical trials can occur at any stage of testing. The outcome of preclinical studies and early clinical trials may not predict the success of later clinical trials and interim results of a clinical trial do not necessarily predict final results. A number of companies in the pharmaceutical and biotechnology industries have suffered significant setbacks in advanced clinical trials due to lack of efficacy or unacceptable safety profiles, notwithstanding promising results in earlier trials. Despite the results reported from our clinical trials and preclinical studies for our product candidates, we do not know whether the clinical trials we or our partners may conduct will demonstrate adequate efficacy and safety to result in regulatory approval to market any of our product candidates in any particular jurisdiction or jurisdictions. If later-stage clinical trials do not produce favorable results, our or our partners’ ability to achieve regulatory approval for any of our product candidates may be adversely impacted.
27
Delays in clinical testing will delay the commercialization of our product candidates, potentially increase our costs and harm our business.
We do not know whether any of our clinical trials will begin as planned, will need to be amended or restructured or will be completed on schedule, or at all. Our product development costs will increase if we experience delays in clinical testing. Significant clinical trial delays also could shorten any periods during which we may have the exclusive right to commercialize our product candidates or could allow our competitors to bring products to market before we do, which would impair our ability to successfully commercialize our product candidates and may harm our business, results of operations and prospects. Events which may result in a delay or unsuccessful completion of clinical development include:
|
|
• |
delays in reaching an agreement with or failure in obtaining authorization from the FDA or other regulatory authorities and institutional review boards, or IRBs; |
|
|
• |
imposition of a clinical hold following an inspection of our manufacturing or clinical trial operations or trial sites by the FDA or other regulatory authorities, or a decision by the FDA, other regulatory authorities, IRBs or us, or recommendation by a data safety monitoring board, to suspend or terminate a clinical trial at any time for safety issues or for any other reason; |
|
|
• |
delays in reaching agreement on acceptable terms with prospective CROs and clinical trial sites; |
|
|
• |
deviations from the trial protocol by clinical trial sites or investigators or failure to conduct a clinical trial in accordance with regulatory requirements; |
|
|
• |
failure of third parties, such as CROs, to satisfy their contractual duties or meet expected deadlines; |
|
|
• |
delays in the testing, validation and manufacturing of product candidates and in the delivery of these product candidates to clinical trial sites; |
|
|
• |
for clinical trials in selected patient populations, delays in identification and auditing of central or other laboratories or the transfer and validation of assays or tests used to identify selected patients; |
|
|
• |
delays in having patients complete participation in a clinical trial or return for post-treatment follow-up; |
|
|
• |
delays caused by patients dropping out of a clinical trial due to side effects, disease progression or other reasons; |
|
|
• |
withdrawal of clinical trial sites from our clinical trials as a result of changing standards of care or the ineligibility of a clinical trial site to participate in our clinical trials; or |
|
|
• |
changes in government regulations or administrative actions or lack of adequate funding to continue the clinical trials. |
Our or any of our partners’ inability to timely complete clinical development could result in additional costs to us or impair our ability to generate product revenue or to receive development, regulatory, commercialization or sales milestone payments and royalties on our product sales.
If we or our partners are unable to timely enroll patients in clinical trials, we will be unable to complete these trials on a timely basis.
The timely completion of clinical trials largely depends on the rate of patient enrollment. Many factors affect the rate of patient enrollment, including:
|
|
• |
the size and nature of the patient population; |
|
|
• |
the number and location of clinical sites; |
|
|
• |
competition with other companies for clinical sites or patients; |
|
|
• |
the eligibility and exclusion criteria for the trial; |
|
|
• |
the design of the clinical trial; |
|
|
• |
inability to obtain and maintain patient consents; |
|
|
• |
the availability of supplies of drug product for clinical use; |
|
|
• |
risk that enrolled subjects will drop out before completion; and |
|
|
• |
competing clinical trials and clinicians’ and patients’ perceptions as to the potential advantages of the drug being studied in relation to other available therapies, including any new drugs that may be approved for the indications we are investigating. |
28
For example, we are conducting a Phase 2 clinical trial of cabiralizumab in patients with diffuse PVNS. Very little data regarding the incidence and prevalence of diffuse PVNS exist, but data we have gathered suggest that the prevalence of diffuse PVNS in the United States may be approximately 25,000 patients. We expect that the limited size of the diffuse PVNS patient population will limit patient enrollment rates. Also, Daiichi Sankyo Co., Ltd./Plexxikon Inc. has recently conducted a Phase 3 clinical trial (ENLIVEN) of pexidartinib (PLX3397) in PVNS, Novartis AG is enrolling patients in its Phase 2 clinical trial of its MCS110 CSF1 monoclonal antibody in PVNS, and F. Hoffmann-La Roche AG, or Roche, has clinically tested its emactuzumab (RO5509554, RG7155) antibody in PVNS patients. If Novartis AG or Roche continue the clinical development of their products in PVNS, we would potentially compete with them for the enrollment in this rare patient population, which may adversely impact the rate of patient enrollment in and the timely completion of our Phase 2 clinical trial of cabiralizumab in PVNS. If Daiichi Sankyo Co., Ltd. should gain approval in any region where we are conducting clinical trials of cabiralizumab in PVNS, it may impact our ability to enroll and timely complete those trials.
Additionally, although we believe selecting gastric cancer patients whose tumors overexpress FGFR2b or amplify the FGFR2 gene using an IHC-based or a blood-based companion diagnostic should increase the percentage of patients eligible for and the probability of success in our clinical trial of FPA144 in gastric cancer, these selection criteria limit the number of patients eligible for enrollment.
There is significant competition for recruiting patients in the clinical trials we and our partners are conducting and plan to conduct, and we or our partners may be unable to timely enroll the patients necessary to complete clinical trials on a timely basis or at all.
We may not successfully identify, test, develop or commercialize potential product candidates, which may force us to abandon our development efforts for a program or programs.
The success of our business depends primarily upon our ability to identify and validate new protein therapeutic targets, including through the use of our discovery platform, and identify, test, develop and commercialize protein therapeutics, which we may develop ourselves or in-license from others. Our research efforts may initially show promise in discovering potential new protein therapeutic targets or candidates, yet fail to yield product candidates for clinical development for numerous reasons, including:
|
|
• |
our research methodology, including our screening technology, may not successfully identify medically relevant protein therapeutic targets or potential product candidates; |
|
|
• |
we tend to identify and select from our discovery platform novel, untested targets that may be challenging to validate because of the novelty of the target or that we may fail to validate at all after further research; |
|
|
• |
we may need to rely on third parties to generate antibody candidates for our product candidate programs; |
|
|
• |
we may encounter product manufacturing difficulties that limit yield or produce undesirable characteristics that increase the cost of goods, cause delays or make our product candidates unmarketable; |
|
|
• |
our product candidates may cause adverse effects in patients or subjects, even after successful initial toxicology studies, which may make our product candidates unmarketable; |
|
|
• |
our product candidates may not demonstrate a meaningful benefit to patients or subjects; or |
|
|
• |
our collaboration partners may change their development profiles or plans for potential product candidates or abandon a therapeutic area or the development of a partnered product. |
The occurrence of any of these events may force us to abandon our development efforts for a program or programs, which would have a material adverse effect on our business, operating results and prospects and could potentially cause us to cease operations. Research programs to identify new product targets and candidates require substantial technical, financial and human resources. We may focus our efforts and resources on potential discovery efforts, programs or product candidates that ultimately prove to be unsuccessful.
We are subject to a multitude of manufacturing risks, any of which could substantially increase our costs and limit supply of our products.
The process of manufacturing our products is complex and subject to several risks, including the following:
|
|
• |
The process of manufacturing biologics is susceptible to product loss due to contamination, equipment failure or improper installation or operation of equipment, or vendor or operator error. Even minor deviations from normal manufacturing processes could result in reduced production yields, product defects and other supply disruptions. If microbial, viral or other contaminations are discovered in our products or in the manufacturing facilities in which our products are made, such manufacturing facilities may need to be closed for an extended time to investigate and remedy the contamination. |
|
|
• |
The manufacturing facilities in which our products are made could be adversely affected by equipment failures, labor and raw material shortages, natural disasters, power failures and numerous other factors. |
29
Certain raw materials necessary for the manufacture of our products, such as growth media, resins and filters, are sourced from a single supplier. We do not have agreements in place that guarantee our supply or the price of these raw materials. Any significant delay in the acquisition or decrease in the availability of these raw materials could considerably delay the manufacture of our product candidates, which could adversely impact the timing of any planned trials or the regulatory approval of that product candidate.
We have process development and small-scale manufacturing capabilities. We do not have and we do not currently plan to acquire or develop the facilities or capabilities to manufacture bulk drug substance or filled drug product for use in human clinical trials or commercialization. In the past we have engaged, and we expect in the future to engage, third-party manufacturers for the manufacture of bulk drug substance and drug product for our products for our clinical trials and additional third parties for our supply chain. Any problems we experience with any of these third parties could delay the manufacturing of our product candidates, which could harm our results of operations.
For example, BMS has the exclusive right to manufacture cabiralizumab. Under our cabiralizumab collaboration agreement with BMS, BMS will supply us with cabiralizumab, at its cost and expense, for our use in the conduct of our clinical trial evaluating cabiralizumab in combination with Opdivo in multiple tumor types and our Phase 2 clinical trial of cabiralizumab in patients with PVNS and will supply us with cabiralizumab, in exchange for a service fee, for our conduct of our independent development activities with respect to cabiralizumab.
We have not contracted with alternate suppliers in the event the current organizations we utilize are unable to scale production or if we otherwise experience any problems with them. If we are unable to arrange for alternative third-party manufacturing sources, or are unable to do so on commercially reasonable terms or in a timely manner, we may be delayed in the development of our product candidates.
Our reliance on third-party manufacturers subjects us to risks to which we would not be subject if we manufactured product candidates or products internally, including failure of the third party to abide by regulatory and quality assurance requirements, the possibility of breach of the manufacturing agreement by the third party due to factors beyond our control (including the third party’s failure to manufacture our product candidates or any products we may eventually commercialize in accordance with our specifications) and the possibility of termination or nonrenewal of the agreement by the third party, based on its own business priorities, at a time that is costly or damaging to our business.
The regulatory approval processes of the FDA and comparable foreign regulatory authorities are lengthy, time-consuming and inherently unpredictable. Our inability to obtain regulatory approval for our product candidates would substantially harm our business.
The time required to obtain approval by the FDA and comparable foreign regulatory authorities is unpredictable but typically takes many years following the commencement of clinical trials and depends upon numerous factors, including the substantial discretion of the regulatory authorities. In addition, approval policies, regulations, or the type and amount of clinical data necessary to gain approval may change during a product candidate’s clinical development and may vary among jurisdictions. We have not obtained regulatory approval for any of our product candidates and it is possible that none of our existing product candidates or any future product candidates will ever obtain regulatory approval.
Our product candidates could fail to receive regulatory approval from the FDA or a comparable foreign regulatory authority for many reasons, including:
|
|
• |
the FDA’s or such comparable foreign regulatory authority’s disagreement with the design or implementation of our clinical trials; |
|
|
• |
our failure to demonstrate that a product candidate is safe and effective for its proposed indication; |
|
|
• |
the failure of our clinical trials to meet the level of statistical significance required for approval; |
|
|
• |
our failure to demonstrate that a product candidate’s clinical and other benefits outweigh its safety risks; |
|
|
• |
the FDA’s or such comparable foreign regulatory authority’s disagreement with our interpretation of data from preclinical studies or clinical trials; |
|
|
• |
the insufficiency of data collected from clinical trials of our product candidates to support the submission and filing of a Biologic License Application or other submission or to obtain regulatory approval; |
30
|
|
• |
our failure to obtain approval of the manufacturing processes or facilities of third-party manufacturers with whom we contract for clinical and commercial supplies; or |
|
|
• |
changes in the approval policies or regulations that render our preclinical and clinical data insufficient for approval. |
The FDA or a comparable foreign regulatory authority may require more information to support approval, including additional preclinical or clinical data, which may delay or prevent approval and our commercialization plans, or we may decide to abandon the development program. If we were to obtain approval, regulatory authorities may approve any of our product candidates for fewer or more limited indications than we request, may grant approval contingent on the performance of costly post-marketing clinical trials, or may approve a product candidate with a label that does not include the labeling claims necessary or desirable for the successful commercialization of that product candidate.
Our product candidates may cause undesirable side effects or have other properties that could delay or prevent their regulatory approval, limit the commercial profile of an approved label, or result in significant negative consequences following any marketing approval.
Undesirable side effects caused by our product candidates could cause us or regulatory authorities to interrupt, delay or halt clinical trials and could result in a more restrictive label or the delay or denial of regulatory approval by the FDA or other comparable foreign regulatory authority or otherwise limit the commercial potential of any such product candidates. Results of our clinical trials could reveal a high and unacceptable severity or prevalence of side effects or unexpected characteristics. In such an event, we could suspend or terminate our trials or the FDA or comparable foreign regulatory authorities could order us to cease clinical trials or deny approval of our product candidates for any or all targeted indications. Drug-related side effects could affect patient recruitment or the ability of enrolled subjects to complete the trial or could result in potential product liability claims. Any of these occurrences may harm our business, financial condition and prospects significantly.
Additionally, if one or more of our products receives marketing approval, and we or others later identify undesirable side effects caused by any such product, numerous potentially significant negative consequences could result, including:
|
|
• |
we may suspend marketing of, or withdraw or recall, such product; |
|
|
• |
regulatory authorities may withdraw approvals of such product; |
|
|
• |
regulatory authorities may require additional warnings on the label for such product; |
|
|
• |
the FDA or other regulatory bodies may issue safety alerts, Dear Healthcare Provider letters, press releases or other communications containing warnings about such product; |
|
|
• |
the FDA may require the establishment or modification of a risk evaluation and mitigation strategy, or REMS, or a comparable foreign regulatory authority may require the establishment or modification of a similar strategy that may, for instance, restrict distribution of such product and impose burdensome implementation requirements on us; |
|
|
• |
regulatory authorities may require that we conduct post-marketing studies; |
|
|
• |
we could be sued and held liable for harm caused to subjects or patients; and |
|
|
• |
our reputation may suffer. |
Any of these events could prevent us from achieving or maintaining market approval or acceptance for a product candidate or otherwise materially harm the commercial prospects for such product candidate, if approved, and could significantly harm our business, results of operations and prospects.
If we are unable to successfully develop companion diagnostics for FPA144, or experience significant delays in doing so, we may not achieve marketing approval or realize the full commercial potential of FPA144.
We are developing in parallel both an IHC assay and a blood-based (liquid biopsy) assay in collaboration with third-party diagnostic development partners to use as companion diagnostics for FPA144 to identify gastric cancer patients whose tumors overexpress FGFR2b or amplify the FGFR2 gene. We expect that the FDA and comparable foreign regulatory authorities may require the development and regulatory approval of at least one companion diagnostic as a condition to approving FPA144 for use in patients that overexpress the FGFR2b protein. We are initially seeking to develop FPA144 to treat a subset of gastric (stomach) cancer patients whose tumors overexpress the FGFR2b protein. Because the IHC-based companion diagnostic will allow us to determine FGFR2 amplification in tumor tissue samples from gastric cancer patients and the blood-based companion diagnostic will allow us to detect FGFR2 amplification by circulating tumor DNA, which is DNA shed from tumors that circulates in blood plasma outside of cells, from gastric cancer patients, we plan to use both companion diagnostics concurrently to more effectively identify these gastric cancer patients, both during our clinical trials and commercialization of FPA144.
31
We do not have experience or capabilities in developing or commercializing diagnostics and will depend in large part on the sustained cooperation and effort of our third-party collaborators to perform these functions.
If we or our third-party collaborators are unable to successfully develop companion diagnostics for FPA144 or experience delays in doing so:
|
|
• |
the development of FPA144 may be adversely affected because we may be unable to appropriately select patients for enrollment in our clinical trials; |
|
|
• |
FPA144 may not receive marketing approval if its safe and effective use depends on use of a companion diagnostic; or |
|
|
• |
we may not realize the full commercial potential of FPA144 if, among other reasons, we are unable to appropriately identify patients with FGFR2b protein overexpression. |
If any of these events were to occur, our business would be harmed, possibly materially.
Companion diagnostics are also subject to regulation by the FDA and comparable foreign regulatory authorities as medical devices and may require separate regulatory approval prior to commercialization, which may cause delays in developing the companion diagnostics and harm our business.
Even if our product candidates receive regulatory approval, they may still face future development and regulatory difficulties, which may inhibit our ability to commercialize our products and generate revenue.
Even if we obtain regulatory approval for a product candidate, the product would be subject to ongoing requirements by the FDA and comparable foreign regulatory authorities governing the manufacture, quality control, further development, labeling, packaging, storage, distribution, safety surveillance, import, export, advertising, promotion, recordkeeping and reporting of safety and other post-market information. The FDA and comparable foreign regulatory authorities will continue to closely monitor the safety profile of any product even after approval. If the FDA or comparable foreign regulatory authorities become aware of new safety information after approval of any of our product candidates, they may require labeling changes or establishment of a REMS or similar strategy, impose significant restrictions on the product’s indicated uses or marketing, or impose ongoing requirements for post-approval studies or post-market surveillance, which may be costly.
In addition, drug product manufacturers and their facilities are subject to continual review and periodic inspections by the FDA and other regulatory authorities for compliance with current Good Manufacturing Practices, or cGMP, regulations and standards. If we or a regulatory agency discover previously unknown problems with one of our product candidates, such as adverse events of unanticipated severity or frequency, or problems with the facility where such product is manufactured, a regulatory agency may impose restrictions on that product, the manufacturing facility or us, including requiring recall or withdrawal of such product from the market or suspension of manufacturing. If we, our product candidates or the manufacturing facilities for our product candidates fail to comply with applicable regulatory requirements, a regulatory agency may:
|
|
• |
issue warning letters or untitled letters; |
|
|
• |
mandate modifications to promotional materials or require us to provide corrective information to healthcare practitioners; |
|
|
• |
require us to enter into a consent decree, which can include imposition of various monetary fines, reimbursements for inspection costs, required due dates for specific actions and penalties for noncompliance; |
|
|
• |
seek an injunction or other court action to impose civil or criminal penalties or monetary fines; |
|
|
• |
suspend or withdraw regulatory approval; |
|
|
• |
suspend any ongoing clinical trials; |
|
|
• |
refuse to approve pending applications or supplements to applications filed by us; |
|
|
• |
suspend or impose restrictions on operations, including costly new manufacturing requirements; or |
|
|
• |
seize or detain products, refuse to permit the import or export of products, or require us to initiate a product recall. |
The occurrence of any event or penalty described above may inhibit our ability to commercialize our products and generate revenue.
32
Advertising and promotion of any product candidate that obtains approval in the United States will be heavily scrutinized by the FDA, the Department of Justice, the Department of Health and Human Services’ Office of Inspector General, state attorneys general, members of Congress and the public. Violations, including promotion of our products for unapproved or off-label uses, may be subject to enforcement letters, inquiries, investigations and civil and criminal sanctions by the government. Additionally, comparable foreign regulatory authorities will heavily scrutinize advertising and promotion of any product candidate that obtains approval outside of the United States.
In the United States, engaging in the impermissible promotion of products for off-label uses can also subject a company to false claims litigation under federal and state statutes, which can lead to civil and criminal penalties and fines and agreements that materially restrict the manner in which such company promotes or distributes drug products. These false claims statutes include the federal False Claims Act, which allows any individual to bring a lawsuit against a pharmaceutical company on behalf of the federal government alleging submission of false or fraudulent claims or that such company caused another entity or individual to present such false or fraudulent claims for payment by a federal program such as Medicare or Medicaid. If the government prevails in the lawsuit, the individual will receive a portion of any fines or settlement funds. Since 2004, these False Claims Act lawsuits against pharmaceutical companies have increased significantly in volume and breadth, leading to several substantial civil and criminal settlements regarding certain sales practices promoting off-label drug uses involving fines exceeding $1.0 billion. This growth in litigation has increased the risk that a pharmaceutical company will have to defend a false claims action, pay settlement fines or restitution, agree to comply with burdensome reporting and compliance obligations and be excluded from Medicare, Medicaid and other federal and state healthcare programs. If we do not lawfully promote our approved products, we may become subject to such litigation and, if we do not successfully defend against such actions, such actions may have a material adverse effect on our business, financial condition and results of operations.
The policies of the FDA or any comparable foreign regulatory agency may change and additional government regulations may be enacted that could prevent, limit or delay regulatory approval of our product candidates. If we are slow or unable to adapt to changes in existing requirements or the adoption of new requirements or policies, or if we are not able to maintain regulatory compliance, we may lose any marketing approval that we may have obtained, which would adversely affect our business, prospects and ability to achieve or sustain profitability.
Our failure to obtain regulatory approval in international jurisdictions would prevent us from marketing our product candidates outside the United States.
In order to market and sell our products in other jurisdictions, we must obtain separate marketing approvals and comply with numerous and varying regulatory requirements. The approval procedures vary among countries and can involve additional testing. The time required to obtain approval may differ substantially from that required to obtain FDA approval. The regulatory approval process outside the United States generally includes all the risks associated with obtaining FDA approval. In addition, in many countries outside the United States, we must secure product reimbursement approvals before regulatory authorities will approve a product for sale in that country. Obtaining foreign regulatory approvals and compliance with foreign regulatory requirements could result in significant delays, difficulties and costs for us and could delay or prevent the introduction of our products in certain countries. We may not obtain foreign regulatory approvals on a timely basis, if at all. Further, results and data from clinical trials conducted in one country may not be accepted by regulatory authorities in other countries, and regulatory approval in one country or by one regulatory authority outside the United States does not ensure approval by regulatory authorities in any other country or jurisdiction or by the FDA, while a failure or delay in obtaining regulatory approval for any of our product candidates in one country may have a negative effect on the regulatory approval process in other countries and may significantly diminish the commercial prospects of that product candidate, and our business prospects could decline. Also, regulatory approval for any of our product candidates may be withdrawn. If we fail to comply with the regulatory requirements in international markets and receive applicable marketing approvals, our target market for our product candidates will be reduced, our ability to realize the full market potential of our product candidates will be harmed and our business will be adversely affected.
We face substantial competition, which may result in others discovering, developing or commercializing products before or more successfully than we do.
The biotechnology industry is intensely competitive and subject to rapid and significant technological change. We face competition with respect to our current product candidates and will face competition with respect to any of our future product candidates from major pharmaceutical companies, specialty pharmaceutical companies and biotechnology companies worldwide. Many of our competitors have significantly greater financial, technical and human resources. Smaller and early-stage companies may also prove to be significant competitors, particularly through collaborative arrangements with large and established companies.
Our competitors may obtain regulatory approval of their products more rapidly than we may or may obtain patent protection or other intellectual property rights that limit our ability to develop or commercialize our product candidates. Our competitors may also develop drugs that are more effective, more convenient, more widely used and less costly or have better safety profiles than our products and these competitors may also be more successful than us in manufacturing and marketing their products.
33
Our competitors also compete with us in recruiting and retaining qualified scientific, management and commercial personnel, establishing clinical trial sites and enrolling patients for clinical trials, as well as in acquiring technologies complementary to, or necessary for, our programs.
Although there are no approved therapies that specifically target the signaling pathways that our product candidates are designed to modulate or inhibit, there are numerous currently-approved therapies for treating the same diseases or indications for which our product candidates may be useful and many of these currently-approved therapies act through mechanisms similar to those of our product candidates. Many of these approved drugs are well-established therapies or products and are widely accepted by physicians, patients and third-party payors. Some of these drugs are branded and subject to patent protection and others are available on a generic basis. Insurers and other third-party payors may also encourage the use of generic products or specific branded products. We expect that if our product candidates are approved, they will be priced at a significant premium over competitive generic, including branded generic, products. This may make it difficult for us to differentiate our products from currently-approved therapies, which may adversely impact our business strategy. In addition, many companies are developing new therapeutics and we cannot predict what the standard of care will be as our product candidates progress through clinical development.
If cabiralizumab were approved for the treatment of cancer or PVNS, it could face competition from products currently in development as single agents or in combination with anti-PD1/PD-L1 agents, including Roche’s emactuzumab (RO5509554, RG7155) anti-CSF1R antibody, Eli Lilly and Company’s IMC-CS4/LY3022855 anti-CSF1R antibody, Amgen Inc.’s AMG 820 anti-CSF1R antibody, Syndax Pharmaceuticals Inc.’s SNDX6352 anti-CSF1R monoclonal antibody, Pfizer Inc.’s PD-0360324 CSF1 monoclonal antibody, Novartis Pharmaceuticals Corporation’s BLZ945 CSF1R-directed small molecule and MCS110 CSF1 monoclonal antibody, Daiichi Sankyo Co., Ltd./Plexxikon Inc.’s pexidartinib (PLX3397) and PLX73086 small molecule tyrosine kinase inhibitors, or TKIs, Array Biopharma Inc.’s ARRY-382 CSF1R small molecule TKI or Deciphera Pharmaceuticals LLC’s DCC-3014 CSF1R small molecule TKI, with respect to immuno-oncology, and Daiichi Sankyo Co., Ltd./Plexxikon Inc.’s pexidartinib (PLX3397) and PLX73086 small molecule TKIs or Novartis Pharmaceuticals Corporation’s MCS110 CSF1 monoclonal antibody, with respect to PVNS, each of which act in the same pathway as cabiralizumab.
If FPA144 were approved for the treatment of gastric cancer, it could face competition from currently-approved and marketed products, including 5-fluorouracil, S-1, capecitabine, doxorubicin, cisplatin, oxaliplatin, carboplatin, paclitaxel, irinotecan, docetaxel and CyramzaTM (ramucirumab), and from products currently in early development, including AstraZeneca plc’s AZD-4547 and erdafitinib (JNJ-42756493) pan-FGFR small molecules and Daiichi Sankyo Co., Ltd.’s DS-1123 FGFR2 non isoform specific antibody, as well as antibodies that bind to PD-1/PD-L1, including BMS’s Opdivo monotherapy and Opdivo in combination with BMS’s Yervoy® (ipilimumab) anti-CTLA-4 antibody, Merck & Co., Inc.’s Keytruda® (pembrolizumab), Merck KGaA, Darmstadt, Germany/Pfizer Inc.’s Bavencio® (avelumab), Roche’s Tecentriq® (atezolizumab), AstraZeneca UK Limited/MedImmune, LLC’s ImfinziTM (durvalumab) anti-PD-L1 antibody, Astellas Pharma Inc.’s claudiximab (IMAB362) anti-Claudin 18.2 antibody and AstraZeneca UK Limited/MedImmune, LLC’s tremelimumab anti-CTLA4 antibody.
If FP-1039 were approved for the treatment of mesothelioma, it could face competition from currently-approved and marketed products, such as cisplatin and pemetrexed, or products in development, such as Boehringer Ingelheim GmbH’s FGF/PDGF/VEGF receptor kinase inhibitor OFEV® (nintedanib), Genentech, Inc./Roche’s Avastin® (bevacizumab), AstraZeneca UK Limited/MedImmune, LLC’s tremelimumab anti-CTLA4 antibody or Imfinzi anti-PD-L1 antibody, Merck & Co., Inc.’s Keytruda anti-PD1 antibody, BMS’s Opdivo anti-PD1 antibody used in combination with BMS’s Yervoy anti-CTLA-4 antibody, Morphotek, Inc.’s amatuximab (MORAb-009) IgG1 antibody, or Polaris Pharmaceuticals, Inc.’s ADI-PEG20 arginine degrading enzyme.
We believe that our ability to successfully compete will depend on, among other things:
|
|
• |
the efficacy and safety profile of our product candidates, including relative to marketed products and product candidates in development by third parties; |
|
|
• |
the time it takes for our product candidates to complete clinical development and receive marketing approval; |
|
|
• |
our or our partners’ ability to commercialize any of our product candidates that receive regulatory approval; |
|
|
• |
the price of our products, including in comparison to branded or generic competitors; |
|
|
• |
whether coverage and adequate levels of reimbursement are available under private and governmental health insurance plans, including Medicare; |
|
|
• |
our ability to establish, maintain and protect intellectual property rights related to our product candidates; |
|
|
• |
our and our partners’ ability to manufacture commercial quantities of any of our product candidates that receive regulatory approval; and |
|
|
• |
acceptance of any of our product candidates that receive regulatory approval by physicians and other healthcare providers. |
34
Our product candidates may not achieve adequate market acceptance among physicians, patients, healthcare payors and others in the medical community necessary for commercial success.
Even if our product candidates receive regulatory approval, they may not gain adequate market acceptance among physicians, patients, healthcare payors and others in the medical community. Our commercial success also depends on coverage and adequate reimbursement of our product candidates by third-party payors, including government payors, generally, which may be difficult or time-consuming to obtain, may be limited in scope and may not be obtained in all jurisdictions in which we may seek to market our products. The degree of market acceptance of any of our approved product candidates will depend on numerous factors, including:
|
|
• |
the efficacy and safety profile of the product candidate, as demonstrated in clinical trials; |
|
|
• |
the timing of market introduction of the product candidate as well as competitive products; |
|
|
• |
the clinical indications for which the product candidate is approved; |
|
|
• |
acceptance of the product candidate as a safe and effective treatment by physicians, clinics and patients; |
|
|
• |
the potential and perceived advantages of the product candidate over alternative treatments, including any similar generic treatments; |
|
|
• |
the cost of treatment in relation to alternative treatments; |
|
|
• |
the availability of coverage and adequate reimbursement and pricing by third parties and government authorities; |
|
|
• |
relative convenience and ease of administration; |
|
|
• |
the frequency and severity of adverse events; |
|
|
• |
the effectiveness of sales and marketing efforts; and |
|
|
• |
unfavorable publicity relating to the product candidate. |
If any product candidate is approved but does not achieve an adequate level of acceptance by physicians, hospitals, healthcare payors and patients, we may not generate or derive sufficient revenue from that product candidate and may not become or remain profitable.
Even if we commercialize any of our product candidates, our product candidates may become subject to unfavorable pricing regulations, third-party reimbursement practices or healthcare reform initiatives, which could harm our business.
The regulations that govern marketing approvals, pricing and reimbursement for new drug products vary widely from country to country. Current and future legislation may significantly change the approval requirements in ways that could involve additional costs and cause delays in obtaining approvals. Some countries require approval of the sale price of a drug before it can be marketed. In many countries, the pricing review period begins after marketing or product licensing approval is granted. In some foreign markets, prescription pharmaceutical pricing remains subject to continuing governmental control even after initial approval is granted. As a result, we might obtain marketing approval for a product in a particular country, but then be subject to price regulations that delay our commercial launch of the product, possibly for lengthy time periods, which could negatively impact the revenues we generate from the sale of the product in that particular country. Adverse pricing limitations may hinder our ability to recoup our investment in one or more product candidates even if those product candidates obtain marketing approval.
Our ability to commercialize any products successfully will also depend in part on the extent to which coverage and adequate reimbursement for these products and related treatments will be available from government health administration authorities, private health insurers and other organizations. Government authorities and other third-party payors, such as private health insurers and health maintenance organizations, determine which medications they will cover and establish reimbursement levels. Government authorities and other third-party payors have attempted to control costs by limiting coverage and reimbursement of medications. Increasingly, third-party payors are requiring that pharmaceutical companies provide them with predetermined discounts from list prices and are challenging the prices charged for medical products. We cannot be sure that coverage and reimbursement will be available for any product that we commercialize and, if reimbursement is available, what the level of reimbursement will be. Coverage and reimbursement may impact the demand for, or the price of, any product candidate for which we obtain marketing approval. If coverage and reimbursement are not available or reimbursement is available only to limited levels, we may not successfully commercialize any product candidate for which we obtain marketing approval.
35
There may be significant delays in obtaining coverage and reimbursement for newly approved drugs, and coverage may be more limited than the purposes for which the drug is approved by the FDA or comparable foreign regulatory authorities. Moreover, eligibility for coverage and reimbursement does not imply that a drug will be paid for in all cases or at a rate that covers our costs, including research, development, manufacture, sale and distribution. Interim reimbursement levels for new drugs, if applicable, may also not be sufficient to cover our costs and may only be temporary. Reimbursement rates may vary depending on the use of the drug and the clinical setting in which it is used, may be based on reimbursement levels already set for lower cost drugs and may be incorporated into existing payments for other services. Net prices for drugs may be reduced by mandatory discounts or rebates required by government healthcare programs or private payors and by any future relaxation of laws that presently restrict imports of drugs from countries where they may be sold at lower prices than in the United States. Our inability to promptly obtain coverage and profitable reimbursement rates from both government-funded and private payors for any approved products that we develop could have a material adverse effect on our operating results, our ability to raise capital needed to commercialize products and our overall financial condition.
Recently enacted and future legislation may increase the difficulty and cost for us to commercialize our product candidates and affect the prices we may obtain.
The United States and many foreign jurisdictions have enacted or proposed legislative and regulatory changes affecting the healthcare system that could prevent or delay marketing approval of our product candidates, restrict or regulate post-approval activities and affect our ability to profitably sell any product for which we obtain marketing approval.
In March 2010, the Patient Protection and Affordable Care Act, as amended by the Health Care and Education Reconciliation Act of 2010, or collectively the Affordable Care Act, was enacted, which includes measures that have significantly changed the way health care is financed by both governmental and private insurers. Some of the provisions of the Affordable Care Act have yet to be implemented, and there have been judicial and Congressional challenges to certain aspects of the Affordable Care Act. In January 2017, President Trump signed an Executive Order directing federal agencies with authorities and responsibilities under the Affordable Care Act to waive, defer, grant exemptions from, or delay the implementation of any provision of the Affordable Care Act that would impose a fiscal or regulatory burden on states, individuals, healthcare providers, health insurers, or manufacturers of pharmaceuticals or medical devices. The U.S. House of Representatives passed legislation known as the American Health Care Act of 2017 in May 2017. More recently, the Senate Republicans introduced and then updated a bill to replace the Affordable Care Act known as the Better Care Reconciliation Act of 2017. The Senate Republicans also introduced legislation to repeal the Affordable Care Act without companion legislation to replace it, and a “skinny” version of the Better Care Reconciliation Act of 2017. Each of these measures was rejected by the full Senate. Congress will likely consider other legislation to replace elements of the Affordable Care Act.. . We continue to evaluate the effect that the ACA and its possible repeal and replacement has on our business.
In addition, other legislative changes have been proposed and adopted since the Affordable Care Act was enacted. For example, in August 2011, then-President Obama signed into law the Budget Control Act of 2011, which, among other things, created the Joint Select Committee on Deficit Reduction to recommend to Congress proposals in spending reductions. The Joint Select Committee on Deficit Reduction did not achieve a targeted deficit reduction, which triggered the legislation’s automatic reduction to several government programs. This includes aggregate reductions to Medicare payments to providers of, on average, 2% per fiscal year through 2025 unless Congress takes additional action. Recently, there has been increasing legislative and enforcement interest in the United States with respect to specialty drug pricing practices. Specifically, there have been several recent U.S. Congressional inquiries and proposed bills designed to, among other things, bring more transparency to drug pricing, reduce the cost of prescription drugs under Medicare, review the relationship between pricing and manufacturer patient programs and reform government program reimbursement methodologies for drugs.
We expect that the healthcare reform measures that have been adopted and may be adopted in the future, may result in more rigorous coverage criteria and in additional downward pressure on the price that we receive for any approved product and could seriously harm our future revenues. Any reduction in reimbursement from Medicare or other government programs may result in a similar reduction in payments from private payors. The implementation of cost containment measures or other healthcare reforms may prevent us from being able to generate revenue, attain profitability or commercialize our products.
36
We may become subject to product liability lawsuits, which could cause us to incur substantial liabilities and may limit commercialization of any products we may develop.
We face an inherent risk of product liability exposure related to the testing of our product candidates in human clinical trials and will face an even greater risk if we commercially sell any products that we may develop. Product liability claims may be brought against us by subjects enrolled in our clinical trials, patients, healthcare providers or others using, administering or selling our products. If we cannot successfully defend ourselves against claims that our product candidates or products that we may develop caused injuries, we could incur substantial liabilities. Regardless of merit or eventual outcome, liability claims may result in:
|
|
• |
decreased demand for our product candidates or any products that we may develop; |
|
|
• |
termination of clinical trials at particular sites or entire trial programs; |
|
|
• |
injury to our reputation and significant negative media attention; |
|
|
• |
withdrawal of clinical trial participants; |
|
|
• |
significant costs to defend the related litigation; |
|
|
• |
substantial monetary awards payable to clinical trial subjects or patients; |
|
|
• |
loss of revenue; |
|
|
• |
diversion of management and scientific resources from our business operations; and |
|
|
• |
the inability to commercialize any products that we may develop. |
We currently hold $10 million in clinical trial liability insurance coverage, which may not adequately cover all liabilities that we may incur. We may not be able to maintain insurance coverage at a reasonable cost or in an amount adequate to satisfy any liability that may arise. We intend to expand our product liability insurance coverage to include the sale of commercial products if we obtain marketing approval for our product candidates in development, but we may be unable to obtain product liability insurance on commercially reasonable terms for any of our products that have been approved for marketing. Large judgments have been awarded in class action lawsuits based on drugs that had unanticipated side effects. A successful product liability claim or series of claims brought against us, particularly if judgments exceed our insurance coverage, could decrease our cash and adversely affect our business.
Our relationships with customers and third-party payors will be subject to applicable anti-kickback, fraud and abuse, transparency and other healthcare laws and regulations, which could expose us to criminal sanctions, civil penalties, contractual damages, reputational harm, administrative burdens and diminished profits and future earnings.
Healthcare providers, physicians and third-party payors play a primary role in the recommendation and prescription of any product candidates for which we obtain marketing approval. Our future arrangements with third-party payors and customers may expose us to broadly applicable fraud and abuse and other healthcare laws and regulations that may constrain the business or financial arrangements and relationships through which we market, sell and distribute our products for which we obtain marketing approval. Restrictions under applicable federal and state healthcare laws and regulations include the following:
|
|
• |
the federal Anti-Kickback Statute prohibits persons from, among other things, knowingly and willfully soliciting, offering, receiving or providing remuneration, directly or indirectly, in cash or in kind, to induce or reward, or in return for, the referral of an individual for the furnishing or arranging for the furnishing, or the purchase, lease or order, or arranging for or recommending purchase, lease or order, of any good or service for which payment may be made under a federal healthcare program such as Medicare or Medicaid; |
|
|
• |
the federal false claims laws, including the civil False Claims Act (which can be enforced by private citizens through whistleblower or qui tam actions), impose civil and criminal penalties against individuals or entities for knowingly presenting, or causing to be presented, to the federal government, claims for payment that are false or fraudulent or making a false statement to avoid, decrease or conceal an obligation to pay money to the federal government; |
|
|
• |
the federal Health Insurance Portability and Accountability Act of 1996, as amended by the Health Information Technology for Economic and Clinical Health Act of 2009, and its implementing regulations, or collectively HIPAA, imposes criminal liability for knowingly and willfully executing a scheme to defraud any healthcare benefit program, knowingly and willfully embezzling or stealing any money or other assets of a health care benefit program, willfully obstructing a criminal investigation of a health care fraud offense or knowingly and willfully making false statements relating to healthcare matters; |
37
|
|
• |
the federal Open Payments program requires manufacturers of drugs, devices, biologics or medical supplies for which payment is available under Medicare, Medicaid or the Children’s Health Insurance Program (with certain exceptions) to report annually to the U.S. Department of Health and Human Services information related to “payments or other transfers of value” made to physicians (defined to include doctors, dentists, optometrists, podiatrists and chiropractors) and teaching hospitals, as well as ownership and investment interests held by physicians (as defined above) and their immediate family members; and |
|
|
• |
analogous state and foreign laws and regulations, such as state anti-kickback and false claims laws, which may apply to sales or marketing arrangements and claims involving healthcare items or services reimbursed by non-governmental third-party payors, including private insurers; state and foreign laws that require pharmaceutical companies to comply with the pharmaceutical industry’s voluntary compliance guidelines and the relevant compliance guidance promulgated by the federal government or otherwise restrict payments that may be made to healthcare providers; state and foreign laws that require drug manufacturers to report information related to payments and other transfers of value to physicians and other healthcare providers or marketing expenditures; and state and foreign laws that govern the privacy and security of health information in certain circumstances, many of which differ from each other in significant ways and often are not preempted by HIPAA, thus complicating compliance efforts. |
Efforts to ensure that our business arrangements with third parties will comply with applicable healthcare laws and regulations will involve substantial costs. It is possible that governmental authorities will conclude that our business practices do not comply with current or future statutes, regulations or case law interpreting applicable fraud and abuse or other healthcare laws and regulations. If our operations are found to be in violation of any of these laws or any other governmental regulations that may apply to us, we may be subject to significant civil, criminal and administrative penalties, damages, fines, imprisonment, exclusion from government-funded healthcare programs, such as Medicare and Medicaid, additional reporting requirements and oversight if we become subject to a corporate integrity agreement or similar agreement to resolve allegations of non-compliance with these laws, reputational harm and the curtailment or restructuring of our operations. If any physician or other healthcare provider or entity with whom we expect to do business is found not to be in compliance with applicable laws, that person or entity may be subject to criminal, civil or administrative sanctions, including exclusions from government-funded healthcare programs.
We must attract and retain highly skilled employees in order to succeed.
We are experiencing significant growth in our operations as we expand the scope of our research and clinical activities, including our conduct of a Phase 2 clinical trial of cabiralizumab in PVNS, a Phase 1a/1b clinical trial of cabiralizumab in combination with Opdivo in multiple cancers, Phase 1 clinical trials of FPA144 in gastric cancer and bladder cancer and our preclinical development and immuno-oncology research activities. Our success will depend in part on our ability to manage our growth, including increases to our headcount, effectively. To succeed, we must continue to recruit, retain, manage and motivate qualified clinical, scientific, technical and management personnel and we face significant competition for experienced personnel. If we do not successfully attract and retain qualified personnel, particularly at the management level, it could adversely affect our ability to execute our business plan and harm our operating results. In particular, the loss of one or more of our executive officers could be detrimental to us if we cannot recruit suitable replacements in a timely manner. The competition for qualified personnel in the pharmaceutical field is intense and we may be unable to continue to attract and retain qualified personnel necessary for the development of our business or to recruit suitable replacement personnel.
Many of the other pharmaceutical companies against which we compete for qualified personnel have greater financial and other resources, different risk profiles and a longer history in the industry than we do. They also may provide more diverse opportunities and better chances for career advancement. Some of these characteristics may appeal more to high-quality candidates than what we offer. If we are unable to continue to attract and retain high-quality personnel, the rate and success at which we can discover and develop product candidates and our business will be limited.
38
Our operations are vulnerable to interruption by fire, earthquake, power loss, telecommunications failure, terrorist activity, political and economic instability in the countries in which we operate and other events beyond our control, which could harm our business.
Our computer and other systems, or those of our partners, CROs or other service providers, may fail or be interrupted, including due to fire, earthquake or other natural disasters, hardware, software, telecommunication or electrical failures or terrorism, or suffer security breaches, including due to computer viruses or unauthorized access, which could significantly disrupt or harm our business or operations. For example, a computing system failure could result in the loss of research or pre-clinical or clinical data important to our discovery, research or development programs, interrupt the conduct of ongoing experiments or otherwise impair our ability to operate, which could result in delays in the advancement of our programs or cause us to incur costs to recover or reproduce lost data. Our facility is in a seismically active region. We have not undertaken a systematic analysis of the potential consequences to our business and financial results from a major earthquake, fire, power loss, terrorist activity or other disaster and do not have a recovery plan for such disasters. In addition, we do not carry sufficient insurance to compensate us for actual losses from interruption of our business that may occur and any losses or damages incurred by us could harm our business. We maintain multiple copies of each of our protein libraries, most of which we maintain at our headquarters. We maintain one copy of each of our protein libraries offsite in Central California. If both facilities were impacted by the same event, we could lose all our protein libraries, which would have a material adverse effect on our ability to perform our obligations under our discovery collaborations and discover new targets.
Risks Related to Our Dependence on Third Parties
BMS has exclusive global rights for the development and commercialization of cabiralizumab. BMS’s failure to timely develop and/or commercialize cabiralizumab would result in a material adverse effect on our business and operating results.
We granted BMS an exclusive global license to develop and commercialize cabiralizumab, subject to certain rights that we retained. Our development collaboration with BMS on cabiralizumab may not be successful due to a number of factors, including the following:
|
|
• |
cabiralizumab may fail to demonstrate in clinical trials sufficient efficacy with an acceptable safety profile to support regulatory approval; |
|
|
• |
BMS may be unable to manufacture sufficient quantities of cabiralizumab in a timely or cost-effective manner; |
|
|
• |
BMS may be unable to obtain regulatory approval to commercialize cabiralizumab even if clinical and preclinical testing is successful; |
|
|
• |
BMS may not succeed in obtaining sufficient reimbursement for cabiralizumab; and |
|
|
• |
existing or future products or technologies developed by competitors may be safer, more effective or more conveniently delivered than cabiralizumab. |
In addition, we could be adversely affected by:
|
|
• |
BMS’s failure to timely perform its obligations under our collaboration agreement; |
|
|
• |
BMS’s failure to timely or fully develop or effectively commercialize cabiralizumab; or |
|
|
• |
a material contractual dispute with BMS. |
Any of the foregoing could adversely impact the likelihood and timing of any milestone payments we are eligible to receive and could result in a material adverse effect on our business, results of operations and prospects and would likely cause our stock price to decline.
BMS has the right to terminate our collaboration agreement without cause as well as upon the existence of certain conditions and, in some cases, BMS may terminate on short notice. BMS could also separately pursue alternative potentially competitive products, therapeutic approaches or technologies as a means of developing treatments for the diseases targeted by cabiralizumab.
39
We may not succeed in establishing and maintaining additional development collaborations, which could adversely affect our ability to develop and commercialize product candidates.
A part of our strategy is to enter into additional product development collaborations, including collaborations with major biotechnology or pharmaceutical companies. We face significant competition in seeking appropriate development partners and the negotiation process is time-consuming and complex. Moreover, we may not succeed in our efforts to establish a development collaboration or other alternative arrangements for any of our other existing or future product candidates and programs because our research and development pipeline may be insufficient, our product candidates and programs may be deemed to be at too early a stage of development for collaborative efforts or third parties may not view our product candidates and programs as having the requisite potential to demonstrate safety and efficacy. Even if we are successful in our efforts to establish new development collaborations, the terms that we agree upon may not be favorable to us and we may not be able to maintain such development collaborations if, for example, development or approval of a product candidate is delayed or sales of an approved product candidate are disappointing. Any delay in entering into new development collaboration agreements related to our product candidates could delay the development and commercialization of our product candidates and reduce their competitiveness if they reach the market.
Moreover, if we fail to establish and maintain additional development collaborations related to our product candidates:
|
|
• |
the development of certain of our current or future product candidates may be terminated or delayed; |
|
|
• |
our cash expenditures related to development of certain of our current or future product candidates would increase significantly and we may need to seek additional financing; |
|
|
• |
we may be required to hire additional employees or otherwise develop expertise, such as sales and marketing expertise, for which we have not budgeted; and |
|
|
• |
we will bear all the risk related to the development of any such product candidates. |
We rely on third-party CROs to conduct our clinical trials, and if those CROs perform in an unsatisfactory manner, it may harm our business.
We rely on CROs to perform most of the activities related to the conduct of our clinical trials, including site identification, screening, preparation, training, initiation and monitoring, document preparation and coordination, program management and data management. However, we do not directly control the conduct, timing, expense or quality of the performance of these activities. The performance of our CROs will impact the quality and validity of the results of our clinical trials, which we rely on for business planning purposes and include in submissions to regulatory authorities. Although we contract with CROs to conduct most clinical trial-related activities, we remain responsible for ensuring that each of our clinical trials is conducted in accordance with the applicable protocol and legal and regulatory requirements. Our reliance on CROs does not relieve us of our legal and regulatory responsibilities.
We and our CROs are required to comply with current Good Clinical Practices, or GCP, which are regulations and guidelines enforced by the FDA, the Competent Authorities of the Member States of the European Economic Area and comparable foreign regulatory authorities for all of our products in clinical development. Regulatory authorities enforce GCP requirements through periodic inspections of clinical trial sponsors, principal investigators and clinical trial sites. If we or any of our CROs fail to comply with applicable GCP, the clinical data generated in our clinical trials may be deemed unreliable and the FDA or comparable foreign regulatory authorities may require us to perform additional clinical trials before approving our marketing applications. We cannot ensure that upon inspection by a given regulatory authority, such regulatory authority will determine that any of our clinical trials comply with GCP requirements. In addition, we must conduct our clinical trials with product produced under cGMP requirements. Failure to comply with these regulations may require us to repeat preclinical and clinical trials, which would delay the regulatory approval process.
Our CROs are not our employees. Except for remedies available to us under our agreements with such CROs, we cannot control whether or not they devote sufficient time and resources to our ongoing clinical, nonclinical and preclinical programs. If our CROs do not successfully carry out their contractual duties or obligations or meet expected deadlines or if the quality or accuracy of the clinical data they obtain is compromised due to their failure to adhere to our clinical protocols, regulatory requirements or for other reasons, our clinical trials may be extended, delayed or terminated and we may not be able to obtain regulatory approval for or successfully commercialize our product candidates. As a result, our results of operations and the commercial prospects for our product candidates would be harmed, our costs could increase and our ability to generate revenues could be delayed.
40
Risks Related to Intellectual Property
If we are unable to obtain or protect intellectual property rights, we may not be able to compete effectively in our market.
Our success depends in significant part on our ability and the ability of our licensors and collaborators to obtain, maintain and defend patents and other intellectual property rights and to operate without infringing the intellectual property rights of others. We have filed numerous patent applications both in the United States and in foreign jurisdictions to obtain patent rights to inventions we have discovered. We have also licensed patent and other intellectual property rights to and from our partners. Some of these licenses give us the right to prepare, file and prosecute patent applications and maintain and enforce patents we have licensed, whereas other licenses may not give us such rights.
In some circumstances, we may not have the right to control the preparation, filing and prosecution of patent applications or to maintain the patents covering technology that we license to or from our partners, and we may have to rely on our partners to fulfill these responsibilities. Consequently, these patents and applications may not be prosecuted and enforced in a manner consistent with the best interests of our business. If our current or future licensors, licensees or collaborators fail to establish, maintain or protect such patents and other intellectual property rights, such rights may be reduced or eliminated. If our licensors, licensees or collaborators are not fully cooperative or disagree with us as to the prosecution, maintenance or enforcement of any patent rights, such patent rights could be compromised.
The patent prosecution process is expensive and time-consuming. We and our current or future licensors, licensees or collaborators may not be able to prepare, file and prosecute all necessary or desirable patent applications at a reasonable cost or in a timely manner. It is also possible that we or our licensors, licensees or collaborators will fail to file patent applications covering inventions made in the course of development and commercialization activities before a competitor files a patent application covering a similar, independently-developed invention. Such competitor’s patent application may pose obstacles to our ability to obtain patent protection.
The patent position of biotechnology and pharmaceutical companies generally is uncertain, involves complex legal and factual questions and is the subject of much litigation. As a result, the issuance, scope, validity, enforceability and commercial value of our and our current or future licensors’, licensees’ or collaborators’ patent rights are uncertain. Our and our licensors’, licensees’ or collaborators’ pending and future patent applications may not result in patents being issued that protect our technology or products, in whole or in part, or which effectively exclude others from commercializing competitive technologies and products. The patent examination process may require us or our licensors, licensees or collaborators to narrow the scope of the claims of our pending and future patent applications, which may limit the scope of protection if patents issue from such applications. Our and our licensors’, licensees’ or collaborators’ patent applications cannot be enforced against third parties practicing the technology claimed in such applications unless and until a patent issues from such applications, and then only to the extent the issued claims cover such technology.
Furthermore, given the amount of time required for the development, testing and regulatory review of new product candidates, patents protecting such candidates might expire before or shortly after such candidates are commercialized. As a result, our owned and licensed patent portfolios may not provide us with adequate protection against third parties seeking to commercialize products similar or identical to ours. We expect to request extensions of patent terms to the extent available in countries where we obtain issued patents. In the United States, the Drug Price Competition and Patent Term Restoration Act of 1984 permits a patent term extension of up to five years beyond the expiration of the patent. However, there are no assurances that the FDA or any comparable foreign regulatory authority will grant such extensions, in whole or in part. In such case, our competitors may launch their products earlier than might otherwise be anticipated.
We may not be able to protect our intellectual property rights throughout the world.
Filing, prosecuting, enforcing and defending patents on product candidates in all countries throughout the world would be prohibitively expensive, and our or our licensors’ or collaborators’ intellectual property rights in some countries outside the United States can be less extensive than those in the United States. Moreover, the requirements for patentability may differ in certain countries, particularly developing countries. For example, China has a heightened requirement for patentability and specifically requires a detailed description of medical uses of a claimed drug. Therefore, it may be more difficult to obtain patent protection in certain countries relative to others.
41
The laws of some foreign countries do not protect intellectual property rights to the same extent as federal and state laws in the United States. Consequently, we and our licensors or collaborators may not be able to prevent third parties from practicing our and our licensors’ or collaborators’ inventions in certain countries outside the United States. Competitors may use our and our licensors’ or collaborators’ technologies in jurisdictions where we have not obtained patent protection to develop their own products and further, may export otherwise infringing products to territories where we and our licensors or collaborators have patent protection but enforcement is not as strong as that in the United States. These products may compete with our product candidates and our and our licensors’ or collaborators’ patents or other intellectual property rights may not be effective or sufficient to prevent them from competing.
Many companies have encountered significant problems in protecting and defending intellectual property rights in foreign jurisdictions. The legal systems of certain countries, particularly certain developing countries, do not favor the enforcement of patents and other intellectual property protection, particularly those relating to biopharmaceuticals, which could make it difficult for us and our licensors or collaborators to stop the infringement of our and our licensors’ or collaborators’ patents or marketing of competing products in violation of our and our licensors’ or collaborators’ proprietary rights generally. Proceedings to enforce our and our licensors’ or collaborators’ patent rights in foreign jurisdictions could result in substantial costs and divert our and our licensors’ or collaborators’ efforts and attention from other aspects of our business, could put our and our licensors’ or collaborators’ patents at risk of being invalidated or interpreted narrowly or not issuing and could provoke third parties to assert counterclaims against us or our licensors or collaborators. We or our licensors or collaborators may not prevail in any lawsuits that we or our licensors or collaborators initiate and, even if we prevail, the damages or other remedies awarded, if any, may not be commercially meaningful.
Biosimilar drug manufacturers or other competitors may challenge the scope, validity or enforceability of our or our licensors’ or collaborators’ patents in countries outside the United States, requiring us or our licensors or collaborators to engage in complex, lengthy and costly litigation or other proceedings. Biosimilar drug manufacturers may develop, seek approval for, and launch biosimilar versions of our products. In addition to India, certain countries in Europe and developing countries, including China, have compulsory licensing laws under which a patent owner may be compelled to grant licenses to third parties. In those countries, we and our licensors or collaborators may have limited remedies if we or our licensors or collaborators are compelled to grant a license to a third party, which could materially diminish the value of our patents. This could limit our potential revenue opportunities. Accordingly, our and our licensors’ or collaborators’ efforts to enforce intellectual property rights around the world may be inadequate to obtain a significant commercial advantage from the intellectual property that we own or license.
Changes in patent law could diminish the value of patents in general, thereby impairing our ability to protect our product candidates.
Obtaining and enforcing patents in the biopharmaceutical industry is inherently uncertain, due in part to ongoing changes in the patent laws. Depending on decisions by Congress, the federal courts, and the U.S. Patent and Trademark Office, or USPTO, the laws and regulations governing patents could change in unpredictable ways that could weaken our and our licensors’ or collaborators’ ability to obtain new patents or to enforce existing or future patents. For example, the Supreme Court has ruled on several patent cases in recent years, either narrowing the scope of patent protection available in certain circumstances or weakening the rights of patent owners in certain situations. Therefore, there is increased uncertainty with regard to our and our licensors’ or collaborators’ ability to obtain patents in the future, as well as uncertainty with respect to the value of patents once obtained.
Recent patent reform legislation could increase the uncertainties and costs surrounding the prosecution of our and our licensors’ or collaborators’ patent applications and the enforcement or defense of our or our licensors’ or collaborators’ issued patents. On September 16, 2011, the Leahy-Smith America Invents Act, or the Leahy-Smith Act, was signed into law. The Leahy-Smith Act includes numerous significant changes to U.S. patent law. These include provisions that affect the way patent applications are prosecuted and may also affect patent litigation. The USPTO recently developed new regulations and procedures to govern administration of the Leahy-Smith Act, and many of the substantive changes to patent law associated with the Leahy-Smith Act, and in particular, the first to file provisions, only became effective on March 16, 2013. Accordingly, it is not clear what, if any, impact the Leahy-Smith Act will have on the operation of our business. However, the Leahy-Smith Act and its implementation could increase the uncertainties and costs surrounding the prosecution of our or our licensors’ or collaborators’ patent applications and the enforcement or defense of our or our licensors’ or collaborators’ issued patents, all of which could have a material adverse effect on our business and financial condition.
42
Obtaining and maintaining our patent protection depends on compliance with various procedural, document submission, fee payment and other requirements imposed by governmental patent agencies, and our patent protection could be reduced or eliminated if we fail to comply with these requirements.
Periodic maintenance and annuity fees on any issued patent are required to be paid to the USPTO and foreign patent agencies in several stages over the lifetime of the patent. The USPTO and various foreign patent agencies also require compliance with a number of procedural, documentary, fee payment and other similar requirements during the patent application and prosecution process. Non-compliance events that could result in abandonment or lapse of a patent or patent application include failure to respond to official communications within prescribed time limits, non-payment of fees and failure to properly legalize and submit formal documents. While an inadvertent lapse can in many cases be cured by payment of a late fee or by other means in accordance with the applicable rules, there are situations in which non-compliance can result in irrevocable abandonment or lapse of the patent or patent application, resulting in partial or complete loss of patent rights in the relevant jurisdiction. If we or our licensors or collaborators fail to maintain the patents and patent applications covering our product candidates, our competitors might be able to enter the market, which would have a material adverse effect on our business.
We may become involved in lawsuits to protect or enforce our intellectual property, which could be expensive, time-consuming and unsuccessful and have a material adverse effect on the success of our business.
Third parties may infringe our or our licensors’ or collaborators’ patents or misappropriate or otherwise violate our or our licensors’ or collaborators’ intellectual property rights. In the future, we or our licensors or collaborators may initiate legal proceedings to enforce or defend our or our licensors’ or collaborators’ intellectual property rights or to protect our or our licensors’ or collaborators’ trade secrets. The outcome of such proceedings may determine or alter the validity or scope of intellectual property rights we own or control. Also, third parties may initiate legal proceedings against us or our licensors or collaborators to challenge the validity or scope of intellectual property rights we own or control. These proceedings can be expensive and time-consuming and many of our or our licensors’ or collaborators’ adversaries in these proceedings may have the ability to dedicate substantially greater resources to prosecuting these legal actions than we or our licensors or collaborators can. Accordingly, despite our or our licensors’ or collaborators’ efforts, we or our licensors or collaborators may not prevent third parties from infringing or misappropriating intellectual property rights we own or control, particularly in countries where the laws may not protect those rights as fully as in the United States. Litigation could result in substantial costs and diversion of management resources, which could harm our business and financial results. In addition, in a patent infringement proceeding, a court may decide that a patent owned by or licensed to us is invalid or unenforceable, or may refuse to impose monetary damages or enjoin the other party from using the technology at issue on the grounds that our or our licensors’ or collaborators’ patents do not cover the technology in question. An adverse result in any litigation proceeding could put one or more of our or our licensors’ or collaborators’ patents at risk of being invalidated, held unenforceable or interpreted narrowly.
Derivation or interference proceedings in the United States or equivalent proceedings in other jurisdictions may be necessary to determine the priority of inventions with respect to our or our licensors’ or collaborators’ patents or patent applications. An unfavorable outcome could require us or our licensors or collaborators to cease using the related technology and commercializing our product candidates or to attempt to license rights to it from the prevailing party. Our business could be harmed if the prevailing party does not offer us or our licensors or collaborators a license or offers a license on terms that are not on commercially reasonable. Even if we or our licensors or collaborators obtain a license, it may be non-exclusive, thereby giving our competitors access to the same technologies licensed to us or our licensors or collaborators. In addition, if the breadth or strength of protection provided by our or our licensors’ or collaborators’ patents and patent applications is threatened, it could dissuade companies from collaborating with us to license, develop or commercialize current or future product candidates. Even if we prevail in such a proceeding, we may incur substantial costs and it may distract our management and other employees.
43
If we breach the agreements under which third parties have licensed intellectual property rights to us, we could lose the ability to use certain of our technologies or continue the development and commercialization of our product candidates.
Our commercial success depends upon our ability, and the ability of our licensors and collaborators, to discover and validate protein therapeutic targets and to identify, test, develop, manufacture, market and sell product candidates without infringing the proprietary rights of third parties. A third party may hold intellectual property rights, including patent rights, that are important or necessary to the development or commercialization of our products. As a result, we are a party to a number of licenses that are important to our business and expect to enter into additional licenses in the future. For example, we have entered into a non-exclusive license with BioWa, Inc. and Lonza Sales AG to use their Potelligent® CHOK1SV technology, which is necessary to produce our FPA144 antibody; an exclusive license with INBRX 110 LP to antibodies to GITR, which we are preclinically developing in our FPA154 program; and non-exclusive licenses with each of the National Research Council of Canada and the Board of Trustees of the Leland Stanford Junior University to use materials and technologies that we use in the production of our protein library. If we fail to comply with the obligations under these agreements, including payment and diligence terms, our licensors may have the right to terminate these agreements, in which event we may not be able to develop, manufacture, market or sell any product that is covered by these agreements or may face other penalties under the agreements. Such an occurrence could materially adversely affect the value of the product candidate being developed under any such agreement. Termination of these agreements or reduction or elimination of our rights under these agreements may result in our having to negotiate new or reinstated agreements, which may not be available to us on equally favorable terms, or at all, or cause us to lose our rights under these agreements, including our rights to intellectual property or technology important to our development programs.
Third parties may initiate legal proceedings against us alleging that we infringe their intellectual property rights or we may initiate legal proceedings against third parties to challenge the validity or scope of intellectual property rights controlled by such third parties, the outcome of which would be uncertain and could have a material adverse effect on the success of our business.
Third parties may initiate legal proceedings against us or our licensors or collaborators alleging that we or our licensors or collaborators infringe their intellectual property rights or we or our licensors or collaborators may initiate legal proceedings against third parties to challenge the validity or scope of intellectual property rights controlled by such third parties, including in oppositions, interferences, reexaminations, inter partes reviews or derivation proceedings in the United States or other jurisdictions. These proceedings can be expensive and time-consuming and many of our or our licensors’ or collaborators’ adversaries in these proceedings may have the ability to dedicate substantially greater resources to prosecuting these legal actions than we or our licensors or collaborators can.
An unfavorable outcome could require us or our licensors or collaborators to cease using the related technology or developing or commercializing our product candidates, or to attempt to license any necessary rights from the prevailing party. Our business could be harmed if the prevailing party does not offer us or our licensors or collaborators a license, or otherwise offers a license on terms that are not commercially reasonable. Even if we or our licensors or collaborators obtain a license, it may be non-exclusive, thereby giving our competitors access to the same technologies licensed to us or our licensors or collaborators. In addition, we could be found liable for monetary damages, including treble damages and attorneys’ fees, if we are found to have willfully infringed a patent. A finding of infringement could prevent us from commercializing our product candidates or force us to cease some of our business operations, which could materially harm our business.
Furthermore, because of the substantial amount of discovery required in connection with intellectual property litigation, there is a risk that some of our confidential information could be compromised by disclosure during this type of litigation. There could also be public announcements of the results of hearings, motions or other interim proceedings or developments. If securities analysts or investors perceive these results to be negative, it could have a material adverse effect on the price of shares of our common stock.
In May 2011, the European Patent Office, or the EPO, granted European Patent No. 2092069, or the ’069 patent, to Aventis Pharma S.A., or Aventis. The ’069 patent included claims regarding soluble fibroblast growth factor receptor Fc fusion proteins having certain levels of glycosylation, some of which claims could have been relevant to our FP-1039 product candidate. In February 2012, we filed an opposition to the ’069 patent. In March 2013, we attended oral proceedings before the Opposition Division of the EPO and presented our arguments regarding our opposition to the ’069 patent. In April 2013, the Opposition Division of the EPO published an Interlocutory Decision regarding the outcome of the oral proceedings. In the Interlocutory Decision, the EPO maintained certain claims of the ’069 patent covering FGFR2 fusion proteins, but not FGFR1 fusion proteins such as FP-1039. Although this proceeding has concluded, Aventis has pursued claims in other countries that are similar to those originally granted by the EPO in the ’069 patent and we may need to initiate similar opposition or other legal proceedings in other jurisdictions with respect to patents that may issue with similar scope of claims as those originally granted in the ’069 patent. If we unsuccessfully oppose Aventis’ similar patents in a country, we could be required to obtain a license from Aventis to continue developing and commercializing FP-1039 in that country.
44
We may be subject to claims by third parties asserting that we or our employees have misappropriated their intellectual property or claiming ownership of what we regard as our own intellectual property.
Many of our employees, including our senior management, were previously employed at universities or at other biotechnology or pharmaceutical companies, including our competitors or potential competitors. Some of these employees executed proprietary rights, non-disclosure and non-competition agreements in connection with such previous employment. Although we try to ensure that our employees do not use the proprietary information or know-how of others in their work for us, we may be subject to claims that we or our employees have used or disclosed confidential information or intellectual property, including trade secrets or other proprietary information, of any such employee’s former employer. Litigation may be necessary to defend against these claims.
If we fail in defending against any such claims, in addition to paying monetary damages, we may lose valuable intellectual property rights or personnel or sustain damages. Such intellectual property rights could be determined to be owned by a third party, and we could be required to obtain a license from such third party to commercialize our technology or products. Such a license may not be available or may not be available on commercially reasonable terms. Even if we successfully defend against such claims, litigation could result in substantial costs and distract management.
Our inability to protect our confidential information and trade secrets would harm our business and competitive position.
In addition to seeking patents for some of our technology and products, we also rely on trade secrets, including unpatented know-how, technology and other proprietary information, to maintain our competitive position. We seek to protect these trade secrets, in part, by entering into non-disclosure and confidentiality agreements with parties who have access to them, such as our employees, corporate collaborators, outside scientific collaborators, contract manufacturers, consultants, advisors and other third parties. We also enter into confidentiality and invention, including patent, assignment agreements with our employees and consultants. Despite these efforts, any of these parties, including their current or former employees or consultants, may breach the agreements and disclose our proprietary information, including our trade secrets, and we may not be able to obtain adequate remedies for such breaches. However, enforcing a claim that a party illegally disclosed or misappropriated a trade secret is difficult, expensive and time-consuming, and the outcome is unpredictable. In addition, some courts both within and outside the United States may be less willing or unwilling to protect trade secrets. If a competitor lawfully obtained or independently developed any of our trade secrets, we would have no right to prevent such competitor from using that technology or information to compete with us, which could harm our competitive position.
Risks Related to the Ownership of Our Common Stock
The market price of our stock may be volatile.
The trading price of our common stock has been and is likely to continue to be volatile. Since shares of our common stock were sold in our IPO in September 2013, our closing stock price as reported on The NASDAQ Global Market and The NASDAQ Global Select Market has ranged from $8.49 to $60.98 through August 7, 2017. The following factors, in addition to other risk factors described in this section and elsewhere in this report, may have a significant impact on the market price of our common stock:
|
|
• |
the success of competitive products or technologies; |
|
|
• |
regulatory actions with respect to our products or our competitors’ products; |
|
|
• |
actual or anticipated changes in our or our partners’ growth rates relative to our competitors; |
|
|
• |
announcements by us, our partners or our competitors of significant acquisitions, strategic collaborations, joint ventures, collaborations or capital commitments; |
|
|
• |
results of clinical trials of our product candidates or those of our competitors; |
|
|
• |
failure of our partners to effectively execute or changes in our partners’ strategies with respect to our products or collaborations; |
|
|
• |
regulatory or legal developments in the United States and other countries; |
|
|
• |
developments or disputes concerning patent applications, issued patents or other proprietary rights; |
|
|
• |
our dependence on third parties, including contract manufacturers, CROs and any partners we may engage to develop and provide us with companion diagnostic products; |
|
|
• |
the recruitment or departure of key personnel; |
|
|
• |
the level of expenses related to any of our product candidates or clinical development programs; |
|
|
• |
the results of our efforts to in-license or acquire additional product candidates or products; |
45
|
|
• |
actual or anticipated changes in estimates as to financial results, development timelines or recommendations by securities analysts; |
|
|
• |
variations in our financial results or those of companies that are perceived to be similar to us; |
|
|
• |
fluctuations in the valuation of companies perceived by investors to be comparable to us; |
|
|
• |
share price and volume fluctuations attributable to inconsistent trading volume levels of our shares; |
|
|
• |
announcements or expectations of additional financing efforts; |
|
|
• |
sales of our common stock by us, our insiders or our other stockholders; |
|
|
• |
changes in the structure of healthcare payment systems; |
|
|
• |
market conditions in the pharmaceutical and biotechnology sectors; and |
|
|
• |
general economic, industry, political and market conditions. |
In addition, the stock market in general, and The NASDAQ Global Select Market and biotechnology companies in particular, have experienced extreme price and volume fluctuations that have often been unrelated or disproportionate to the operating performance of these companies. Broad market and industry factors may negatively affect the market price of our common stock, regardless of our actual operating performance. The realization of any of the above risks or any of a broad range of other risks, including those described in this “Risk Factors” section, could have a dramatic and material adverse impact on the market price of our common stock.
We may be subject to securities litigation, which is expensive and could divert management attention.
The market price of our common stock may be volatile, and in the past, companies that have experienced volatility in the market price of their stock have been subject to securities class action litigation. We may be the target of this type of litigation in the future. Securities litigation against us could result in substantial costs and divert our management’s attention from other business concerns, which could seriously harm our business.
Our principal stockholders and management own a significant percentage of our stock and may be able to exert significant control over matters subject to stockholder approval.
As of June 30, 2017, our executive officers, directors, holders of 5% or more of our capital stock and their respective affiliates beneficially owned approximately 54% of our common stock. This concentration of share ownership may adversely affect the trading price of our common stock because investors often perceive disadvantages in owning stock in companies with controlling stockholders. As a result, these stockholders, acting together, could significantly influence all matters requiring approval by our stockholders, including the election of directors and the approval of mergers or other business combination transactions. The interests of these stockholders may not always coincide with our interests or the interests of other stockholders.
Sales of a substantial number of shares of our common stock in the public market by our existing stockholders could cause our stock price to fall.
Sales of a substantial number of shares of our common stock in the public market or the perception that these sales might occur could depress the market price of our common stock and could impair our ability to raise capital through the sale of additional equity securities. We are unable to predict the effect that sales may have on the prevailing market price of our common stock.
Some of the holders of our securities are entitled to rights with respect to the registration of their shares under the Securities Act of 1933, as amended, or the Securities Act. Registration of these shares under the Securities Act would result in the shares becoming freely tradable without restriction under the Securities Act, except for shares held by our affiliates, as defined in Rule 144 under the Securities Act. Any sales of securities by these stockholders could have a material adverse effect on the trading price of our common stock.
Our disclosure controls and procedures may not prevent or detect all errors or acts of fraud.
We are subject to the periodic reporting requirements of the Exchange Act. We designed our disclosure controls and procedures to reasonably assure that information we must disclose in reports we file or submit under the Exchange Act is accumulated and communicated to management, and recorded, processed, summarized and reported within the time periods specified in the rules and forms of the SEC. We believe that any disclosure controls and procedures or internal controls and procedures, no matter how well-conceived and operated, can provide only reasonable, not absolute, assurance that the objectives of the control system are met.
46
These inherent limitations include the realities that judgments in decision-making can be faulty, and that breakdowns can occur because of simple error or mistake. Additionally, controls can be circumvented by the individual acts of some persons, by collusion of two or more people or by an unauthorized override of the controls. Accordingly, because of the inherent limitations in our control system, misstatements due to error or fraud may occur and not be detected.
Some provisions of our charter documents and Delaware law may have anti-takeover effects that could discourage an acquisition of us by others, even if an acquisition would benefit our stockholders, and may prevent attempts by our stockholders to replace or remove our current management.
Provisions in our amended and restated certificate of incorporation and amended and restated bylaws, as well as provisions of Delaware law, could make it more difficult or costly for a third party to acquire us, even if doing so would benefit our stockholders, and could make it more difficult to remove our current management. These provisions include:
|
|
• |
authorizing the issuance of “blank check” preferred stock, the terms of which we may establish and shares of which we may issue without stockholder approval; |
|
|
• |
prohibiting cumulative voting in the election of directors, which would otherwise allow for less than a majority of stockholders to elect director candidates; |
|
|
• |
prohibiting stockholder action by written consent, thereby requiring all stockholder actions to be taken at a meeting of our stockholders; |
|
|
• |
eliminating the ability of stockholders to call a special meeting of stockholders; and |
|
|
• |
establishing advance notice requirements for nominations for election to the board of directors or for proposing matters that can be acted upon at stockholder meetings. |
These provisions may frustrate or prevent any attempts by our stockholders to replace or remove our current management by making it more difficult for stockholders to replace members of our board of directors, who are responsible for appointing the members of our management. Because we are incorporated in Delaware, we are governed by the provisions of Section 203 of the General Corporation Law of the State of Delaware, or the DGCL, which may discourage, delay or prevent someone from acquiring us or merging with us whether or not it is desired by or beneficial to our stockholders. Under the DGCL, a corporation may not, in general, engage in a business combination with any holder of 15% or more of its capital stock unless the holder has held the stock for three years or, among other things, the board of directors has approved the transaction. Any provision of our amended and restated certificate of incorporation or amended and restated bylaws or Delaware law that has the effect of delaying or deterring a change of control could limit the opportunity for our stockholders to receive a premium for their shares of our common stock, and could also affect the price that some investors are willing to pay for our common stock.
47
The exhibits filed as part of this Quarterly Report on Form 10-Q are set forth on the Exhibit Index, which are incorporated herein by reference.
48
Pursuant to the requirements of the Securities Exchange Act of 1934, the registrant has duly caused this report to be signed on its behalf by the undersigned thereunto duly authorized.
|
|
|
Five Prime Therapeutics, Inc. |
|
|
|
(Registrant) |
|
|
|
|
|
|
|
/s/ Lewis T. Williams |
|
Date: August 8, 2017 |
|
Lewis T. Williams |
|
|
|
President, Chief Executive Officer and Chairman of the Board |
|
|
|
(Principal Executive Officer) |
|
|
|
|
|
|
|
/s/ Marc L. Belsky |
|
Date: August 8, 2017 |
|
Marc L. Belsky |
|
|
|
Senior Vice President and Chief Financial Officer |
|
|
|
(Principal Financial and Accounting Officer) |
49
|
Exhibit |
|
Description |
|
|
|
|
|
3.1 |
|
|
|
v |
|
|
|
3.2 |
|
|
|
|
|
|
|
31.1 |
|
|
|
|
|
|
|
31.2 |
|
|
|
|
|
|
|
32.1* |
|
|
|
|
|
|
|
32.2* |
|
|
|
|
|
|
|
101 |
|
Financial statements from the Quarterly Report on Form 10-Q of the Company for the quarter ended June 30, 2017, formatted in XBRL (eXtensible Business Reporting Language): (i) the Condensed Balance Sheets; (ii) the Condensed Statements of Operations; (iii) the Condensed Statements of Comprehensive Loss; (iv) the Condensed Statements of Cash Flows; and (v) Notes to Condensed Financial Statements. |
|
* |
Furnished herewith and not deemed to be “filed” for purposes of Section 18 of the Securities Exchange Act of 1934, as amended (the “Exchange Act”), and shall not be deemed to be incorporated by reference into any filing under the Securities Act of 1933, as amended, or the Exchange Act (whether made before or after the date of the Form 10-Q), irrespective of any general incorporation language contained in such filing. |
50