Attached files
| file | filename |
|---|---|
| 8-K - FORM 8-K - Bluerock Residential Growth REIT, Inc. | tv495726_8k.htm |
Exhibit 99.1

NAREIT – June 2018
Forward - Looking Statements The information in this presentation has been prepared solely for informational purposes by Bluerock Residential Growth REIT, Inc . (“BRG”) and does not constitute an offer to sell or the solicitation of an offer to purchase any securities . This presentation is not, and should not be assumed to be, complete . This presentation has been prepared to assist interested parties in making their own evaluation of BRG and does not purport to contain all of the information that may be relevant . In all cases, interested parties should conduct their own investigation and analysis of BRG and the data set forth in this presentation and other information provided by or on behalf of BRG . In addition, certain of the information contained herein may be derived from information provided by industry sources . BRG believes that such information is accurate and that the sources from which it has been obtained are reliable . BRG cannot guarantee the accuracy of such information, however, and has not independently verified such information . The information presented herein remains subject to change . Statements in this presentation are made as of the date of this presentation unless stated otherwise . This presentation also contains statements that, to the extent they are not recitations of historical fact, constitute “forward - looking statements . ” Forward - looking statements are typically identified by the use of terms such as “may,” “should,” “expect,” “could,” “intend,” “plan,” “anticipate,” “estimate,” “believe,” “continue,” “predict,” “potential” or the negative of such terms and other comparable terminology . The forward - looking statements included herein are based upon BRG’s current expectations, plans, estimates, assumptions and beliefs that involve numerous risks and uncertainties . Assumptions relating to the foregoing involve judgments with respect to, among other things, future economic, competitive and market conditions and future business decisions, all of which are difficult or impossible to predict accurately and many of which are beyond BRG’s control . Although BRG believes that the expectations reflected in such forward - looking statements are based on reasonable assumptions, BRG’s actual results and performance and the value of its securities could differ materially from those set forth in the forward - looking statements due to the impact of many factors including, but not limited to, the uncertainties of real estate development, acquisition and disposition activity, the ability of our joint venture partners to satisfy their obligations, the costs and availability of financing, the effects of local economic and market conditions, the effects of acquisitions and dispositions, the impact of newly adopted accounting principles on BRG’s accounting policies and on period - to - period comparisons of financial results, regulatory changes and other risks and uncertainties detailed in the “Risk Factors” in Item 1 . A . Risk Factors section of the Company’s Annual Report on Form 10 - K filed with the U . S . Securities and Exchange Commission on March 13 , 2018 , and other discussions of risk factors contained in BRG’s periodic filings . BRG claims the safe harbor protection for forward looking statements contained in the Private Securities Litigation Reform Act of 1995 . BRG undertakes no obligation to update or revise any such information for any reason after the date of this presentation, unless required by law .

BRG Strategy Overview Focus on Knowledge - Economy Growth Markets Build a Highly Amenitized Live/Work/Play Portfolio Create Value with Core+ and Development Strategies 3 Owner of highly amenitized apartment communities – places to live, play, interact & socialize – in Knowledge - Economy growth markets

4 30 16 Well - Aligned Management Team with 26 Years Average Experience Years at Bluerock Real Estate Years in the Industry Ramin Kamfar CHAIRMAN & CEO Jordan Ruddy PRESIDENT & COO James Babb CHIEF INVESTMENT OFFICER Ryan MacDonald CHIEF ACQUISITIONS OFFICER Accounting | Asset Management | Administrative Financing | Legal | Regulatory | Reporting ~40 Dedicated Employees 30 16 29 11 13 10

Favorable Long Term Demographic and Homeownership Trends Sources: JCHS tabulations of U.S. Census Bureau, 2013 American Community Survey. Urban Institute, “Headship and Homeownership : W hat does the Future Hold?”, June 2015. U.S. Census Bureau, MPF Research, 2014. Notes Millennials projected to generate 30 MM+ additional households over next 15 years 5 Homeownership decline a long - term trend across all age groups

6 Transformation Into a Knowledge Economy / Workforce Source: Bureau of Labor Statistics and U.S. Census Bureau; Current Statistics on White Collar Employees, 2003, AFL - CIO; The Broo kings Institution: America’s Advanced Industries. Notes U . S . transforming from Industrial Economy to Knowledge Economy Wage growth in knowledge - based jobs ~ 4 x non - knowledge - based jobs since 1975 White collar, as % of total U.S. workforce Average earnings per worker (inflation adjusted) Advanced Industries: +68% Non - Advanced Industries: +25%

7 0 350 700 1,050 1,400 1,750 2,100 2,450 1970 1971 1972 1973 1974 1975 1976 1977 1978 1979 1980 1981 1982 1983 1984 1985 1986 1987 1988 1989 1990 1991 1992 1993 1994 1995 1996 1997 1998 1999 2000 2001 2002 2003 2004 2005 2006 2007 2008 2009 2010 2011 2012 2013 2014 2015 2016 2017 Avg since '70: 1.4MM Development remains well below historic peaks Trailing Twelve Month Housing Unit Completions (1) Total Residential Supply Remains Benign Source: U.S. Census Bureau (1) Figures in thousands, not seasonally adjusted. Notes T - 12m Total Housing Units T - 12m Multifamily Units
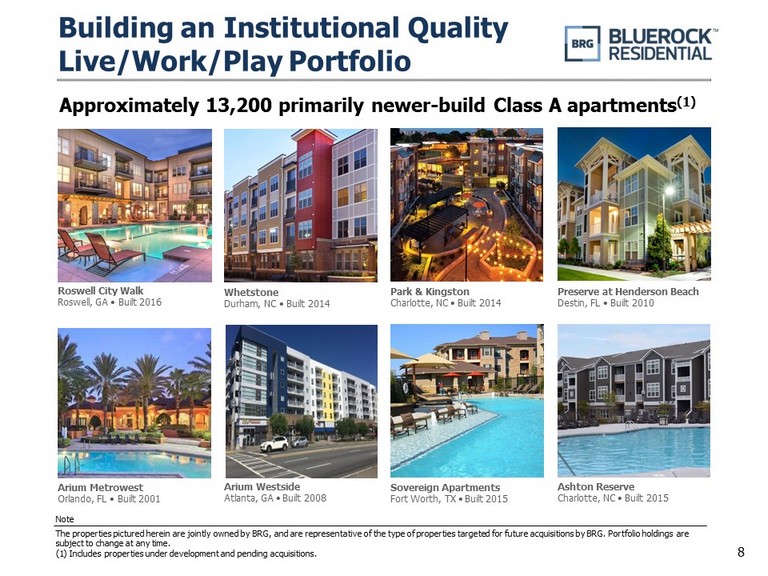
Building an Institutional Quality Live/Work/Play Portfolio Approximately 13,200 primarily newer - build Class A apartments (1) The properties pictured herein are jointly owned by BRG, and are representative of the type of properties targeted for future ac quisitions by BRG. Portfolio holdings are subject to change at any time. (1) Includes properties under development and pending acquisitions. Park & Kingston Charlotte, NC • Built 2014 Arium Metrowest Orlando, FL • Built 2001 Whetstone Durham, NC • Built 2014 Sovereign Apartments Fort Worth, TX • Built 2015 Ashton Reserve Charlotte, NC • Built 2015 Preserve at Henderson Beach Destin, FL • Built 2010 Roswell City Walk Roswell, GA • Built 2016 Arium Westside Atlanta, GA • Built 2008 Note 8

9 Targeting markets with above average employment and income growth Focus on Knowledge - Economy Growth Markets U.S. Median HH Inc. Growth: 1.7% U.S. Avg. Employment Growth: 1.5% Employment and Median Household Income Growth in Selected BRG MSAs (1) Source: Bureau of Labor Statistics and SNL Financial (1) Figures represent YoY (%) Change in Employment Growth as of March 2018. (2) Represents Median Household Income Growth Compound Annual Growth Rate (“CAGR”) from current period until 2023E. (3) RDU denotes Raleigh / Durham. Notes Current BRG Market (1) (LHS) Target BRG Market (1) (LHS) Median HH Inc. Growth CAGR (2) (RHS) 3.6% 3.5% 3.2% 3.0% 2.8% 2.5% 2.4% 2.2% 2.2% 2.1% 1.8% 1.7% 2.7% 2.3% 1.7% 1.7% 1.9% 2.3% 2.4% 1.6% 2.2% 1.5% 1.8% 1.8% 0.00% 0.50% 1.00% 1.50% 2.00% 2.50% 3.00% 0.00% 0.50% 1.00% 1.50% 2.00% 2.50% 3.00% 3.50% 4.00%

Aggregating a Class A Portfolio in Knowledge Economy Growth Markets Building a Lifestyle Portfolio in top 40 markets (excluding the Coastal Six) with intellectual - capital driven industries ~120,000 units across the nation, providing plug and play execution ability at reduced cost and logistical burden to BRG 10

$27 $58 $75 $- $20 $40 $60 $80 2016 2018 $86 $118 $50 $75 $100 $125 $150 2016 2018 $5,313 $6,426 $4,000 $5,000 $6,000 $7,000 $8,000 2016 2018 Core+ Value Creation Case Study: ARIUM Gulfshore / Palmer Ranch (1) Notes (1) Potential value upside based on Management estimates. (2) Net Operating Income (“NOI”) based on BRG 2018 operating budgets; dollars in thousands. (3) BRG purchased partner share at midpoint of BOVs for total value of $118MM; dollars in millions. (4) BRG recapitalized and refinanced debt upon purchasing partner share – recapitalized cash and new debt figures not reflected. Asset Value (3) AFTER NOI (2) Equity Value (3) (4) $7,550 $139 Potential value upside from remaining renovations 11 BEFORE

$20 $28 $45 $0 $10 $20 $30 $40 $50 2016 2018 $3,277 $4,032 $2,500 $3,250 $4,000 $4,750 $5,500 2016 2018 $5,129 Core+ Value Creation Case Study: ARIUM Glenridge (1) Notes (1) Potential value upside based on Management estimates. (2) 2016 Net Operating Income (“NOI”) based on T - 3 annualized at time of purchase. 2018 NOI based on April 2018 T - 1 annualized NOI; dollars in thousands. (3) Asset Value based on 2018 NOI valued at a 5.25% cap rate; dollars in millions. (4) Reflects Asset Value less loan proceeds of $48.4MM less cost of renovations. AFTER BEFORE $68 $77 $45 $60 $75 $90 $105 2016 2018 $98 12 Potential value upside from remaining renovations Asset Value (3) NOI (2) Equity Value (3) (4)

13 454 380 375 357 349 328 327 446 314 302 300 294 266 244 232 220 218 188 165 142 132 125 125 122 112 92 68 48 $800 $1,000 $1,200 $1,400 $1,600 $1,800 $2,000 Strong Potential Rent Upside with Core+ Renovation Strategy Potential rent upside per market based on Management estimates. Properties reflect BRG operating assets as of 12/31/2017. Note Current Average Rents: $1,222 Average Potential Rent Upside: $200 – $250 Potential Rent Upside ($) Current Average Rents

14 Approximately 4 , 650 units have Core+ upgrade potential of $ 200 – $ 250 per month upside Potential Impact of Upgrade Rent Increases ( 1 ) : Core+ Renovations Create Value (1) Table reflects hypothetical information and is provided for purposes of example only. There can be no assurance that average re nts will increase an average of $150, or at all. Actual information, in each case, will vary by asset and amount of actual average rent increase, if any, at ea ch such asset. Incremental NOI and AFFO figures net of 2.5% property management fees. (2) Per share figures include Common shares, OP Units and LTIPs. Note Annual Total Monthly Rent Increase $ 150 $ 150 # of Units 1,200 4,650 Incremental NOI $ 2,106,000 $ 8,160,750 NAV Cap Rate 5.25% 5.25% Incremental NAV per Share (2) $ 1.01 $ 3.91 Incremental AFFO per Share (2) $ 0.07 $ 0.26 Upgrade IRR 27% 27%

15 Asset Location IRR (1) Equity Multiple (1) Grove at Waterford Hendersonville, TN 85% 1.6x 23Hundred@Berry Hill Nashville, TN 60% 2.8x North Park Towers Southfield, MI 40% 1.7x Village Green of Ann Arbor Ann Arbor, MI 38% 2.3x EOS Orlando, FL 31% 1.8x Fox Hill Austin, TX 26% 1.6x Lansbrook Village Palm Harbor, FL 23% 1.5x MDA City Apartments Chicago, IL 23% 2.3x Villas at Oak Crest Chattanooga, TN 21% 1.3x Springhouse Apartments Newport News, VA 17% 1.8x Estates at Perimeter Augusta, GA 6% 1.2x Weighted Average 33% 1.8x Core+ Value Creation Delivering Consistently Strong Returns (1) IRR and equity multiple calculated based on BRG’s investment. Villas at Oak Crest returns are property level, excluding 1031 cos ts. Note:

0.0% 15.0% 30.0% 45.0% ESS BRG IRT AIV UDR APTS MAA CPT AVB EQR Meaningful Long Term Same Store NOI Growth Rate Outperformance Source: SNL and company filings. (1) Figures represent aggregate YoY Same Store NOI growth for the previous eight quarters (2Q’16 – 1Q’18). (2) For a definition of Same Store NOI Growth and a reconciliation to GAAP measures, see Appendix A. (3) 4Q’16 SS NOI growth not reported for APTS; Average of Q1 – Q3 SS NOI growth used as a proxy for 4Q figure. Peer Average: 31.0% Cumulative Same Store NOI Growth 2Q’16 – 1Q’18 (1) Notes: 16

BRG Portfolio Growth and Evolution: IPO (1) – 1Q’18 Notes (1) IPO figures reflect YE 2013. (2) Net Operating Income figures in thousands. Trailing twelve month Net Operating Income. (3) Numbers in millions. (4) Pro forma development rent included. 17 173 1,760 0 500 1,000 1,500 2,000 IPO 1Q'18 9 40 5 15 25 35 45 IPO 1Q'18 $9,604 $72,276 - 20,000 40,000 60,000 80,000 IPO 1Q'18 $1,140 $1,360 $1,000 $1,100 $1,200 $1,300 $1,400 IPO 1Q'18 Multifamily Communities Net Operating Income (2) Total Assets (3) Average Rent (4)

18 3.2% 3.5% 3.6% 3.6% 3.6% 3.8% 4.0% 3.6% 6.8% 7.4% 7.6% 0.0% 1.0% 2.0% 3.0% 4.0% 5.0% 6.0% 7.0% 8.0% ESS EQR CPT UDR AVB AIV MAA NXRT APTS BRG IRT Mid/Large Cap REITs Small Cap REITs Attractive Dividend Yield Source: Company filings and SNL Financial as of 5/30/2018. Note

19 (7%) (7%) (8%) (11%) (12%) (14%) (17%) (5%) (8%) (12%) (30%) (40%) (30%) (20%) (10%) 0% ESS CPT MAA EQR UDR AVB AIV NXRT APTS IRT BRG Meaningful Valuation Gap Provides Significant Upside Note Source: SNL Financial and third party analyst reports as of 5/30/2018; Price to NAV metrics based solely on third party estimates. Company management expresses no opinion on the accuracy of such estimates and is not providing valuation or earnings guidance. Mid/Large Cap REITs Small Cap REITs Price to NAV Premium / (Discount) Peer Average: (10%)
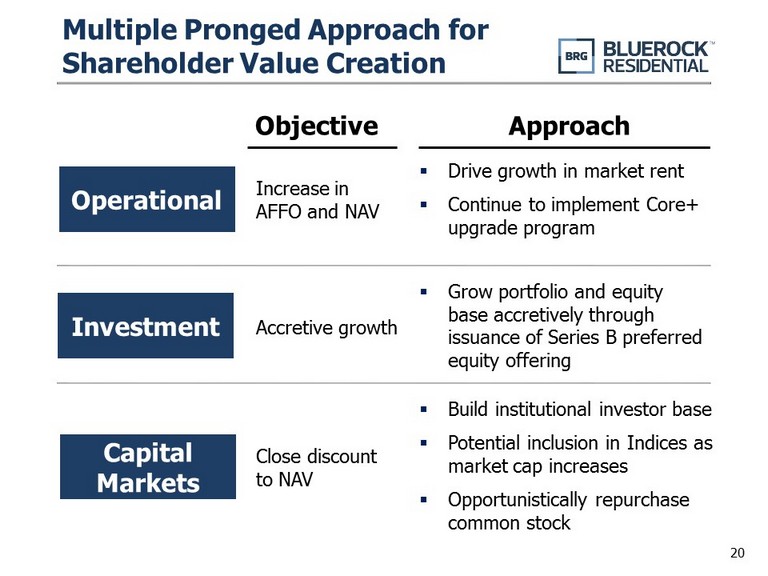
20 Multiple Pronged Approach for Shareholder Value Creation ▪ Drive growth in market rent ▪ Continue to implement Core+ upgrade program Operational Investment Capital Markets Accretive growth ▪ Build institutional investor base ▪ Potential inclusion in Indices as market cap increases ▪ Opportunistically repurchase common stock Objective Approach Increase in AFFO and NAV Close discount to NAV ▪ Grow portfolio and equity base accretively through issuance of Series B preferred equity offering

(5.0%) 0.0% 5.0% 10.0% 15.0% 20.0% 25.0% 30.0% 2/13/18 4/7/18 5/30/18 BRG MSCI US REIT (RMS) Total Shareholder Returns Since BRG 4Q’17 Earnings Source: SNL Financial. Notes: 21 BRG: +21.7% MSCI: +8.0%
22 APPENDIX A

23 Snapshot of BRG Capitalization as of March 31, 2018 Source: Company filings (1) Includes $99.2MM revolving credit facility; net of $31.5MM of cash and cash equivalents. (2) Excludes Series D Perpetual Preferred, which is shown on a separate line item above. Note Instrument $ Amount (MM's) % of Capitalization Total Secured Net Debt (1) $1,046.1 62% Series A Redeemable Term Preferred 138.9 Series B Preferred – Continuous Offering 178.4 Series C Redeemable Term Preferred 56.3 Series D Perpetual Preferred 68.7 Stockholders Equity (2) 206.5 Total Equity $648.8 38% Total Net Capitalization (1) $1,694.9 100%

24 Same Store NOI Reconciliation See footnotes on pg 25 We believe that net operating income, or NOI, is a useful measure of our operating performance . We define NOI as total property revenues less total property operating expenses, excluding depreciation and amortization and interest . Other REITs may use different methodologies for calculating NOI, and accordingly, our NOI may not be comparable to other REITs . We believe that this measure provides an operating perspective not immediately apparent from GAAP operating income or net income . We use NOI to evaluate our performance on a same store and non - same store basis because NOI measures the core operations of property performance by excluding corporate level expenses and other items not related to property operating performance and captures trends in rental housing and property operating expenses . Same store properties are conventional multifamily residential apartments which were owned and operational for the entire periods presented, including each comparative period . NOI should only be used as an alternative measure of our financial performance . The following table reflects same store and non - same store contributions to consolidated NOI together with a reconciliation of NOI to net (loss) income attributable to common stockholders as computed in accordance with GAAP for the periods presented (unaudited and amounts in thousands) : Mar 31, Jun 30, Sep 30, Dec 31, Mar 31, Jun 30, Sep 30, Dec 31, Mar 31, 2016 (1) 2016 (2) 2016 (3) 2016 (4) 2017 (5) 2017 (6) 2017 (7) 2017 (8) 2018 (9) Net income (loss) attributable to common shares and units (4,135)$ (5,043)$ (2,551)$ (7,260)$ (4,990)$ 17,569$ (12,017)$ (46,241)$ (12,100)$ Add pro-rata share: Depreciation and amortization 6,470 6,769 6,197 7,527 9,802 9,326 10,771 12,074 14,831 Non-real estate depreciation and amortization - - - - - - - 5 64 Amortization of non-cash interest expense 83 65 472 171 474 773 245 356 461 Property management fees 433 474 587 597 642 661 773 726 939 Management fees 1,197 1,394 1,839 1,987 2,737 6,099 2,773 825 - Acquisition and pursuit costs 1,147 227 619 2,130 3,006 18 15 16 43 Loss on early extinguishment of debt - - 2,269 - - 1,534 - - - Corporate operating expenses 1,269 1,666 1,169 1,680 1,433 1,679 1,091 2,737 4,669 Management internalization process expense - - - 63 475 336 818 34,842 - Weather-related losses, net - - - - - - 635 264 165 Preferred dividends 1,461 2,924 3,883 5,298 5,786 6,314 6,966 6,446 8,248 Preferred stock accretion 123 166 271 320 333 641 896 934 1,112 Less pro-rata share: Other income - - 26 - - 16 - - - Preferred returns and equity in income of unconsolidated real estate joint ventures 2,730 2,733 3,030 2,973 2,543 2,577 2,663 2,055 2,461 Interest income from related parties - 17 1,506 2,075 2,099 1,820 5,196 Gain on sale of joint venture interest, net - - - - - 6,332 - 13 - Gain on sale of real estate assets - - 4,876 1,828 7,397 26,548 - 102 - Pro-rata share of properties' income 5,318 5,909 6,823 7,695 8,252 7,402 8,204 8,994 10,775 Add: Noncontrolling interest pro-rata share of property income 1,084 1,142 1,128 1,384 1,338 931 555 2,526 607 Other (income) loss related to JV/MM entities - - - - - - - - - Total property income 6,402 7,051 7,951 9,079 9,590 8,333 8,759 11,520 11,382 Add: Interest expense, net 4,141 4,510 4,730 5,628 6,453 6,708 7,215 8,723 9,635 Net operating income 10,543 11,561 12,681 14,707 16,043 15,041 15,974 20,243 21,017 Less: Non-same store net operating income 5,061 5,013 6,655 7,985 7,381 8,547 8,773 11,865 8,830 Same store net operating income 5,482$ 6,548$ 6,026$ 6,722$ 8,662$ 6,494$ 7,201$ 8,378$ 12,187$
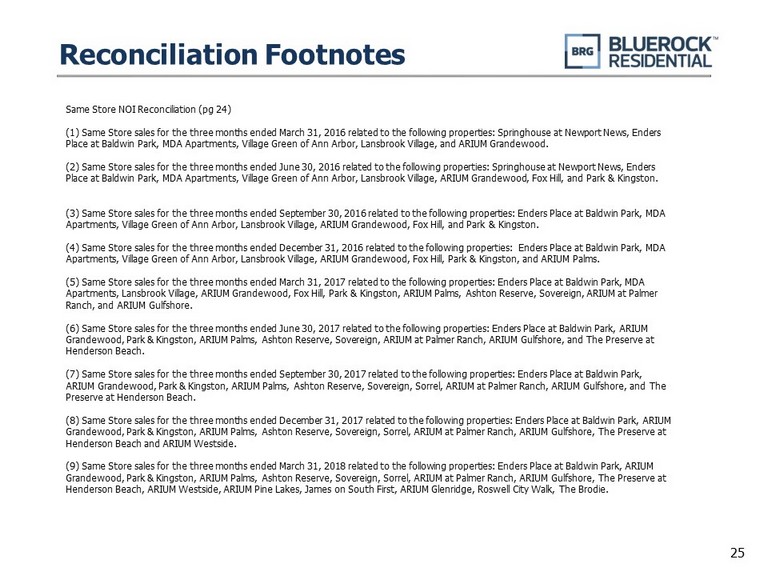
25 Reconciliation Footnotes Same Store NOI Reconciliation (pg 24) (1) Same Store sales for the three months ended March 31, 2016 related to the following properties: Springhouse at Newport Ne ws, Enders Place at Baldwin Park, MDA Apartments, Village Green of Ann Arbor, Lansbrook Village, and ARIUM Grandewood. (2) Same Store sales for the three months ended June 30, 2016 related to the following properties: Springhouse at Newport New s, Enders Place at Baldwin Park, MDA Apartments, Village Green of Ann Arbor, Lansbrook Village, ARIUM Grandewood, Fox Hill, and Park & Kin gston. (3) Same Store sales for the three months ended September 30, 2016 related to the following properties: Enders Place at Baldw in Park, MDA Apartments, Village Green of Ann Arbor, Lansbrook Village, ARIUM Grandewood, Fox Hill, and Park & Kingston. (4) Same Store sales for the three months ended December 31, 2016 related to the following properties: Enders Place at Baldw in Park, MDA Apartments, Village Green of Ann Arbor, Lansbrook Village, ARIUM Grandewood, Fox Hill, Park & Kingston, and ARIUM Palms. (5) Same Store sales for the three months ended March 31, 2017 related to the following properties: Enders Place at Baldwin P ark , MDA Apartments, Lansbrook Village, ARIUM Grandewood, Fox Hill, Park & Kingston, ARIUM Palms, Ashton Reserve, Sovereign, ARIUM at Pal mer Ranch, and ARIUM Gulfshore. (6) Same Store sales for the three months ended June 30, 2017 related to the following properties: Enders Place at Baldwin Pa rk, ARIUM Grandewood, Park & Kingston, ARIUM Palms, Ashton Reserve, Sovereign, ARIUM at Palmer Ranch, ARIUM Gulfshore, and The Preserve at Henderson Beach. (7) Same Store sales for the three months ended September 30, 2017 related to the following properties: Enders Place at Baldw in Park, ARIUM Grandewood, Park & Kingston, ARIUM Palms, Ashton Reserve, Sovereign, Sorrel, ARIUM at Palmer Ranch, ARIUM Gulfshore, an d T he Preserve at Henderson Beach. (8) Same Store sales for the three months ended December 31, 2017 related to the following properties: Enders Place at Baldwi n P ark, ARIUM Grandewood, Park & Kingston, ARIUM Palms, Ashton Reserve, Sovereign, Sorrel, ARIUM at Palmer Ranch, ARIUM Gulfshore, The Pres erv e at Henderson Beach and ARIUM Westside. (9) Same Store sales for the three months ended March 31, 2018 related to the following properties: Enders Place at Baldwin P ark , ARIUM Grandewood, Park & Kingston, ARIUM Palms, Ashton Reserve, Sovereign, Sorrel, ARIUM at Palmer Ranch, ARIUM Gulfshore, The Pres erv e at Henderson Beach, ARIUM Westside, ARIUM Pine Lakes, James on South First, ARIUM Glenridge, Roswell City Walk, The Brodie.

26