Attached files
| file | filename |
|---|---|
| EX-99.1 - EX-99.1 - Aleris Corp | d566014dex991.htm |
| 8-K - 8-K - Aleris Corp | d566014d8k.htm |
Exhibit 99.2
BASIS OF PRESENTATION
We are a direct wholly owned subsidiary of Aleris Corporation. Aleris Corporation currently conducts its business and operations through us and our consolidated subsidiaries. As used herein, unless otherwise specified or the context otherwise requires, “Aleris,” “we,” “our,” “us” and the “Company” refer to Aleris International, Inc. and its consolidated subsidiaries and the “issuer” refers to Aleris International, Inc. and not to any of its subsidiaries or affiliates.
Notwithstanding the foregoing, with respect to the historical financial information and other data presented herein, including under the heading “Summary—Summary Historical Consolidated Financial and Other Data,” as well as the historical financial and other information presented in the 2017 10-K (as defined below) and the 2018 10-Q (as defined below), including under the heading “Management’s Discussion and Analysis of Financial Condition and Results of Operations” and our consolidated financial statements and notes thereto, unless otherwise specified or the context requires, “Aleris,” “we,” “our,” “us” and the “Company” refer to Aleris Corporation and its consolidated subsidiaries.
Numbers and percentages presented in the tables herein may not sum to the totals presented due to rounding.
INDUSTRY DATA
Information herein concerning processing volumes, production capacity, rankings and other industry information, including our general expectations concerning the rolled aluminum products and aluminum industries, are based on estimates prepared by us using certain assumptions and our knowledge of these industries as well as data from third party sources. We have not independently verified any of the data from third party sources. Our estimates, in particular as they relate to our general expectations concerning the aluminum industry, involve risks and uncertainties and are subject to changes based on various factors, including those discussed under “Risk Factors” herein and under “Risk Factors” in the 2017 10-K.
EXPLANATION OF CERTAIN FINANCIAL MATTERS
We present EBITDA, Adjusted EBITDA, segment Adjusted EBITDA and commercial margin as non-GAAP financial measures in various places herein.
We report our financial results in accordance with GAAP. However, our management believes that certain non-GAAP performance measures, which we use in managing the business, may provide investors with additional meaningful comparisons between current results and results in prior periods. EBITDA, Adjusted EBITDA, segment Adjusted EBITDA and commercial margin are examples of non-GAAP financial measures that we believe provide investors and other users of our financial information with useful information.
Management uses EBITDA, Adjusted EBITDA, segment Adjusted EBITDA and commercial margin as performance metrics and believes these measures provide additional information commonly used by holders and lenders of our debt with respect to the ongoing performance of our underlying business activities, as well as our ability to meet our future debt service, capital expenditures and working capital needs. In addition, EBITDA with certain adjustments, as more fully described below, will be a component of certain covenants under the credit agreement that will govern the New First Lien Term Loan Facility (as defined below) and the agreement that will govern the private financing transaction. Adjusted EBITDA, including the impact of metal price lag, is a component of certain financial covenants under the credit agreement governing the ABL Facility. Management also uses commercial margin as a performance metric and believes that it provides useful information regarding the performance of our segments because it measures the price at which we sell our aluminum products above the hedged cost of the metal and the effects of metal price lag, thereby reflecting the value-added components of our commercial activities independent of aluminum prices which we cannot control.
Our EBITDA calculations represent net income and loss attributable to Aleris Corporation before interest income and expense, provision for and benefit from income taxes, depreciation and amortization and income from discontinued operations, net of tax. Adjusted EBITDA is defined as EBITDA excluding metal price lag, unrealized gains and losses on derivative financial instruments, restructuring charges, currency exchange gains and losses on debt, stock-based compensation expense, start-up costs and certain other gains and losses. Segment Adjusted EBITDA represents Adjusted EBITDA on a per segment basis. EBITDA as defined in the agreement that will govern the private financing transaction and the credit agreement that will govern the New First Lien Term Loan
Facility may also limit the amount of adjustments for cost savings, operational improvement and synergies for the purpose of determining our compliance with such covenants. Adjusted EBITDA as defined in the ABL Facility also limits the amount of adjustments for restructuring charges and requires additional adjustments be made if certain annual pension funding levels are exceeded. Commercial margin represents revenues less the hedged cost of metal and the effects of metal price lag.
We also present Further Adjusted EBITDA and Structuring Adjusted EBITDA herein. Further Adjusted EBITDA and Structuring Adjusted EBITDA are also non-GAAP financial measures. Furthermore, elements of Structuring Adjusted EBITDA include forward-looking information. See “Forward Looking Statements.” These non-GAAP financial measures are being provided for illustrative purposes only in connection with the private financing transaction. Accordingly, we do not intend to update or provide these financial measures on an ongoing basis. See footnote (h) in “Summary—Summary Historical Consolidated Financial and Other Data” for a calculation of Further Adjusted EBITDA and Structuring Adjusted EBITDA for the twelve months ended March 31, 2018 and a discussion of important factors which could cause actual results to differ materially from those contained in or implied by Structuring Adjusted EBITDA.
EBITDA, Adjusted EBITDA, Further Adjusted EBITDA, Structuring Adjusted EBITDA, segment Adjusted EBITDA and commercial margin (collectively, the “Non-GAAP Measures”), as we use them, may not be comparable to similarly titled measures used by other companies. We calculate the Non-GAAP Measures by eliminating the impact of a number of items we do not consider indicative of our ongoing operating performance and certain other items. You are encouraged to evaluate each adjustment and the reasons we consider it appropriate for supplemental analysis. However, the Non-GAAP Measures are not financial measurements recognized under GAAP, and when analyzing our operating performance, investors should use the Non-GAAP Measures in addition to, and not as an alternative for, net income and loss attributable to Aleris Corporation, operating income and loss or any other performance measure derived in accordance with GAAP, or in addition to, and not as an alternative for, cash flow from operating activities as a measure of our liquidity. The Non-GAAP Measures have limitations as analytical tools, and they should not be considered in isolation, or as a substitute for, or superior to, our measures of financial performance prepared in accordance with GAAP. These limitations include the following:
| • | they do not reflect our cash expenditures or future requirements for capital expenditures or contractual commitments; |
| • | they do not reflect changes in, or cash requirements for, working capital needs; |
| • | they do not reflect interest expense or cash requirements necessary to service interest expense or principal payments under our outstanding indebtedness; |
| • | they do not reflect certain tax payments that may represent a reduction in cash available to us; |
| • | although depreciation and amortization are non-cash charges, the assets being depreciated and amortized may have to be replaced in the future, and EBITDA and Adjusted EBITDA, including Further Adjusted EBITDA, Structuring Adjusted EBITDA and segment Adjusted EBITDA, do not reflect cash requirements for such replacements; and |
| • | other companies, including companies in our industry, may calculate these measures differently and, as the number of differences in the way companies calculate these measures increases, the degree of their usefulness as a comparative measure correspondingly decreases. |
In addition, in evaluating Adjusted EBITDA (including segment Adjusted EBITDA), Further Adjusted EBITDA and Structuring Adjusted EBITDA, we may incur expenses in the future that are similar to the adjustments in the presentation herein and/or we may not realize the benefits expected from the adjustments in the calculation of Structuring Adjusted EBITDA presented herein, as applicable. Our presentation of Adjusted EBITDA (including segment Adjusted EBITDA), Further Adjusted EBITDA and Structuring Adjusted EBITDA should not be construed as an inference that our future results will be unaffected by unusual or non-recurring items or that we will realize the anticipated benefits contained in or implied by the adjustments in the calculation of Structuring Adjusted EBITDA presented herein.
For reconciliations of EBITDA, Adjusted EBITDA, Further Adjusted EBITDA, Structuring Adjusted EBITDA and commercial margin to their most directly comparable financial measures presented in accordance with GAAP, see “Summary—Summary Historical Consolidated Financial and Other Data.” For reconciliations of segment Adjusted EBITDA to segment income, which is the most directly comparable financial measure presented in accordance with GAAP, see the reconciliations in “Management’s Discussion and Analysis of Financial Condition and Results of Operations—Our Segments” included in Aleris Corporation’s annual report on Form 10-K for the year ended December 31, 2017 (the “2017 10-K”) filed with the SEC on March 20, 2018 and Aleris Corporation’s quarterly report on Form 10-Q for the quarter ended March 31, 2018 filed with the SEC on May 3, 2018 (the “2018 10-Q”).
FORWARD LOOKING STATEMENTS
This document contains forward-looking statements that are based on current expectations, estimates, forecasts and projections about us and the industry in which we operate and beliefs and assumptions made by our management. Statements herein that are not historical in nature are considered to be forward-looking statements. They include statements in “Summary—Recent Developments—Outlook for the Quarter Ending June 30, 2018” and regarding our expectations, hopes, beliefs, estimates, intentions or strategies regarding the future. Statements about Structuring Adjusted EBITDA in footnote (h) under the heading “Summary—Summary Historical Consolidated Financial and Other Data” and statements regarding future costs and prices of commodities, production volumes, customer commitments, industry trends, anticipated cost savings, anticipated benefits from new products, facilities, acquisitions or divestitures, projected results of operations, achievement of production efficiencies, capacity expansions, future prices and demand for our products and estimated cash flows and sufficiency of cash flows to fund operations, capital expenditures and debt obligations, as well as statements regarding the impact of trade cases, tariffs and other future governmental actions, are forward-looking statements. The words “may,” “could,” “would,” “should,” “will,” “believe,” “expect,” “anticipate,” “plan,” “estimate,” “target,” “project,” “look forward to,” “intend” and similar expressions are intended to identify forward-looking statements.
Forward-looking statements should be read in conjunction with the cautionary statements and other important factors herein, which include descriptions of important factors which could cause actual results to differ materially from those contained in the forward-looking statements. Our expectations, beliefs and projections are expressed in good faith, and we believe we have a reasonable basis to make these statements through our management’s examination of historical operating trends, data contained in our records and other data available from third parties, but there can be no assurance that our management’s expectations, beliefs or projections will result or be achieved.
Forward-looking statements involve known and unknown risks and uncertainties, which could cause actual results to differ materially from those contained in or implied by any forward-looking statement. Important factors that could cause actual results to differ materially from the forward-looking statements include, but are not limited to:
| • | our ability to successfully implement our business strategy; |
| • | the success of past and future acquisitions or divestitures; |
| • | the cyclical nature of the aluminum industry, material adverse changes in the aluminum industry or our end-uses, such as global and regional supply and demand conditions for aluminum and aluminum products, and changes in our customers’ industries; |
| • | increases in the cost, or limited availability, of raw materials and energy; |
| • | our ability to enter into effective metal, energy and other commodity derivatives or arrangements with customers to manage effectively our exposure to commodity price fluctuations and changes in the pricing of metals, especially London Metal Exchange (“LME”)-based aluminum prices; |
| • | our ability to generate sufficient cash flows to fund our operations and capital expenditure requirements and to meet our debt obligations; |
| • | competitor pricing activity, competition of aluminum with alternative materials and the general impact of competition in the industry end-uses we serve; |
| • | our ability to retain the services of certain members of our management; |
| • | the loss of order volumes from any of our largest customers; |
| • | our ability to retain customers, a substantial number of whom do not have long-term contractual arrangements with us; |
| • | risks of investing in and conducting operations on a global basis, including political, social, economic, currency and regulatory factors; |
| • | variability in general economic or political conditions on a global or regional basis; |
| • | current environmental liabilities and the cost of compliance with and liabilities under health and safety laws; |
| • | labor relations (i.e., disruptions, strikes or work stoppages) and labor costs; |
| • | our internal controls over financial reporting and our disclosure controls and procedures may not prevent all possible errors that could occur; |
| • | our levels of indebtedness and debt service obligations, including changes in our credit ratings, material increases in our cost of borrowing or the failure of financial institutions to fulfill their commitments to us under committed facilities; |
| • | our ability to access credit or capital markets; |
| • | the possibility that we may incur additional indebtedness in the future; and |
| • | limitations on operating our business and incurring additional indebtedness as a result of covenant restrictions under our indebtedness, and our ability to pay amounts due under our outstanding indebtedness. |
The above list is not exhaustive. Some of these factors and additional risks, uncertainties and other factors that may cause our actual results, performance or achievements to be different from those expressed or implied in our written or oral forward-looking statements may be found under “Risk Factors” contained herein and under “Risk Factors” in the 2017 10-K.
These factors and other risk factors disclosed herein and elsewhere are not necessarily all of the important factors that could cause our actual results to differ materially from those expressed in any of our forward-looking statements. Other unknown or unpredictable factors could also harm our results. Consequently, there can be no assurance that the actual results or developments anticipated by us will be realized or, even if substantially realized, that they will have the expected consequences to, or effects on, us. Given these uncertainties, you are cautioned not to place undue reliance on such forward-looking statements.
The forward-looking statements contained herein are made only as of the date hereof. Except to the extent required by law, we do not undertake, and specifically decline any obligation, to update any forward-looking statements or to publicly announce the results of any revisions to any of such statements to reflect future events or developments.
This summary highlights significant aspects of our business, but it is not complete and does not contain all of the information about us. This summary contains forward-looking statements that involve risks and uncertainties. Our actual results may differ significantly from the results discussed in the forward-looking statements as a result of certain factors, including those set forth in “Forward-Looking Statements” and “Risk Factors” in the 2017 10-K, and “Risk Factors” herein.
Our Company
We are a global leader in the manufacture and sale of aluminum rolled products with a strategic footprint throughout North America, Europe and China. Our product portfolio ranges from the most technically demanding heat treated plate and sheet used in mission-critical applications to sheet produced through our low-cost continuous cast process. In 2010, we embarked on a significant strategic growth campaign and have since invested over $1 billion in our business. As a result, we believe we are well positioned to capture increasing demand for rolled aluminum products in the primary end-uses we serve.
We operate 13 production facilities located around the world. We possess a combination of technically advanced, flexible and low-cost manufacturing operations supported by an industry-leading research and development (“R&D”) platform. Our facilities are strategically located to serve our customers globally. Our diversified customer base includes a number of industry-leading companies such as Airbus, Audi, Boeing, Bombardier, Daimler, Embraer, Ford and Volvo.
In anticipation of strong demand growth from our customers and favorable industry trends, we are continuing to invest in the areas of our business where we believe we hold industry-leading positions and that serve attractive end-uses. We believe the following investments will substantially enhance the future growth and profitability of our business:
| • | Automotive. In 2013, we completed an automotive body sheet (“ABS”) expansion project at our Duffel, Belgium facility to meet increased European demand. The project included the construction of a new wide cold mill that allows us to produce the widest ABS in Europe. We leveraged our decade-long reputation for quality and technical expertise in Europe, where we believe we are one of the leading suppliers of ABS, by upgrading our rolling mill in Lewisport, Kentucky to produce ABS. This investment will enable us to capture the anticipated significant growth in the consumption of aluminum by the North American automotive industry and to supply our automotive customers from both Europe and North America. |
| • | Aerospace. In 2012, building on our industry-leading aerospace plate and sheet capabilities in Koblenz, Germany, we expanded our global aerospace offering through the completion of our state-of-the-art aluminum rolling mill in Zhenjiang, China. This strategic investment makes us the only supplier capable of serving aerospace customers from both Europe and Asia and allows us to expand our business to meet growing demand for aerospace plate and sheet, which we believe we are the third largest supplier of globally. |
| • | Building and Construction. With the 2014 acquisition of Nichols Aluminum LLC (“Nichols”), we have the largest continuous cast footprint in North America and are the largest supplier of building and construction sheet in North America. The acquisition has also positioned us to capture the benefits from |
| the continuing economic recovery in the key end-uses we serve in North America, including building and construction, truck trailer and general industrial. |
For the twelve months ended March 31, 2018, we shipped approximately 810.6 thousand metric tons of finished products and generated revenues of approximately $3.0 billion, a net loss of $170.8 million, Adjusted EBITDA of $202.4 million, Further Adjusted EBITDA of $239 million and Structuring Adjusted EBITDA of $334 million. See footnotes (c) and (h) in “—Summary Historical Consolidated Financial and Other Data” for a definition of Adjusted EBITDA and reconciliation to net income attributable to Aleris Corporation and a calculation of Further Adjusted EBITDA and Structuring Adjusted EBITDA.
Our Segments
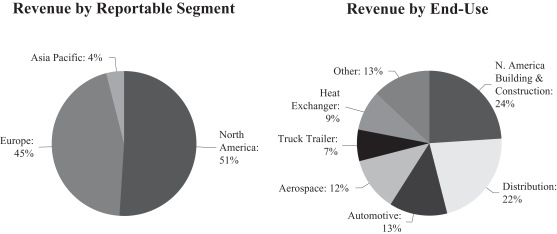
We operate three segments (each of which is a reportable segment): North America, Europe and Asia Pacific. The following charts present the percentage of our consolidated revenues from continuing operations by reportable segment and by end-use for the year ended December 31, 2017:
North America
Our North America segment consists of nine manufacturing facilities located throughout the United States that produce rolled aluminum and coated products for the building and construction, truck trailer, automotive, consumer durables, other general industrial and distribution end-uses. Substantially all of our North America segment’s products are manufactured to specific customer requirements, using continuous cast and direct-chill technologies that provide us with significant flexibility to produce a wide range of products. Specifically, those products are integrated into, among other applications, building products, truck trailers, appliances, cars and recreational vehicles.
Our facility in Lewisport, Kentucky uses a direct-chill cast process which enables us to meet more technically demanding applications. We are investing approximately $425.0 million to build a new wide cold mill, two continuous annealing lines with pre-treatment (each, a “CALP”) and an automotive innovation center to support ABS production at our Lewisport facility (the “North America ABS Project”). We have also invested in upgrades to other key non-ABS equipment at the facility, including upgrading our ingot scalper and pre-heating furnace capabilities, widening the hot mill and installing state-of-the-art mill controls, to capture additional opportunities. The Lewisport facility has started to ship ABS and wide non-ABS to customers using the re-engineered hot mill, the new wide cold mill and the first of the two CALPs. We have completed the
construction and installation and are significantly through commissioning of the facility’s second CALP. We expect ABS shipments to meaningfully ramp up in 2018 and over the next several years based upon committed volumes and to account for a significantly higher percentage of our North America product mix. In particular, we have long term customer commitments for approximately 60% of our ABS capacity through 2025 with significant “take or pay” obligations.
We have the largest footprint of continuous cast operations of any aluminum rolled products producer in North America. Our continuous cast operations have lower capital requirements and lower operating costs compared to our direct-chill cast operations. For our continuous cast operations, scrap input typically comprises over 90% of our overall metal needs, which provides substantial benefits, including metal cost savings. For the year ended December 31, 2017, approximately 99% of our North America revenues were derived using a formula pricing model which allows us to pass through risks from the volatility of aluminum price changes by charging a market-based aluminum price plus a conversion fee.
Europe
Our Europe segment consists of two world-class aluminum rolling mills, one in Koblenz, Germany and the other in Duffel, Belgium, and an aluminum cast house in Germany. The segment produces aerospace plate and sheet, ABS, clad brazing sheet (clad aluminum material used for, among other applications, vehicle radiators and HVAC systems) and heat-treated plate for engineered product applications. Substantially all of our Europe segment’s products are manufactured to specific customer requirements using direct-chill cast technologies that allow us to use and offer a variety of alloys and products for a number of technically demanding end-uses, which command some of the highest margins in the industry.
For over a decade, we have been a leading supplier of automotive and aerospace aluminum rolled products in Europe. The technical and quality requirements needed to participate in these end-uses provides us with a competitive advantage. We continue to pursue technical and manufacturing initiatives, such as our wingskin project at our Koblenz, Germany facility, expected to be completed in the second half of 2018, which will allow us to produce aluminum for commercial aircraft wings to be used in the aerospace industry.
Asia Pacific
Our Asia Pacific segment consists of the Zhenjiang rolling mill that produces technically demanding and value-added plate products for aerospace, semiconductor equipment, general engineering, distribution and other end-uses worldwide. Substantially all of our Asia Pacific segment’s products are manufactured to specific customer requirements using direct-chill cast technologies that allow us to use and offer a variety of alloys and products principally for aerospace and also for a number of other technically demanding end-uses.
The Zhenjiang rolling mill commenced operations in the first quarter of 2013 and achieved Nadcap certification, an industry standard for the production of aerospace aluminum, in 2014. Since then, the Zhenjiang rolling mill has received qualifications from several industry-leading aircraft manufacturers, including Airbus, Boeing, Bombardier and COMAC, and is the only facility in Asia capable of meeting the exacting standards of the global aerospace industry.
We expect demand for aluminum plate in Asia to grow, driven by the development and expansion of industries serving aerospace, semiconductor, rail and other technically demanding applications. In anticipation of this demand, we built the Zhenjiang rolling mill with 250,000 tons of hot mill capacity and the capability to both expand into other high growth and high value-added products, including ABS, clad brazing sheet and other technically demanding products, as well as produce additional aerospace and heat treated plate with modest incremental investment. Currently, we are expanding our aerospace offerings in our Asia Pacific segment by
investing in technical and manufacturing initiatives to allow for the production of aluminum for commercial aircraft wings to be used in the aerospace industry, which is expected to be completed in early 2019.
Industry Trends
Aluminum is a widely-used, attractive industrial material. Compared to several alternative metals such as steel and copper, aluminum is lightweight, has a high strength-to-weight ratio, is resistant to corrosion and can be recycled repeatedly without any material decline in performance or quality. We believe the following trends support the fundamental long-term growth of rolled aluminum consumption in the end-uses we serve that will drive demand for our products:
| • | Automotive “light-weighting.” In the automotive industry, aluminum is the metal of choice for “light-weighting” vehicles and improving fuel efficiency because of its strength-to-weight ratio. We believe the use of aluminum in vehicles will become increasingly more prevalent in the automotive industry in response to European Union and U.S. regulations relating to reducing carbon emissions and increasing fuel efficiency. The “light-weighting” trend is also no longer limited to the premium automotive segment of the automotive industry where performance was the principal driving factor of aluminum consumption. Today, a number of automotive manufacturers are producing non-premium lines of passenger cars and trucks with increasingly more aluminum to light-weight the vehicles, such as the Toyota Camry and the Ford F series. Ducker Worldwide estimates the demand for aluminum in North America will increase from 1.2 billion pounds in 2016 to 3.4 billion pounds by 2025 and the aluminum content per light vehicle will increase from 397 pounds in 2015 to 565 pounds by 2028, with ABS per light vehicle increasing from 14 pounds to 61 pounds per vehicle over the same time frame. In addition, based on third-party and management estimates, we believe a shortage of ABS supply in North America may develop by 2024. |
| • | Metal of choice for the aerospace end-use. Aluminum continues to be the metal of choice for the aerospace industry due to its exceptional strength to weight ratio. Demand for aerospace aluminum plate and sheet typically trend with aircraft backlog and build rates. Despite aerospace softness in 2017, due to continued supply chain destocking, aircraft order backlogs for Airbus and Boeing were over 13,000 planes in December 2017, an all-time high for the industry. |
| • | Continued U.S. housing recovery. Housing starts are expected to see another year of growth in 2018, with experts estimating that total housing starts in the U.S. will increase from 1,203,000 in 2017 to 1,268,000 in 2018. Importantly, the mix between single-family and multi-family construction is expected to continue to trend favorably for us. Additionally, the demographic trends in the U.S. around population growth and family formation rates continue to suggest strength in this important end-use. |
We believe that our global platform and our leading positions in the automotive, aerospace and building and construction end-uses position us to benefit from these industry growth trends. In addition, beginning in late 2018, certain common alloys used in products made by our North America segment may potentially benefit from trade case activity. However, there can be no assurance regarding the final timing or outcome of such trade case activity.
Our Competitive Strengths
Leading global market positions across attractive end-uses
We hold leading positions across a number of attractive end-uses that are experiencing favorable industry trends. We have been an industry-leading supplier of ABS in Europe for over a decade. Today, we believe we are one of the largest suppliers of ABS by volume to the European automotive industry. We believe we are one of the largest global suppliers of aerospace sheet and plate by volume, primarily produced at our Koblenz, Germany facility and we have strengthened our leading global position in aerospace with the construction of our Zhenjiang
rolling mill. We have the largest continuous cast footprint and are a leading supplier of aluminum sheet to the building and construction and truck trailer end-uses in North America.
Significant investments underpinning future performance
We have built a foundation for growth through investments in several high growth and high value-added projects. We believe these investments will upgrade our product mix, enhance our profitability and better position us to capture favorable industry trends.
| • | ABS expansion project in Europe. In 2013, we strengthened our position as a leading supplier of ABS in Europe with the construction of a new wide cold mill at our Duffel, Belgium facility. This investment significantly expanded our ABS capacity, enhanced our dedicated automotive R&D center focused on product development and innovation and positioned us to benefit from increased demand from the light-weighting trend in Europe. |
| • | ABS project in North America. We are leveraging the technical expertise and reputation for excellence of our Duffel, Belgium facility and investing approximately $425.0 million to add ABS capabilities at our Lewisport facility. We have also invested in upgrades to other key non-ABS equipment at the facility, including upgrading our ingot scalper and pre-heating furnace capabilities and widening the hot mill, to capture additional opportunities. ABS products typically command substantially higher margins compared to common-alloy products. The investment includes a new wide cold mill, two CALP lines and an automotive innovation center and positions us to meet the anticipated significant growth in demand for ABS in North America. |
| • | Zhenjiang rolling mill. Our Zhenjiang rolling mill commenced operations in the first quarter of 2013 and has since received qualifications from several industry-leading aircraft manufacturers. We designed the mill with 250,000 tons of hot mill capacity, 35,000 tons of which is currently producing aerospace and heat treated plate. As the only supplier in Asia qualified to meet the technically demanding requirements of the global aerospace industry, we believe we are well positioned to meet the expected growth in demand for aluminum plate in Asia. |
| • | Nichols acquisition. Our 2014 acquisition of Nichols expanded our capacity to produce continuous cast material in North America. In addition, the integration of Nichols has provided significant synergy benefits. We believe this investment has strengthened our ability to meet growing customer demand in North America at substantially enhanced profitability. |
Broad range of best-in-class manufacturing capabilities supported by an advanced R&D platform
We possess a broad range of best-in-class capabilities within our manufacturing operations that allow us to compete effectively in numerous end-uses and geographies.
We believe our automotive and aerospace products meet the most technically demanding customer quality and product performance requirements in the industry. For these highly specialized products, we compete based on our state-of-the-art direct-chill manufacturing capabilities and advanced R&D platform.
For building and construction and truck trailer products in North America, we differentiate ourselves through our highly efficient and low-cost continuous cast process. For our continuous cast operations, scrap input typically comprises over 90% of our overall metal needs which, given the discount of scrap aluminum to primary aluminum, provides substantial benefits, including cost savings.
We support our manufacturing operations through five highly advanced R&D centers in the United States, Europe and China. Because of our reputation for technical excellence, we typically form partnerships with our
customers at the early stages of the design and development process. Our technological and R&D capabilities allow us to produce the most technically demanding products, many of which require close collaboration and, in some cases, joint development with our customers. We believe these capabilities will allow us to continue to grow in higher value-added applications that meet the developing needs of our customers.
Long-term relationships with a broad and diverse customer base
We have long-standing relationships with a number of industry-leading companies across key end-uses and geographies. We believe that our global footprint combined with manufacturing excellence and technical capabilities provide substantial benefits to our customers and makes us the supplier of choice across our targeted end-uses. In particular, we believe that we are a “mission critical” supplier to many of our customers due to the lengthy and complex qualification process required for many of our products.
Our relationships with our top 10 customers average approximately 20 years. Our strong relationships with our customers are mutually beneficial, offering us a consistent base of customer demand and allowing us to plan and manage our operations more effectively. Knowledge gained from these relationships helps us provide superior service, including product innovation and just-in-time inventory management.
We have a balanced customer base that is diversified by geography and end-use. Our ten largest customers were responsible for less than 33% of our revenues in 2017 and no one customer accounted for more than 10% of those revenues. The following table summarizes our major customers by our key end-uses:
| Aerospace |
Automotive | |||||
| • Airbus |
• Bombardier |
• Audi |
• General Motors | |||
| • AVIC / COMAC |
• Embraer |
• Daimler |
• VW Group | |||
| • Boeing |
• Ford |
• Volvo | ||||
| Building and Construction |
Truck Trailer | |||||
| • American Construction Metals |
• Ply Gem Industries |
• Great Dane |
• Utility Trailer | |||
| • Gentek Building Products |
• Hyundai Translead |
|||||
Value creation through the Aleris Operating System
Our culture focuses on continuous improvement, achievement of synergies and the optimal use of capital resources. We established the Aleris Operating System (“AOS”) as a company-wide ongoing initiative to align and coordinate all key processes of our operations. AOS is an integrated system of principles, operating practices and tools that engages all employees in the transformation of our core business processes and the pursuit of value creation. We also use AOS to leverage expertise from one region or product area to generate value for other parts of our business. We focus on key operating metrics for all of our segments and facilities and strive to achieve best practices both internally and when compared with external benchmarks. The AOS initiative utilizes various tools, including Six Sigma and Lean methodologies, to drive sustainable, process driven productivity improvements such as initiatives to lower energy usage, improve metal mix or recovery, reduce headcount, increase throughput and reduce freight or other costs.
We believe our business has benefited from AOS. For the years ended December 31, 2017, 2016 and 2015, we generated net productivity savings (or, the incremental Adjusted EBITDA benefit from, offset by inefficiencies and costs associated with taking, AOS initiatives) of approximately $21.0 million, $9.0 million and $27.0 million, respectively. In addition, we believe that AOS enabled us to capture significantly more synergies in connection with our integration of Nichols at a more rapid pace. AOS also enabled us to use our aerospace
expertise from our operations in Koblenz, Germany to complete the Zhenjiang rolling mill, a greenfield project, within three years. Similarly, we leveraged our ABS expertise from our operations in Duffel, Belgium to successfully complete the installation of a new wide cold mill and the first of the two CALPs at our facility in Lewisport, Kentucky, as part of the North America ABS Project, which we believe reduced execution risks and will allow us to become an industry leader in the North American ABS market.
Highly experienced management team
Our executive officers and key leaders have diverse industry experience, including an average of more than 20 years of experience with various manufacturing companies, including managing Aleris when it was a public company prior to its leveraged buyout in 2006. Our management team has expertise in the commercial, technical and management aspects of our business, which provides for focused marketing efforts, quality and cost controls and safety and environmental improvement.
Our management team has a strong track record of managing and executing complex strategic initiatives and redirecting our business to capture high growth and high value-added opportunities globally. As a result, we believe our management team will continue to leverage our operational expertise and identify and take advantage of favorable industry trends and growth opportunities as they arise.
Our Business Strategies
Continue to execute on growth investments
We have made significant investments in our business and are focused on continuing to successfully implement, and deliver results from, these investments. We believe these investments have and will continue to enable us to expand our capabilities, leverage industry trends and improve the profitability and growth profile of our business.
| • | Automotive. The ABS expansion project at our Duffel, Belgium facility, which was completed in 2013, produces wide ABS for major customers such as Audi, Daimler, Volkswagen and Volvo. We are continuing to implement the North America ABS Project at our Lewisport Facility, which is nearing completion. We have started to ship ABS and wide non-ABS to customers using the facility’s re-engineered hot mill, the new wide cold mill and the first of the two CALPs. We expect ABS shipments to meaningfully ramp up in 2018 and over the next several years based upon committed volumes and to account for a significantly higher percentage of our North America product mix. |
| • | Aerospace. In China, we have achieved the global aerospace qualifications we targeted and are now focused on leveraging our investment to increase Asia Pacific’s contribution to our overall returns. We expect demand for aluminum plate in Asia to grow, driven by the development and expansion of industries serving aerospace, semiconductor, rail and other technically demanding applications. As a result, we are currently evaluating a number of growth opportunities for the Zhenjiang rolling mill, which, with over 200,000 tons of remaining hot mill capacity, can produce additional aerospace and heat treated plate with modest incremental investment. |
| • | Building and Construction. In North America, Nichols has been successfully integrated into our North America operations and provided substantial synergy benefits. In addition, this investment has strengthened our ability to capture growing customer demand at substantially enhanced profitability. We also intend to grow our North America business by optimizing our production facilities to ensure we remain one of the lowest cost producers for our product portfolio through targeted technology upgrades. |
Continue to drive mix improvement across our segments
We believe we have opportunities to enhance our product mix and a number of our recent investments have been targeted at strengthening our position in higher growth and higher value-added end-uses where we face fewer competitors. Currently, we are:
| • | leveraging our recently expanded technology and production capabilities to capture fast growing demand for ABS, which we believe will continue to grow as automakers work to meet stringent regulatory requirements on carbon reductions by using aluminum to reduce vehicle weight and increase fuel efficiency; |
| • | proactively upgrading our product portfolio to focus on higher value business, for example, by shifting existing capacity to the production of aerospace plate in Europe and China and by investing in technical and manufacturing initiatives to expand our aerospace offerings; and |
| • | targeting R&D efforts towards collaboration with customers to enhance our product offerings. |
Continue to focus on the Aleris Operating System to drive productivity
We believe there are significant additional opportunities to further reduce our manufacturing and other costs and improve profitability by continuing to deploy AOS. Some of our current AOS projects include realigning our supply chain, launching a focused reliability program and maximizing our scrap processing capability. We also believe that going forward our AOS initiatives will generate productivity gains that more than offset base inflation within our operations.
Limit our exposure to commodity price fluctuations
We continuously seek to reduce the impact of aluminum price fluctuations on our business by (i) using formula pricing (based on a market-based primary aluminum price plus a conversion fee), which effectively passed through aluminum costs to our customers for approximately 93% of our sales for the year ended December 31, 2017, (ii) aligning physical aluminum purchases with aluminum sales, (iii) hedging fixed price forward sales with the use of financial and commodity derivatives to protect transaction margins, which are margins associated with the sale of products and the conversion fees we earn on such sales and (iv) hedging uncommitted or open inventory positions to protect our operating results and financial condition from the impact of changing aluminum prices on inventory values. These techniques minimize both transactional margin and inventory valuation risk. Additionally, we continuously seek to reduce the effects of copper, zinc, natural gas, fuel and electricity price volatility and currency exchange risks through the use of derivatives and forward purchases, as well as through price escalators and pass-throughs contained in some of our customer supply agreements.
Selectively pursue strategic transactions
We have grown significantly through the successful completion of 13 strategic acquisitions from 2004 through 2015 targeted at broadening our product offerings and geographic presence, diversifying our end-use customer base and increasing our scale and scope. We focus on acquisitions that we expect would increase earnings, and from which we can realize significant operational efficiencies generally within 12 to 24 months through the integration process. We prudently evaluate these opportunities as potential enhancements to our existing operating platforms. We also consider strategic alliances, where appropriate, to achieve operational efficiencies or expand our product offerings.
Recent Developments
Aluminum Tariffs and Regulatory Matters
On March 8, 2018, the current U.S. administration authorized the imposition of a 10% tariff on aluminum imported into the United States, with exemptions for certain countries and the possibility of exemptions for certain products. While it is too early to predict how the recently imposed tariff will impact our business, the tariff may cause customers to delay or reduce their spending or seek substitute materials as a result of increased costs or may cause foreign countries to impose tariffs on certain of our products.
On April 6, 2018, the U.S. Treasury Department announced that it was implementing sanctions on various Russian individuals and companies they own and control, including United Company Rusal Plc (“Rusal”) with whom we do business through its subsidiaries. On April 23, 2018, the U.S. Treasury Department issued General License 14, which authorizes transactions until October 23, 2018 related to winding down or maintaining business with Rusal that was in effect prior to the implementation of sanctions. While we expect to be able to meet our aluminum consumption requirements while abiding by the sanctions, we continue to evaluate the risk of temporary supply disruptions as a result of the sanctions and are evaluating alternatives, where appropriate.
Outlook for the Quarter Ending June 30, 2018
The quarter ending June 30, 2018 is not yet complete and our financial results for the quarter ending June 30, 2018 are not available. Although we do not typically provide quantitative or intra-quarter guidance, certain estimates are included below for the quarter ending June 30, 2018. These estimates reflect management’s best estimates based upon currently available information and certain assumptions we believe to be reasonable, including estimates of tons to be produced and sold during the quarter, commercial margin to be generated from tons sold and conversion costs to be incurred in production. Because we have not yet completed our second quarter of 2018, these estimates and assumptions are based on events that have not yet occurred and are subject to all of the risks and uncertainties, many of which are not within our control, inherent in making projections and may be revised as a result of management’s further review. These estimates should not be relied upon as fact or as an accurate representation of future results, and the information below that is presented as a range of results is not intended to represent that actual results might not fall outside of the suggested ranges. In particular, these estimates are not a comprehensive statement of our financial results for the quarter ending June 30, 2018, and our actual results may differ materially from these estimates due to developments that may arise between now and the time our second quarter is completed, as well as the time the closing procedures for the fiscal quarter are completed. There can be no assurance that the estimates will be realized in the amounts or during the time period expected, or at all, and our results for the quarter ending June 30, 2018 or any future period may vary materially from the estimates, including as a result of unexpected issues in our business and operations. Accordingly, you should not place undue reliance on these estimates.
The outlook and guidance provided below has been prepared by, and is the responsibility of, our management. Ernst & Young LLP has not audited, reviewed, compiled or performed any procedures with respect to this information. Accordingly, Ernst & Young LLP does not express an opinion or any other form of assurance with respect thereto.
| • | We estimate that Segment income and Adjusted EBITDA for the quarter ending June 30, 2018 will be meaningfully higher than the quarter ended June 30, 2017 from anticipated increases in global automotive and North American building and construction and distribution volumes, as well as favorable metal spreads. |
| • | We estimate that Adjusted EBITDA for the quarter ending June 30, 2018 will be in the range of approximately $80 to $85 million compared to $66 million for the quarter ended June 30, 2017. |
| • | The higher expected Adjusted EBITDA excludes any impact from Lewisport ABS, which we expect will see ramp ups in shipments beginning in the third quarter of fiscal 2018 based on committed volumes, and excludes anticipated growth in global aerospace volumes from higher aircraft production rates and new global multi-year customer contracts until inventory destocking subsides, which is anticipated to happen in the second half of the year. |
| • | A weaker U.S. dollar is expected to negatively impact our results in the quarter ending June 30, 2018 versus comparable 2017 levels. |
For a discussion of additional risks, uncertainties and other factors that may cause our actual results to differ materially from the estimates above, see “Forward Looking Statements” and “Risk Factors—Our estimates for the quarter ending June 30, 2018 reflect certain management estimates and assumptions. Furthermore, our actual results for the quarter ending June 30, 2018 may differ from these estimates” herein and “Risk Factors” and “Management’s Discussion and Analysis of Financial Condition and Results of Operation—Outlook” (excluding “—2018 Outlook”) in the 2017 10-K.
Adjusted EBITDA is a Non-GAAP Measure that has limitations as an analytical tool, and it should not be considered in isolation, or as a substitute for, or superior to, our measures of financial performance prepared in accordance with GAAP.
Except to the extent required by law, we do not undertake, and specifically decline any obligation, to update any forward-looking statements or to publicly announce the results of any revisions to any of such statements to reflect future events or developments.
Refinancing Transactions
As used herein, the term “Refinancing Transactions” refers to the following transactions:
| • | the redemption (the “Notes Redemptions”) of all of the issuer’s outstanding 7.875% Senior Notes due 2020 (the “2020 Notes”) and 9.500% Senior Secured Notes due 2021 (the “2021 Notes” and, together with the 2020 Notes, the “Existing Senior Notes”) and the satisfaction and discharge of the related indentures; |
| • | $400.0 million of private debt financing to refinance, in part, the Existing Senior Notes; |
| • | the entry into a new $1.1 billion first lien senior secured term loan facility (the “New First Lien Term Loan Facility”) to refinance, in part, the Existing Senior Notes and repay a portion of the outstanding borrowings under the ABL Facility; |
| • | the entry into an amendment to our existing $600.0 million asset-based revolving credit facility (the “ABL Facility”) to, among other things, (i) increase aggregate commitments to $750.0 million, (ii) extend the maturity date from June 15, 2020 to the earliest of (x) the fifth anniversary of the closing date of the ABL Amendment (as defined below) (which we expect to be concurrent with the private financing transaction), (y) the date that is 60 days prior to the scheduled maturity date of the term loans under the New First Lien Term Loan Facility, which we expect to mature 4.75 years after the closing of the New First Lien Term Loan Facility and (z) the date that is 60 days prior to the scheduled maturity date of the private debt financing, which we expect to mature five years from the incurrence of the private debt, (iii) remove a previous borrowing base reserve on Belgian finished goods inventory, (iv) permit the |
| private financing transaction and the incurrence of the New First Lien Term Loan Facility and (v) amend certain covenants and other provisions consistent with the corresponding terms of the New First Lien Term Loan Facility and the private debt financing (the “ABL Amendment”); and |
| • | the use of the net proceeds from the private debt financing, together with borrowings under the New First Lien Term Loan Facility and cash on hand, to (i) fund the Notes Redemptions, (ii) repay a portion of the borrowings outstanding under the ABL Facility and (iii) pay related fees and expenses. |
Summary Historical Consolidated Financial and Other Data
The following summary historical consolidated financial data for the years ended December 31, 2017, 2016 and 2015 and as of December 31, 2017 and 2016 have been derived from our audited consolidated financial statements from the 2017 10-K. The summary historical consolidated financial data as of December 31, 2015 have been derived from our audited consolidated financial statements. The following summary historical consolidated financial data for the three months ended March 31, 2018 and 2017 and as of March 31, 2018 have been derived from our unaudited consolidated financial statements from the 2018 10-Q. The summary historical consolidated financial data as of March 31, 2017 have been derived from our unaudited consolidated financial statements. The following summary historical statement of operations data for the twelve months ended March 31, 2018 have been derived by taking our audited consolidated statement of operations data for the year ended December 31, 2017 from the 2017 10-K, adding our unaudited consolidated statement of operations data for the three months ended March 31, 2018 from the 2018 10-Q and subtracting our unaudited consolidated statement of operations data for the three months ended March 31, 2017 from the 2018 10-Q. The unaudited consolidated financial statements have been prepared on the same basis as our audited consolidated financial statements and, in the opinion of our management, reflect all adjustments, consisting of normal recurring adjustments, necessary for a fair presentation of the results for those periods. The results for any interim period are not necessarily indicative of the results that may be expected for a full year.
The historical results included here are not necessarily indicative of future performance or results of operations. The historical consolidated financial data presented below is only a summary and should be read together with “Management’s Discussion and Analysis of Financial Condition and Results of Operations” and our unaudited consolidated financial statements, including the notes thereto, included in the 2018 10-Q, and “Selected Financial Data,” “Management’s Discussion and Analysis of Financial Condition and Results of Operations” and our audited consolidated financial statements, including the notes thereto, included in the 2017 10-K. Unless otherwise indicated, the following table presents the results of operations and financial position of our continuing operations for all periods presented. See Note 17, “Discontinued Operations” to our audited consolidated financial statements in the 2017 10-K.
| For the Twelve Months Ended March 31, |
For the Three Months Ended March 31, |
For the Years Ended December 31, |
||||||||||||||||||||||
| (Dollars in millions, metric tons in thousands) | 2018 | 2018 | 2017 | 2017 | 2016 | 2015 | ||||||||||||||||||
| Statement of operations data: |
||||||||||||||||||||||||
| Revenues |
$ | 2,985.4 | $ | 802.3 | $ | 674.2 | $ | 2,857.3 | $ | 2,663.9 | $ | 2,917.8 | ||||||||||||
| Operating income (loss)(a) |
27.2 | 44.2 | 2.3 | (14.7 | ) | 51.9 | (8.3 | ) | ||||||||||||||||
| (Loss) income from continuing operations |
(174.6 | ) | 4.6 | (35.2 | ) | (214.4 | ) | (72.3 | ) | (72.3 | ) | |||||||||||||
| Net (loss) income attributable to Aleris Corporation |
(170.8 | ) | 4.6 | (35.2 | ) | (210.6 | ) | (75.6 | ) | 48.7 | ||||||||||||||
| Balance sheet data (at end of period): |
||||||||||||||||||||||||
| Cash and cash equivalents |
$ | 79.1 | $ | 79.1 | $ | 74.6 | $ | 102.4 | $ | 55.6 | $ | 62.2 | ||||||||||||
| Total assets(b) |
2,828.8 | 2,828.8 | 2,563.7 | 2,644.4 | 2,389.9 | 2,160.5 | ||||||||||||||||||
| Total debt |
1,829.4 | 1,829.4 | 1,593.3 | 1,780.5 | 1,466.2 | 1,118.3 | ||||||||||||||||||
| Total Aleris Corporation equity |
120.9 | 120.9 | 185.9 | 92.7 | 216.6 | 327.2 | ||||||||||||||||||
| Other data: |
||||||||||||||||||||||||
| Metric tons of finished product shipped: |
||||||||||||||||||||||||
| North America |
467.0 | 119.5 | 114.5 | 462.0 | 486.3 | 492.8 | ||||||||||||||||||
| Europe |
323.0 | 85.4 | 79.7 | 317.3 | 326.7 | 313.6 | ||||||||||||||||||
| Asia Pacific |
27.8 | 6.4 | 5.5 | 26.9 | 22.2 | 21.8 | ||||||||||||||||||
| Intra-entity shipments |
(7.2 | ) | (2.0 | ) | (1.4 | ) | (6.6 | ) | (6.2 | ) | (5.8 | ) | ||||||||||||
|
|
|
|
|
|
|
|
|
|
|
|
|
|||||||||||||
| Total metric tons of finished product shipped |
810.6 | 209.3 | 198.3 | 799.6 | 829.0 | 822.4 | ||||||||||||||||||
|
|
|
|
|
|
|
|
|
|
|
|
|
|||||||||||||
| For the Twelve Months Ended March 31, |
For the Three Months Ended March 31, |
For the Years Ended December 31, |
||||||||||||||||||||||
| (Dollars in millions, metric tons in thousands) | 2018 | 2018 | 2017 | 2017 | 2016 | 2015 | ||||||||||||||||||
| Other financial data: |
||||||||||||||||||||||||
| Net cash (used) provided by(b): |
||||||||||||||||||||||||
| Operating activities |
$ | (27.7 | ) | $ | (34.9 | ) | $ | (38.6 | ) | $ | (31.4 | ) | $ | 12.0 | $ | 119.5 | ||||||||
| Investing activities |
(178.0 | ) | (30.3 | ) | (63.0 | ) | (210.7 | ) | (354.6 | ) | 273.7 | |||||||||||||
| Financing activities |
207.1 | 40.1 | 123.5 | 290.5 | 338.1 | (359.9 | ) | |||||||||||||||||
| Depreciation and amortization(b) |
124.7 | ) | 34.7 | 25.7 | 115.7 | 104.9 | 123.8 | |||||||||||||||||
| Capital expenditures(b) |
(175.2 | ) | (30.1 | ) | (62.6 | ) | (207.7 | ) | (358.1 | ) | (313.6 | ) | ||||||||||||
| EBITDA(c) |
116.0 | 78.5 | 28.3 | 65.8 | 155.1 | 122.8 | ||||||||||||||||||
| Adjusted EBITDA(c) |
202.4 | 53.6 | 51.8 | 200.6 | 205.1 | 222.8 | ||||||||||||||||||
| Commercial margin(d) |
1,230.3 | 325.4 | 294.0 | 1,198.9 | 1,193.1 | 1,204.3 | ||||||||||||||||||
| Ratio of earnings to fixed charges(e) |
— | 1.3 | x | — | — | — | — | |||||||||||||||||
| Ratio of Adjusted EBITDA to cash interest expense(c)(f) |
1.5 | x | 1.5 | x | 2.0 | x | 2.3 | x | ||||||||||||||||
| Ratio of debt to Adjusted EBITDA(c) |
9.1 | x | 8.9 | x | 7.2 | x | 5.0 | x | ||||||||||||||||
| Ratio of net debt to Adjusted EBITDA(c)(g) |
8.7 | x | 8.4 | x | 7.0 | x | 4.8 | x | ||||||||||||||||
| Adjusted other financial data: |
||||||||||||||||||||||||
| Further Adjusted EBITDA(h) |
$ | 239 | ||||||||||||||||||||||
| As adjusted ratio of Further Adjusted EBITDA to cash interest expense(f)(h)(i) |
1.9 | x | ||||||||||||||||||||||
| As adjusted ratio of debt to Further Adjusted EBITDA(h)(j) |
8.0 | x | ||||||||||||||||||||||
| As adjusted ratio of net debt to Further Adjusted EBITDA(g)(h)(j) |
7.8 | x | ||||||||||||||||||||||
| Structuring Adjusted EBITDA(h) |
$ | 334 | ||||||||||||||||||||||
| As adjusted ratio of Structuring Adjusted EBITDA to cash interest expense(f)(h)(i) |
2.6 | x | ||||||||||||||||||||||
| As adjusted ratio of debt to Structuring Adjusted EBITDA(h)(j) |
5.7 | x | ||||||||||||||||||||||
| As adjusted ratio of net debt to Structuring Adjusted EBITDA(g)(h)(j) |
5.6 | x | ||||||||||||||||||||||
| (a) | In the first quarter of 2018, we adopted ASU No. 2017-07, which requires the presentation of all components of net periodic benefit cost, other than service costs, outside of operating income. For the twelve months ended March 31, 2018 (other than the three months ended March 31, 2018) and the years ended December 31, 2017, 2016 and 2015, pension and postretirement benefit expense has not been reclassified and is presented within “Operating income (loss).” Approximately $3.6 million and $2.9 million of pension and postretirement benefit expense will be reclassified for the years ended December 31, 2017 and 2016, respectively, and we do not expect to reclassify such expense for the year ended December 31, 2015. We do not expect the reclassifications to have any impact on net income. |
| (b) | Reflects the total assets, cash flows, depreciation and amortization and capital expenditures of our continuing and discontinued operations for all periods presented. |
| (c) | For additional information regarding our use of EBITDA and Adjusted EBITDA and limitations on their usefulness as analytical tools, see “Explanation of Certain Financial Matters.” For the twelve months ended March 31, 2018, the three months ended March 31, 2018 and 2017 and the years ended December 31, 2017, 2016 and 2015, our reconciliations of EBITDA and Adjusted EBITDA to net income (loss) attributable to Aleris Corporation and net cash (used) provided by operating activities is as follows: |
| For the Twelve Months Ended March 31, |
For the Three Months Ended March 31, |
For the Years Ended December 31, | ||||||||||||||||||||||
| (in millions) | 2018 | 2018 | 2017 | 2017 | 2016 | 2015 | ||||||||||||||||||
| Adjusted EBITDA |
$ | 202.4 | $ | 53.6 | $ | 51.8 | $ | 200.6 | $ | 205.1 | $ | 222.8 | ||||||||||||
| Unrealized gains (losses) on derivative financial instruments of continuing operations |
44.5 | 33.7 | (7.8 | ) | 3.0 | 19.0 | (30.1 | ) | ||||||||||||||||
| Restructuring charges(i) |
(3.4 | ) | (0.9 | ) | (0.4 | ) | (2.9 | ) | (1.5 | ) | (10.3 | ) | ||||||||||||
| Currency exchange (losses) gains on debt |
(1.4 | ) | 1.1 | — | (2.5 | ) | (0.6 | ) | 1.0 | |||||||||||||||
| Stock-based compensation expense |
(11.0 | ) | (0.3 | ) | (0.6 | ) | (11.3 | ) | (7.0 | ) | (4.8 | ) | ||||||||||||
| Start-up costs(ii) |
(75.1 | ) | (16.0 | ) | (14.5 | ) | (73.6 | ) | (46.0 | ) | (21.1 | ) | ||||||||||||
| Favorable (unfavorable) metal price lag(iii) |
0.6 | 9.0 | 2.1 | (6.3 | ) | 3.2 | (18.6 | ) | ||||||||||||||||
| Loss on extinguishment of debt |
— | — | — | — | (12.6 | ) | (2.0 | ) | ||||||||||||||||
| Impairment of amounts held in escrow related to the sale of the recycling business(iv) |
(22.8 | ) | — | — | (22.8 | ) | — | — | ||||||||||||||||
| Other(v) |
(17.8 | ) | (1.7 | ) | (2.3 | ) | (18.4 | ) | (4.5 | ) | (14.1 | ) | ||||||||||||
|
|
|
|
|
|
|
|
|
|
|
|
|
|||||||||||||
| EBITDA |
116.0 | 78.5 | 28.3 | 65.8 | 155.1 | 122.8 | ||||||||||||||||||
| Interest expense, net |
(130.8 | ) | (33.8 | ) | (27.1 | ) | (124.1 | ) | (82.5 | ) | (94.1 | ) | ||||||||||||
| (Provision for) benefit from income taxes |
(35.1 | ) | (5.4 | ) | (10.7 | ) | (40.4 | ) | (40.0 | ) | 22.7 | |||||||||||||
| Depreciation and amortization from continuing operations |
(124.7 | ) | (34.7 | ) | (25.7 | ) | (115.7 | ) | (104.9 | ) | (123.8 | ) | ||||||||||||
| Income (loss) from discontinued operations, net of tax |
3.8 | — | — | 3.8 | (3.3 | ) | 121.1 | |||||||||||||||||
|
|
|
|
|
|
|
|
|
|
|
|
|
|||||||||||||
| Net (loss) income attributable to Aleris Corporation |
(170.8 | ) | 4.6 | (35.2 | ) | (210.6 | ) | (75.6 | ) | 48.7 | ||||||||||||||
| Net income from discontinued operations attributable to noncontrolling interest |
— | — | — | — | — | 0.1 | ||||||||||||||||||
|
|
|
|
|
|
|
|
|
|
|
|
|
|||||||||||||
| Net (loss) income |
(170.8 | ) | 4.6 | (35.2 | ) | (210.6 | ) | (75.6 | ) | 48.8 | ||||||||||||||
| Depreciation and amortization |
124.7 | 34.7 | 25.7 | 115.7 | 104.9 | 123.8 | ||||||||||||||||||
| Provision for deferred income taxes |
27.8 | 1.6 | 6.1 | 32.3 | 21.5 | 34.5 | ||||||||||||||||||
| Stock-based compensation expense |
11.0 | 0.3 | 0.6 | 11.3 | 7.0 | 4.8 | ||||||||||||||||||
| Unrealized (gains) losses on derivative financial instruments |
(44.5 | ) | (33.7 | ) | 7.8 | (3.0 | ) | (19.0 | ) | 28.1 | ||||||||||||||
| Amortization of debt issuance costs |
2.7 | 0.7 | 0.8 | 2.8 | 5.7 | 6.6 | ||||||||||||||||||
| Loss on extinguishment of debt |
— | — | — | — | 12.6 | 2.0 | ||||||||||||||||||
| Net (gain) loss on sale of discontinued operations |
(4.5 | ) | — | — | (4.5 | ) | 3.3 | (191.7 | ) | |||||||||||||||
| Impairment of amounts held in escrow related to the sale of the recycling business |
22.8 | — | — | 22.8 | — | — | ||||||||||||||||||
| Other |
8.7 | (0.4 | ) | 1.0 | 10.1 | 4.9 | (10.2 | ) | ||||||||||||||||
| Change in operating assets and liabilities: |
||||||||||||||||||||||||
| Change in accounts receivable |
(39.7 | ) | (84.4 | ) | (50.4 | ) | (5.7 | ) | (9.4 | ) | (31.3 | ) | ||||||||||||
| Change in inventories |
(52.4 | ) | (60.9 | ) | (66.9 | ) | (58.4 | ) | (70.2 | ) | 128.0 | |||||||||||||
| Change in other assets |
(13.9 | ) | (18.4 | ) | (0.6 | ) | 3.9 | (1.4 | ) | 3.8 | ||||||||||||||
| Change in accounts payable |
34.8 | 44.9 | 43.8 | 33.7 | 41.7 | (18.6 | ) | |||||||||||||||||
| Change in accrued liabilities |
65.6 | 76.1 | 28.7 | 18.2 | (14.0 | ) | (9.1 | ) | ||||||||||||||||
|
|
|
|
|
|
|
|
|
|
|
|
|
|||||||||||||
| Net cash (used) provided by operating activities |
$ | (27.7 | ) | $ | (34.9 | ) | $ | (38.6 | ) | $ | (31.4 | ) | $ | 12.0 | $ | 119.5 | ||||||||
|
|
|
|
|
|
|
|
|
|
|
|
|
|||||||||||||
| (i) | See Note 3, “Restructuring Charges,” to our audited consolidated financial statements in the 2017 10-K. |
| (ii) | Start-up costs are primarily related to the North America ABS Project. Costs associated with start-up activities include the design and development of new products and manufacturing processes, the manufacture of commissioning and trial products and the development of sales and marketing efforts necessary to enter the automotive end-use in North America. |
| (iii) | Represents the estimated financial impact of the timing difference between when aluminum prices included within our revenues are established and when aluminum purchase prices included in our cost of sales are established. This lag will, generally, increase our earnings and EBITDA in times of rising primary aluminum prices and decrease our earnings and EBITDA in times of declining primary aluminum prices; however, our use of derivative financial instruments seeks to reduce this impact. Metal price lag is net of the realized gains and losses from our derivative financial instruments. We exclude metal price lag from our determination of Adjusted EBITDA because it is not an indicator of the performance of our underlying operations. |
| (iv) | The amounts in escrow were preferred shares of Real Industry, Inc., which filed for bankruptcy protection in November 2017. |
| (v) | Includes costs associated with acquisition and disposition activities and other business development costs, gains and losses on the disposal of assets, dividend income, the write down of inventories associated with plant closures and certain other one-time gains and losses. |
| (d) | For additional information regarding our use of commercial margin and limitations on its usefulness as an analytical tool, see “Explanation of Certain Financial Matters.” For the twelve months ended March 31, 2018, the three months ended March 31, 2018 and 2017 and the years ended December 31, 2017, 2016 and 2015, our reconciliation of revenues to commercial margin is as follows: |
| (in millions) | For the Twelve Months Ended March 31, |
For the Three Months Ended March 31, |
For the Years Ended December 31, | |||||||||||||||||||||
| 2018 | 2018 | 2017 | 2017 | 2016 | 2015 | |||||||||||||||||||
| Revenues |
$ | 2,985.4 | $ | 802.3 | $ | 674.2 | $ | 2,857.3 | $ | 2,663.9 | $ | 2,917.8 | ||||||||||||
| Hedged cost of metal |
(1,754.5 | ) | (467.9 | ) | (378.1 | ) | (1,664.7 | ) | (1,467.6 | ) | (1,732.1 | ) | ||||||||||||
| (Favorable) unfavorable metal price lag |
(0.6 | ) | (9.0 | ) | (2.1 | ) | 6.3 | (3.2 | ) | 18.6 | ||||||||||||||
|
|
|
|
|
|
|
|
|
|
|
|
|
|||||||||||||
| Commercial Margin |
$ | 1,230.3 | $ | 325.4 | $ | 294.0 | $ | 1,198.9 | $ | 1,193.1 | $ | 1,204.3 | ||||||||||||
|
|
|
|
|
|
|
|
|
|
|
|
|
|||||||||||||
| (e) | For purposes of computing the ratio of earnings to fixed charges, “earnings” consist of income and loss from continuing operations before a provision for or benefit from income tax expense, plus cash dividends received from equity interests less the equity income or loss recorded and the noncontrolling interest in income or loss from continuing operations of subsidiaries that have not incurred fixed charges. Fixed charges consist of interest expense, including amortization of debt issuance costs, interest capitalized and the interest portion of rental expense. For the twelve months ended March 31, 2018, the three months ended March 31, 2017 and the years ended December 31, 2017, 2016 and 2015, earnings were insufficient to cover fixed charges by approximately $140.0 million, $27.1 million, $178.1 million, $54.4 million and $101.1 million, respectively. |
| (f) | Cash interest expense is defined as interest expense, including capitalized interest, less amortization of debt issuance costs. |
| (g) | Net debt is total debt minus cash and cash equivalents. |
| (h) | For additional information regarding our use of Further Adjusted EBITDA and Structuring Adjusted EBITDA and limitations on their usefulness as analytical tools, see “Explanation of Certain Financial Matters.” In addition, the items in the calculation of Structuring Adjusted EBITDA below regarding the future financial impact of customer purchase commitments and capital expenditure projects are forward-looking statements (the “outlook adjustments”). These outlook adjustments are subject to various risks and uncertainties, many of which are beyond our control. For example, we have estimated the future financial impact of certain customer purchase commitments net of their expected costs. Actual costs may exceed our projections, including as a result of increased aluminum, energy, labor or other operating costs or other factors, which could limit the benefits we expect to realize from these customer purchase commitments. We have also made certain assumptions regarding customer purchase commitments based on our historical experience with such customers and industry practice. Some of these commitments are not subject to contractual arrangements, and to the extent these customers seek to reduce or delay their commitments, we will not realize the benefits expected from these commitments. In addition, certain of the anticipated benefits contained in or implied by the outlook adjustments are not expected to be realized until the successful ramp up of ABS production at our Lewisport facility and of certain aerospace production at our Koblenz and Zhenjiang facilities. As a result, we expect to realize only a portion of the anticipated benefits contained in or implied by these outlook adjustments during the year ending December 31, 2018, as ramp up at these facilities is expected to occur over the next several years. See “Forward Looking Statements” and “Risk Factors—We may be unable to achieve some or all of the benefits that we expect to realize as a result of certain customer purchase commitments and capital expenditure projects” herein and “Risk Factors” and “Management’s Discussion and Analysis of Financial Condition and Results of Operation—Outlook” (excluding “—2018 Outlook”) in the 2017 10-K for a discussion of additional risks, uncertainties and other factors that may cause our actual results to differ materially from those expressed in our outlook adjustments. |
Further Adjusted EBITDA and Structuring Adjusted EBITDA are being provided for illustrative purposes only in connection with the Refinancing Transactions. Accordingly, we do not intend to update or provide these financial measures on an ongoing basis.
For the twelve months ended March 31, 2018, our calculation of Further Adjusted EBITDA and Structuring Adjusted EBITDA is as follows:
| For the Twelve Months Ended March 31, |
||||
| (in millions) | 2018 | |||
| Adjusted EBITDA |
$ | 202 | ||
| Lewisport outage(i) |
30 | |||
| Duffel North America support(ii) |
3 | |||
| Wingskin qualification(iii) |
4 | |||
| Further Adjusted EBITDA |
$ | 239 | ||
|
|
|
|||
| Expected automotive volumes(iv) |
70 | |||
| Expected aerospace volumes(v) |
25 | |||
|
|
|
|||
| Structuring Adjusted EBITDA |
$ | 334 | ||
|
|
|
|||
| (i) | Represents the estimated Adjusted EBITDA impact of lost volumes related to the planned hot mill outage at our Lewisport facility, which occurred during the third quarter of 2017. The planned hot mill outage was related to the upgrades we have made to our existing asset base at our Lewisport facility in connection with the North America ABS Project. During the outage, we upgraded our ingot scalper and pre-heating furnace capabilities, widened our hot mill and installed state-of-the-art mill controls. This necessary outage took approximately 60 days (together with the commissioning of the hot mill after the outage, effectively 75 days) to complete and impacted our ability to produce and ship products to customers. We estimate that we missed 100 million pounds (45 kilotons) of customer shipments during the outage. |
| (ii) | Represents the estimated Adjusted EBITDA impact of lost volumes related to blocking the capacity of the CALP at our Duffel facility to supply ABS to our Lewisport facility in connection with customer qualifications related to the North America ABS Project, which impacted our ability to produce and ship products to customers during 2017. |
| (iii) | Represents the estimated Adjusted EBITDA impact of lost volumes related to the allocation of equipment run time at our Koblenz and Zhenjiang facilities for the development and qualification of new wingskin products, which impacted our ability to produce and ship products to customers during 2017. We expect to introduce wingskin production at our Koblenz facility in the second half of 2018 and at our Zhenjiang facility in early 2019. |
| (iv) | Represents the mid-point of the estimated future Adjusted EBITDA impact of expected increases in shipments of automotive products from our Lewisport facility related to certain customer purchase commitments, net of their expected cost. |
Aluminum ABS products are expected to generate more than twice the commercial margin per ton of the standard distribution sheet currently produced at the Lewisport facility. Over the next several years, this is expected to have a meaningful impact on our profitability. Based on existing long-term customer commitments, which account for approximately 60% of our ABS capacity through 2025 and include significant “take or pay” obligations, we believe the segment income and Adjusted EBITDA impact of the North America ABS Project could range from $65 million to $75 million in 2019. We expect the full ramp up of ABS shipments from our combined CALP capacity to occur over the next four years.
Estimates of the future Adjusted EBITDA impact from certain existing commitments have been determined using a range of expected customer nominated volumes based on existing customer commitments and applying an appropriate estimate of average profitability per ton. For the expected automotive volumes, to determine an estimate of average North America segment income and Adjusted EBITDA per ton, we used the range of rolling margins per ton included in the pricing terms of our existing customer arrangements. These rolling margins were then compared to Lewisport’s average rolling margin per ton in 2017. Profitability per ton also reflects an estimate of incremental cash conversion costs.
| (v) | Represents the mid-point of the estimated future Adjusted EBITDA impact of expected increases in shipments of aerospace products related to certain customer purchase commitments, net of their expected cost. |
During 2016 and 2017, several of our long-term contracts with major aircraft OEMs were successfully renewed. Each contract was renewed with a higher share of the OEM’s aerospace business and with a higher value-added mix of products and alloys. Based upon expected aircraft build rates, these new contracts and products are expected to increase Adjusted EBITDA by $20 million to $30 million annually, beginning in 2019. The full annual benefit of these contracts is not expected to be realized until 2022.
Estimates of the future Adjusted EBITDA impact from certain existing commitments have been determined using a range of expected customer nominated volumes based on existing customer commitments and applying an appropriate estimate of average profitability per ton. For the expected aerospace volumes, the estimate of average Europe and Asia Pacific segment income and Adjusted EBITDA per ton was determined using the 2017 Company-wide average Adjusted EBITDA per ton for aerospace products plus an estimate of profitability benefits from fixed cost leverage, which was based on our 2017 aerospace fixed cost absorption and adjusted for the higher production volumes expected to be realized in the future under certain aerospace contracts.
| (i) | The as adjusted ratio of Further Adjusted EBITDA and Structuring Adjusted EBITDA to cash interest expense for the twelve months ended March 31, 2018 gives effect to the consummation of the Refinancing Transactions as if they had occurred on April 1, 2017 and reflects interest expense related to the private financing transaction as well as borrowings under the New First Lien Term Loan Facility, based on an estimated weighted-average blended rate of approximately 7.4%. The interest rates related to the private financing transaction and the New First Lien Term Loan Facility are based on assumptions of the rates to be effective upon closing of the Refinancing Transactions. |
| (j) | The as adjusted ratios of debt and net debt, as described in (g) above, to Further Adjusted EBITDA and Structuring Adjusted EBITDA as of March 31, 2018 give effect to the consummation of the Refinancing Transactions as if they had occurred on April 1, 2017. |
RISK FACTORS
We may be unable to achieve some or all of the benefits that we expect to realize as a result of certain customer purchase commitments and capital expenditure projects.
We present Structuring Adjusted EBITDA, a non-GAAP financial measure and forward-looking statement herein. Structuring Adjusted EBITDA is being provided for illustrative purposes only in connection with the Refinancing Transactions. Accordingly, we do not intend to update or provide this financial measure on an ongoing basis. The items in the calculation of Structuring Adjusted EBITDA regarding the future financial impact of customer purchase commitments and capital expenditure projects are forward-looking statements (the “outlook adjustments”). These outlook adjustments are subject to various risks and uncertainties, many of which are beyond our control.
We prepared the outlook adjustments based upon available information and assumptions and estimates that we believe are reasonable. Accordingly, the outlook adjustments may not be indicative of our future operating or financial performance. Our actual results of operations may vary materially from our presentation of Structuring Adjusted EBITDA. In particular, we cannot assure you that the expected increases in shipments of automotive and aerospace products reflected in Structuring Adjusted EBITDA will be realized on our expected timing or at all or that our estimates and assumptions will prove to be accurate. For example, we have estimated the future financial impact of certain customer purchase commitments net of their expected costs. Actual costs may exceed our projections, including as a result of increased aluminum, energy, labor or other operating costs or other factors, which could limit the benefits we expect to realize from these customer purchase commitments. We have also made certain assumptions regarding customer purchase commitments based on our historical experience with such customers and industry practice. Some of these commitments are not subject to contractual arrangements, and to the extent these customers seek to reduce or delay their commitments, we will not realize the benefits expected from these commitments. In addition, certain of the anticipated benefits contained in or implied by the outlook adjustments are not expected to be realized until the successful ramp up of ABS production at our Lewisport facility and of certain aerospace production at our Koblenz and Zhenjiang facilities. As a result, we expect to realize only a portion of the anticipated benefits contained in or implied by these outlook adjustments during the year ending December 31, 2018, as ramp up at these facilities is expected to occur over the next several years. In addition, our actual results of operations may vary as a result of future currency exchange rate fluctuation. See “Forward Looking Statements” herein and “Risk Factors” and “Management’s Discussion and Analysis of Financial Condition and Results of Operation—Outlook” (excluding “—2018 Outlook”) in the 2017 10-K for a discussion of additional risks, uncertainties and other factors that may cause our actual results to differ materially from those expressed in our outlook adjustments.
Our estimates for the quarter ending June 30, 2018 reflect certain management estimates and assumptions. Furthermore, our actual results for the quarter ending June 30, 2018 may differ from these estimates.
The quarter ending June 30, 2018 is not yet complete and our financial results for the quarter ending June 30, 2018 are not available yet. Although we do not typically provide quantitative or intra-quarter guidance, we present certain estimates for the quarter ending June 30, 2018, which are forward-looking statements herein. These estimates reflect management’s best estimates based upon currently available information and certain assumptions we believe to be reasonable, including estimates of tons to be produced and sold during the quarter, commercial margin to be generated from tons sold and conversion costs to be incurred in production, which are also forward-looking statements. Any one or more of the assumptions may be incorrect and future results may be different from the estimates and the differences may be materially less favorable. The estimates and assumptions have not been reviewed or verified by any third party, including our independent auditors.
Because we have not yet completed our second quarter of 2018, the estimates and assumptions are based on events that have not yet occurred and are subject to all of the risks and uncertainties, many of which are not within our control, inherent in making projections and may be revised as a result of management’s further review. The estimates should not be relied upon as fact or as an accurate representation of future results, and the information that is presented as a range of results is not intended to represent that actual results could not fall outside of the suggested ranges. In particular, the estimates are not a comprehensive statement of our financial results for the quarter ending June 30, 2018, and our actual results may differ materially from the estimates due to developments that may arise between now and the time our second quarter is completed, as well as the time the closing procedures for the fiscal quarter are completed. There can be no assurance that the estimates will be realized in the amounts or during the time period expected, or at all, and our results for the quarter ending June 30, 2018 or any future period may vary materially from the estimates, including as a result of unexpected issues in our business and operations. For example, the estimates assume that no unexpected risks materialize during the forecasted period, which could include significant business, economic, financial, regulatory, competitive or market risks, any of which could result in materially different results than the estimates. Accordingly, you should not place undue reliance on the estimates. See “Forward Looking Statements” herein and “Risk Factors” and “Management’s Discussion and Analysis of Financial Condition and Results of Operation—Outlook” (excluding “—2018 Outlook”) in the 2017 10-K for a discussion of additional risks, uncertainties and other factors that may cause our actual results to differ materially from the estimates.
In addition, the estimated amount of Adjusted EBITDA for the quarter ending June 30, 2018 presented herein is a Non-GAAP Measure and investors will not have the ability to compare such Non-GAAP Measure against the most comparable GAAP measure. As a result, the limitations of such measure are even more pronounced. See “Explanation of Certain Financial Matters” herein.