Attached files
| file | filename |
|---|---|
| EX-99.1 - EXHIBIT 99.1 - BRINKS CO | ex991pressrelease53118.htm |
| EX-2.1 - EXHIBIT 2.1 - BRINKS CO | ex21stockpurchaseagreement.htm |
| 8-K - 8-K - BRINKS CO | a201805delta.htm |

Exhibit 99.2 Dunbar Acquisition Strengthening Our U.S. Operations MAY 31, 2018
Safe Harbor Statement and Non-GAAP Results These materials contain forward-looking information. Words such as "anticipate," "assume," "estimate," "expect," “target” "project," "predict," "intend," "plan," "believe," "potential," "may," "should" and similar expressions may identify forward-looking information. Forward-looking information in these materials includes, but is not limited to information regarding:;2019 adjusted EBITDA and non-GAAP operating profit targets; expected synergies and contributions to future earnings related to the Dunbar acquisition; 2018 and 2019 tax rate outlook and future U.S. cash tax payments; net debt and leverage outlook and future investment in and results of acquisitions. Forward-looking information in this document is subject to known and unknown risks, uncertainties and contingencies, which are difficult to predict or quantify, and which could cause actual results, performance or achievements to differ materially from those that are anticipated. These risks, uncertainties and contingencies, many of which are beyond our control, include, but are not limited to: our ability to improve profitability and execute further cost and operational improvement and efficiencies in our core businesses; our ability to improve service levels and quality in our core businesses; market volatility and commodity price fluctuations; seasonality, pricing and other competitive industry factors; investment in information technology and its impact on revenue and profit growth; our ability to maintain an effective IT infrastructure and safeguard confidential information; our ability to effectively develop and implement solutions for our customers; risks associated with operating in foreign countries, including changing political, labor and economic conditions, regulatory issues, currency restrictions and devaluations, restrictions on and cost of repatriating earnings and capital, impact on the Company’s financial results as a result of jurisdictions determined to be highly inflationary, and restrictive government actions, including nationalization; labor issues, including negotiations with organized labor and work stoppages; the strength of the U.S. dollar relative to foreign currencies and foreign currency exchange rates; our ability to identify, evaluate and complete acquisitions and other strategic transactions and to successfully integrate acquired companies; costs related to dispositions and market exits; our ability to obtain appropriate insurance coverage, positions taken by insurers relative to claims and the financial condition of insurers; safety and security performance and loss experience; employee, environmental and other liabilities in connection with former coal operations, including black lung claims; the impact of the Patient Protection and Affordable Care Act on legacy liabilities and ongoing operations; funding requirements, accounting treatment, and investment performance of our pension plans, the VEBA and other employee benefits; changes to estimated liabilities and assets in actuarial assumptions; the nature of hedging relationships and counterparty risk; access to the capital and credit markets; our ability to realize deferred tax assets; the outcome of pending and future claims, litigation, and administrative proceedings; public perception of our business, reputation and brand; changes in estimates and assumptions underlying critical accounting policies; the promulgation and adoption of new accounting standards, new government regulations and interpretation of existing standards and regulations. This list of risks, uncertainties and contingencies is not intended to be exhaustive. Additional factors that could cause our results to differ materially from those described in the forward-looking statements can be found under "Risk Factors" in Item 1A of our Annual Report on Form 10-K for the period ended December 31, 2017, and in our other public filings with the Securities and Exchange Commission. The forward-looking information discussed today and included in these materials is representative as of today only and The Brink's Company undertakes no obligation to update any information contained in this document. These materials are copyrighted and may not be used without written permission from Brink's. Today’s presentation is focused primarily on non-GAAP results. Detailed reconciliations of non-GAAP to GAAP results are included in the appendix and in the May 9, 2018 Wells Fargo Conference presentation available in the Investor Presentations section of the Brink’s website: www.brinks.com. 2

Dunbar Acquisition Overview Core Acquisition in Core Market Strong Returns • Combines #2 and #4 largest U.S. cash • $390M LTM revenue management companies • $43M LTM adjusted EBITDA • $520M purchase price • Funded from available cash • $40 - $45M of expected cost synergies • Expected additional Capex of ~$50 million • 6.5x – 7.0x adjusted EBITDA post- synergy purchase multiple (including • Expected to close by end of 2018 expected Capex) • Subject to regulatory approval and customary conditions • Expected to be accretive in year 1 • Expected to add ~$0.90 to non- GAAP EPS in year 2 • Provides significant tax benefits 3

Dunbar Business Overview Operations Customers Other • Strong management team Financial • National footprint Institutions • Complementary customer base includes small-to-medium sized retailers and financial institutions • 78 branch facilities Retail • 5,400 employees • 1,600 vehicles 4
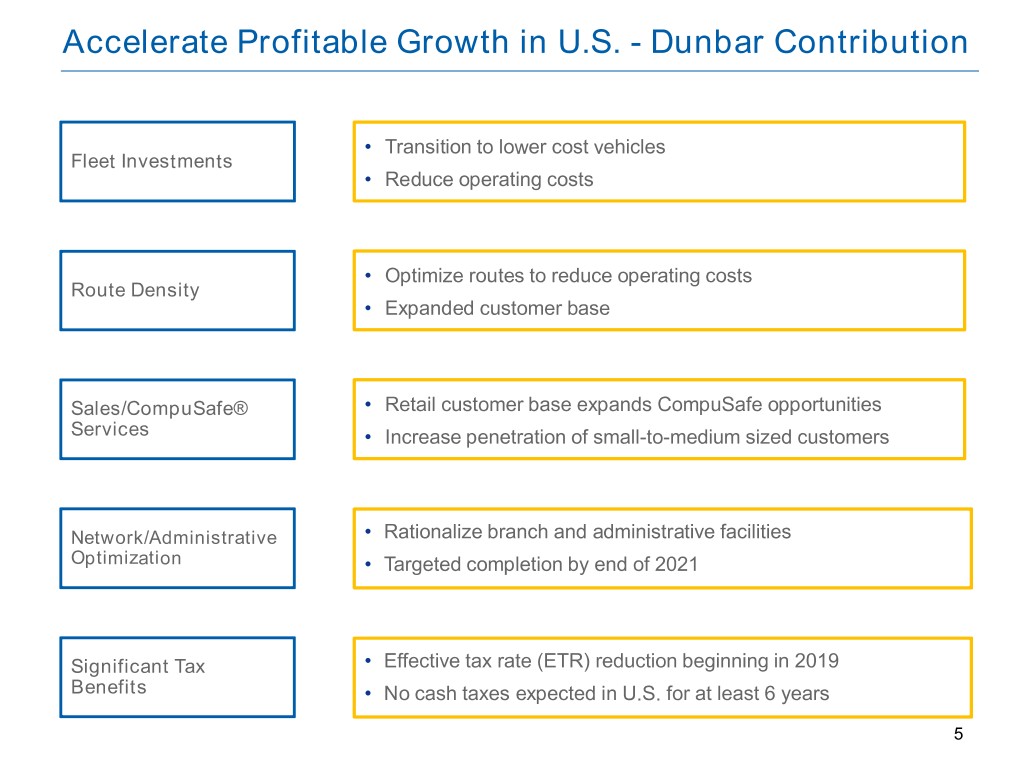
Accelerate Profitable Growth in U.S. - Dunbar Contribution • Transition to lower cost vehicles Fleet Investments • Reduce operating costs • Optimize routes to reduce operating costs Route Density • Expanded customer base Sales/CompuSafe® • Retail customer base expands CompuSafe opportunities Services • Increase penetration of small-to-medium sized customers Network/Administrative • Rationalize branch and administrative facilities Optimization • Targeted completion by end of 2021 Significant Tax • Effective tax rate (ETR) reduction beginning in 2019 Benefits • No cash taxes expected in U.S. for at least 6 years 5
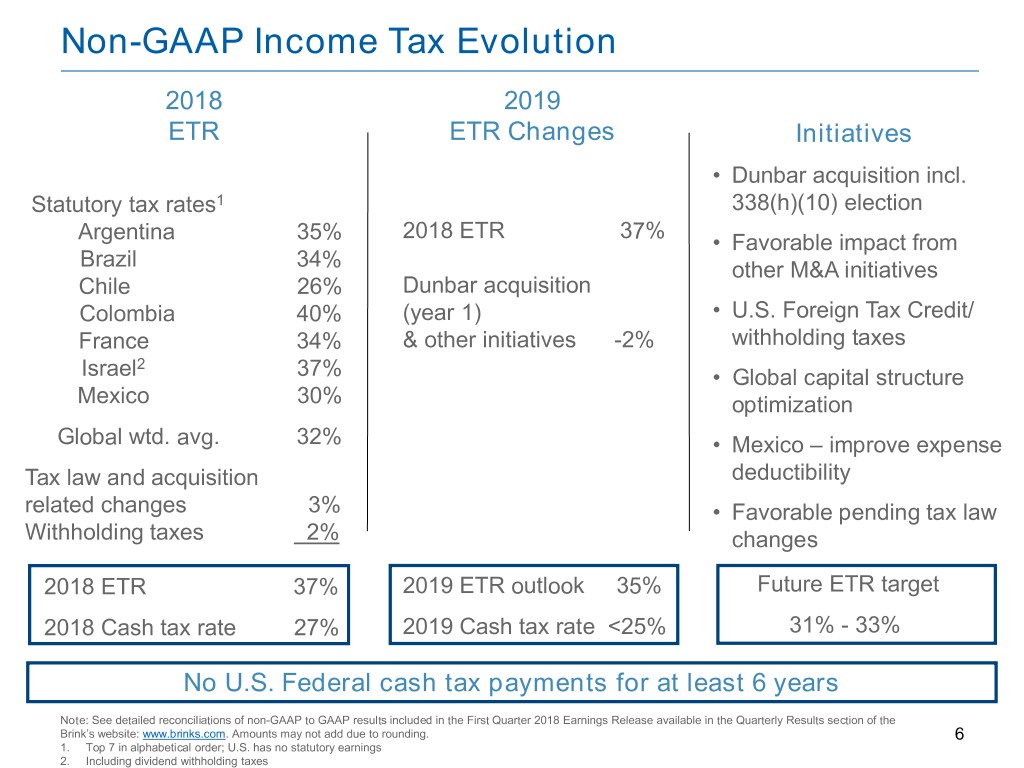
Non-GAAP Income Tax Evolution 2018 2019 ETR ETR Changes Initiatives • Dunbar acquisition incl. Statutory tax rates1 338(h)(10) election 2018 ETR 37% Argentina 35% • Favorable impact from Brazil 34% other M&A initiatives Chile 26% Dunbar acquisition Colombia 40% (year 1) • U.S. Foreign Tax Credit/ France 34% & other initiatives -2% withholding taxes 2 Israel 37% • Global capital structure Mexico 30% optimization Global wtd. avg. 32% • Mexico – improve expense Tax law and acquisition deductibility related changes 3% • Favorable pending tax law Withholding taxes 2% changes 2018 ETR 37% 2019 ETR outlook 35% Future ETR target 0 2018 Cash tax rate 27% 2019 Cash tax rate <25% 31% - 33% No U.S. Federal cash tax payments for at least 6 years Note: See detailed reconciliations of non-GAAP to GAAP results included in the First Quarter 2018 Earnings Release available in the Quarterly Results section of the Brink’s website: www.brinks.com. Amounts may not add due to rounding. 6 1. Top 7 in alphabetical order; U.S. has no statutory earnings 2. Including dividend withholding taxes

Net Debt and Leverage Assumes $685 in acquisitions in 2018 and $115 in 2019 (Non-GAAP, $ Millions) Net Debt Adjusted EBITDA and Financial Leverage Significant capacity for acquisitions Leverage Ratio per financial covenants1 ~ $1,200 0.9 0.7 1.4 ~1.3 ~1.9 ~1.5 ~ $1,100 $735-$765 $50 – Pro-forma $80 acquisition impact ~ $640 ~ $115 $612 ~ $465 ~ $40 $685 $269 $247 $525 $425 $425 $342 $306 Dec 2015 Dec 2016 Dec 2017 Pro-forma Pro-forma 2015 2016 2017 Pro-forma Pro-forma Pro-forma 2 2018 3 20193 2017 20183 20193 1. Net Debt divided by Adjusted EBITDA 2. Additional pro-forma impact (TTM) based on post-closing synergies of closed acquisitions. 3. Forecasted utilization based on business plan through 2019 including $685 million of Note: See detailed reconciliations of non-GAAP to GAAP results in the appendix and in the May 9, acquisitions in 2018 and $115 million in 2019. Includes additional pro-forma Adjusted 7 2018 Wells Fargo Conference presentation available in the Investor Presentations section of the EBITDA and cash flow impact based on post-closing synergies of closed, announced and Brink’s website: www.brinks.com. potential acquisitions.
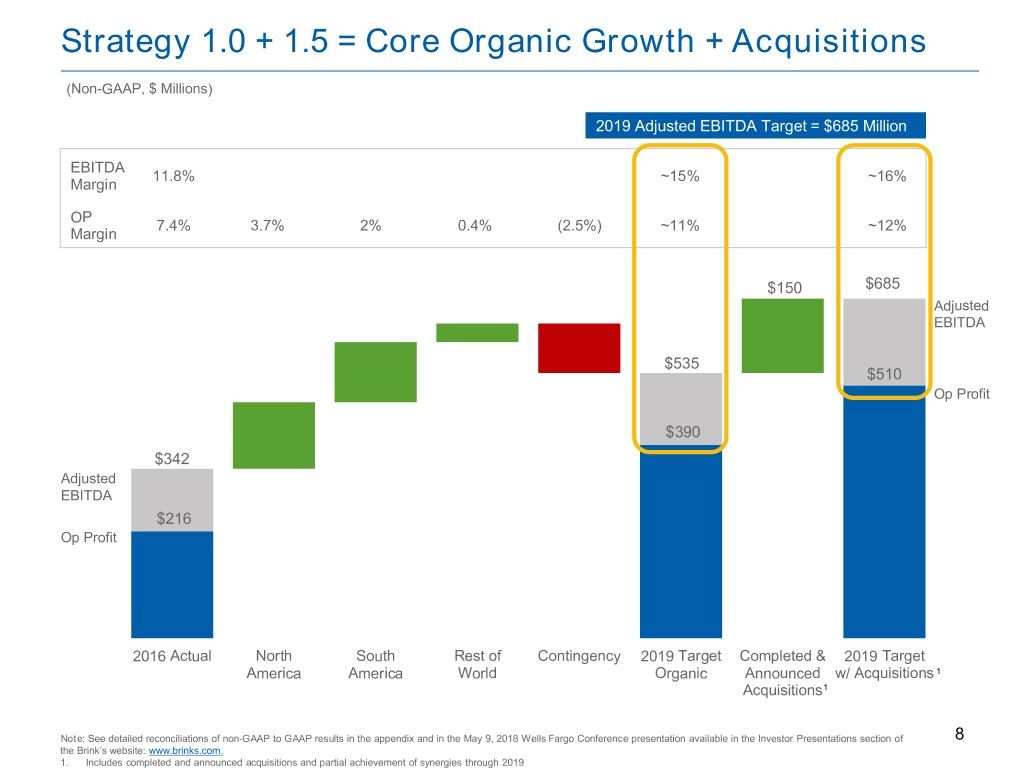
Strategy 1.0 + 1.5 = Core Organic Growth + Acquisitions (Non-GAAP, $ Millions) 2019 Adjusted EBITDA Target = $685 Million EBITDA 11.8% ~15% ~16% Margin OP 7.4% 3.7% 2% 0.4% (2.5%) ~11% ~12% Margin $150 $685 Adjusted EBITDA $535 $510 Op Profit $390 $342 Adjusted EBITDA $216 Op Profit 2016 Actual North South Rest of Contingency 2019 Target Completed & 2019 Target America America World Organic Announced w/ Acquisitions 1 Acquisitions1 Note: See detailed reconciliations of non-GAAP to GAAP results in the appendix and in the May 9, 2018 Wells Fargo Conference presentation available in the Investor Presentations section of 8 the Brink’s website: www.brinks.com. 1. Includes completed and announced acquisitions and partial achievement of synergies through 2019

3 Year Strategic Plan – 2019 EBITDA Target Increased 45% (Non-GAAP, $ Millions) Operating Profit & Adj. EBITDA Expected Benefits • Deploys ~85% of $800 million acquisition target ~16% through 2019 ~15% • Core – Core accretive acquisitions at less 13.3% ~12% than 6.5x post synergy Adjusted EBITDA multiple Adj. EBITDA 11.8% Margin ~10% ~$685 • “Excess” cash fully deployed at attractive returns 8.8% • Financed at attractive long-term rates ~ $175 Op Profit 7.4% Margin • Substantial tax rate improvement $475 • No U.S. cash taxes for 6 plus years $425 Adj. $342 ~ $150 EBITDA $144 $126 D&A/Other ~ $510 ~$325 $281 Doubles Adjusted EBITDA over 3 year plan $216 Op Profit from $342 to ~$685 2016 2017 2019 Target from 2019 Target 3/2/17 Investor Day Note See detailed reconciliations of non-GAAP to GAAP results in the appendix and in the May 9, 2018 Wells Fargo Conference presentation available in the Investor Presentations section of 9 the Brink’s website: www.brinks.com. Amounts may not add due to rounding.

Appendix
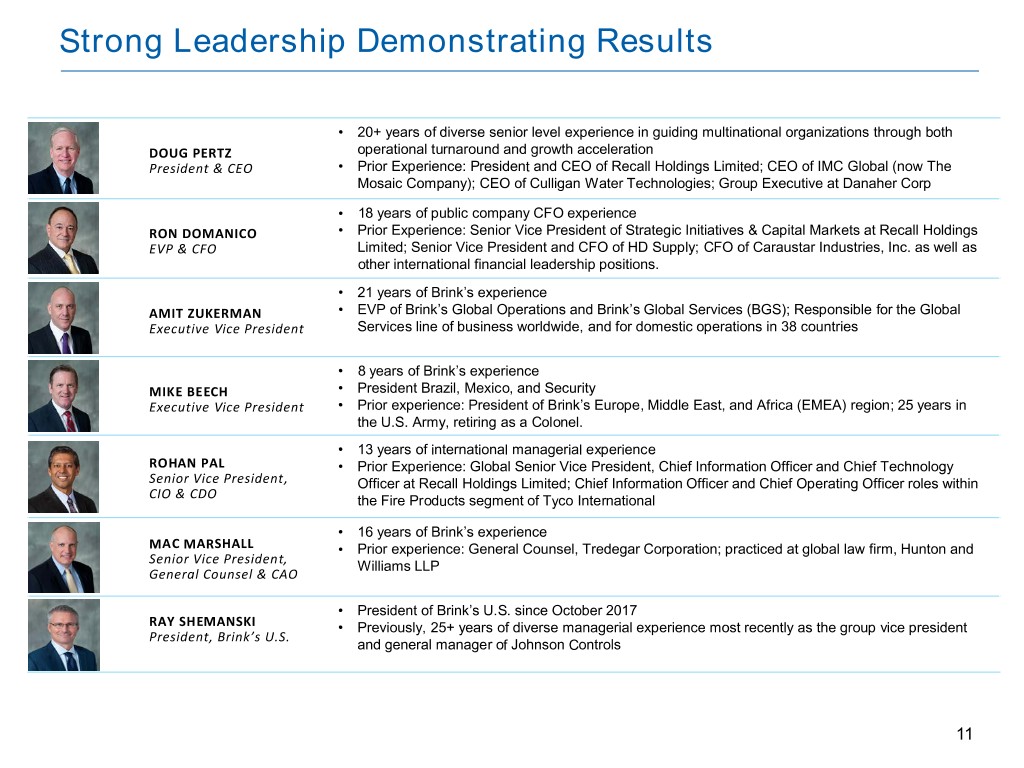
Strong Leadership Demonstrating Results • 20+ years of diverse senior level experience in guiding multinational organizations through both DOUG PERTZ operational turnaround and growth acceleration President & CEO • Prior Experience: President and CEO of Recall Holdings Limited; CEO of IMC Global (now The Mosaic Company); CEO of Culligan Water Technologies; Group Executive at Danaher Corp • 18 years of public company CFO experience RON DOMANICO • Prior Experience: Senior Vice President of Strategic Initiatives & Capital Markets at Recall Holdings EVP & CFO Limited; Senior Vice President and CFO of HD Supply; CFO of Caraustar Industries, Inc. as well as other international financial leadership positions. • 21 years of Brink’s experience AMIT ZUKERMAN • EVP of Brink’s Global Operations and Brink’s Global Services (BGS); Responsible for the Global Executive Vice President Services line of business worldwide, and for domestic operations in 38 countries • 8 years of Brink’s experience MIKE BEECH • President Brazil, Mexico, and Security Executive Vice President • Prior experience: President of Brink’s Europe, Middle East, and Africa (EMEA) region; 25 years in the U.S. Army, retiring as a Colonel. • 13 years of international managerial experience ROHAN PAL • Prior Experience: Global Senior Vice President, Chief Information Officer and Chief Technology Senior Vice President, Officer at Recall Holdings Limited; Chief Information Officer and Chief Operating Officer roles within CIO & CDO the Fire Products segment of Tyco International • 16 years of Brink’s experience MAC MARSHALL • Prior experience: General Counsel, Tredegar Corporation; practiced at global law firm, Hunton and Senior Vice President, Williams LLP General Counsel & CAO • President of Brink’s U.S. since October 2017 RAY SHEMANSKI • Previously, 25+ years of diverse managerial experience most recently as the group vice president President, Brink’s U.S. and general manager of Johnson Controls 11
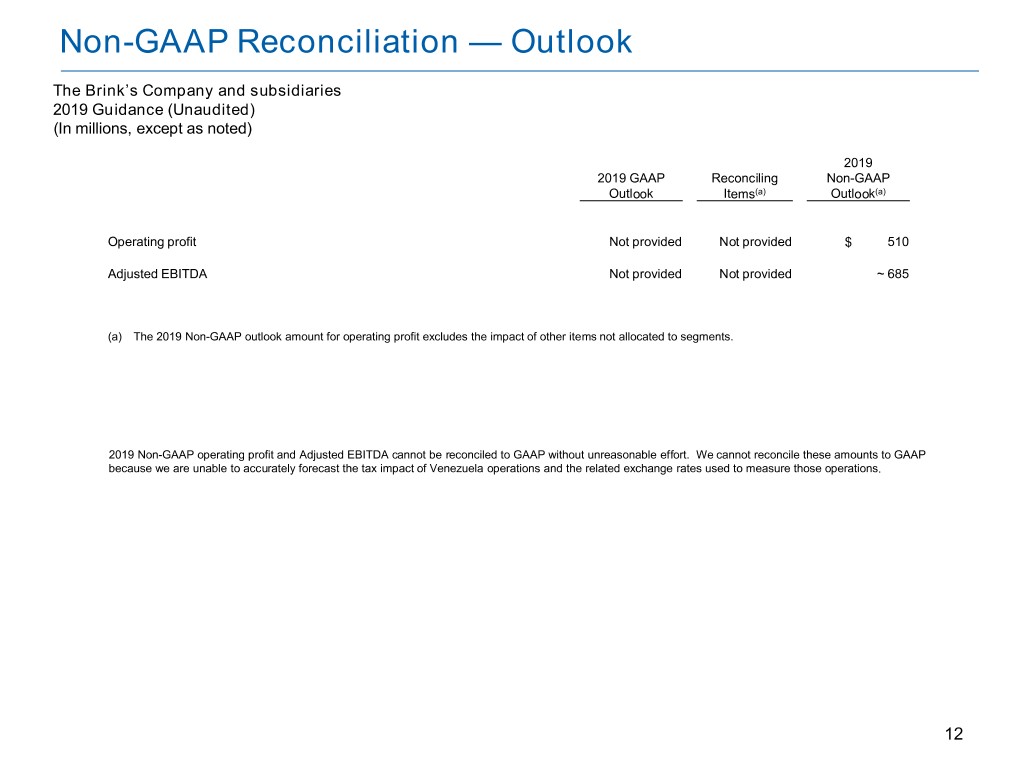
Non-GAAP Reconciliation — Outlook The Brink’s Company and subsidiaries 2019 Guidance (Unaudited) (In millions, except as noted) 2019 2019 GAAP Reconciling Non-GAAP Outlook Items(a) Outlook(a) Operating profit Not provided Not provided $ 510 Adjusted EBITDA Not provided Not provided ~ 685 (a) The 2019 Non-GAAP outlook amount for operating profit excludes the impact of other items not allocated to segments. 2019 Non-GAAP operating profit and Adjusted EBITDA cannot be reconciled to GAAP without unreasonable effort. We cannot reconcile these amounts to GAAP because we are unable to accurately forecast the tax impact of Venezuela operations and the related exchange rates used to measure those operations. 12

Non-GAAP Results Reconciled to GAAP (1 of 3) The Brink’s Company and subsidiaries Non-GAAP Reconciliations (In millions) 2015 Full Year Revenues: GAAP 3,061.4 Venezuela operations(a) (84.5) Non-GAAP 2,976.9 Operating profit (loss): GAAP 96.4 Venezuela operations(a) 45.6 Reorganization and Restructuring(a) 15.3 Acquisitions and dispositions(a) 10.2 Non-GAAP 167.5 Taxes: GAAP 66.5 Retirement plans(c) 10.8 Venezuela operations(a) (5.5) Reorganization and Restructuring(a) 3.9 Acquisitions and dispositions(a) 1.4 Tax on accelerated U.S. income(b) (23.5) Non-GAAP 53.6 Amounts may not add due to rounding. See slide 15 for footnote explanations. 13

Non-GAAP Results Reconciled to GAAP (2 of 3) The Brink’s Company and subsidiaries Non-GAAP Reconciliations (In millions) 2015 Full Year Income (loss) from continuing operations attributable to Brink's: GAAP (9.1) Retirement plans(c) 20.4 Venezuela operations(a) 32.1 Reorganization and Restructuring(a) 11.4 Acquisitions and dispositions(a) 8.8 Tax on accelerated U.S. income(b) 23.5 Non-GAAP 87.1 Depreciation and Amortization: GAAP 139.9 Venezuela operations(a) (3.9) Acquisitions and dispositions(a) (4.2) Non-GAAP 131.8 Amounts may not add due to rounding. See slide 15 for footnote explanations. 14

Non-GAAP Results Reconciled to GAAP (3 of 3) The Brink’s Company and subsidiaries Non-GAAP Reconciliations (In millions) 2015 Full Year Adjusted EBITDA(e): Net income (loss) attributable to Brink's - GAAP (11.9) Interest expense - GAAP 18.9 Income tax provision - GAAP 66.5 Depreciation and amortization - GAAP 139.9 EBITDA 213.4 Discontinued operations - GAAP 2.8 Retirement plans(c) 31.2 Venezuela operations(a) 22.7 Reorganization and Restructuring(a) 15.3 Acquisitions and dispositions(a) 6.0 Share-based compensation(d) 14.1 Adjusted EBITDA 305.5 Amounts may not add due to rounding. (a) See “Other Items Not Allocated To Segments” on slide 16 for details. We do not consider these items to be reflective of our core operating performance due to the variability of such items from period-to-period in terms of size, nature and significance. (b) The non-GAAP tax rate excludes the U.S. tax on a transaction that accelerated U.S. taxable income because it will be offset by foreign tax benefits in future years. (c) Our U.S. retirement plans are frozen and costs related to these plans are excluded from non-GAAP results. Certain non-U.S. operations also have retirement plans. Settlement charges related to these non-U.S. plans are also excluded from non-GAAP results. (d) There is no difference between GAAP and non-GAAP share-based compensation amounts for the periods presented. (e) Adjusted EBITDA is defined as non-GAAP income from continuing operations excluding the impact of non-GAAP interest expense, non-GAAP income tax provision, non-GAAP depreciation and amortization and non-GAAP share-based compensation. 15

Non-GAAP Reconciliation — Other The Brink’s Company and subsidiaries Other Items Not Allocated to Segments (Unaudited) Brink’s measures its segment results before income and expenses for corporate activities and for certain other items. A summary of the other items not allocated to segment results is below. Venezuela operations We have excluded from our segment results all of our Venezuela operating results, due to the Venezuelan government's restrictions that have prevented us from repatriating funds. As a result, the Chief Executive Officer, the Company's Chief Operating Decision maker ("CODM"), assesses segment performance and makes resource decisions by segment excluding Venezuela operating results. Reorganization and Restructuring 2015 Restructuring Brink's initiated a restructuring of its business in the third quarter of 2015. We recognized $11.6 million in related 2015 costs and an additional $6.5 million in 2016 related to this restructuring. The actions under this program were substantially completed by the end of 2016, with cumulative pretax charges of approximately $18 million. Due to the unique circumstances around these charges, they have not been allocated to segment results and are excluded from non-GAAP results. Acquisitions and dispositions Certain acquisition and disposition items that are not considered part of the ongoing activities of the business and are special in nature are consistently excluded from non-GAAP results. These items are described below: 2015 Acquisitions and Dispositions - These items related primarily to Brink's sale of its 70% interest in a cash management business in Russia in the fourth quarter of 2015 from which we recognized a $5.9 million loss on the sale. - Amortization expense for acquisition-related intangible assets was $4.2 million in 2015. These costs have been excluded from our segment and our consolidated non-GAAP results. 16

Non-GAAP Reconciliation — Net Debt The Brink’s Company and subsidiaries Non-GAAP Reconciliations — Net Debt (Unaudited) (In millions) December 31, 2015 Debt: Short-term borrowings $ 32.6 Long-term debt 397.9 Total Debt 430.5 Restricted cash borrowings(a) (3.5) Total Debt without restricted cash borrowings 427.0 Less: Cash and cash equivalents 181.9 Amounts held by Cash Management Services operations(b) (24.2) Cash and cash equivalents available for general corporate purposes 157.7 Net Debt $ 269.3 a) Restricted cash borrowings are related to cash borrowed under lending arrangements used in the process of managing customer cash supply chains, which is currently classified as restricted cash and not available for general corporate purposes. b) Title to cash received and processed in certain of our secure Cash Management Services operations transfers to us for a short period of time. The cash is generally credited to customers’ accounts the following day and we do not consider it as available for general corporate purposes in the management of our liquidity and capital resources and in our computation of Net Debt. Net Debt is a supplemental non-GAAP financial measure that is not required by, or presented in accordance with GAAP. We use Net Debt as a measure of our financial leverage. We believe that investors also may find Net Debt to be helpful in evaluating our financial leverage. Net Debt should not be considered as an alternative to Debt determined in accordance with GAAP and should be reviewed in conjunction with our condensed consolidated balance sheets. Set forth above is a reconciliation of Net Debt, a non-GAAP financial measure, to Debt, which is the most directly comparable financial measure calculated and reported in accordance with GAAP, as of December 31, 2015.. 17
