Attached files
| file | filename |
|---|---|
| EX-32.1 - EX-32.1 - NEXTGEN HEALTHCARE, INC. | qsii-ex321_9.htm |
| EX-31.2 - EX-31.2 - NEXTGEN HEALTHCARE, INC. | qsii-ex312_8.htm |
| EX-31.1 - EX-31.1 - NEXTGEN HEALTHCARE, INC. | qsii-ex311_11.htm |
| EX-23.1 - EX-23.1 - NEXTGEN HEALTHCARE, INC. | qsii-ex231_10.htm |
| EX-21 - EX-21 - NEXTGEN HEALTHCARE, INC. | qsii-ex21_125.htm |
UNITED STATES
SECURITIES AND EXCHANGE COMMISSION
Washington, D.C. 20549
FORM 10-K
☑ANNUAL REPORT PURSUANT TO SECTION 13 OR 15(d) OF THE SECURITIES EXCHANGE ACT OF 1934
For the fiscal year ended March 31, 2018
or
☐TRANSITION REPORT PURSUANT TO SECTION 13 OR 15(d) OF THE SECURITIES EXCHANGE ACT OF 1934
Commission file number: 001-12537
QUALITY SYSTEMS, INC.
(Exact name of registrant as specified in its charter)
|
California (State or other jurisdiction of incorporation or organization) |
95-2888568 (IRS Employer Identification No.) |
|
18111 Von Karman Avenue, Suite 800, Irvine, California (Address of principal executive offices) |
92612 (Zip Code) |
(949) 255-2600
(Registrant’s telephone number, including area code)
Securities registered pursuant to Section 12(b) of the Act:
|
Title of each class |
Name of each exchange on which registered |
|
Common Stock, $0.01 Par Value |
NASDAQ Global Select Market |
Securities registered pursuant to Section 12(g) of the Act: None
Indicate by check mark if the registrant is a well-known seasoned issuer, as defined in Rule 405 of the Securities Act. Yes ☑ No ☐
Indicate by check mark if the registrant is not required to file reports pursuant to Section 13 or Section 15(d) of the Act. Yes ☐ No ☑
Indicate by check mark whether the registrant (1) has filed all reports required to be filed by Section 13 or 15(d) of the Securities Exchange Act of 1934 during the preceding 12 months (or for such shorter period that the registrant was required to file such reports), and (2) has been subject to such filing requirements for the past 90 days. Yes ☑ No ☐
Indicate by check mark whether the registrant has submitted electronically and posted on its corporate Web site, if any, every Interactive Data File required to be submitted and posted pursuant to Rule 405 of Regulation S-T (§ 232.405 of this chapter) during the preceding 12 months (or for such shorter period that the registrant was required to submit and post such files). Yes ☑ No ☐
Indicate by check mark if disclosure of delinquent filers pursuant to Item 405 of Regulation S-K (§ 229.405 of this chapter) is not contained herein, and will not be contained, to the best of registrant’s knowledge, in definitive proxy or information statements incorporated by reference in Part III of this Form 10-K or any amendment to this Form 10-K. ☑
Indicate by check mark whether the registrant is a large accelerated filer, an accelerated filer, a non-accelerated filer, smaller reporting company, or an emerging growth company. See the definitions of “large accelerated filer,” “accelerated filer,” and “smaller reporting company,” and "emerging growth company" in Rule 12b-2 of the Exchange Act.
|
Large accelerated filer ☑ |
|
Accelerated filer ☐ |
|
Non-accelerated filer ☐ (Do not check if a smaller reporting company) |
|
Smaller reporting company ☐ |
|
Emerging growth company ☐ |
If an emerging growth company, indicate by check mark if the registrant has elected not to use the extended transition period for complying with any new or revised financial accounting standards provided pursuant to Section 13(a) of the Exchange Act. ☐
Indicate by check mark whether the registrant is a shell company (as defined in Rule 12b-2 of the Act). Yes ☐ No ☑
The aggregate market value of the voting stock held by non-affiliates of the Registrant as of September 30, 2017: 828,669,000 (based on the closing sales price of the Registrant’s common stock as reported on the NASDAQ Global Select Market on that date of 15.73 per share).*
The Registrant has no non-voting common equity.
The number of outstanding shares of the Registrant’s common stock as of May 22, 2018 was 63,850,007 shares.
* For purposes of this Annual Report on Form 10-K, in addition to those shareholders which fall within the definition of “affiliates” under Rule 405 of the Securities Act of 1933, as amended, holders of ten percent or more of the Registrant’s common stock are deemed to be affiliates for purposes of this Report.
DOCUMENTS INCORPORATED BY REFERENCE
Portions of the registrant's definitive proxy statement related to the 2018 Annual Shareholders' Meeting to be filed with the Securities and Exchange Commission within 120 days of the registrant’s fiscal year ended March 31, 2018 are incorporated herein by reference in Part III of this Annual Report on Form 10-K where indicated.
2018 ANNUAL REPORT ON FORM 10-K
|
Item |
|
|
|
Page |
|
|
|
|
|
|
|
|
||||
|
|
|
|
|
|
|
Item 1. |
|
|
4 |
|
|
Item 1A. |
|
|
10 |
|
|
Item 1B. |
|
|
26 |
|
|
Item 2. |
|
|
26 |
|
|
Item 3. |
|
|
26 |
|
|
Item 4. |
|
|
26 |
|
|
|
|
|
|
|
|
|
|
|
|
|
|
Item 5. |
|
|
27 |
|
|
Item 6. |
|
|
29 |
|
|
Item 7. |
|
Management’s Discussion and Analysis of Financial Condition and Results of Operations |
|
30 |
|
Item 7A. |
|
|
45 |
|
|
Item 8. |
|
|
45 |
|
|
Item 9. |
|
Changes in and Disagreements with Accountants on Accounting and Financial Disclosure |
|
45 |
|
Item 9A. |
|
|
45 |
|
|
Item 9B. |
|
|
46 |
|
|
|
|
|
|
|
|
|
|
|
|
|
|
Item 10. |
|
|
47 |
|
|
Item 11. |
|
|
47 |
|
|
Item 12. |
|
Security Ownership of Certain Beneficial Owners and Management and Related Stockholder Matters |
|
47 |
|
Item 13. |
|
Certain Relationships and Related Transactions, and Director Independence |
|
47 |
|
Item 14. |
|
|
47 |
|
|
|
|
|
|
|
|
|
|
|
|
|
|
Item 15. |
|
|
48 |
|
|
Item 16. |
|
|
48 |
|
|
|
|
|
52 |
|
This Annual Report on Form 10-K (this "Report") and certain information incorporated herein by reference contain forward-looking statements within the “safe harbor” provisions of the Private Securities Litigation Reform Act of 1995. All statements included or incorporated by reference in this Report, other than statements that are purely historical, are forward-looking statements. Words such as “anticipate,” “expect,” “intend,” “plan,” “believe,” “seek,” “estimate,” “will,” “should,” “would,” “could,” “may,” and similar expressions also identify forward-looking statements. These forward-looking statements include, without limitation, discussions of our product development plans, business strategies, future operations, financial condition and prospects, developments in and the impacts of government regulation and legislation and market factors influencing our results. Our expectations, beliefs, objectives, intentions and strategies regarding our future results are not guarantees of future performance and are subject to risks and uncertainties, both foreseen and unforeseen, that could cause actual results to differ materially from results contemplated in our forward-looking statements. These risks and uncertainties include, but are not limited to, our ability to continue to develop new products and increase systems sales in markets characterized by rapid technological evolution, consolidation, and competition from larger, better-capitalized competitors. Many other economic, competitive, governmental and technological factors could affect our ability to achieve our goals, and interested persons are urged to review the risks factors discussed in “Item 1A. Risk Factors” of this Report, as well as in our other public disclosures and filings with the Securities and Exchange Commission (“SEC”). Because of these risk factors, as well as other variables affecting our financial condition and results of operations, past financial performance may not be a reliable indicator of future performance and historical trends should not be used to anticipate results or trends in future periods. We assume no obligation to update any forward-looking statements. You are cautioned not to place undue reliance on forward-looking statements, which speak only as of the date of the filing of this Report. Each of the terms “NextGen Healthcare,” “NextGen,” “we,” “us,” “our,” or the “Company” as used throughout this Report refers collectively to Quality Systems, Inc. and its wholly-owned subsidiaries, unless otherwise indicated.
3
Company Overview
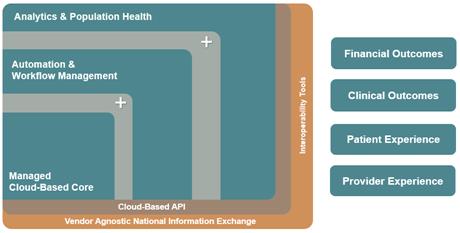
Quality Systems, Inc., known to our clients as NextGen Healthcare, provides solutions on an integrated platform that enables our clients to target superior clinical and financial outcomes concurrent with improved physician and patient engagement.
Our clients span the ambulatory care market from large multi-specialty to small single specialty practices and include networks of practices such as physician hospital organizations (“PHOs”), management service organizations (“MSOs”), independent physician associations (“IPAs”), accountable care organizations (“ACOs”), ambulatory care centers (“ACCs”), and community health centers (“CHCs”).
|
|
|
Our solutions start with a clinical and financial core that can be deployed effectively on premise and in the cloud. We optimize the core with an automation and workflow layer that gives our clients control over how platform capabilities are implemented to drive their desired outcomes. Our recently acquired cloud-based analytics and population health assets have been integrated into our core platform to allow our clients to improve results in both fee for service and fee for value environments. Finally, in support of extensibility, we surround the core with open web-based APIs and drive the secure exchange of health and patient data with connected health solutions |
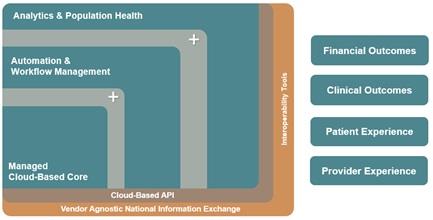
At the core of NextGen Healthcare’s offerings are industry leading electronic health record (“EHR”) and practice management (“PM”) solutions that support the foundational clinical and financial activities of any ambulatory practice. We strive to enable our clients’ ability to maintain control of their organizational identity and destiny, rather than dictating a technology-driven road map. To meet our clients’ unique, evolving needs, NextGen Healthcare continues to expand and enrich our core offerings to create a comprehensive platform essential to our clients’ success in the new value-based environment. Our platform includes one of the industry’s most recognized suites of vendor-agnostic cloud-based interoperability tools as well as our recently acquired, cloud-based Population Health Management and Analytics platform which allows our clients to cost effectively manage populations of patients – improving outcomes and enhancing the quality of care rendered. Our mobile solution significantly enhances, automates and streamlines physician workflows reducing physician burnout and resulting physician attrition.
NextGen Healthcare has a history of enhancing our solutions through organic and inorganic activities. Over the last few years, we have entered into strategic transactions to complement and enhance our ambulatory market product portfolio. In October 2015, we divested our former Hospital Solutions division to focus exclusively on the ambulatory marketplace. In January 2016, we acquired HealthFusion Holdings, Inc. ("HealthFusion"), and its cloud-based EHR/PM. In April 2017, we acquired Entrada, Inc. ("Entrada"), a cloud-based, mobile platform for clinical documentation and collaboration. In August 2017, we acquired EagleDream Health, Inc. (“EagleDream”) and its cloud-based population health analytics, and in January 2018, we acquired Inforth Technologies (“Inforth”) for its specialty-focused clinical content.
Quality Systems, Inc. was incorporated in California in 1974. Our principal offices are located at 18111 Von Karman Ave., Suite 800, Irvine, California, 92612. Our website is located at www.nextgen.com. We operate on a fiscal year ending on March 31.
Industry Background and Market Opportunity
Significant challenges and thus opportunities exist today in the ambulatory healthcare market due to changes in regulations and requirements that have occurred over the past several years. We have seen the Health Information Technology for Economic and Clinical Health portion of the American Recovery and Reinvestment Act of 2009 ("HITECH Act") drive the adoption of EHRs, the Patient Protection and Affordable Care Act of 2010 (“ACA”) drive fundamental changes to the health insurance industry, and most recently, the Medicare Access and CHIP Reauthorization Act of 2015 (“MACRA”) driving value-based payment reform. We believe MACRA may be the most important of the three regulations for our market because it permanently changes how ambulatory healthcare providers are reimbursed by Medicare. It offers certainty and a timeline for the market’s move away from volume-based, fee-for-service models to value-based payment models that reward the delivery of lower cost, high quality care.
Healthcare information technology (“HCIT”) solutions, based on technology and services, have become the catalyst for propelling healthcare into this outcomes-based era and many of our clients are paving the way. As part of the healthcare
4
transformation that is taking place, providers will be held accountable for proactively managing the health of entire patient populations and delivering higher quality care at lower costs. As such, healthcare organizations are likely to invest in integrated healthcare technology and technology-enabled services that will help identify patient risk, engage patients, coordinate care, and determine when intervention is needed to improve clinical and financial outcomes. We are well positioned to provide healthcare professionals an integrated experience through our platform and solutions which we believe they need to enable them to achieve these goals. Additionally, we believe there will be an increasing demand for revenue cycle management services that are aligned and integrated with clinical technology solutions. Through our NextGen Connected Health Solutions, we provide our clients with the ability to securely share data and/or interoperate, which is essential to transforming the healthcare delivery system into one that provides better care, smarter spending, and healthier people.
As healthcare continues to evolve, our focus is to help our clients adapt and thrive, by delivering the best clinical and financial outcomes possible. As a result, many of our clients are successfully participating in many advanced practice models leading and driving healthcare transformation.
Our Strategy
As many of the challenges of healthcare are uniquely local or regional, we believe that every client has the need and right to create its unique formula for success. Our strategy and platforms are singularly well suited to support our clients’ chosen approach.
Our strategy is to move beyond the traditional vendor-client relationship pervasive in the industry today by becoming a client’s trusted partner. We earn this status by offering solutions to our clients that allow them to thrive and grow by enabling them to control their outcomes and guide them in execution of their strategies. Much of the organizational changes we implemented over the last two years were aimed at creating client relationships that enable us to better understand each client’s unique needs. Our subject matter experts’ high touch coverage model supports very frequent client contact which allows them to become an extension of the client’s own staff.
Consequently, our strategic priorities are:
|
|
• |
Focused on ambulatory care delivery – In October 2015, we sold our former Hospital Solutions division to focus on our core ambulatory clients. We believe it is essential to protect, build and sell new capabilities within our ambulatory client segment. We are focused on our core by increasing the overall quality and serviceability of our integrated solutions. |
|
|
• |
Enable our clients to control HOW they deliver clinical and financial outcomes. |
|
|
• |
Keep the physician and the patient experience top of mind in everything we do. |
|
|
• |
Support pervasive interoperability (Connect to everyone…no matter what). |
|
|
• |
Deliver actionable insights that deliver value regardless of where a group is on its journey to value-based care and where the data came from. We are migrating into applications, analytics and services that will enable our clients to proactively manage the health of patient populations. We are establishing strong development partnerships with our most innovative clients who are actively participating in shared-risk contracts, and working together with them to create progressive population health capabilities. We support extraordinary information sharing capabilities vital to managing patient populations through our interoperability offerings. |
5
Products and Services
The Core
NextGen® Enterprise EHR. Our electronic health records solution stores and maintains clinical patient information and offers a workflow module, prescription management, automatic document and letter generation, patient education, referral tracking, interfaces to billing and lab systems, physician alerts and reminders, and reporting and data analysis tools. Its configurable clinical content supports all of the required critical quality measures (“CQMs”) in Quality Reporting Document Architecture (“QRDA”) format.
NextGen® Enterprise PM. Our practice management offering is a seamlessly integrated, scalable, multi-module solution that includes a master patient index, enterprise-wide appointment scheduling with referral tracking, and clinical support. NextGen Enterprise PM is a highly configurable, cost-effective, and proven solution that enables the management of both single and multi-practice settings. It is designed to drive efficiency, increase revenue, and speed cash flow through greater practice control. It has achieved full accreditation with the Practice Management Systems Accreditation Program (“PMSAP”) from the Electronic Healthcare Network Accreditation Commission (“EHNAC”).
NextGen® Office (formerly known as Meditouch®). A cloud-based EHR and PM solution for physicians and medical billing services. The product line expands our offering to the ambulatory client base by enabling our cloud-based technology platform to meet the specific needs of smaller and growing practices.
Automation and Workflow
NextGen® Mobile Health Solutions (formerly known as Entrada®). NextGen Mobile Health Solutions, anchored by the Entrada platform, enables physicians and other caregivers to quickly and easily create relevant documentation within the EHR without sacrificing productivity. A true EHR mobile experience, the platform provides a fast, easy way for caregivers to view and share real-time clinical content and complete key tasks directly from their mobile device. Included in the NextGen Mobile Health Solutions are NextGen® Remote Scribe Services which offers full EHR template support via remote assistance and NextGen® Mobile Dictation which offers both front-end speech and back-end transcription within a single mobile workflow.
NextGen® Electronic Healthcare Transactions. NextGen Electronic Healthcare Transactions automate the exchange of electronic data between providers, payers and patients. Standardized electronic communication replaces expensive, manual processing of complex healthcare transactions with highly automated processes that significantly improve the fidelity of the data and analytics used to manage financial outcomes. Included in this offering are insurance eligibility, authorizations, electronic claims, remittance, patient appointment reminders, and electronic statements.
NextGen® Pre-Service Clearance. NextGen Pre-Service Clearance solutions provide access to real-time patient data and payers’ payment systems to provide a client’s front-desk staff the ability to accurately resolve patient collections at or before the point of service. With NextGen Pre-Service Clearance, clients have patient estimates, address verification, benefits and the ability to submit prior authorizations in real time to payers.
NextGen® Patient Payment. NextGen Patient Payment solutions provide the power of a comprehensive, integrated payment processing service program at a client’s fingertips to collect payments faster and easier. It allows patients one integrated solution that delivers an integrated point of sale, credit card on file, automated payment collection, online and mobile compatible, automated phone pay, and kiosk payments
6
Analytics, Population Health, and Patient Engagement
NextGen® Population Health Informed Analytics. NextGen Population Health Informed Analytics deliver robust capabilities for core population health insights using integrated clinical and claims data to support both broad and deep analysis for populations of interest (attribute visualization, risk stratification, etc.). Functionality includes the ability to manage patient cohorts with pre-built condition registries, reporting on targeted metrics, and identification and alerting of gaps in care. The system also provides a geospatial view of patient populations, integrating social determinates of health into the analysis. NextGen Population Health Informed Analytics offers clients a market leading dynamic user interface that integrates with their preferred workflow.
NextGen® Population Health Patient Care Coordination. The NextGen Population Health Patient Care Coordination module allows provider groups to manage patients across a continuum of care. This solution enables scalable management of care and payment reform initiatives driven by collaborative care and workflow automation. Dedicated practitioners can prioritize this solution for pre-visit planning, predictive risk analysis, to stratify risk and prioritize resources, and to manage transitions of care. A unique feature of our offering includes analytics driven patient outreach facilitating care coordinators’ ability to automate communications with patients based on quality initiatives and value-based contract commitments.
NextGen® Population Health Performance Management. NextGen Population Health Performance Management offers clients rich financial analytics capabilities incorporating clinical and claims data. The functionality of this module supports proactive value-based contract management including network management (leakage/keepage), network design (geospatial view of network), clinical variation analysis, and a wide range of resource utilization metrics. These tools provide insights over time, at the practice and individual provider levels, with trending capabilities that support optimized performance and reporting.
NextGen® Patient Portal. NextGen Patient Portal drives patient engagement and satisfaction with easy, intuitive, 24/7 access to payments, scheduling, personal health information, and communication. It facilitates and simplifies comprehensive information exchange, offering anytime, anywhere access from PCs, tablets, and smart phones.
Interoperability
NextGen® Connected Health Solutions. NextGen Connected Health Solutions enable patient data from disparate systems to be easily and securely shared, aggregated, and put to work, regardless of EHR, PM, or other HCIT platform or location. With these solutions, providers have simple access to aggregated, actionable data to better treat patients using a complete longitudinal medical record, manage transitions of care, coordinate care plans, and manage chronic conditions. These solutions power the automated data exchange for some of the largest state and regional health information exchanges, ACOs, and health systems. NextGen Connected Health Solutions support a wide-range of industry standard exchange mechanisms including Fast Healthcare Interoperability Resources (“FHIR”) and Integrating the Healthcare Enterprise (“IHE”) profiles. The interoperability product offerings within the NextGen Connected Health Solutions suite include NextGen Connect Integration Engine, NextGen Results CDR, NextGen Clinical Message Manager, NextGen Enterprise API, and NextGen® Share.
NextGen Share. The NextGen Share interoperability platform enables a wide variety of plug-and-play interoperability solutions which help NextGen Enterprise EHR users safely and securely exchange clinical content with external providers and organizations. The platform includes support for secure direct messaging with more than 1.2 million providers and organizations, care quality integration to enable automated data exchange on behalf of nearly 240 million patients, and clinical data exchange interfaces with payers. These automated solutions enable the delivery of external documents and notifications into the clinical workflow, allowing providers to focus on patient care. NextGen Share connectivity is delivered as a core part of the NextGen Enterprise EHR solution with many interfaces automatically activated to save client time and effort to fulfill data exchange requirements.
Managed Services
NextGen® Managed Cloud Services. These new, scalable, cloud hosting services reduce the burden of information technology ("IT"). They speed implementations, simplify upgrades, cut technology costs significantly, offer the latest technology, and provide 24/7 monitoring and support by an expanded team of technical experts. Clients can benefit from cloud access to a secure, hosted IT infrastructure, and regardless of size, can scale and enjoy the advantages of a cloud-based environment for their EHR and PM systems, enabling them to focus more on care and the practice, not on IT.
NextGen® Financial Suite (formerly known as NextGen® RCMS). Our NextGen Financial Suite partners with private ambulatory and hospital-based physicians and groups to implement the NextGen® product suite using best practices and enables clients to tailor scalable RCM services that help them streamline workflow, identify and fix revenue leaks, increase cash flow, and optimize revenue. NextGen Financial Suite includes billing and collections, electronic claims submission and denials management, electronic remittance and payment posting and accounts receivable follow-up. Our dedicated account management model helps make NextGen Healthcare a top performing provider of RCMS as reported in the KLAS Ambulatory RCM Services Report, most recently released in 2016.
7
NextGen® Contract Audit & Recovery Service. This specialized service designed specifically for ambulatory-based practices and offered in coordination with a proven industry expert, changes the way providers and practices think about monitoring payer reimbursement. Unlike other payment review software tools that require clients to load their own contracts and fee schedules, perform analysis reports, and appeal findings with payers themselves. NextGen Healthcare provides a turn-key service solution that frees up valuable provider and staff time while maximizing recovery opportunity through years of experience and thousands of recovery efforts.
Professional Services. We offer a variety of professional services to our clients. Such services include training, project management, functional and detailed specification preparation, configuration, testing, and installation services. We generally charge for professional services on a time and materials basis, but we also charge on a fixed fee basis for projects with milestone payments utilizing mutually agreed upon functional and detailed specifications. We offer “E-learning” through the NextGen™ Learning Center, an online learning subscription service, which allows end-users to self-manage their learning. Our consulting services, which include physician, professional, and technical consulting, assist clients with optimizing their staffing and software solutions, enhancing financial and clinical outcomes, achieving regulatory requirements in the drive to value-based care, and meeting the evolving requirements of healthcare reform.
Client Service and Support. Our technical services staff provides support for the dependable and timely resolution of technical inquiries from clients. Such inquiries are made via telephone, email and the internet. We offer several levels of support, with the most comprehensive service covering 24 hours a day, seven days a week. The charge for support and maintenance varies, depending upon the related level of service and other factors, including the related software license fee. By remaining current on support and maintenance fees, clients also receive access to future unspecified versions of the software, on a when-available basis, as part of support services. To further improve and simplify our client’s service and support experience, we recently implemented an Online Client Success Community that allows clients to access support, technical articles and documentation, and interact with peers one-on-one, all in one portal.
Proprietary Rights
We rely on a combination of patents, copyrights, trademarks, service marks, trade secret laws and contractual restrictions to establish and protect proprietary rights in our products and services. To protect our proprietary rights, we enter into confidentiality agreements and invention assignment agreements with our employees with whom such controls are relevant. In addition, we include intellectual property protective provisions in our client contracts. However, because the software industry is characterized by rapid technological change, we believe such factors as the technological and creative skills of our personnel, new product developments, frequent product enhancements, name recognition, and reliable product maintenance are more important to establishing and maintaining a technology leadership position than the various legal protections of our technology.
We rely on software that we license from third parties for certain components of our products and services. These components enhance our products and services and help meet evolving client needs. The failure to license any necessary technology, or to maintain our existing licenses, could result in reduced functionality of or reduced demand for our products.
Although we believe our products and services, and other proprietary rights, do not infringe upon the proprietary rights of third parties, third parties may assert intellectual property infringement claims against us in the future. Any such claims may result in costly, time-consuming litigation and may require us to enter into royalty or cross-license arrangements.
Competition
The markets for healthcare information systems and services are intensely competitive and highly fragmented. Our traditional “full-suite” competitors in the healthcare information systems and services market include: Allscripts Healthcare Solutions, Inc., athenahealth, Inc., Cerner Corporation, eClinicalWorks, Epic Systems Corporation, GE Healthcare, Greenway Health, LLC, and Modernizing Medicine. Additionally, we face competition from “services-only” competitors like business process outsourcers, hosting providers and transcription companies.
The EHR, PM, interoperability, and connectivity markets, in particular, are subject to rapid changes in technology, and we expect that competition in these market segments could increase as new competitors enter the market. We believe our principal competitive advantages are depth and breadth of capabilities and configurability.
Research and Development
The healthcare information management and computer software and hardware industries are characterized by rapid technological change requiring us to engage in continuing investments to update, enhance and improve our systems. During the years ended March 31, 2018, 2017 and 2016, our gross research and development expenditures were $100.1 million $86.6 million, and $80.3 million, respectively, which included capitalized software costs of $18.9 million, $8.2 million, and $14.7 million, respectively. The majority of such expenditures are currently targeted on our software license and software related subscription services products lines.
8
We sell and market our products primarily through a direct sales force and to a lesser extent, through a reseller channel. Software license sales to resellers represented less than 10% of total revenue for each of the years ended March 31, 2018, 2017 and 2016.
Our direct sales force is comprised of subject matter experts by solution, as well as engaged account managers, all of whom deliver presentations to potential clients by demonstrating our systems and capabilities on the prospective client’s premises. System demonstrations for mobile workflow and analytics solutions is more web-based as these offerings tend to be targeted to larger practices. Sales efforts aimed at smaller practices can be performed on the prospective clients’ premises, or remotely via telephone or web-based presentations. Both the direct and reseller channel sales force concentrate on multi-product sales opportunities.
Our sales and marketing employees identify prospective clients through a variety of means, including: referrals from existing clients, industry consultants, and contacts at professional society meetings and trade shows; web-based seminars; trade journal advertising; online advertising; public relations and social media campaigns; direct mail and email campaigns; and telemarketing. Resources have shifted more heavily to web-based marketing as we meet potential clients where they are and how they shop for services. Additionally, we focus on thought leadership and content marketing to highlight our industry knowledge, expertise and the successes of our diverse client base.
Our sales cycle can vary significantly and typically ranges from six to twenty-four months from initial contact to contract execution. Software licenses are normally delivered to a client almost immediately upon receipt of an order and we normally receive up-front licensing fees. Implementation and training services are normally rendered based on a mutually agreed upon timetable. Clients have the option to purchase hosting and maintenance services which, if purchased, are invoiced on a monthly, quarterly or annual basis. Subscriptions generally involve implementation and are billed monthly after implementation, or based on volume or throughput.
We continue to concentrate our direct sales and marketing efforts on the ambulatory market from large multi-specialty organizations to small-single specialty practices and include clinically integrated networks of practices such as PHOs, MSOs, ACOs, ACCs, and CHCs. IPAs, PHOs and similar networks to which we have sold systems provide use of our software to those group and single physician practices associated with the organization or hospital on either a service basis or by directing us to contract with those practices for the sale of stand-alone systems.
We have numerous clients and do not believe that the loss of any single client would adversely affect us. No client accounted for 10% or more of our net revenue during each of the years ended March 31, 2018, 2017 and 2016. Substantially all of our clients are located in the United States.
Employees
As of March 31, 2018, we had approximately 2,830 full-time employees, of which 491 were based in Bangalore, India and substantially all other employees were based in the United States. We believe that our future success depends in part upon recruiting and retaining qualified sales, marketing and technical talent as well as other employees. None of our employees are covered by a collective bargaining agreement or are represented by a labor union.
Available Information
Our principal website is www.nextgen.com. We make our periodic and current reports, together with amendments to these reports, filed or furnished pursuant to Section 13(a) or 15(d) of the Securities Exchange Act of 1934, as amended, available on our website, free of charge, as soon as reasonably practicable after such material is electronically filed with, or furnished to, the SEC. You may access such filings under the “QSI Investors” button on our website. Members of the public may also read and copy any materials we file with, or furnish to, the SEC at the SEC’s Public Reference Room at 100 F Street, NE, Washington, DC 20549. To obtain information on the operation of the Public Reference Room, please call the SEC at 1-800-SEC-0330. The SEC maintains an internet site at www.sec.gov that contains the reports, proxy statements and other information that we file electronically with the SEC. Our website and the information contained therein or connected thereto is not intended to be incorporated into this Report or any other report or information we file with the SEC.
9
You should carefully consider the risks described below, as well as the other cautionary statements and risks described elsewhere and the other information contained in this Report and in our other filings with the SEC, including subsequent Quarterly Reports on Form 10-Q and Current Reports on Form 8-K. We operate in a rapidly changing environment that involves a number of risks. The risks and uncertainties described below are not the only ones we face. Additional risks and uncertainties not presently known to us or that we currently deem immaterial may also affect our business operations. If any of these known or unknown risks actually occur, our business, financial condition or results of operations could be materially and adversely affected, in which case the trading price of our common stock may decline and you may lose all or part of your investment.
Risks Related to Our Business
We face significant, evolving competition which, if we fail to properly address, could adversely affect our business, results of operations, financial condition and price of our stock. The markets for healthcare information systems are intensely competitive, and we face significant competition from a number of different sources. Several of our competitors have substantially greater name recognition and financial, technical, product development and marketing resources than we do. There has been significant merger and acquisition activity among a number of our competitors in recent years. Some of our larger competitors, who have greater scale than we do, have and may continue to become more active in our markets both through internal development and acquisitions. Transaction induced pressures, or other related factors may result in price erosion or other negative market dynamics that could adversely affect our business, results of operations, financial condition and price of our stock.
We compete in all of our markets with other major healthcare related companies, information management companies, systems integrators and other software developers. Competition in our markets occurs on the basis of several factors, including price, innovation, client service, product quality and reliability, scope of services, industry acceptance, and others. Competitive pressures and other factors, such as new product introductions by us or our competitors, may result in price or market share erosion that could adversely affect our business, results of operations and financial condition. Also, there can be no assurance that our applications will achieve broad market acceptance or will successfully compete with other available software products. If we fail to distinguish our offerings from other options available to healthcare providers, the demand for and market share of our offerings may decrease.
Saturation or consolidation in the healthcare industry could result in the loss of existing clients, a reduction in our potential client base and downward pressure on the prices for our products and services. As the healthcare information systems market evolves, saturation of this market with our products or our competitors' products could limit our revenues and opportunities for growth. There has also been increasing consolidation amongst healthcare industry participants in recent years, creating integrated healthcare delivery systems with greater market power. As provider networks and managed care organizations consolidate, the number of market participants decreases and competition to provide products and services like ours will become more intense. The importance of establishing relationships with key industry participants will become greater and our inability to make initial sales of our systems to, or maintain relationships with, newly formed groups and/or healthcare providers that are replacing or substantially modifying their healthcare information systems could adversely affect our business, results of operations and financial condition. These consolidated industry participants may also try to use their increased market power to negotiate price reductions for our products and services. If we were forced to reduce our prices, our business would become less profitable unless we were able to achieve corresponding reductions in our expenses.
Many of our competitors have greater resources than we do. In order to compete successfully, we must keep pace with our competitors in anticipating and responding to the rapid changes involving the industry in which we operate, or our business, results of operations and financial condition may be adversely affected. The software market generally is characterized by rapid technological change, changing client needs, frequent new product introductions and evolving industry standards. The introduction of products incorporating new technologies and the emergence of new industry standards could render our existing products obsolete and unmarketable. There can be no assurance that we will be successful in developing and marketing new products that respond to technological changes or evolving industry standards. New product development depends upon significant research and development expenditures which depend ultimately upon sales growth. Any material shortfall in revenue or research funding could impair our ability to respond to technological advances or opportunities in the marketplace and to remain competitive. If we are unable, for technological or other reasons, to develop and introduce new products in a timely manner in response to changing market conditions or client requirements, our business, results of operations and financial condition may be adversely affected.
In response to increasing market demand, we are currently developing new generations of targeted software products. There can be no assurance that we will successfully develop these new software products or that these products will operate successfully, or that any such development, even if successful, will be completed concurrently with or prior to introduction of competing products. Any such failure or delay could adversely affect our competitive position or could make our current products obsolete.
10
Uncertainty in global economic and political conditions may negatively impact our business, operating results or financial condition. Global economic and political uncertainty have caused in the past, and may cause in the future, unfavorable business conditions such as a general tightening in the credit markets, lower levels of liquidity, increases in the rates of default and bankruptcy and extreme volatility in credit, equity and fixed income markets. These macroeconomic conditions could negatively affect our business, operating results or financial condition in a number of ways. Instability can make it difficult for our clients, our vendors, and us to accurately forecast and plan future business activities, and could cause constrained spending on our products and services, delays and a lengthening of our sales cycles and/or difficulty in collection of our accounts receivable. Current or potential clients may be unable to fund software purchases, which could cause them to delay, decrease or cancel purchases of our products and services or to not pay us or to delay paying us for previously purchased products and services. Our clients may cease business operations or conduct business on a greatly reduced basis. Bankruptcies or similar insolvency events affecting our clients may cause us to incur bad debt expense at levels higher than historically anticipated. Further, economic instability could limit our ability to access the capital markets at a time when we would like, or need, to raise capital, which could have an impact on our ability to react to changing business conditions or new opportunities. Finally, our investment portfolio is generally subject to general credit, liquidity, counterparty, market and interest rate risks that may be exacerbated by these global financial conditions. If the banking system or the fixed income, credit or equity markets deteriorate or remain volatile, our investment portfolio may be impacted and the values and liquidity of our investments could be adversely affected as well.
Our relationships with strategic partners may fail to benefit us as expected. We face risk and/or the possibility of claims from activities related to strategic partners, which could be expensive and time-consuming, divert personnel and other resources from our business and result in adverse publicity that could harm our business. We rely on third parties to provide services for our business. For example, we use national clearinghouses in the processing of some insurance claims and we outsource some of our hardware services and the printing and delivery of patient statements for our clients. These third parties could raise their prices and/or be acquired by our competitors, which could potentially create short and long-term disruptions to our business, negatively impacting our revenue, profit and/or stock price. We also have relationships with certain third parties where these third parties serve as sales channels through which we generate a portion of our revenue. Due to these third-party relationships, we could be subject to claims as a result of the activities, products, or services of these third party service providers even though we were not directly involved in the circumstances leading to those claims. Even if these claims do not result in liability to us, defending and investigating these claims could be expensive and time-consuming, divert personnel and other resources from our business and result in adverse publicity that could harm our business. In addition, our strategic partners may compete with us in some or all of the markets in which we operate.
We have acquired companies, and may engage in future acquisitions, which may be expensive, time consuming, subject to inherent risks and from which we may not realize anticipated benefits. Historically, we have acquired numerous businesses, technologies, and products. We may acquire additional businesses, technologies and products if we determine that these additional businesses, technologies and products are likely to serve our strategic goals. Acquisitions have inherent risks, which may have a material adverse effect on our business, financial condition, operating results or prospects, including, but not limited to the following:
|
|
• |
failure to achieve projected synergies and performance targets; |
|
|
• |
potentially dilutive issuances of our securities, the incurrence of debt and contingent liabilities and amortization expenses related to intangible assets with indefinite useful lives, which could adversely affect our results of operations and financial condition; |
|
|
• |
using cash as acquisition currency may adversely affect interest or investment income, which may in turn adversely affect our earnings and /or earnings per share; |
|
|
• |
unanticipated expenses or difficulty in fully or effectively integrating or retaining the acquired technologies, software products, services, business practices, management teams or personnel, which would prevent us from realizing the intended benefits of the acquisition; |
|
|
• |
failure to maintain uniform standard controls, policies and procedures across acquired businesses; |
|
|
• |
difficulty in predicting and responding to issues related to product transition such as development, distribution and client support; |
|
|
• |
the possible adverse effect of such acquisitions on existing relationships with third party partners and suppliers of technologies and services; |
|
|
• |
the possibility that staff or clients of the acquired company might not accept new ownership and may transition to different technologies or attempt to renegotiate contract terms or relationships, including maintenance or support agreements; |
|
|
• |
the assumption of known and unknown liabilities; |
|
|
• |
the possibility of disputes over post-closing purchase price adjustments such as performance-based earnouts; |
11
|
|
• |
difficulty in entering geographic and/or business markets in which we have no or limited prior experience; |
|
|
• |
difficulty in integrating acquired operations due to geographical distance and language and cultural differences; |
|
|
• |
diversion of management's attention from other business concerns; and |
|
|
• |
the possibility that acquired assets become impaired, or that acquired assets lead us to determine that existing assets become impaired, requiring us to take a charge to earnings which could be significant. |
A failure to successfully integrate acquired businesses or technology could, for any of these reasons, have an adverse effect on our financial condition and results of operations.
Our failure to manage growth could harm our business, results of operations and financial condition. We have in the past experienced periods of growth which have placed, and may continue to place, a significant strain on our non-cash resources. We have also expanded our overall software development, marketing, sales, client management and training capacity, and may do so in the future. In the event we are unable to identify, hire, train and retain qualified individuals in such capacities within a reasonable timeframe, such failure could have an adverse effect on the operation of our business. In addition, our ability to manage future increases, if any, in the scope of our operations or personnel will depend on significant expansion of our research and development, marketing and sales, management and administrative and financial capabilities. The failure of our management to effectively manage expansion in our business could have an adverse effect on our business, results of operations and financial condition.
We may experience reduced revenues and/or be forced to reduce our prices. We may be subject to pricing pressures with respect to our future sales arising from various sources, including amount other things, government action affecting reimbursement levels. Our clients and the other entities with which we have business relationships are affected by changes in statutes, regulations, and limitations on government spending for Medicare, Medicaid, and other programs. Recent government actions and future legislative and administrative changes could limit government spending for Medicare and Medicaid programs, limit payments to healthcare providers, increase emphasis on competition, impose price controls, initiate new and expanded value-based reimbursement programs and create other programs that potentially could have an adverse effect on our business. If we experience significant downward pricing pressure, our revenues may decline along with our ability to absorb overhead costs, which may leave our business less profitable.
Our operations are dependent upon attracting and retaining key personnel. If such personnel were to leave unexpectedly, we may not be able to execute our business plan. Our future performance depends in significant part upon the continued service of our key development and senior management personnel and successful recruitment of new talent. These personnel have specialized knowledge and skills with respect to our business and our industry. Because we have a relatively small number of employees when compared to other leading companies in our industry, our dependence on maintaining our relationships with key employees and successful recruiting is particularly significant.
The industry in which we operate is characterized by a high level of employee mobility and aggressive recruiting of skilled personnel. There can be no assurance that our current employees will continue to work for us. Loss of services of key employees could have an adverse effect on our business, results of operations and financial condition. Furthermore, we may need to grant additional equity incentives to key employees and provide other forms of incentive compensation to attract and retain such key personnel. Equity incentives may be dilutive to our per share financial performance. Failure to provide such types of incentive compensation could jeopardize our recruitment and retention capabilities.
The integration of new key executives into our management team may interfere with our operations. In the past several years, we have appointed several new key executives, including our Chief Executive Officer, Chief Financial Officer, Chief Technology Officer, Chief Strategy Officer, General Counsel and Chief Operating Officer, and we may hire additional key management team members. These executives are required to spend a significant amount of time on certain integration and transition efforts in addition to performing their regular duties and responsibilities. If we fail to complete these integrations and transitions in an efficient manner, or if we fail to provide sufficient incentives to motivate and retain our key executives, our business and prospects may suffer.
Our recent strategy shift and the resulting business reorganization plan we are implementing may be disruptive both internally and externally, and we may not fully realize the anticipated benefits. We recently embarked on a new strategic plan, which we call NextGen 2.0, geared toward realigning our business structure and strategy to rapidly emerging changes in the healthcare industry. As NextGen 2.0 continues, we anticipate that it will result in continued evaluation of our organizational structure in order to achieve greater efficiency, as well as investments in new market solutions and changes to our culture that we hope will drive revenue growth and provide increased value to stakeholders and shareholders. There can be no assurance that our current or future strategic realignment efforts will be successful. Our ability to achieve the anticipated benefits of our strategy shift is subject to estimates and assumptions, which may vary based on numerous factors and uncertainties, some of which are beyond our control. Reorganization programs entail a variety of known and unknown risks that may increase our costs or impair our ability to achieve operational efficiencies, such as distraction to management and employees, loss of
12
workforce capabilities, loss of continuity, accounting charges for technology-related write-offs and workforce reduction costs, decreases in employee focus and morale, uncertainty and turbulence among our clients and vendors, higher than anticipated separation expenses, litigation, and the failure to meet financial and operational targets. If we are unable to effectively implement our strategic shift and realign our business to address the rapidly evolving market, we and our shareholders may not realize the anticipated financial, operational, and other benefits from these initiatives.
If we are unable to manage our growth in the new markets we may enter, our business and financial results could suffer. Our future financial results will depend in part on our ability to profitably manage our business in new markets that we may enter. We are engaging in the strategic identification of, and competition for, growth and expansion opportunities in new markets or offerings, including but not limited to the areas of interoperability, patient engagements, data analytics and population health. With several of our recent acquisitions, we have expanded into the market for cloud-based EHR products. It remains uncertain whether the market for cloud-based products will expand to the levels of demand and market acceptance we anticipate, and there can be no assurance that we will be able to successfully scale the acquired companies’ products to meet our clients’ expectations. In addition, as clients move from fee-for-service to fee-for-value reimbursement strategies in conjunction with the adoption of population health business models, we may not make appropriate and timely changes to our service offerings consistent with shifts in market demands and expectations. In order to successfully execute on our growth initiatives, we will need to, among other things, manage changing business conditions, anticipate and react to changes in the regulatory environment, and develop expertise in areas outside of our business's traditional core competencies. Difficulties in managing future growth in new markets could have a significant negative impact on our business, financial condition and results of operations.
We may not be successful in developing or launching our new software products and services, which could have a negative impact on our financial condition and results of operations. We invest significant resources in the research and development of new and enhanced software products and services. Over the last few years we have incurred, and will continue to incur, significant internal research and development expenses, a portion of which have been and may continue to be recorded as capitalized software costs. We cannot provide assurances that we will be successful in our efforts to plan, develop or sell new software products that meet client expectations, which could result in an impairment of the value of the related capitalized software costs, an adverse effect on our financial condition and operating results and a negative impact the future of our business. Additionally, we cannot be assured that we will continue to capitalize software development costs to the same extent as we have done to date, as the result of changes in development methodologies and other factors. To the extent that we capitalize a lower percentage of total software development costs, our earnings could be reduced.
We have substantially development and other operations in India, and we use offshore third-party partners located in India that subject us to regulatory, economic, social and political uncertainties in India and to laws applicable to US companies operating overseas. We are subject to several risks associated with having a portion of our assets and operations located in India. Many US companies have benefited from many policies of the Government of India and the Indian state governments in the states in which we operate, which are designed to promote foreign investment generally and the business process services industry in particular, including significant tax incentives, relaxation of regulatory restrictions, liberalized import and export duties and preferential rules on foreign investment and repatriation. There is no assurance that such policies will continue. Various factors, such as changes in the current Government of India, could trigger significant changes in India’s economic liberalization and deregulation policies and disrupt business and economic conditions in India generally and our business in particular. In addition, our financial performance and the market price of our common stock may be adversely affected by general economic conditions and economic and fiscal policy in India, including changes in exchange rates and controls, interest rates and taxation policies, as well as social stability and political, economic or diplomatic developments affecting India in the future. In particular, India has experienced significant economic growth over the last several years, but faces major challenges in sustaining that growth in the years ahead. These challenges include the need for substantial infrastructure development and improving access to healthcare and education. Our ability to recruit, train and retain qualified employees, develop and operate our captive facility could be adversely affected if India does not successfully meet these challenges. In addition, US governing authorities may pressure us to perform work domestically rather than using offshore resources. Furthermore, local laws and customs in India may differ from those in the US. For example, it may be a local custom for businesses to engage in practices that are prohibited by our internal policies and procedures or US laws and regulations applicable to us, such as the Foreign Corrupt Practices Act (“FCPA”). The FCPA generally prohibits US companies from giving or offering money, gifts, or anything of value to a foreign official to obtain or retain business, and requires businesses to make and keep accurate books and records and a system of internal accounting controls. We cannot guarantee that our employees, contractors, and agents will comply with all of our FCPA compliance policies and procedures. If we or our employees, contractors, or agents fail to comply with the requirements of the FCPA or similar legislation, government authorities in the US and elsewhere could seek to impose civil or criminal fines and penalties which could have a material adverse effect on our business, operating results, and financial condition.
13
We face the risks and uncertainties that are associated with litigation and investigations, which may adversely impact our marketing, distract management and have a negative impact upon our business, results of operations and financial condition. We face the risks associated with litigation and investigations concerning the operation of our business, including claims by clients regarding product and contract disputes, by other third parties asserting infringement of intellectual property rights, by current and former employees regarding certain employment matters, by certain shareholders, and by governmental and regulatory bodies for failures to comply with applicable laws. The uncertainty associated with substantial unresolved disputes may have an adverse effect on our business. In particular, such disputes could impair our relationships with existing clients and our ability to obtain new clients. Defending litigation and investigative matters may require substantial cost and may result in a diversion of management's time and attention away from business operations, which could have an adverse effect on our business, results of operations and financial condition.
There can be no assurance that such litigation and investigations will not result in liability in excess of our insurance coverage, that our insurance will cover such claims or that appropriate insurance will continue to be available to us in the future at commercially reasonable rates. In addition, any enforcement action by a government agency may result in fines, damage awards, regulatory consequences or other sanctions which could have a material adverse effect, individually or collectively, on the Company’s liquidity, financial condition or results of operations.
We may be impacted by IT system failures or other disruptions. We may be subject to IT systems failures and network disruptions. These may be caused by natural disasters, accidents, power disruptions, telecommunications failures, acts of terrorism or war, computer viruses, malware, physical or electronic break-ins, or other events or disruptions. System redundancy may be ineffective or inadequate, and our disaster recovery planning may not be sufficient for all eventualities. Such failures or disruptions could prevent access to or the delivery of certain of our products or services, compromise our data or our clients’ data, or result in delayed or cancelled orders as well as potentially expose us to third party claims. System failures and disruptions could also impede our transactions processing services and financial reporting.
Our business operations are subject to interruption by, among other, natural disasters, fire, power shortages, terrorist attacks, and other hostile acts, labor disputes, public health issues, and other issues beyond our control. Such events could decrease our demand for our products or services or make it difficult or impossible for us to develop and deliver our products or services to our clients. A significant portion of our research and development activities, our corporate headquarters, our IT systems, and certain of our other critical business operations are concentrated in a few geographic areas. In the event of a business disruption in one or more of those areas, we could incur significant losses, require substantial recovery time, and experience significant expenditures in order to resume operations, which could materially and adversely impact our business, financial condition, and operating results.
We have had to take charges due to asset impairments, and we could suffer further charges due to asset impairment that could reduce our income. We test our goodwill for impairment annually during our first fiscal quarter, and on interim dates should events or changes in circumstances indicate the carrying value of goodwill may not be recoverable in accordance with the relevant accounting guidance. In the past, we have recorded sizeable goodwill impairment charges, and we may need to do so in the future. Declines in business performance or other factors could cause the fair value of any of our operating segments to be revised downward, resulting in further impairment charges. If the financial outlook for any of our operating segments warrants additional impairments of goodwill, the resulting write-downs could materially affect our reported net earnings.
We face risks related to litigation advanced by a former director and shareholder of ours, a putative class action and a shareholder derivative claim. On October 7, 2013, a complaint was filed against our Company and certain of our officers and directors in the Superior Court of the State of California for the County of Orange, captioned Ahmed D. Hussein v. Sheldon Razin, Steven Plochocki, Quality Systems, Inc. and Does 1-10, inclusive, No. 30-2013-00679600-CU-NP-CJC, by Ahmed Hussein, a former director and significant shareholder of our Company. We filed a demurrer to the complaint, which the Court granted on April 10, 2014. An amended complaint was filed on April 25, 2014. The amended complaint generally alleges fraud and deceit, constructive fraud, negligent misrepresentation and breach of fiduciary duty in connection with statements made to our shareholders regarding our financial condition and projected future performance. The amended complaint seeks actual damages, exemplary and punitive damages and costs. We filed a demurrer to the amended complaint. On July 29, 2014, the Court sustained the demurrer with respect to the breach of fiduciary duty claim, and overruled the demurrer with respect to the fraud and deceit claims. On August 28, 2014, we filed an answer and also filed a cross-complaint against Hussein, alleging that he breached fiduciary duties owed to the Company, Mr. Razin and Mr. Plochocki. Mr. Razin and Mr. Plochocki have dismissed their claims against Hussein, leaving QSI as the sole plaintiff in the cross-complaint. On June 26, 2015, we filed a motion for summary judgment with respect to Hussein’s claims, which the Court granted on September 16, 2015, dismissing all of Hussein’s claims against us. On September 23, 2015, Hussein filed an application for reconsideration of the Court's summary judgment order, which the Court denied. Hussein filed a renewed application for reconsideration of the Court’s summary judgment order on August 3, 2017. The Court again denied Hussein’s application. On October 28, 2015, May 9, 2016, and August 5, 2016, Hussein filed a motion for summary judgment, motion for summary adjudication, and motion for judgment on the pleadings, respectively, seeking to dismiss our cross-complaint. The Court denied each motion. Trial on our cross-complaint began June 12, 2017. On July 26, 2017, the Court issued a statement of decision granting Hussein’s motion for judgment on our cross-complaint. Final judgment over Hussein’s claims and our cross-claims was entered on January 9, 2018. Hussein has noticed his appeal of the order granting summary judgment over his claims, and we noticed a cross-appeal on the court’s statement of decision granting Hussein’s motion for judgment on our cross-complaint. Briefing on the cross-appeals will be completed in fall 2018.
14
On November 19, 2013, a putative class action complaint was filed on behalf of the shareholders of our Company other than the defendants against us and certain of our officers and directors in the United States District Court for the Central District of California by one of our shareholders. After the Court appointed lead plaintiffs and lead counsel for this action, and recaptioned the action In re Quality Systems, Inc. Securities Litigation, No. 8:13-cv-01818-CJC-JPR, lead plaintiffs filed an amended complaint on April 7, 2014. The amended complaint, which is substantially similar to the litigation described above under the caption “Hussein Litigation,” generally alleges that statements made to our shareholders regarding our financial condition and projected future performance were false and misleading in violation of Section 10(b) of the Securities Exchange Act of 1934, as amended (the “Exchange Act”), and that the individual defendants are liable for such statements because they are controlling persons under Section 20(a) of the Exchange Act. The complaint seeks compensatory damages, court costs and attorneys' fees. We filed a motion to dismiss the amended complaint on June 20, 2014, which the Court granted on October 20, 2014, dismissing the complaint with prejudice. Plaintiffs filed a motion for reconsideration of the Court's order, which the Court denied on January 5, 2015. On January 30, 2015, Plaintiffs filed a notice of appeal to the United States Court of Appeals for the Ninth Circuit, captioned In re Quality Systems, Inc. Securities Litigation, No. 15-55173. On July 28, 2017, the Ninth Circuit issued a decision reversing and remanding the District Court's order on our motion to dismiss. On September 5, 2017, we filed a petition for rehearing en banc, which was denied on September 29, 2017. On January 26, 2018, we filed a petition for a writ of certiorari with the Supreme Court of the United States. The Supreme Court ordered the plaintiffs to file a response to the petition, which they filed on March 22, 2018. On May 10, 2018, the parties reached an agreement-in-principle to resolve the action for $19 million. On May 11, 2018, the parties requested that the Supreme Court stay any decision regarding whether to hear the Company’s petition for a writ of certiorari, pending the parties’ ongoing settlement negotiations. Under the terms of the agreement-in-principle, a portion of the settlement will be funded by certain of the Company’s insurance carriers, and defendants will continue to deny any liability or wrongdoing. Once the parties enter into a definitive settlement agreement resolving the matter, the settlement will be submitted to the Court for approval. The agreement-in-principle does not resolve the Hussein Litigation or the Shareholder Derivative Litigation.
On January 24, 2014, a complaint was filed against our Company and certain of our officers and current and former directors in the United States District Court for the Central District of California, captioned Timothy J. Foss, derivatively on behalf of himself and all others similarly situated, vs. Craig A. Barbarosh, George H. Bristol, James C. Malone, Peter M. Neupert, Morris Panner, D. Russell Pflueger, Steven T. Plochocki, Sheldon Razin, Lance E. Rosenzweig and Quality Systems, Inc., No. SACV14-00110-DOC-JPPx, by Timothy J. Foss, a purported shareholder of ours. The complaint arises from the same allegations described above under the captions “Hussein Litigation” and “Federal Securities Class Action” and generally alleges breach of fiduciary duties, abuse of control and gross mismanagement by our directors, in addition to unjust enrichment and insider selling by individual directors. The complaint seeks compensatory damages, restitution and disgorgement of all profits, court costs, attorneys’ fees and implementation of enhanced corporate governance procedures. The matter was stayed pending the Ninth Circuit’s decision in the appeal described above under the caption, “Federal Securities Class Action.” This stay now has been lifted and, Defendants filed a motion to dismiss on February 2, 2018. Defendants’ motion is scheduled to be heard on July 23, 2018.
On September 28, 2017, a complaint was filed against our Company and certain of our current and former officers and directors in the United States District Court for the Central District of California, captioned Kusumam Koshy, derivatively on behalf of Quality Systems Inc. vs. Craig Barbarosh, George H. Bristol, James C. Malone, Peter M. Neupert, Morris Panner, D. Russell Pflueger, Steven T. Plochocki, Sheldon Razin, Lance E. Rosenzweig, Paul A. Holt, and Quality Systems, Inc., No. 8:17-cv-01694, by Kusumam Koshy, a purported shareholder of ours. The complaint alleges breach of fiduciary duties and abuse of control, as well as unjust enrichment and insider selling by individual directors arising out of the allegations described above under the captions “Hussein Litigation” and “Federal Securities Class Action,” QSI’s adoption of revised indemnification agreements, and the resignation of certain officers of the Company. The complaint seeks restitution and disgorgement, court costs and attorneys’ fees, and enhanced corporate governance reforms and internal control procedures. On January 12, 2018, Defendants filed a motion to dismiss the derivative complaint. Defendants’ motion is scheduled to be heard on July 23, 2018.
Although we believe the claims to be without merit, our operating results and share price may be negatively impacted due to the negative publicity, expenses incurred in connection with our defense, management distraction, and/or other factors related to this litigation. In addition, litigation of this nature may negatively impact our ability to attract and retain clients and strategic partners, as well as qualified board members and management personnel.
Our credit agreement contains restrictive and financial covenants that may limit our operational flexibility. If we fail to meet our obligations under the credit agreement, our operations may be interrupted and our business and financial results could be adversely affected. On March 29, 2018, we entered into a revolving credit agreement with various lenders, secured by substantially all of our and our material domestic subsidiaries’ existing and future property. The credit agreement includes certain customary covenants that impose restrictions on our business and financing activities that could limit our operations or flexibility to take certain actions. The credit agreement also contains certain customary affirmative covenants requiring us to maintain specified levels of financial performance. Our ability to comply with these covenants may be affected by events that could be beyond our control. A breach of these covenants could result in an event of default under the credit agreement which, if not cured or waived, could result in the indebtedness becoming immediately due and payable, which in turn could result in material adverse consequences that negatively impact our business, the market price for our common stock, and our ability to obtain financing in the future. In addition, our credit agreement’s covenants, consent requirements, and other provisions may limit our flexibility to pursue or fund strategic initiatives or acquisitions that might be in the long-term interests of our Company and shareholders.
15
We may not be successful in integrating and operating our recent acquisitions, and in implementing our post-acquisition business strategy with respect to the products acquired in these transactions. Our shift in product focus following the acquisitions may not yield the desired results. We have recently completed several acquisitions. As a result of these acquisitions, we have devoted and will continue to need to devote significant management attention and resources to integrating the acquired companies’ businesses and product platforms into our business. We may experience problems associated with the acquired companies and their personnel, processes, product, technology, liabilities, commitments, and other matters. There is no assurance that we will be able to successfully integrate the acquired businesses or realize synergies and benefits from the transactions. Furthermore, the acquisitions have substantially altered our business strategy, increasing our focus on efforts to expand our client base and cloud-based solution capabilities in the ambulatory market. The HealthFusion acquisition caused us to evaluate the impact of HealthFusion’s existing cloud-based product, MediTouch, on our ongoing efforts to develop and release our NextGen Now cloud-based platform. Our assessment led us to determine that MediTouch, which was already a production-ready and sellable solution, represented a more prudent investment in our technical future than continuing with the NextGen Now development plans. Accordingly, we abandoned further development of the previously capitalized NextGen Now platform, and instead have redeployed research and development capital toward enhancing and scaling the HealthFusion MediTouch cloud-based platform. This shift resulted in a pre-tax non-cash charge of approximately $32 million relating to the impairment of a portion of our previously capitalized NextGen Now software development costs. If we are unable to successfully integrate acquisitions and implement post-acquisition revisions to our business strategy and product focus, our business, financial condition, and results of operations may suffer.
Risks Related to Our Products and Services
If our principal products, new product developments or implementation, training and support services fail to meet the needs of our clients due to lack of client acceptance, errors, or other problems, we may fail to realize future growth, suffer reputational harm and face the risk of losing existing clients. We currently derive substantially all of our net revenue from sales of our healthcare information systems and related services. We believe that a primary factor in the market acceptance of our systems has been our ability to meet the needs of users of healthcare information systems. Our future financial performance will depend in large part on our ability to continue to meet the increasingly sophisticated needs of our clients through the timely development and successful introduction of new and enhanced versions of our systems and other complementary products, as well as our ability to provide high quality implementation, training and support services for our products. We have historically expended a significant percentage of our net revenue on product development and believe that significant continuing product development efforts will be required to retain our existing clients and sustain our growth. Continued investment in our sales staff and our client implementation, training and support staffs will also be required to retain and grow our client base.
There can be no assurance that we will be successful in our client satisfaction or product development efforts, that the market will continue to accept our existing products and services, or that new products or product enhancements will be developed and implemented in a timely manner, meet the requirements of healthcare providers, or achieve market acceptance. Also, it is possible that our technology may contain defects or errors, some of which may remain undetected for a period of time. If we detect errors before we introduce a solution, we may have to delay deployment for an extended period of time while we address the problem. If we do not discover errors until after product deployment, we may need to provide enhancements to correct such errors. Remediating product defects and errors could consume our development and management resources. In addition, any failure or perceived failure to maintain high-quality and highly-responsive client support could harm our reputation. Quality or performance issues with our products and services may result in product-related liabilities, unexpected expenses and diversion of resources to remedy errors, harm to our reputation, lost sales, delays in commercial releases, delays in or loss of market acceptance of our solutions, license termination or renegotiations, and privacy or security vulnerabilities. If new products or product enhancements are delayed or do not achieve market acceptance, or if our implementation, training and support services do not achieve a high degree of client satisfaction, our reputation, business, results of operations and financial condition could be adversely affected. At certain times in the past, we have also experienced delays in purchases of our products by clients anticipating our launch, or the launch of our competitors, of new products. There can be no assurance that material order deferrals in anticipation of new product introductions from ourselves or other entities will not occur.
If the emerging technologies and platforms of Microsoft and others upon which we build our products do not gain or continue to maintain broad market acceptance, or if we fail to develop and introduce in a timely manner new products and services compatible with such emerging technologies, we may not be able to compete effectively and our ability to generate revenue will suffer. Our software products are built and depend upon several underlying and evolving relational database management system platforms such as those developed by Microsoft. To date, the standards and technologies upon which we have chosen to develop our products have proven to have gained industry acceptance. However, the market for our software products is subject to ongoing rapid technological developments, quickly evolving industry standards and rapid changes in client requirements, and there may be existing or future technologies and platforms that achieve industry standard status, which are not compatible with our products.
We are dependent on our license rights and other services from third parties, which may cause us to discontinue, delay or reduce product shipments. We depend upon licenses for some of the technology used in our products as well as other services from third party vendors. Most of these arrangements can be continued/renewed only by mutual consent and may be terminated for any number of reasons. We may not be able to continue using the products or services made available to us under these arrangements on commercially reasonable terms or at all. As a result, we may have to discontinue, delay or reduce product shipments or services provided until we can obtain equivalent technology or services. Most of our third party licenses are non-exclusive. Our competitors may obtain the right to use any of the business elements covered by these arrangements and use these elements to compete directly with us. In addition, if our vendors choose to discontinue providing their technology or services in the future or are unsuccessful in their continued research and development efforts, we may not be able to modify or adapt our own products.
16
We may experience interruption at our data centers or client support facilities. We perform data center and/or hosting services for certain clients, including the storage of critical patient and administrative data at company-owned facilities and through third party hosting arrangements. In addition, we provide support services to our clients through various client support facilities. We have invested in reliability features such as multiple power feeds, multiple backup generators and redundant telecommunications lines, as well as technical (such as multiple overlapping security applications, access control and other countermeasures) and physical security safeguards, and structured our operations to reduce the likelihood of disruptions. However, complete failure of all local public power and backup generators, impairment of all telecommunications lines, a concerted denial of service cyber-attack, a significant data breach, damage, injury or impairment (environmental, accidental, intentional or pandemic) to the buildings, the equipment inside the buildings housing our data centers, the personnel operating such facilities or the client data contained therein, or errors by the personnel trained to operate such facilities could cause a disruption in operations and negatively impact clients who depend on us for data center and system support services. Any interruption in operations at our data centers and/or client support facilities could damage our reputation, cause us to lose existing clients, hurt our ability to obtain new clients, result in significant revenue loss, create potential liabilities for our clients and us and increase insurance and other operating costs.
We face the possibility of having to adopt new pricing strategies, such as subscription pricing or bundling. In April 2009, we announced a new subscription based software as a service delivery model which includes monthly subscription pricing. This model is designed for smaller practices to quickly access the NextGen Ambulatory EHR or NextGen PM products at a modest monthly per provider price. We currently derive substantially all of our systems revenue from traditional software license, implementation and training fees, as well as the resale of computer hardware. Today, the majority of our clients pay an initial license fee for the use of our products, in addition to a periodic maintenance fee. While the intent of the new subscription based delivery model is to further penetrate the smaller practice market, there can be no assurance that this delivery model will not become increasingly popular with both small and large clients. In addition, we have experienced increasing demand for bundling our software and systems with RCM service arrangements, which has required us to modify our standard upfront license fee pricing model and could impact software maintenance revenue streams prospectively. If the marketplace increasingly demands subscription or bundled pricing, we may be forced to further adjust our sales, marketing and pricing strategies accordingly, by offering a higher percentage of our products and services through these means. Shifting to a significantly greater degree of subscription or bundled pricing could adversely affect our financial condition, cash flows and quarterly and annual revenue and results of operations, as our revenue would initially decrease substantially.
We face the possibility of claims based upon our website content, which may cause us expense and management distraction. We could be subject to third party claims based on the nature and content of information supplied on our website by us or third parties, including content providers or users. We could also be subject to liability for content that may be accessible through our website or third-party websites linked from our website or through content and information that may be posted by users in chat rooms, bulletin boards or on websites created by professionals using our applications. Even if these claims do not result in liability to us, investigating and defending against these claims could be expensive and time consuming and could divert management’s attention away from our operations.
If our security measures are breached or fail and unauthorized access is obtained to a client’s data, our services may be perceived as not being secure, clients may curtail or stop using our services, and we may incur significant liabilities. Our services involve the storage, transmission and processing of clients’ proprietary information and protected health information of patients. Because of the sensitivity of this information, security features of our software are very important. If our security measures are breached or fail as a result of third party action, employee error, malfeasance, insufficiency, defective design, or otherwise, someone may be able to obtain unauthorized access to client or patient data. As a result, our reputation could be damaged, our business may suffer, and we could face damages for contract breach, penalties for violation of applicable laws or regulations and significant costs for remediation and remediation efforts to prevent future occurrences. We rely upon our clients as users of our system for key activities to promote security of the system and the data within it, such as administration of client-side access credentialing and control of client-side display of data. On occasion, our clients have failed to perform these activities. Failure of clients to perform these activities may result in claims against us that this reliance was misplaced, which could expose us to significant expense and harm to our reputation even though our policy is to enter into business associate agreements with our clients. Although we extensively train and monitor our employees, it is possible that our employees may, intentionally or unintentionally, breach security measures. Moreover, third parties with whom we do not have business associate agreements may breach the privacy and security of patient information, potentially causing us reputational damage and exposing us to liability. Because techniques used to obtain unauthorized access or to sabotage systems change frequently and generally are not recognized until launched against a target, we may be unable to anticipate these techniques or to implement adequate preventive measures. If an actual or perceived breach of our security occurs, the market perception of the effectiveness of our security measures could be harmed and we could lose sales and clients. In addition, our clients may authorize or enable third parties to access their client data or the data of their patients on our systems. Because we do not control such access, we cannot ensure the complete propriety of that access or integrity or security of such data in our systems.
17
Failure by our clients to obtain proper permissions and waivers may result in claims against us or may limit or prevent our use of data, which could harm our business. We require our clients to provide necessary notices and to obtain necessary permissions and waivers for use and disclosure of the information that we receive, and we require contractual assurances from them that they have done so and will do so. If they do not obtain necessary permissions and waivers, then our use and disclosure of information that we receive from them or on their behalf may be limited or prohibited by state or federal privacy laws or other applicable laws. This could impair our functions, processes and databases that reflect, contain, or are based upon such data and may prevent use of such data. In addition, this could interfere with or prevent creation or use of rules and analyses or limit other data-driven activities that are beneficial to our business. Moreover, we may be subject to claims or liability for use or disclosure of information by reason of lack of valid notice, permission or waiver. These claims or liabilities could subject us to unexpected costs and adversely affect our operating results.
We face the possibility of damages resulting from internal and external security breaches. In the course of our business operations, we store, process, compile and transmit confidential information, including patient health information, in our processing centers and other facilities. A breach of security in any of these facilities could damage our reputation and result in damages being assessed against us. In addition, the other systems with which we may interface, such as the internet and related systems may be vulnerable to security breaches, viruses, programming errors, or similar disruptive problems. In addition, our clients and vendors with whom we have business associate agreements, or other parties with whom we do not have business associate agreements, may be responsible for breaching the security and compromising the privacy of patient information located on our systems. In addition, although we extensively train and monitor our employees, it is possible that our own employees may engage in conduct that compromises security or privacy. The effect of these security breaches and related issues could disrupt our ability to perform certain key business functions and could potentially reduce demand for our services. Accordingly, we have expended significant resources toward establishing and enhancing the security of our related infrastructures, although no assurance can be given that they will be entirely free from potential breach. Maintaining and enhancing our infrastructure security may require us to expend significant capital in the future.
The success of our strategy to offer our electronic data interchange (“EDI”) services and software as a service (“SaaS”) solutions depends on the confidence of our clients in our ability to securely transmit confidential information. Our EDI services and SaaS solutions rely on encryption, authentication and other security technology licensed from third parties to achieve secure transmission of confidential information. We may not be able to stop unauthorized attempts to gain access to or disrupt the transmission of communications by our clients. Anyone who is able to circumvent our security measures could misappropriate confidential user information or interrupt our, or our clients’, operations. In addition, our EDI and SaaS solutions may be vulnerable to viruses, malware, physical or electronic break-ins and similar disruptions.
High-profile security breaches at other companies have increased in recent years, and security industry experts and government officials have warned about the risks of hackers and cyber-attacks targeting information technology products and businesses. Although this is an industry-wide problem that affects other software and hardware companies, we may be targeted by computer hackers because we are a prominent healthcare information technology company and have high profile clients. These risks will increase as we continue to grow our cloud offerings, store and process increasingly large amounts of our clients’ confidential data, including personal health information, and host or manage parts of our clients’ businesses in cloud-based/multi-tenant information technology environments. We may use third party public cloud providers in connection with our cloud-based offerings or third party providers to host our own data, in which case we may have to rely on the processes, controls and security such third parties have in place to protect the infrastructure.
The costs we would incur to address any security incidents would increase our expenses, and our efforts to resolve these problems may not be successful and could result in interruptions, delays, cessation of service and loss of existing or potential clients that may impede our sales, development of solutions, provision of services, or other critical functions. If a cyberattack or other security incident were to allow unauthorized access to or modification of our clients’ or suppliers’ data, our own data, or our information technology systems, or if our products or services are perceived as having security vulnerabilities, we could suffer significant damage to our brand and reputation. This could lead to fewer clients using our products or services and make it more difficult for us to obtain new clients, resulting in reduced revenue and earnings. These types of security incidents could also lead to lawsuits, regulatory investigations and claims, and increased legal liability.
Our business depends on continued and unimpeded access to the internet by us and our clients, which is not within our control. We deliver internet-based services and, accordingly, depend on our ability and the ability of our clients to access the internet. This access is currently provided by third parties that have significant market power in the broadband and internet access marketplace, including incumbent telephone companies, cable companies, mobile communications companies and government-owned service provides -- all of whom are outside of our control. In the event of any difficulties, outages and delays by internet service providers, we may be impeded from providing services, resulting in a loss of potential or existing clients.
We may be subject to claims for system errors, warranties or product liability, which could have an adverse effect on our business, results of operations and financial condition. Our software solutions are intended for use in collecting, storing and displaying clinical and healthcare-related information used in the diagnosis and treatment of patients and in related healthcare settings such as admissions and billing. Therefore, users of our software solutions have a greater sensitivity to errors than the market for software products generally. Any failure by our products to provide accurate and timely information concerning patients, their medication, treatment and health status, generally, could result in claims against us which could materially and adversely impact our financial performance, industry reputation and ability to market new system sales. In
18
addition, a court or government agency may take the position that our delivery of health information directly, including through licensed practitioners, or delivery of information by a third-party site that a consumer accesses through our websites, exposes us to assertions of malpractice, other personal injury liability, or other liability for wrongful delivery/handling of healthcare services or erroneous health information. We maintain insurance to protect against claims associated with the use of our products as well as liability limitation language in our end-user license agreements, but there can be no assurance that our insurance coverage or contractual language would adequately cover any claim asserted against us. A successful claim brought against us in excess of or outside of our insurance coverage could have an adverse effect on our business, results of operations and financial condition. Even unsuccessful claims could result in our expenditure of funds for litigation and management time and resources.
Certain healthcare professionals who use our SaaS products will directly enter health information about their patients including information that constitutes a record under applicable law that we may store on our computer systems. Numerous federal and state laws and regulations, the common law and contractual obligations, govern collection, dissemination, use and confidentiality of patient-identifiable health information, including:
|
|
• |
state and federal privacy and confidentiality laws; |
|
|
• |
our contracts with clients and partners; |
|
|
• |
state laws regulating healthcare professionals; |
|
|
• |
Medicaid laws; |
|
|
• |
the HIPAA and related rules proposed by CMS; and |
|
|
• |
CMS standards for internet transmission of health data. |
HIPAA establishes elements including, but not limited to, federal privacy and security standards for the use and protection of Protected Health Information. Any failure by us or by our personnel or partners to comply with applicable requirements may result in a material liability to us.
Although we have systems and policies in place for safeguarding Protected Health Information from unauthorized disclosure, these systems and policies may not preclude claims against us for alleged violations of applicable requirements. Also, third party sites and/or links that consumers may access through our web sites may not maintain adequate systems to safeguard this information, or may circumvent systems and policies we have put in place. In addition, future laws or changes in current laws may necessitate costly adaptations to our policies, procedures, or systems.
There can be no assurance that we will not be subject to product liability claims, that such claims will not result in liability in excess of our insurance coverage, that our insurance will cover such claims or that appropriate insurance will continue to be available to us in the future at commercially reasonable rates. Such product liability claims could adversely affect our business, results of operations and financial condition.
We are subject to the effect of payer and provider conduct which we cannot control and accordingly, there is no assurance that revenue for our services will continue at historic levels. We offer certain electronic claims submission products and services as part of our product line. While we have implemented certain product features designed to maximize the accuracy and completeness of claims submissions, these features may not be sufficient to prevent inaccurate claims data from being submitted to payers. Should inaccurate claims data be submitted to payers, we may be subject to liability claims.
Electronic data transmission services are offered by certain payers to healthcare providers that establish a direct link between the provider and payer. This process reduces revenue to third party EDI service providers such as us. As a result of this, and other market factors, we are unable to ensure that we will continue to generate revenue at or in excess of prior levels for such services.
A significant increase in the utilization of direct links between healthcare providers and payers could adversely affect our transaction volume and financial results. In addition, we cannot provide assurance that we will be able to maintain our existing links to payers or develop new connections on terms that are economically satisfactory to us, if at all.
Proprietary rights are material to our success, and the misappropriation of these rights could adversely affect our business and our financial condition. We are heavily dependent on the maintenance and protection of our intellectual property and we rely largely on technical security measures, license agreements, confidentiality procedures and employee nondisclosure agreements to protect our intellectual property. The majority of our software is not patented and existing copyright laws offer only limited practical protection.
There can be no assurance that the legal protections and precautions we take will be adequate to prevent misappropriation of our technology or that competitors will not independently develop technologies equivalent or superior to ours. Further, the laws of some foreign countries do not protect our proprietary rights to as great an extent as do the laws of the United States and are often not enforced as vigorously as those in the United States.
We do not believe that our operations or products infringe on the intellectual property rights of others. However, there can be no assurance that others will not assert infringement or trade secret claims against us with respect to our current or future products or that any such assertion will not require us to enter into a license agreement or royalty arrangement or other
19
financial arrangement with the party asserting the claim. Responding to and defending any such claims may distract the attention of our management and adversely affect our business, results of operations and financial condition. In addition, claims may be brought against third parties from which we purchase software, and such claims could adversely affect our ability to access third party software for our systems.
If we are deemed to infringe on the proprietary rights of third parties, we could incur unanticipated expense and be prevented from providing our products and services. We have been, and may be in the future, subject to intellectual property infringement claims as the number of our competitors grows and our applications' functionality is viewed as similar or overlapping with competitive products. We do not believe that we have infringed or are infringing on any proprietary rights of third parties. However, claims are occasionally asserted against us, and we cannot assure you that infringement claims will not be asserted against us in the future. Also, we cannot assure you that any such claims will be unsuccessful. We could incur substantial costs and diversion of management resources defending any infringement claims - even if we are ultimately successful in the defense of such matters. Furthermore, a party making a claim against us could secure a judgment awarding substantial damages, as well as injunctive or other equitable relief that could effectively block our ability to provide products or services. In addition, we cannot assure you that licenses for any intellectual property of third parties that might be required for our products or services will be available on commercially reasonable terms, or at all.
We face risks related to the periodic maintenance and upgrades that need to be made to our products. As we continue to develop and improve upon our technology and offerings, we need to periodically upgrade and maintain the products deployed to our clients. This process can require a significant amount of our internal time and resources, and be complicated and time consuming for our clients. Certain upgrades may also pose the risk of system delays or failure. If our periodic upgrades and maintenance cause disruptions to our clients, we may lose revenue-generating transactions, our clients may elect to use other solutions and we may also be the subject of negative publicity that may adversely affect our business and reputation.
Risks Related to Regulation
There is significant uncertainty in the healthcare industry in which we operate, and the current governmental laws and regulations as well as any future modifications to the regulatory environment, may adversely impact our business, financial condition and results of operations. The healthcare industry is subject to changing political, economic and regulatory influences that may affect the procurement processes and operation of healthcare facilities. During the past several years, the healthcare industry has been subject to an increase in governmental regulation of, among other things, reimbursement rates and certain capital expenditures.
For example, the Health Insurance Portability and Accountability Act of 1996, as modified by HITECH provisions of the ARRA (collectively, “HIPAA”), continues to have a direct impact on the health care industry by requiring national provider identifiers and standardized transactions/code sets, operating rules and necessary security and privacy measures in order to ensure the appropriate level of privacy of protected health information. These regulatory factors affect the purchasing practices and operation of health care organizations.
The Patient Protection and Affordable Care Act (“PPACA”), which was amended by the Health Care and Education Reconciliation Act of 2010, became law in 2010. This comprehensive health care reform legislation included provisions to control health care costs, improve health care quality, and expand access to affordable health insurance. The Medicare Access and CHIP Reauthorization Act of 2015 (“MACRA”), which became law in 2015, repealed the sustainable growth rate (“SGR”) formula and created two new value-based payment systems for Medicare physicians. Together with ongoing statutory and budgetary policy developments at a federal level, these health care reform laws include changes in Medicare and Medicaid payment policies and other health care delivery administrative reforms that could potentially negatively impact our business and the business of our clients. Because not all the administrative rules implementing health care reform under these laws have been finalized, and because of ongoing federal fiscal budgetary pressures yet to be resolved for federal health programs, the full impact of the health care reform legislation and of further statutory actions to reform healthcare payment on our business is unknown, but there can be no assurances that health care reform legislation will not adversely impact either our operational results or the manner in which we operate our business. Health care industry participants may respond by reducing their investments or postponing investment decisions, including investments in our solutions and services.
Since January 2017, the actions taken by the Trump administration to delay, cancel, and amend the healthcare regulations and initiatives implemented by the prior administration have created tremendous uncertainty surrounding the continued implementation of the PPACA, MACRA, and other healthcare legislation. The legislative efforts taken by the 115th Congress in 2017 to repeal and amend major provisions of the PPACA added to this uncertainty.
Healthcare providers may react to these proposals, and the uncertainty surrounding such proposals, by curtailing or deferring investments, including those for our systems and related services. Cost-containment measures instituted by healthcare providers as a result of regulatory reform or otherwise could result in a reduction in the allocation of capital funds. Such a reduction could have an adverse effect on our ability to sell our systems and related services. On the other hand, changes in the regulatory environment have increased and may continue to increase the needs of healthcare organizations for cost-effective data management and thereby enhance the overall market for healthcare management information systems. We cannot predict what effect, if any, such proposals or healthcare reforms might have on our business, financial condition and results of operations.
20
As existing regulations mature and become better defined, we anticipate that these regulations will continue to directly affect certain of our products and services, but we cannot fully predict the effect at this time. We have taken steps to modify our products, services and internal practices as necessary to facilitate our compliance with the regulations, but there can be no assurance that we will be able to do so in a timely or complete manner. Achieving compliance with these regulations could be costly and distract management’s attention and divert other company resources, and any noncompliance by us could result in civil and criminal penalties.
Developments of additional federal and state regulations and policies have the potential to positively or negatively affect our business.
Other specific risks include, but are not limited to, risks relating to:
Privacy and Security of Patient Information. As part of the operation of our business, we may have access to or our clients may provide to us individually-identifiable health information related to the treatment, payment, and operations of providers’ practices. Government and industry legislation and rulemaking, especially HIPAA, HITECH and standards and requirements published by industry groups such as the Joint Commission require the use of standard transactions, standard identifiers, security and other standards and requirements for the transmission of certain electronic health information. These standards and requirements impose additional obligations and burdens on us, limiting the use and disclosure of individually-identifiable health information, and require us to enter into business associate agreements with our clients and vendors. Failure by us to enter into adequate business associate agreements with any client or vendor would place us in violation of applicable standards and requirements and could expose us to liability. Our business associates may interpret HIPAA requirements differently than we do, and we may not be able to adequately address the risks created by such interpretations. These new rules, and any future changes to privacy and security rules, may increase the cost of compliance and could subject us to additional enforcement actions, which could further increase our costs and adversely affect the way in which we do business.
Interoperability Standards. Our clients are concerned with and often require that our software solutions and health care devices be interoperable with other third-party health care information technology suppliers. With the passing of the MACRA in 2015, the U.S. Congress declared it a national objective to achieve widespread exchange of health information through interoperable certified EHR technology nationwide by December 31, 2018. The 21st Century Cures Act, which was passed and signed into law in December 2016, includes numerous provisions intended to encourage this nationwide interoperability. As a result of the 21st Century Cures Act, the U.S. Department of Health and Human Services (“HHS”) has the regulatory authority to investigate and assess civil monetary penalties of up to $1,000,000 against health IT developers and/or providers found to be in violation of “information blocking”. This new oversight and authority to investigate claims of “information blocking” creates significant risks for us and our clients, although at this time HHS, the Office of the National Coordinator for Health IT (“ONC”), and the Office of the Inspector General (“OIG”) have yet to issue regulations and guidance regarding how these provisions will be defined and enforced. The 21st Century Cures Act legislation also requires HHS and ONC to add new certification requirements related to interoperability as a condition of a health IT developer achieving or maintaining approved federal government certification status. One of these requirements is for a developer to publish an application programming interface (API) that allows health information to be “accessed, exchanged, and used without special effort”. Regulations and certification requirements implementing this legislative provision have not yet been written, but if our software solutions, health care devices or services are not consistent with interoperability standards imposed by governmental/regulatory authorities or demanded by market forces, we could be forced to incur substantial additional development costs to conform.
FDA Regulation of Software as a Medical Device. The U.S. Food and Drug Administration (“FDA”) has the statutory authority to regulate medical software if it falls within the definition of a “device” under the Federal Food, Drug, and Cosmetic Act (“FFDCA”). However, the FDA has exercised enforcement discretion for software said to be “low risk.” The December 2016 21st Century Cures Act clarified the FDA’s regulation of medical software by amending the definition of “device” in the FFDCA to exclude certain software functions, including electronic health record software functionality and administrative software functionality. In December 2017, the FDA issued draft guidance documents to clarify how it intends to interpret and enforce these provisions of the Cures Act. In 2017, the FDA also issued a Digital Health Innovation Action Plan and launched a voluntary “Software Precertification (Pre-Cert) Pilot Program” for software developers. Although we believe that our products are currently not subject to FDA regulation, we continue to follow the FDA’s guidance in this area, which is subject to change and in some critical areas only currently exists in draft form. As a result, our software may potentially be subject to regulation by the FDA as a medical device. Such regulation could require the registration of the applicable manufacturing facility and software and hardware products, application of detailed record-keeping and manufacturing standards, application of the medical device excise tax, and FDA approval or clearance prior to marketing. An approval or clearance requirement could create delays in marketing, and the FDA could require supplemental filings or object to certain of these applications, the result of which could adversely affect our business, financial condition and results of operations.
Health Reform. The health reform laws discussed above and that may be enacted in the future contain and may contain various provisions which may impact us and our clients. Some of these provisions may have a positive impact, by expanding the use of electronic health records and other health information technology solutions in certain federal programs, for example, while others, such as reductions in reimbursement for certain types of providers, may have a negative impact due to fewer available resources. Increases in fraud and abuse penalties may also adversely affect participants in the health care sector, including us.
21
We may not see the benefits from government funding programs initiated to accelerate the adoption and utilization of health information technology. While government programs have been implemented to improve the efficiency and quality of the healthcare sector, including expenditures to stimulate business and accelerate the adoption and utilization of healthcare technology, we may not see the anticipated benefits of such programs. Under the ARRA, the PPACA, and the MACRA, significant government financial resources are being invested in healthcare, including financial incentives to healthcare providers who can demonstrate meaningful use of certified EHR technology since 2011. While we expect the ARRA, the PPACA, and the MACRA to continue to create sales opportunities over the next several years, we are unsure of the immediate or long-term impact of these government actions.
HITECH established the Medicare and Medicaid EHR Incentive Programs to provide incentive payments for eligible professionals, hospitals, and critical access hospitals as they adopt, implement, upgrade, or demonstrate meaningful use of certified EHR technology. HITECH, and subsequently MACRA, also authorized CMS to apply payment adjustments, or penalties, to Medicare eligible professionals and eligible hospitals that are not meaningful users under the Medicare EHR Incentive Program.
Although we believe that our service offerings will meet the requirements of HITECH and MACRA to allow our clients to qualify for financial incentives and avoid financial penalties for implementing and using our services, there can be no guaranty that our clients will achieve meaningful use (or its equivalent under MACRA’s Merit Based Incentive Payment System, Advancing Care Information (“ACI”)) or actually receive such planned financial incentives for our services. We also cannot predict the speed at which healthcare providers will adopt electronic health record systems in response to these government incentives, whether healthcare providers will select our products and services or whether healthcare providers will implement an electronic health record system at all. In addition, the financial incentives associated with the meaningful use program are tied to provider participation in Medicare and Medicaid, and we cannot predict whether providers will continue to participate in these programs. Any delay in the purchase and implementation of electronic health records systems by healthcare providers in response to government programs, or the failure of healthcare providers to purchase an electronic health record system, could have an adverse effect on our business, financial condition and results of operations. It is also possible that additional regulations or government programs related to electronic health records, amendment or repeal of current healthcare laws and regulations or the delay in regulatory implementation could require us to undertake additional efforts to meet meaningful use standards, materially impact our ability to compete in the evolving healthcare IT market, materially impact healthcare providers' decisions to implement electronic health records systems or have other impacts that would be unfavorable to our business. Recent regulations from the CMS have slowed or moderated requirements for adoption of certified electronic health record technology ("CEHRT") that is required for participation in Medicare and Medicaid programs. As a result, our clients may delay or cancel their decision to purchase our solutions and services needed to comply with these regulations, negatively impacting our sales. The costs of achieving and maintaining CEHRT are also significant and because the definition of CEHRT and its use requirements for clients are subject to regulatory changes, these programs and future regulatory changes to them could adversely impact our business.
We may be subject to false or fraudulent claim laws. There are numerous federal and state laws that forbid submission of false information or the failure to disclose information in connection with submission and payment of physician claims for reimbursement. In some cases, these laws also forbid abuse of existing systems for such submission and payment. Any failure of our RCM services to comply with these laws and regulations could result in substantial liability including, but not limited to, criminal liability, could adversely affect demand for our services and could force us to expend significant capital, research and development and other resources to address the failure. Errors by us or our systems with respect to entry, formatting, preparation or transmission of claim information may be determined or alleged to be in violation of these laws and regulations. Determination by a court or regulatory agency that our services violate these laws could subject us to civil or criminal penalties, invalidate all or portions of some of our client contracts, require us to change or terminate some portions of our business, require us to refund portions of our services fees, cause us to be disqualified from serving clients doing business with government payers and have an adverse effect on our business.
In most cases where we are permitted to do so, we calculate charges for our RCM services based on a percentage of the collections that our clients receive as a result of our services. To the extent that violations or liability for violations of these laws and regulations require intent, it may be alleged that this percentage calculation provides us or our employees with incentive to commit or overlook fraud or abuse in connection with submission and payment of reimbursement claims. The U.S. Centers for Medicare and Medicaid Services has stated that it is concerned that percentage-based billing services may encourage billing companies to commit or to overlook fraudulent or abusive practices.
A portion of our business involves billing of Medicare claims on behalf of its clients. In an effort to combat fraudulent Medicare claims, the federal government offers rewards for reporting of Medicare fraud which could encourage others to subject us to a charge of fraudulent claims, including charges that are ultimately proven to be without merit.
Additionally, under the False Claims Act (“FCA”), the federal government allows private individuals to file a complaint or otherwise report actions alleging the defrauding of the federal government by an entity. These suits, known as qui tam actions or “whistleblower” suits may be brought by, with only a few exceptions, any private citizen who believes that he has material information of a false claim that has not been previously disclosed. If the federal government intervenes, the individual that filed the initial complaint may share in any settlement or judgment. If the federal government does not intervene in the action, the whistleblower plaintiff may pursue its allegation independently. Some states have adopted similar state whistleblower and false claims provisions. Qui tam actions under the FCA and similar state laws may lead to significant fines, penalties, settlements or other sanctions, including exclusion from Medicare or other federal or state healthcare programs.
22
If our products fail to comply with evolving government and industry standards and regulations, we may have difficulty selling our products. We may be subject to additional federal and state statutes and regulations in connection with offering services and products via the internet. On an increasingly frequent basis, federal and state legislators are proposing laws and regulations that apply to internet commerce and communications. Areas being affected by these regulations include user privacy, pricing, content, taxation, copyright protection, distribution, and quality of products and services. To the extent that our products and services are subject to these laws and regulations, the sale of our products and services could be harmed.
We are subject to changes in and interpretations of financial accounting matters that govern the measurement of our performance, one or more of which could adversely affect our business, financial condition, cash flows, revenue, results of operations, and debt covenant compliance. Based on our reading and interpretations of relevant guidance, principles or concepts issued by, among other authorities, the American Institute of Certified Public Accountants, the Financial Accounting Standards Board and the Commission, we believe our current business arrangements, transactions, and related estimates and disclosures have been properly reported. However, there continue to be issued interpretations and guidance for applying the relevant standards to a wide range of sales and licensing contract terms and business arrangements that are prevalent in the software industry. Future interpretations or changes by the regulators of existing accounting standards or changes in our business practices could result in changes in our revenue recognition and/or other accounting policies and practices that could adversely affect our business, financial condition, cash flows, revenue and results of operations. In addition, changes in accounting rules could alter the application of certain terms in our credit agreement, thereby impacting our ability to comply with our debt covenants.
Failure to maintain effective internal controls in accordance with Section 404 of the Sarbanes-Oxley Act of 2002 could have an adverse effect on our business, and our per share price may be adversely affected. Pursuant to Section 404 of the Sarbanes-Oxley Act of 2002 (“Section 404”) and the rules and regulations promulgated by the SEC to implement Section 404, we are required to include in our Form 10-K a report by our management regarding the effectiveness of our internal control over financial reporting. The report includes, among other things, an assessment of the effectiveness of our internal control over financial reporting. The assessment must include disclosure of any material weakness in our internal control over financial reporting identified by management.
As part of the evaluation undertaken by management and our independent registered public accountants pursuant to Section 404, our internal control over financial reporting was effective as of March 31, 2018. However, if we fail to maintain an effective system of disclosure controls or internal controls over financial reporting, we may discover material weaknesses that we would then be required to disclose. Any material weaknesses identified in our internal controls could have an adverse effect on our business. We may not be able to accurately or timely report on our financial results, and we might be subject to investigation by regulatory authorities. This could result in a loss of investor confidence in the accuracy and completeness of our financial reports, which may have an adverse effect on our stock price.
No evaluation process can provide complete assurance that our internal controls will detect and correct all failures within our company to disclose material information otherwise required to be reported. The effectiveness of our controls and procedures could also be limited by simple errors or faulty judgments. In addition, if we continue to expand, through either organic growth or through acquisitions (or both), the challenges involved in implementing appropriate controls will increase and may require that we evolve some or all of our internal control processes.
It is also possible that the overall scope of Section 404 may be revised in the future, thereby causing ourselves to review, revise or reevaluate our internal control processes which may result in the expenditure of additional human and financial resources.
Risks Related to Ownership of Our Common Stock
The unpredictability of our quarterly operating results may cause the price of our common stock to fluctuate or decline. Our revenue may fluctuate in the future from quarter to quarter and period to period, as a result of a number of factors including, without limitation:
|
|
• |
the size and timing of orders from clients; |
|
|
• |
the specific mix of software, hardware and services in client orders; |
|
|
• |
the length of sales cycles and installation processes; |
|
|
• |
the ability of our clients to obtain financing for the purchase of our products; |
|
|
• |
changes in pricing policies or price reductions by us or our competitors; |
|
|
• |
the timing of new product announcements and product introductions by us or our competitors; |
|
|
• |
changes in revenue recognition or other accounting guidelines employed by us and/or established by the Financial Accounting Standards Board ("FASB") or other rule-making bodies; |
|
|
• |
changes in government healthcare policies and regulations, such as the shift from fee-for-service reimbursement to value-based reimbursement; |
23
|
|
• |
the availability and cost of system components; |
|
|
• |
the financial stability of clients; |
|
|
• |
market acceptance of new products, applications and product enhancements; |
|
|
• |
our ability to develop, introduce and market new products, applications and product enhancements; |
|
|
• |
our success in expanding our sales and marketing programs; |
|
|
• |
deferrals of client orders in anticipation of new products, applications, product enhancements, or public/private sector initiatives; |
|
|
• |
execution of or changes to our strategy; |
|
|
• |
personnel changes; and |
|
|
• |
general market/economic factors. |
Our software products are generally shipped as orders are received and accordingly, we have historically operated with a minimal backlog of license fees. As a result, a portion of our revenue in any quarter is dependent on orders booked and shipped in that quarter and is not predictable with any degree of certainty. Furthermore, our systems can be relatively large and expensive, and individual systems sales can represent a significant portion of our revenue and profits for a quarter such that the loss or deferral of even one such sale can adversely affect our quarterly revenue and profitability. Clients often defer systems purchases until our quarter end, so quarterly revenue from system sales generally cannot be predicted and frequently are not known until after the quarter has concluded. Our sales are dependent upon clients’ initial decisions to replace or substantially modify their existing information systems, and subsequently, their decision concerning which products and services to purchase. These are major decisions for healthcare providers and, accordingly, the sales cycle for our systems can vary significantly and typically ranges from six to twenty-four months from initial contact to contract execution/shipment. Because a significant percentage of our expenses are relatively fixed, a variation in the timing of systems sales, implementations and installations can cause significant variations in operating results from quarter to quarter. As a result, we believe that interim period-to-period comparisons of our results of operations are not necessarily meaningful and should not be relied upon as indications of future performance. Further, our historical operating results are not necessarily indicative of future performance for any particular period. We currently recognize revenue in accordance with the applicable accounting guidance as defined by the FASB. There can be no assurance that application and subsequent interpretations of these pronouncements will not further modify our revenue recognition policies, or that such modifications would not adversely affect our operating results reported in any particular quarter or year. Due to all of the foregoing factors, it is possible that our operating results may be below the expectations of public market analysts and investors. In such event, the price of our common stock would likely be adversely affected.
Our common stock price has been volatile, which could result in substantial losses for investors purchasing shares of our common stock and in litigation against us. Volatility may be caused by a number of factors including but not limited to:
|
|
• |
actual or anticipated quarterly variations in operating results; |
|
|
• |
rumors about our performance, software solutions, or merger and acquisition activity; |
|
|
• |
changes in expectations of future financial performance or changes in estimates of securities analysts; |
|
|
• |
governmental regulatory action; |
|
|
• |
health care reform measures; |
|
|
• |
client relationship developments; |
|
|
• |
purchases or sales of company stock; |
|
|
• |
activities by one or more of our major shareholders concerning our policies and operations; |
|
|
• |
changes occurring in the markets in general; |
|
|
• |
macroeconomic conditions, both nationally and internationally; and |
|
|
• |
other factors, many of which are beyond our control. |
Furthermore, the stock market in general, and the market for software, healthcare and high technology companies in particular, has experienced extreme volatility that often has been unrelated to the operating performance of particular companies. These broad market and industry fluctuations may adversely affect the trading price of our common stock, regardless of actual operating performance.
24
Moreover, in the past, securities class action litigation has often been brought against a company following periods of volatility in the market price of its securities. We may in the future be the target of similar litigation. Securities litigation could result in substantial costs and divert management’s attention and resources.
One of our current directors, and one of our former directors are each significant shareholders, which makes it possible for them to have significant influence over the outcome of all matters submitted to our shareholders for approval and which influence may be alleged to conflict with our interests and the interests of our other shareholders. One of our directors is a significant shareholder who beneficially owns approximately 16.0% of the outstanding shares of our common stock at March 31, 2018. In addition, a former director, who owns approximately 8.9% (based on the most recently available publicly filed information) of the outstanding shares of our common stock at March 31, 2018, likely maintains a large enough ownership stake to reelect himself to our Board of Directors under cumulative voting. California law and our Bylaws permit our shareholders to cumulate their votes, the effect of which is to provide shareholders with sufficiently large concentrations of our shares the opportunity to assure themselves one or more seats on our Board of Directors. The amounts required to assure a seat on our Board of Directors can vary based upon the number of shares outstanding, the number of shares voting, the number of directors to be elected, the number of “broker non-votes,” and the number of shares held by the shareholder exercising the cumulative voting rights. In the event that cumulative voting is invoked, it is likely that these two individuals that are significant shareholders will each have sufficient votes to assure themselves of one or more seats on our Board of Directors. With or without cumulative voting, these two significant shareholders will have substantial influence over the outcome of all matters submitted to our shareholders for approval, including the election of our directors and other corporate actions. This influence may be alleged to conflict with our interests and the interests of our other shareholders. For example, in fiscal year 2013, the former director launched a proxy contest to elect a different slate of directors than what our Company proposed to shareholders. We spent approximately $1.3 million to defend against the proxy contest and elect the Company's slate of directors. In addition, such influence by one or both of these shareholders could have the effect of discouraging others from attempting to acquire our Company or create actual or perceived governance instabilities that could adversely affect the price of our common stock.
25
ITEM 1B. UNRESOLVED STAFF COMMENTS
None.
Our corporate headquarters is located in Irvine, California. We believe that our existing facilities are in good condition and adequate for our current business requirements. Should we continue to grow, we may be required to lease or acquire additional space. We believe that suitable additional space is available, if needed, at commercially reasonable market rates and terms.
As of March 31, 2018, we leased an aggregate of approximately 541,500 square feet of space with lease agreements expiring at various dates, of which approximately 461,700 square feet of space are utilized for continuing operations and 79,800 square feet of space are being subleased or have been vacated as part of our reorganization efforts, as detailed further below:
|
|
|
Square Feet |
|
|
Notes |
|
|
Primary Operating Locations |
|
|
|
|
|
|
|
Horsham, Pennsylvania |
|
|
92,800 |
|
|
(2) |
|
Irvine, California |
|
|
83,100 |
|
|
(1) (2) |
|
Bangalore, India |
|
|
73,800 |
|
|
(2) |
|
St. Louis, Missouri |
|
|
50,900 |
|
|
|
|
San Diego, California |
|
|
40,000 |
|
|
(2) |
|
Atlanta, Georgia |
|
|
35,500 |
|
|
(2) |
|
Hunt Valley, Maryland |
|
|
34,000 |
|
|
|
|
North Canton, Ohio |
|
|
22,100 |
|
|
|
|
Brentwood, Tennessee |
|
|
17,400 |
|
|
|
|
Fairport, New York |
|
|
10,500 |
|
|
|
|
Other Locations |
|
|
1,600 |
|
|
|
|
Total Primary Operating Locations |
|
|
461,700 |
|
|
|
|
|
|
|
|
|
|
|
|
Vacated or Subleased Locations |
|
|
|
|
|
|
|
Austin, Texas |
|
|
43,700 |
|
|
|
|
Horsham, Pennsylvania |
|
|
17,200 |
|
|
|
|
Solana Beach, California |
|
|
12,000 |
|
|
|
|
Other Locations |
|
|
6,900 |
|
|
|
|
Total Vacated or Subleased Locations |
|
|
79,800 |
|
|
|
|
|
|
|
|
|
|
|
|
Total Leased Properties |
|
|
541,500 |
|
|
|
|
(1) |
Location of our corporate office |
|
(2) |
Locations of our research and development functions |
We have experienced legal claims by clients regarding product and contract disputes, by other third parties asserting that we have infringed their intellectual property rights, by current and former employees regarding certain employment matters and by certain shareholders. We believe that these claims are without merit and intend to defend against them vigorously; however, we could incur substantial costs and diversion of management resources defending any such claim, even if we are ultimately successful in the defense of such matter. Litigation is inherently uncertain and always difficult to predict.
Additionally, we are subject to the regulation and oversight of various federal and state governmental agencies that enforce fraud and abuse programs related to the submission of fraudulent claims for reimbursement from governmental payers. We have received, and from time to time may receive, inquiries or subpoenas from federal and state agencies. Under the FCA, private parties have the right to bring qui tam, or “whistleblower,” suits against entities that submit, or cause to be submitted, fraudulent claims for reimbursement. Qui tam or whistleblower actions initiated under the FCA may be pending but placed under seal by the court to comply with the FCA’s requirements for filing such suits. As a result, they could lead to proceedings without our knowledge. We refer you to the discussion of regulatory and litigation risks within “Item 1A. Risk Factors” and to Note 14, “Commitments, Guarantees and Contingencies” of our notes to consolidated financial statements included elsewhere in this Report for a discussion of current legal proceedings.
ITEM 4. MINE AND SAFETY DISCLOSURES
Not applicable.
26
ITEM 5. MARKET FOR REGISTRANT’S COMMON EQUITY, RELATED STOCKHOLDER MATTERS AND ISSUER PURCHASES OF EQUITY SECURITIES
Market Price and Holders
Our common stock is traded on the NASDAQ Global Select Market under the symbol “QSII.”
The following table sets forth for the quarters indicated the high and low sales prices for each period indicated, as reported on the NASDAQ Global Select Market:
|
|
|
High |
|
|
Low |
|
||
|
Three Months Ended |
|
|
|
|
|
|
|
|
|
June 30, 2016 |
|
$ |
15.31 |
|
|
$ |
11.10 |
|
|
September 30, 2016 |
|
|
13.04 |
|
|
|
11.13 |
|
|
December 31, 2016 |
|
|
14.18 |
|
|
|
10.61 |
|
|
March 31, 2017 |
|
|
15.90 |
|
|
|
13.07 |
|
|
June 30, 2017 |
|
|
17.55 |
|
|
|
13.45 |
|
|
September 30, 2017 |
|
|
17.74 |
|
|
|
14.62 |
|
|
December 31, 2017 |
|
|
16.19 |
|
|
|
12.61 |
|
|
March 31, 2018 |
|
|
14.35 |
|
|
|
12.24 |
|
At May 22, 2018, there were approximately 524 holders of record of our common stock.
Dividends
We have not declared or paid dividends during the last two years, and our future practice concerning the payment of dividends is uncertain. The payment of future dividends, if any, will be at the discretion of our Board of Directors after taking into account various factors, including without limitation, our credit agreement, operating cash flows, financial condition, operating results, and sufficiency of funds based on our then-current and anticipated cash needs and capital requirements.
Securities Authorized for Issuance Under Equity Compensation Plans
The information included under Item 12 of this Report, "Security Ownership of Certain Beneficial Owners and Management and Related Stockholder Matters," is incorporated herein by reference.
27
The following graph compares the cumulative total returns of our common stock, the NASDAQ Composite Index and the NASDAQ Computer & Data Processing Services Stock Index over the five-year period ended March 31, 2018 assuming $100 was invested on March 31, 2012 with all dividends, if any, reinvested. The returns shown are based on historical results and are not intended to be indicative of future stock prices or future performance. This performance graph shall not be deemed to be “soliciting material” or “filed” for purposes of Section 18 of the Securities Exchange Act of 1934, as amended (the “Exchange Act”) or otherwise subject to the liabilities under that Section and shall not be deemed to be incorporated by reference into any filing of the Company under the Securities Act of 1933, as amended or the Exchange Act.
COMPARISON OF 5 YEAR CUMULATIVE TOTAL RETURN*
Among Quality Systems, Inc., The NASDAQ Composite Index
And The NASDAQ Computer & Data Processing Index
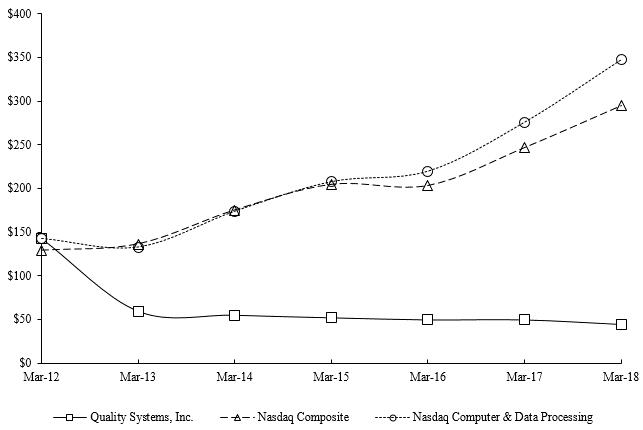
|
* |
$100 invested on March 31, 2012 in stock or index, including reinvestment of dividends. Fiscal year ended March 31. |
28
ITEM 6. SELECTED FINANCIAL DATA
The following selected financial data, with respect to our consolidated statements of net income and comprehensive income data for each of the five years in the period ended March 31, 2018 and the consolidated balance sheets data as of the end of each such fiscal year, are not necessarily indicative of results of future operations and should be read in conjunction with our consolidated financial statements and the related notes thereto and Item 7, "Management’s Discussion and Analysis of Financial Condition and Results of Operations” included elsewhere in this Report.
Consolidated Financial Data
(In thousands, except per share data)
|
|
|
Fiscal Year Ended March 31, |
|
|||||||||||||||||
|
|
|
2018 |
|
|
2017 |
|
|
2016 |
|
|
2015 |
|
|
2014 |
|
|||||
|
Statements of comprehensive income data: |
|
|
|
|
|
|
|
|
|
|
|
|
|
|
|
|
|
|
|
|
|
Revenue |
|
$ |
531,019 |
|
|
$ |
509,624 |
|
|
$ |
492,477 |
|
|
$ |
490,225 |
|
|
$ |
444,667 |
|
|
Cost of revenue |
|
|
241,535 |
|
|
|
223,134 |
|
|
|
225,615 |
|
|
|
223,164 |
|
|
|
220,163 |
|
|
Gross profit |
|
|
289,484 |
|
|
|
286,490 |
|
|
|
266,862 |
|
|
|
267,061 |
|
|
|
224,504 |
|
|
Selling, general and administrative |
|
|
193,226 |
|
|
|
163,623 |
|
|
|
156,234 |
|
|
|
158,172 |
|
|
|
149,214 |
|
|
Research and development costs, net |
|
|
81,259 |
|
|
|
78,341 |
|
|
|
65,661 |
|
|
|
69,240 |
|
|
|
41,524 |
|
|
Amortization of acquired intangible assets |
|
|
7,810 |
|
|
|
10,435 |
|
|
|
5,367 |
|
|
|
3,693 |
|
|
|
4,805 |
|
|
Impairment of assets |
|
|
3,757 |
|
|
|
— |
|
|
|
32,238 |
|
|
|
— |
|
|
|
5,873 |
|
|
Restructuring costs |
|
|
611 |
|
|
|
7,078 |
|
|
|
— |
|
|
|
— |
|
|
|
— |
|
|
Income from operations |
|
|
2,821 |
|
|
|
27,013 |
|
|
|
7,362 |
|
|
|
35,956 |
|
|
|
23,088 |
|
|
Interest income |
|
|
55 |
|
|
|
14 |
|
|
|
428 |
|
|
|
111 |
|
|
|
269 |
|
|
Interest expense |
|
|
(3,323 |
) |
|
|
(3,156 |
) |
|
|
(1,304 |
) |
|
|
(341 |
) |
|
|
— |
|
|
Other income (expense), net |
|
|
37 |
|
|
|
(262 |
) |
|
|
(166 |
) |
|
|
(62 |
) |
|
|
(356 |
) |
|
Income (loss) before provision for income taxes |
|
|
(410 |
) |
|
|
23,609 |
|
|
|
6,320 |
|
|
|
35,664 |
|
|
|
23,001 |
|
|
Provision for (benefit of) income taxes |
|
|
(2,830 |
) |
|
|
5,368 |
|
|
|
663 |
|
|
|
8,332 |
|
|
|
7,321 |
|
|
Net income |
|
$ |
2,420 |
|
|
$ |
18,241 |
|
|
$ |
5,657 |
|
|
$ |
27,332 |
|
|
$ |
15,680 |
|
|
Basic net income per share |
|
$ |
0.04 |
|
|
$ |
0.30 |
|
|
$ |
0.09 |
|
|
$ |
0.45 |
|
|
$ |
0.26 |
|
|
Diluted net income per share |
|
$ |
0.04 |
|
|
$ |
0.29 |
|
|
$ |
0.09 |
|
|
$ |
0.45 |
|
|
$ |
0.26 |
|
|
Basic weighted average shares outstanding |
|
|
63,435 |
|
|
|
61,818 |
|
|
|
60,635 |
|
|
|
60,259 |
|
|
|
59,918 |
|
|
Diluted weighted average shares outstanding |
|
|
63,440 |
|
|
|
62,010 |
|
|
|
61,233 |
|
|
|
60,849 |
|
|
|
60,134 |
|
|
Dividends declared per common share |
|
$ |
— |
|
|
$ |
— |
|
|
$ |
0.525 |
|
|
$ |
0.70 |
|
|
$ |
0.70 |
|
|
|
|
March 31, 2018 |
|
|
March 31, 2017 |
|
|
March 31, 2016 |
|
|
March 31, 2015 |
|
|
March 31, 2014 |
|
|||||
|
Balance sheet data: |
|
|
|
|
|
|
|
|
|
|
|
|
|
|
|
|
|
|
|
|
|
Cash, cash equivalents, and marketable securities |
|
$ |
28,845 |
|
|
$ |
37,673 |
|
|
$ |
36,473 |
|
|
$ |
130,585 |
|
|
$ |
113,801 |
|
|
Working capital |
|
|
7,070 |
|
|
|
18,108 |
|
|
|
45,931 |
|
|
|
100,893 |
|
|
|
124,782 |
|
|
Total assets |
|
|
515,755 |
|
|
|
473,221 |
|
|
|
530,790 |
|
|
|
460,521 |
|
|
|
451,351 |
|
|
Long-term line of credit |
|
|
37,000 |
|
|
|
15,000 |
|
|
|
105,000 |
|
|
|
— |
|
|
|
— |
|
|
Total liabilities |
|
|
192,345 |
|
|
|
168,178 |
|
|
|
261,413 |
|
|
|
176,981 |
|
|
|
156,261 |
|
|
Total shareholders’ equity |
|
|
323,410 |
|
|
|
305,043 |
|
|
|
269,377 |
|
|
|
283,540 |
|
|
|
295,090 |
|
29
ITEM 7. MANAGEMENT’S DISCUSSION AND ANALYSIS OF FINANCIAL CONDITION AND RESULTS OF OPERATIONS
Except for the historical information contained herein, the matters discussed in this management’s discussion and analysis of financial condition and results of operations (“MD&A”), including discussions of our product development plans, business strategies and market factors influencing our results, may include forward-looking statements that involve certain risks and uncertainties. Actual results may differ from those anticipated by us as a result of various factors, both foreseen and unforeseen, including, but not limited to, our ability to continue to develop new products and increase systems sales in markets characterized by rapid technological evolution, consolidation and competition from larger, better-capitalized competitors. Many other economic, competitive, governmental and technological factors could affect our ability to achieve our goals and interested persons are urged to review any risks that may be described in “Item 1A. Risk Factors” as set forth herein, as well as in our other public disclosures and filings with the Securities and Exchange Commission ("SEC").
This MD&A is provided as a supplement to the consolidated financial statements and notes thereto included elsewhere in this Annual Report on Form 10-K ("Report") in order to enhance your understanding of our results of operations and financial condition and should be read in conjunction with, and is qualified in its entirety by, the consolidated financial statements and related notes thereto included elsewhere in this Report. Historical results of operations, percentage margin fluctuations and any trends that may be inferred from the discussion below are not necessarily indicative of the operating results for any future period.
Company Overview
Quality Systems, Inc., known to our clients as NextGen® Healthcare, provides solutions on an integrated platform that enables our clients to target superior clinical and financial outcomes concurrent with improved physician and patient engagement.
Our clients span the ambulatory care market from large multi-specialty to small single specialty practices and include networks of practices such as physician hospital organizations (“PHOs”), management service organizations (“MSOs”), independent physician associations (“IPAs”), accountable care organizations (“ACOs”), ambulatory care centers (“ACCs”), and community health centers(“CHCs”).
At the core of our offerings are industry leading electronic health record (“EHR”) and practice management (“PM”) solutions that support the foundational clinical and financial activities of any ambulatory practice. We strive to enable our clients’ ability to maintain control of their organizational identity and destiny, rather than dictating a technology-driven road map. To meet our clients’ unique, evolving needs, we continue to expand and enrich our core offerings to create a comprehensive platform essential to our client’s success in the new value-based environment. Our platform includes one of the industry’s most recognized suites of vendor-agnostic cloud-based interoperability tools as well as our recently acquired, cloud-based Population Health Management and Analytics platform which allows our clients to cost effectively manage populations of patients – improving outcomes and enhancing the quality of care rendered. Our mobile solution significantly enhances, automates and streamlines physician workflows reducing physician burnout and resulting physician attrition.
We have a history of enhancing our solutions through organic and inorganic activities. Over the last few years, we have entered into strategic transactions to complement and enhance our ambulatory market product portfolio. In October 2015, we divested our former Hospital Solutions division to focus exclusively on the ambulatory market place. In January 2016, we acquired HealthFusion Holdings, Inc. ("HealthFusion"), and its cloud-based EHR/PM. In April 2017, we acquired Entrada, Inc. ("Entrada"), a cloud-based, mobile platform for clinical documentation and collaboration. In August 2017, we acquired EagleDream Health, Inc. (“EagleDream”) and its cloud-based population health analytics, and in January 2018, we acquired Inforth Technologies (“Inforth”) for its specialty-focused clinical content.
Quality Systems, Inc. was incorporated in California in 1974. Our principal offices are located at 18111 Von Karman Ave., Suite 800, Irvine, California, 92612. Our website is located at www.nextgen.com. We operate on a fiscal year ending on March 31.
Critical Accounting Policies and Estimates
The discussion and analysis of our consolidated financial statements and results of operations is based upon our consolidated financial statements, which have been prepared in accordance with accounting principles generally accepted in the United States of America ("GAAP"). The preparation of these consolidated financial statements requires us to make estimates and judgments that affect our reported amounts of assets, liabilities, revenue and expenses, and related disclosures. We base our assumptions, estimates and judgments on historical experience, current trends, and other factors we believe to be reasonable under the circumstances, and we evaluate these estimates on an ongoing basis. On a regular basis, we review the accounting policies and update our assumptions, estimates, and judgments, as needed, to ensure that our consolidated financial statements are presented fairly and in accordance with GAAP. Actual results could differ materially from our estimates under different assumptions or conditions. To the extent that there are material differences between our estimates and actual results, our financial condition or results of operations will be affected.
30
Our significant accounting policies, as described in Note 2, “Summary of Significant Accounting Policies” of our notes to consolidated financial statements included elsewhere in this Report, should be read in conjunction with management’s discussion and analysis of financial condition and results of operations. We believe that the following accounting policies are the most critical to aid in fully understanding and evaluating our reported financial results because application of such policies require significant judgment regarding the effects of matters that are inherently uncertain and that affect our consolidated financial statements.
We generate revenue from sales of licensing rights and subscriptions to our software products, hardware and third party software products, support and maintenance services, revenue cycle management and related services ("RCM"), electronic data interchange and data services (“EDI”), and professional services, such as implementation, training, and consulting performed for clients who use our products.
We generally recognize revenue provided that persuasive evidence of an arrangement exists, fees are considered fixed or determinable, delivery of the product or service has occurred, and collection is considered probable. Revenue from the delivered elements, such as software licenses, are generally recognized upon physical or electronic delivery. In certain transactions where collection is not considered probable, the revenue is deferred until collection occurs. If the fee is not fixed or determinable, then the revenue recognized in each period (subject to application of other revenue recognition criteria) will be the lesser of the aggregate amounts due and payable or the amount of the arrangement fee that would have been recognized if the fees were being recognized using the residual method. We assess whether fees are considered fixed or determinable at the inception of the arrangement and negotiated fees generally are based on a specific volume of products to be delivered and not subject to change based on variable pricing mechanisms, such as the number of units copied or distributed or the expected number of users.
A typical software licensing arrangement may contain multiple elements, such as software licenses, support and maintenance services, and professional services. Revenue from arrangements involving multiple elements is generally allocated to each element using the residual method when evidence of fair value only exists for the undelivered elements. The fair value of an element is based on vendor-specific objective evidence (“VSOE”), which is established based on the price charged when the same element is sold separately or renewed. We generally establish VSOE for the related undelivered elements based on the bell-shaped curve method. VSOE is established on maintenance for certain clients based on stated renewal rates only if the rate is determined to be substantive and falls within our customary pricing practices. VSOE calculations are updated and reviewed on a quarterly or annual basis, depending on the nature of the product or service.
Under the residual method, we defer revenue related to the undelivered elements based on VSOE of fair value of each undelivered element and allocate the remainder of the contract price, net of all discounts, to the delivered elements. If VSOE of fair value of any undelivered element does not exist, all revenue is deferred until VSOE of fair value of the undelivered element is established or the element has been delivered.
Revenue related to arrangements that include hosting services is recognized in accordance to the revenue recognition criteria described above only if the client has the contractual right to take possession of the software at any time without incurring a significant penalty, and it is feasible for the client to either host the software on its own equipment or through another third party. Otherwise, the arrangement is accounted for as a service contract in which the entire arrangement is deferred and recognized over the period that the hosting services are being provided.
From time to time, we offer future purchase discounts on our products and services as part of our arrangements. Such discounts that are incremental to the range of discounts reflected in the pricing of the other elements of the arrangement, that are incremental to the range of discounts typically given in comparable transactions, and that are significant, are assessed as an additional element of the arrangement. Based on our assessments, such discounts are generally not considered to be incremental and significant. Revenue deferred related to incremental and significant future purchase options, if any, are not recognized until either the client exercises the discount offer or the offer expires.
Revenue from professional services, including implementation, training, and consulting services, are generally recognized as the corresponding services are performed. Revenue from software related subscription services and support and maintenance revenue are recognized ratably over the contractual service period. Revenue from EDI and data services and other transaction processing services are recognized at the time the services are provided to clients.
Revenue from RCM and related services is derived from service fees under our RCM arrangements, generally calculated as a percentage of total client collections. Our RCM arrangements include ongoing billing, collections, and other related services, and often may also include other products and services, such as software, software-as-a-service, support and maintenance, and professional services. We recognize RCM and related services revenue at the time collections are made by the client as the services fees are not fixed or determinable until such time.
We record revenue net of sales tax obligation in the consolidated statements of net income and comprehensive income.
31
The amount and timing of revenue recognized in a given period is affected by our judgment as to whether an arrangement includes multiple elements and if so, the allocation of revenue to each element. We generally apply the residual method for the revenue recognition of our multiple element arrangements and estimate the fair value of the undelivered elements based on VSOE. Establishing VSOE on our undelivered elements requires judgment. We establish VSOE for each undelivered element as the price charged when the same element is sold separately and generally evidenced when a substantial majority of historical standalone transactions fall within a reasonably narrow range using the bell-shaped curve method. In our determination of VSOE, we also consider service type, client type, and other variables. Our revenue recognition is based on our ability to maintain VSOE. Although not currently expected, certain events may occur, such as modification to or lack of consistency in our selling and pricing practices that could result in changes to our determination of VSOE. VSOE calculations are updated and reviewed on a quarterly or annual basis, depending on the nature of the product or service.
We also must apply judgment in determining the appropriate timing and recognition of certain revenue deferrals. In certain transactions where collection risk is high, the revenue is deferred until collection occurs. If the fee is not fixed or determinable, then the revenue recognized in each period (subject to application of other revenue recognition criteria) will be the lesser of the aggregate amounts due and payable or the amount of the arrangement fee that would have been recognized if the fees were being recognized using the residual method. We assess whether fees are considered fixed or determinable at the inception of the arrangement and negotiated fees generally are based on a specific volume of products to be delivered and not subject to change based on variable pricing mechanisms, such as the number of units copied or distributed or the expected number of users.
Although we currently believe that our approach to estimates and judgments as described herein is reasonable, actual results could differ and we may be exposed to increases or decreases in revenue that could be material.
Reserves on Accounts Receivable
We maintain reserves for potential sales returns and uncollectible accounts receivable. In aggregate, such reserves reduce our gross accounts receivable to its estimated net realizable value.
Our standard contracts generally do not contain provisions for clients to return products or services. However, we historically have accepted sales returns under certain circumstances. Accordingly, we estimate sales return reserves, including reserves for returns and other credits, based upon our review of customer-specific facts and circumstances, including aged receivable balances, and recognize revenue, net of an allowance for sales returns. If we are unable to estimate the returns, revenue recognition may be delayed until the rights of return period lapses, provided also, that all other criteria for revenue recognition have been met. If we experience changes in practices related to sales returns or changes in actual return rates that deviate from the historical data on which our reserves had been established, our revenues may be adversely affected.
Allowances for doubtful accounts and other uncollectible accounts receivable related to estimated losses resulting from our clients’ inability to make required payments are established based on our historical experience of bad debt expense and the aging of our accounts receivable balances, net of deferred revenue and specifically reserved accounts. Specific reserves are based on our estimate of the probability of collection for certain troubled accounts. Accounts are written off as uncollectible only after we have expended extensive collection efforts.
Our allowances for doubtful accounts are based on our assessment of the collectability of client accounts. We regularly review the adequacy of these allowances by considering internal factors such as historical experience, credit quality and age of the client receivable balances as well as external factors such as economic conditions that may affect a client’s ability to pay and review of major third-party credit-rating agencies, as needed. If a major client’s creditworthiness or financial condition were to deteriorate, if actual defaults are higher than our historical experience, or if other circumstances arise, our estimates of the recoverability of amounts due to us could be overstated, and additional allowances could be required, which could have an adverse impact on our operating results.
Although we currently believe that our approach to estimates and judgments as described herein is reasonable, actual results could differ and we may be exposed to increases or decreases in required reserves that could be material.
Software Development Costs
Software development costs, consisting primarily of employee salaries and benefits, incurred in the research and development of new software products and enhancements to existing software products for external sale are expensed as incurred, and reported as net research and development costs in the consolidated statements of net income and comprehensive income, until technological feasibility has been established. After technological feasibility is established, any additional external software development costs are capitalized. Amortization of capitalized software is recorded using the greater of the ratio of current revenues to the total of current and expected revenues of the related product or the straight-line method over the estimated economic life of the related product, which is typically three years. The total of capitalized software costs incurred in the development of products for external sale are reported as capitalized software costs within our consolidated balance sheets.
32
We also incur costs to develop software applications for our internal-use and costs for the development of software-as-a-service ("SaaS") based products sold to our clients. The development costs of our SaaS-based products are considered internal-use for accounting purposes. Our internal-use capitalized costs are stated at cost and amortized using the straight-line method over the estimated useful lives of the assets, which is typically three to seven years. Application development stage costs generally include costs associated with internal-use software configuration, coding, installation and testing. Costs related to the preliminary project stage and post-implementation activities are expensed as incurred. Costs of significant upgrades and enhancements that result in additional functionality are also capitalized, whereas costs incurred for maintenance and minor upgrades and enhancements are expensed as incurred. Capitalized software costs for developing SaaS-based products are reported as capitalized software costs within our consolidated balance sheets and capitalized software costs for developing our internal-use software applications are reported as equipment and improvements within our consolidated balance sheets.
We periodically reassess the estimated economic life and the recoverability of our capitalized software costs. If a determination is made that capitalized amounts are not recoverable based on the estimated net cash flows to be generated from sales of the applicable software product, the amount by which the unamortized capitalized costs of a software product exceed the net realizable value is written off as a charge to earnings. The net realizable value is the estimated future gross revenues from that product reduced by the estimated future costs of completing and disposing of that product, including the costs of performing maintenance and client support required to satisfy our responsibility at the time of sale.
Although we currently believe that our approach to estimates and judgments as described herein is reasonable, actual results could differ and we may be exposed to increases or decreases in revenue that could be material.
Business Combinations
We completed our acquisition of HealthFusion during the year ended March 31, 2017 and completed our acquisitions of Entrada, EagleDream and Inforth during the year ended March 31, 2018, all of which were accounted for as purchase business combinations using the acquisition method of accounting.
In accordance with the acquisition method of accounting for business combinations, we allocated the purchase price of acquired businesses to the tangible and intangible assets acquired and liabilities assumed based on estimated fair values. Our purchase price allocation methodology contains uncertainties because it requires us to make assumptions and to apply judgment to estimate the fair value of acquired assets and liabilities, including, but not limited to, intangible assets, goodwill, and contingent consideration liabilities. We estimate the fair value of assets and liabilities based upon quoted market prices, the carrying value of the acquired assets and widely accepted valuation techniques, including discounted cash flows and market multiple analyses depending on the nature of the assets being sold. We estimate the fair value of the contingent consideration liabilities based on our projection of expected results, as needed. The process for estimating fair values in many cases requires the use of significant estimates, assumptions and judgments, including determining the timing and estimates of future cash flows and developing appropriate discount rates. Unanticipated events or circumstances may occur which could affect the accuracy of our fair value estimates, including assumptions regarding industry economic factors and business strategies. We expect to finalize the purchase price allocation as soon as practicable within the measurement period, but not later than one year following the acquisition date. Any adjustments to fair value subsequent to the measurement period are reflected in the consolidated statements of net income and comprehensive income.
We currently do not believe there is a reasonable likelihood that there will be a material change in the future estimates or assumptions we use to complete the purchase price allocation and estimate the fair value of acquired assets and liabilities. However, if actual results are not consistent with our estimates or assumptions, we may be exposed to losses or gains that could be material.
Goodwill
Goodwill acquired in a business combination is measured as the excess of the purchase price, or consideration transferred, over the net acquisition date fair values of the assets acquired and the liabilities assumed. Goodwill is not amortized as it has been determined to have an indefinite useful life.
We test goodwill for impairment annually during our first fiscal quarter, referred to as the annual test date. We will also test for impairment between annual test dates if an event occurs or circumstances change that would indicate the carrying amount may be impaired. As part of our annual goodwill impairment test, we first assess qualitative factors to determine whether it is more likely than not that the fair value of a reporting unit is less than its carrying amount. If we conclude that it is more likely than not that the fair value of a reporting unit is less than its carrying amount, we conduct a two-step quantitative goodwill impairment test. The first step of the impairment test involves comparing the fair values of the applicable reporting units with their carrying values. If the carrying amount of the reporting unit exceeds the reporting unit's fair value, we perform the second step of the goodwill impairment test. The second step of the goodwill impairment test involves comparing the implied fair value of the affected reporting unit's goodwill with the carrying value of that goodwill. The amount by which the carrying value of the goodwill exceeds its implied fair value, if any, is recognized as an impairment loss.
33
Application of the goodwill impairment test requires judgment, including the identification of reporting units, assignment of assets and liabilities to reporting units, assignment of goodwill to reporting units, and determination of the fair value of each reporting unit. The fair value of each reporting unit is estimated primarily through the use of a discounted cash flow methodology. This analysis requires significant judgments, including estimation of future cash flows, which is dependent on internal forecasts, estimation of the long-term rate of growth for our business, estimation of the useful life over which cash flows will occur, and determination of our weighted average cost of capital.
The estimates used to calculate the fair value of a reporting unit change from year to year based on operating results, market conditions, and other factors. Changes in these estimates and assumptions could materially affect the determination of fair value and goodwill impairment for each reporting unit.
We currently do not believe there is a reasonable likelihood that there will be a material change in the future estimates or assumptions we use to test for impairment losses on goodwill. However, if actual results are not consistent with our estimates or assumptions, we may be exposed to future impairment charges that could be material.
Intangible Assets
Intangible assets consist of trade names and contracts, customer relationships, and software technology, all of which arose in connection with our acquisitions.
These intangible assets are recorded at fair value and are stated net of accumulated amortization. We currently amortize intangible assets using a method that reflects the pattern in which the economic benefits of the intangible asset are consumed.
Although currently we believe that our approach to estimates and judgments as described herein is reasonable, actual results could differ and we may be exposed to decreases in the fair value of our intangible assets, resulting in impairment charges that could be material. We test intangible assets for impairment if we believe indicators of impairment exist.
During the year ended March 31, 2018, we recorded an impairment of $3.8 million to our acquired trade names intangible assets, which was the result of the elimination of certain legacy brand and trade names due to the launching of our new branding, identity, and corporate logo intended to reflect our expanded health technology portfolio following years of recent acquisitions.
Share-Based Compensation
We record share-based compensation related to our employee stock options plans, employee share purchase plans, restricted stock awards, and restricted performance stock awards and shares. See Note 13, “Share-Based Awards,” of our notes to consolidated financial statements included elsewhere in this Report for a complete discussion of our stock-based compensation plans.
Share-based compensation expense associated with the stock options under our equity incentive plans is based on the number of options that ultimately vest and adjusted, if needed, as forfeitures occur. We estimate the fair value of stock options on the date of grant using the Black Scholes option-pricing model based on required inputs, including expected term, volatility, risk-free rate, and expected dividend yield. Expected term is estimated based upon the historical exercise behavior and represents the period of time that options granted are expected to be outstanding and therefore the proportion of awards that is expected to vest. Volatility is estimated by using the weighted-average historical volatility of our common stock, which approximates expected volatility. The risk-free rate is the implied yield available on the U.S. Treasury zero-coupon issues with remaining terms equal to the expected term. The expected dividend yield is the average dividend rate during a period equal to the expected term of the option. The fair value vest is recognized ratably as expense over the requisite service period in our consolidated statements of net income and comprehensive income.
Share-based compensation expense associated with restricted stock awards is estimated using the market price of the common stock on the date of grant. Share-based compensation expense associated with the restricted performance stock awards and shares is based on the grant date fair value measured at the underlying closing share price on the date of grant using a Monte Carlo-based valuation model.
We currently do not believe there is a reasonable likelihood there will be a material change in the future estimates or assumptions we use to determine share-based compensation expense. However, if actual results are not consistent with our estimates or assumptions, we may be exposed to changes in share-based compensation expense that could be material.
Trends and Events in Our Business
We believe that the trends and events described below have contributed to our consolidated results of operations and may continue to impact our future results.
We believe healthcare is more heavily influenced by regulatory and national health projects than by the cycles of our economy. From 2009 to 2016, many changes in the healthcare industry were driven by the Obama Administration's healthcare reform efforts, which included the Health Information Technology for Economic and Clinical Health portion of the American Recovery and Reinvestment Act of 2009 ("HITECH Act"), the Patient Protection and Affordable Care Act ("ACA"), and the Medicare Access and CHIP Reauthorization Act of 2015 (“MACRA”).
34
Today, while certain aspects of the Trump Administration’s healthcare policy agenda have focused on reversing or amending policies and programs implemented by the Obama Administration, the transition towards a value-based healthcare system is continuing to move forward. As a result, demand for robust electronic health record solutions, as well as new health information technology solutions from bundled billing capabilities to patient engagement and population health management, will continue to accelerate. We believe MACRA may be the most important of these because it permanently changes how ambulatory healthcare providers are reimbursed by Medicare. Further, it offers certainty and a timeline for the market’s move away from volume-based, fee-for-service models to value-based payment models that reward the delivery of lower cost, high quality care.
While we expect to benefit from the increasing demands for greater efficiency as well as government support for increased adoption of electronic health records, the market for physician-based electronic health records software is becoming increasingly saturated while physician group practices are rapidly being consolidated by hospitals, insurance payers and other entities. Hospital software providers are leveraging their position with their hospital clients to gain market share with hospital owned physician practices. Insurance providers and large physician groups are also consolidating physician offices creating additional opportunity for ambulatory software providers like us. Our strategy is to focus on addressing the growing needs of accountable care organizations around interoperability, patient engagements, population health, and data analytics.
We believe that our core strength lies in the central role our software products and services play in the delivery of healthcare by the primary physician in an ambulatory setting. We intend to remain at the forefront of upcoming new regulatory requirements and meaningful use requirements for stimulus payments. We intend to continue the development and enhancement of our software solutions to support healthcare reform, such as MACRA, which promotes the transition from fee-for-service to value-based, pay-for-performance and patient-centric and quality initiatives such as accountable care organizations. Key elements of our future software development will be to expand our interoperability capabilities enhancing the competitiveness of our software offerings, make our products more intuitive and easy to use, and to enhance the capability of our NextGen Office platform to allow us to deliver our software over the cloud to larger ambulatory care practices.
We have a history of enhancing our solutions through organic and inorganic activities. Over the last few years, we have entered into strategic transactions to complement and enhance our ambulatory market product portfolio. In October 2015, we divested our former Hospital Solutions division to focus exclusively on the ambulatory marketplace. In January 2016, we acquired HealthFusion, and their cloud-based EHR/PM; in April 2017, we acquired Entrada, a cloud-based, mobile platform for clinical documentation and collaboration; in August 2017, we acquired EagleDream and their cloud-based population health analytics; and in January 2018, we acquired Inforth for their specialty focused clinical content.
We have made, and intend to continue to make, investments in our infrastructure, including but not limited to maintaining and expanding sales, marketing and product development activities to improve patient care and reduce healthcare costs, providing industry-leading, integrated clinical and administrative healthcare data systems, services, and expertise to clinical, medical, technology, and healthcare business professionals while continuing our strong commitment of service in support of our client satisfaction programs. These investments in our infrastructure will continue while maintaining reasonable expense discipline. We strive to add new clients and expand our relationship with existing clients through delivery of add-on and complementary products and services and believe that our client base that is using our products and services on a daily basis is a strategic asset. We intend to leverage this strategic asset by expanding our product and service offerings towards this client base.
Led by our vision and mission, we are resetting our strategy and structure to deliver value to our clients. To achieve a lower-cost, increased capability structure, our new management team is building what we believe is an aligned, client-focused organization, supported by a recurring revenue stream and a large and diverse existing client base.
35
The following table sets forth the percentage of revenue represented by each item in our consolidated statements of net income and comprehensive income for the years ended March 31, 2018, 2017, and 2016 (certain percentages below may not sum due to rounding):
|
|
|
Fiscal Year Ended March 31, |
|
|||||||||
|
|
|
2018 |
|
|
2017 |
|
|
2016 |
|
|||
|
Revenues: |
|
|
|
|
|
|
|
|
|
|
|
|
|
Software license and hardware |
|
|
10.5 |
% |
|
|
12.9 |
% |
|
|
14.3 |
% |
|
Software related subscription services |
|
|
18.7 |
|
|
|
17.1 |
|
|
|
11.2 |
|
|
Total software, hardware and related |
|
|
29.2 |
|
|
|
29.9 |
|
|
|
25.6 |
|
|
Support and maintenance |
|
|
30.8 |
|
|
|
31.2 |
|
|
|
33.5 |
|
|
Revenue cycle management and related services |
|
|
15.8 |
|
|
|
16.2 |
|
|
|
16.9 |
|
|
Electronic data interchange and data services |
|
|
17.5 |
|
|
|
17.5 |
|
|
|
16.7 |
|
|
Professional services |
|
|
6.7 |
|
|
|
5.2 |
|
|
|
7.3 |
|
|
Total revenues |
|
|
100.0 |
|
|
|
100.0 |
|
|
|
100.0 |
|
|
Cost of revenue: |
|
|
|
|
|
|
|
|
|
|
|
|
|
Software license and hardware |
|
|
4.1 |
|
|
|
4.8 |
|
|
|
5.6 |
|
|
Software related subscription services |
|
|
8.4 |
|
|
|
7.2 |
|
|
|
5.4 |
|
|
Total software, hardware and related |
|
|
12.5 |
|
|
|
12.0 |
|
|
|
11.0 |
|
|
Support and maintenance |
|
|
5.6 |
|
|
|
5.6 |
|
|
|
6.4 |
|
|
Revenue cycle management and related services |
|
|
11.5 |
|
|
|
11.1 |
|
|
|
11.7 |
|
|
Electronic data interchange and data services |
|
|
10.2 |
|
|
|
10.0 |
|
|
|
10.2 |
|
|
Professional services |
|
|
5.7 |
|
|
|
5.1 |
|
|
|
6.6 |
|
|
Total cost of revenue |
|
|
45.5 |
|
|
|
43.8 |
|
|
|
45.8 |
|
|
Gross profit |
|
|
54.5 |
|
|
|
56.2 |
|
|
|
54.2 |
|
|
Operating expenses: |
|
|
|
|
|
|
|
|
|
|
|
|
|
Selling, general and administrative |
|
|
36.4 |
|
|
|
32.1 |
|
|
|
31.7 |
|
|
Research and development costs, net |
|
|
15.3 |
|
|
|
15.4 |
|
|
|
13.3 |
|
|
Amortization of acquired intangible assets |
|
|
1.5 |
|
|
|
2.0 |
|
|
|
1.1 |
|
|
Impairment of assets |
|
|
0.7 |
|
|
|
0.0 |
|
|
|
6.5 |
|
|
Restructuring costs |
|
|
0.1 |
|
|
|
1.4 |
|
|
|
0.0 |
|
|
Total operating expenses |
|
|
54.0 |
|
|
|
50.9 |
|
|
|
52.7 |
|
|
Income from operations |
|
|
0.5 |
|
|
|
5.3 |
|
|
|
1.5 |
|
|
Interest income |
|
|
0.0 |
|
|
|
0.0 |
|
|
|
0.1 |
|
|
Interest expense |
|
|
(0.6 |
) |
|
|
(0.6 |
) |
|
|
(0.3 |
) |
|
Other income (expense), net |
|
|
0.0 |
|
|
|
(0.1 |
) |
|
|
0.0 |
|
|
Income (loss) before provision for (benefit of) income taxes |
|
|
(0.1 |
) |
|
|
4.6 |
|
|
|
1.3 |
|
|
Provision for (benefit of) income taxes |
|
|
(0.5 |
) |
|
|
1.1 |
|
|
|
0.1 |
|
|
Net income |
|
|
0.5 |
% |
|
|
3.6 |
% |
|
|
1.1 |
% |
Revenues
The following table presents our consolidated revenues for the years ended March 31, 2018, 2017, and 2016 (in thousands):
|
|
|
Fiscal Year Ended March 31, |
|
|||||||||
|
|
|
2018 |
|
|
2017 |
|
|
2016 |
|
|||
|
Revenues: |
|
|
|
|
|
|
|
|
|
|
|
|
|
Software license and hardware |
|
$ |
55,576 |
|
|
$ |
65,547 |
|
|
$ |
70,523 |
|
|
Software related subscription services |
|
|
99,547 |
|
|
|
87,050 |
|
|
|
55,403 |
|
|
Total software, hardware and related |
|
|
155,123 |
|
|
|
152,597 |
|
|
|
125,926 |
|
|
Support and maintenance |
|
|
163,805 |
|
|
|
158,803 |
|
|
|
165,200 |
|
|
Revenue cycle management and related services |
|
|
83,996 |
|
|
|
82,552 |
|
|
|
83,006 |
|
|
Electronic data interchange and data services |
|
|
92,773 |
|
|
|
88,951 |
|
|
|
82,343 |
|
|
Professional services |
|
|
35,322 |
|
|
|
26,721 |
|
|
|
36,002 |
|
|
Total revenues |
|
$ |
531,019 |
|
|
$ |
509,624 |
|
|
$ |
492,477 |
|
36
We generate revenue from sales of licensing rights and subscriptions to our software products, hardware and third party software products, support and maintenance services, revenue cycle management and related services ("RCM"), electronic data interchange and data services (“EDI”), and professional services, such as implementation, training, and consulting performed for clients who use our products.
Consolidated revenue for the year ended March 31, 2018 increased $21.4 million compared to the prior year, consisting of a $12.5 million increase in software related subscription services, $8.6 million increase in professional services, $5.0 million increase in support and maintenance, $3.8 million increase in EDI, and $1.4 million increase in RCM, offset by a $10.0 million decrease in software licenses and hardware. Software related subscription services increased primarily due to higher sales of our NextGen Office cloud-based subscriptions, and incremental sales of our NextGen Mobile and NextGen Population Health cloud-based solutions acquired from Entrada in April 2017 and EagleDream in August 2017. Software related subscription services also benefit from higher sales of our hosting services, Patient Portal, interoperability solutions, and QSIDental Web offerings as we continue to expand our client base. The increase in professional services is mostly associated with transcription and editing services from our acquisition of Entrada, offset by lower sales of professional services due to lower client demand for our core software products and related implementation, training, and consulting services. The increase in support and maintenance is primarily due to lower sales credits in the current year, addition of new customers, and the impact of our annual price increases. EDI revenue increased due to higher EDI services sold with our NextGen Office cloud-based solutions and growth in EDI transaction volume due to the addition of new clients and further penetration of our existing client base. RCM services revenue increased from the addition of new clients and organic growth achieved through cross selling and ramping up of RCM services provided to our existing clients, offset by customer attrition. The decline in software license and hardware reflects lower recent bookings associated with the increasingly saturated end-market for electronic health records software and our transition to a recurring subscription-based model.
Consolidated revenue for the year ended March 31, 2017 increased $17.1 million compared to the year ended March 31, 2016 mostly to a $31.6 million increase in software related subscription services and $6.6 million increase in EDI, partially offset by a $9.3 million decrease in professional services, $6.4 million decrease in support and maintenance, $5.0 million decrease in software license and hardware, and $0.5 million decrease in RCM. The increase in software related subscription services was primarily driven by a full year of sales related to the NextGen Office cloud-based solution acquired from HealthFusion in January 2016, combined with growth in subscriptions related to our interoperability, Patient Portal, and QSIDental Web product offerings as we continue to expand our client base. The increase in EDI is partially attributed to the acquisition of HealthFusion and growth in EDI transaction volume due to addition of new clients and further penetration of our existing client base. The decline in software license and hardware revenue was mostly caused by a shift in market dynamics toward cloud-based solutions and away from perpetual license arrangements, which has also resulted in lower demand for our professional services, including implementation, training, and consulting services. The decline in support and maintenance is due primarily to the disposition of the former Hospital Solutions division in October 2015, which accounted for $5.3 million of the decrease, and net attrition in products sold with accompanying maintenance. The lower RCM revenue is due to customer attrition and a decline in new bookings.
Recurring service revenue, consisting of software related subscription services, support and maintenance, RCM, and EDI, represented 83%, 82%, and 78% of total revenue for the years ended March 31, 2018, 2017, and 2016, respectively.
Our goals include further enhancement of our existing products, including expansion of our software and service offerings that support pay-for-performance initiatives around accountable care organizations, bringing greater ease of use and intuitiveness to our software products, enhancing our managed cloud and hosting services to lower our clients' total cost of ownership, expanding our interoperability and enterprise analytics capabilities, and further development and enhancements of our portfolio of specialty focused templates within our electronic health records software.
We intend to remain at the forefront of upcoming new regulatory requirements, including meaningful use requirements for stimulus payments and recent healthcare reform that is driving the transition towards pay-for-performance, value-based reimbursement models. We believe that the expanded requirements for continued eligibility for incentive payments under meaningful use rules will result in an expanded replacement market for electronic health records software. We also intend to continue selling additional software and services to existing clients, expanding penetration of connectivity and other services to new and existing clients, and capitalizing on growth and cross selling opportunities. We continue to expand our client base and cloud-based solution capabilities in the ambulatory market to meet the needs of practices of increasing size and complexity, and focus our strategy on accountable care organizations around interoperability, patient engagements, population health and collaborative care management, and enterprise analytics. Our software and service offerings offer clients a full suite of cloud-based solutions that better enable our clients to focus on care delivery. We believe we are well-positioned within the evolving healthcare market to deliver products and services that address the growing importance of quality collaborative care and shift from fee-for-service to value-based, pay-for-performance care. We also believe that a significant opportunity exists to continue cross selling RCM services to our existing clients as the portion of existing clients who are using RCM services is approximately 10%. We are actively pursuing efforts to achieve faster growth from expanded efforts to leverage our existing sales force towards selling RCM services. We also believe that ongoing increases in the complexity of medical billing and collections processes, including the migration to value-based reimbursement models, will create additional opportunities.
While it remains difficult to assess the relative impact or the timing of positive and negative trends affecting the aforementioned market opportunities, we believe we are well positioned to remain a leader in serving the evolving market needs for healthcare information technology. We believe that our operating results are attributed to a strong brand name and reputation within the marketplace for healthcare information technology software and services and investments in sales and marketing activities, including new marketing campaigns, internet advertising investments, tradeshow attendance and other expanded advertising and marketing expenditures.
37
The following table presents our consolidated cost of revenue and gross profit for the years ended March 31, 2018, 2017, and 2016 (in thousands):
|
|
|
Fiscal Year Ended March 31, |
|
|||||||||
|
|
|
2018 |
|
|
2017 |
|
|
2016 |
|
|||
|
Total cost of revenue |
|
$ |
241,535 |
|
|
$ |
223,134 |
|
|
$ |
225,615 |
|
|
Gross profit |
|
|
289,484 |
|
|
|
286,490 |
|
|
|
266,862 |
|
|
Gross margin % |
|
|
54.5 |
% |
|
|
56.2 |
% |
|
|
54.2 |
% |
Cost of revenue consists primarily of compensation expense, including share-based compensation, for personnel that deliver our products and services. Cost of revenue also includes amortization of capitalized software costs and acquired technology, third party consultant and outsourcing costs, costs associated with our EDI business partners and clearinghouses, hosting service costs, third party software costs and royalties, and other costs directly associated with delivering our products and services. Refer to Note 7, "Intangible Assets" and Note 8, "Capitalized Software Costs" of our notes to consolidated financial statements included elsewhere in this Report for additional information on current period amortization of capitalized software costs and acquired technology and an estimate of future expected amortization.
Share-based compensation expense included in cost of revenue was $0.9 million, $0.5 million, and $0.4 million for the years ended March 31, 2018, 2017, and 2016, respectively, and is included in the amounts in the table above.
Gross profit for the year ended March 31, 2018 increased $3.0 million compared to the prior year due primarily to the $21.4 million higher revenues discussed above, combined with an increase of $18.4 million in cost of revenue. The increase in cost of revenue is primarily the result of higher costs associated with the acquisitions of Entrada in April 2017 and EagleDream in August 2017, higher amortization of the software technology intangible assets associated with our recent acquisitions, higher EDI vendor costs associated with higher transaction volumes, and higher personnel costs associated with delivering our support and maintenance and RCM services, partially offset by lower amortization of previously capitalized software development cost. The decrease in our gross margin percentage to 54.5% for the year ended March 31, 2018 compared to 56.2% in the prior year period primarily reflects the decline in our high margin software revenue as noted above, partially offset by improvements in the profitability of our professional services driven by the growth in sales described above.
Gross profit for the year ended March 31, 2017 increased $19.6 million compared to the year ended March 31, 2016 primarily to the higher revenues as discussed above, combined with a decrease of $2.5 in cost of revenue. Cost of revenue decreased due to lower payroll costs associated with delivering support and maintenance and professional services and lower amortization of previously capitalized software development costs that became fully amortized during the year, partially offset by higher amortization of the software technology intangible asset acquired from HealthFusion. The increase in the gross margin percentage to 56.2% for the year ended March 31, 2017 compared to 54.2% in the prior year period primarily reflects higher profitability related to sales of the NextGen Office cloud-based solution acquired from HealthFusion in January 2016, offset by lower profitability of professional services as the demand for such services have declined at a quicker pace than the associated payroll costs.
Selling, General and Administrative Expense
The following table presents our consolidated selling, general and administrative expense for the years ended March 31, 2018, 2017, and 2016 (in thousands):
|
|
|
Fiscal Year Ended March 31, |
|
|||||||||
|
|
|
2018 |
|
|
2017 |
|
|
2016 |
|
|||
|
Selling, general and administrative |
|
$ |
193,226 |
|
|
$ |
163,623 |
|
|
$ |
156,234 |
|
|
Selling, general and administrative, as a percentage of revenue |
|
|
36.4 |
% |
|
|
32.1 |
% |
|
|
31.7 |
% |
Selling, general and administrative expense consist of compensation expense, including share-based compensation, for management and administrative personnel, selling and marketing expense, facilities costs, depreciation, professional service fees, including legal and accounting services, legal settlements, acquisition and transaction-related costs, and other general corporate and administrative expenses.
Share-based compensation expense included in selling, general and administrative expenses was $9.2 million, $6.1 million, and $2.6 million for the years ended March 31, 2018, 2017, and 2016, respectively, and is included in the amounts in the table above. The increase in share-based compensation expense for the year ended March 31, 2018 compared to the prior year is due to increased utilization of share-based awards to incentivize our executives and employees. Refer to Note 13, "Share-Based Awards" of our notes to consolidated financial statements included elsewhere in this Report for additional information on equity award grants.
Selling, general and administrative expenses increased $29.6 million for the year ended March 31, 2018 compared to the prior year primarily due to higher incremental costs associated with our acquisitions of Entrada in April 2017 EagleDream Health in August 2017, higher personnel costs, including share-based compensation, higher advertising and marketing expense related
38
to our rebranding efforts, higher consulting costs associated with our adoption of the new revenue standard (ASC 606, Revenue From Contracts With Customers), including implementation of a new accounting system module, higher legal expense, and accrual of $19.0 million for the preliminary settlement of the Federal Securities Class Action complaint (refer to Note 14, “Commitments, Guarantees and Contingencies” of our notes to consolidated financial statements included elsewhere in this Report for additional information), offset by $3.8 million of fair value adjustments related to the HealthFusion contingent consideration recorded in the prior year period.
Selling, general and administrative expenses increased $7.4 million for the year ended March 31, 2017 compared to the prior year primarily due to higher incremental costs associated with HealthFusion acquired in January 2016, higher legal expense related to shareholder litigation, partially offset by lower payroll costs associated with our reorganization efforts and lower acquisition costs.
Research and Development Costs, net
The following table presents our consolidated net research and development costs, capitalized software costs, and gross expenditures prior to capitalization, for the years ended March 31, 2018, 2017, and 2016 (in thousands):
|
|
|
Fiscal Year Ended March 31, |
|
|||||||||
|
|
|
2018 |
|
|
2017 |
|
|
2016 |
|
|||
|
Gross expenditures |
|
$ |
100,124 |
|
|
$ |
86,590 |
|
|
$ |
80,336 |
|
|
Capitalized software costs |
|
|
(18,865 |
) |
|
|
(8,249 |
) |
|
|
(14,675 |
) |
|
Research and development costs, net |
|
$ |
81,259 |
|
|
$ |
78,341 |
|
|
$ |
65,661 |
|
|
|
|
|
|
|
|
|
|
|
|
|
|
|
|
Research and development costs, as a percentage of revenue |
|
|
15.3 |
% |
|
|
15.4 |
% |
|
|
13.3 |
% |
|
Capitalized software costs as a percentage of gross expenditures |
|
|
18.8 |
% |
|
|
9.5 |
% |
|
|
18.3 |
% |
Gross research and development expenditures, including costs expensed and costs capitalized, consist of compensation expense, including share-based compensation for research and development personnel, certain third-party consultant fees, software maintenance costs, and other costs related to new product development and enhancement to our existing products. We intend to continue to invest heavily in research and development expenses as we continue to bring additional functionality and features to the medical community and develop a new integrated inpatient and outpatient, web-based software platform.
The capitalization of software development costs results in a reduction to our reported net research and development costs. Our software capitalization rate, or capitalized software costs as a percentage of gross expenditures, has varied historically and may continue to vary based on the nature and status of specific projects and initiatives in progress. Although changes in software capitalization rates have no impact on our overall cash flows, it results in fluctuations in the amount of software development costs being expensed up front and the amount of net research and development costs reported in our consolidated statement of net income and comprehensive income.
Share-based compensation expense included in research and development costs was $2.0 million, $1.0 million, and $0.3 million for the years ended March 31, 2018, 2017, and 2016, respectively, and is included in the amounts in the table above.
Net research and development costs for the year ended March 31, 2018 increased $2.9 million compared to the prior year due to a $13.5 million increase in our gross expenditures, offset by $10.6 million in higher capitalization of software costs. The increase in both gross expenditures and capitalization of software costs are related to the development of the next major versions of our core software products and enhancements to our existing products, for which we incurred a higher level of personnel and third party development costs. Additionally, gross expenditures increased due to incremental costs associated with the acquisition of Entrada in April 2017 and growth in our research and development headcount.
Net research and development costs for the year ended March 31, 2017 increased $12.7 million compared to the year ended March 31, 2016 due to a $6.3 million increase in our gross expenditures, combined with a $6.4 million decrease in capitalized software costs. The increase in gross expenditures is primarily the result of incremental costs from HealthFusion and higher costs related to development of the next versions of our software products, partially offset by lower gross expenditures from the discontinuation of the former NextGen Now development project during the fourth quarter of fiscal 2016 and lower personnel costs associated with our reorganization efforts. The reduction in capitalized software costs and rate of software capitalization is primarily due to the discontinuation of the former NextGen Now development project and the recent releases of the next major version of our core software products.
Our software capitalization rate fluctuates due to differences in the nature and status of our projects and initiatives during a given year, which affects the amount of development costs that may be capitalized.
39
Amortization of Acquired Intangible Assets
The following table presents our amortization of acquired intangible assets for the years ended March 31, 2018, 2017, and 2016 (in thousands):
|
|
|
Fiscal Year Ended March 31, |
|
|||||||||
|
|
|
2018 |
|
|
2017 |
|
|
2016 |
|
|||
|
Amortization of acquired intangible assets |
|
$ |
7,810 |
|
|
$ |
10,435 |
|
|
$ |
5,367 |
|
Amortization of acquired intangible assets included in operating expense consist of the amortization related to our customer relationships, trade name, and contracts intangible assets acquired as part of our business combinations. Refer to Note 7, "Intangible Assets" of our notes to consolidated financial statements included elsewhere in this Report for an estimate of future expected amortization.
Amortization of acquired intangible assets for the year ended March 31, 2018 decreased $2.6 million, compared to the prior year period due to certain acquired intangible assets being fully amortized during the year, partially offset by the incremental amortization associate with intangible assets acquired from Inforth, EagleDream and Entrada.
Amortization of acquired intangible assets for the year ended March 31, 2017 increased $5.1 million, compared to the year ended March 31, 2016 period due to additional amortization of the customer relationships and trade name intangible assets related to the acquisition of HealthFusion.
Impairment of Assets
During the year ended March 31, 2018, we recorded an impairment of $3.8 million to our acquired trade names intangible assets that is reflected within the impairment of assets caption in our consolidated statements of net income and comprehensive income. The impairment was the result of the elimination of certain legacy brand and trade names due to the launching of our new branding, identity, and corporate logo intended to reflect our expanded health technology portfolio following years of recent acquisitions.
Restructuring Costs
During the year ended March 31, 2017, as part of our corporate restructuring plan, we recorded $7.1 million of restructuring costs within operating expenses in our consolidated statements of net income and comprehensive income. The restructuring costs consisted primarily of payroll-related costs, such as severance, outplacement costs, and continuing healthcare coverage, associated with the involuntary separation of employees pursuant to a one-time benefit arrangement, which were accrued when it was probable that the benefits would be paid and the amounts were reasonably estimable. The restructuring plan was substantially complete by the end of fiscal 2017. Refer to Note 15, "Restructuring Plan" of our notes to consolidated financial statements included elsewhere in this Report for additional information.
Also included in restructuring costs were certain facilities-related costs associated with accruals for the remaining lease obligations at certain locations, including Solana Beach, Costa Mesa, and a portion of Horsham with contractual lease terms ending between January 2018 and September 2023. We have vacated each of the locations or portions thereof and are actively marketing the locations for sublease. We estimated the remaining lease obligations at fair value as of the cease-use date for each location based on the future contractual lease obligations, reduced by projected sublease rentals that could be reasonably obtained for the locations after a period of marketing, and adjusted for the effect deferred rents that have been recognized under the lease. The effect of discounting future cash flows using a credit-adjusted risk free rate was not significant. Sublease income and commencement dates were estimated based on data available from rental activity in the local markets. Significant judgment was required to estimate the remaining lease obligations at fair value and actual results could vary from the estimates, resulting in potential future adjustments to amounts previously recorded. For the year ended March 31, 2018, we recorded $0.6 million of restructuring costs related to adjustments to the estimated fair value of remaining lease obligations. As of March 31, 2018 and March 31, 2017, the remaining lease obligation, net of estimated projected sublease rentals, was $1.6 million and $2.3 million, respectively. Refer to Note 14, "Commitments, Guarantees, and Contingencies," of our notes to consolidated financial statements included elsewhere in this Report for estimated timing of payments related to remaining lease obligations.
Interest Expense
The following table presents our interest expense for the years ended March 31, 2018, 2017, and 2016 (in thousands):
|
|
|
Fiscal Year Ended March 31, |
|
|||||||||
|
|
|
2018 |
|
|
2017 |
|
|
2016 |
|
|||
|
Interest expense |
|
|
(3,323 |
) |
|
|
(3,156 |
) |
|
|
(1,304 |
) |
40
Interest expense relates to our revolving credit agreement and the related amortization of deferred debt issuance costs. Refer to Note 9, “Line of Credit” of our notes to consolidated financial statements included elsewhere in this Report for additional information.
Interest expense for the year ended March 31, 2018 increased $0.2 million compared to the prior year. Interest expense for the year ended March 31, 2017 increased $1.9 million compared to the year ended March 31, 2016. The changes in interest expense is primarily caused by fluctuations in outstanding balances under our revolving credit agreement and the related amortization of debt issuance costs.
As of March 31, 2018, we had $37.0 million in outstanding loans under the revolving credit agreement.
Provision for (Benefit of) Income Taxes
The following table presents our provision for (benefit of) income taxes for the years ended March 31, 2018, 2017, and 2016 (in thousands):
|
|
|
Fiscal Year Ended March 31, |
|
|||||||||
|
|
|
2018 |
|
|
2017 |
|
|
2016 |
|
|||
|
Provision for (benefit of) income taxes |
|
$ |
(2,830 |
) |
|
$ |
5,368 |
|
|
$ |
663 |
|
|
Effective tax rate |
|
|
690.2 |
% |
|
|
22.7 |
% |
|
|
10.5 |
% |
The change in the effective tax rate for the year ended March 31, 2018 compared to the prior year period was driven primarily by the decrease in pre-tax income for the current year. The year ended March 31, 2018 also benefitted from an increase in the research and development tax credit, the release of uncertain tax position reserves, and a benefit from the lower federal tax rate. These were partially offset by a one-time revaluation of deferred taxes and a foreign transition tax resulting from tax reform legislation enacted on December 22, 2017.
We continue to fully assess the impact of the new tax reform legislation, that was enacted December 22, 2017, on our future taxes and on our consolidated financial statements. We have recorded the provisional impacts of the new tax reform legislation as of March 31, 2018 based on our most reasonable estimates. Our estimated impacts of the new tax reform legislation are based on our current knowledge, interpretation, and assumptions, and the recognized impacts could be materially different from current estimates based on our future results, actions taken by us, the issuance of further guidance, and our further analysis of the new tax reform legislation. Refer to Note 11, "Income Taxes" of our notes to consolidated financial statements included elsewhere in this Report for more information.
The effective tax rate for the year ended March 31, 2017 increased compared to the prior year primarily because the lower income before taxes in the prior year caused the rate reconciling items to have a more significant impact to the effective tax rate.
Net Income
The following table presents our net income (in thousands) and net income per share and for the years ended March 31, 2018, 2017, and 2016:
|
|
|
Fiscal Year Ended March 31, |
|
|||||||||
|
|
|
2018 |
|
|
2017 |
|
|
2016 |
|
|||
|
Net income |
|
$ |
2,420 |
|
|
$ |
18,241 |
|
|
$ |
5,657 |
|
|
Net income per share: |
|
|
|
|
|
|
|
|
|
|
|
|
|
Basic |
|
$ |
0.04 |
|
|
$ |
0.30 |
|
|
$ |
0.09 |
|
|
Diluted |
|
$ |
0.04 |
|
|
$ |
0.29 |
|
|
$ |
0.09 |
|
As a result of the foregoing changes in revenue and expense, net income for the fiscal year ended March 31, 2018 decreased $15.8 million compared to the prior year period.
As a result of the foregoing changes in revenue and expense, net income for the fiscal year ended March 31, 2017 increased $12.6 million compared to the prior year period.
41
Liquidity and Capital Resources
The following table presents selected financial statistics and information for the years ended March 31, 2018, 2017, and 2016 (in thousands):
|
|
|
Fiscal Year Ended March 31, |
|
|||||||||
|
|
|
2018 |
|
|
2017 |
|
|
2016 |
|
|||
|
Cash and cash equivalents |
|
$ |
28,845 |
|
|
$ |
37,673 |
|
|
$ |
36,473 |
|
|
Unused portion of revolving credit agreement (1) |
|
|
263,000 |
|
|
|
235,000 |
|
|
|
145,000 |
|
|
Total liquidity |
|
$ |
291,845 |
|
|
$ |
272,673 |
|
|
$ |
181,473 |
|
|
|
|
|
|
|
|
|
|
|
|
|
|
|
|
Net income |
|
$ |
2,420 |
|
|
$ |
18,241 |
|
|
$ |
5,657 |
|
|
Net cash provided by operating activities |
|
$ |
76,586 |
|
|
$ |
110,592 |
|
|
$ |
40,796 |
|
|
(1) |
As of March 31, 2018, we had outstanding borrowings of $37.0 million under our $300.0 million revolving credit agreement. |
Our principal sources of liquidity are our cash generated from operations, driven mostly by our net income and working capital management, our cash and cash equivalents, and our revolving credit agreement.
Cash and Cash Equivalents
As of March 31, 2018, our cash and cash equivalents balance of $28.8 million compares to $37.7 million as of March 31, 2017. This decrease primarily reflects $62.9 million of net cash paid for the acquisitions of Entrada, EagleDream and Inforth, which were partially funded by $50.0 million of additional borrowings under our revolving credit agreement, $28.0 million of principal repayments, and payment of $18.8 million to settle the contingent consideration liability related to the acquisition of HealthFusion, offset by $76.6 million of cash from operations. During the upcoming fiscal year ended March 31, 2019, we expect to pay approximately $19.0 million for the preliminary settlement of the Federal Securities Class Action complaint (refer to Note 14, “Commitments, Guarantees and Contingencies” of our notes to consolidated financial statements included elsewhere in this Report for additional information), which we expect to be partially offset by related insurance proceeds.
Our outstanding borrowings under our revolving credit agreement was $37.0 million as of March 31, 2018.
We may continue to use a portion of our funds as well as available financing from our revolving credit agreement for future acquisitions or other similar business activities, although the specific timing and amount of funds to be used is not currently determinable. We intend to expend some of our available funds for the development of products complementary to our existing product line as well as new versions of certain of our products. These developments are intended to take advantage of more powerful technologies and to increase the integration of our products.
Our investment policy is determined by our Board of Directors. Excess cash, if any, may be invested in very liquid short term assets including tax exempt and taxable money market funds, certificates of deposit and short term municipal bonds with average maturities of 365 days or less at the time of purchase. Our Board of Directors continues to review alternate uses for our cash including an expansion of our investment policy and other items. Any or all of these programs could significantly impact our investment income in future periods.
We believe that our cash and cash equivalents and marketable securities on hand at March 31, 2018, together with our cash flows from operations and liquidity provided by our revolving credit agreement, will be sufficient to meet our working capital and capital expenditure requirements for the next twelve months.
Cash Flows from Operating Activities
The following table summarizes our consolidated statements of cash flows for the years ended March 31, 2018, 2017, and 2016 (in thousands):
|
|
|
Year Ended March 31, |
|
|||||||||
|
|
|
2018 |
|
|
2017 |
|
|
2016 |
|
|||
|
Net income |
|
$ |
2,420 |
|
|
$ |
18,241 |
|
|
$ |
5,657 |
|
|
Non-cash expenses |
|
|
64,833 |
|
|
|
62,147 |
|
|
|
81,013 |
|
|
Cash from net income, as adjusted |
|
$ |
67,253 |
|
|
$ |
80,388 |
|
|
$ |
86,670 |
|
|
Change in deferred revenue |
|
|
847 |
|
|
|
(5,493 |
) |
|
|
(8,390 |
) |
|
Change in accounts receivable |
|
|
(5,409 |
) |
|
|
5,535 |
|
|
|
9,929 |
|
|
Change in other assets and liabilities |
|
|
13,895 |
|
|
|
30,162 |
|
|
|
(47,413 |
) |
|
Net cash provided by operating activities |
|
$ |
76,586 |
|
|
$ |
110,592 |
|
|
$ |
40,796 |
|
For the year ended March 31, 2018, cash provided by operating activities decreased $34.0 million compared to the prior year period. The decrease in cash flows was primarily due to $16.3 million in changes to other assets and liabilities, as noted in the table above, of which $43.3 million was associated with changes in income taxes receivable and payable, offset by an accrual
42
of $19.0 million for a preliminary settlement of the Federal Securities Class Action complaint (refer to Note 14, “Commitments, Guarantees and Contingencies” of our notes to consolidated financial statements included elsewhere in this Report for additional information), and higher deferred rents and accruals for remaining lease obligations of our vacated properties. Net cash provided from net income, as adjusted for non-cash expenses, decreased $13.1 million primarily due to higher non-cash expenses during the year ended March 31, 2018, offset by a $15.8 million decrease in net income. The increase in non-cash expenses was driven by changes in deferred taxes, higher share-based compensation, and impairment of assets recorded during the year ended March 31, 2018, offset by lower amortization of previously capitalized software costs, and lower non-cash expense associated with changes in the fair value of contingent consideration liabilities.
For the year ended March 31, 2017, cash provided by operating activities increased $69.8 million compared to the year ended March 31, 2016. The increase in cash flows was primarily due to $77.6 million changes other assets and liabilities, as noted in the table above, of which $75.2 million was associated with changes in income taxes receivable and payable. Net cash provided from net income, as adjusted for non-cash expenses, decreased $6.3 million because the increase of $12.6 million in net income was offset by $18.9 million lower non-cash expenses. The decrease in non-cash expenses was due to a non-cash impairment charge of $32.2 million related to the discontinuation of the former NGNow development project recorded in the prior year, partially offset by higher amortization of intangibles associated with the acquisition of HealthFusion. Refer to the "Net Income" section above for additional details regarding the fluctuations in net income. Cash provided by operating activities increased $5.5 million due to an overall decline in accounts receivable from prior year as a result of higher current year collections and aggressive working capital management, which was offset by a $5.5 million associated with a decline in deferred revenue caused by lower system sales and a shift in market dynamics toward cloud-based solutions.
Cash Flows from Investing Activities
Net cash used in investing activities for the years ended March 31, 2018, 2017, and 2016 was $91.5 million, $11.4 million, and $190.4 million, respectively. The $80.1 million net increase in cash used in investing activities for the year ended March 31, 2018 compared to the prior year is primarily due to $62.9 million of cash paid (net of cash acquired) for the acquisitions of Entrada, EagleDream and Inforth, $10.6 million increase in additions to capitalized software associated with the development of new products and enhancement of existing products, $9.3 million lower proceeds from sales of marketable securities, offset by a $2.4 million decrease in additions to equipment and improvements.
The $179.0 million net decrease in cash used in investing activities for the year ended March 31, 2017 compared to the year ended March 31, 2016 is primarily due to $163.8 million of cash paid (net of cash acquired) for the acquisition of HealthFusion in January 2016, $7.1 million higher net proceeds from sales of marketable securities used to make principal payments on our revolving line of credit, $6.4 million decrease in additions to capitalized software associated with the discontinuation of the former NextGen Now development project, and $1.8 million decrease in additions to equipment and improvements.
Cash Flows from Financing Activities
Net cash provided by financing activities for the year ended March 31, 2018 was $6.1 million compared to net cash used in financing activities of $88.7 million in the prior year. The increase in cash provided in financing activities relates to $22.0 million in net cash provided by our revolving credit facility, including $50.0 million of additional borrowings and $28.0 million of principle repayments, compared to the prior year repayment of $90.0 million on our line of credit. In addition, we received $4.0 million from the issuance of shares under employee stock plans, net of taxes paid for the net share settlement of equity awards. The increase in cash provided by financing activities was partially offset by $18.8 million paid to settle the contingent consideration liability related to the acquisition of HealthFusion and $1.1 million of debt issuance costs paid related to the amendment of our revolving credit agreement.
Net cash used in financing activities for the year ended March 31, 2017 was $88.7 million compared to net cash provided by financing activities of $57.8 million in the year ended March 31, 2016. The $146.5 million net increase in cash used in financing activities is due to $90.0 million in principal repayments on our revolving line of credit in the current year, compared to net proceeds of $105.0 million related to our revolving credit agreement in the prior year, partially offset by $42.9 million in dividends paid to shareholders and payments of $5.4 million in debt issuance and other related fees in the prior year.
43
We have minimum purchase commitments of $31.2 million related to payments due under certain non-cancelable agreements to purchase goods and services.
The following table summarizes our other significant contractual obligations at March 31, 2018 and the effect that such obligations are expected to have on our liquidity and cash in future periods (in thousands):
|
|
|
|
|
|
|
For the year ended March 31, |
|
|||||||||||||||||||||
|
Contractual Obligations |
|
Total |
|
|
2019 |
|
|
2020 |
|
|
2021 |
|
|
2022 |
|
|
2023 |
|
|
2024 and beyond |
|
|||||||
|
Operating lease obligations |
|
$ |
57,924 |
|
|
$ |
9,321 |
|
|
$ |
9,012 |
|
|
$ |
8,997 |
|
|
$ |
8,725 |
|
|
$ |
8,393 |
|
|
$ |
13,476 |
|
|
Remaining lease obligations for vacated properties (1) |
|
|
4,112 |
|
|
|
1,413 |
|
|
|
794 |
|
|
|
816 |
|
|
|
551 |
|
|
|
357 |
|
|
|
181 |
|
|
Line of credit obligations (Note 9) |
|
|
37,000 |
|
|
|
— |
|
|
|
— |
|
|
|
— |
|
|
|
— |
|
|
|
37,000 |
|
|
|
— |
|
|
Foreign transition tax - Tax reform (Note 11) |
|
|
1,381 |
|
|
|
1,381 |
|
|
|
— |
|
|
|
— |
|
|
|
— |
|
|
|
— |
|
|
|
— |
|
|
Total |
|
$ |
100,417 |
|
|
$ |
12,115 |
|
|
$ |
9,806 |
|
|
$ |
9,813 |
|
|
$ |
9,276 |
|
|
$ |
45,750 |
|
|
$ |
13,657 |
|
|
(1) |
Remaining lease obligations for vacated properties relates to remaining lease obligations at certain locations, including Austin, Solana Beach, and a portion of Horsham, that we have vacated and are actively marketing the locations for sublease as part of our reorganization efforts. Refer to Note 15, "Restructuring Plan" of our notes to consolidated financial statements included elsewhere in this Report for additional information. Total obligations have not been reduced by projected sublease rentals or by minimum sublease rentals of $1.0 million due in future periods under non-cancelable subleases. |
The deferred compensation liability as of March 31, 2018 was $6.1 million, which is not included in the table above as the timing of future benefit payments to employees is not determinable.
The uncertain tax position liability as of March 31, 2018 was $2.4 million, which is not included in the table above as the timing of expected payments is not determinable.
New Accounting Pronouncements
Refer to Note 2, “Summary of Significant Accounting Policies” of our notes to consolidated financial statements included elsewhere in this Report for a discussion of new accounting standards.
44
ITEM 7A. QUANTITATIVE AND QUALITATIVE DISCLOSURES ABOUT MARKET RISK
As of March 31, 2018 and March 31, 2017, we were subject to minimal market risk on our cash and cash equivalents as we maintained our balances in very liquid funds with maturities of 90 days or less at the time of purchase.
As of March 31, 2018 and March 31, 2017, we had $37.0 million and $15.0 million, respectively, in outstanding borrowings under our revolving credit agreement. The revolving borrowings under our revolving credit agreement bear interest at our option of either, (a) for base rate loans, a base rate based on the highest of (i) 0%, (ii) the rate of interest publicly announced by the administrative agent as its prime rate in effect at its principal office in New York City, (iii) the overnight bank funding rate (not to be less than zero) as determined by the Federal Reserve Bank of New York plus 0.50% or (iv) the LIBOR-based rate for one, two, three or six months Eurodollar deposits plus 1%, and (b) for Eurodollar loans, the LIBOR-based rate for one, two, three or six months (as selected by us) Eurodollar deposits plus 1.00%, plus, in each case, an applicable margin based on our total leverage ratio from time to time, ranging from 0.50% to 1.50% for base rate loans, and from 1.50% to 2.50% for Eurodollar loans. Accordingly, we are exposed to interest rate risk, primarily changes in LIBOR, due to our loans under the revolving credit agreement. A one hundred basis point (1.00%) change in the interest rate on our outstanding loans as of March 31, 2018 would result in a corresponding change in our annual interest expense of approximately $0.4 million. Refer to Note 9, “Line of Credit” of our notes to consolidated financial statements included elsewhere in this Report for additional information.
As of March 31, 2018 and March 31, 2017, we had international operations that exposed us to the risk of fluctuations in foreign currency exchange rates against the U.S. dollar. However, the impact of foreign currency fluctuations has not been material to our financial position or operating results.
ITEM 8. FINANCIAL STATEMENTS AND SUPPLEMENTARY DATA
See our consolidated financial statements identified in the Index to Financial Statements appearing under “Item 15. Exhibits and Financial Statement Schedules” of this Report.
ITEM 9. CHANGES IN AND DISAGREEMENTS WITH ACCOUNTANTS ON ACCOUNTING AND FINANCIAL DISCLOSURE
None.
ITEM 9A. CONTROLS AND PROCEDURES
Evaluation of Disclosure Controls and Procedures
Our Chief Executive Officer and Chief Financial Officer (our principal executive officer and principal financial officer, respectively) have evaluated the effectiveness of our disclosure controls and procedures (as defined in Rules 13a-15(e) and 15d-15(e) under the Security Exchange Act of 1934, as amended, the "Exchange Act") as of March 31, 2018, the end of the period covered by this Report (the “Evaluation Date”). They have concluded that, as of the Evaluation Date, these disclosure controls and procedures were effective to ensure that material information relating to the Company and its consolidated subsidiaries would be made known to them by others within those entities and would be disclosed on a timely basis. The Chief Executive Officer and Chief Financial Officer have concluded that our disclosure controls and procedures are designed, and are effective, to give reasonable assurance that the information required to be disclosed by us in reports that we file under the Exchange Act is recorded, processed, summarized and reported within the time period specified in the rules and forms of the Securities and Exchange Commission. They have also concluded that our disclosure controls and procedures are effective to ensure that information required to be disclosed in the reports that are filed or submitted under the Exchange Act are accumulated and communicated to our management, including the Chief Executive Officer and Chief Financial Officer, to allow timely decisions regarding required disclosure.
Management’s Report on Internal Control over Financial Reporting
During the year ended March 31, 2018, we completed our acquisitions of Entrada, Inc. ("Entrada") in April 2017, EagleDream Health, Inc. (“EagleDream”) in August 2017, and Inforth Technologies (“Inforth”) in January 2018, each of which are now wholly-owned subsidiaries of the Company. In conducting our evaluation of the effectiveness of our internal controls over financial reporting as of March 31, 2018, we have elected to exclude Entrada, EagleDream, and Inforth from our evaluation for fiscal year 2018 as permitted under current Securities and Exchange Commission rules and regulations. As of and for the year ended March 31, 2018, the assets and revenues of the acquired companies not included in our evaluation represented less than 1.0% of consolidated assets and 2.3% of consolidated revenues. We are currently in the process of integrating the historical internal controls over financial reporting of the acquired companies with the rest of our company. The integration may lead to changes in future periods, but we do not expect these changes to materially affect our internal controls over financial reporting. We expect to complete this integration in fiscal year 2019.
Our management is responsible for establishing and maintaining adequate internal control over financial reporting as defined in Rule 13a-15(f) under the Exchange Act. Internal control over financial reporting is a process designed by, or under the supervision and with the participation of our management, including our principal executive officer and principal financial
45
officer, to provide reasonable assurance regarding the reliability of financial reporting and the preparation of financial statements for external purposes in accordance with generally accepted accounting principles.
Our internal control over financial reporting is supported by written policies and procedures, that:
|
(1) |
pertain to the maintenance of records that, in reasonable detail, accurately and fairly reflect the transactions and dispositions of our assets; |
|
(2) |
provide reasonable assurance that transactions are recorded as necessary to permit preparation of financial statements in accordance with generally accepted accounting principles, and that receipts and expenditures of our company are being made only in accordance with authorizations of our management and directors; and |
|
(3) |
provide reasonable assurance regarding prevention or timely detection of unauthorized acquisition, use or disposition of our assets that could have a material effect on our financial statements. |
Because of its inherent limitations, internal control over financial reporting may not prevent or detect misstatements. Also, projections of any evaluation of effectiveness to future periods are subject to the risks that controls may become inadequate because of changes in conditions or that the degree of compliance with the policies or procedures may deteriorate.
Management of the Company has assessed the effectiveness of the Company’s internal control over financial reporting as of March 31, 2018 in making our assessment of internal control over financial reporting, management used the criteria set forth in Internal Control — Integrated Framework (2013) issued by the Committee of Sponsoring Organizations of the Treadway Commission. Based on our evaluation, our management concluded that our internal control over financial reporting was effective as of March 31, 2018.
The effectiveness of the Company’s internal control over financial reporting as of March 31, 2018 has been audited by PricewaterhouseCoopers LLP, an independent registered public accounting firm, as stated in their report contained in Item 15(a)(1) of Part IV of this Report, "Exhibits and Financial Statement Schedules."
Changes in Internal Control over Financial Reporting
During the quarter ended March 31, 2018, there were no changes in our “internal control over financial reporting” (as defined in Rule 13a-15(f) under the Exchange Act) that have materially affected, or are reasonably likely to materially affect, our internal control over financial reporting.
None.
46
ITEM 10. DIRECTORS, EXECUTIVE OFFICERS AND CORPORATE GOVERNANCE
The information required by Item 10 is incorporated herein by reference from our definitive proxy statement for our 2018 Annual Shareholders’ Meeting to be filed with the Securities and Exchange Commission.
ITEM 11. EXECUTIVE COMPENSATION
The information required by Item 11 is incorporated herein by reference from our definitive proxy statement for our 2018 Annual Shareholders’ Meeting to be filed with the Securities and Exchange Commission.
ITEM 12. SECURITY OWNERSHIP OF CERTAIN BENEFICIAL OWNERS AND MANAGEMENT AND RELATED STOCKHOLDER MATTERS
The information required by Item 12 is incorporated herein by reference from our definitive proxy statement for our 2018 Annual Shareholders’ Meeting to be filed with the Securities and Exchange Commission.
ITEM 13. CERTAIN RELATIONSHIPS AND RELATED TRANSACTIONS, AND DIRECTOR INDEPENDENCE
The information required by Item 13 is incorporated herein by reference from our definitive proxy statement for our 2018 Annual Shareholders’ Meeting to be filed with the Securities and Exchange Commission.
ITEM 14. PRINCIPAL ACCOUNTANT FEES AND SERVICES
The information required by Item 14 is incorporated herein by reference from our definitive proxy statement for our 2018 Annual Shareholders’ Meeting to be filed with the Securities and Exchange Commission.
47
ITEM 15. EXHIBITS AND FINANCIAL STATEMENT SCHEDULES
(a) Documents filed as part of this Annual Report on Form 10-K:
|
|
|
Page |
|
(1) Index to Financial Statements: |
|
|
|
|
|
|
|
|
53 |
|
|
|
|
|
|
|
55 |
|
|
|
|
|
|
|
56 |
|
|
|
|
|
|
Consolidated Statements of Shareholders’ Equity — Years Ended March 31, 2018, 2017 and 2016 |
|
57 |
|
|
|
|
|
Consolidated Statements of Cash Flows — Years Ended March 31, 2018, 2017 and 2016 |
|
58 |
|
|
|
|
|
|
60 |
|
|
|
|
|
|
(2) The following supplementary financial statement schedule of Quality Systems, Inc., required to be included in Item 15(a)(2) on Form 10-K is filed as part of this Report. |
|
|
|
|
|
|
|
Schedule II — Valuation and Qualifying Accounts — Years Ended March 31, 2018, 2017 and 2016 |
|
86 |
|
|
|
|
|
Schedules other than that listed above have been omitted since they are either not required, not applicable, or because the information required is included in the Consolidated Financial Statements or the notes thereto. |
|
|
|
|
|
|
|
(3) The exhibits listed in the Index to Exhibits hereof are attached hereto or incorporated herein by reference and filed as a part of this Report. |
|
|
|
|
|
|
|
|
49 |
None.
48
|
|
|
|
|
|
|
Incorporated by Reference |
||||
|
Exhibit Number |
|
Exhibit Description |
|
Filed Herewith |
|
Form |
|
Exhibit |
|
Filing Date |
|
|
|
|
|
|
|
|
|
|
|
|
|
3.1 |
|
|
|
|
S-1 |
|
3.1 |
|
January 11, 1996 |
|
|
|
|
|
|
|
|
|
|
|
|
|
|
3.2 |
|
|
|
|
10-K |
|
3.1.1 |
|
June 14, 2005 |
|
|
|
|
|
|
|
|
|
|
|
|
|
|
3.3 |
|
|
|
|
8-K |
|
3.01 |
|
October 11, 2005 |
|
|
|
|
|
|
|
|
|
|
|
|
|
|
3.4 |
|
|
|
|
8-K |
|
3.1 |
|
March 6, 2006 |
|
|
|
|
|
|
|
|
|
|
|
|
|
|
3.5 |
|
Amended and Restated Bylaws of Quality Systems, Inc., effective October 30, 2008 |
|
|
|
8-K |
|
3.1 |
|
October 31, 2008 |
|
|
|
|
|
|
|
|
|
|
|
|
|
3.6 |
|
|
|
|
8-K |
|
3.1 |
|
October 6, 2011 |
|
|
|
|
|
|
|
|
|
|
|
|
|
|
10.1* |
|
Second Amended and Restated 2005 Stock Option and Incentive Plan |
|
|
|
DEF14A |
|
Appendix I |
|
July 1, 2011 |
|
|
|
|
|
|
|
|
|
|
|
|
|
10.2* |
|
Form of Nonqualified Stock Option Agreement for 2005 Stock Incentive Plan |
|
|
|
8-K |
|
10.2 |
|
June 5, 2007 |
|
|
|
|
|
|
|
|
|
|
|
|
|
10.3* |
|
Form of Incentive Stock Option Agreement for 2005 Stock Incentive Plan |
|
|
|
8-K |
|
10.3 |
|
June 5, 2007 |
|
|
|
|
|
|
|
|
|
|
|
|
|
10.4* |
|
2009 Quality Systems, Inc. Amended and Restated Deferred Compensation Plan. |
|
|
|
10-K |
|
10.8 |
|
May 30, 2013 |
|
|
|
|
|
|
|
|
|
|
|
|
|
10.5* |
|
|
|
|
8-K |
|
10.2 |
|
February 2, 2010 |
|
|
|
|
|
|
|
|
|
|
|
|
|
|
10.6* |
|
|
|
|
8-K |
|
10.1 |
|
August 15, 2011 |
|
|
|
|
|
|
|
|
|
|
|
|
|
|
10.7* |
|
|
|
|
8-K |
|
10.1 |
|
January 28, 2013 |
|
|
|
|
|
|
|
|
|
|
|
|
|
|
10.8* |
|
|
|
|
8-K |
|
10.2 |
|
May 28, 2013 |
|
|
|
|
|
|
|
|
|
|
|
|
|
|
10.9* |
|
|
|
|
8-K |
|
10.1 |
|
July 17, 2013 |
|
|
|
|
|
|
|
|
|
|
|
|
|
|
10.10* |
|
|
|
|
10-Q |
|
2.1 |
|
October 31, 2013 |
|
|
|
|
|
|
|
|
|
|
|
|
|
|
10.11* |
|
|
|
|
10-K |
|
10.17 |
|
May 29, 2014 |
|
|
|
|
|
|
|
|
|
|
|
|
|
49
|
|
|
|
|
|
|
Incorporated by Reference |
||||
|
Exhibit Number |
|
Exhibit Description |
|
Filed Herewith |
|
Form |
|
Exhibit |
|
Filing Date |
|
|
|
|
|
DEF14A |
|
Annex A |
|
June 27, 2014 |
||
|
|
|
|
|
|
|
|
|
|
|
|
|
10.13* |
|
Executive Employment Agreement, dated June 3, 2015, between Quality Systems, Inc. and John R. Frantz |
|
|
|
8-K |
|
10.1 |
|
June 4, 2015 |
|
|
|
|
|
|
|
|
|
|
|
|
|
10.14* |
|
|
|
|
8-K |
|
10.1 |
|
August 14, 2015 |
|
|
|
|
|
|
|
|
|
|
|
|
|
|
10.15* |
|
|
|
|
8-K |
|
10.2 |
|
August 14, 2015 |
|
|
|
|
|
|
|
|
|
|
|
|
|
|
10.16* |
|
|
|
|
8-K |
|
10.3 |
|
August 14, 2015 |
|
|
|
|
|
|
|
|
|
|
|
|
|
|
10.17* |
|
|
|
|
8-K |
|
10.4 |
|
August 14, 2015 |
|
|
|
|
|
|
|
|
|
|
|
|
|
|
10.18* |
|
|
|
|
8-K |
|
2.1 |
|
October 30, 2015 |
|
|
|
|
|
|
|
|
|
|
|
|
|
|
10.19* |
|
|
|
|
10-Q |
|
10.1 |
|
January 29, 2016 |
|
|
|
|
|
|
|
|
|
|
|
|
|
|
10.20* |
|
Employment Offer Letter, dated January 27, 2016, between David Metcalfe and Quality Systems, Inc. |
|
|
|
8-K |
|
10.1 |
|
January 28, 2016 |
|
|
|
|
|
|
|
|
|
|
|
|
|
10.21* |
|
Employment Offer Letter, dated February 16, 2016, between James R. Arnold and Quality Systems, Inc. |
|
|
|
8-K |
|
10.1 |
|
February 18, 2016 |
|
|
|
|
|
|
|
|
|
|
|
|
|
10.22* |
|
|
|
|
8-K |
|
10.1 |
|
January 3, 2017 |
|
|
|
|
|
|
|
|
|
|
|
|
|
|
10.23* |
|
|
|
|
8-K |
|
10.2 |
|
January 3, 2017 |
|
|
|
|
|
|
|
|
|
|
|
|
|
|
10.24* |
|
|
|
|
8-K |
|
10.3 |
|
January 3, 2017 |
|
|
|
|
|
|
|
|
|
|
|
|
|
|
10.25* |
|
|
|
|
8-K |
|
10.1 |
|
April 4, 2017 |
|
|
|
|
|
|
|
|
|
|
|
|
|
|
10.26 |
|
|
|
|
8-K |
|
2.1 |
|
April 12, 2017 |
|
|
|
|
|
|
|
|
|
|
|
|
|
50
|
|
|
|
|
|
|
Incorporated by Reference |
||||
|
Exhibit Number |
|
Exhibit Description |
|
Filed Herewith |
|
Form |
|
Exhibit |
|
Filing Date |
|
|
|
|
|
8-K |
|
2.1 |
|
August 1, 2017 |
||
|
|
|
|
|
|
|
|
|
|
|
|
|
10.28 |
|
|
|
|
8-K |
|
10.1 |
|
August 23, 2017 |
|
|
|
|
|
|
|
|
|
|
|
|
|
|
10.29 |
|
|
|
|
8-K |
|
10.2 |
|
August 23, 2017 |
|
|
|
|
|
|
|
|
|
|
|
|
|
|
10.30 |
|
|
|
|
8-K |
|
10.1 |
|
December 1, 2017 |
|
|
|
|
|
|
|
|
|
|
|
|
|
|
10.31 |
|
|
|
|
8-K |
|
10.1 |
|
April 4, 2018 |
|
|
|
|
|
|
|
|
|
|
|
|
|
|
21 |
|
|
X |
|
|
|
|
|
|
|
|
|
|
|
|
|
|
|
|
|
|
|
|
23.1 |
|
Consent of Independent Registered Public Accounting Firm — PricewaterhouseCoopers LLP. |
|
X |
|
|
|
|
|
|
|
|
|
|
|
|
|
|
|
|
|
|
|
31.1 |
|
|
X |
|
|
|
|
|
|
|
|
|
|
|
|
|
|
|
|
|
|
|
|
31.2 |
|
|
X |
|
|
|
|
|
|
|
|
|
|
|
|
|
|
|
|
|
|
|
|
32.1 |
|
|
X |
|
|
|
|
|
|
|
|
|
|
|
|
|
|
|
|
|
|
|
|
101.INS** |
|
XBRL Instance |
|
|
|
|
|
|
|
|
|
|
|
|
|
|
|
|
|
|
|
|
|
101.SCH** |
|
XBRL Taxonomy Extension Schema |
|
|
|
|
|
|
|
|
|
|
|
|
|
|
|
|
|
|
|
|
|
101.CAL** |
|
XBRL Taxonomy Extension Calculation |
|
|
|
|
|
|
|
|
|
|
|
|
|
|
|
|
|
|
|
|
|
101.DEF** |
|
XBRL Taxonomy Extension Definition |
|
|
|
|
|
|
|
|
|
|
|
|
|
|
|
|
|
|
|
|
|
101.LAB** |
|
XBRL Taxonomy Extension Label |
|
|
|
|
|
|
|
|
|
|
|
|
|
|
|
|
|
|
|
|
|
101.PRE** |
|
XBRL Taxonomy Extension Presentation |
|
|
|
|
|
|
|
|
|
* |
This exhibit is a management contract or a compensatory plan or arrangement. |
|
** |
XBRL information is furnished and not filed or a part of a registration statement or prospectus for purposes of section 11 or 12 of the Securities and Exchange Act of 1933, as amended, is deemed not filed for purposes of section 18 of the Securities and Exchange Act of 1934, as amended, and otherwise is not subject to liability under these sections. |
51
Pursuant to the requirements of Section 13 or 15(d) of the Securities Exchange Act of 1934, the registrant has duly caused this Report to be signed on its behalf by the undersigned, thereunto duly authorized.
|
|
By: |
|
/s/ John R. Frantz |
|
|
|
|
John R. Frantz |
|
|
|
|
Chief Executive Officer (Principal Executive Officer) |
|
|
|
|
|
|
|
By: |
|
/s/ James R. Arnold |
|
|
|
|
James R. Arnold |
|
|
|
|
Chief Financial Officer (Principal Financial Officer) |
Date: May 24, 2018
KNOW ALL PERSONS BY THESE PRESENTS, that each of the persons whose signature appears below hereby constitutes and appoints John R. Frantz and James R. Arnold, each of them acting individually, as his attorney-in-fact, each with the full power of substitution, for him in any and all capacities, to sign any and all amendments to this Annual Report on Form 10-K, and to file the same, with all exhibits thereto and other documents in connection therewith, with the Securities and Exchange Commission, granting unto said attorneys-in-fact, and each of them, full power and authority to do and perform each and every act and thing requisite and necessary to be done in and about the premises as fully to all intents and purposes as he might or could do in person, hereby ratifying and confirming our signatures as they may be signed by our said attorney-in-fact and any and all amendments to this Annual Report on Form 10-K.
Pursuant to the requirement of the Securities Exchange Act of 1934, this Report has been signed by the following persons on our behalf in the capacities and on the dates indicated.
|
Signature |
|
Title |
|
Date |
|
|
|
|
|
|
|
/s/ Jeffrey H. Margolis |
|
Chairman of the Board and Director |
|
May 24, 2018 |
|
Jeffrey H. Margolis |
|
|
|
|
|
|
|
|
|
|
|
/s/ Craig A. Barbarosh |
|
Vice Chairman of the Board and Director |
|
May 24, 2018 |
|
Craig A. Barbarosh |
|
|
|
|
|
|
|
|
|
|
|
/s/ John R. Frantz |
|
Chief Executive Officer (Principal Executive Officer) and Director |
|
May 24, 2018 |
|
John R. Frantz |
|
|
|
|
|
|
|
|
|
|
|
/s/ James R. Arnold |
|
Chief Financial Officer (Principal Financial Officer) |
|
May 24, 2018 |
|
James R. Arnold |
|
|
|
|
|
|
|
|
|
|
|
/s/ George H. Bristol |
|
Director |
|
May 24, 2018 |
|
George H. Bristol |
|
|
|
|
|
|
|
|
|
|
|
/s/ Julie D. Klapstein |
|
Director |
|
May 24, 2018 |
|
Julie D. Klapstein |
|
|
|
|
|
|
|
|
|
|
|
/s/ James C. Malone |
|
Director |
|
May 24, 2018 |
|
James C. Malone |
|
|
|
|
|
|
|
|
|
|
|
/s/ Morris Panner |
|
Director |
|
May 24, 2018 |
|
Morris Panner |
|
|
|
|
|
|
|
|
|
|
|
/s/ Sheldon Razin |
|
Chairman Emeritus and Director |
|
May 24, 2018 |
|
Sheldon Razin |
|
|
|
|
|
|
|
|
|
|
|
/s/ Lance E. Rosenzweig |
|
Director |
|
May 24, 2018 |
|
Lance E. Rosenzweig |
|
|
|
|
52
Report of Independent Registered Public Accounting Firm
To the Board of Directors and Shareholders of Quality Systems, Inc.
Opinions on the Financial Statements and Internal Control over Financial Reporting
We have audited the accompanying consolidated balance sheets of Quality Systems, Inc. and its subsidiaries as of March 31, 2018 and 2017, and the related consolidated statements of net income and comprehensive income, statements of shareholders’ equity, and statements of cash flows for each of the three years in the period ended March 31, 2018, including the related notes and financial statement schedule listed in the accompanying index appearing under Item 15(a)(2) (collectively referred to as the “consolidated financial statements”). We also have audited the Company's internal control over financial reporting as of March 31, 2018, based on criteria established in Internal Control - Integrated Framework (2013) issued by the Committee of Sponsoring Organizations of the Treadway Commission (COSO).
In our opinion, the consolidated financial statements referred to above present fairly, in all material respects, the financial position of the Company as of March 31, 2018 and 2017, and the results of their operations and their cash flows for each of the three years in the period ended March 31, 2018 in conformity with accounting principles generally accepted in the United States of America. Also in our opinion, the Company maintained, in all material respects, effective internal control over financial reporting as of March 31, 2018, based on criteria established in Internal Control - Integrated Framework (2013) issued by the COSO.
Basis for Opinions
The Company's management is responsible for these consolidated financial statements, for maintaining effective internal control over financial reporting, and for its assessment of the effectiveness of internal control over financial reporting, included in Management's Report on Internal Control over Financial Reporting appearing under Item 9A. Our responsibility is to express opinions on the Company’s consolidated financial statements and on the Company's internal control over financial reporting based on our audits. We are a public accounting firm registered with the Public Company Accounting Oversight Board (United States) ("PCAOB") and are required to be independent with respect to the Company in accordance with the U.S. federal securities laws and the applicable rules and regulations of the Securities and Exchange Commission and the PCAOB.
We conducted our audits in accordance with the standards of the PCAOB. Those standards require that we plan and perform the audits to obtain reasonable assurance about whether the consolidated financial statements are free of material misstatement, whether due to error or fraud, and whether effective internal control over financial reporting was maintained in all material respects.
Our audits of the consolidated financial statements included performing procedures to assess the risks of material misstatement of the consolidated financial statements, whether due to error or fraud, and performing procedures that respond to those risks. Such procedures included examining, on a test basis, evidence regarding the amounts and disclosures in the consolidated financial statements. Our audits also included evaluating the accounting principles used and significant estimates made by management, as well as evaluating the overall presentation of the consolidated financial statements. Our audit of internal control over financial reporting included obtaining an understanding of internal control over financial reporting, assessing the risk that a material weakness exists, and testing and evaluating the design and operating effectiveness of internal control based on the assessed risk. Our audits also included performing such other procedures as we considered necessary in the circumstances. We believe that our audits provide a reasonable basis for our opinions.
As described in Management’s Annual Report on Internal Control over Financial Reporting, management has excluded Entrada, Inc. (“Entrada”), EagleDream Health, Inc. (“EagleDream”), and Inforth Technologies LLC (“Inforth”) from its assessment of internal control over financial reporting as of March 31, 2018 because they were acquired by the Company in a purchase business combination during the year ended March 31, 2018. We have also excluded Entrada, EagleDream, and Inforth from our audit of internal control over financial reporting. Entrada, EagleDream, and Inforth are wholly-owned subsidiaries whose total assets and total revenues excluded from management’s assessment and our audit of internal control over financial reporting represent less than 1.0% and 2.3%, respectively, of the related consolidated financial statement amounts as of and for the year ended March 31, 2018.
53
Definition and Limitations of Internal Control over Financial Reporting
A company’s internal control over financial reporting is a process designed to provide reasonable assurance regarding the reliability of financial reporting and the preparation of financial statements for external purposes in accordance with generally accepted accounting principles. A company’s internal control over financial reporting includes those policies and procedures that (i) pertain to the maintenance of records that, in reasonable detail, accurately and fairly reflect the transactions and dispositions of the assets of the company; (ii) provide reasonable assurance that transactions are recorded as necessary to permit preparation of financial statements in accordance with generally accepted accounting principles, and that receipts and expenditures of the company are being made only in accordance with authorizations of management and directors of the company; and (iii) provide reasonable assurance regarding prevention or timely detection of unauthorized acquisition, use, or disposition of the company’s assets that could have a material effect on the financial statements.
Because of its inherent limitations, internal control over financial reporting may not prevent or detect misstatements. Also, projections of any evaluation of effectiveness to future periods are subject to the risk that controls may become inadequate because of changes in conditions, or that the degree of compliance with the policies or procedures may deteriorate.
/s/ PricewaterhouseCoopers LLP
Irvine, California
May 24, 2018
We have served as the Company’s auditor since 2009.
54
(In thousands, except per share data)
|
|
|
March 31, 2018 |
|
|
March 31, 2017 |
|
||
|
ASSETS |
|
|
|
|
|
|
|
|
|
Current assets: |
|
|
|
|
|
|
|
|
|
Cash and cash equivalents |
|
$ |
28,845 |
|
|
$ |
37,673 |
|
|
Restricted cash and cash equivalents (Note 2) |
|
|
2,373 |
|
|
|
4,916 |
|
|
Accounts receivable, net (Note 10) |
|
|
84,962 |
|
|
|
83,407 |
|
|
Inventory |
|
|
180 |
|
|
|
158 |
|
|
Income taxes receivable |
|
|
8,122 |
|
|
|
2,679 |
|
|
Prepaid expenses and other current assets |
|
|
17,180 |
|
|
|
17,969 |
|
|
Total current assets |
|
|
141,662 |
|
|
|
146,802 |
|
|
Equipment and improvements, net |
|
|
26,795 |
|
|
|
27,426 |
|
|
Capitalized software costs, net |
|
|
26,318 |
|
|
|
13,607 |
|
|
Deferred income taxes, net |
|
|
9,219 |
|
|
|
11,265 |
|
|
Intangibles, net |
|
|
74,091 |
|
|
|
69,213 |
|
|
Goodwill |
|
|
218,875 |
|
|
|
185,898 |
|
|
Other assets |
|
|
18,795 |
|
|
|
19,010 |
|
|
Total assets |
|
$ |
515,755 |
|
|
$ |
473,221 |
|
|
LIABILITIES AND SHAREHOLDERS' EQUITY |
|
|
|
|
|
|
|
|
|
Current liabilities: |
|
|
|
|
|
|
|
|
|
Accounts payable |
|
$ |
4,213 |
|
|
$ |
4,618 |
|
|
Deferred revenue |
|
|
54,079 |
|
|
|
52,383 |
|
|
Accrued compensation and related benefits |
|
|
27,910 |
|
|
|
24,513 |
|
|
Income taxes payable |
|
|
73 |
|
|
|
405 |
|
|
Other current liabilities |
|
|
48,317 |
|
|
|
46,775 |
|
|
Total current liabilities |
|
|
134,592 |
|
|
|
128,694 |
|
|
Deferred revenue, net of current |
|
|
1,173 |
|
|
|
1,394 |
|
|
Deferred compensation |
|
|
6,086 |
|
|
|
6,629 |
|
|
Line of credit |
|
|
37,000 |
|
|
|
15,000 |
|
|
Other noncurrent liabilities |
|
|
13,494 |
|
|
|
16,461 |
|
|
Total liabilities |
|
|
192,345 |
|
|
|
168,178 |
|
|
Commitments and contingencies (Note 14) |
|
|
|
|
|
|
|
|
|
Shareholders' equity: |
|
|
|
|
|
|
|
|
|
Common stock |
|
|
|
|
|
|
|
|
|
$0.01 par value; authorized 100,000 shares; issued and outstanding 63,995 and 62,455 shares at March 31, 2018 and 2017, respectively |
|
|
640 |
|
|
|
625 |
|
|
Additional paid-in capital |
|
|
244,462 |
|
|
|
228,549 |
|
|
Accumulated other comprehensive loss |
|
|
(400 |
) |
|
|
(358 |
) |
|
Retained earnings (1) |
|
|
78,708 |
|
|
|
76,227 |
|
|
Total shareholders' equity |
|
|
323,410 |
|
|
|
305,043 |
|
|
Total liabilities and shareholders' equity |
|
$ |
515,755 |
|
|
$ |
473,221 |
|
(1) Includes cumulative effect adjustment related to adoption of ASU 2016-09. See Note 1 for additional details.
The accompanying notes are an integral part of these consolidated financial statements.
55
CONSOLIDATED STATEMENTS OF NET INCOME AND COMPREHENSIVE INCOME
(In thousands, except per share data)
|
|
Fiscal Year Ended March 31, |
|
|||||||||
|
|
2018 |
|
|
2017 |
|
|
2016 |
|
|||
|
Revenues: |
|
|
|
|
|
|
|
|
|
|
|
|
Software license and hardware |
$ |
55,576 |
|
|
$ |
65,547 |
|
|
$ |
70,523 |
|
|
Software related subscription services |
|
99,547 |
|
|
|
87,050 |
|
|
|
55,403 |
|
|
Total software, hardware and related |
|
155,123 |
|
|
|
152,597 |
|
|
|
125,926 |
|
|
Support and maintenance |
|
163,805 |
|
|
|
158,803 |
|
|
|
165,200 |
|
|
Revenue cycle management and related services |
|
83,996 |
|
|
|
82,552 |
|
|
|
83,006 |
|
|
Electronic data interchange and data services |
|
92,773 |
|
|
|
88,951 |
|
|
|
82,343 |
|
|
Professional services |
|
35,322 |
|
|
|
26,721 |
|
|
|
36,002 |
|
|
Total revenues |
|
531,019 |
|
|
|
509,624 |
|
|
|
492,477 |
|
|
Cost of revenue: |
|
|
|
|
|
|
|
|
|
|
|
|
Software license and hardware |
|
21,667 |
|
|
|
24,654 |
|
|
|
27,506 |
|
|
Software related subscription services |
|
44,495 |
|
|
|
36,744 |
|
|
|
26,622 |
|
|
Total software, hardware and related |
|
66,162 |
|
|
|
61,398 |
|
|
|
54,128 |
|
|
Support and maintenance |
|
29,932 |
|
|
|
28,317 |
|
|
|
31,329 |
|
|
Revenue cycle management and related services |
|
60,905 |
|
|
|
56,370 |
|
|
|
57,591 |
|
|
Electronic data interchange and data services |
|
54,015 |
|
|
|
51,102 |
|
|
|
50,153 |
|
|
Professional services |
|
30,521 |
|
|
|
25,947 |
|
|
|
32,414 |
|
|
Total cost of revenue |
|
241,535 |
|
|
|
223,134 |
|
|
|
225,615 |
|
|
Gross profit |
|
289,484 |
|
|
|
286,490 |
|
|
|
266,862 |
|
|
Operating expenses: |
|
|
|
|
|
|
|
|
|
|
|
|
Selling, general and administrative |
|
193,226 |
|
|
|
163,623 |
|
|
|
156,234 |
|
|
Research and development costs, net |
|
81,259 |
|
|
|
78,341 |
|
|
|
65,661 |
|
|
Amortization of acquired intangible assets |
|
7,810 |
|
|
|
10,435 |
|
|
|
5,367 |
|
|
Impairment of assets |
|
3,757 |
|
|
|
— |
|
|
|
32,238 |
|
|
Restructuring costs |
|
611 |
|
|
|
7,078 |
|
|
|
— |
|
|
Total operating expenses |
|
286,663 |
|
|
|
259,477 |
|
|
|
259,500 |
|
|
Income from operations |
|
2,821 |
|
|
|
27,013 |
|
|
|
7,362 |
|
|
Interest income |
|
55 |
|
|
|
14 |
|
|
|
428 |
|
|
Interest expense |
|
(3,323 |
) |
|
|
(3,156 |
) |
|
|
(1,304 |
) |
|
Other income (expense), net |
|
37 |
|
|
|
(262 |
) |
|
|
(166 |
) |
|
Income (loss) before provision for (benefit of) income taxes |
|
(410 |
) |
|
|
23,609 |
|
|
|
6,320 |
|
|
Provision for (benefit of) income taxes |
|
(2,830 |
) |
|
|
5,368 |
|
|
|
663 |
|
|
Net income |
$ |
2,420 |
|
|
$ |
18,241 |
|
|
$ |
5,657 |
|
|
Other comprehensive income: |
|
|
|
|
|
|
|
|
|
|
|
|
Foreign currency translation, net of tax |
|
(42 |
) |
|
|
80 |
|
|
|
(382 |
) |
|
Unrealized gain on marketable securities, net of tax |
|
— |
|
|
|
43 |
|
|
|
93 |
|
|
Comprehensive income |
$ |
2,378 |
|
|
$ |
18,364 |
|
|
$ |
5,368 |
|
|
Net income per share: |
|
|
|
|
|
|
|
|
|
|
|
|
Basic |
$ |
0.04 |
|
|
$ |
0.30 |
|
|
$ |
0.09 |
|
|
Diluted |
$ |
0.04 |
|
|
$ |
0.29 |
|
|
$ |
0.09 |
|
|
Weighted-average shares outstanding: |
|
|
|
|
|
|
|
|
|
|
|
|
Basic |
|
63,435 |
|
|
|
61,818 |
|
|
|
60,635 |
|
|
Diluted |
|
63,440 |
|
|
|
62,010 |
|
|
|
61,233 |
|
|
Dividends declared per common share |
$ |
— |
|
|
$ |
— |
|
|
$ |
0.525 |
|
The accompanying notes are an integral part of these consolidated financial statements.
56
CONSOLIDATED STATEMENTS OF SHAREHOLDERS’ EQUITY
(In thousands)
|
|
|
|
|
|
|
|
|
|
|
|
|
|
|
|
|
|
|
Accumulated |
|
|
|
|
|
|
|
|
|
|
|
|
|
|
|
|
|
Additional |
|
|
|
|
|
|
Other |
|
|
Total |
|
|||
|
|
|
Common Stock |
|
|
Paid-in |
|
|
Retained |
|
|
Comprehensive |
|
|
Shareholders' |
|
|||||||||
|
|
|
Shares |
|
|
Amount |
|
|
Capital |
|
|
Earnings |
|
|
Loss |
|
|
Equity |
|
||||||
|
Balance, March 31, 2015 |
|
|
60,303 |
|
|
|
603 |
|
|
|
198,650 |
|
|
|
84,479 |
|
|
|
(192 |
) |
|
|
283,540 |
|
|
Common stock issued under stock plans, net of shares withheld for taxes |
|
|
241 |
|
|
|
3 |
|
|
|
989 |
|
|
|
— |
|
|
|
— |
|
|
|
992 |
|
|
Common stock issued for earnout settlement |
|
|
434 |
|
|
|
4 |
|
|
|
9,269 |
|
|
|
— |
|
|
|
— |
|
|
|
9,273 |
|
|
Tax benefit related to stock options |
|
|
— |
|
|
|
— |
|
|
|
(941 |
) |
|
|
— |
|
|
|
— |
|
|
|
(941 |
) |
|
Stock-based compensation |
|
|
— |
|
|
|
— |
|
|
|
3,295 |
|
|
|
— |
|
|
|
— |
|
|
|
3,295 |
|
|
Dividends declared |
|
|
— |
|
|
|
— |
|
|
|
— |
|
|
|
(32,150 |
) |
|
|
— |
|
|
|
(32,150 |
) |
|
Components of other comprehensive income: |
|
|
|
|
|
|
|
|
|
|
|
|
|
|
|
|
|
|
|
|
|
|
|
|
|
Unrealized gain on marketable securities |
|
|
— |
|
|
|
— |
|
|
|
— |
|
|
|
— |
|
|
|
93 |
|
|
|
93 |
|
|
Translation adjustments |
|
|
— |
|
|
|
— |
|
|
|
— |
|
|
|
— |
|
|
|
(382 |
) |
|
|
(382 |
) |
|
Net income |
|
|
— |
|
|
|
— |
|
|
|
— |
|
|
|
5,657 |
|
|
|
— |
|
|
|
5,657 |
|
|
Balance, March 31, 2016 |
|
|
60,978 |
|
|
|
610 |
|
|
|
211,262 |
|
|
|
57,986 |
|
|
|
(481 |
) |
|
|
269,377 |
|
|
Common stock issued under stock plans, net of shares withheld for taxes |
|
|
1,043 |
|
|
|
11 |
|
|
|
1,299 |
|
|
|
— |
|
|
|
— |
|
|
|
1,310 |
|
|
Common stock issued for earnout settlement |
|
|
434 |
|
|
|
4 |
|
|
|
9,269 |
|
|
|
— |
|
|
|
— |
|
|
|
9,273 |
|
|
Tax benefit related to stock options |
|
|
— |
|
|
|
— |
|
|
|
(879 |
) |
|
|
— |
|
|
|
— |
|
|
|
(879 |
) |
|
Stock-based compensation |
|
|
— |
|
|
|
— |
|
|
|
7,598 |
|
|
|
— |
|
|
|
— |
|
|
|
7,598 |
|
|
Components of other comprehensive income: |
|
|
|
|
|
|
|
|
|
|
|
|
|
|
|
|
|
|
|
|
|
|
|
|
|
Unrealized gain on marketable securities |
|
|
— |
|
|
|
— |
|
|
|
— |
|
|
|
— |
|
|
|
43 |
|
|
|
43 |
|
|
Translation adjustments |
|
|
— |
|
|
|
— |
|
|
|
— |
|
|
|
— |
|
|
|
80 |
|
|
|
80 |
|
|
Net income |
|
|
— |
|
|
|
— |
|
|
|
— |
|
|
|
18,241 |
|
|
|
— |
|
|
|
18,241 |
|
|
Balance, March 31, 2017 |
|
|
62,455 |
|
|
|
625 |
|
|
|
228,549 |
|
|
|
76,227 |
|
|
|
(358 |
) |
|
|
305,043 |
|
|
Common stock issued under stock plans, net of shares withheld for taxes |
|
|
1,540 |
|
|
|
15 |
|
|
|
3,818 |
|
|
|
— |
|
|
|
— |
|
|
|
3,833 |
|
|
Stock-based compensation |
|
|
— |
|
|
|
— |
|
|
|
12,196 |
|
|
|
— |
|
|
|
— |
|
|
|
12,196 |
|
|
Cumulative effect adjustment related to the adoption of ASU 2016-09 |
|
|
— |
|
|
|
— |
|
|
|
(101 |
) |
|
|
61 |
|
|
|
— |
|
|
|
(40 |
) |
|
Components of other comprehensive income: |
|
|
|
|
|
|
|
|
|
|
|
|
|
|
|
|
|
|
|
|
|
|
|
|
|
Translation adjustments |
|
|
— |
|
|
|
— |
|
|
|
— |
|
|
|
— |
|
|
|
(42 |
) |
|
|
(42 |
) |
|
Net income |
|
|
— |
|
|
|
— |
|
|
|
— |
|
|
|
2,420 |
|
|
|
— |
|
|
|
2,420 |
|
|
Balance, March 31, 2018 |
|
|
63,995 |
|
|
$ |
640 |
|
|
$ |
244,462 |
|
|
$ |
78,708 |
|
|
$ |
(400 |
) |
|
$ |
323,410 |
|
The accompanying notes are an integral part of these consolidated financial statements.
57
CONSOLIDATED STATEMENTS OF CASH FLOWS
(In thousands)
|
|
|
Fiscal Year Ended March 31, |
|
|||||||||
|
|
|
2018 |
|
|
2017 |
|
|
2016 |
|
|||
|
Cash flows from operating activities: |
|
|
|
|
|
|
|
|
|
|
|
|
|
Net income |
|
$ |
2,420 |
|
|
$ |
18,241 |
|
|
$ |
5,657 |
|
|
Adjustments to reconcile net income to net cash provided by operating activities: |
|
|
|
|
|
|
|
|
|
|
|
|
|
Depreciation |
|
|
10,498 |
|
|
|
10,080 |
|
|
|
8,834 |
|
|
Amortization of capitalized software costs |
|
|
6,518 |
|
|
|
7,892 |
|
|
|
9,891 |
|
|
Amortization of other intangibles |
|
|
23,380 |
|
|
|
22,462 |
|
|
|
11,014 |
|
|
Amortization and write-off of debt issuance costs |
|
|
1,610 |
|
|
|
1,076 |
|
|
|
258 |
|
|
Loss on disposal of equipment and improvements |
|
|
169 |
|
|
|
530 |
|
|
|
205 |
|
|
Provision for bad debts |
|
|
5,913 |
|
|
|
5,082 |
|
|
|
3,573 |
|
|
Provision for inventory obsolescence |
|
|
51 |
|
|
|
418 |
|
|
|
48 |
|
|
Share-based compensation |
|
|
12,297 |
|
|
|
7,598 |
|
|
|
3,295 |
|
|
Deferred income taxes |
|
|
312 |
|
|
|
(129 |
) |
|
|
10,030 |
|
|
Excess tax benefit from share-based compensation |
|
|
328 |
|
|
|
— |
|
|
|
— |
|
|
Change in fair value of contingent consideration |
|
|
— |
|
|
|
4,247 |
|
|
|
261 |
|
|
Restructuring costs, net of amounts paid |
|
|
— |
|
|
|
2,891 |
|
|
|
— |
|
|
Loss on disposition of Hospital Solutions Division |
|
|
— |
|
|
|
— |
|
|
|
1,366 |
|
|
Impairment of assets |
|
|
3,757 |
|
|
|
— |
|
|
|
32,238 |
|
|
Changes in assets and liabilities, net of amounts acquired: |
|
|
|
|
|
|
|
|
|
|
|
|
|
Accounts receivable |
|
|
(5,409 |
) |
|
|
5,535 |
|
|
|
9,929 |
|
|
Inventory |
|
|
(73 |
) |
|
|
(21 |
) |
|
|
17 |
|
|
Accounts payable |
|
|
(1,232 |
) |
|
|
(6,590 |
) |
|
|
(271 |
) |
|
Deferred revenue |
|
|
847 |
|
|
|
(5,493 |
) |
|
|
(8,390 |
) |
|
Accrued compensation and related benefits |
|
|
2,228 |
|
|
|
5,237 |
|
|
|
(5,914 |
) |
|
Income taxes |
|
|
(8,530 |
) |
|
|
34,740 |
|
|
|
(40,471 |
) |
|
Deferred compensation |
|
|
(543 |
) |
|
|
272 |
|
|
|
607 |
|
|
Other assets and liabilities |
|
|
22,045 |
|
|
|
(3,476 |
) |
|
|
(1,381 |
) |
|
Net cash provided by operating activities |
|
|
76,586 |
|
|
|
110,592 |
|
|
|
40,796 |
|
|
Cash flows from investing activities: |
|
|
|
|
|
|
|
|
|
|
|
|
|
Additions to capitalized software costs |
|
|
(18,865 |
) |
|
|
(8,249 |
) |
|
|
(14,675 |
) |
|
Additions to equipment and improvements |
|
|
(9,801 |
) |
|
|
(12,165 |
) |
|
|
(14,013 |
) |
|
Proceeds from sales and maturities of marketable securities |
|
|
— |
|
|
|
9,291 |
|
|
|
8,795 |
|
|
Purchases of marketable securities |
|
|
— |
|
|
|
— |
|
|
|
(6,637 |
) |
|
Payments for acquisitions, net of cash acquired |
|
|
(62,867 |
) |
|
|
— |
|
|
|
(163,843 |
) |
|
HealthFusion working capital adjustment payment |
|
|
— |
|
|
|
(282 |
) |
|
|
— |
|
|
Net cash used in investing activities |
|
|
(91,533 |
) |
|
|
(11,405 |
) |
|
|
(190,373 |
) |
|
Cash flows from financing activities: |
|
|
|
|
|
|
|
|
|
|
|
|
|
Proceeds from line of credit |
|
|
50,000 |
|
|
|
— |
|
|
|
173,509 |
|
|
Repayments on line of credit |
|
|
(28,000 |
) |
|
|
(90,000 |
) |
|
|
(68,509 |
) |
|
Payment of debt issuance costs |
|
|
(1,105 |
) |
|
|
— |
|
|
|
(5,382 |
) |
|
Payment of contingent consideration related to acquisitions |
|
|
(18,817 |
) |
|
|
— |
|
|
|
— |
|
|
Proceeds from issuance of shares under employee plans |
|
|
4,889 |
|
|
|
1,310 |
|
|
|
992 |
|
|
Dividends paid |
|
|
— |
|
|
|
— |
|
|
|
(42,850 |
) |
|
Payments for taxes related to net share settlement of equity awards |
|
|
(848 |
) |
|
|
— |
|
|
|
— |
|
|
Net cash provided by (used in) financing activities |
|
|
6,119 |
|
|
|
(88,690 |
) |
|
|
57,760 |
|
|
Net increase (decrease) in cash and cash equivalents |
|
|
(8,828 |
) |
|
|
10,497 |
|
|
|
(91,817 |
) |
|
Cash and cash equivalents at beginning of period |
|
|
37,673 |
|
|
|
27,176 |
|
|
|
118,993 |
|
|
Cash and cash equivalents at end of period |
|
$ |
28,845 |
|
|
$ |
37,673 |
|
|
$ |
27,176 |
|
58
CONSOLIDATED STATEMENTS OF CASH FLOWS – (Continued)
(In thousands)
|
|
|
Fiscal Year Ended March 31, |
|
|||||||||
|
|
|
2018 |
|
|
2017 |
|
|
2016 |
|
|||
|
Supplemental disclosures of cash flow information: |
|
|
|
|
|
|
|
|
|
|
|
|
|
Cash paid for income taxes |
|
$ |
6,379 |
|
|
$ |
4,800 |
|
|
$ |
33,246 |
|
|
Cash refunds from income taxes |
|
|
1,874 |
|
|
|
29,575 |
|
|
|
2,344 |
|
|
Cash paid for interest |
|
|
1,953 |
|
|
|
1,958 |
|
|
|
781 |
|
|
Non-cash investing and financing activities: |
|
|
|
|
|
|
|
|
|
|
|
|
|
Tenant improvement allowance from landlord |
|
|
1,442 |
|
|
|
4,813 |
|
|
|
2,933 |
|
|
Unpaid additions to equipment and improvements |
|
|
72 |
|
|
|
82 |
|
|
|
295 |
|
|
Common stock issued for settlement of share-based contingent consideration |
|
|
— |
|
|
|
9,273 |
|
|
|
9,273 |
|
The accompanying notes are an integral part of these consolidated financial statements.
59
NOTES TO CONSOLIDATED FINANCIAL STATEMENTS
(In thousands, except shares and per share data)
Description of Business
Quality Systems, Inc., known to our clients as NextGen® Healthcare, provides solutions on an integrated platform that enables our clients to target superior clinical and financial outcomes concurrent with improved physician and patient engagement.
Our clients span the ambulatory care market from large multi-specialty to small single specialty practices and include networks of practices such as physician hospital organizations (“PHOs”), management service organizations (“MSOs”), independent physician associations (“IPAs”), accountable care organizations (“ACOs”), ambulatory care centers (“ACCs”), and community health centers(“CHCs”).
At the core of our offerings are industry leading electronic health record (“EHR”) and practice management (“PM”) solutions that support the foundational clinical and financial activities of any ambulatory practice. We strive to enable our clients’ ability to maintain control of their organizational identity and destiny, rather than dictating a technology-driven road map. To meet our clients’ unique, evolving needs, we continue to expand and enrich our core offerings to create a comprehensive platform essential to our client’s success in the new value-based environment. Our platform includes one of the industry’s most recognized suites of vendor-agnostic cloud-based interoperability tools as well as our recently acquired, cloud-based Population Health Management and Analytics platform which allows our clients to cost effectively manage populations of patients – improving outcomes and enhancing the quality of care rendered. Our mobile solution significantly enhances, automates and streamlines physician workflows reducing physician burnout and resulting physician attrition.
We have a history of enhancing our solutions through organic and inorganic activities. Over the last few years, we have entered into strategic transactions to complement and enhance our ambulatory market product portfolio. In October 2015, we divested our former Hospital Solutions division to focus exclusively on the ambulatory market place. In January 2016, we acquired HealthFusion Holdings, Inc. ("HealthFusion"), and its cloud-based EHR/PM. In April 2017, we acquired Entrada, Inc. ("Entrada"), a cloud-based, mobile platform for clinical documentation and collaboration. In August 2017, we acquired EagleDream Health, Inc. (“EagleDream”) and its cloud-based population health analytics, and in January 2018, we acquired Inforth Technologies (“Inforth”) for its specialty-focused clinical content.
Quality Systems, Inc. was incorporated in California in 1974. Our principal offices are located at 18111 Von Karman Ave., Suite 800, Irvine, California, 92612. Our website is located at www.nextgen.com. We operate on a fiscal year ending on March 31.
2. Summary of Significant Accounting Policies
Principles of Consolidation. The consolidated financial statements include the accounts of Quality Systems, Inc. and its wholly-owned subsidiaries (collectively, the “Company”). Each of the terms “NextGen Healthcare,” “NextGen,” “we,” “us,” or “our” as used herein refers collectively to the Company, unless otherwise stated. All intercompany accounts and transactions have been eliminated.
Business Segments. We have determined that the Company operates in one segment as of June 30, 2017. We have made such determination by first identifying our Chief Executive Officer as our chief operating decision maker ("CODM") and considering the measures used by our CODM to allocate resources. Our CODM utilizes consolidated revenue and consolidated operating results to assess performance and make decisions about allocation of resources.
Previously, through the end of fiscal year 2017, we operated under two reportable segments, consisting of the Software and Related Solutions segment and the RCM and Related Services segment, which was consistent with the disaggregated financial information used and evaluated by our CODM to assess performance and make decisions about the allocation of resources. However, as part of our reorganization efforts that were substantially complete as of the end of fiscal year 2017, our internal organizational structure whereby certain functions that formerly existed within each individual operating segment has continued to evolve. Our former Chief Operating Officer was previously responsible for leading the operations of our former RCM and Related Services business while our former Chief Client Officer led our client success organization, consisting of the Software and Related Solutions business and other functions, such as sales and marketing. Upon the resignation of our former Chief Operating Officer in April 2017 and concurrent appointment of our former Chief Client Officer as Chief Operating Officer, our entire portfolio of software and services were aligned under our new Chief Operating Officer in an effort to provide our clients with an even more simplified experience and more effectively deliver a consolidated financial solution to our clients, rather than components of a solution. As a result of such changes in our internal organization structure, the CODM now operates the Company as a single functional organization. The CODM measures company-wide performance by reviewing consolidated revenue and operating results and evaluates the impact of allocating resources to overall profit and margins on a consolidated basis.
60
Basis of Presentation. References to amounts in the consolidated financial statement sections are in thousands, except shares and per share data, unless otherwise specified.
Use of Estimates. The accompanying consolidated financial statements have been prepared in accordance with accounting principles generally accepted in the United States of America (“GAAP”), which requires us to make estimates and assumptions that affect the amounts reported and disclosed in the consolidated financial statements and the accompanying notes. Actual results could differ materially from these estimates. We evaluate our estimates on an ongoing basis. We base our estimates on historical experience and on various other assumptions that are believed to be reasonable under the circumstances, the results of which form the basis for making judgments about the carrying values of assets and liabilities and recording revenue and expenses during the period.
Revenue Recognition. We generate revenue from sales of licensing rights and subscriptions to our software products, hardware and third-party software products, support and maintenance services, revenue cycle management (“RCM”), electronic data interchange (“EDI”) and professional services, such as implementation, training, and consulting performed for clients who use our products.
We generally recognize revenue provided that persuasive evidence of an arrangement exists, fees are considered fixed or determinable, delivery of the product or service has occurred, and collection is considered probable. Revenue from the delivered elements, such as software licenses, are generally recognized upon physical or electronic delivery. In certain transactions where collection is not considered probable, the revenue is deferred until collection occurs. If the fee is not fixed or determinable, then the revenue recognized in each period (subject to application of other revenue recognition criteria) will be the lesser of the aggregate amounts due and payable or the amount of the arrangement fee that would have been recognized if the fees were being recognized using the residual method. We assess whether fees are considered fixed or determinable at the inception of the arrangement and negotiated fees generally are based on a specific volume of products to be delivered and not subject to change based on variable pricing mechanisms, such as the number of units copied or distributed or the expected number of users.
A typical software licensing arrangement may contain multiple elements, such as software licenses, support and maintenance services, and professional services. Revenue from arrangements involving multiple elements is generally allocated to each element using the residual method when evidence of fair value only exists for the undelivered elements. The fair value of an element is based on vendor-specific objective evidence (“VSOE”), which is established based on the price charged when the same element is sold separately or renewed. We generally establish VSOE for the related undelivered elements based on the bell-shaped curve method. VSOE is established on maintenance for certain clients based on stated renewal rates only if the rate is determined to be substantive and falls within our customary pricing practices. VSOE calculations are updated and reviewed on a quarterly or annual basis, depending on the nature of the product or service.
Under the residual method, we defer revenue related to the undelivered elements based on VSOE of fair value of each undelivered element and allocate the remainder of the contract price, net of all discounts, to the delivered elements. If VSOE of fair value of any undelivered element does not exist, all revenue is deferred until VSOE of fair value of the undelivered element is established or the element has been delivered.
Revenue related to arrangements that include hosting services is recognized in accordance to the revenue recognition criteria described above only if the client has the contractual right to take possession of the software at any time without incurring a significant penalty, and it is feasible for the client to either host the software on its own equipment or through another third party. Otherwise, the arrangement is accounted for as a service contract in which the entire arrangement is deferred and recognized over the period that the hosting services are being provided.
From time to time, we offer future purchase discounts on our products and services as part of our arrangements. Such discounts that are incremental to the range of discounts reflected in the pricing of the other elements of the arrangement, that are incremental to the range of discounts typically given in comparable transactions, and that are significant, are assessed as an additional element of the arrangement. Based on our assessments, such discounts are generally not considered to be incremental and significant. Revenue deferred related to incremental and significant future purchase options, if any, are not recognized until either the client exercises the discount offer or the offer expires.
Revenue from professional services, including implementation, training, and consulting services, are generally recognized as the corresponding services are performed. Revenue from software related subscription services and support and maintenance revenue are recognized ratably over the contractual service period. Revenue from EDI and data services and other transaction processing services are recognized at the time the services are provided to clients.
Revenue from RCM and related services is derived from service fees under our RCM arrangements, generally calculated as a percentage of total client collections. Our RCM arrangements include ongoing billing, collections, and other related services, and often may also include other products and services, such as software, software-as-a-service, support and maintenance, and professional services. We recognize RCM and related services revenue at the time collections are made by the client as the services fees are not fixed or determinable until such time.
We record revenue net of sales tax obligation in the consolidated statements of net income and comprehensive income.
61
Cash and Cash Equivalents. Cash and cash equivalents consist primarily of cash and money market funds with original maturities of less than 90 days. We had cash deposits held at U.S. banks and financial institutions at March 31, 2018 of which $27,566 was in excess of the Federal Deposit Insurance Corporation insurance limit of $250 per owner. Our cash deposits are exposed to credit loss for amounts in excess of insured limits in the event of nonperformance by the institutions; however, we do not anticipate nonperformance by these institutions.
Money market funds in which we hold a portion of our excess cash are invest in very high grade commercial and governmental instruments, and therefore bear low market risk.
Restricted Cash and Cash Equivalents. Restricted cash and cash equivalents consist of cash that is being held by the Company acting as an agent for the disbursement of certain state social and care services programs. We record an offsetting liability when we initially receive such cash from the programs. We relieve both restricted cash and cash equivalents and the related liability when amounts are disbursed. We earn an administrative fee based on a percentage of the funds disbursed on behalf of the government social and care service programs.
Accounts Receivable Reserves. We maintain reserves for potential sales returns and uncollectible accounts receivable. In aggregate, such reserves reduce our gross accounts receivable to estimated net realizable value.
Our standard contracts generally do not contain provisions for clients to return products or services. However, we historically have accepted sales returns under certain circumstances. Accordingly, we estimate sales return reserves, including reserves for returns and other credits, based upon our review of customer-specific facts and circumstances, including aged receivable balances, and recognize revenue, net of an allowance for sales returns. If we are unable to estimate the returns, revenue recognition may be delayed until the rights of return period lapses, provided also, that all other criteria for revenue recognition have been met. If we experience changes in practices related to sales returns or changes in actual return rates that deviate from the historical data on which our reserves had been established, our revenues may be adversely affected.
Allowances for doubtful accounts and other uncollectible accounts receivable related to estimated losses resulting from our clients’ inability to make required payments are established based on our historical experience of bad debt expense and the aging of our accounts receivable balances, net of deferred revenue and specifically reserved accounts. Specific reserves are based on our estimate of the probability of collection for certain troubled accounts. Accounts are written off as uncollectible only after we have expended extensive collection efforts.
Our allowances for doubtful accounts are based on our assessment of the collectability of client accounts. We regularly review the adequacy of these allowances by considering internal factors such as historical experience, credit quality and age of the client receivable balances as well as external factors such as economic conditions that may affect a client’s ability to pay and review of major third-party credit-rating agencies, as needed.
Inventory. Inventory consists of hardware for specific client orders and spare parts and are valued at lower of cost (first-in, first-out) and net realizable value. Our provision for inventory obsolescence reduces our inventory to net realizable value.
Equipment and Improvements. Equipment and improvements are stated at cost less accumulated depreciation and amortization. Repair and maintenance costs that do not improve service potential or extend economic life are expensed as incurred. Depreciation and amortization of equipment and improvements are recorded over the estimated useful lives of the assets, or the related lease terms if shorter, by the straight-line method. Useful lives generally have the following ranges:
|
|
• |
Computer equipment - 3 to 5 years |
|
|
• |
Furniture and fixtures - 3 to 7 years |
|
|
• |
Leasehold improvements - lesser of lease term or estimated useful life of asset |
Depreciation expense related to our equipment and improvements was $10,498, $10,080, and $8,834 for the years ended March 31, 2018, 2017, and 2016, respectively.
Capitalized Software Costs. Software development costs, consisting primarily of employee salaries and benefits, incurred in the research and development of new software products and enhancements to existing software products for external sale are expensed as incurred, and reported as net research and development costs in the consolidated statements of net income and comprehensive income, until technological feasibility has been established. After technological feasibility is established, additional external-sale software development costs are capitalized. Amortization of capitalized software is recorded using the greater of the ratio of current revenues to the total of current and expected revenues of the related product or the straight-line method over the estimated economic life of the related product, which is typically three years. We perform ongoing assessments of the net realizable value of such capitalized software costs. If a determination is made that capitalized amounts are not recoverable based on the projected undiscounted cash flows to be generated from the applicable software, any excess unamortized capitalized software costs are written off. In addition to the assessment of net realizable value, we routinely review the remaining estimated lives of our capitalized software costs and record adjustments, if deemed necessary. The total of capitalized software costs incurred in the development of products for external sale are reported as capitalized software costs within our consolidated balance sheets.
62
We also incur costs to develop software applications for our internal-use and costs for the development of software-as-a-service ("SaaS") based products sold to our clients. The development costs of our SaaS-based products are considered internal-use for accounting purposes. Our internal-use capitalized costs are stated at cost and amortized using the straight-line method over the estimated useful lives of the assets, which is typically three to seven years. Application development stage costs generally include costs associated with internal-use software configuration, coding, installation and testing. Costs related to the preliminary project stage and post-implementation activities are expensed as incurred. Costs of significant upgrades and enhancements that result in additional functionality are also capitalized, whereas costs incurred for maintenance and minor upgrades and enhancements are expensed as incurred. Capitalized software costs for developing SaaS-based products are reported as capitalized software costs within our consolidated balance sheets and capitalized software costs for developing our internal-use software applications are reported as equipment and improvements within our consolidated balance sheets.
Business Combinations. In accordance with the accounting for business combinations, we allocate the purchase price of the acquired business to the tangible and intangible assets acquired and liabilities assumed based on their estimated fair values as of the acquisition date. The fair values of acquired assets and liabilities assumed represent our best estimate of fair value. The estimated fair value of the acquired tangible and intangible assets and liabilities assumed were determined using multiple valuation approaches depending on the type and nature of tangible or intangible asset acquired, including but not limited to the income approach, the excess earnings method and the relief from royalty method approach. The purchase price allocation methodology contains uncertainties as it requires us make assumptions and to apply judgment to estimate the fair value of acquired assets and liabilities, including, but not limited to, intangible assets, goodwill, deferred revenue, and contingent consideration liabilities. We estimate the fair value of the contingent consideration liabilities based on our projection of expected results, as needed. Unanticipated events or circumstances may occur which could affect the accuracy of our fair value estimates, including assumptions regarding industry economic factors and business strategies. We expect to finalize the purchase price allocation as soon as practicable within the measurement period, but not later than one year following the acquisition date. Any adjustments to fair value subsequent to the measurement period are reflected in the consolidated statements of net income and comprehensive income.
Goodwill. Goodwill acquired in a business combination is measured as the excess of the purchase price, or consideration transferred, over the net acquisition date fair values of the assets acquired and the liabilities assumed. Goodwill is not amortized as it has been determined to have an indefinite useful life.
We test goodwill for impairment annually during our first fiscal quarter, referred to as the annual test date. We will also test for impairment between annual test dates if an event occurs or circumstances change that would indicate the carrying amount may be impaired.
As part of our annual goodwill impairment test, we first assess qualitative factors to determine whether it is more likely than not that the fair value of a reporting unit is less than its carrying amount. If we conclude that it is more likely than not that the fair value of a reporting unit is less than its carrying amount, we conduct a two-step quantitative goodwill impairment test. The first step of the impairment test involves comparing the fair values of the applicable reporting units with their carrying values. If the carrying amount of the reporting unit exceeds the reporting unit's fair value, we perform the second step of the goodwill impairment test. The second step of the goodwill impairment test involves comparing the implied fair value of the affected reporting unit's goodwill with the carrying value of that goodwill. The amount by which the carrying value of the goodwill exceeds its implied fair value, if any, is recognized as an impairment loss.
Intangible Assets. Intangible assets consist of customer relationships, trade names and contracts, and software technology. These intangible assets are recorded at fair value and are reported net of accumulated amortization. We currently amortize the intangible assets over periods ranging from 3 to 10 years using a method that reflects the pattern in which the economic benefits of the intangible asset are consumed. We assess the recoverability of intangible assets at least annually or whenever adverse events or changes in circumstances indicate that impairment may have occurred. If the future undiscounted cash flows expected to result from the use of the related assets are less than the carrying value of such assets, impairment is deemed to have occurred and a loss is recognized to reduce the carrying value of the intangible assets to fair value, which is determined by discounting estimated future cash flows. In addition to the impairment assessment, we routinely review the remaining estimated lives of our intangible assets and record adjustments, if deemed necessary.
Long-Lived Assets. We assess the recoverability of long-lived assets at least annually or whenever adverse events or changes in circumstances indicate that impairment may have occurred. If the future undiscounted cash flows expected to result from the use of the related assets are less than the carrying value of such assets, impairment is deemed to have occurred and a loss is recognized to reduce the carrying value of the long-lived assets to fair value, which is determined by discounting estimated future cash flows. In addition to the impairment assessment, we routinely review the remaining estimated lives of our long-lived assets and record adjustments, if deemed necessary.
Income Taxes. Income taxes are provided based on current taxable income and the future tax consequences of temporary differences between the basis of assets and liabilities for financial and tax reporting. The deferred income tax assets and liabilities represent the future state and federal tax return consequences of those differences, which will either be taxable or deductible when the assets and liabilities are recovered or settled. Deferred income taxes are also recognized for operating losses that are available to offset future taxable income and tax credits that are available to offset future income taxes. At each reporting period, we assess the realizable value of deferred tax assets based on, among other things, estimates of future taxable income and adjusts the related valuation allowance as necessary. We make a number of assumptions and estimates in determining the appropriate amount of expense to record for income taxes. The assumptions and estimates consider the taxing jurisdiction in which we operate as well as current tax regulations. Accruals are established for estimates of tax effects for certain transactions and future projected profitability based on our interpretation of existing facts and circumstances.
63
Advertising Costs. Advertising costs are expensed as incurred. We do not have any direct-response advertising. Advertising costs, which include trade shows and conventions, were approximately $9,073, $7,111, and $7,890 for the years ended March 31, 2018, 2017, and 2016, respectively, and were included in selling, general and administrative expenses in the accompanying consolidated statements of net income and comprehensive income.
Earnings per Share. We provide a dual presentation of “basic” and “diluted” earnings per share (“EPS”). Shares below are in thousands.
|
|
|
Fiscal Year Ended March 31, |
|
|||||||||
|
|
|
2018 |
|
|
2017 |
|
|
2016 |
|
|||
|
Earnings per share — Basic: |
|
|
|
|
|
|
|
|
|
|
|
|
|
Net income |
|
$ |
2,420 |
|
|
$ |
18,241 |
|
|
$ |
5,657 |
|
|
Weighted-average shares outstanding — Basic |
|
|
63,435 |
|
|
|
61,818 |
|
|
|
60,635 |
|
|
Net income per common share — Basic |
|
$ |
0.04 |
|
|
$ |
0.30 |
|
|
$ |
0.09 |
|
|
|
|
|
|
|
|
|
|
|
|
|
|
|
|
Earnings per share — Diluted: |
|
|
|
|
|
|
|
|
|
|
|
|
|
Net income |
|
$ |
2,420 |
|
|
$ |
18,241 |
|
|
$ |
5,657 |
|
|
Weighted-average shares outstanding |
|
|
63,435 |
|
|
|
61,818 |
|
|
|
60,635 |
|
|
Effect of potentially dilutive securities |
|
|
5 |
|
|
|
192 |
|
|
|
598 |
|
|
Weighted-average shares outstanding — Diluted |
|
|
63,440 |
|
|
|
62,010 |
|
|
|
61,233 |
|
|
Net income per common share — Diluted |
|
$ |
0.04 |
|
|
$ |
0.29 |
|
|
$ |
0.09 |
|
The computation of diluted net income per share does not include 2,984, 2,999 and 1,926 options for the years ended March 31, 2018, 2017, and 2016 respectively, because their inclusion would have an anti-dilutive effect on net income per share.
Share-Based Compensation. The following table shows total share-based compensation expense included in the consolidated statements of net income and comprehensive income for the fiscal year ended March 31, 2018, 2017, and 2016:
|
|
|
Fiscal Year Ended March 31, |
|
|||||||||
|
|
|
2018 |
|
|
2017 |
|
|
2016 |
|
|||
|
Costs and expenses: |
|
|
|
|
|
|
|
|
|
|
|
|
|
Cost of revenue |
|
$ |
938 |
|
|
$ |
514 |
|
|
$ |
404 |
|
|
Research and development costs, net |
|
|
2,038 |
|
|
|
973 |
|
|
|
318 |
|
|
Selling, general and administrative |
|
|
9,220 |
|
|
|
6,111 |
|
|
|
2,573 |
|
|
Total share-based compensation |
|
|
12,196 |
|
|
|
7,598 |
|
|
|
3,295 |
|
|
Income tax benefit |
|
|
(4,125 |
) |
|
|
(2,637 |
) |
|
|
(1,018 |
) |
|
Decrease in net income |
|
$ |
8,071 |
|
|
$ |
4,961 |
|
|
$ |
2,277 |
|
Recent Accounting Standards. Recent accounting pronouncements requiring implementation in current or future periods are discussed below or in the notes, where applicable.
In May 2017, the Financial Accounting Standards Board ("FASB") issued Accounting Standards Update ("ASU") 2017-09, Compensation–Stock Compensation (Topic 718): Scope of Modification Accounting ("ASU 2017-09"). ASU 2017-09 clarifies the changes to terms or conditions of a share-based payment award that require an entity to apply modification accounting. ASU 2017-09 is effective for annual periods, and interim periods within those annual periods, beginning after December 15, 2017. Early application is permitted and prospective application is required. ASU 2017-09 is effective for us in the first quarter of fiscal 2019, and we currently do not expect the adoption of this new standard to have a material impact on our consolidated financial statements.
In January 2017, the FASB issued ASU 2017-04, Intangibles–Goodwill and Other (Topic 350): Simplifying the Test for Goodwill Impairment (“ASU 2017-04”). ASU 2017-04 removes the requirement to compare the implied fair value of goodwill with its carrying amount as part of Step two of the goodwill impairment test. Instead, an entity should perform its annual, or interim, goodwill impairment test by comparing the fair value of a reporting unit with its carrying amount and should recognize an impairment charge for the amount by which the carrying amount exceeds the reporting unit's fair value. ASU 2017-04 is effective prospectively for annual and interim periods beginning after December 15, 2019, and early adoption is permitted on goodwill impairment tests performed on testing dates after January 1, 2017. ASU 2017-04 is effective for us in the fourth quarter of fiscal 2020, and we currently do not expect the adoption of this new standard to have a material impact on our consolidated financial statements.
64
In January 2017, the FASB issued ASU 2017-01, Business Combinations (Topic 805): Clarifying the Definition of a Business (“ASU 2017-01”). ASU 2017-01 clarifies the definition of a business with the objective of adding guidance to assist entities with evaluating whether transactions should be accounted for as acquisitions (or disposals) of assets or businesses. ASU 2017-01 is effective for annual periods beginning after December 15, 2017, including interim periods within those periods. Early adoption is permitted in two scenarios as identified in the new standard. ASU 2017-01 is effective for us in the first quarter of fiscal 2019, and we currently do not expect the adoption of this new standard to have a material impact on our consolidated financial statements.
In November 2016, the FASB issued Accounting Standards Update ("ASU") 2016-18, Statement of Cash Flows (Topic 230): Restricted Cash (“ASU 2016-18”). ASU 2016-18 provides guidance on the classification of restricted cash and cash equivalents in the statement of cash flows. Although it does not provide a definition of restricted cash or restricted cash equivalents, it states that amounts generally described as restricted cash and restricted cash equivalents should be included with cash and cash equivalents when reconciling the beginning-of-period and end-of period total amounts shown on the statement of cash flows. ASU 2016-18 is effective for interim and annual reporting periods beginning after December 15, 2017. Early adoption is permitted, including adoption in an interim period. ASU 2016-18 is effective for us in the first quarter of fiscal 2019, and we do not expect the adoption of this new standard to have a material impact on our consolidated financial statements.
In October 2016, the FASB issued ASU 2016-16, Income Taxes: Intra-Entity Transfers of Assets Other Than Inventory ("ASU 2016-16"). ASU 2016-16 requires the recognition of current and deferred income taxes for intra-entity asset transfers when the transaction occurs. ASU 2016-16 is effective for interim and annual reporting periods beginning after December 15, 2017. Early adoption is permitted. ASU 2016-16 is effective for us in the first quarter of fiscal 2019, and we are currently in the process of evaluating the potential impact of adoption of this updated authoritative guidance on our consolidated financial statements.
In August 2016, the FASB issued ASU 2016-15, Classification of Certain Cash Receipts and Cash Payments. ASU 2016-15 is intended to add and clarify guidance on the classification of certain cash receipts and cash payments in the statement of cash flows to eliminate diversity in practice related to how such cash receipts and cash payments are presented and classified in the statement of cash flows. ASU 2016-15 is effective for interim and annual reporting periods beginning after December 15, 2017. Early adoption is permitted, including adoption in an interim period. ASU 2016-15 is effective for us in the first quarter of fiscal 2019, and we do not expect the adoption of this new standard to have a material impact on our consolidated financial statements.
In March 2016, the FASB issued ASU 2016-09, Compensation - Stock Compensation (Topic 718): Improvements to Employee Share-Based Payment Accounting ("ASU 2016-09"). ASU 2016-09 simplifies the accounting for and reporting on share-based payment transactions, including the income tax consequences, classification of awards as either equity or liabilities, and classification on the statement of cash flows. ASU 2016-09 is effective for interim and annual reporting periods beginning after December 15, 2016, with early adoption permitted. The amendments in this update are to be applied differently upon adoption with certain amendments being applied prospectively, retrospectively and under a modified retrospective transition method. We adopted ASU 2016-09 in the first quarter of fiscal 2018. As permitted by ASU 2016-09, we have made an accounting policy election to account for forfeitures as they occur, which was adopted on a modified retrospective basis and resulted in a cumulative-effect adjustment of $0.1 million to retained earnings and additional paid-in capital as of April 1, 2017. ASU 2016-09 also eliminates additional paid-in capital pools and requires excess tax benefits and tax deficiencies to be recorded in the income statement when the awards vest or are settled, which was adopted on a prospective basis. The requirements to recognize previously unrecognized excess tax benefits on a modified retrospective basis did not have an impact on our consolidated financial statements. Upon adoption of ASU 2016-09, excess tax benefits and tax deficiencies are recognized in the income statement, and the tax effects of exercised or vested awards are treated as discrete items in the period they occur. The provisions of ASU 2016-09 could have an impact to our future income tax expense, including increased volatility in our effective tax rate on a quarter by quarter basis due to a number of factors, including fluctuations in the stock price and the timing of stock option exercises and vesting of restricted share awards. Additionally, ASU 2016-09 addresses presentation of excess tax benefits and deficiencies and employee taxes paid related to shares withheld for tax withholdings purposes on the statement of cash flows, including a requirement to present excess tax benefits and deficiencies as an operating activity in the same manner as other cash flows related to income taxes on the statement of cash flows, which will be adopted on a prospective basis, and presentation of employee taxes paid related to shares withheld for tax withholdings purposes as a financing activity, which is consistent with our current presentation and thus did not impact our consolidated financial statements.
In February 2016, the FASB issued ASU 2016-02, Leases (Topic 842) (“ASU 2016-02”), which is intended to improve financial reporting about leasing transactions. The new guidance will require lessees to recognize on their balance sheets the assets and liabilities for the rights and obligations created by leases and to disclose key information about the leasing arrangements. ASU 2016-02 is effective for interim and annual periods beginning after December 15, 2018, with early adoption permitted. ASU 2016-02 is effective for us in the first quarter of fiscal 2020. We are currently in the process of evaluating the potential impact of adoption of this updated authoritative guidance on our consolidated financial statements.
65
In May 2014, the FASB, along with the International Accounting Standards Board, issued ASU 2014-09, Revenue from Contracts with Customers ("ASU 2014-09"), which supersedes the revenue recognition requirements in ASC 605, Revenue Recognition. ASU 2014-09 provides enhancements to the quality and consistency of how revenue is reported while also improving comparability in the financial statements of companies reporting using International Financial Reporting Standards and GAAP. The core principle of this updated guidance is that an entity should recognize revenue to depict the transfer of promised goods or services to customers in an amount that reflects the consideration to which the entity expects to be entitled in exchange for those goods or services. The new standard also requires additional disclosure about revenue and provides improved guidance for multiple element arrangements. In July 2015 decision, the FASB issued ASU 2015-14, Deferral of Effective Date ("ASU 2015-14") to delay the effective date by one year. In March 2016, the FASB issued ASU 2016-08, Revenue from Contracts with Customers (Topic 606) –Principal versus Agent Consideration ("ASU 2016-08"). In April 2016, the FASB issued ASU 2016-10, Revenue from Contracts with Customers (Topic 606) - Identifying Performance Obligations and Licensing ("ASU 2016-10”). In May 2016, the FASB issued ASU 2016-11, Revenue from Contracts with Customers (Topic 606) and Derivatives and Hedging (Topic 815) – Rescission of SEC Guidance Because of ASU 2014-09 and 2014-16 ("ASU 2016-11") and ASU 2016-12, Revenue from Contracts with Customers (Topic 606) –Narrow Scope Improvements and Practical Expedients ("ASU 2016-12"). The new ASUs do not change the core principle of the guidance in Topic 606 (as amended by ASU 2014-09), but rather help to provide further interpretive clarifications on the new guidance in ASU 2014-09. ASU 2014-09, as amended by ASU 2015-14, is effective for us in the first quarter of fiscal 2019. Companies are permitted to adopt this new guidance following either a full retrospective or modified retrospective approach.
We expect to implement the new revenue guidance when it becomes effective for us in the first quarter of fiscal 2019 utilizing the modified retrospective transition method. Under this transition method, prior period amounts will not be adjusted and the cumulative effect from prior periods of applying the new revenue guidance will be recognized in our consolidated balance sheets as of the date of adoption, including an adjustment to retained earnings.
We have completed our assessment of the potential impacts to our business processes, systems, and internal controls that could result from the implementation of the new revenue guidance. We expect that the new revenue guidance will result in additional complexity to our revenue recognition, including the use of an increased amount of significant judgments and estimates, particularly as it relates to our RCM services revenue, as compared to our current revenue recognition. RCM services revenue is derived from sales under our NextGen Financial Suite arrangements that include ongoing billing, collections, and other related services, and often may also include other products and services, such as software, subscriptions, support and maintenance, and professional services, for which service fees are generally calculated as a percentage of total client collections. Currently, we recognize RCM services revenue at the time collections are made by the client as the services fees are not fixed or determinable until such time. Substantially all revenues under our RCM services arrangements are currently reported as RCM and related services revenue in the consolidated statements of net income and comprehensive income. Upon the adoption of the new revenue guidance, we will estimate the total consideration to which we expect to be entitled over the non-cancellable contractual period of the RCM services arrangements and allocate the total consideration to the various performance obligations that may be included in the arrangement. As a result, a portion of revenues from our RCM services arrangements that were previously recognized and reported as RCM and related services revenue will be recognized as software, subscriptions, support and maintenance, and professional services revenue subsequent to the adoption of the new revenue guidance. Under the new revenue guidance, the timing of revenue recognition is based upon the transfer of value of the promised goods or services to our clients, which may result in an acceleration of revenue recognition under our RCM services arrangements as our software, subscriptions, support and maintenance, and professional services may be transferred to the client prior to time that client collections occur. Accordingly, we preliminarily expect a decrease in our RCM services revenue with a corresponding increase to our software, subscriptions, and professional services revenue subsequent to the adoption of the new revenue guidance.
Additionally, certain incremental costs incurred to obtain contracts with customers, such as sales commissions, are within the scope of the new revenue guidance and are required to be capitalized and amortized to expense over the remaining performance periods of the contracts. Currently, our sales commission are capitalized and amortized to expense over the related period of revenue recognition, which is generally one-year, or up to five-years for certain longer-term arrangements. We currently expect an increase in the amortization period of capitalized sales commissions upon adoption of the new revenue guidance, and we are currently in the process of evaluating the potential impact of the capitalization and amortization of sales commissions on our consolidated financial statements.
Based on our assessment, we currently believe that the impact on our consolidated financial statements could be material. Due to the complexity of our revenue recognition, a significant amount of work remains as we continue to evaluate all potential impacts of the new revenue guidance, and develop and implement the necessary changes to our current accounting systems, processes, and internal controls. Accordingly, our preliminary assessments are subject to change.
We do not believe that any other recently issued, but not yet effective accounting standards, if adopted, would have a material impact on our consolidated financial statements.
At March 31, 2018 and March 31, 2017, we had cash and cash equivalents of $28,845 and $37,673, respectively. Cash and cash equivalents consist primarily of cash and money market funds with original maturities of less than 90 days.
66
The following tables set forth by level within the fair value hierarchy our financial assets and liabilities that were accounted for at fair value on a recurring basis at March 31, 2018 and March 31, 2017:
|
|
|
Balance At |
|
|
Quoted Prices in Active Markets for Identical Assets |
|
|
Significant Other Observable Inputs |
|
|
Unobservable Inputs |
|
||||
|
|
|
March 31, 2018 |
|
|
(Level 1) |
|
|
(Level 2) |
|
|
(Level 3) |
|
||||
|
ASSETS |
|
|
|
|
|
|
|
|
|
|
|
|
|
|
|
|
|
Cash and cash equivalents (1) |
|
$ |
28,845 |
|
|
$ |
28,845 |
|
|
$ |
— |
|
|
$ |
— |
|
|
Restricted cash and cash equivalents |
|
|
2,373 |
|
|
|
2,373 |
|
|
|
— |
|
|
|
— |
|
|
|
|
$ |
31,218 |
|
|
$ |
31,218 |
|
|
$ |
— |
|
|
$ |
— |
|
|
|
|
Balance At |
|
|
Quoted Prices in Active Markets for Identical Assets |
|
|
Significant Other Observable Inputs |
|
|
Unobservable Inputs |
|
||||
|
|
|
March 31, 2017 |
|
|
(Level 1) |
|
|
(Level 2) |
|
|
(Level 3) |
|
||||
|
ASSETS |
|
|
|
|
|
|
|
|
|
|
|
|
|
|
|
|
|
Cash and cash equivalents (1) |
|
$ |
37,673 |
|
|
$ |
37,673 |
|
|
$ |
— |
|
|
$ |
— |
|
|
Restricted cash and cash equivalents |
|
|
4,916 |
|
|
|
4,916 |
|
|
|
— |
|
|
|
— |
|
|
|
|
$ |
42,589 |
|
|
$ |
42,589 |
|
|
$ |
— |
|
|
$ |
— |
|
|
LIABILITIES |
|
|
|
|
|
|
|
|
|
|
|
|
|
|
|
|
|
Contingent consideration related to acquisitions |
|
$ |
18,817 |
|
|
$ |
— |
|
|
$ |
18,817 |
|
|
$ |
— |
|
|
|
|
$ |
18,817 |
|
|
$ |
— |
|
|
$ |
18,817 |
|
|
$ |
— |
|
(1) Cash equivalents consist primarily of money market funds.
The contingent consideration liability as of March 31, 2017 relates to the acquisition of HealthFusion, which was settled during the quarter ended June 30, 2017. The measurement period of the contingent consideration liability ended on December 31, 2016, and thus the actual revenue achievement rate was utilized to compute the ending contingent consideration liability as of March 31, 2017. Accordingly, the contingent consideration liability was reflected under a Level 2 valuation hierarchy because the fair value was determined based on other significant observable inputs.
The following table presents activity in our financial assets and liabilities measured at fair value using significant unobservable inputs (Level 3), as of and for the years ended March 31, 2017:
|
|
|
Total Liabilities |
|
|
|
Balance at March 31, 2016 |
|
$ |
23,843 |
|
|
Settlement of share-based contingent consideration related to Mirth |
|
|
(9,273 |
) |
|
Fair value adjustments, net |
|
|
4,247 |
|
|
Transfer of HealthFusion contingent consideration to Level 2 |
|
|
(18,817 |
) |
|
Balance at March 31, 2017 |
|
$ |
— |
|
During the year ended March 31, 2017, we issued shares of common stock to settle $9,273 in contingent consideration liabilities related to the acquisition of Mirth and recorded $4,247 of net fair value adjustments to contingent consideration liabilities, of which $3,817 was related to HealthFusion and $430 was related to Mirth. The fair value adjustments to contingent consideration liabilities are included as a component of selling, general and administrative expense in the consolidated statements of net income and comprehensive income.
We believe that the fair value of other financial assets and liabilities, including accounts receivable, accounts payable, and line of credit, approximate their respective carrying values due to their nominal credit risk.
Non-Recurring Fair Value Measurements
We have certain assets, including goodwill and other intangible assets, which are measured at fair value on a non-recurring basis and are adjusted to fair value only if an impairment charge is recognized. The categorization of the framework used to measure fair value of the assets is considered to be within the Level 3 valuation hierarchy due to the subjective nature of the unobservable inputs used. During the year ended March 31, 2018, we recorded an impairment of $3,757 to our acquired trade names intangible assets, which was the result of the elimination of certain legacy brand and trade names due to the launching of our new branding, identity, and corporate logo intended to reflect our expanded health technology portfolio following years of recent acquisitions. During the years ended March 31, 2018 and 2017, we also recorded certain measurement period adjustments to goodwill (see Note 5).
67
5. Business Combinations and Disposals
On January 31, 2018, we completed the acquisition of Inforth Technologies, LLC ("Inforth") pursuant to the Membership Interest Purchase Agreement, dated January 31, 2018. Headquartered in Traverse City, MI. Inforth was one of our premier clinical content and technical services partners specializing in comprehensive solutions for physician practices. The preliminary purchase price of Inforth totaled $4,337 and was funded by cash flows from operations.
On August 16, 2017, we completed the acquisition of EagleDream Health, Inc. ("EagleDream") pursuant to the Agreement and Plan of Merger, dated July 31, 2017. Headquartered in Rochester, NY, EagleDream provides cloud-based analytics that drives meaningful insight across clinical, financial and administrative data to optimize practice performance. The preliminary purchase price of EagleDream totaled $25,609, which included preliminary working capital and other customary adjustments, and was partially funded by a draw against our revolving credit agreement (see Note 9).
On April 14, 2017, we completed our acquisition of Entrada, Inc. ("Entrada") pursuant to the terms of the Agreement and Plan of Merger, dated April 11, 2017. Based in Nashville, TN, Entrada is a leading provider of cloud-based solutions that are reshaping the way care is delivered by leveraging the power of mobile whenever and wherever care happens. Entrada’s best-in-class mobile application integrates with multiple clinical platforms and all major electronic health record systems. Entrada enables organizations to maximize their existing technology investments while simultaneously enhancing physician and staff productivity. The acquisition of Entrada and its cloud-based, mobile application is part of our commitment to deliver systematic solutions that meet its clients' transforming work requirements to become increasingly nimble and mobile. The preliminary purchase price of Entrada totaled $33,958, which included preliminary working capital and other customary adjustments and was primarily funded by a draw against our revolving credit agreement (see Note 9).
On January 4, 2016, we completed our acquisition of HealthFusion Holdings, Inc. ("HealthFusion") pursuant to the Agreement and Plan of Merger, dated October 30, 2015. HealthFusion provides Web-based, cloud computing software for physicians, medical billing service providers, and hospitals. Its flagship product, MediTouch®, is a fully-integrated, cloud-based software suite consisting of clearinghouse, practice management, electronic health records, and patient portals with rich functionality to enable mobility, workflow automation, and advanced reporting and analytics aimed primarily at small-to-mid-size physician practices. The acquisition of HealthFusion is part of our strategy to expand its client base and cloud-based solution capabilities in the ambulatory market. Over time, we plan to expand the HealthFusion platform to satisfy the needs of practices of increasing size and complexity. The purchase price of HealthFusion totaled $183,049, which included working capital and other customary adjustments and the fair value of contingent consideration related to an additional $25,000 of cash in the form of an earnout, subject to HealthFusion achieving certain revenue targets through December 31, 2016. The initial estimated fair value of contingent consideration of $16,700 was based on a Monte Carlo-based valuation model that considered, among other assumptions and inputs, our estimate of projected HealthFusion revenues. As of March 31, 2017, the fair value of the contingent consideration was $18,817, which was paid and settled during the quarter ended June 30, 2017. The acquisition of HealthFusion was initially funded by a draw against the revolving credit agreement (see Note 9), a portion of which was subsequently repaid from existing cash on hand.
We accounted for the acquisitions noted above as purchase business combinations using the acquisition method of accounting. The purchase price allocation of the Inforth, EagleDream, and Entrada acquisitions are deemed to be preliminary. The purchase price allocation of the HealthFusion acquisition was considered final as of March 31, 2017.
The purchase price was allocated to the tangible and intangible assets acquired and liabilities assumed based on their estimated fair values as of the acquisition date. The preliminary fair values of acquired assets and liabilities assumed represent management’s estimate of fair value and are subject to change if additional information, such as changes to deferred taxes and/or working capital, becomes available. We expect to finalize the purchase price allocation as soon as practicable within the measurement period, but not later than one year following the acquisition date.
Goodwill represents the excess of the purchase price over the net identifiable assets acquired and liabilities assumed. Goodwill primarily represents, among other factors, the value of synergies expected to be realized and the assemblage of all assets that enable us to create new client relationships, neither of which qualify as separate amortizable intangible assets. Goodwill arising from the acquisition of Inforth is considered deductible for tax purposes, and goodwill arising from the acquisitions of EagleDream, Entrada, and HealthFusion are not deductible for tax purposes.
68
The total preliminary purchase price for the acquisitions of Inforth, EagleDream, and Entrada and final purchase price for the acquisition of HealhtFusion are summarized as follows:
|
|
Inforth |
|
|
EagleDream |
|
|
Entrada |
|
|
|
|
|
|||
|
|
Preliminary |
|
|
Preliminary |
|
|
Preliminary |
|
|
HealthFusion |
|
||||
|
|
Purchase Price |
|
|
Purchase Price |
|
|
Purchase Price |
|
|
Purchase Price |
|
||||
|
Initial purchase price |
$ |
4,000 |
|
|
$ |
26,000 |
|
|
$ |
34,000 |
|
|
$ |
165,000 |
|
|
Settlement of pre-existing net liabilities |
|
337 |
|
|
|
— |
|
|
|
— |
|
|
|
— |
|
|
Contingent consideration |
|
— |
|
|
|
— |
|
|
|
— |
|
|
|
16,700 |
|
|
Working capital and other adjustments |
|
— |
|
|
|
(391 |
) |
|
|
(42 |
) |
|
|
1,349 |
|
|
Total purchase price |
$ |
4,337 |
|
|
$ |
25,609 |
|
|
$ |
33,958 |
|
|
$ |
183,049 |
|
|
|
|
|
|
|
|
|
|
|
|
|
|
|
|
|
|
|
Fair value of the net tangible assets acquired and liabilities assumed: |
|
|
|
|
|
|
|
|
|
|
|
|
|
|
|
|
Acquired cash and cash equivalents |
$ |
25 |
|
|
$ |
573 |
|
|
$ |
102 |
|
|
$ |
2,225 |
|
|
Accounts receivable |
|
6 |
|
|
|
217 |
|
|
|
1,836 |
|
|
|
1,514 |
|
|
Prepaid expense and other current assets |
|
— |
|
|
|
20 |
|
|
|
145 |
|
|
|
4,645 |
|
|
Equipment and improvements |
|
— |
|
|
|
— |
|
|
|
163 |
|
|
|
767 |
|
|
Capitalized software costs |
|
— |
|
|
|
— |
|
|
|
364 |
|
|
|
307 |
|
|
Deferred income tax asset |
|
— |
|
|
|
— |
|
|
|
117 |
|
|
|
— |
|
|
Other assets |
|
— |
|
|
|
— |
|
|
|
— |
|
|
|
700 |
|
|
Accounts payable |
|
— |
|
|
|
(115 |
) |
|
|
(639 |
) |
|
|
(1,085 |
) |
|
Accrued compensation and related benefits |
|
(49 |
) |
|
|
(691 |
) |
|
|
(120 |
) |
|
|
(533 |
) |
|
Deferred revenues |
|
— |
|
|
|
(394 |
) |
|
|
(234 |
) |
|
|
(1,067 |
) |
|
Deferred income tax liability |
|
— |
|
|
|
(1,811 |
) |
|
|
— |
|
|
|
(9,089 |
) |
|
Other liabilities |
|
(22 |
) |
|
|
(122 |
) |
|
|
(444 |
) |
|
|
(2,721 |
) |
|
Total net tangible assets acquired and liabilities assumed |
|
(40 |
) |
|
|
(2,323 |
) |
|
|
1,290 |
|
|
|
(4,337 |
) |
|
Fair value of identifiable intangible assets acquired: |
|
|
|
|
|
|
|
|
|
|
|
|
|
|
|
|
Goodwill |
|
1,177 |
|
|
|
14,532 |
|
|
|
17,268 |
|
|
|
112,386 |
|
|
Software technology |
|
3,200 |
|
|
|
12,800 |
|
|
|
10,500 |
|
|
|
42,500 |
|
|
Customer relationships |
|
— |
|
|
|
600 |
|
|
|
3,300 |
|
|
|
28,500 |
|
|
Trade name |
|
— |
|
|
|
— |
|
|
|
1,600 |
|
|
|
4,000 |
|
|
Total identifiable intangible assets acquired |
|
4,377 |
|
|
|
27,932 |
|
|
|
32,668 |
|
|
|
187,386 |
|
|
Total purchase price |
$ |
4,337 |
|
|
$ |
25,609 |
|
|
$ |
33,958 |
|
|
$ |
183,049 |
|
As noted in the table above, we recorded $3,200 of Inforth intangible assets related to software technology, which is being amortized over 5 years. We recorded $13,400 of EagleDream intangible assets related to customer relationships and software technology, which are being amortized over 8 years and 5 years, respectively. The weighted average amortization period for the acquired EagleDream intangible assets is 5.1 years. We also recorded $15,400 of Entrada intangible assets related to customer relationships, trade names, and software technology, which are being amortized over 10 years, 5 years, and 5 years, respectively. The weighted average amortization period for the acquired Entrada intangible assets is 6.1 years.
In connection with the HealthFusion acquisition, we recorded $75,000 of intangible assets related to customer relationships, trade names and software technology. We are amortizing the HealthFusion customer relationships over 10 years and trade names and software technology over 5 years. The weighted average amortization period for the acquired HealthFusion intangible assets is 6.9 years.
During the year ended March 31, 2018, we recorded a measurement period adjustment of $274 to EagleDream goodwill related to liabilities which existed at the time of acquisition, partially offset by changes in deferred taxes based on the filing of tax returns, and a measurement period adjustment of $924 to Entrada goodwill related to changes in deferred taxes based on the filing of tax returns.
During the year ended March 31, 2017, we recorded a measurement period adjustment of $2,938 to HealthFusion goodwill related to changes in deferred taxes based on the filing of final tax returns.
The revenues, earnings, and pro forma effects of the Inforth, EagleDream, and Entrada acquisitions would not have been material to our results of operations, individually and in aggregate, and are therefore not presented.
Including the effect of certain acquisition-related fair value adjustments, amortization of acquired intangible assets, and interest expense associated with the revolving credit agreement, the acquisition of HealthFusion contributed revenues of $8,781 and estimated net loss of $1,149 to our consolidated results for the year ended March 31, 2016.
69
The following table presents unaudited supplemental pro forma consolidated revenue and net income as if the acquisition of HealthFusion had occurred on April 1, 2014 (the beginning of the comparable prior annual reporting period).
|
|
|
Pro forma year ended March 31, 2016 (unaudited) |
|
|
|
Combined revenues |
|
|
518,708 |
|
|
Combined net income |
|
|
134 |
|
The pro forma revenue and net income were derived by combining our historical results with HealthFusion's historical results, after applying our accounting policies and making adjustments related to the amortization of acquired intangible assets and interest expense associated with the revolving credit agreement. Specifically, the pro forma combined net income for the year ended March 31, 2016 include estimated amortization of acquired intangible assets and of estimated interest expense.
On October 22, 2015, we closed an Asset Purchase Agreement with Quadramed Affinity Corporation in which we sold and assigned substantially all assets and liabilities of the former Hospital Solutions division. We believed that the Hospital disposition would allow us to focus our efforts and resources on our core ambulatory business. The financial terms of the transaction and the amount of consideration received were not significant. Since the Hospital disposition did not have a major effect on our operations and financial results, separate discontinued operations reporting was not provided.
We incurred a loss on the Hospital disposition of $1,366 in the year ended March 31, 2016, which was recorded in our consolidated statements of net income and comprehensive income as a component of selling, general and administrative expense. The loss was measured as the total consideration received and expected to be received less the lower of carrying value or fair value of the former Hospital Solutions division. Additionally, we incurred $387 in direct incremental costs of disposition and $335 in severance and other employee-related costs in connection with the Hospital disposition during the year ended March 31, 2016, which were recorded in our consolidated statements of net income and comprehensive income as a component of selling, general and administrative expense.
We test goodwill for impairment annually during our first fiscal quarter, referred to as the annual test date. Based on our assessment, we have determined that there was no impairment to our goodwill as of June 30, 2017. We will also test for impairment between annual test dates if an event occurs or circumstances change that would indicate the carrying amount may be impaired.
During the years ended March 31, 2018 and March 31, 2017, we did not identify any events or circumstances that would require an interim goodwill impairment test.
We do not amortize goodwill as it has been determined to have an indefinite useful life. The carrying amount of goodwill as of March 31, 2018 was $218,875, which reflects the acquisitions of Entrada, EagleDream and Inforth (see Note 5). The carrying amount of goodwill as of March 31, 2017 was $185,898. During the years ended March 31, 2018 and 2017, we also recorded certain measurement period adjustments to goodwill (see Note 5).
During the year ended March 31, 2018, we recorded an impairment of $3,757 to our acquired trade names intangible assets that is reflected within the impairment of assets caption in our consolidated statements of net income and comprehensive income. The impairment was the result of the elimination of certain legacy brand and trade names due to the launching of our new branding, identity, and corporate logo intended to reflect our expanded health technology portfolio following years of recent acquisitions.
Our definite-lived intangible assets, other than capitalized software development costs, are summarized as follows:
|
|
|
|
|
March 31, 2018 |
|
|||||||||
|
|
|
|
|
Customer |
|
|
Software |
|
|
|
|
|
||
|
|
|
|
|
Relationships |
|
|
Technology |
|
|
Total |
|
|||
|
Gross carrying amount |
|
|
|
$ |
54,450 |
|
|
$ |
94,310 |
|
|
$ |
148,760 |
|
|
Accumulated amortization |
|
|
|
|
(35,531 |
) |
|
|
(39,138 |
) |
|
|
(74,669 |
) |
|
Net intangible assets |
|
|
|
$ |
18,919 |
|
|
$ |
55,172 |
|
|
$ |
74,091 |
|
70
|
|
|
March 31, 2017 |
|
|||||||||||||
|
|
|
Customer |
|
|
Trade Name |
|
|
Software |
|
|
|
|
|
|||
|
|
|
Relationships |
|
|
and Contracts |
|
|
Technology |
|
|
Total |
|
||||
|
Gross carrying amount |
|
$ |
50,550 |
|
|
$ |
5,480 |
|
|
$ |
67,810 |
|
|
$ |
123,840 |
|
|
Accumulated amortization |
|
|
(28,972 |
) |
|
|
(2,088 |
) |
|
|
(23,567 |
) |
|
|
(54,627 |
) |
|
Net intangible assets |
|
$ |
21,578 |
|
|
$ |
3,392 |
|
|
$ |
44,243 |
|
|
$ |
69,213 |
|
Amortization expense related to customer relationships and trade name and contracts recorded as operating expenses in the consolidated statements of net income and comprehensive income was $7,810, $10,435, and $5,368 for the years ended March 31, 2018, 2017 and 2016, respectively. Amortization expense related to software technology recorded as cost of revenue was $15,570, $12,027, and $5,646 for the years ended March 31, 2018, 2017, and 2016, respectively.
The following table summarizes the remaining estimated amortization of definite-lived intangible assets as of March 31, 2018:
|
|
|
Estimated Remaining Amortization Expense |
|
|||||||||
|
|
|
Operating Expense |
|
|
Cost of Revenue |
|
|
Total |
|
|||
|
For the year ended March 31, |
|
|
|
|
|
|
|
|
|
|
|
|
|
2019 |
|
$ |
4,345 |
|
|
$ |
17,151 |
|
|
$ |
21,496 |
|
|
2020 |
|
|
3,460 |
|
|
|
17,151 |
|
|
|
20,611 |
|
|
2021 |
|
|
2,803 |
|
|
|
13,268 |
|
|
|
16,071 |
|
|
2022 |
|
|
2,273 |
|
|
|
5,480 |
|
|
|
7,753 |
|
|
2023 |
|
|
1,866 |
|
|
|
1,761 |
|
|
|
3,627 |
|
|
2024 and beyond |
|
|
4,172 |
|
|
|
361 |
|
|
|
4,533 |
|
|
Total |
|
$ |
18,919 |
|
|
$ |
55,172 |
|
|
$ |
74,091 |
|
Our capitalized software costs are summarized as follows:
|
|
|
March 31, 2018 |
|
|
March 31, 2017 |
|
||
|
Gross carrying amount |
|
$ |
50,361 |
|
|
$ |
104,948 |
|
|
Accumulated amortization |
|
|
(24,043 |
) |
|
|
(91,341 |
) |
|
Net capitalized software costs |
|
$ |
26,318 |
|
|
$ |
13,607 |
|
During the year ended March 31, 2018, we acquired $364 in capitalized software from Entrada (see Note 5) and retired $73,817 of fully amortized capitalized software costs that are no longer being utilized by our client base. Amortization expense related to capitalized software costs was $6,518, $7,892, and $9,891 for the years ended March 31, 2018, 2017, and 2016, respectively, and is recorded as cost of revenue in the consolidated statements of net income and comprehensive income.
The following table presents the remaining estimated amortization of capitalized software costs as of March 31, 2018. The estimated amortization is comprised of (i) amortization of released products and (ii) the expected amortization for products that are not yet available for sale based on their estimated economic lives and projected general release dates.
|
For the year ended March 31, |
|
|
|
|
|
2019 |
|
$ |
12,800 |
|
|
2020 |
|
|
8,100 |
|
|
2021 |
|
|
4,600 |
|
|
2022 |
|
|
818 |
|
|
Total |
|
$ |
26,318 |
|
71
During the year ended March 31, 2016, we recorded a non-cash impairment charge of $32,238 that is reflected within the impairment of assets caption in our consolidated statements of net income and comprehensive income. The impairment relates to the previously capitalized investment in the NextGen Now development project, which we deemed to have zero net realizable value. The impairment charge did not result in any cash expenditures. The impairment charge followed our assessment of the NextGen Now development project and the MediTouch platform that we obtained through our acquisition of HealthFusion. We had determined that the MediTouch platform offered the most efficient path to providing a high-quality, robust, cloud-based solution for ambulatory care and decided to cease further investment in NextGen Now and immediately discontinued all efforts to use or repurpose the NextGen Now platform.
9. Line of Credit
On March 29, 2018, we entered into a $300,000 amended and restated revolving credit agreement (the “Credit Agreement”) with JPMorgan Chase Bank, N.A., as administrative agent, U.S. Bank National Association, as syndication agent, and certain other agents and lenders. The Credit Agreement replaces our prior $250,000 revolving credit agreement originally entered into on January 4, 2016 (“Original Credit Agreement”). The Credit Agreement provides a subfacility of up to $10,000 for letters of credit and a subfacility of up to $10,000 for swing-line loans and also includes a $100,000 accordion feature that provides us with the ability to obtain up to $400,000 in the aggregate of revolving credit commitments and/or term loans upon satisfaction of certain conditions.
The Credit Agreement matures on March 29, 2023 and the full balance of the revolving loans and all other obligations under the agreement must be paid at that time. In addition, we are required to prepay the revolving loan balance if at any time the aggregate principal amount outstanding under the Credit Agreement exceeds the aggregate commitments thereunder. The Credit Agreement is secured by substantially all of our existing and future property. The revolving loans under the Credit Agreement will be available for letters of credit, permitted acquisitions, working capital and general corporate purposes.
The revolving loans under the Credit Agreement bear interest at our option of either, (a) for base rate loans, a base rate based on the highest of (i) 0%, (ii) the rate of interest publicly announced by the administrative agent as its prime rate in effect at its principal office in New York City, (iii) the overnight bank funding rate (not to be less than zero) as determined by the Federal Reserve Bank of New York plus 0.50% or (iv) the LIBOR-based rate for one, two, three or six months Eurodollar deposits plus 1%, and (b) for Eurodollar loans, the LIBOR-based rate for one, two, three or six months (as selected by us) Eurodollar deposits plus 1.00%, plus, in each case, an applicable margin based on our total leverage ratio from time to time, ranging from 0.50% to 1.50% for base rate loans, and from 1.50% to 2.50% for Eurodollar loans. We will also pay a commitment fee of between 0.25% and 0.45%, payable quarterly in arrears, on the average daily unused amount of the revolving facility based on our total leverage ratio from time to time.
The revolving loans under the Credit Agreement are subject to customary representations, warranties and ongoing affirmative and negative covenants and agreements. The negative covenants include, among other things, limitations on indebtedness, liens, asset sales, mergers and acquisitions, investments, transactions with affiliates, dividends and other restricted payments, subordinated indebtedness and amendments to subordinated indebtedness documents and sale and leaseback transactions. The Credit Agreement also requires us to maintain (1) a maximum net leverage ratio of 3.00 to 1.00 and (2) a minimum fixed charge coverage ratio of 3.00 to 1.00 at the end of each fiscal quarter through the term of the loan. We were in compliance with all financial and non-financial covenants under the Credit Agreement as of March 31, 2018.
As of March 31, 2018, we had $37,000 in outstanding loans and $263,000 of unused credit under the Credit Agreement. As of March 31, 2017, we had $15,000 in outstanding loans and $235,000 of unused credit under the Original Credit Agreement. The interest rates as of March 31, 2018 and 2017 was approximately 3.1% and 2.3%, respectively.
During the years ended March 31, 2018, 2017, and 2016 we recorded $1,812, $1,899, and $969 of interest expense (excluding amortization of deferred debt issuance costs), respectively, and the weighted average interest rates were approximately 2.8%, 2.4%, and 3.2% respectively.
Costs incurred in connection with securing the Credit Agreement, including fees paid to legal advisors and third parties, are deferred and amortized to interest expense over the term of the Credit Agreement. Deferred debt issuance costs are reported as a component of other assets on the consolidated balance sheets. As of March 31, 2018, total unamortized debt issuance costs were $3,549, which includes $1,105 of additional costs related to the Credit Agreement, and net of $536 unamortized debt issuance costs that were written off in connection with amending the Original Credit Agreement. As of March 31, 2017, total unamortized debt issuance costs were $4,048. During the years ended March 31, 2018, 2017, and 2016, we recorded $1,610, $1,076, and $258, respectively, in amortization of deferred debt issuance costs.
72
10. Composition of Certain Financial Statement Captions
Accounts receivable may include amounts invoiced for undelivered products and services at each period end. Undelivered products and services are included as a component of the deferred revenue balance on the accompanying consolidated balance sheets.
|
|
|
March 31, 2018 |
|
|
March 31, 2017 |
|
||
|
Accounts receivable, gross |
|
$ |
94,358 |
|
|
$ |
93,377 |
|
|
Sales return reserve |
|
|
(5,520 |
) |
|
|
(7,213 |
) |
|
Allowance for doubtful accounts |
|
|
(3,876 |
) |
|
|
(2,757 |
) |
|
Accounts receivable, net |
|
$ |
84,962 |
|
|
$ |
83,407 |
|
Inventory is comprised of finished goods of computer systems and components.
Prepaid expenses and other current assets are summarized as follows:
|
|
|
March 31, 2018 |
|
|
March 31, 2017 |
|
||
|
Prepaid expenses |
|
$ |
16,693 |
|
|
$ |
14,884 |
|
|
Other current assets |
|
|
487 |
|
|
|
3,085 |
|
|
Prepaid expenses and other current assets |
|
$ |
17,180 |
|
|
$ |
17,969 |
|
Equipment and improvements are summarized as follows:
|
|
|
March 31, 2018 |
|
|
March 31, 2017 |
|
||
|
Computer equipment |
|
$ |
27,347 |
|
|
$ |
22,014 |
|
|
Internal-use software |
|
|
15,804 |
|
|
|
13,053 |
|
|
Furniture and fixtures |
|
|
11,432 |
|
|
|
10,472 |
|
|
Leasehold improvements |
|
|
16,016 |
|
|
|
16,360 |
|
|
Equipment and improvements, gross |
|
|
70,599 |
|
|
|
61,899 |
|
|
Accumulated depreciation and amortization |
|
|
(43,804 |
) |
|
|
(34,473 |
) |
|
Equipment and improvements, net |
|
$ |
26,795 |
|
|
$ |
27,426 |
|
The current portion of deferred revenues are summarized as follows:
|
|
|
March 31, 2018 |
|
|
March 31, 2017 |
|
||
|
Professional services |
|
$ |
20,982 |
|
|
$ |
21,889 |
|
|
Software license, hardware and other |
|
|
12,879 |
|
|
|
12,680 |
|
|
Support and maintenance |
|
|
11,375 |
|
|
|
9,691 |
|
|
Software related subscription services |
|
|
8,843 |
|
|
|
8,123 |
|
|
Deferred revenue |
|
$ |
54,079 |
|
|
$ |
52,383 |
|
Accrued compensation and related benefits are summarized as follows:
|
|
|
March 31, 2018 |
|
|
March 31, 2017 |
|
||
|
Payroll, bonus and commission |
|
$ |
18,120 |
|
|
$ |
15,836 |
|
|
Vacation |
|
|
9,790 |
|
|
|
8,677 |
|
|
Accrued compensation and related benefits |
|
$ |
27,910 |
|
|
$ |
24,513 |
|
73
Other current and noncurrent liabilities are summarized as follows:
|
|
|
March 31, 2018 |
|
|
March 31, 2017 |
|
||
|
Accrued securities litigation settlement |
|
$ |
19,000 |
|
|
$ |
— |
|
|
Accrued consulting and outside services |
|
|
4,428 |
|
|
|
2,496 |
|
|
Customer credit balances and deposits |
|
|
4,287 |
|
|
|
4,124 |
|
|
Accrued outsourcing costs |
|
|
2,898 |
|
|
|
1,588 |
|
|
Care services liabilities |
|
|
2,373 |
|
|
|
4,957 |
|
|
Accrued EDI expense |
|
|
2,310 |
|
|
|
2,490 |
|
|
Deferred rent and lease obligations |
|
|
2,266 |
|
|
|
2,427 |
|
|
Accrued self insurance expense |
|
|
2,145 |
|
|
|
1,697 |
|
|
Accrued legal expense |
|
|
1,793 |
|
|
|
853 |
|
|
Accrued hosting costs |
|
|
1,600 |
|
|
|
401 |
|
|
Accrued royalties |
|
|
1,400 |
|
|
|
2,033 |
|
|
Sales tax payable |
|
|
499 |
|
|
|
448 |
|
|
Employee benefit plan withholdings |
|
|
174 |
|
|
|
739 |
|
|
Contingent consideration and other liabilities related to acquisitions |
|
|
— |
|
|
|
18,817 |
|
|
Other accrued expenses |
|
|
3,144 |
|
|
|
3,705 |
|
|
Other current liabilities |
|
$ |
48,317 |
|
|
$ |
46,775 |
|
|
|
|
|
|
|
|
|
|
|
|
Deferred rent and lease obligations |
|
$ |
10,864 |
|
|
$ |
11,402 |
|
|
Uncertain tax positions |
|
|
2,419 |
|
|
|
4,762 |
|
|
Other liabilities |
|
|
211 |
|
|
|
297 |
|
|
Other noncurrent liabilities |
|
$ |
13,494 |
|
|
$ |
16,461 |
|
11. Income Taxes
The provision for (benefit of) income taxes consists of the following components:
|
|
|
Fiscal Year Ended March 31, |
|
|||||||||
|
|
|
2018 |
|
|
2017 |
|
|
2016 |
|
|||
|
Current: |
|
|
|
|
|
|
|
|
|
|
|
|
|
Federal taxes |
|
$ |
(2,788 |
) |
|
$ |
3,443 |
|
|
$ |
(9,338 |
) |
|
State taxes |
|
|
(1,073 |
) |
|
|
1,556 |
|
|
|
(403 |
) |
|
Foreign taxes |
|
|
678 |
|
|
|
498 |
|
|
|
374 |
|
|
Total current taxes |
|
|
(3,183 |
) |
|
|
5,497 |
|
|
|
(9,367 |
) |
|
Deferred: |
|
|
|
|
|
|
|
|
|
|
|
|
|
Federal taxes |
|
$ |
2,949 |
|
|
$ |
824 |
|
|
$ |
10,474 |
|
|
State taxes |
|
|
(2,510 |
) |
|
|
(879 |
) |
|
|
(100 |
) |
|
Foreign taxes |
|
|
(86 |
) |
|
|
(74 |
) |
|
|
(344 |
) |
|
Total deferred taxes |
|
|
353 |
|
|
|
(129 |
) |
|
|
10,030 |
|
|
Provision for (benefit of) income taxes |
|
$ |
(2,830 |
) |
|
$ |
5,368 |
|
|
$ |
663 |
|
74
The provision for (benefit of) income taxes differs from the amount computed at the federal statutory rate as follows:
|
|
|
Fiscal Year Ended March 31, |
|
|||||||||
|
|
|
2018 |
|
|
2017 |
|
|
2016 |
|
|||
|
Tax expense at United States federal statutory rate (1) |
|
$ |
(129 |
) |
|
$ |
8,263 |
|
|
$ |
2,212 |
|
|
Items affecting federal income tax rate: |
|
|
|
|
|
|
|
|
|
|
|
|
|
Research and development tax credits |
|
|
(4,179 |
) |
|
|
(2,276 |
) |
|
|
(2,517 |
) |
|
Impact of uncertain tax positions |
|
|
(2,884 |
) |
|
|
311 |
|
|
|
47 |
|
|
Return to provision true-ups |
|
|
(2,229 |
) |
|
|
(300 |
) |
|
|
(492 |
) |
|
Impact of foreign operations |
|
|
(365 |
) |
|
|
(402 |
) |
|
|
(644 |
) |
|
Impact of valuation allowance |
|
|
(101 |
) |
|
|
(212 |
) |
|
|
149 |
|
|
Qualified production activities income deduction |
|
|
(4 |
) |
|
|
(763 |
) |
|
|
— |
|
|
Impact of amended returns |
|
|
— |
|
|
|
(1,530 |
) |
|
|
— |
|
|
Net operating loss carryback |
|
|
— |
|
|
|
— |
|
|
|
578 |
|
|
Non-deductible expenses |
|
|
98 |
|
|
|
(7 |
) |
|
|
266 |
|
|
Acquisition expenses |
|
|
304 |
|
|
|
1,336 |
|
|
|
(228 |
) |
|
Impact of audit settlements |
|
|
428 |
|
|
|
— |
|
|
|
11 |
|
|
Deferred adjustments |
|
|
611 |
|
|
|
(490 |
) |
|
|
234 |
|
|
Compensation |
|
|
620 |
|
|
|
192 |
|
|
|
232 |
|
|
State income taxes |
|
|
1,291 |
|
|
|
1,246 |
|
|
|
815 |
|
|
Foreign transition tax - Tax reform |
|
|
1,381 |
|
|
|
— |
|
|
|
— |
|
|
Tax act revaluation of deferred tax balances |
|
|
2,328 |
|
|
|
— |
|
|
|
— |
|
|
Provision for (benefit of) income taxes |
|
$ |
(2,830 |
) |
|
$ |
5,368 |
|
|
$ |
663 |
|
(1) Federal statutory rate was 31.5%, 35.0% and 35.0% for March 31, 2018, 2017 and 2016, respectively.
The net deferred tax assets and liabilities in the accompanying consolidated balance sheets consist of the following:
|
|
|
March 31, |
|
|
March 31, |
|
||
|
|
|
2018 |
|
|
2017 |
|
||
|
Deferred tax assets: |
|
|
|
|
|
|
|
|
|
Net operating losses |
|
$ |
9,729 |
|
|
$ |
11,811 |
|
|
Research and development credit |
|
|
5,368 |
|
|
|
4,328 |
|
|
Deferred revenue |
|
|
4,918 |
|
|
|
7,337 |
|
|
Compensatory stock option expense |
|
|
8,023 |
|
|
|
4,028 |
|
|
Deferred rent |
|
|
3,364 |
|
|
|
5,446 |
|
|
Accrued legal settlement |
|
|
4,906 |
|
|
|
7,063 |
|
|
Allowance for doubtful accounts |
|
|
2,267 |
|
|
|
3,974 |
|
|
Deferred compensation |
|
|
— |
|
|
|
2,642 |
|
|
Foreign deferred taxes |
|
|
1,259 |
|
|
|
1,173 |
|
|
Other |
|
|
580 |
|
|
|
730 |
|
|
Total deferred tax assets |
|
|
40,414 |
|
|
|
48,532 |
|
|
Deferred tax liabilities: |
|
|
|
|
|
|
|
|
|
Intangibles assets |
|
$ |
(17,323 |
) |
|
$ |
(18,038 |
) |
|
Capitalized software |
|
|
(4,854 |
) |
|
|
(7,494 |
) |
|
Accounts receivable |
|
|
(3,340 |
) |
|
|
(5,538 |
) |
|
Accelerated depreciation |
|
|
(1,568 |
) |
|
|
(2,348 |
) |
|
Prepaid expense |
|
|
(1,217 |
) |
|
|
(1,776 |
) |
|
Total deferred tax liabilities |
|
|
(28,302 |
) |
|
|
(35,194 |
) |
|
Valuation allowance |
|
|
(2,893 |
) |
|
|
(2,073 |
) |
|
Deferred tax assets, net |
|
$ |
9,219 |
|
|
$ |
11,265 |
|
The deferred tax assets and liabilities have been shown net in the accompanying consolidated balance sheets as noncurrent.
As of March 31, 2018 and March 31, 2017, we had federal net operating loss (“NOL”) carryforwards of $36,395 and $31,032, respectively. The federal NOL carryforwards were inherited in connection with our acquisitions of HealthFusion in January 2016, Gennius in March 2015, Entrada in April 2017, and EagleDream in August 2017. The NOL carryforwards expire in various amounts starting on 2029 for both federal and state tax purposes. As of March 31, 2018, we had state NOL carryforwards of approximately $2,086, related to the HealthFusion, Entrada, and EagleDream acquisitions state NOL tax attribute. The utilization of the federal NOL carryforwards is subject to limitations under the rules regarding changes in stock ownership as determined by the Internal Revenue Code.
75
As of March 31, 2018 and March 31, 2017, the research and development tax credit carryforward available to offset future federal and state taxes was $5,368 and $4,328 respectively. The credits expire in various amounts starting in 2019.
We expect to receive the full benefit of the deferred tax assets recorded with the exception of certain state credits and NOL carryforwards for which we have recorded a valuation allowance.
We have not recorded any United States income tax or foreign withholding tax on the earnings of our India foreign subsidiary as these amounts are intended to be indefinitely reinvested. As of March 31, 2018, the cumulative amount of undistributed earnings of our foreign subsidiary was $9,844. Determination of the potential amount of unrecognized deferred United States income tax liability and foreign withholding tax is not practicable because of the complexities associated with its hypothetical calculation.
Uncertain tax positions
A reconciliation of the beginning and ending amount of unrecognized tax benefits, which is recorded within other noncurrent liabilities in our consolidated balance sheet, is as follows:
|
Balance as of March 31, 2016 |
|
$ |
3,955 |
|
|
Additions for prior year tax positions |
|
|
920 |
|
|
Additions for current year tax positions |
|
|
139 |
|
|
Reductions for prior year tax positions |
|
|
(252 |
) |
|
Balance as of March 31, 2017 |
|
|
4,762 |
|
|
Additions for current year tax positions |
|
|
217 |
|
|
Reductions for prior year tax positions |
|
|
(2,560 |
) |
|
Balance as of March 31, 2018 |
|
$ |
2,419 |
|
During the year ended March 31, 2018, we recorded additional net liabilities of $217 mostly related to various state tax planning benefits recorded in the current year for prior year tax positions. The total amount of unrecognized tax benefit that, if recognized, would decrease the income tax provision is $2,419.
Our practice is to recognize interest related to income tax matters as interest expense in the consolidated statements of net income and comprehensive income. We had approximately $213 and $297 of accrued interest related to income tax matters as of March 31, 2018 and 2017, respectively. We recognized $86 and $170 of interest related to income tax matters in the consolidated statements of net income and comprehensive income in the years ended March 31, 2018 and 2017, respectively, and $57 in the year ended March 31, 2016. No penalties related to income tax matters were accrued or recognized in our consolidated financial statements for all periods presented.
We are no longer subject to United States federal income tax examinations for tax years before fiscal years ended 2014. With a few exceptions, we are no longer subject to state or local income tax examinations for tax years before fiscal years ended 2013. We do not anticipate that total unrecognized tax benefits will significantly change due to the settlement of audits or the expiration of statute of limitations within the next twelve months.
United States Tax Reform
On December 22, 2017, the President of the United States signed and enacted into law H.R. 1 (the “Tax Reform”). This new tax legislation, effective for tax years beginning on or after January 1, 2018, except for certain provisions, resulted in significant changes to existing United States tax law, including various provisions, such as
|
|
• |
Establishes a flat corporate income tax rate of 21% on United States earnings |
|
|
• |
Imposes a one-time tax on unremitted cumulative non- United States earnings of foreign subsidiaries (Transition Tax) |
|
|
• |
Imposes a new minimum tax on certain non- United States earnings, irrespective of the territorial system of taxation, and generally allows for the repatriation of future earnings of foreign subsidiaries without incurring additional United States taxes by transitioning to a territorial system of taxation (Global Intangible Low-Taxed Income or “GILTI Tax”) |
|
|
• |
Subjects certain payments made by a United States company to a related foreign company to certain minimum taxes (Base Erosion Anti-Abuse Tax) |
|
|
• |
Eliminates certain prior tax incentives for manufacturing in the United States and creates an incentive for United States companies to sell, lease or license goods and services abroad by allowing for a reduction in taxes owed on earnings related to such sales |
|
|
• |
Allows the cost of investments in certain depreciable assets acquired and placed in service after September 27, 2017 to be immediately expensed |
|
|
• |
Reduces deductions with respect to certain compensation paid to specified executive officers |
76
We are subject to the provisions of FASB Accounting Standards Codification 740-10, Income Taxes (“ASC 740”), which requires that the effect on deferred tax assets and liabilities of a change in tax rates be recognized in the period the tax rate change was enacted. The Tax Reform reduces the federal corporate tax rate from 35% to 21% effective January 1, 2018, and thus we have revised our estimated annual effective tax rate to reflect the change in the federal statutory rate by using a blended rate of 31.5% for the annual period ended March 31, 2018. As a result of the enacted reduction in the federal corporate income tax rate, we recorded a one-time, non-cash increase to income tax expense in the fiscal year ended March 31, 2018 related to the remeasurement of certain deferred tax assets and liabilities. The resulting $2,327 decrease in net deferred tax assets was reasonably estimated and based on the tax rates at which they are expected to reverse in the future.
The Tax Reform also required a one-time transition tax based on total post-1986 foreign cumulative earnings and profits previously deferred from United States federal taxation, which was reasonably estimated and recorded as a one-time income tax expense of $1,381 at March 31, 2018. We will continue to analyze the calculation of cumulative foreign earnings and finalize the amounts held in cash or other specified assets.
Due to the complexities involved in accounting for the enactment of the Tax Reform, Staff Accounting Bulletin No. 118 (”SAB 118”) allowed us to record provisional amounts in earnings for the year ended March 31, 2018. SAB 118 provides that where reasonable estimates can be made, the provisional accounting should be based on such estimates and when no reasonable estimate can be made, the provisional accounting may be based on the tax law in effect before the Tax Reform. We will continue to analyze the effects of the Tax Reform on our consolidated financial statements. Additional impacts from the enactment of the Tax Reform will be recorded as they are identified during the measurement period of up to one year from the enactment date as provided for in SAB 118. The final impact of the Tax Reform may differ from the provisional amounts that have been recognized, possibly materially, due to, among other things, changes in our interpretation of the Tax Reform, legislative or administrative actions to clarify the intent of the statutory language provided that differ from our current interpretation, any changes in accounting standards for income taxes or related interpretations in response to the Tax Reform, or any updates or changes to estimates utilized to calculate the impacts, including changes to current year earnings estimates and applicable foreign exchange rates. Additionally, our United States tax returns for March 31, 2018 will be filed during the first quarter of 2019 and any changes to the tax positions for temporary differences compared to the estimates used will result in an adjustment of the estimated tax expense recorded as of March 31, 2018.
We also continue to evaluate the impact of the GILTI provisions under the Tax Reform which are complex and subject to continuing regulatory interpretation by the United States Internal Revenue Service. We are required to make an accounting policy election of either (1) treating taxes due on future United States inclusions in taxable income related to GILTI as a current period expense when incurred or (2) factoring such amounts into our measurement of deferred taxes. The accounting policy we elect with respect to the new GILTI Tax rules will depend, in part, on analyzing our global income to determine whether we can reasonably estimate the tax impact. We did not include an estimate of GILTI in our estimated effective tax rate for March 31, 2018, as we have not completed our analysis and are not yet able to determine which method to elect.
The Tax Reform legislation includes various other provisions with effective dates beginning April 1, 2018 and beyond. For other changes that impact business related income, exclusions, deductions and credits with effective dates for our fiscal year beginning April 1, 2018, we will continue to account for those items based on our existing accounting under ASC 740 and the provisions of the tax laws that were in effect immediately prior to the enactment of the Tax Reform.
12. Employee Benefit Plans
We provide a 401(k) plan to substantially all of our employees. Participating employees may defer up to the Internal Revenue Service limit per year based on the Internal Revenue Code. The annual contribution is determined by a formula set by our Board of Directors ("Board") and may include matching and/or discretionary contributions. The amount of the Company match is discretionary and subject to change. The retirement plans may be amended or discontinued at the discretion of the Board. Contributions of $4,205, $2,735 and $1,063 were made by the Company to the 401(k) plan for the years ended March 31, 2018, 2017, and 2016, respectively.
We have a deferred compensation plan (the “Deferral Plan”) for the benefit of those employees who qualify. Participating employees may defer up to 75% of their salary and 100% of their annual bonus for a Deferral Plan year. In addition, we may, but are not required to, make contributions into the Deferral Plan on behalf of participating employees, and the amount of the Company match is discretionary and subject to change. Each employee's deferrals together with earnings thereon are accrued as part of our long-term liabilities. Investment decisions are made by each participating employee from a family of mutual funds. The deferred compensation liability was $6,086 and $6,629 at March 31, 2018 and 2017, respectively. To offset this liability, we have purchased life insurance policies on some of the participants. The Company is the owner and beneficiary of the policies and the cash values are intended to produce cash needed to help make the benefit payments to employees when they retire or otherwise leave the Company. We intend to hold the life insurance policy until the death of the plan participant. The cash surrender value of the life insurance policies for deferred compensation was $8,890 and $8,115 at March 31, 2018 and 2017, respectively. The values of the life insurance policies and our related obligations are included on the accompanying consolidated balance sheets in long-term other assets and long-term deferred compensation, respectively. We made contributions of $66, $65 and $120 to the Deferral Plan for the years ended March 31, 2018, 2017, and 2016, respectively.
77
Employee Stock Option and Incentive Plans
In October 2005, our shareholders approved a stock option and incentive plan (the “2005 Plan”) under which 4,800,000 shares of common stock were reserved for the issuance of awards, including incentive stock options and non-qualified stock options, stock appreciation rights, restricted stock, unrestricted stock, restricted stock units, performance shares, performance units (including performance options) and other share-based awards. The 2005 Plan provides that our employees and directors may, at the discretion of the Board or a duly designated compensation committee, be granted certain share-based awards. In the case of option awards granted under the 2005 Plan, the exercise price of each option is determined based on the date of grant and expire no later than 10 years from the date of grant. Awards granted pursuant to the 2005 Plan are subject to the vesting schedule or performance metrics set forth in the agreements pursuant to which they are granted. Upon a change of control of our Company, as such term is defined in the 2005 Plan, awards under the 2005 Plan will fully vest under certain circumstances. The 2005 Plan expired on May 25, 2015. As of March 31, 2018, there were 580,795 outstanding options under the 2005 Plan.
In August 2015, our shareholders approved a stock option and incentive plan (the “2015 Plan”) under which 11,500,000 shares of common stock were reserved for the issuance of awards, including incentive stock options and non-qualified stock options, stock appreciation rights, restricted stock awards and restricted stock unit awards, performance stock awards and other share-based awards. In August 2017, our shareholders approved an amendment to the 2015 Plan, (the “Amended 2015 Plan”), to, among other items, increase the number of shares of common stock reserved for issuance thereunder by 6,000,000. The Amended 2015 Plan provides that our employees and directors may, at the discretion of the Board or a duly designated compensation committee, be granted certain share-based awards. In the case of option awards granted under the Amended 2015 Plan, the exercise price of each option is determined based on the date of grant and expire no later than 10 years from the date of grant. Awards granted pursuant to the Amended 2015 Plan are subject to the vesting schedule or performance metrics set forth in the agreements pursuant to which they are granted. Upon a change of control of our Company, as such term is defined in the Amended 2015 Plan, awards under the Amended 2015 Plan will fully vest under certain circumstances. As of March 31, 2018, there were 3,089,375 outstanding options, 1,820,910 outstanding shares of restricted stock awards, 83,125 outstanding shares of performance stock awards, and 8,571,286 shares available for future grant under the Amended 2015 Plan.
The following table summarizes the stock option transactions during the years ended March 31, 2018, 2017, and 2016:
|
|
|
|
|
|
|
Weighted- |
|
|
Weighted- |
|
|
|
|
|
||
|
|
|
|
|
|
|
Average |
|
|
Average |
|
|
Aggregate |
|
|||
|
|
|
|
|
|
|
Exercise |
|
|
Remaining |
|
|
Intrinsic |
|
|||
|
Employee Stock Options Summary |
|
Number of |
|
|
Price |
|
|
Contractual |
|
|
Value |
|
||||
|
|
|
Shares |
|
|
per Share |
|
|
Life (years) |
|
|
(in thousands) |
|
||||
|
Outstanding, March 31, 2015 |
|
|
1,636,176 |
|
|
$ |
24.82 |
|
|
|
5.5 |
|
|
$ |
8 |
|
|
Granted |
|
|
1,414,000 |
|
|
|
15.51 |
|
|
|
7.6 |
|
|
|
|
|
|
Exercised |
|
|
(800 |
) |
|
|
15.99 |
|
|
|
6.2 |
|
|
$ |
1 |
|
|
Forfeited/Canceled |
|
|
(572,090 |
) |
|
|
24.65 |
|
|
|
4.6 |
|
|
|
|
|
|
Expired |
|
|
(30,000 |
) |
|
|
22.81 |
|
|
|
|
|
|
|
|
|
|
Outstanding, March 31, 2016 |
|
|
2,447,286 |
|
|
|
19.55 |
|
|
|
6.3 |
|
|
$ |
574 |
|
|
Granted |
|
|
1,146,500 |
|
|
|
11.30 |
|
|
|
7.2 |
|
|
|
|
|
|
Forfeited/Canceled |
|
|
(708,371 |
) |
|
|
16.86 |
|
|
|
3.4 |
|
|
|
|
|
|
Outstanding, April 1, 2017 |
|
|
2,885,415 |
|
|
|
15.41 |
|
|
|
6.2 |
|
|
$ |
3,150 |
|
|
Granted |
|
|
1,479,000 |
|
|
|
14.56 |
|
|
|
7.5 |
|
|
|
|
|
|
Exercised |
|
|
(216,405 |
) |
|
|
16.62 |
|
|
|
5.8 |
|
|
$ |
119 |
|
|
Forfeited/Canceled |
|
|
(477,840 |
) |
|
|
18.90 |
|
|
|
3.1 |
|
|
|
|
|
|
Outstanding, March 31, 2018 |
|
|
3,670,170 |
|
|
$ |
15.51 |
|
|
|
6.2 |
|
|
$ |
766 |
|
|
Vested and expected to vest, March 31, 2018 |
|
|
3,262,589 |
|
|
$ |
15.66 |
|
|
|
6.1 |
|
|
$ |
680 |
|
|
Exercisable, March 31, 2018 |
|
|
1,013,165 |
|
|
$ |
18.59 |
|
|
|
4.7 |
|
|
$ |
207 |
|
Share-based compensation expense related to stock options was $2,953, $3,496, and $1,682 for the years ended March 31, 2018, 2017, and 2016, respectively.
78
We utilize the Black-Scholes valuation model for estimating the fair value of share-based compensation with the following assumptions:
|
|
|
Year Ended |
|
|
Year Ended |
|
|
Year Ended |
|
|
|
March 31, 2018 |
|
|
March 31, 2017 |
|
|
March 31, 2016 |
|
Expected term |
|
5.6 - 6.1 years |
|
|
6.0 - 6.6 years |
|
|
3.8 - 3.9 years |
|
Expected volatility |
|
37.0% - 37.7% |
|
|
36.9% - 37.4% |
|
|
39.3% - 41.1% |
|
Expected dividends |
|
0.0% |
|
|
0.0% |
|
|
0.0% - 5.3% |
|
Risk-free rate |
|
1.9% - 2.2% |
|
|
1.2% - 2.1% |
|
|
1.1% - 1.6% |
During the years ended March 31, 2018, 2017, and 2016, a total of 1,479,000, 1,146,500, and 1,414,000 options, respectively, to purchase shares of common stock were granted under the Amended 2015 Plan at an exercise price equal to the market price of our common stock on the date of grant, as summarized below:
|
Option Grant Date |
|
Number of Shares |
|
|
Exercise Price |
|
|
Vesting Terms (1) |
|
Expiration |
||
|
March 1, 2016 |
|
|
450,000 |
|
|
$ |
15.60 |
|
|
Four years |
|
March 1, 2024 |
|
February 1, 2016 |
|
|
200,000 |
|
|
$ |
14.20 |
|
|
Four years |
|
February 1, 2024 |
|
January 4, 2016 |
|
|
200,000 |
|
|
$ |
16.85 |
|
|
(2) |
|
January 4, 2024 |
|
August 17, 2015 |
|
|
150,000 |
|
|
$ |
12.80 |
|
|
(3) |
|
August 17, 2023 |
|
May 22, 2015 |
|
|
414,000 |
|
|
$ |
16.64 |
|
|
Five years |
|
May 22, 2023 |
|
Fiscal year 2016 grants |
|
|
1,414,000 |
|
|
|
|
|
|
|
|
|
|
|
|
|
|
|
|
|
|
|
|
|
|
|
|
January 31, 2017 |
|
|
90,000 |
|
|
$ |
15.01 |
|
|
Four years |
|
January 31, 2025 |
|
November 1, 2016 |
|
|
50,000 |
|
|
$ |
12.71 |
|
|
Four years |
|
November 1, 2024 |
|
July 11, 2016 |
|
|
150,000 |
|
|
$ |
12.60 |
|
|
Four years |
|
July 11, 2024 |
|
May 31, 2016 |
|
|
100,000 |
|
|
$ |
12.71 |
|
|
Five years |
|
May 31, 2024 |
|
May 25, 2016 |
|
|
216,500 |
|
|
$ |
12.78 |
|
|
Four years |
|
May 25, 2024 |
|
May 24, 2016 |
|
|
540,000 |
|
|
$ |
12.93 |
|
|
Four years |
|
May 24, 2024 |
|
Fiscal year 2017 grants |
|
|
1,146,500 |
|
|
|
|
|
|
|
|
|
|
|
|
|
|
|
|
|
|
|
|
|
|
|
|
June 13, 2017 |
|
|
249,000 |
|
|
$ |
16.37 |
|
|
Four Years |
|
June 13, 2025 |
|
May 24, 2017 |
|
|
60,000 |
|
|
$ |
14.57 |
|
|
Four Years |
|
May 24, 2025 |
|
August 4, 2017 |
|
|
25,000 |
|
|
$ |
16.13 |
|
|
Four Years |
|
August 4, 2025 |
|
October 31, 2017 |
|
|
915,000 |
|
|
$ |
14.07 |
|
|
Four Years |
|
October 31, 2025 |
|
December 4, 2017 |
|
|
230,000 |
|
|
$ |
14.38 |
|
|
Four Years |
|
December 4, 2025 |
|
Fiscal year 2018 grants |
|
|
1,479,000 |
|
|
|
|
|
|
|
|
|
|
(1) |
Unless otherwise indicated, options vest in equal annual installments on each grant anniversary date commencing one year following the date of grant |
|
(2) |
100,000 options vested on March 31, 2017 and the remaining 100,000 options vested on March 31, 2018 |
|
(3) |
Option vests in five equal annual installments beginning on July 1, 2016 |
The weighted-average grant date fair value of stock options granted during the years ended March 31, 2018, 2017, and 2016 was $5.59, $5.00, and $4.44 per share, respectively.
79
Non-vested stock option award activity during the years ended March 31, 2018, 2017, and 2016 is summarized as follows:
|
|
|
|
|
|
|
Weighted- |
|
|
|
|
|
|
|
|
|
Average |
|
|
|
|
|
|
|
|
|
Grant-Date |
|
|
|
Non-Vested Stock Option Award Summary |
|
Number of |
|
|
Fair Value |
|
||
|
|
|
Shares |
|
|
per Share |
|
||
|
Outstanding, March 31, 2015 |
|
|
1,068,290 |
|
|
$ |
5.81 |
|
|
Granted |
|
|
1,414,000 |
|
|
|
4.44 |
|
|
Vested |
|
|
(311,740 |
) |
|
|
5.44 |
|
|
Forfeited/Canceled |
|
|
(310,800 |
) |
|
|
5.45 |
|
|
Outstanding, March 31, 2016 |
|
|
1,859,750 |
|
|
$ |
4.67 |
|
|
Granted |
|
|
1,146,500 |
|
|
|
5.00 |
|
|
Vested |
|
|
(540,595 |
) |
|
|
3.87 |
|
|
Forfeited/Canceled |
|
|
(392,360 |
) |
|
|
4.50 |
|
|
Outstanding, March 31, 2017 |
|
|
2,073,295 |
|
|
$ |
5.09 |
|
|
Granted |
|
|
1,479,000 |
|
|
|
5.59 |
|
|
Vested |
|
|
(621,440 |
) |
|
|
4.92 |
|
|
Forfeited/Canceled |
|
|
(273,850 |
) |
|
|
4.57 |
|
|
Outstanding, March 31, 2018 |
|
|
2,657,005 |
|
|
$ |
5.18 |
|
As of March 31, 2018, $11,584 of total unrecognized compensation costs related to stock options is expected to be recognized over a weighted-average period of 3.0 years. This amount does not include the cost of new options that may be granted in future periods or any changes in our forfeiture percentage. The total fair value of options vested during the years ended March 31, 2018, 2017, and 2016 was $3,059, $2,090, and $1,697, respectively.
Restricted stock awards activity during the years ended March 31, 2018, 2017, and 2016 is summarized as follows:
|
|
|
|
|
|
|
Weighted- |
|
|
|
|
|
|
|
|
|
Average |
|
|
|
|
|
|
|
|
|
Grant-Date |
|
|
|
Restricted Stock |
|
Number of |
|
|
Fair Value |
|
||
|
|
|
Shares |
|
|
per Share |
|
||
|
Outstanding, March 31, 2015 |
|
|
78,205 |
|
|
$ |
17.94 |
|
|
Granted |
|
|
165,634 |
|
|
|
14.06 |
|
|
Vested |
|
|
(51,092 |
) |
|
|
20.14 |
|
|
Canceled |
|
|
(1,500 |
) |
|
|
17.95 |
|
|
Outstanding, March 31, 2016 |
|
|
191,247 |
|
|
$ |
14.44 |
|
|
Granted |
|
|
909,456 |
|
|
|
12.93 |
|
|
Vested |
|
|
(92,543 |
) |
|
|
15.25 |
|
|
Canceled |
|
|
(105,212 |
) |
|
|
13.00 |
|
|
Outstanding, March 31, 2017 |
|
|
902,948 |
|
|
$ |
12.92 |
|
|
Granted |
|
|
1,424,441 |
|
|
|
15.00 |
|
|
Vested |
|
|
(386,226 |
) |
|
|
14.26 |
|
|
Canceled |
|
|
(120,253 |
) |
|
|
14.29 |
|
|
Outstanding, March 31, 2018 |
|
|
1,820,910 |
|
|
$ |
14.52 |
|
Share-based compensation expense related to restricted stock awards was $8,536, $3,691, and $940 for the years ended March 31, 2018, 2017, and 2016, respectively.
The weighted-average grant date fair value for the restricted stock awards was estimated using the market price of the common stock on the date of grant. The fair value of the restricted stock awards is amortized on a straight-line basis over the vesting period, which is between one and three years.
As of March 31, 2018, $19,919 of total unrecognized compensation costs related to restricted stock awards is expected to be recognized over a weighted-average period of 1.9 years. This amount does not include the cost of new restricted stock awards that may be granted in future periods.
80
On December 29, 2016, the Compensation Committee of the Board granted 123,082 performance stock awards to certain executive officers, of which 83,125 shares are currently outstanding. The performance stock awards vest in four equal increments on each of the first four anniversaries of the grant date, subject in each case to the executive officer’s continued service and achievement of certain performance goals, including strong stock price performance. Share-based compensation expense related to the performance stock awards was $306 for the fiscal year ended March 31, 2018. As of March 31, 2018, $640 of total unrecognized compensation costs related to performance stock awards is expected to be recognized over a weighted-average period of 2.8 years. This amount does not include the cost of new performance stock awards that may be granted in future periods.
Employee Share Purchase Plan
On August 11, 2014, our shareholders approved an Employee Share Purchase Plan (the “Purchase Plan”) under which 4,000,000 shares of common stock were reserved for future grant. The Purchase Plan allows eligible employees to purchase shares through payroll deductions of up to 15% of total base salary at a price equal to 90% of the lower of the fair market values of the shares as of the beginning or the end of the corresponding offering period. Any shares purchased under the Purchase Plan are subject to a six-month holding period. Employees are limited to purchasing no more than 1,500 shares on any single purchase date and no more than $25,000 in total fair market value of shares during any one calendar year. As of March 31, 2018, we have issued 345,119 shares under the Purchase Plan and 3,654,881 shares are available for future issuance.
Share-based compensation expense recorded for the employee share purchase plan was $362, $359, and $291 for the years ended March 31, 2018, 2017, and 2016, respectively.
14. Commitments, Guarantees and Contingencies
We lease facilities and offices under irrevocable operating lease agreements expiring at various dates with rent escalation clauses. Rent expense related to these leases is recognized on a straight-line basis over the lease terms. Rent expense for the years ended March 31, 2018, 2017, and 2016 was $7,551, $8,610 and $7,309, respectively.
The following table summarizes our significant contractual obligations at March 31, 2018 and the effect that such obligations are expected to have on our liquidity and cash in future periods:
|
|
|
|
|
|
|
For the year ended March 31, |
|
|||||||||||||||||||||
|
Contractual Obligations |
|
Total |
|
|
2019 |
|
|
2020 |
|
|
2021 |
|
|
2022 |
|
|
2023 |
|
|
2024 and beyond |
|
|||||||
|
Operating lease obligations |
|
$ |
57,924 |
|
|
$ |
9,321 |
|
|
$ |
9,012 |
|
|
$ |
8,997 |
|
|
$ |
8,725 |
|
|
$ |
8,393 |
|
|
$ |
13,476 |
|
|
Remaining lease obligations for vacated properties (1) |
|
|
4,112 |
|
|
|
1,413 |
|
|
|
794 |
|
|
|
816 |
|
|
|
551 |
|
|
|
357 |
|
|
|
181 |
|
|
Line of credit obligations (Note 9) |
|
|
37,000 |
|
|
|
— |
|
|
|
— |
|
|
|
— |
|
|
|
— |
|
|
|
37,000 |
|
|
|
— |
|
|
Foreign transition tax - Tax reform (Note 11) |
|
|
1,381 |
|
|
|
1,381 |
|
|
|
— |
|
|
|
— |
|
|
|
— |
|
|
|
— |
|
|
|
— |
|
|
Total |
|
$ |
100,417 |
|
|
$ |
12,115 |
|
|
$ |
9,806 |
|
|
$ |
9,813 |
|
|
$ |
9,276 |
|
|
$ |
45,750 |
|
|
$ |
13,657 |
|
|
(1) |
Remaining lease obligations for vacated properties relates to remaining lease obligations at certain locations, including Austin, Solana Beach, and a portion of Horsham, that we have vacated and are actively marketing the locations for sublease as part of our reorganization efforts. Refer to Note 15 for additional details. Total obligations have not been reduced by projected sublease rentals or by minimum sublease rentals of $966 due in future periods under non-cancelable subleases. |
The deferred compensation liability as of March 31, 2018 was $6,086, which is not included in the table above as the timing of future benefit payments to employees is not readily determinable.
The uncertain tax position liability as of March 31, 2018 was $2,419, which is not included in the table above as the timing of expected payments is not readily determinable.
Commitments and Guarantees
Our software license agreements include a performance guarantee that our software products will substantially operate as described in the applicable program documentation for a period of 365 days after delivery. To date, we have not incurred any significant costs associated with our performance guarantee or other related warranties and do not expect to incur significant warranty costs in the future. Therefore, no accrual has been made for potential costs associated with these warranties. Certain arrangements also include performance guarantees related to response time, availability for operational use, and other performance-related guarantees. Certain arrangements also include penalties in the form of maintenance credits should the performance of the software fail to meet the performance guarantees. To date, we have not incurred any significant costs associated with these warranties and do not expect to incur significant warranty costs in the future. Therefore, no accrual has been made for potential costs associated with these warranties.
81
We have historically offered short-term rights of return in certain sales arrangements. If we are able to estimate returns for these types of arrangements and all other criteria for revenue recognition have been met, revenue is recognized and these arrangements are recorded in the consolidated financial statements. If we are unable to estimate returns for these types of arrangements, revenue is not recognized in the consolidated financial statements until the rights of return expire, provided also, that all other criteria of revenue recognition have been met.
Our standard sales agreements contain an indemnification provision pursuant to which we shall indemnify, hold harmless, and reimburse the indemnified party for losses suffered or incurred by the indemnified party in connection with any United States patent, any copyright or other intellectual property infringement claim by any third-party with respect to our software. As we have not incurred any significant costs to defend lawsuits or settle claims related to these indemnification agreements, we believe that our estimated exposure on these agreements is currently minimal. Accordingly, we have no liabilities recorded for these indemnification obligations.
Hussein Litigation
On October 7, 2013, a complaint was filed against our Company and certain of our officers and directors in the Superior Court of the State of California for the County of Orange, captioned Ahmed D. Hussein v. Sheldon Razin, Steven Plochocki, Quality Systems, Inc. and Does 1-10, inclusive, No. 30-2013-00679600-CU-NP-CJC, by Ahmed Hussein, a former director and significant shareholder of our Company. We filed a demurrer to the complaint, which the Court granted on April 10, 2014. An amended complaint was filed on April 25, 2014. The amended complaint generally alleges fraud and deceit, constructive fraud, negligent misrepresentation and breach of fiduciary duty in connection with statements made to our shareholders regarding our financial condition and projected future performance. The amended complaint seeks actual damages, exemplary and punitive damages and costs. We filed a demurrer to the amended complaint. On July 29, 2014, the Court sustained the demurrer with respect to the breach of fiduciary duty claim, and overruled the demurrer with respect to the fraud and deceit claims. On August 28, 2014, we filed an answer and also filed a cross-complaint against Hussein, alleging that he breached fiduciary duties owed to the Company, Mr. Razin and Mr. Plochocki. Mr. Razin and Mr. Plochocki have dismissed their claims against Hussein, leaving QSI as the sole plaintiff in the cross-complaint. On June 26, 2015, we filed a motion for summary judgment with respect to Hussein’s claims, which the Court granted on September 16, 2015, dismissing all of Hussein’s claims against us. On September 23, 2015, Hussein filed an application for reconsideration of the Court's summary judgment order, which the Court denied. Hussein filed a renewed application for reconsideration of the Court’s summary judgment order on August 3, 2017. The Court again denied Hussein’s application. On October 28, 2015, May 9, 2016, and August 5, 2016, Hussein filed a motion for summary judgment, motion for summary adjudication, and motion for judgment on the pleadings, respectively, seeking to dismiss our cross-complaint. The Court denied each motion. Trial on our cross-complaint began June 12, 2017. On July 26, 2017, the Court issued a statement of decision granting Hussein’s motion for judgment on our cross-complaint. Final judgment over Hussein’s claims and our cross-claims was entered on January 9, 2018. Hussein has noticed his appeal of the order granting summary judgment over his claims, and we noticed a cross-appeal on the court’s statement of decision granting Hussein’s motion for judgment on our cross-complaint. Briefing on the cross-appeals will be completed in fall 2018. At this time, we are unable to estimate the probability or the amount of liability, if any, related to this claim.
Federal Securities Class Action
On November 19, 2013, a putative class action complaint was filed on behalf of the shareholders of our Company other than the defendants against us and certain of our officers and directors in the United States District Court for the Central District of California by one of our shareholders. After the Court appointed lead plaintiffs and lead counsel for this action, and recaptioned the action In re Quality Systems, Inc. Securities Litigation, No. 8:13-cv-01818-CJC-JPR, lead plaintiffs filed an amended complaint on April 7, 2014. The amended complaint, which is substantially similar to the litigation described above under the caption “Hussein Litigation,” generally alleges that statements made to our shareholders regarding our financial condition and projected future performance were false and misleading in violation of Section 10(b) of the Securities Exchange Act of 1934, as amended (the “Exchange Act”), and that the individual defendants are liable for such statements because they are controlling persons under Section 20(a) of the Exchange Act. The complaint seeks compensatory damages, court costs and attorneys' fees. We filed a motion to dismiss the amended complaint on June 20, 2014, which the Court granted on October 20, 2014, dismissing the complaint with prejudice. Plaintiffs filed a motion for reconsideration of the Court's order, which the Court denied on January 5, 2015. On January 30, 2015, Plaintiffs filed a notice of appeal to the United States Court of Appeals for the Ninth Circuit, captioned In re Quality Systems, Inc. Securities Litigation, No. 15-55173. On July 28, 2017, the Ninth Circuit issued a decision reversing and remanding the District Court's order on our motion to dismiss. On September 5, 2017, we filed a petition for rehearing en banc, which was denied on September 29, 2017. On January 26, 2018, we filed a petition for a writ of certiorari with the Supreme Court of the United States. The Supreme Court ordered the plaintiffs to file a response to the petition, which they filed on March 22, 2018.
On May 10, 2018, the parties reached an agreement-in-principle to resolve the action for $19 million. On May 11, 2018, the parties requested that the Supreme Court stay any decision regarding whether to hear the Company’s petition for a writ of certiorari, pending the parties’ ongoing settlement negotiations. Under the terms of the agreement-in-principle, a portion of the settlement is expected to be funded by certain of the Company’s insurance carriers, and defendants will continue to deny any liability or wrongdoing. Once the parties enter into a definitive settlement agreement resolving the matter, the settlement will be submitted to the Court for approval. The agreement-in-principle does not resolve the Hussein Litigation or the Shareholder
82
Derivative Litigation. As of March 31, 2018, we recorded an accrual of $19.0 million for preliminary settlement this Federal Securities Class Action complaint, which is included as a component of selling, general and administrative expense in the consolidated statements of net income and comprehensive income.
Shareholder Derivative Litigation
On January 24, 2014, a complaint was filed against our Company and certain of our officers and current and former directors in the United States District Court for the Central District of California, captioned Timothy J. Foss, derivatively on behalf of himself and all others similarly situated, vs. Craig A. Barbarosh, George H. Bristol, James C. Malone, Peter M. Neupert, Morris Panner, D. Russell Pflueger, Steven T. Plochocki, Sheldon Razin, Lance E. Rosenzweig and Quality Systems, Inc., No. SACV14-00110-DOC-JPPx, by Timothy J. Foss, a purported shareholder of ours. The complaint arises from the same allegations described above under the captions “Hussein Litigation” and “Federal Securities Class Action” and generally alleges breach of fiduciary duties, abuse of control and gross mismanagement by our directors, in addition to unjust enrichment and insider selling by individual directors. The complaint seeks compensatory damages, restitution and disgorgement of all profits, court costs, attorneys’ fees and implementation of enhanced corporate governance procedures. The matter was stayed pending the Ninth Circuit’s decision in the appeal described above under the caption, “Federal Securities Class Action.” This stay now has been lifted and, Defendants filed a motion to dismiss on February 2, 2018. Defendants’ motion is scheduled to be heard on July 23, 2018. On September 28, 2017, a complaint was filed against our Company and certain of our current and former officers and directors in the United States District Court for the Central District of California, captioned Kusumam Koshy, derivatively on behalf of Quality Systems Inc. vs. Craig Barbarosh, George H. Bristol, James C. Malone, Peter M. Neupert, Morris Panner, D. Russell Pflueger, Steven T. Plochocki, Sheldon Razin, Lance E. Rosenzweig, Paul A. Holt, and Quality Systems, Inc., No. 8:17-cv-01694, by Kusumam Koshy, a purported shareholder of ours. The complaint alleges breach of fiduciary duties and abuse of control, as well as unjust enrichment and insider selling by individual directors arising out of the allegations described above under the captions “Hussein Litigation” and “Federal Securities Class Action,” QSI’s adoption of revised indemnification agreements, and the resignation of certain officers of the Company. The complaint seeks restitution and disgorgement, court costs and attorneys’ fees, and enhanced corporate governance reforms and internal control procedures. On January 12, 2018, Defendants filed a motion to dismiss the derivative complaint. Defendants’ motion is scheduled to be heard on July 23, 2018. We believe that the plaintiffs’ claims are without merit and intend to defend against them vigorously. At this time, we are unable to estimate the probability or the amount of liability, if any, related to this claim.
Other Regulatory Matters
In April 2017, we received a request for documents and information from the United States Attorney's Office for the District of Vermont pursuant to a Civil Investigative Demand (“CID”). The CID relates to an investigation concerning the certification we obtained for our software under the United States Department of Health and Human Services' Electronic Health Record Incentive Program. We have provided documents and information in response to that CID. On December 11, 2017, we received a subpoena from the United States Department of Justice in connection with the same matter seeking among other things records relating to (a) data used to determine objectives and measures under the Meaningful Use (MU) and the Physician Quality Reporting System (PQRS) programs, (b) EHR software code used in certifying the 2014 EHR software and information, and (c) payments provided for the referral of EHR business. We continue to respond to this CID and subpoena and intend to cooperate fully with the government, including responding to any future requests. Requests and investigations of this nature may lead to future requests for information and ultimately the assertion of claims or the commencement of legal proceedings against us, as well as other material liabilities. In addition, our responses to these and any future requests require time and effort, which can result in additional cost to us. At this time, we are unable to estimate the probability or the amount of liability, if any, related to this matter. Given the highly-regulated nature of our industry, we may, from time to time, be subject to subpoenas, requests for information, or investigations from various government agencies. It is our practice to respond to such matters in a cooperative, thorough and timely manner.
During the year ended March 31, 2017, as part of our corporate restructuring plan, we recorded $7,078 of restructuring costs within operating expenses in our consolidated statements of net income and comprehensive income. The restructuring costs consisted primarily of payroll-related costs, such as severance, outplacement costs, and continuing healthcare coverage, associated with the involuntary separation of employees pursuant to a one-time benefit arrangement, which were accrued when it was probable that the benefits would be paid and the amounts were reasonably estimable. As of March 31, 2017, the remaining restructuring liability associated with payroll-related costs was $606, which was settled in the first quarter of fiscal 2018. The restructuring plan was substantially complete by the end of fiscal 2017.
Also included in restructuring costs were certain facilities-related costs associated with accruals for the remaining lease obligations at certain locations, including Solana Beach, Costa Mesa, and a portion of Horsham with contractual lease terms ending between January 2018 and September 2023. We have vacated each of the locations or portions thereof and are actively marketing the locations for sublease. We estimated the remaining lease obligations at fair value as of the cease-use date for each location based on the future contractual lease obligations, reduced by projected sublease rentals that could be reasonably obtained for the locations after a period of marketing, and adjusted for the effect deferred rents that have been recognized under the lease. The effect of discounting future cash flows using a credit-adjusted risk free rate was not significant. Sublease income and commencement dates were estimated based on data available from rental activity in the local markets. Significant judgment was required to estimate the remaining lease obligations at fair value and actual results
83
could vary from the estimates, resulting in potential future adjustments to amounts previously recorded. For the year ended March 31, 2018, we recorded $611 of restructuring costs related to adjustments to the estimated fair value of remaining lease obligations. As of March 31, 2018 and March 31, 2017, the remaining lease obligation, net of estimated projected sublease rentals, was $1,623 and $2,285, respectively. Refer to Note 14 for estimated timing of payments related to remaining lease obligations.
16. Selected Quarterly Operating Results (unaudited)
The following table presents quarterly unaudited consolidated financial information for the eight quarters preceding March 31, 2018. Such information is presented on the same basis as the annual information presented in the accompanying consolidated financial statements. In management’s opinion, this information reflects all adjustments that are necessary for a fair statement of the results for these periods.
|
|
|
Quarter Ended |
|
|||||||||||||||||||||||||||||
|
|
|
03/31/18 |
|
|
12/31/17 |
|
|
09/30/17 |
|
|
06/30/17 |
|
|
03/31/17 |
|
|
12/31/16 |
|
|
09/30/16 |
|
|
06/30/16 |
|
||||||||
|
Revenues: |
|
|
|
|
|
|
|
|
|
|
|
|
|
|
|
|
|
|
|
|
|
|
|
|
|
|
|
|
|
|
|
|
|
Software license and hardware |
|
$ |
15,378 |
|
|
$ |
13,131 |
|
|
$ |
14,267 |
|
|
$ |
12,800 |
|
|
$ |
16,581 |
|
|
$ |
16,995 |
|
|
$ |
17,182 |
|
|
$ |
14,789 |
|
|
Software related subscription services |
|
|
25,963 |
|
|
|
24,690 |
|
|
|
24,988 |
|
|
|
23,906 |
|
|
|
23,139 |
|
|
|
22,546 |
|
|
|
21,490 |
|
|
|
19,875 |
|
|
Total software, hardware and related |
|
|
41,341 |
|
|
|
37,821 |
|
|
|
39,255 |
|
|
|
36,706 |
|
|
|
39,720 |
|
|
|
39,541 |
|
|
|
38,672 |
|
|
|
34,664 |
|
|
Support and maintenance |
|
|
40,634 |
|
|
|
40,362 |
|
|
|
41,693 |
|
|
|
41,116 |
|
|
|
41,898 |
|
|
|
39,924 |
|
|
|
38,974 |
|
|
|
38,007 |
|
|
Revenue cycle management and related services |
|
|
19,669 |
|
|
|
21,922 |
|
|
|
21,002 |
|
|
|
21,403 |
|
|
|
20,515 |
|
|
|
20,048 |
|
|
|
20,936 |
|
|
|
21,053 |
|
|
Electronic data interchange and data services |
|
|
23,327 |
|
|
|
23,136 |
|
|
|
22,998 |
|
|
|
23,312 |
|
|
|
23,424 |
|
|
|
21,790 |
|
|
|
21,613 |
|
|
|
22,124 |
|
|
Professional services |
|
|
10,804 |
|
|
|
8,474 |
|
|
|
7,659 |
|
|
|
8,385 |
|
|
|
6,828 |
|
|
|
6,565 |
|
|
|
6,971 |
|
|
|
6,357 |
|
|
Total revenues |
|
|
135,775 |
|
|
|
131,715 |
|
|
|
132,607 |
|
|
|
130,922 |
|
|
|
132,385 |
|
|
|
127,868 |
|
|
|
127,166 |
|
|
|
122,205 |
|
|
Cost of revenue: |
|
|
|
|
|
|
|
|
|
|
|
|
|
|
|
|
|
|
|
|
|
|
|
|
|
|
|
|
|
|
|
|
|
Software license and hardware |
|
|
5,720 |
|
|
|
5,726 |
|
|
|
4,848 |
|
|
|
5,373 |
|
|
|
5,427 |
|
|
|
5,680 |
|
|
|
6,427 |
|
|
|
7,120 |
|
|
Software related subscription services |
|
|
11,673 |
|
|
|
11,693 |
|
|
|
10,699 |
|
|
|
10,430 |
|
|
|
9,637 |
|
|
|
9,345 |
|
|
|
8,675 |
|
|
|
9,087 |
|
|
Total software, hardware and related |
|
|
17,393 |
|
|
|
17,419 |
|
|
|
15,547 |
|
|
|
15,803 |
|
|
|
15,064 |
|
|
|
15,025 |
|
|
|
15,102 |
|
|
|
16,207 |
|
|
Support and maintenance |
|
|
7,349 |
|
|
|
7,525 |
|
|
|
7,435 |
|
|
|
7,623 |
|
|
|
7,414 |
|
|
|
7,299 |
|
|
|
7,036 |
|
|
|
6,568 |
|
|
Revenue cycle management and related services |
|
|
15,290 |
|
|
|
15,401 |
|
|
|
14,853 |
|
|
|
15,361 |
|
|
|
14,318 |
|
|
|
13,462 |
|
|
|
14,359 |
|
|
|
14,231 |
|
|
Electronic data interchange and data services |
|
|
13,702 |
|
|
|
13,581 |
|
|
|
13,574 |
|
|
|
13,158 |
|
|
|
12,870 |
|
|
|
12,662 |
|
|
|
12,807 |
|
|
|
12,763 |
|
|
Professional services |
|
|
8,243 |
|
|
|
7,708 |
|
|
|
7,346 |
|
|
|
7,224 |
|
|
|
6,304 |
|
|
|
5,904 |
|
|
|
6,693 |
|
|
|
7,046 |
|
|
Total cost of revenue |
|
|
61,977 |
|
|
|
61,634 |
|
|
|
58,755 |
|
|
|
59,169 |
|
|
|
55,970 |
|
|
|
54,352 |
|
|
|
55,997 |
|
|
|
56,815 |
|
|
Gross profit |
|
|
73,798 |
|
|
|
70,081 |
|
|
|
73,852 |
|
|
|
71,753 |
|
|
|
76,415 |
|
|
|
73,516 |
|
|
|
71,169 |
|
|
|
65,390 |
|
|
Operating expenses: |
|
|
|
|
|
|
|
|
|
|
|
|
|
|
|
|
|
|
|
|
|
|
|
|
|
|
|
|
|
|
|
|
|
Selling, general and administrative |
|
|
65,709 |
|
|
|
43,563 |
|
|
|
40,977 |
|
|
|
42,977 |
|
|
|
42,710 |
|
|
|
37,542 |
|
|
|
42,790 |
|
|
|
40,581 |
|
|
Research and development costs, net |
|
|
21,098 |
|
|
|
20,645 |
|
|
|
19,527 |
|
|
|
19,989 |
|
|
|
22,111 |
|
|
|
19,714 |
|
|
|
18,292 |
|
|
|
18,224 |
|
|
Amortization of acquired intangible assets |
|
|
1,795 |
|
|
|
1,956 |
|
|
|
2,012 |
|
|
|
2,047 |
|
|
|
2,546 |
|
|
|
2,568 |
|
|
|
2,617 |
|
|
|
2,704 |
|
|
Impairment of assets (1) |
|
|
3,757 |
|
|
|
— |
|
|
|
— |
|
|
|
— |
|
|
|
— |
|
|
|
— |
|
|
|
— |
|
|
|
— |
|
|
Restructuring costs |
|
|
481 |
|
|
|
130 |
|
|
|
— |
|
|
|
— |
|
|
|
2,393 |
|
|
|
231 |
|
|
|
701 |
|
|
|
3,753 |
|
|
Total operating expenses |
|
|
92,840 |
|
|
|
66,294 |
|
|
|
62,516 |
|
|
|
65,013 |
|
|
|
69,760 |
|
|
|
60,055 |
|
|
|
64,400 |
|
|
|
65,262 |
|
|
Income (loss) from operations |
|
|
(19,042 |
) |
|
|
3,787 |
|
|
|
11,336 |
|
|
|
6,740 |
|
|
|
6,655 |
|
|
|
13,461 |
|
|
|
6,769 |
|
|
|
128 |
|
|
Interest income |
|
|
19 |
|
|
|
15 |
|
|
|
12 |
|
|
|
9 |
|
|
|
5 |
|
|
|
— |
|
|
|
1 |
|
|
|
8 |
|
|
Interest expense |
|
|
(1,073 |
) |
|
|
(733 |
) |
|
|
(840 |
) |
|
|
(677 |
) |
|
|
(711 |
) |
|
|
(629 |
) |
|
|
(803 |
) |
|
|
(1,013 |
) |
|
Other income (expense), net |
|
|
85 |
|
|
|
(41 |
) |
|
|
15 |
|
|
|
(22 |
) |
|
|
(116 |
) |
|
|
(4 |
) |
|
|
(55 |
) |
|
|
(87 |
) |
|
Income before provision for (benefit of) income taxes |
|
|
(20,011 |
) |
|
|
3,028 |
|
|
|
10,523 |
|
|
|
6,050 |
|
|
|
5,833 |
|
|
|
12,828 |
|
|
|
5,912 |
|
|
|
(964 |
) |
|
Provision for (benefit of) income taxes |
|
|
(8,964 |
) |
|
|
1,487 |
|
|
|
2,493 |
|
|
|
2,154 |
|
|
|
1,418 |
|
|
|
2,342 |
|
|
|
1,925 |
|
|
|
(317 |
) |
|
Net income (loss) |
|
$ |
(11,047 |
) |
|
$ |
1,541 |
|
|
$ |
8,030 |
|
|
$ |
3,896 |
|
|
$ |
4,415 |
|
|
$ |
10,486 |
|
|
$ |
3,987 |
|
|
$ |
(647 |
) |
|
Net income (loss) per share: |
|
|
|
|
|
|
|
|
|
|
|
|
|
|
|
|
|
|
|
|
|
|
|
|
|
|
|
|
|
|
|
|
|
Basic (2) |
|
$ |
(0.17 |
) |
|
$ |
0.02 |
|
|
$ |
0.13 |
|
|
$ |
0.06 |
|
|
$ |
0.07 |
|
|
$ |
0.17 |
|
|
$ |
0.06 |
|
|
$ |
(0.01 |
) |
|
Diluted (2) |
|
$ |
(0.17 |
) |
|
$ |
0.02 |
|
|
$ |
0.13 |
|
|
$ |
0.06 |
|
|
$ |
0.07 |
|
|
$ |
0.17 |
|
|
$ |
0.06 |
|
|
$ |
(0.01 |
) |
|
Weighted-average shares outstanding: |
|
|
|
|
|
|
|
|
|
|
|
|
|
|
|
|
|
|
|
|
|
|
|
|
|
|
|
|
|
|
|
|
|
Basic |
|
|
63,888 |
|
|
|
63,706 |
|
|
|
63,513 |
|
|
|
62,636 |
|
|
|
62,345 |
|
|
|
62,093 |
|
|
|
61,658 |
|
|
|
61,179 |
|
|
Diluted |
|
|
63,888 |
|
|
|
63,708 |
|
|
|
63,530 |
|
|
|
62,643 |
|
|
|
62,348 |
|
|
|
62,093 |
|
|
|
62,052 |
|
|
|
61,179 |
|
|
(1) |
Impairment of assets for the quarter ended 3/31/2018 relates to the impairment of our acquired trade names intangible assets, which was the result of the elimination of certain legacy brand and trade names due to the launching of our new branding, identity, and corporate logo intended to reflect our expanded health technology portfolio following years of recent acquisitions. Refer to Note 7 for additional details. |
|
(2) |
Quarterly net income (loss) per share may not sum to annual net income (loss) per share due to rounding. |
84
On May 10, 2018, we reached an agreement-in-principle to resolve the Federal Securities Class action complaint that was filed on November 19, 2013. As of March 31, 2018, we recorded an accrual of $19.0 million for this preliminary settlement, which is included as a component of selling, general and administrative expense in the consolidated statements of net income and comprehensive income. For additional information, refer to the caption “Federal Securities Class Action” in Note 14.
85
SCHEDULE II — VALUATION AND QUALIFYING ACCOUNTS
|
|
|
|
|
Sales Return Reserve |
|
|||||||||||||
|
(in thousands) For the year ended |
|
|
|
Balance at Beginning of Year |
|
|
Additions Charged Against Revenue |
|
|
Deductions |
|
|
Balance at End of Year |
|
||||
|
March 31, 2018 |
|
|
|
$ |
7,213 |
|
|
$ |
3,964 |
|
|
$ |
(5,657 |
) |
|
$ |
5,520 |
|
|
March 31, 2017 |
|
|
|
$ |
7,541 |
|
|
$ |
11,330 |
|
|
$ |
(11,658 |
) |
|
$ |
7,213 |
|
|
March 31, 2016 |
|
|
|
$ |
8,835 |
|
|
$ |
6,737 |
|
|
$ |
(8,031 |
) |
|
$ |
7,541 |
|
|
|
|
|
|
Allowance for Doubtful Accounts |
|
|||||||||||||
|
(in thousands) For the year ended |
|
|
|
Balance at Beginning of Year |
|
|
Additions Charged to Costs and Expenses |
|
|
Deductions |
|
|
Balance at End of Year |
|
||||
|
March 31, 2018 |
|
|
|
$ |
2,757 |
|
|
$ |
5,913 |
|
|
$ |
(4,794 |
) |
|
$ |
3,876 |
|
|
March 31, 2017 |
|
|
|
$ |
2,902 |
|
|
$ |
5,082 |
|
|
$ |
(5,227 |
) |
|
$ |
2,757 |
|
|
March 31, 2016 |
|
|
|
$ |
3,303 |
|
|
$ |
3,573 |
|
|
$ |
(3,974 |
) |
|
$ |
2,902 |
|
|
|
|
Valuation Allowance for Deferred Taxes |
|
|||||||||||||||||
|
(in thousands) For the year ended |
|
Balance at Beginning of Year |
|
|
Additions Charged to Costs and Expenses |
|
|
Acquisition Related Additions |
|
|
Deductions |
|
|
Balance at End of Year |
|
|||||
|
March 31, 2018 |
|
$ |
2,073 |
|
|
$ |
— |
|
|
$ |
922 |
|
|
$ |
(102 |
) |
|
$ |
2,893 |
|
|
March 31, 2017 |
|
$ |
2,551 |
|
|
$ |
— |
|
|
$ |
(267 |
) |
|
$ |
(211 |
) |
|
$ |
2,073 |
|
|
March 31, 2016 |
|
$ |
1,840 |
|
|
$ |
112 |
|
|
$ |
599 |
|
|
$ |
— |
|
|
$ |
2,551 |
|
86
INDEX TO EXHIBITS ATTACHED TO THIS REPORT
|
Exhibit Number |
|
Description |
|
21 |
|
|
|
|
|
|
|
23.1 |
|
Consent of Independent Registered Public Accounting Firm — PricewaterhouseCoopers LLP. |
|
|
|
|
|
31.1 |
|
|
|
|
|
|
|
31.2 |
|
|
|
|
|
|
|
32.1 |
|
|
|
|
|
|
|
101.INS* |
|
XBRL Instance |
|
|
|
|
|
101.SCH* |
|
XBRL Taxonomy Extension Schema |
|
|
|
|
|
101.CAL* |
|
XBRL Taxonomy Extension Calculation |
|
|
|
|
|
101.DEF* |
|
XBRL Taxonomy Extension Definition |
|
|
|
|
|
101.LAB* |
|
XBRL Taxonomy Extension Label |
|
|
|
|
|
101.PRE* |
|
XBRL Taxonomy Extension Presentation |
|
* |
XBRL information is furnished and not filed or a part of a registration statement or prospectus for purposes of section 11 or 12 of the Securities and Exchange Act of 1933, as amended, is deemed not filed for purposes of section 18 of the Securities and Exchange Act of 1934, as amended, and otherwise is not subject to liability under these section. |
87