Attached files
| file | filename |
|---|---|
| 8-K - 8-K - Randolph Bancorp, Inc. | d590978d8k.htm |

Annual Meeting of Shareholders May 21, 2018 Exhibit 99.1
Safe Harbor Statement This presentation includes “forward looking statements” within the meaning of Section 27A of the Securities Act of 1933, as amended, and Section 21E of the Securities Exchange Act of 1934, as amended, and is intended to be covered by the safe harbor provisions of the Private Securities Litigation Reform Act of 1995. Forward-looking statements, which are based on certain current assumptions and describe our future plans, strategies and expectations, can generally be identified by the use of the words “may,” “will,” “should,” “could,” “would,” “plan,” “potential,” “estimate,” “project,” “believe,” “intend,” “anticipate,” “expect,” “target” and similar expressions. These statements include, among others, statements regarding our strategy, goals and expectations; evaluations of future interest rate trends and liquidity; expectations as to growth in assets, deposits and results of operations, future operations, market position and financial position; and prospects, plans and objectives of management. You should exercise caution in interpreting and relying on forward-looking statements because they are subject to significant risks, uncertainties and other factors which are, in some cases, beyond the control of the Bank. Forward-looking statements are based on the current assumptions and beliefs of management and are only expectations of future results. Our actual results could differ materially from those projected in the forward-looking statements as a result of, among others, factors referenced under the section captioned “Risk Factors” in our Annual Report on Form 10-K and quarterly reports on Form 10-Q as filed with the SEC; adverse conditions in the capital and debt markets and the impact of such conditions on our business activities; changes in interest rates; competitive pressures from other financial institutions; the effects of weakness in general economic conditions on a national basis or in the local markets in which we operate, including changes that adversely affect borrowers’ ability to service and repay our loans; changes in the value of securities in our investment portfolio; changes in loan default and charge-off rates; fluctuations in real estate values; the adequacy of loan loss reserves; decreases in deposit levels necessitating increased borrowing to fund loans and investments; changes in government regulation; changes in accounting standards and practices; the risk that intangible assets recorded in our financial statements will become impaired; demand for loans in our market area; our ability to attract and maintain deposits; risks related to the implementation of acquisitions, dispositions, and restructurings; the risk that we may not be successful in the implementation of our business strategy; and changes in assumptions used in making such forward-looking statements. Forward-looking statements speak only as of the date on which they are made. We do not undertake any obligation to update any forward-looking statement to reflect circumstances or events that occur after the date the forward-looking statements are made.
Overview of Randolph Bancorp, Inc. Financial Highlights RNDB Ownership and Market Information Envisioning What Lies Ahead Rebrand Q&A Appendix: RNDB Peer Group Our Agenda
Overview of Randolph Bancorp, Inc. Holding company for Envision Bank July 1, 2016 Initial Public Offering Completed raising $49.8 million in new capital Acquired First Eastern Bankshares Corporation for $14.1 million in cash We’ve come a long way since 1851
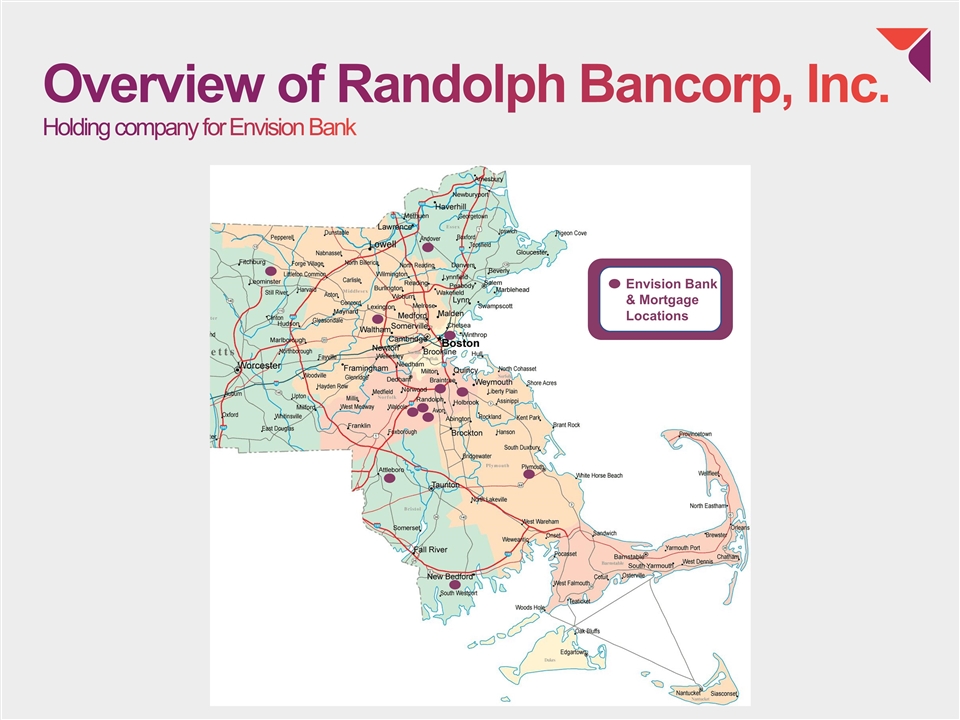
Overview of Randolph Bancorp, Inc. Holding company for Envision Bank Ee Envision Bank & Mortgage Locations
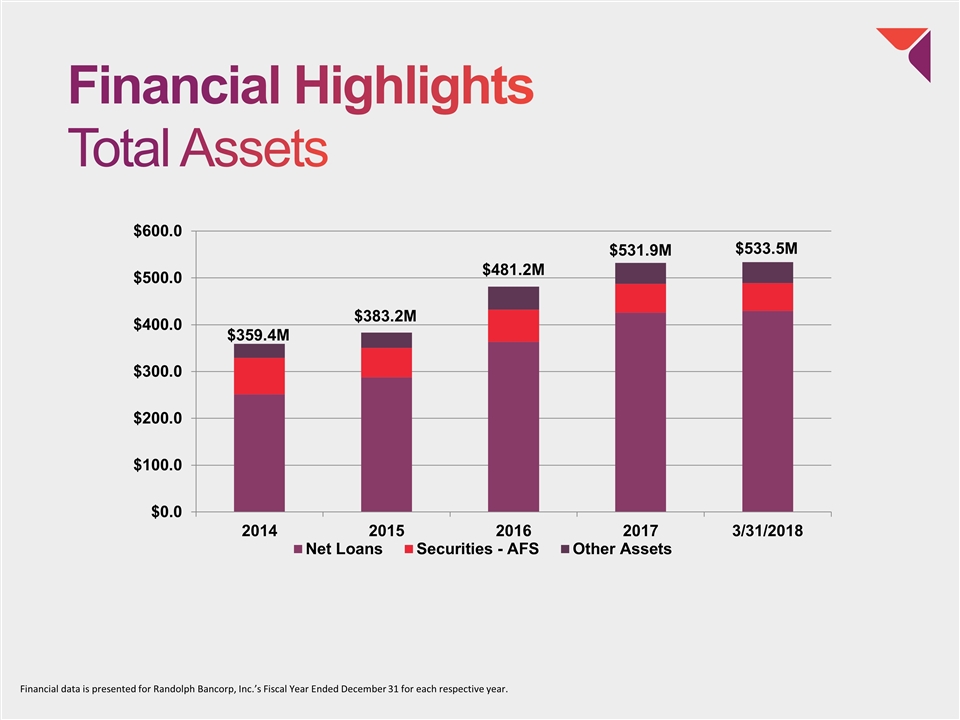
Financial Highlights Total Assets Financial data is presented for Randolph Bancorp, Inc.’s Fiscal Year Ended December 31 for each respective year.
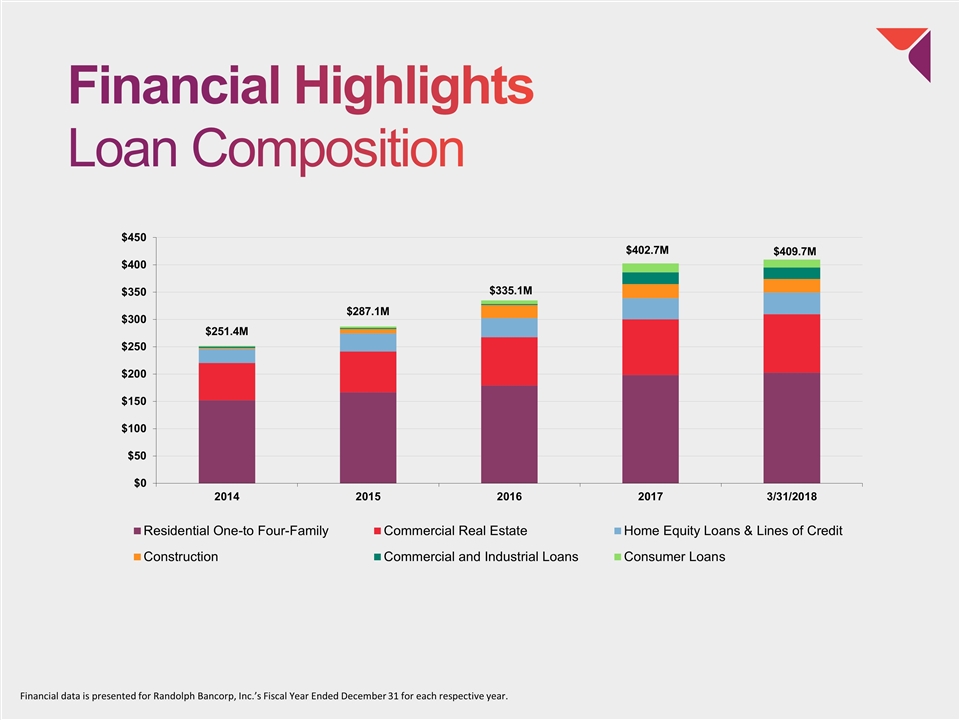
Financial Highlights Loan Composition Financial data is presented for Randolph Bancorp, Inc.’s Fiscal Year Ended December 31 for each respective year.
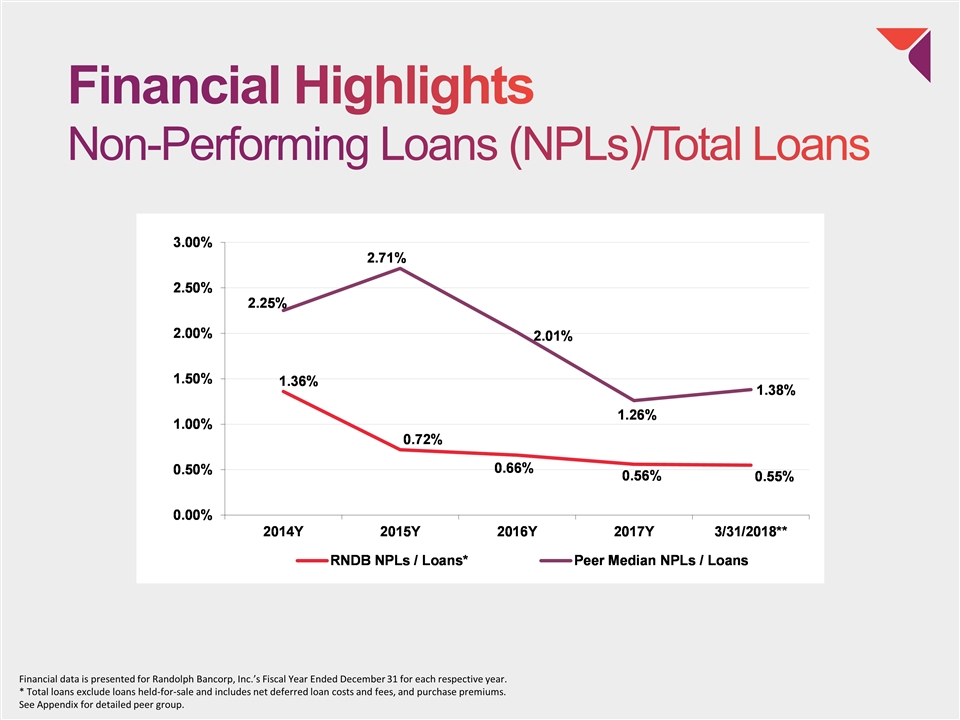
Financial Highlights Non-Performing Loans (NPLs)/Total Loans Financial data is presented for Randolph Bancorp, Inc.’s Fiscal Year Ended December 31 for each respective year. * Total loans exclude loans held-for-sale and includes net deferred loan costs and fees, and purchase premiums. See Appendix for detailed peer group.
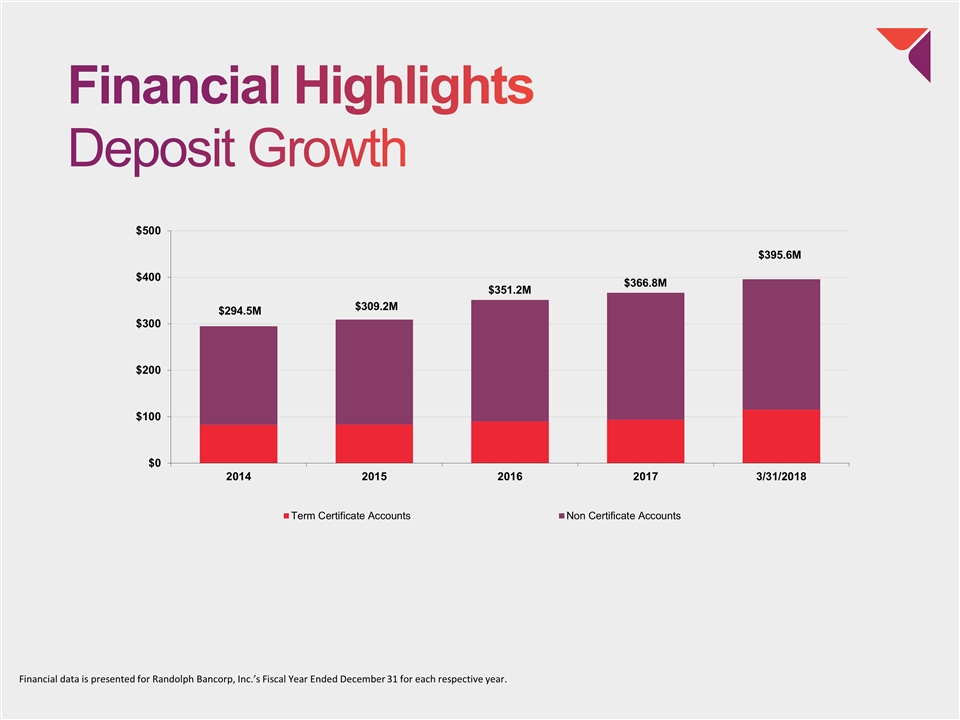
Financial Highlights Deposit Growth Financial data is presented for Randolph Bancorp, Inc.’s Fiscal Year Ended December 31 for each respective year.
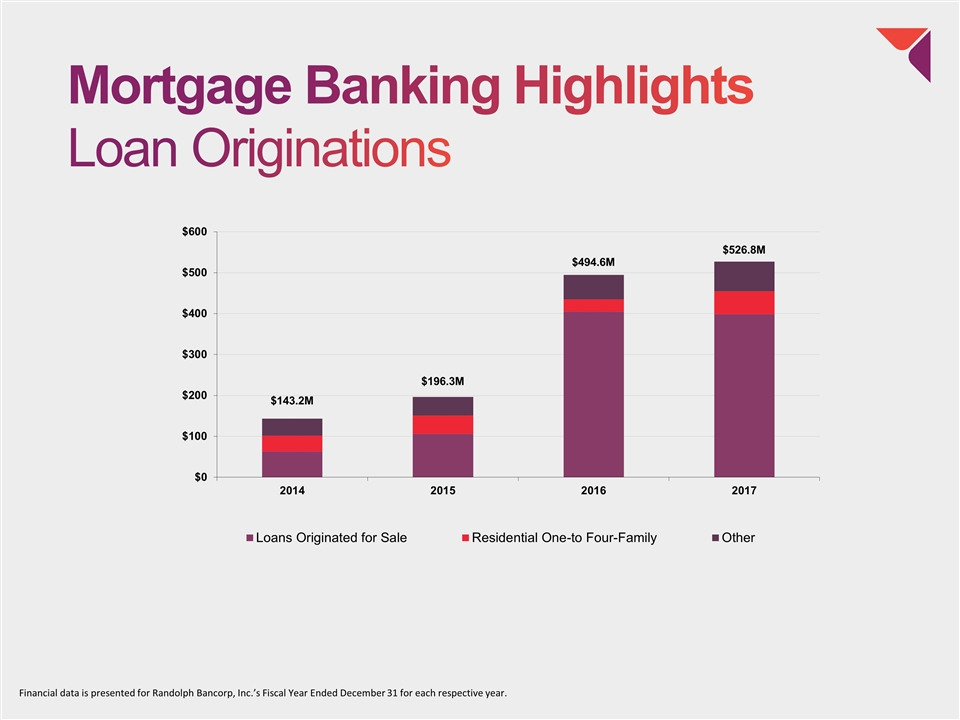
Mortgage Banking Highlights Loan Originations Financial data is presented for Randolph Bancorp, Inc.’s Fiscal Year Ended December 31 for each respective year.
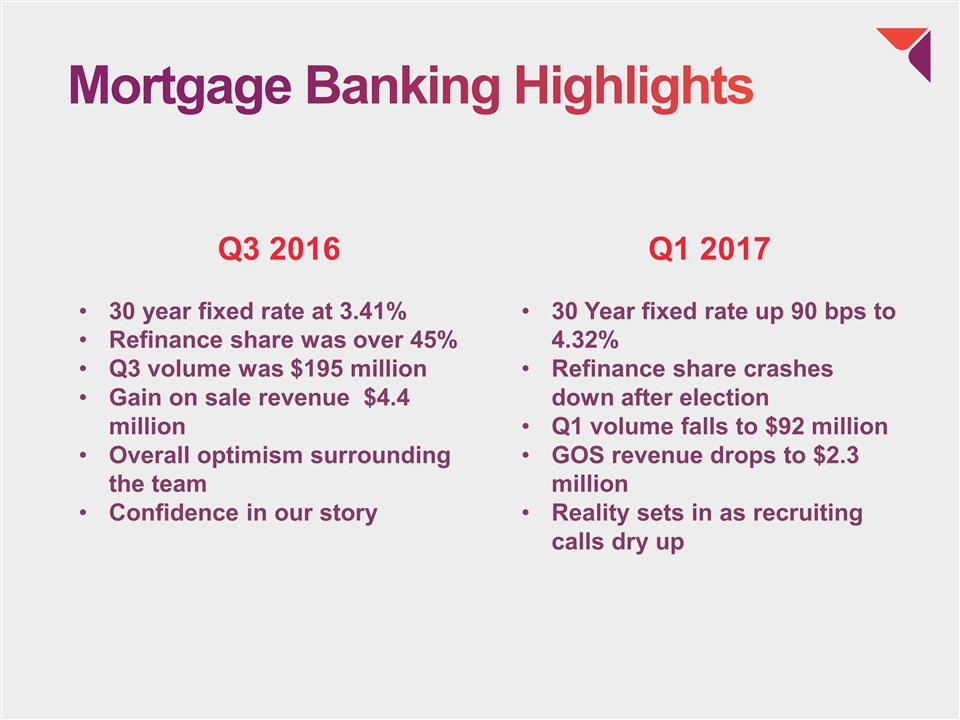
Mortgage Banking Highlights Q3 2016 30 year fixed rate at 3.41% Refinance share was over 45% Q3 volume was $195 million Gain on sale revenue $4.4 million Overall optimism surrounding the team Confidence in our story Q1 2017 30 Year fixed rate up 90 bps to 4.32% Refinance share crashes down after election Q1 volume falls to $92 million GOS revenue drops to $2.3 million Reality sets in as recruiting calls dry up
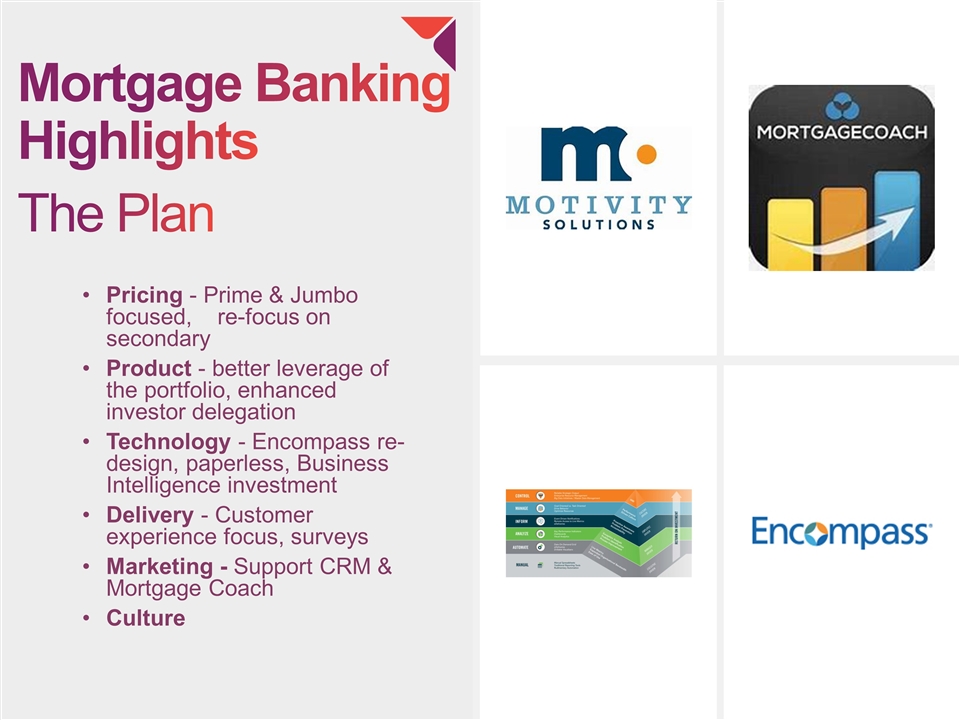
Mortgage Banking Highlights Pricing - Prime & Jumbo focused, re-focus on secondary Product - better leverage of the portfolio, enhanced investor delegation Technology - Encompass re-design, paperless, Business Intelligence investment Delivery - Customer experience focus, surveys Marketing - Support CRM & Mortgage Coach Culture The Plan
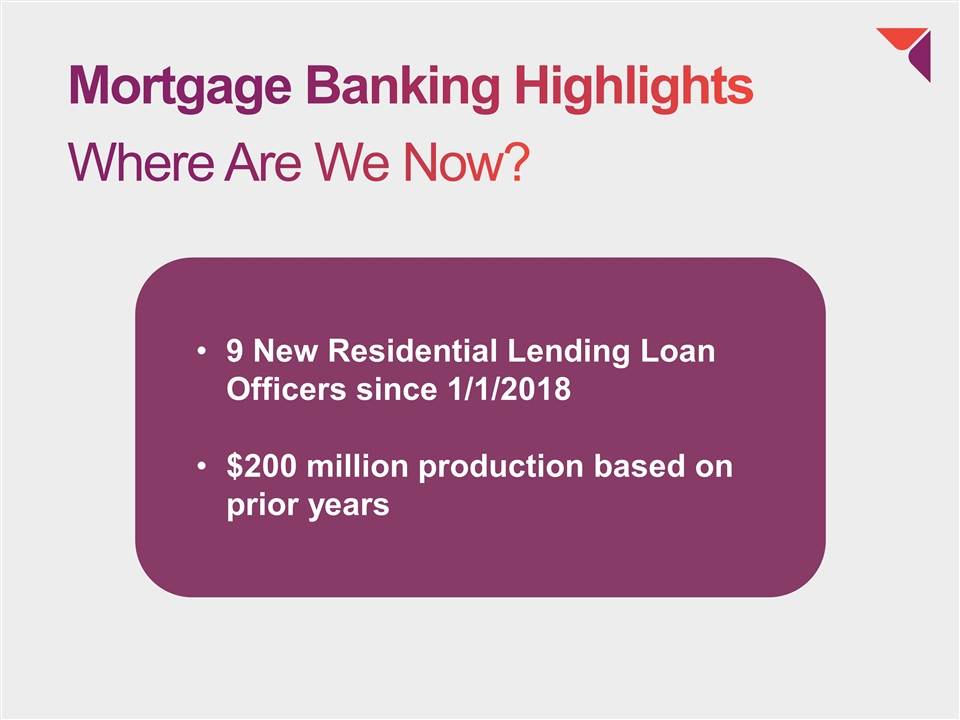
Mortgage Banking Highlights 9 New Residential Lending Loan Officers since 1/1/2018 $200 million production based on prior years Where Are We Now?
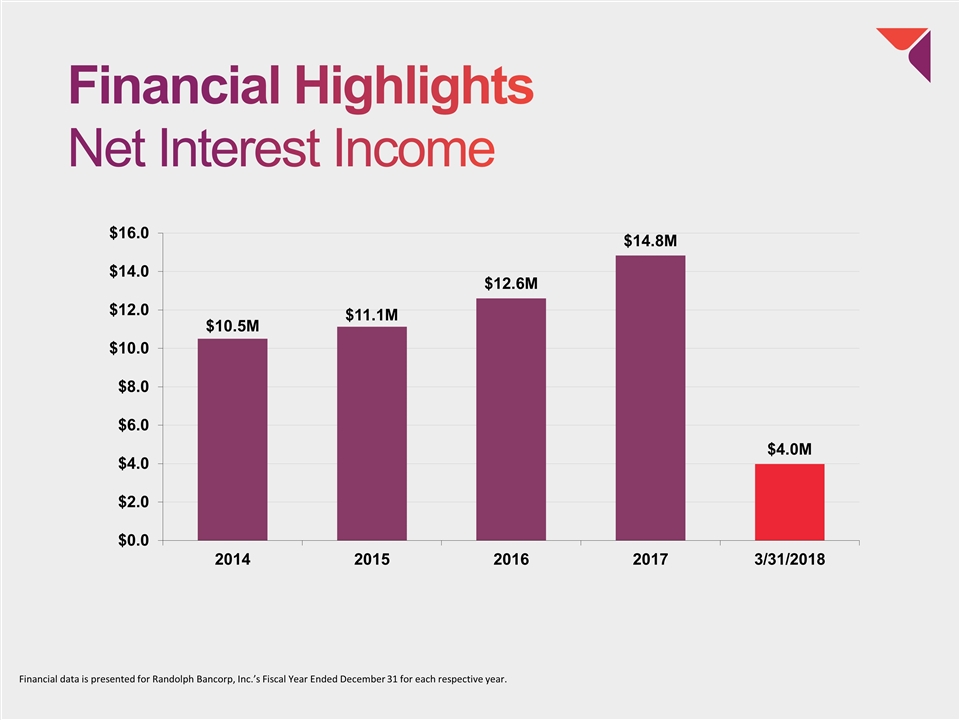
Financial Highlights Net Interest Income Financial data is presented for Randolph Bancorp, Inc.’s Fiscal Year Ended December 31 for each respective year.
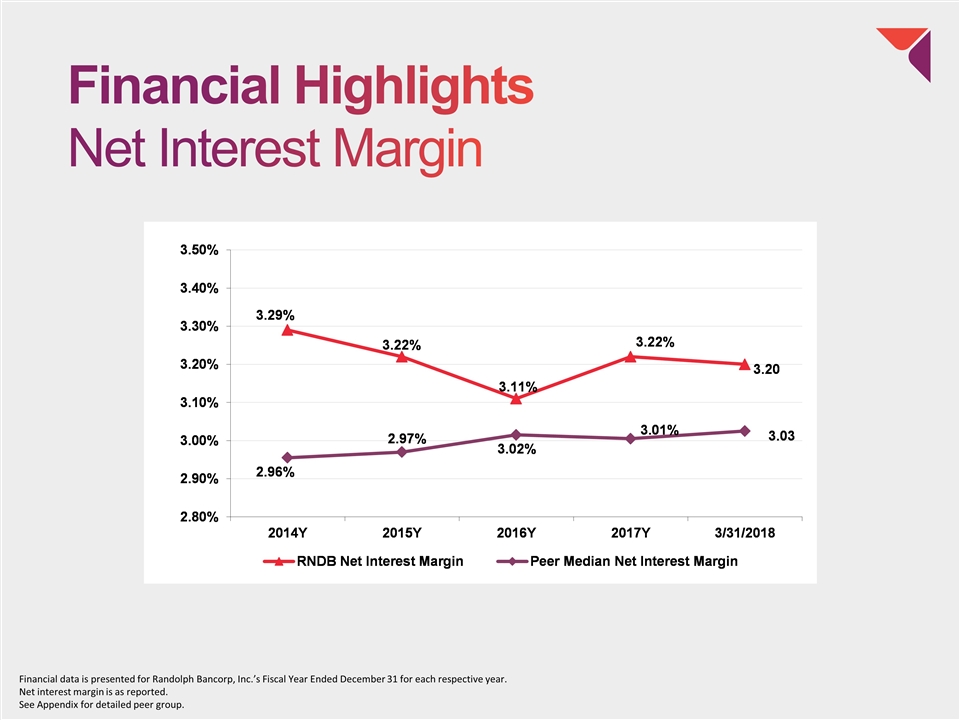
Financial Highlights Net Interest Margin Financial data is presented for Randolph Bancorp, Inc.’s Fiscal Year Ended December 31 for each respective year. Net interest margin is as reported. See Appendix for detailed peer group.
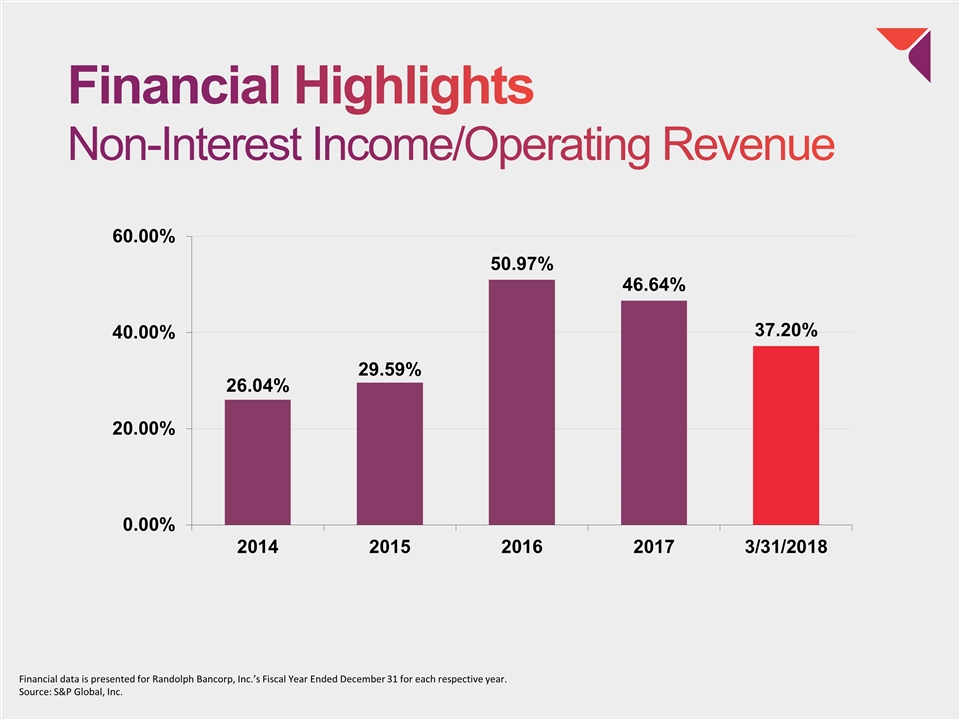
Financial Highlights Non-Interest Income/Operating Revenue Financial data is presented for Randolph Bancorp, Inc.’s Fiscal Year Ended December 31 for each respective year. Source: S&P Global, Inc.
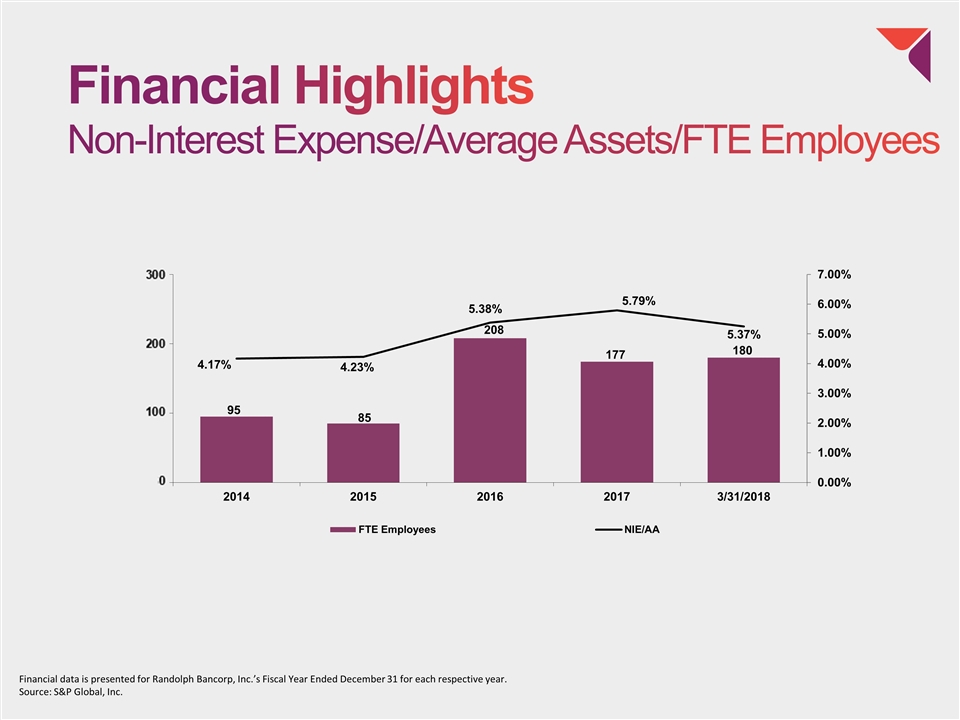
Financial Highlights Non-Interest Expense/Average Assets/FTE Employees Financial data is presented for Randolph Bancorp, Inc.’s Fiscal Year Ended December 31 for each respective year. Source: S&P Global, Inc. 95 180
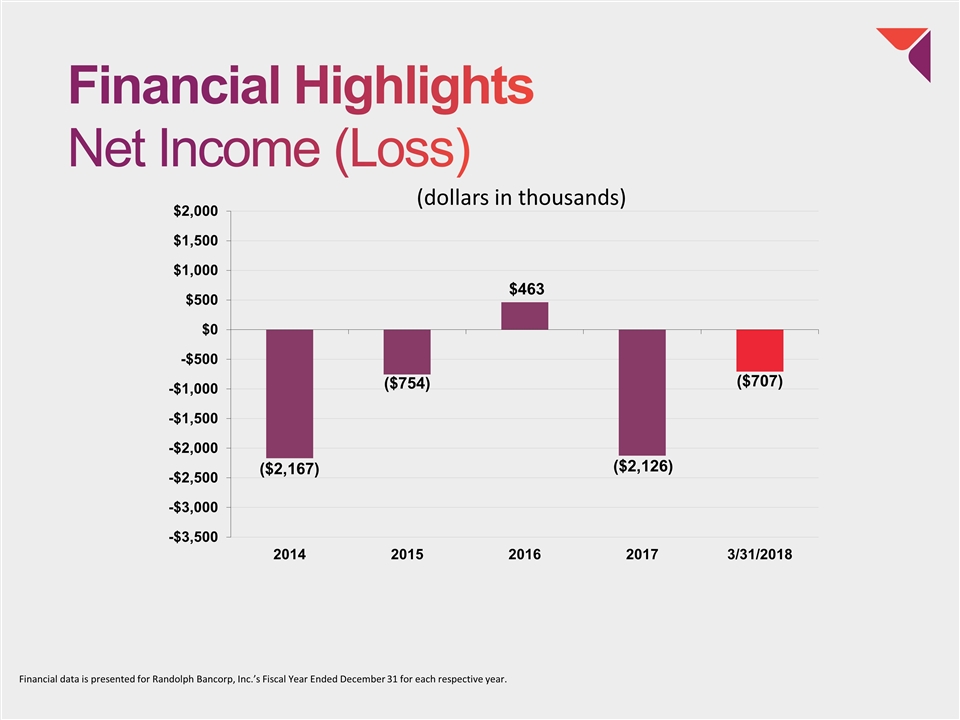
Financial Highlights Net Income (Loss) Financial data is presented for Randolph Bancorp, Inc.’s Fiscal Year Ended December 31 for each respective year. (dollars in thousands)
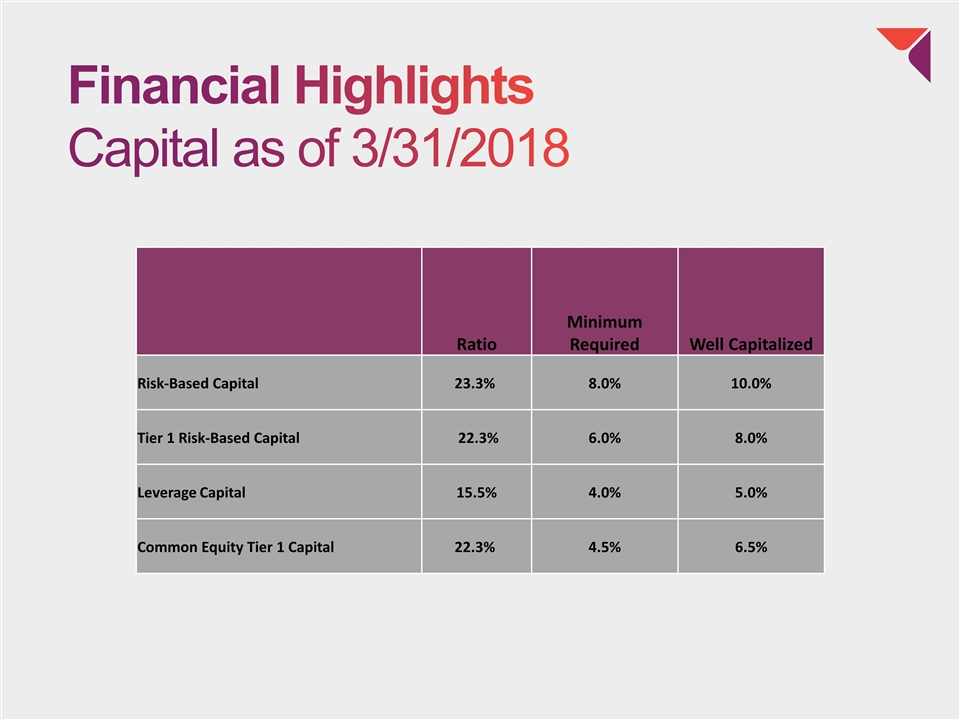
Financial Highlights Capital as of 3/31/2018 Ratio Minimum Required Well Capitalized Risk-Based Capital 23.3% 8.0% 10.0% Tier 1 Risk-Based Capital 22.3% 6.0% 8.0% Leverage Capital 15.5% 4.0% 5.0% Common Equity Tier 1 Capital 22.3% 4.5% 6.5%
Rebranding – Why Now? Support the goals, mission and values of the Bank Growth Reflect current capabilities Community focus Tell a more accurate story as to who we are

Rebranding – Brand Reception Positive feedback Customers Referral partners Colleagues Brand Launch Campaign Billboard Direct Mail COI Receptions Television Campaign & Key Sponsorships
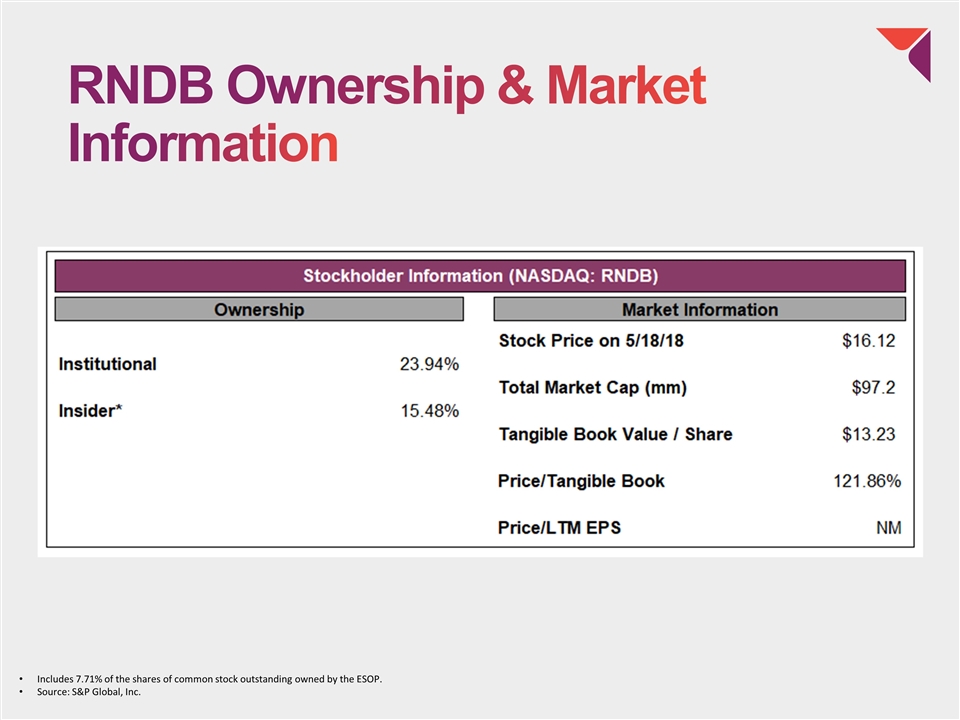
RNDB Ownership & Market Information Includes 7.71% of the shares of common stock outstanding owned by the ESOP. Source: S&P Global, Inc.
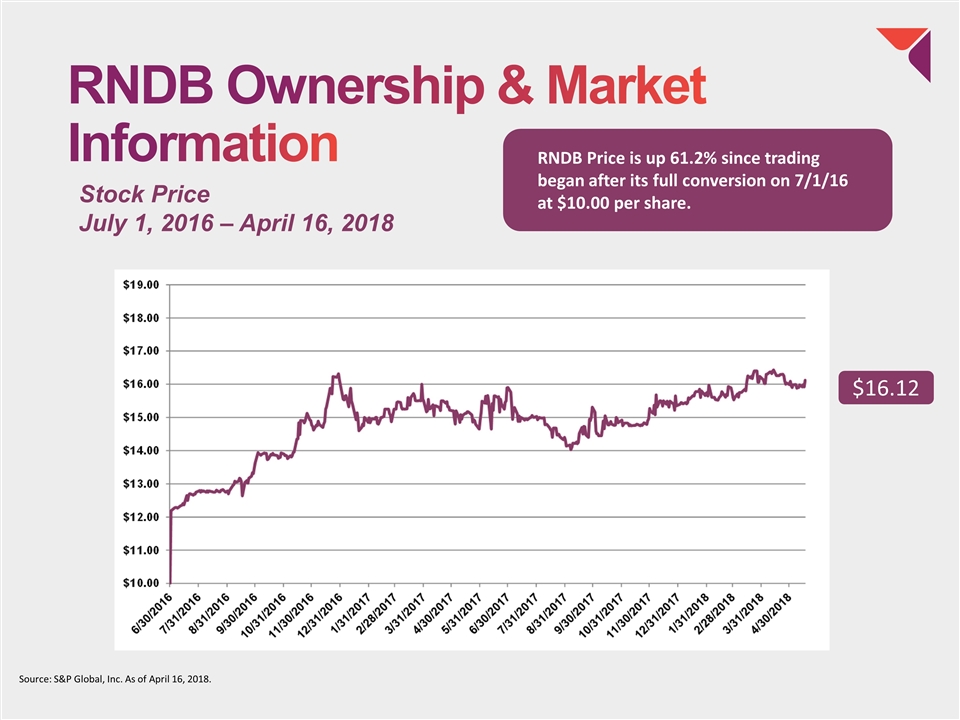
RNDB Ownership & Market Information Source: S&P Global, Inc. As of April 16, 2018. Stock Price July 1, 2016 – April 16, 2018 RNDB Price is up 61.2% since trading began after its full conversion on 7/1/16 at $10.00 per share. $16.12
Envisioning What Lies Ahead Grow quality purchase-money focused originator network Commercial loan growth at steady, responsible pace Core deposit growth to support loan growth Responsible and measured capital deployment

In Appreciation Richard Phillips 25 years of service Corporator since 1993 Director since 2007

Q & A
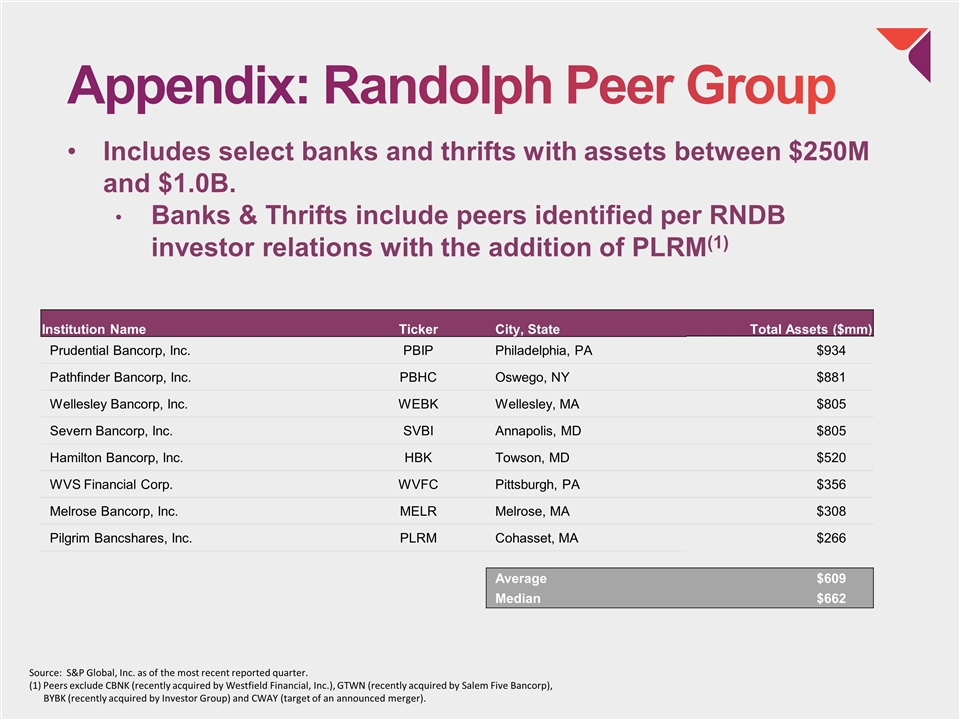
Appendix: Randolph Peer Group Institution Name Ticker City, State Total Assets ($mm) Prudential Bancorp, Inc. PBIP Philadelphia, PA $934 Pathfinder Bancorp, Inc. PBHC Oswego, NY $881 Wellesley Bancorp, Inc. WEBK Wellesley, MA $805 Severn Bancorp, Inc. SVBI Annapolis, MD $805 Hamilton Bancorp, Inc. HBK Towson, MD $520 WVS Financial Corp. WVFC Pittsburgh, PA $356 Melrose Bancorp, Inc. MELR Melrose, MA $308 Pilgrim Bancshares, Inc. PLRM Cohasset, MA $266 Average $609 Median $662 Source: S&P Global, Inc. as of the most recent reported quarter. (1) Peers exclude CBNK (recently acquired by Westfield Financial, Inc.), GTWN (recently acquired by Salem Five Bancorp), BYBK (recently acquired by Investor Group) and CWAY (target of an announced merger). Includes select banks and thrifts with assets between $250M and $1.0B. Banks & Thrifts include peers identified per RNDB investor relations with the addition of PLRM(1)
