Attached files
| file | filename |
|---|---|
| EX-31.4 - EX-31.4 - KLX Inc. | a18-13993_1ex31d4.htm |
| EX-31.3 - EX-31.3 - KLX Inc. | a18-13993_1ex31d3.htm |
UNITED STATES
SECURITIES AND EXCHANGE COMMISSION
Washington, D.C. 20549
FORM 10-K/A
Amendment No. 1
(Mark One)
x ANNUAL REPORT PURSUANT TO SECTION 13 OR 15(d) OF THE SECURITIES EXCHANGE ACT OF 1934
For the fiscal year ended January 31, 2018
or
o TRANSITION REPORT PURSUANT TO SECTION 13 OR 15(d) OF THE SECURITIES EXCHANGE ACT OF 1934
For the transition period from to
Commission File Number: 001-36610
KLX INC.
(Exact name of registrant as specified in its charter)
|
Delaware |
|
47-1639172 |
1300 Corporate Center Way
Wellington, Florida
(Address of principal executive offices)
(561) 383-5100
(Registrant’s telephone number, including area code) registered pursuant to Section 12(b) of the Act:
|
Title of Each Class |
|
Name of Each Exchange on Which Registered |
|
Common Stock, $0.01 Par Value |
|
The NASDAQ Global Select Market |
Securities registered pursuant to Section 12(g) of the Act: None.
Indicate by check mark if the registrant is a well-known seasoned issuer, as defined in Rule 405 of the Securities Act. Yes x No o
Indicate by check mark if the registrant is not required to file reports pursuant to Section 13 or Section 15(d) of the Act. Yes o No x
Indicate by check mark whether the registrant (1) has filed all reports required to be filed by Section 13 or 15(d) of the Securities Exchange Act of 1934 during the preceding 12 months (or for such shorter period that the registrant was required to file such reports), and (2) has been subject to such filing requirements for the past 90 days: Yes x No o
Indicate by check mark whether the registrant has submitted electronically and posted on its corporate Web site, if any, every Interactive Data File required to be submitted and posted pursuant to Rule 405 of Regulation S-T (§ 232.405 of this chapter) during the preceding 12 months (or for such shorter period that the registrant was required to submit and post such files). Yes x No o
Indicate by check mark if disclosure of delinquent filers pursuant to Item 405 of Regulation S-K (§ 229.405 of this chapter) is not contained herein, and will not be contained, to the best of the registrant’s knowledge, in definitive proxy or information statements incorporated by reference in Part III of this Form 10-K or any amendment to this Form 10-K. o
Indicate by check mark whether the registrant is a large accelerated filer, an accelerated filer, a non-accelerated filer, a smaller reporting company or an emerging growth company. See the definitions of “large accelerated filer,” “accelerated filer,” “smaller reporting company” and “emerging growth company” in Rule 12b-2 of the Exchange Act.
|
Large accelerated filer x |
|
Accelerated filer o |
|
Non-accelerated filer |
|
Smaller reporting company o |
|
Emerging growth company o |
|
|
If an emerging growth company, indicate by check mark if the registrant has elected not to use the extended transition period for complying with any new or revised financial accounting standards provided pursuant to Section 13(a) of the Exchange Act. o
Indicate by check mark whether the registrant is a shell company (as defined in Rule 12b-2 of the Exchange Act). Yes o No x
As of July 31, 2017, the aggregate market value of the registrant’s voting stock held by non-affiliates was approximately $2,614 million. Shares of common stock held by executive officers and directors have been excluded since such persons may be deemed affiliates. This determination of affiliate status is not a determination for any other purpose. The number of shares of the registrant’s common stock, $0.01 par value, outstanding as of March 13, 2018, was 50,740,101 shares.
This Amendment No. 1 to Form 10-K (this “Amendment”) amends the Annual Report on Form 10-K for the fiscal year ended on January 31, 2018 (the “2018 Form 10-K”) originally filed on March 19, 2018 (the “Original Filing”) by KLX Inc., a Delaware corporation (the “Company”). The Company is filing this Amendment to present the information required by Part III of Form 10-K, as the Company will not file a definitive proxy statement within 120 days of the end of the Company’s fiscal year ended January 31, 2018.
Except as described above, no other changes have been made to the Original Filing. The Original Filing continues to speak as of the date of the Original Filing, and the Company has not updated the disclosures contained therein to reflect any events that occurred at a date subsequent to the date of the Original Filing.
ITEM 10. DIRECTORS, EXECUTIVE OFFICERS AND CORPORATE GOVERNANCE
Our Executive Officers
The following table sets forth information regarding our executive officers as of May 1, 2018.
|
Name and Title |
|
Business Experience |
|
|
|
|
|
Amin J. Khoury Chief Executive Officer |
|
Amin J. Khoury has served as Chief Executive Officer and Chairman of the Board of Directors of KLX Inc. since its formation in December 2014. Mr. Khoury co-founded B/E Aerospace in July 1987 and served as its Chairman of the Board until its sale to Rockwell Collins in April 2017. Mr. Khoury served as Chief Executive Officer of B/E Aerospace from December 31, 2005 through December 31, 2013. Mr. Khoury also served as the Co-Chief Executive Officer of B/E Aerospace from January 1, 2014 to December 16, 2014. Mr. Khoury was a Trustee of the Scripps Research Institute from May 2008 until July 2014 and was a director of Synthes Incorporated until its acquisition by Johnson & Johnson in 2012. Mr. Khoury holds an Executive Masters Professional Director Certification, the highest level, from the American College of Corporate Directors. |
|
|
|
|
|
Thomas P. McCaffrey President and Chief Operating Officer |
|
Thomas P. McCaffrey has served as President and Chief Operating Officer of KLX Inc. since the spin-off in December 2014. Previously, Mr. McCaffrey served as Senior Vice President and Chief Financial Officer of B/E Aerospace from May 1993 until December 16, 2014. Prior to joining B/E Aerospace, Mr. McCaffrey was an Audit Director with Deloitte & Touche LLP from August 1989 through May 1993, and from 1976 through 1989 served in several capacities, including Audit Partner, with Coleman & Grant LLP. Since 2016, Mr. McCaffrey has served as a member of the Board of Trustees of Palm Beach Atlantic University, Chairman of its Development Committee and as a member of its Audit Committee. Mr. McCaffrey is a Certified Public Accountant licensed to practice in the states of Florida and California. |
|
|
|
|
|
Michael F. Senft Vice President, Chief Financial Officer |
|
Michael F. Senft has served as Vice President and Chief Financial Officer and Treasurer of KLX Inc. since November 2014. Previously, Mr. Senft served on the Board of Directors of B/E Aerospace from February 2012 until September 2014. Mr. Senft previously was a Managing Director of Moelis & Company. Mr. Senft’s prior positions include Global Head of Leveraged Finance at CIBC and Global Co-Head of Leveraged Finance at Merrill Lynch. For more than 20 years, he advised B/E Aerospace on its long-term capital transactions and strategic acquisitions. Mr. Senft has also served on the Board of Directors of Moly Mines Ltd. and Del Monte Foods. |
|
John Cuomo Vice President and General Manager, Aerospace Solutions Group |
|
John Cuomo has served as Vice President and General Manager of the Aerospace Solutions Group segment of KLX Inc. since the spin-off in December 2014. Previously, Mr. Cuomo served as Vice President and General Manager, Consumables Management business since July 2014. He has over 15 years of experience in the aerospace consumables distribution market and served in multiple roles and functions at B/E Aerospace Consumables Management from April 2000 to February 2014, with the most recent being Senior Vice President, Sales, Marketing and Business Development. Prior to joining B/E Aerospace, Mr. Cuomo served as an attorney at a large multi-national law firm practicing commercial law, mergers and acquisitions and litigation. He has a Bachelor of Science in International Business, a Juris Doctorate from the University of Miami and a Master of Business Administration from the University of Florida. |
|
|
|
|
|
Roger Franks General Counsel, Vice President — Law and Human Resources, Secretary |
|
Roger Franks has served as served as General Counsel, Vice President—Law and Human Resources, Secretary since December 2014. During Mr. Frank’s tenure at B/E Aerospace, he oversaw employee matters, commercial disputes, compliance and general corporate law. Prior to joining B/E Aerospace, he was on the Board of Directors of a mid-size California law firm where he focused on commercial matters including employment law and litigation. |
|
|
|
|
|
Gary J. Roberts Vice President and General Manager, Energy Services Group |
|
Gary Roberts has served as Vice President and General Manager of the Energy Services Group segment of KLX Inc. since the spin-off in December 2014. Previously, Mr. Roberts served as Vice President and General Manager, Energy Services Group since April 2014. Previously, Mr. Roberts was the Chief Executive Officer of Vision Oil Tools, LLC, a private energy services company, from 2010 until its acquisition by B/E Aerospace. Before that, Mr. Roberts was General Manager for Complete Production Services, Inc. and worked for Weatherford International from 1991 to 2008, holding management positions with increasing levels of responsibility in Singapore, China, Indonesia and Qatar. Mr. Roberts brings to KLX over 30 years of oilfield experience. |
|
|
|
|
|
Heather Floyd Vice President — Finance and Corporate Controller |
|
Heather Floyd has served as Vice President—Finance and Corporate Controller since the spin-off in December 2014. Previously, Ms. Floyd served as Vice President—Internal Audit of B/E Aerospace. Ms. Floyd has over 15 years of combined accounting, auditing, financial reporting and Sarbanes-Oxley compliance experience. Ms. Floyd joined B/E Aerospace in November 2010 as Director of Financial Reporting and Internal Controls. Prior to joining B/E Aerospace, Ms. Floyd served as an Audit Manager with Ernst & Young and in various accounting roles at Corporate Express, now a subsidiary of Staples. Ms. Floyd is a Certified Public Accountant licensed to practice in Florida. |
|
|
|
|
|
Eric Wesch Vice President — Finance |
|
Eric Wesch has been Vice President — Finance and Treasurer since July 2017. Previously, Mr. Wesch served as the Vice President — Finance, Treasurer and Assistant Secretary of B/E Aerospace, Inc. from July 2011 through April 2017 and as Corporate Treasurer from 2008 to 2011 where he oversaw treasury, risk management and shared services. Mr. Wesch has over 14 years of treasury related experience. Mr. Wesch joined B/E Aerospace, Inc. in 1997 as Manager, Financial Planning & Analysis and served in multiple roles within finance and treasury from January 1997 to 2008. Prior to joining B/E Aerospace, Inc., Mr. Wesch worked for Blockbuster Entertainment Group. |
Our Board of Directors
The following table sets forth information regarding our directors as of May 1, 2018. The table contains each person’s biography as well as the qualifications and experience each person would bring to our Board. Our Board consists of eight members, seven of whom will meet applicable regulatory and exchange listing independence requirements.
|
Name and Title |
|
Business Experience and Director Qualifications | ||
|
|
|
| ||
|
Amin J. Khoury Chairman |
|
79 |
|
Amin J. Khoury, our Chief Executive Officer and Chairman of our Board of Directors since our formation, co-founded B/E Aerospace in July 1987 and served as its Chairman of the Board. Mr. Khoury served as Chief Executive Officer of B/E Aerospace from December 31, 2005 through December 31, 2013. Mr. Khoury also served as the Co-Chief Executive Officer of B/E Aerospace from January 1, 2014 to December 16, 2014. Mr. Khoury was a Trustee of the Scripps Research Institute from May 2008 until July 2014. Mr. Khoury holds an Executive Masters Professional Director Certification, the highest level, from the American College of Corporate Directors. During his time at B/E Aerospace, Mr. Khoury was primarily responsible for the development and execution of B/E Aerospace’s business strategies that resulted in its growth from a single product line business with $3.0 million in annual sales, to the leading global manufacturer of commercial aircraft and business jet cabin interior products and the world’s leading distributor of aerospace consumable products, with annual revenues in 2013 of $3.5 billion. Mr. Khoury led the strategic planning and acquisition strategy of B/E Aerospace as well as its operational integration and execution strategies. He is a highly effective leader in organizational design and development matters and has been instrumental in identifying and attracting both our managerial talent and Board members. He has an intimate knowledge of the Company, its industry and its competitors which he has gained over the last 30 years at B/E Aerospace. All of the above experience and leadership roles uniquely qualify him to serve as our Company’s Chairman of the Board. |
|
|
|
|
|
|
|
John T. Collins Director |
|
71 |
|
John T. Collins has been a Director since December 2014. From 1986 to 1992, Mr. Collins served as the President and Chief Executive Officer of Quebecor Printing (USA) Inc., which was formed in 1986 by a merger with Semline Inc., where he had served in various positions since 1968, including since 1973 as President. During his term, Mr. Collins guided Quebecor Printing (USA) Inc. through several large acquisitions and situated the company to become one of the leaders in the industry. From 1992 to 2017, Mr. Collins was the Chairman and Chief Executive Officer of The Collins Group, Inc., a manager of a private securities portfolio and minority interest holder in several privately held companies. Mr. Collins currently serves on the Board of Directors of Federated Funds, Inc. and has served on the Board of Directors for several public companies, including Bank of America Corp. and FleetBoston Financial. In addition, Mr. Collins has served as Chairman of the Board of Trustees of his alma mater, Bentley University. Our Board benefits from Mr. Collins’s many years of experience in the management, acquisition and development of several companies. |
|
Peter V. Del Presto Director |
|
67 |
|
Peter V. Del Presto has been a Director since December 2014. Mr. Del Presto is an adjunct professor of finance at the University of Pittsburgh, where he teaches courses covering capital markets, advanced valuation methods and private equity. From 1985 until his retirement in 2010, Mr. Del Presto was a partner with PNC Equity Partners, a private equity firm and an affiliate of PNC Bank targeting middle-market companies for acquisition and investment. During his 25 years at PNC Equity Partners, Mr. Del Presto led the firm’s investment in 35 companies and participated as a member of the firm’s Investment Committee in over 200 investments. Mr. Del Presto was PNC Equity Partner’s representative on the boards of 24 companies where he was responsible for the development of value creation strategies in each. Mr. Del Presto is a director of Spencer Turbine Company and Markel Corporation, a member of the Board of Advisors of Sabert Corporation and the principal shareholder of two smaller companies. Mr. Del Presto is also a licensed private pilot. Our Board benefits from Mr. Del Presto’s background in engineering and business administration, his expertise in the field of finance, and 25 years of experience in the acquisition, investment and development of numerous companies. |
|
|
|
|
|
|
|
Richard G. Hamermesh Director |
|
70 |
|
Richard G. Hamermesh has been a Director since December 2014. Dr. Hamermesh is a Senior Fellow at the Harvard Business School, where he was formerly the MBA Class of 1961 Professor of Management Practice from 2002 to 2015. From 1987 to 2001, he was a co-founder and a Managing Partner of The Center for Executive Development, an executive education and development consulting firm. From 1976 to 1987, Dr. Hamermesh was a member of the faculty of Harvard Business School. He is also an active investor and entrepreneur, having participated as a principal, director and investor in the founding and early stages of more than 15 organizations. Dr. Hamermesh is a member of the Board of Directors of SmartCloud, Inc. and was a director of B/E Aerospace, Inc. until its sale to Rockwell Collins in April 2017. Dr. Hamermesh joined the Rockwell Collins Board of Directors in April 2017. Our Board benefits from Dr. Hamermesh’s education and business experience as co-founder of a leading executive education and consulting firm, as president, founder, director and co-investor in over 15 early stage businesses, and his 28 years as a Professor of Management Practice at Harvard Business School, where he has led MBA candidates through thousands of business case studies, as well as his intimate knowledge of our business and industry (including over 27 years as a member of the B/E Aerospace board). |
|
Benjamin A. Hardesty Director |
|
68 |
|
Benjamin A. Hardesty has been a Director since December 2014. Mr. Hardesty has been the owner of Alta Energy LLC, a consulting business focused on oil and natural gas in the Appalachian Basin and onshore United States since, 2010. In May 2010, Mr. Hardesty retired as president of Dominion E&P, Inc., a subsidiary of Dominion Resources Inc. engaged in the exploration and production of oil and natural gas in North America, a position he had held since September 2007. After joining Dominion Resources in 1995, Mr. Hardesty had previously also served in other executive positions, including President of Dominion Appalachian Development, Inc. and General Manager and Vice President Northeast Gas Basin. Mr. Hardesty has served on the Board of Directors of Antero Resources Corporation since its initial public offering in October 2013. He previously was a member of the Board of Directors of Blue Dot Energy Services, LLC from 2011 until its sale to B/E Aerospace in 2013. From 1982 to 1995, Mr. Hardesty served as an officer and director of Stonewall Gas Company, and from 1978 to 1982 as vice president of operations of Development Drilling Corporation. Mr. Hardesty is director emeritus and past president of the West Virginia Oil & Natural Gas Association and past president of the Independent Oil & Gas Association of West Virginia. Mr. Hardesty serves on the Visiting Committee of the Petroleum Natural Gas Engineering Department of the College of Engineering and Mineral Resources at West Virginia University. Mr. Hardesty’s significant experience in the oil and natural gas industry, including in our areas of operation, make him well suited to serve as a member of our Board. |
|
|
|
|
|
|
|
Stephen M. Ward, Jr. Director |
|
63 |
|
Stephen M. Ward, Jr., has been a Director since December 2014. Mr. Ward has been a director of Carpenter Technology Corporation since 2001, where he is Chair of the Corporate Governance Committee and a member of the Human Resources and Science and Technology Committees. Mr. Ward previously served as President and Chief Executive Officer of Lenovo Corporation, which was formed by the acquisition of IBM Corporation’s personal computer business by Lenovo of China. Mr. Ward had spent 26 years at IBM Corporation holding various management positions, including Chief Information Officer and Senior Vice President and General Manager, Personal Systems Group. Mr. Ward is a co-founder and Board member of C3-IoT, a company that develops and sells internet of things software for analytics and control. Mr. Ward was previously a Board member and founder of E2open, a maker of enterprise software, and a Board member of E-Ink, a maker of high-tech screens for e-readers and computers, and the Chairman of the Board of QDVision, the developer and a manufacturer of quantum dot technology for the computer, TV and display industries until its sale. Mr. Ward’s broad executive experience and focus on innovation enables him to share with our Board valuable perspectives on a variety of issues relating to management, strategic planning, tactical capital investments and international growth, making him well suited to serve as a member of our Board. |
|
Theodore L. Weise Director |
|
74 |
|
Theodore L. Weise has been a Director since December 2014. Mr. Weise is currently a business consultant and serves on the Board of Directors of Hawthorne Global Aviation Services. Mr. Weise joined Federal Express Corporation in 1972 during its formative years and retired in 2000 as its President and Chief Executive Officer. He held many officer positions, including Executive Vice President of World Wide Operations, and led the following divisions as its Senior Vice President: Air Operations, Domestic Ground Operations, Central Support Services, Business Service Center, and Operations Planning. Prior to joining Federal Express Corporation, Mr. Weise flew on the US Air Force F-111 as a Flight Test Engineer for General Dynamics Corp. He has previously served on the boards of Federal Express Corporation, Computer Management Sciences, Inc., ResortQuest International, Inc. and Pogo Jet, Inc. Mr. Weise is a member of the Missouri University of Science and Technology Board of Trustees, of which he was a past President. Mr. Weise is a jet rated Airline Transport Pilot with over 5,700 flight hours. He holds an Executive Masters Professional Director Certification from the American College of Corporate Directors. Our Board benefits from Mr. Weise’s extensive leadership experience. |
|
|
|
|
|
|
|
John T. Whates, Esq. Director |
|
70 |
|
John T. Whates has been a Director since December 2014. Mr. Whates has been an independent tax advisor and involved in venture capital and private investing since 2005. He is a member of the Board of Dynamic Healthcare Systems, Inc. and was the Chairman of the Compensation Committee of B/E Aerospace until its sale to Rockwell Collins in April 2017. Mr. Whates joined the Rockwell Collins Board of Directors in April 2017. From 1994 to 2011, Mr. Whates was a tax and financial advisor to B/E Aerospace, providing business and tax advice on essentially all of its significant strategic acquisitions. Previously, Mr. Whates was a tax partner in several of the largest public accounting firms, most recently leading the High Technology Group Tax Practice of Deloitte LLP in Orange County, California. He has extensive experience working with aerospace and other public companies in the fields of tax, equity financing and mergers and acquisitions. Mr. Whates is an attorney licensed to practice in California and was an Adjunct Professor of Taxation at Golden Gate University. Our Board benefits from Mr. Whates’s extensive experience, multi-dimensional educational background, and thorough knowledge of our business and industry. |
Structure of the Board of Directors
Our Board is divided into three classes of directors. Directors of each class are chosen for three-year terms upon the expiration of their current terms, and each year our stockholders elect one class of our directors.
Audit Committee
We have a separately-designated standing Audit Committee established in accordance with Section 3(a)(58)(A) of the Exchange Act. Messrs. Del Presto, Hardesty, Weise and Whates currently serve as members of the Audit Committee. Under the current SEC rules and the rules of Nasdaq, all of the members are independent. Our Board has determined that Mr. Del Presto and Mr. Whates are “audit committee financial experts” in accordance with current SEC rules. All members of the Audit Committee are independent, as that term is used in Item 407 of Regulation S-K of the federal securities laws.
Section 16(a) Beneficial Ownership Reporting Compliance
Section 16(a) of the Exchange Act requires our directors and executive officers, and persons who own more than ten percent of a registered class of our equity securities, to file with the SEC initial reports of ownership and reports of changes in ownership of our common stock and other equity securities. Officers, directors and greater-than-ten-percent stockholders are required by SEC regulations to furnish us with copies of all Section 16(a) forms they file.
Based solely on a review of the copies of reports furnished to us and, with respect to our directors and officers, written representations that no other reports were required, with respect to the year ended January 31, 2018, all Section 16(a) filing requirements applicable to our directors, officers and greater-than-ten-percent beneficial owners were complied with, with the exception that there was one late filing for each of our non-employee directors and one non-NEO officer. There was no failure to file a form.
Code of Business Conduct
Our Board has adopted a code of business conduct that applies to all our directors, officers and employees worldwide, including our principal executive officer, principal financial officer, controller, treasurer and all other employees performing a similar function. We maintain a copy of our code of business conduct, including any amendments thereto and any waivers applicable to any of our directors and officers, on our website at www.klx.com.
ITEM 11. EXECUTIVE COMPENSATION
Introduction
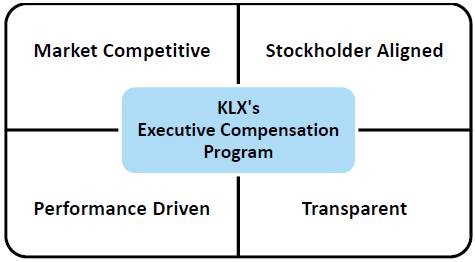
In this section, we discuss our compensation philosophy and describe the compensation programs for our Chairman and Chief Executive Officer and our senior leadership team. We explain how the Compensation Committee (the “Committee”) determines compensation of our senior executives and its rationale for specific 2017 decisions. Finally, we also discuss recent changes that the Committee has made to advance its fundamental objective — aligning our executive compensation program with the long-term incentives of KLX stockholders.
Our executive compensation program design utilizes financial results and effective strategic leadership, the key elements in building sustainable value for stockholders, as the principal criteria for evaluating executive performance. Our program’s performance measures align the interests of our stockholders and senior executives by correlating the timing and amount of actual pay to our short and long-term performance. We believe our program places an appropriate weight on ethical and responsible conduct as we pursue these goals.
We actively seek— and highly value— feedback from stockholders and their advisors concerning our compensation program. During Fiscal 2017, senior management has personally visited or held telephone conferences with 11 of our top 15 institutional investors.
In addition, we are committed to carefully benchmarking our compensation decisions against an appropriate group of peer companies, each one a potential competitor for the type of executive talent required to manage a complex, global company like KLX. The companies we include in our peer group are also of similar size and in the same or related business as we are.
In direct response to this year’s stockholder outreach and benchmarking, we have made several significant changes that further strengthen the alignment of executive compensation to the interests of KLX stockholders.
Our Approach to Executive Pay
Our executive compensation program was fully implemented over the past two years and incorporates the extensive feedback we gathered and analyzed from a spectrum of stakeholders including stockholders, proxy advisory firms, independent consultants, management and the full Board. We believe the 2017 executive pay program addresses the feedback we received and reaffirms our commitment to pay-for-performance that drives long-term stockholder value and is driven by the following guiding principles:
Guiding Principles
|
Pay for Performance |
|
Stockholder Alignment |
|
Long-term Focus |
|
A substantial portion of compensation should be variable, contingent and directly linked to individual, Company and business unit performance. |
|
The financial interests of executives should be aligned with the long-term interests of our stockholders through stock-based compensation and performance metrics that correlate with long-term stockholder value. |
|
For our most senior executives, long-term stock-based compensation opportunities should significantly outweigh short-term cash-based opportunities. Annual objectives should complement sustainable long-term performance. |
|
|
|
|
|
|
|
Competitiveness |
|
Balance |
|
Responsibility |
|
Total compensation should be sufficiently competitive to attract, retain and motivate a leadership team capable of maximizing KLX’s performance. Each element should be benchmarked relative to peers. |
|
The portion of total compensation contingent on performance should increase with an executive’s level of responsibility. Annual and long-term incentive compensation opportunities should reward the appropriate balance of short- and long-term financial and strategic business results. |
|
Compensation should take into account each executive’s responsibility to act in an ethical manner, which contemplates a compliance with, continuous environmental, health and safety objectives. The need for complete commitment to ethical and corporate responsibility is a basic tenet of our compensation program. |
The program applies to all of our NEOs as follows:
|
Name |
|
Title |
|
Amin J. Khoury |
|
Chief Executive Officer and Chairman of the Board of Directors |
|
Thomas P. McCaffrey |
|
President and Chief Operating Officer |
|
Michael J. Senft |
|
Vice President, Chief Financial Officer |
|
John Cuomo |
|
Vice President and General Manager, Aerospace Solutions Group |
|
Roger Franks |
|
Vice President — Law and Human Resources, General Counsel and Secretary |
Implementing the Feedback We Received; Our Response to Say on Pay
We regularly meet with our stockholders to discuss business topics, seek feedback on our performance and address other matters such as executive compensation. We continued our focus and intensity of our stockholder engagement during 2017 and we received a strong increase in support on the say-on-pay vote, which increased from approximately 95% in 2016 to approximately 97% in 2017. Since the beginning of 2017, we have spoken with 11 of our 15 largest stockholders. Through these multiple exchanges, we continue to interface with our stockholders regarding compensation philosophies, targeted compensation levels, performance metrics and other incentive design considerations.
As part of this process, the Compensation Committee worked with Pearl Meyer, the Committee’s independent compensation consultant, to gain Pearl Meyer’s perspectives on our pay practices to ensure that our approach going forward balances competitive market practices, stockholder expectations, best-practice governance standards and our business strategy.
The result of this extensive outreach was the development, adoption and implementation of a new comprehensive compensation program that more closely aligns with stockholder preferences. We executed this effort on an aggressive, yet thoughtful, implementation timeline to respond to our stockholders’ priorities, while mitigating any disruption to the business. Specifically, we adopted the new long-term equity incentive awards for the grants awarded since December 2015, and implemented the new annual cash incentive target levels and related performance metrics for the performance period for the years ending January 31, 2017 and 2018. The following is an overview of the modifications that we have made over the past several years based on discussions with our stockholders and from our compensation consultant.
|
Stockholder Feedback |
|
Actions Taken |
|
Increase the percentage of performance-based equity awards for long-term incentives |
|
Doubled the percentage of performance-based restricted stock from 25% to 50% of equity awards; 50% of NEO awards are dependent on the achievement of specific financial measures as compared against our peers over a three-year performance period |
|
Target TDC near the 50th percentile of the peer group |
|
Targeted TDC near the 50th percentile of our peer group, representing a significant decrease from the prior practice of targeting the 75th percentile of the peer group |
|
Target total cash compensation and annual cash incentive levels near the 50th percentile of the peer group |
|
Targeted annual cash incentive levels near the 50th percentile of our peer group, significantly reducing targeted cash compensation for our NEOs, including a 21% reduction of our CEO’s targeted total annual cash compensation |
|
Place a heavier weight on relative performance for long-term incentives, using multiple metrics |
|
Adopted new financial metrics that represent key elements of business performance— Earnings Before Interest and Taxes (EBIT) Margin, and free cash flow growth rate, — with award amounts determined based upon performance relative to our peer group |
|
Provide more transparent communication about how the program works |
|
Revamped our CD&A narrative using a simpler, more easily readable format |
A Closer Look at How Our Program Works
Our executive compensation program is grounded in our guiding principles and also stresses the following best-practice governance features:
· Compensation targeted at approximately the peer median; above median performance will result in pay above median, and below median performance will result in pay below median, consistent with market practices
· Heavy emphasis on variable compensation that is aligned with market practice
· Significant stock ownership guidelines
· Clawback policy
· Annual risk assessments
· No tax gross-ups
· No option backdating or repricing
· No hedging or pledging of NEO shares
Targeting Compensation at Approximately the 50th Percentile of the Peer Group
Target award opportunities are expressed as a percentage of base salary and are based on the individual NEO’s level of responsibility and ability to impact overall business results. The Committee set target award levels to align TDC and annual cash incentive levels at approximately the 50th percentile of our peer group.
Specifically, the following tables set forth target award opportunities under our prior executive compensation program, and the target cash bonus for 2017, followed by a table that sets forth the targeted long-term incentives under our current and prior programs for 2017 as compared to 2015. Our current cash incentive plan was implemented in 2016; our long-term incentive plan was implemented in December 2015. The second table also demonstrates the significant shift from time-based awards to performance-based awards.
|
|
|
Target Annual Cash Award Opportunity |
| ||
|
NEO |
|
Prior Plan |
|
Current Plan |
|
|
Amin J. Khoury |
|
175% |
|
110% |
|
|
Thomas P. McCaffrey |
|
150% |
|
95% |
|
|
Michael F. Senft |
|
75% |
|
70% |
|
|
John Cuomo |
|
75% |
|
70% |
|
|
Roger Franks |
|
75% |
|
70% |
|
|
|
|
Long-Term Incentives: Target Award Opportunity |
| ||||||
|
|
|
Performance-Based Restricted |
|
Time-Based Restricted Stock |
| ||||
|
NEO |
|
Prior Plan |
|
Current Plan |
|
Prior Plan |
|
Current Plan |
|
|
Amin J. Khoury |
|
81% |
|
162.5% |
|
244% |
|
162.5% |
|
|
Thomas P. McCaffrey |
|
81% |
|
162.5% |
|
244% |
|
162.5% |
|
|
Michael F. Senft |
|
44% |
|
87.5% |
|
131% |
|
87.5% |
|
|
John Cuomo |
|
38% |
|
75% |
|
112% |
|
75% |
|
|
Roger Franks |
|
38% |
|
75% |
|
112% |
|
75% |
|
The end result of these changes was to set targeted TDC near the 50th percentile of our peers with a significant portion of total compensation in the form of stock-based compensation. The portion of restricted stock that is performance-based doubled from 25% of each NEO’s award to 50% of each award effective with the 2015 awards.
Emphasizing Performance
Both our annual cash and long-term incentives place a significant focus on attaining certain performance goals and are evaluated on a relative basis as compared with our peers. We developed metrics, both financial and operational, to measure performance and ensure that our NEOs’ expectations are aligned with our stockholders.
The financial performance metrics upon which our NEOs’ performance-based incentive awards are determined are directly linked to the key drivers of our business: achieving superior operating margins and free cash flow growth rates. These metrics are also meaningful to investors.
The strategic and operational initiatives established and approved by the Compensation Committee at the beginning of each year ensure that the highest priorities are identified, monitored and measured over the course of the performance period. All of the financial and strategic goals are thoughtfully developed to complement each other— creating a holistic program that aligns the interests of our stockholders with our business strategy.
Annual cash incentives reward both the achievement of short-term financial goals, as well as the execution of activities to advance our strategic and operational priorities, which support near-term financial performance and long-term strategic objectives. Below is a summary of the annual cash incentive plan structure, including metrics and weightings.
Annual Cash Incentives— Plan Structure
|
Weighting |
|
Performance Objectives |
|
Metrics |
|
|
|
|
|
EBIT Margin (33 1/3% weighting) |
|
70% |
|
Financial Metrics |
|
Free Cash Flow Growth Rate (33 1/3% weighting) |
|
|
|
|
|
EBIT Growth Rate (33 1/3% weighting) |
|
|
|
|
|
|
|
|
|
|
|
Examples of strategic and operational initiatives include, but are not limited to: |
|
|
|
|
|
· Strengthen KLX brand identity, internally and externally |
|
30% |
|
Strategic and Operational Initiatives |
|
· Develop and implement programs to optimize efficiencies and effectiveness · Develop and implement financial tools and training for operations management |
|
|
|
|
|
· Continue to generate market share gains |
|
|
|
|
|
· Continue to expand product offerings · Continue to improve processes and efficiency |
The financial metric portion of the award is determined by the achievement of the combined score of the three performance metrics set at the beginning of the year as compared with our peers on a relative basis at the end of the year. The actual amount of cash incentives to be paid will be driven by the achievement of the below target performance targets relative to our peer group as follows:
|
Percentile Ranking |
|
Range of Payout* |
|
Below 25th Percentile |
|
0% payout |
|
From 25th to 50th Percentile |
|
50% to 100% payout |
|
From 50th to 75th Percentile |
|
100% to 200% of payout |
|
Above 75th Percentile |
|
200% payout (capped) |
*Performance achieved between the 25th and 50th percentiles and 50th and 75th percentiles is interpolated between the end points identified above.
The strategic and operational portion of the award is determined by the achievement of the strategic and operational objectives set at the beginning of the year as compared with our peers on an absolute basis at the end of the year. The actual amount of cash incentives to be paid is driven by the achievement of the performance targets determined by the Committee, as set forth below:
|
Percentile Ranking |
|
Range of Payout* |
|
Below 25th Percentile |
|
0% payout |
|
From 25th to 50th Percentile |
|
50% to 100% payout |
|
From 50th to 75th Percentile |
|
100% to 150% of payout |
|
Above 75th Percentile |
|
150% payout (capped) |
* Performance achieved between the 25th and 50th percentiles and 50th and 75th percentiles is interpolated between the end points identified above.
Total cash incentives are equal to the sum of the financial and non-financial achievements, and are awarded to our managers, including NEOs, based on their individual performance.
Long-term incentives encourage the NEOs to execute on longer-term financial goals that drive stockholder value creation and support our retention strategy.
|
Weighting |
|
Equity Vehicles |
|
Metrics |
|
50% |
|
Performance-Based Restricted Stock: Earned and vests based on the achievement of financial metrics relative to our peer group over a three-year performance period |
|
EBIT Margin |
|
50% |
|
Time-Based Restricted Stock: Vests in equal one-third increments, annually, until becoming fully vested on the third anniversary of the grant date |
|
N/A |
The actual amount of performance-based restricted stock earned and vested is driven by the achievement of performance against goals at the end of the three-year performance period relative to our compensation peer group as follows:
|
Percentile Ranking |
|
Range of Payout* |
|
Below 25th Percentile |
|
0% payout |
|
From 25th to 50th Percentile |
|
50% to 100% payout |
|
From 50th to 75th Percentile |
|
100% to 200% of payout |
|
Above 75th Percentile |
|
200% payout (capped) |
*Performance achieved between the 25th and 50th percentiles and 50th and 75th percentiles is interpolated between the end points identified above.
Executive Compensation Philosophy
Introduction
The Committee believes that executive compensation opportunities must align with and enhance long-term stockholder value. This core philosophy is embedded in all aspects of our executive compensation program and has allowed us to establish an important set of guiding principles. We believe these principles create a meaningful link between compensation outcomes and long-term, sustainable growth for our stockholders.
How We Make Compensation Decisions
Role of the Committee on Compensation and Executive Development
The Committee, which consists of three independent directors, is responsible for overseeing the development and administration of our executive compensation program. The Committee reviews and approves all aspects of our executive compensation program.
In this role, the Committee makes all compensation decisions relative to our CEO and approves all compensation recommendations for the other NEOs.
The Committee’s responsibilities include:
· Reviewing and approving incentive plans and objectives
· Assessing each NEO’s performance relative to these targets and objectives
· Evaluating the competitiveness of each NEO’s total compensation package
· Approving changes to a NEO’s compensation elements, including base salary, annual and long-term incentive opportunities and awards, benefits and perquisites
· Designing executive compensation plans and programs
The NEOs assist the Committee as requested with certain of the above.
The Committee’s charter, which sets out its objectives and responsibilities, can be found on our web site at www.klx.com.
The Committee’s Process
The Committee maintains a structured process for the evaluation of Company, CEO and NEO performance. At the beginning of each fiscal year, the Committee establishes strategic and financial objectives for the CEO for the upcoming year and for a longer-term period. At this meeting, it also evaluates the prior year performance of the CEO and NEOs.
A combination of qualitative and quantitative factors provides a broad and balanced assessment of performance.
A Process for Performance Evaluation
|
Internal Performance |
|
External Performance |
|
Achievement versus previously established strategic, financial and operational goals. |
|
Relative financial performance using key financial metrics versus peers over varying time periods. |
The Role of Management
The CEO does not play any role in the Committee’s determination of his own compensation. However, he presents the Committee with recommendations for each element of compensation, including the level of base salary and annual and long-term incentive awards for the other NEOs. Mr. Khoury bases these recommendations upon his assessment of each individual’s performance, the performance of his or her respective business unit and/or function, benchmark information and retention risk. The Committee reviews the CEO’s recommendations, makes adjustments, as appropriate, and approves compensation changes at its sole discretion.
The Role of Compensation Consultant
To gain a perspective on external pay levels, emerging practices and regulatory changes, the Committee has engaged an independent executive compensation consultant to provide benchmark and survey information and advise the Compensation Committee as it conducts its review of our executive and director compensation programs. Our Board selected Pearl Meyer as its independent consultant and tasked them with gathering market competitive data, reviewing compensation plan design alternatives and advising the Committee on director and executive compensation trends and best practices.
Executive Compensation Practices
We strive to maintain sound compensation practices by continually monitoring the evolution of best practices. Here are some of the principal practices we follow:
· Review of Pay versus Performance. The Committee continually reviews the relationship of the CEO’s compensation relative to the Company’s performance.
· Rigorous Stock Ownership Guidelines. Stock ownership requirements for the CEO are five
times base salary; three times base salary for the other NEOs.
· Review of Compensation Peer Group (“CPG”). The Committee periodically reviews the CPG and makes adjustments, when appropriate, to further enhance our market competitiveness and alignment with investor expectations. As an example, during 2016, the Committee modified our CPG to eliminate businesses that no longer were of similar size and added other aerospace, industrial or energy service providers which are more appropriate for peer comparison purposes.
· No Tax Gross-Ups. KLX does not provide excise tax reimbursements or gross-ups in the event of a change in control.
· No Pledging of Shares. To avoid conflicts of interest that could undermine the goals of our share ownership policy and the focus on sustainable long-term growth, KLX prohibits directors and employees from entering into transactions involving short sales of our securities or put or call options based on our securities, except for options granted under KLX compensation programs. In addition, directors and NEOs are generally prohibited from holding KLX shares in a margin account or pledging KLX shares as collateral for a loan.
· No Hedging. Directors and employees may not enter into short sales or purchase put or call options on KLX common stock.
· No Repricing or Underwater Cash Buyouts. Stock option exercise prices are set at the grant date market price and may not be reduced (except to adjust for stock splits or similar transactions) without stockholder approval.
· Clawback(s). KLX has a comprehensive policy addressing the clawback of executive compensation. In the event of a material restatement of the Company’s financial results, the Board will review the facts and circumstances that led to the requirement for the restatement and may take such actions, if any, as it deems necessary or appropriate in its discretion. The Board will consider whether any executive officer received cash incentive compensation based on the original financial statements because it appeared he or she had achieved financial performance targets that were not achieved based on the restatement. The Board also will consider the accountability of any executive officer whose acts or omissions were responsible in whole or in part for the events that led to the restatement and whether such acts or omissions constituted misconduct.
Competitive Positioning
Peer Group Benchmarking
To evaluate market competitiveness, we compare our program to the compensation at the 17 companies that make up our CPG. These companies provide a relevant comparison based on their similarity to us in size and complexity, taking into account factors such as their revenues, market capitalization, global scope of operations during 2017 and diversified product portfolios. For benchmarking purposes, the Committee believes that a mix of both industry and non-industry peers provides a balanced and realistic perspective on competition for the pool of potential senior executive talent.
In addition to CPG data, we look at a broader sample of proxy and general industry pay benchmark data. This information provides useful insight on compensation trends and supplements CPG data, when appropriate. For certain positions such as our President and Chief Operating Officer, where there are not an adequate number of incumbents to benchmark against, we develop an alternative peer group with similar positions at comparable size companies to establish benchmarks. Because the benchmarking process is performed based upon publicly available information from our CPG, and other broader samples, the comparisons are based upon data from the preceding year. As a result, the August 2017 Pearl Meyer benchmarking study prepared for the Committee was generally based upon data for the year ended December 31, 2016 and May 30, 2017 as to size and composition of the peer group for purposes of determining the applicability of the peers. The study which Pearl Meyer will prepare for the Committee for its August 2018 meeting will be generally based on the comparison companies’ data for the period ended December 31, 2017.
Our 2017 CPG includes the following companies, based on May 30, 2017 data as described above (dollars in thousands):
|
|
|
GICS Sub-Industry |
|
Revenue |
|
Equity Market |
|
Enterprise |
| |||
|
AAR Corp. |
|
Aerospace and Defense |
|
$ |
1,708 |
|
$ |
1,156 |
|
$ |
1,288 |
|
|
Basic Energy Services, Inc. |
|
Oil and Gas Equipment and Services |
|
599 |
|
713 |
|
899 |
| |||
|
C&J Energy Services, Inc. |
|
Oil and Gas Equipment and Services |
|
1,016 |
|
2,159 |
|
2,044 |
| |||
|
Carlisle Companies Incorporated |
|
Industrial Conglomerates |
|
3,739 |
|
6,580 |
|
7,043 |
| |||
|
Esterline Technologies Corp. |
|
Aerospace and Defense |
|
2,028 |
|
2,849 |
|
3,385 |
| |||
|
Forum Energy Technologies, Inc. |
|
Oil and Gas Equipment and Services |
|
599 |
|
1,578 |
|
1,772 |
| |||
|
Helix Energy Solutions Group, Inc. |
|
Oil and Gas Equipment and Services |
|
501 |
|
749 |
|
821 |
| |||
|
Hexcel Corp. |
|
Aerospace and Defense |
|
1,985 |
|
4,566 |
|
5,325 |
| |||
|
ITT Inc. |
|
Industrial Machinery |
|
2,422 |
|
3,393 |
|
3,259 |
| |||
|
Kennametal Inc. |
|
Industrial Machinery |
|
2,015 |
|
3,115 |
|
3,744 |
| |||
|
Mueller Industries Inc. |
|
Industrial Machinery |
|
2,101 |
|
1,627 |
|
2,024 |
| |||
|
Oil States International, Inc. |
|
Oil and Gas Equipment and Services |
|
676 |
|
1,495 |
|
1,456 |
| |||
|
Patterson-UTI Energy, Inc. |
|
Oil and Gas Drilling |
|
933 |
|
4,500 |
|
4,632 |
| |||
|
Superior Energy Services, Inc. |
|
Oil and Gas Equipment and Services |
|
1,438 |
|
1,589 |
|
2,724 |
| |||
|
The Timken Company |
|
Industrial Machinery |
|
2,690 |
|
3,619 |
|
4,160 |
| |||
|
Wesco Aircraft Holdings, Inc. |
|
Aerospace and Defense |
|
1,445 |
|
957 |
|
1,766 |
| |||
|
Woodward, Inc. |
|
Industrial Machinery |
|
2,042 |
|
4,153 |
|
4,770 |
| |||
|
|
|
Average |
|
1,643 |
|
2,635 |
|
3,007 |
| |||
|
|
|
25th Percentile |
|
933 |
|
1,495 |
|
1,766 |
| |||
|
|
|
Median Percentile |
|
1,708 |
|
2,159 |
|
2,724 |
| |||
|
|
|
75th Percentile |
|
2,042 |
|
3,619 |
|
4,160 |
| |||
|
KLX |
|
Aerospace and Defense |
|
1,553 |
|
2,475 |
|
3,389 |
| |||
|
|
|
Rank |
|
10 of 18 |
|
9 of 18 |
|
7 of 18 |
| |||
|
|
|
Percentile |
|
46% |
|
53% |
|
63% |
| |||
(1) Calculated as of May 30, 2017
The above peer group was appropriate for KLX in 2017 and will be reviewed annually as industry conditions in the aerospace and defense and energy sectors change. The above study was based on December 31, 2016 trailing twelve months revenues and equity valuations as of May 30, 2017. KLX’s equity market capitalization and enterprise value based on our May 30, 2017 share price of $47.86 was $2,475 and $3,389, respectively, which would have represented percentile rankings of 53% and 63%, respectively.
External Benchmarking
Benchmarking Objectives
The Committee uses external benchmarking based on our compensation structure as we strive to ensure that our compensation program remains competitive and in alignment with our industry peers. Through the structural changes we made to our NEO compensation program during 2015, our primary objective of our executive compensation program was to align our target levels of TDC for our NEOs at approximately the 50th percentile of our CPG. We define target total direct compensation as base salary, target annual cash incentives and target long-term incentives. We reviewed the weighting of each component and have adjusted the various elements accordingly based upon stockholder feedback and market best practices. While maintaining our primary objective, we also consider the cyclical nature of our business, our historical business performance, and our future
financial and strategic goals. These factors are necessary in attracting, maintaining and retaining our leadership team, who we view as critical assets given their knowledge, relationships and expertise.
We believe market data provides a reference and framework for decisions about the base salary, target annual cash incentives and the appropriate target level of long-term incentives to be provided to each NEO. However, due to variability and the inexact science of matching and pricing executive jobs, we believe that market data should be interpreted within the context of other important factors and should not solely be used to dictate a specific pay level for an executive. As a result, in setting the target pay level of our NEOs, market data is reviewed along with a variety of other factors, including individual performance, competencies, skills, future potential, prior experience, scope of responsibility and accountability within the organization.
Pearl Meyer reviewed both the individual components and aggregate composition of our compensation packages for our NEOs focusing on several components of pay including:
· base salary;
· target and actual cash incentives;
· total cash compensation (i.e., base salary plus cash incentives);
· target and actual long-term equity incentives; and
· target and actual total direct compensation (i.e., total cash plus long-term equity incentives).
Based on this review of our revised compensation program, Pearl Meyer advised the Committee that, for our NEOs, the target TDC for the NEO group approximated the median (50th percentile) of our CPG.
How We Structure Our Compensation
The following elements make up our compensation program:
|
Element |
|
Form |
|
Base Salary |
|
Cash |
|
Annual Incentives |
|
Cash |
|
Long-Term Incentives (LTI) |
|
50% Performance-Based Restricted Stock Units |
|
|
|
50% Time-Vested Restricted Stock Awards |
|
Retirement |
|
Supplemental Retirement Plan |
|
|
|
401(k) Savings Plan |
Emphasis on Contingent Compensation
The total compensation of each NEO is substantially contingent on performance. The Committee selects individual and business performance metrics designed to link actual compensation amounts with factors that contribute to stockholder value.
Fixed compensation elements, such as base salary, SERP and other benefits, are designed to be sufficiently competitive for recruitment and retention purposes.
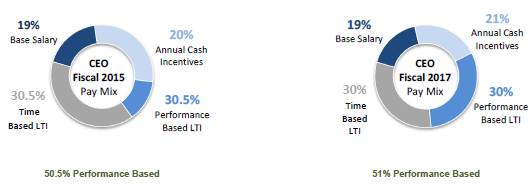
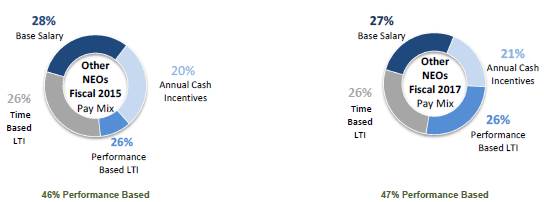
The following charts illustrate the basic pay mix for our CEO and other NEOs:
Pay Mix
Our compensation structure has an appropriate focus on performance-based compensation. The charts below show targeted 2017 TDC for our CEO and our other NEOs. These graphs also illustrate the targeted annual cash incentives for our CEO and our NEO group. These charts demonstrate that our compensation structure emphasizes accountability and correlation of performance relative to pay and correlates well with our CPG.
All figures are shown as a percentage of target TDC.
Target TDC Comparison: CEO
Target TDC Comparison: Other NEOs
How We Set Our Financial Targets
Each year we establish financial and strategic objectives with quantitative targets that determine annual and long-term incentive award opportunities for our NEOs. We strive to set financial targets that are both challenging and realistic.
2017 Financial Performance Assessment
Following are the Consolidated, ASG and ESG financial and operational highlights:
|
2017 Financial Results |
|
|
|
· Consolidated revenues of $1.74 billion increased 16.5% |
|
· ASG generated record revenues of $1.4 billion, operating earnings increased to $238.5 million and operating margin was 16.8% |
|
· ESG revenues of $320.6 million increased by 109.3% and generated positive adjusted operating earnings(1) of $1.2 million in the fourth quarter of 2017 |
|
· Operating earnings, adjusted net earnings and adjusted EPS were $216.3 million, $166.4 million and $3.24 per share, respectively(1) |
|
· Generated cash flow from operating activities of $206.6 million |
|
· Repurchased $131.3 million of KLXI common stock cumulatively through January 31, 2018 ($79.4 million through 2017) |
|
· Initiated strategic alternatives review |
(1) Adjusted net earnings and adjusted EPS reflect net earnings before the non-cash charge associated with the revaluation of the Company’s deferred tax assets, Costs as Defined, amortization and non-cash compensation expense, and include the tax benefit from the amortization of tax-deductible goodwill.
2017 Operational Highlights
· Enhanced strong corporate infrastructure to support business segments.
· Continued to enhance a comprehensive corporate governance structure that recognizes risk management as an important part of day to day responsibilities.
· Completed the development of a KLX data center and completed the migration from B/E Aerospace’s data center.
· Implemented new warehouse management system in Phoenix operations yielding approximately 30% increase in site productivity.
· Continued to enhance our ESG Research and Development Center of Excellence, which has developed or is in the process of developing more than 21 innovative tools for our energy service customers, including 7 patented products and 27 tools with patents pending.
· Completed the build-out of ASG’s new global distribution and operations center in Miami.
· ESG revenues of $320.6 million increased by 109.3% and generated positive adjusted operating earnings in the fourth quarter of 2017.
· Continued to strengthen the ASG and ESG management teams through numerous key new hires and internal development programs.
· Won approximately $150 million of new ASG customers under long-term agreements in each of ASG’s end markets.
· Renewed/expanded ASG’s long-term agreements with key customers on programs.
· Continued to expand the number of ASG suppliers under long-term supply agreements.
· Expanded E-Commerce website at ASG with annualized revenues of approximately $70 million.
Annual Incentive Plan
The Committee determined due to the severity of the decline in the energy sector as well resulting fluctuations in customer demand for ESG’s products and services that ESG should be evaluated on the basis of non-financial goals oriented toward aligning its products and service and staffing levels consistent with demand, with a focus on improving its core infrastructure, systems and processes, upgrading the quality of its personnel as appropriate, and establishing new product development activities to further differentiate ESG as the industry
begins to recover. As a result, our evaluation of ESG’s performance was based on these and other non-financial goals and accomplishments set forth above. During 2016, cash bonuses at ESG were based on individual performance and were limited to 50% of targeted bonus.
In addition, in order to maintain morale at ESG in these difficult conditions, we increased the key executives’ restricted stock awards by 50% of the targeted cash bonus that was foregone in 2016, thereby effecting a strong retention tool as the oil field service sector began its recovery. ASG and ESG were evaluated on a relative basis as compared with its CPG.
For 2017, ASG performance as compared with peer groups on a relative percentile ranking basis was as follows:
|
|
|
ASG Performance |
|
Peer Group Ranking (Percentile) |
|
|
EBIT Margin |
|
17.0% |
|
91st |
|
|
Free Cash Flow Growth Rate(1) |
|
5.5% |
|
81st |
|
|
EBIT Growth Rate |
|
8.9% |
|
55th |
|
|
Average Ranking |
|
— |
|
76th |
|
(1) Free Cash Flow Growth Rate represents KLX consolidated year-over-year performance.
For 2017, ESG performance as compared with its peer group on a relative percentile ranking basis was as follows:
|
|
|
ESG Performance |
|
Peer Group Ranking (Percentile) |
|
|
EBIT Margin |
|
(5.8)% |
|
83rd |
|
|
Free Cash Flow Growth Rate(1) |
|
5.5% |
|
100th |
|
|
EBIT Growth Rate |
|
79.6% |
|
83rd |
|
|
Average Ranking |
|
— |
|
89th |
|
(1) Free Cash Flow Growth Rate represents KLX consolidated year-over-year performance.
Corporate NEOs’ financial metrics were based on performance with the Company’s CPG. The following table summarizes the company’s consolidated performance against its entire peer group on a relative basis:
|
|
|
KLX Consolidated |
|
Peer Group Ranking (Percentile) |
|
|
EBIT Margin |
|
12.8% |
|
88th |
|
|
Free Cash Flow Growth Rate |
|
5.5% |
|
80th |
|
|
EBIT Growth Rate |
|
70.9% |
|
88th |
|
|
Average Ranking |
|
— |
|
85th |
|
As a result, the Committee concluded that the financial metrics for ASG, ESG and the corporate NEOs were achieved at the 75th percentile, which is the maximum level of performance under our annual cash incentive plan.
The Committee reviewed each of ASG’s and ESG’s non-financial goals in detail and determined that these goals were achieved, or substantial progress was made toward achievement of multi-year objectives.
As a result, the Committee determined that the KLX NEOs achieved 200% of their 2017 targeted cash incentives.
Annual Cash Incentive Awards for 2017. Based on the financial performance results, individual achievements and achievement of non-financial goals, the Committee approved the following cash bonus awards, for each of the NEOs based upon 2017 performance:
|
Annual Incentive Payouts for 2017 |
| ||||||||||
|
NEO |
|
Target (as a |
|
Target Bonus |
|
Award (as a percentage |
|
Award |
| ||
|
Amin Khoury |
|
110% |
|
$ |
1,210,180 |
|
208% |
|
$ |
2,238,834 |
|
|
Thomas P. McCaffrey |
|
95% |
|
$ |
667,855 |
|
180% |
|
$ |
1,235,531 |
|
|
Michael F. Senft |
|
70% |
|
$ |
329,013 |
|
132% |
|
$ |
608,675 |
|
|
John Cuomo |
|
70% |
|
$ |
306,580 |
|
132% |
|
$ |
567,174 |
|
|
Roger Franks |
|
70% |
|
$ |
284,149 |
|
132% |
|
$ |
525,675 |
|
Annual incentive payments for Fiscal 2017 were paid in late December 2017. Historically, annual incentive payments have been paid following the end of the applicable fiscal year, but the Committee resolved to make payments earlier for Fiscal 2017 based on the high level of achievement of the applicable Fiscal 2017 performance goals as of the end of calendar year 2017 and in light of the pending federal tax law changes that were adopted at the end of calendar year 2017 and that became effective in calendar year 2018, which introduced uncertainty as to the tax deductibility of such annual incentive payments going forward. To ensure deductibility of the annual incentive payments in 2017 under then existing federal tax law, the payments were subject to recoupment by the Company in the event that the applicable performance goals were not achieved or certified by the Committee based on the full Fiscal 2017 results. Following completion of Fiscal 2017, the Committee certified the achievement of Fiscal 2017 results, and no recoupment was necessary due to the Company’s outstanding performance for Fiscal 2017.
Long-Term Incentives. In addition to the aforementioned incentives, we provide our NEOs with long-term equity incentive awards under our long-term incentive plan. We believe the use of long-term equity incentive awards accomplishes important objectives of our executive compensation program by linking executive compensation to long-term stockholder value creation. The level of benefit received by our NEOs in connection with these awards is dependent, to a large degree, on our achievement of the pre-determined goals over each three-year period.
On December 8, 2016, the Committee approved grants of restricted stock to our NEOs, as well as other participants. The number of shares of restricted stock comprising each award granted is equal to the dollar value of such award approved by our Committee, divided by the closing price of our common stock as quoted on the NASDAQ Global Select Market on the date of grant. The Company did not grant any stock options during Fiscal 2016 or 2017.
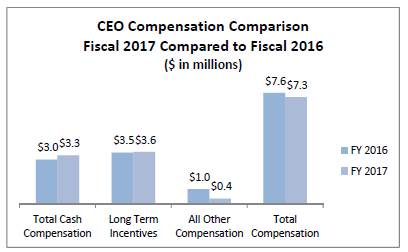
The following chart sets forth our CEO’s total cash, LTIs and all other and total compensation for Fiscal 2016 and 2017.
Long-Term Incentive Award Grants for 2017. Based on the new compensation program and incentive targets, the Committee approved and granted in December 2017, the following awards:
2017 Long-Term Incentive Award Grants
|
|
|
Grant Date Fair Value(s) |
|
|
| |||||
|
NEO |
|
Performance-Based |
|
Time-Based |
|
Grant Date Fair |
| |||
|
Amin J. Khoury |
|
$ |
1,787,767 |
|
$ |
1,787,767 |
|
$ |
3,575,534 |
|
|
Thomas P. McCaffrey |
|
$ |
1,142,375 |
|
$ |
1,142,436 |
|
$ |
2,284,811 |
|
|
Michael F. Senft |
|
$ |
411,260 |
|
$ |
411,322 |
|
$ |
822,582 |
|
|
John Cuomo |
|
$ |
328,501 |
|
$ |
328,501 |
|
$ |
657,002 |
|
|
Roger Franks |
|
$ |
304,415 |
|
$ |
304,477 |
|
$ |
608,892 |
|
(1) Dependent on the achievement of financial metrics relative to our peer group over a three-year performance period.
(2) Full grant date fair value of performance-based and time-based restricted stock as recognized under U.S. generally accepted accounting principles. The fair value was calculated using the closing price of our common stock on the grant date.
NEO long-term incentive awards reflect a performance-based vesting condition on 50% of the award amount. We structured our compensation program to allow multiple points of feedback to our managers and employees throughout the year. We conduct performance reviews throughout the organization in the second half of each year, award LTIs after the end of our third quarter, and generally award STIs after we report our full year results and adjust base salaries generally in the middle of the fiscal year. We have found this to be a well-rounded process that allows for mentoring, goal setting and on-going performance recognition throughout the year.
For 2017, long-term incentives were granted as follows:
|
Weighting |
|
Equity Vehicles |
|
Metrics |
|
50% |
|
Performance-Based Restricted Stock: Earned and vests based on the achievement of financial metrics relative to our peer group over a three-year performance period. |
|
EBIT Margin
Free Cash Flow Growth Rate |
|
50% |
|
Time-Based Restricted Stock: Vests in equal one-third increments, annually, until becoming fully vested on the third anniversary of the grant date. |
|
N/A |
A Closer Look at Performance-Based Restricted Stock Awarded in 2017. This portion of a NEO’s long-term incentive award is directly linked to a three-year performance period that consists of three annual performance cycles. The performance result used to determine the actual award earned will be calculated at the end of the three-year performance period by averaging the results of the three annual performance cycles:
|
|
|
Three-Year Performance Period |
|
|
| ||||
|
Award Granted: December 2017 |
|
Annual Performance Cycle 2/1/2018 - 1/31/2019 |
|
Annual Performance Cycle 2/1/2019 - 1/31/2020 |
|
Annual Performance Cycle 2/1/2020 - 1/31/2021 |
|
Performance Result/Actual Award Determined: Q1 2021 |
|
Comparing the average results on the two key metrics (EBIT margin and free cash flow growth rate) relative to the performance of our peer group over a three-year performance period as follows:
Performance & Payout Ranges
|
Percentile Ranking |
|
Range of Payout* |
|
Below 25% Percentile |
|
0% payout |
|
From 25th to 50th Percentile |
|
50% to 100% payout |
|
From 50th to 75th Percentile |
|
100% to 200% payout |
|
Above 75th Percentile |
|
200% payout (capped) |
*Performance between 25th and 75th percentiles is interpolated.
Legacy Long-Term Incentives. The unvested performance portion of restricted stock awards for shares at the date of the spin-off from B/E Aerospace Inc. (B/E) that were based on the performance for the three-year period ended December 31, 2014 were fully realized. The financial metric utilized under those awards at the date of grant were based on achieving an annual ROE target as determined at the beginning of each year. Pursuant to the terms of these legacy awards, in 2016, vesting was based on the planned achievement of the average return on equity target for the three-year period ended 2015. Two years were based on B/E performance and one year was based on ASG performance. In 2017, vesting was based on one year of B/E performance and two years of ASG performance.
Retirement Benefits. All of our NEOs participated in our qualified 401(k) defined contribution plan in 2017. Under this plan, we match 100% of the first 3% and 50% of the next 2% of employee contributions up to $10,400. In addition, we make tax-deferred contributions on behalf of each of Messrs. McCaffrey and Senft to our 2014 Deferred Compensation Plan (“SERP”) with an aggregate annual value of one times each of their base salaries, and on behalf of Mr. Khoury with an aggregate value of 30% of his base salary.
During 2017, we amended our employment agreement with our CEO, Mr. Khoury, effective May 25, 2017, to make certain minor conforming changes, provide for the use of an automobile (previously provided under his employment agreement with B/E Aerospace), and clarify the manner in which any unpaid executive compensation would be determined for an interim separation period. We also have a consulting agreement with Mr. Khoury pursuant to which he will provide, upon his retirement, consulting services to the Company for five years for $300,000 per year.
Deferred Compensation Plan. The Company adopted its 2014 Deferred Compensation Plan in 2014. The 2014 Deferred Compensation Plan is a nonqualified deferred compensation plan pursuant to which certain senior executives of the Company (as selected by the Committee) are eligible to defer salary and bonus. Each of our NEOs was eligible to participate in the plan. We may make a matching contribution equal to 100% of the participant’s deferrals under the 2014 Deferred Compensation Plan up to a maximum of 7.5% of the participant’s total base salary and annual incentive award. Matching contributions vest in equal installments on January 15th of each of the three years succeeding the year in which the contribution is made. In addition, an executive will fully vest in all matching contributions upon (i) meeting the requirements of a retirement, (ii) a termination of employment by the Company without cause, (iii) death, (iv) a change in control of the Company or (v) meeting the requirements of a disability. We made matching contributions to the 2014 Deferred Compensation Plan for NEOs (other than Messrs. Khoury, McCaffrey and Senft) in March 2018 totaling $145,256. Messrs. Khoury, McCaffrey and Senft are not eligible for matching contributions due to the retirement benefits described above. Details regarding 2017 contributions are set forth under the caption “Fiscal 2017 Deferred Compensation” on page 32 of this Form 10-K/A. Our 2014 Deferred Compensation Plan also permits the deferral of equity-based awards.
Other Compensation. In 2017, our NEOs were eligible to participate in all benefit programs that are generally available to all our employees. In addition, in order to provide a comparative compensation package, we generally reimburse each of our NEOs for medical care expenses that are not otherwise reimbursed by any plan or arrangement up to a maximum benefit of 10% of their base salary per year. We also reimburse each of our NEOs for reasonable costs of financial and estate planning.
Stock Ownership / Prohibited Transactions in Company Securities
Our Board has established stock ownership guidelines for our executive officers and non-employee directors. Under these guidelines, our NEOs and members of the Board are required to own shares of the Company’s common stock with a market value of at least a multiple of the base salary or annual cash retainer, as applicable, within a reasonable period from their election to the Board or appointment as an executive officer, as determined by the Board. The guidelines are five times base salary for the CEO and three times base salary for all other NEOs and three times the annual cash retainers for the members of our Board. Progress toward meeting the guidelines is reviewed by the Compensation Committee annually.
The Committee considers all shares held by a director or an executive officer toward the meeting of the ownership requirements, including shares owned outright (including family trusts and those held by a spouse), time-vested restricted shares, stock units held in any deferred compensation plan and shares in our employee stock purchase plan. Unexercised stock options and unearned performance shares are not included toward meeting the ownership guidelines.
Our Board also established a policy that prohibits our directors and executive officers from engaging in short sales of Company securities. Our officers and directors are also prohibited from selling or purchasing puts or calls, trading in or writing options, or engaging in other hedging activities with respect to Company securities. Directors and executive officers are also prohibited from holding Company securities in a margin account or pledging Company securities as collateral for a loan, unless our General Counsel, Vice President - Law and Human Resources provides pre-clearance after the director or executive officer clearly demonstrates the financial capability to repay the loan without resort to the pledged securities.
Compensation Risks
Management and the Committee assessed the Company’s compensation policies and practices and determined that its policies and practices do not create risks that are reasonably likely to have a material adverse effect on the Company. In reaching this conclusion we primarily considered the following factors:
· Executive officers receive a mix of base salary, cash-incentive awards and long-term equity-based awards as compensation, and the cash incentives plus performance-based incentives paid to our executive officers in 2017 ranged from approximately 54% - 58% of TDC while base salary and time-based vesting long-term equity-based awards accounted for approximately 42% - 46% of TDC. We do not believe the amount of cash-incentives paid to our executive officers would incentivize management to take excessive risks for short-term gains.
· Equity-based awards are designed to align the long-term interests of executive officers and stockholders. The performance portion of our long-term equity-based awards vests based on an average achievement of financial metrics as compared with our peers over a three-year period and the time-based portion of the long-term equity-based awards vests over a three-year period. Due to these vesting periods, we do not believe that our equity-based awards incentivize executive officers to take excessive risks for short-term gains.
· To align the long-term interest of our executives and our stockholders, we adopted an anti-hedging policy, which provides that no insider, including NEOs and members of our Board, may engage in short sales of KLX Inc. securities. Also, selling or purchasing puts or calls or otherwise trading in or writing options on KLX Inc. securities by officers and directors is prohibited.
· We have also implemented a comprehensive Clawback policy, as further described below, to ensure that performance-based compensation is not paid based on improper or inaccurate financial results.
· The Committee reviews and approves the targeted annual compensation opportunity and type of compensation available for each executive officer, utilizing its independent compensation consultant as necessary.
· As part of this review, the Committee will compare the targeted and actual total compensation of
each executive officer with their counterparts within the Company’s peer group.
· On an annual basis, our executive officers provide a certification that they have complied with our Code of Business Conduct. In addition, the Company regularly reviews its Code of Business Conduct and our other corporate policies with all employees.
· We do not have employees who are compensated based on taking significant risks with the Company’s capital.
Compensation Recoupment Policy (“Clawback”)
In the event of a material restatement of the Company’s financial results, the Board will review the facts and circumstances that led to the requirement for the restatement and may take such actions, if any, as it deems necessary or appropriate in its discretion. The Board will consider whether any executive officer received cash incentive compensation based on the original financial statements because it appeared he or she had achieved financial performance targets which in fact were not achieved based on the restatement. The Board also will consider the accountability of any executive officer whose acts or omissions were responsible in whole or in part for the events that led to the restatement and whether such acts or omissions constituted misconduct.
The actions, if any, that the Board may in its discretion elect to take against a particular executive officer, depending on all the facts and circumstances as determined during their review, could include (i) the recoupment of all or part of any bonus or other cash incentive compensation paid to the executive officer that was based upon the achievement of financial results that were subsequently restated and/or (ii) the pursuit of other available remedies.
Tax and Accounting Considerations
Section 162(m) of the Internal Revenue Code (“Section 162(m)”) generally limits to $1 million the U.S. federal tax deductibility of compensation paid in one year to certain executive officers. Prior to 2018, a company could deduct compensation above that limit if it paid the compensation in a manner that satisfied the requirements for the “qualified performance-based compensation” exception under Section 162(m). However, beginning in 2018 and subject to very limited exceptions going forward, recent changes in federal tax law have repealed the “qualified performance-based compensation” exception under Section 162(m), thus limiting the Company’s ability to deduct significant portions of the compensation paid to certain of our NEOs. To the extent it determines to be reasonably practicable and consistent with the Company’s other compensation objectives, the Company will provide our NEOs with compensation programs that will preserve tax deductibility. However, the Committee evaluates other considerations, such as hiring qualified executive officers, providing our executive officers with competitive and adequate incentives to remain with and increase our business operations, Company financial performance and prospects, as well as rewarding extraordinary contributions, that also significantly factor into the Committee’s compensation decisions, and the Committee expressly reserves the right to pay compensation that may not qualify for deductibility under Section 162(m).
To the extent that any compensation paid to our NEOs constitutes a deferral of compensation within the meaning of Section 409A of the Internal Revenue Code, the Committee intends to cause the award to comply with the requirements of Section 409A of the Internal Revenue Code and to avoid the imposition of penalty taxes and interest upon the participant receiving the award.
The Committee also takes accounting considerations, including the impact of FASB ASC 718, Compensation — Stock Compensation, into account in structuring compensation programs and determining the form and amount of compensation awarded.
Employment, Severance and Change of Control Agreements
Pursuant to their employment agreements, we provide each of our NEOs with severance benefits if their employment is terminated for any reason other than cause or, due to their resignation for good reason (as each term is defined in the applicable employment agreement). In certain cases, the employment agreements require that we pay the NEO’s base salary for the balance of the then-existing term of the applicable employment
agreement and in other cases provide a severance payment which is generally a multiple of the NEO’s base salary. In addition, the employment agreements describe the treatment of unvested equity upon termination of employment.
The Board recognizes the disparity in remuneration to a NEO in the event of termination of employment as a result of retirement versus remuneration for reasons other than a termination of employment for “cause.” The Board believes that depending on a NEO’s contributions to such NEO’s effective succession plan, including assistance with the identification of a successor and facilitating an effective succession, and other considerations such as the role and tenure of the NEO, his or her contributions to the growth of the Company and the creation of stockholder value during the NEO’s career with the Company, or to facilitate, in certain circumstances, the retirement of a NEO, the Board would favorably consider treating a NEO in the same manner in which the NEO would be compensated in the event of an involuntary termination or a change of control, provided that any such decision would be made at the discretion of the Board at the time of such retirement on a case by case basis.
In the event of a change of control, the employment of our NEOs will be automatically terminated. Payments upon a termination are described below, beginning on page 33 and, depending on the NEO, can include payment of base salary, incentive bonus and automobile allowance for the balance of the then-existing term of the NEO’s employment agreement and a severance payment that is generally a multiple of the NEO’s base salary and incentive bonuses. None of our NEOs’ employment agreements provides for gross-ups in connection with any potential excise taxes imposed under Section 4999 of the Internal Revenue Code. The Committee has not approved tax gross-ups for any executives.
Fiscal 2018 Compensation Decisions In Connection With Pending Boeing Merger
In prior disclosures, the Company has disclosed to stockholders that (i) the Board has been mindful of ensuring that the interests of stockholders and the senior executives of the Company are aligned in the event of a transaction which would constitute a change of control of the Company and (ii) the Committee and the Board had concluded that they would favorably consider a discretionary transaction bonus at that time for senior executives, including our NEOs, which transaction bonus would be in addition to amounts payable under each employment agreement, including those described below.
Consistent with the foregoing historical disclosures, in connection with the pending merger between the Company and The Boeing Company (which we refer to herein as the “Merger”), the Company entered into Transaction Bonus and Noncompetition Agreements with each of Messrs. Khoury, McCaffrey, Senft and Franks, which generally provide for the following, upon, and subject to, the completion of the Merger:
· Lump-sum cash transaction bonuses in an amount equal to $20,720,000, $9,620,000, $3,330,000 and $3,330,000 for each of Messrs. Khoury, McCaffrey, Senft and Franks, respectively;
· Customary and market outplacement services following termination of employment until the earlier of the expiration of a period of twelve (12) months termination and the date upon which the applicable executive obtains substantially comparable employment; and
· A non-competition restriction applicable for a period of three (3) years following termination of employment generally restricting each executive’s engagement in any employment, consulting or other activity in any business directly competitive with the Company’s operations and services as of the date of the completion of the Merger, without the Company’s written consent, which consent will not be unreasonably withheld, except that the executives are permitted to serve as a director of any corporation or a partner or investor in any private equity firm.
In addition, at the request of Boeing, Mr. Khoury’s employment agreement was amended to address certain matters relating to Mr. Khoury’s contemplated employment by KLX Energy, and to eliminate the Company’s and Mr. Khoury’s obligations pursuant to the consulting arrangement contemplated by the employment agreement, which otherwise would have taken effect on upon the consummation of the Merger. In exchange for the elimination of the contemplated consulting arrangement and the cancellation of the valuable benefits to which Mr. Khoury otherwise would have been entitled thereunder, Mr. Khoury will be entitled to receive an additional lump-sum cash payment equal to $7,500,000 upon, and subject to, the completion of the
Merger.
For more detailed information regarding the pending Merger, please see the Company’s Current Report on Form 8-K filed with the Securities and Exchange Commission on May 1, 2018, which is hereby incorporated by reference.
Report of the Compensation Committee on Executive Compensation
The Compensation Committee has reviewed and discussed the Compensation Discussion and Analysis for the year ended January 31, 2018 with management. Based on the review and discussion, the Compensation Committee has recommended to the Board that the Compensation Discussion and Analysis be included in this Form 10-K/A.
|
|
Respectfully submitted, |
|
|
|
|
|
|
|
|
Compensation Committee |
|
|
|
|
|
John T. Collins |
The following table sets forth information concerning the total compensation paid to each of our NEOs in Fiscal 2017 (the year ended January 31, 2018), Fiscal 2016 (the year ended January 31, 2017) and Fiscal 2015 (the year ended January 31, 2016).
|
Name and Principal |
|
Year |
|
Salary |
|
Stock |
|
Option |
|
Non-Equity |
|
All Other |
|
Total |
| ||||||
|
Amin J. Khoury |
|
2017 |
|
$ |
1,075,129 |
|
$ |
3,575,534 |
|
$ |
— |
|
$ |
2,238,834 |
|
$ |
392,884 |
(3) |
$ |
7,282,381 |
|
|
Chairman of the Board of Directors and Chief Executive Officer |
|
2016 |
|
872,940 |
|
3,526,627 |
|
— |
|
2,163,124 |
|
1,030,000 |
(3) |
7,592,691 |
| ||||||
|
|
2015 |
|
1,017,608 |
|
3,347,511 |
|
— |
|
1,802,500 |
|
1,015,000 |
(3) |
7,182,619 |
| |||||||
|
|
|
|
|
|
|
|
|
|
|
|
|
|
|
|
| ||||||
|
Thomas P. McCaffrey |
|
2017 |
|
$ |
687,007 |
|
$ |
2,284,811 |
|
$ |
— |
|
$ |
1,235,531 |
|
$ |
719,523 |
(4) |
$ |
4,926,872 |
|
|
President and Chief Operating Officer |
|
2016 |
|
557,808 |
|
2,253,554 |
|
— |
|
1,193,749 |
|
699,982 |
(4) |
4,705,093 |
| ||||||
|
|
|
2015 |
|
650,060 |
|
2,139,100 |
|
— |
|
987,255 |
|
686,669 |
(4) |
4,463,084 |
| ||||||
|
|
|
|
|
|
|
|
|
|
|
|
|
|
|
|
| ||||||
|
Michael F. Senft |
|
2017 |
|
$ |
462,072 |
|
$ |
822,582 |
|
$ |
— |
|
$ |
608,675 |
|
$ |
590,451 |
(5) |
$ |
2,483,780 |
|
|
Vice President, Chief Financial Officer |
|
2016 |
|
447,063 |
|
794,747 |
|
— |
|
588,092 |
|
626,015 |
(5) |
2,455,917 |
| ||||||
|
|
|
2015 |
|
418,662 |
|
770,002 |
|
— |
|
330,000 |
|
1,115,083 |
(5) |
2,633,747 |
| ||||||
|
|
|
|
|
|
|
|
|
|
|
|
|
|
|
|
| ||||||
|
John A. Cuomo |
|
2017 |
|
$ |
430,567 |
|
$ |
657,002 |
|
$ |
— |
|
$ |
567,174 |
|
$ |
112,920 |
(6) |
$ |
1,767,663 |
|
|
Vice President and General Manager, Aerospace Solutions Group |
|
2016 |
|
416,580 |
|
634,774 |
|
— |
|
547,994 |
|
113,653 |
(6) |
1,713,001 |
| ||||||
|
|
2015 |
|
369,692 |
|
615,003 |
|
— |
|
307,500 |
|
101,878 |
(6) |
1,394,073 |
| |||||||
|
|
|
|
|
|
|
|
|
|
|
|
|
|
|
|
| ||||||
|
Roger M. Franks |
|
2017 |
|
$ |
399,064 |
|
$ |
608,892 |
|
$ |
— |
|
$ |
525,675 |
|
$ |
153,714 |
(7) |
$ |
1,687,345 |
|
|
General Counsel, Vice President — Law and Human Resources, Secretary |
|
2016 |
|
386,100 |
|
588,331 |
|
— |
|
507,899 |
|
156,024 |
(7) |
1,638,354 |
| ||||||
|
|
2015 |
|
355,450 |
|
570,061 |
|
— |
|
285,000 |
|
111,307 |
(7) |
1,321,818 |
| |||||||
(1) The amounts reported in the “Stock Award” column represent the aggregate full grant date fair value of the restricted stock awards calculated in accordance with FASB ASC 718 (without any reduction for risk of forfeiture). For more information about our adoption of FASB ASC 718 and how we value stock-based awards (including assumptions made in such valuation), refer to Note 11 to our audited financial statements for the fiscal year ended January 31, 2018 included in our Annual Report on Form 10-K filed with the SEC on March 19, 2018. For the performance-based restricted stock awards, the grant date value is based upon the probable outcome of the performance metrics. If the highest level of payout were achieved, the value of the December 2017, 2016 and 2015 awards as of the grant date for performance based restricted stock are capped at 200% of the performance award target. All other performance based awards granted in 2015 are capped at 100% of the performance award target. Whether, and to what extent, a NEO realizes value with respect to restricted stock awards will depend on our actual operating performance, stock price fluctuations and the NEO’s continued employment.
(2) All annual cash bonuses paid to our NEOs are reflected in the “Non-Equity Incentive Plan Compensation” column of this table. The amounts shown represent the annual cash incentive payments received by our NEOs. These cash awards were earned in 2017, 2016 and 2015 and were paid on December 29, 2017, March 24, 2017 and March 15, 2016, respectively. The annual cash incentives are described in detail above in our “Compensation Discussion and Analysis.”
(3) With respect to Mr. Khoury, the amount reported for 2017, 2016 and 2015 as “All Other Compensation” include $324,468, $1,030,000 and $1,015,000, respectively, for SERP contributions; and additional amounts in 2017 for estate planning.
(4) With respect to Mr. McCaffrey, the amounts reported for 2017, 2016 and 2015 as “All Other Compensation” include $691,118, $658,170 and $648,585, respectively, for SERP contributions; $11,882, $10,195 and $8,745, respectively, for 401(K) Plan contributions; and additional amounts relating to automobile allowance and estate planning.
(5) With respect to Mr. Senft, the amount reported for 2017, 2016 and 2015 as “All Other Compensation” includes $462,072, $447,063 and $430,000, respectively, for SERP contributions; $32,470, $26,610 and $40,000, respectively, for payments under our executive
medical plan; and additional amounts for automobile allowance and financial planning. The amount reported for 2016 and 2015 includes $68,467 and $567,883, respectively, for moving and relocation expenses.
(6) With respect to Mr. Cuomo, the amounts reported for 2017, 2016 and 2015 as “All Other Compensation” includes $75,386, $72,267 and $52,517, respectively, for SERP contributions; $11,860, $16,915 and $26,592, respectively, for payments under our executive medical plan; and $11,474, $11,271 and $9,569, respectively, for 401(k) Plan contributions; and additional amounts for automobile allowance and financial planning.
(7) With respect to Mr. Franks, the amounts reported for 2017, 2016 and 2015 as “All Other Compensation” include $69,870, $65,000 and $48,741, respectively, for SERP contributions; $39,220, $47,517 and $25,924, respectively, for payments under our executive medical plan; $11,424, $11,807 and $6,442, respectively, for 401(k) Plan contributions; and additional amounts for automobile allowance and financial planning.
Grants of Plan Based Awards During 2017
The following table sets forth information concerning incentive awards made to our NEOs in 2017. Awards consisted of restricted stock, restricted stock units, stock options and annual incentive awards under our annual incentive plan as described in detail in our “Compensation Discussion and Analysis.”
|
|
|
|
|
Estimated Future Payouts |
|
Estimated Future Payouts Under |
|
|
|
|
|
|
|
|
| ||||||||
|
Name |
|
Grant |
|
Threshold(2) |
|
Target |
|
Max |
|
Threshold |
|
Target |
|
Max |
|
All |
|
Grant |
|
All |
|
Option |
|
|
Amin J. Khoury |
|
12/15/17 |
|
— |
|
— |
|
— |
|
893,884 |
|
1,787,767 |
|
3,575,534 |
|
28,947 |
|
1,787,767 |
|
— |
|
— |
|
|
|
|
|
|
|
|
|
|
|
|
|
|
|
|
|
|
|
|
|
|
|
|
|
|
|
Thomas P. McCaffrey |
|
12/15/17 |
|
— |
|
— |
|
— |
|
571,188 |
|
1,142,375 |
|
2,284,750 |
|
18,498 |
|
1,142,436 |
|
— |
|
— |
|
|
|
|
|
|
|
|
|
|
|
|
|
|
|
|
|
|
|
|
|
|
|
|
|
|
|
Michael J. Senft |
|
12/15/17 |
|
— |
|
— |
|
— |
|
205,630 |
|
411,260 |
|
822,520 |
|
6,660 |
|
411,322 |
|
— |
|
— |
|
|
|
|
|
|
|
|
|
|
|
|
|
|
|
|
|
|
|
|
|
|
|
|
|
|
|
John A. Cuomo |
|
12/15/17 |
|
— |
|
— |
|
— |
|
164,251 |
|
328,501 |
|
657,002 |
|
5,319 |
|
328,501 |
|
— |
|
— |
|
|
|
|
|
|
|
|
|
|
|
|
|
|
|
|
|
|
|
|
|
|
|
|
|
|
|
Roger M. Franks |
|
12/15/17 |
|
— |
|
— |
|
— |
|
152,208 |
|
304,415 |
|
608,830 |
|
4,930 |
|
304,477 |
|
— |
|
— |
|
(1) The amounts shown represent the range of annual cash incentive opportunities for each NEO under our 2017 annual incentive plan.
(2) Since the amount of Non-Equity Incentive Plan awards is determined on the basis of a NEO’s contributions to the success of a segment or the Company, as applicable, no specific threshold can be determined.
(3) The amounts shown represent restricted stock units that are subject to performance criteria and have not yet been earned. The number of shares of restricted stock granted is generally equal to the dollar value approved by the Committee divided by the closing price of our common stock on the date of grant, rounded to the nearest whole number of units. Performance from the 25th percentile to the 50th percentile will result in 50% - 100% of the target number of shares being earned. Performance from the 50th to the 75th percentiles will result in 100% - 200% of the target number of shares being earned, and performance above the 75th percentile will result in 200% of the target number of shares being earned. Shares earned will be linearly interpolated for performance between 25th and the 75th percentiles.
(4) These awards are subject to time-based vesting only. The number of shares of restricted stock or restricted stock units granted is equal to the dollar value approved by the Committee divided by the closing price of our common stock on the date of grant.
(5) The amounts shown represent the aggregate grant date fair value of the long-term incentive awards calculated in accordance with FASB ASC 718 (without any reduction for risk of forfeiture). For more information about our adoption of FASB ASC 718 and how we value stock based awards (including assumptions made in such valuation), refer to Note 11 to our audited financial statements for the fiscal year ended January 31, 2018 included in our Annual Report on Form 10 K filed with the SEC on March 19, 2018.
2017 Outstanding Equity Awards at Fiscal Year-End
The following table provides information concerning outstanding equity awards held by each NEO as of January 31, 2018, which includes unvested shares of restricted stock and restricted stock units.
|
|
|
|
|
Time-Based Shares or |
|
Time-Based Market Value |
|
Performance-Based |
|
Performance-Based |
| ||
|
Name |
|
Grant Date |
|
(#) |
|
($) |
|
(#) |
|
($) |
| ||
|
Amin J. Khoury |
|
12/15/17 |
|
28,947 |
|
$ |
2,045,395 |
|
28,947 |
|
$ |
2,045,395 |
|
|
|
12/15/16 |
|
24,002 |
|
1,695,981 |
|
36,002 |
|
2,543,901 |
| |||
|
|
03/18/16 |
|
3,664 |
|
258,898 |
|
— |
|
— |
| |||
|
|
12/02/15 |
|
16,871 |
|
1,192,105 |
|
50,612 |
|
3,576,244 |
| |||
|
|
01/15/15 |
|
— |
|
— |
|
47,978 |
|
3,390,125 |
| |||
|
|
|
|
|
|
|
|
|
|
|
| |||
|
Thomas P. McCaffrey |
|
12/15/17 |
|
18,498 |
|
1,307,069 |
|
18,497 |
|
1,306,998 |
| ||
|
|
12/15/16 |
|
15,336 |
|
1,083,642 |
|
23,006 |
|
1,625,604 |
| |||
|
|
03/18/16 |
|
2,341 |
|
165,415 |
|
— |
|
|
| |||
|
|
12/02/15 |
|
10,780 |
|
761,715 |
|
32,342 |
|
2,285,286 |
| |||
|
|
01/15/15 |
|
— |
|
— |
|
23,988 |
|
1,694,992 |
| |||
|
|
12/15/14 |
|
5,877 |
|
415,269 |
|
— |
|
— |
| |||
|
|
11/15/14 |
|
— |
|
— |
|
7,245 |
|
511,932 |
| |||
|
|
02/12/14 |
|
3,835 |
|
270,981 |
|
— |
|
— |
| |||
|
|
|
|
|
|
|
|
|
|
|
| |||
|
Michael J. Senft |
|
12/15/17 |
|
6,660 |
|
470,596 |
|
6,659 |
|
470,525 |
| ||
|
|
12/15/16 |
|
5,698 |
|
402,621 |
|
8,547 |
|
603,931 |
| |||
|
|
12/02/15 |
|
3,880 |
|
274,161 |
|
11,642 |
|
822,624 |
| |||
|
|
01/15/15 |
|
— |
|
— |
|
2,399 |
|
169,513 |
| |||
|
|
|
|
|
|
|
|
|
|
|
| |||
|
John A. Cuomo |
|
12/15/17 |
|
5,319 |
|
375,841 |
|
5,319 |
|
375,841 |
| ||
|
|
12/15/16 |
|
4,551 |
|
321,574 |
|
6,827 |
|
482,396 |
| |||
|
|
12/02/15 |
|
3,099 |
|
218,975 |
|
9,298 |
|
656,997 |
| |||
|
|
01/15/15 |
|
160 |
|
11,306 |
|
— |
|
— |
| |||
|
|
11/15/14 |
|
— |
|
— |
|
2,779 |
|
196,364 |
| |||
|
|
02/12/14 |
|
564 |
|
39,852 |
|
— |
|
— |
| |||
|
|
|
|
|
|
|
|
|
|
|
| |||
|
Roger M. Franks |
|
12/15/17 |
|
4,930 |
|
348,354 |
|
4,929 |
|
348,283 |
| ||
|
|
12/15/16 |
|
4,218 |
|
298,044 |
|
6,327 |
|
447,066 |
| |||
|
|
12/02/15 |
|
2,872 |
|
202,936 |
|
8,618 |
|
608,948 |
| |||
|
|
01/15/15 |
|
1,119 |
|
79,069 |
|
1,597 |
|
112,844 |
| |||
|
|
02/12/14 |
|
648 |
|
45,788 |
|
— |
|
— |
| |||
(1) The time-based awards vest ratably on an annual basis over three years following the grant date provided the executive is employed or, as to Mr. Khoury, is providing consulting services to the Company on the applicable vesting date.
(2) The market value of unvested shares is based on KLX’s common stock closing share price on January 31, 2018 as quoted on the NASDAQ Global Select Market.
(3) The December 2017, 2016 and 2015 awards are subject to performance-based vesting based upon the following criteria: If the Company achieves performance below the 25th percentile relative to its Peer Group over the three-year performance period, none of these shares will be earned. Performance from the 25th percentile to the 50th percentile will result in 50% - 100% of the target number of shares being earned. Performance from the 50th to the 75th percentile will result in 100% - 200% of the target number of shares being earned, and performance above the 75th percentile will result in 200% of the target number of shares being earned. Shares earned will be linearly interpolated for performance between 25th and the 75th percentiles. The 2014 annual restricted stock award vests subject to achieving the annual return on equity targets established by the Committee, which were met, and vest four years from the date of grant. These awards will vest in November 2018.
Option Exercises and Stock Vested During 2017
The following table provides information concerning vesting of common stock awards held by each NEO during 2017.
|
|
|
Option Awards |
|
Stock Awards |
| ||||
|
|
|
Number of Shares |
|
Value Realized on |
|
Number of Shares |
|
Value Realized on |
|
|
Name |
|
(#) |
|
($) |
|
(#) |
|
($) |
|
|
Amin J. Khoury |
|
577,354 |
|
17,436,091 |
|
78,683 |
|
4,728,164 |
|
|
Thomas P. McCaffrey |
|
288,677 |
|
8,718,045 |
|
66,791 |
|
3,939,060 |
|
|
Michael J. Senft |
|
28,868 |
|
871,814 |
|
9,130 |
|
540,117 |
|
|
John A. Cuomo |
|
— |
|
— |
|
10,702 |
|
620,716 |
|
|
Roger M. Franks |
|
— |
|
— |
|
9,400 |
|
547,131 |
|
(1) Represents the number of securities for which the options were exercised during 2017.
(2) Represents the number of shares acquired on exercise multiplied by the difference between the market price at exercise, as reported on the NASDAQ Global Select Market and the exercise price of the options.
(3) Represents the shares of restricted stock that vested during 2017.
(4) Represents the number of shares of restricted stock that vested during 2017 multiplied by the closing price of our common stock, as reported on the NASDAQ Global Select Market on the applicable vesting date.
Fiscal 2017 Deferred Compensation
The Deferred Compensation Plan is a nonqualified deferred executive compensation plan pursuant to which certain senior executives of the Company (as selected by the Committee) are eligible to defer a portion of their base salary, cash bonus and equity-based awards.
A deferral election must be made prior to the beginning of the calendar year in which deferral occurs. Each of our NEOs is eligible to participate in the plan. We may make a matching contribution equal to 100% of the participant’s deferrals under the Deferred Compensation Plan up to a maximum of 7.5% of the participant’s total base salary and annual cash bonus, except for the benefit of Messrs. Khoury, McCaffrey and Senft, who are not eligible for matching contributions. Matching contributions vest in equal installments on January 15th of each of the three years succeeding the year in which the contribution is made. In addition, an executive will fully vest in all matching contributions upon: (i) meeting the requirements of a retirement, (ii) a termination of employment by the Company without cause, (iii) death, (iv) a change in control of the Company or (v) meeting the requirements of a disability.
The Deferred Compensation Plan is a non-qualified plan under the Internal Revenue Code and does not provide for guaranteed returns on plan contributions. A participant’s deferrals, together with Company matching contributions, are adjusted for earnings or losses measured by the rate of return on the notional investments available under the plan to which participants allocate their accounts.
Participants may change investment elections on any business day. Distributions are made after termination of employment or on a date, selected by the participant, prior to termination of employment.
During 2017, each of the NEOs elected to defer compensation under the plan and we made matching contributions for these NEOs (other than Messrs., Khoury, McCaffrey and Senft) in March 2018 totaling $145,256.
Nonqualified Deferred Compensation
|
|
|
Executive |
|
Registrant |
|
Aggregate |
|
Aggregate |
|
Aggregate |
|
|
Name |
|
($) |
|
($) |
|
($) |
|
($) |
|
($) |
|
|
Amin J. Khoury |
|
4,506,587 |
|
324,469 |
|
3,155,774 |
|
— |
|
15,403,028 |
|
|
Thomas P. McCaffrey |
|
2,475,164 |
|
691,118 |
|
2,437,372 |
|
— |
|
13,141,498 |
|
|
Michael J. Senft |
|
353,318 |
|
462,073 |
|
377,656 |
|
— |
|
2,383,739 |
|
|
John A. Cuomo |
|
187,775 |
|
72,267 |
|
445,245 |
|
— |
|
2,841,533 |
|
|
Roger M. Franks |
|
212,562 |
|
65,000 |
|
166,194 |
|
(74,435 |
) |
718,250 |
|
(1) All executive contributions are included as compensation in the Summary Compensation Table.
(2) Earnings on account balances are not included in the Summary Compensation Table.
(3) Includes current and prior year contributions and earnings.
In addition to the 2014 Deferred Compensation Plan, all of our NEOs participated in our qualified 401(k) defined contribution plan. Pursuant to this plan, we match 100% of the first 3% and 50% of the next 2% of employee contributions up to $10,400.
Employment Agreements
Amin J. Khoury. Mr. Khoury is party to an employment agreement with us entered into on September 15, 2014 (effective as of the spin-off date), amended and restated as of February 27, 2015, further amended and restated as of May 25, 2016, and further amended and restated as of May 25, 2017, pursuant to which he serves as our Chairman and Chief Executive Officer. The employment agreement has a three-year term with automatic extension by one year on each anniversary of the effective date of the agreement unless either party gives at least 30 days’ written notice.
The agreement provides that Mr. Khoury will receive a specified base salary, currently $1,100,164 per year, subject to increases as determined from time to time by our Board or the Committee. He is also eligible to receive an annual discretionary incentive bonus of not less than 175% of his base salary and an annual equity grant with a grant date value of no less than 325% of his base salary. In lieu of retirement benefits, we make tax deferred contributions on behalf of Mr. Khoury to our deferred compensation plan. Previously, we contributed an aggregate annual value equal to one times Mr. Khoury’s base salary. Effective February 1, 2017, Mr. Khoury voluntarily reduced the tax deferred contribution from us from one times his annual base salary to 30% of his annual base salary. Mr. Khoury is also eligible to participate in all benefit plans generally available to our executives and in all benefits pursuant to our travel policy.
General Provisions
In the event of a dispute between us and Mr. Khoury with respect to any breach of his employment agreement, the prevailing party will be entitled to recover from the non-prevailing party all reasonable costs incurred in connection with the dispute.
During the term of his employment agreement with us and for a period of two years thereafter, Mr. Khoury is subject to noncompetition and nonsolicitation obligations. In addition, Mr. Khoury is subject to a perpetual confidentiality covenant. Pursuant to his Transaction Bonus and Noncompetition Agreement, as described above, upon and subject to the completion of the Merger, Mr. Khoury will be subject to a three year post-employment noncompetition restriction.
Specific Termination and Change of Control Provisions
In addition to the benefits described above, Mr. Khoury will be entitled to receive the following benefits and payments upon the occurrence of the following specified events.
If we terminate Mr. Khoury’s employment for any reason, upon Mr. Khoury’s death or incapacity, upon a “Change of Control” or if Mr. Khoury resigns for “Good Reason” (as defined in the employment agreement), Mr. Khoury is entitled to (i) any accrued and unpaid salary and benefits through the termination date, (ii) any earned but unpaid bonuses payable to Mr. Khoury for any fiscal periods ending prior to the termination date and (iii) a lump-sum amount equal to the sum of (A) a prorated portion of 175% of Mr. Khoury’s then current salary, with the prorated amount to be determined based on the number of days that Mr. Khoury was employed by us in the year during which the termination date occurs, (B) Mr. Khoury’s salary for the remainder of the employment term, (C) the retirement contributions based on amounts in effect at January 31, 2017 that would have been made during the remainder of the employment term and (D) two times Mr. Khoury’s target bonus. In addition, any equity awards granted to Mr. Khoury that would not vest on or prior to the termination date will vest and be exercisable immediately, and, notwithstanding any termination of employment provisions set forth in the applicable agreement or related plan, all equity awards will continue to be exercisable until their original stated expiration date. In addition to the foregoing payments and benefits, Mr. Khoury would be entitled to a pro-rata portion of Mr. Khoury’s annual bonus for the fiscal year in which Mr. Khoury’s termination occurs in respect of the period of active service for such fiscal year, (i) based on actual results for such fiscal year, in the event that we terminate Mr. Khoury’s employment for any reason or if Mr. Khoury resigns for Good Reason, or (ii) based on the assumed performance achievement at the maximum performance pay out level applicable for such fiscal year under the annual bonus plan, in the event that Mr. Khoury’s employment terminates due to Mr. Khoury’s death or incapacity or a Change of Control. In addition to the foregoing payments and benefits, Mr. Khoury would be entitled to a pro-rata portion of Mr. Khoury’s annual bonus for the fiscal year in which Mr. Khoury’s termination occurs in respect of the period of active service for such fiscal year, (i) based on actual results for such fiscal year, in the event that we terminate Mr. Khoury’s employment for any reason or if Mr. Khoury resigns for Good Reason, or (ii) based on the assumed performance achievement at the maximum performance pay out level applicable for such fiscal year under the annual bonus plan, in the event that Mr. Khoury’s employment terminates due to Mr. Khoury’s death or incapacity or a Change of Control.
If Mr. Khoury’s employment terminates for any other reason, he will receive accrued and unpaid salary, benefits and bonuses through the termination date but will not be entitled to severance payments.
During 2016, the Committee determined the Company should provide Mr. Khoury’s estate with a $3.5 million death benefit (to be funded by a fully paid life insurance policy effective as of February 1, 2017) in recognition of his voluntary 70% reduction in annual SERP contributions.
Thomas P. McCaffrey. Mr. McCaffrey is party to an employment agreement with us entered into on September 15, 2014 (effective as of the spin-off date) and amended and restated as of February 27, 2015, pursuant to which he serves as our President and Chief Operating Officer, or COO. The employment agreement has a three-year term with automatic extension by one year on each anniversary of the effective date of the agreement unless either party gives at least 30 days’ written notice. Mr. McCaffrey’s employment agreement provides that Mr. McCaffrey will receive a specified base salary, currently $703,005 per year, which may be increased in the discretion of our Board or the Committee. Mr. McCaffrey will have an annual target bonus of no less than 150% of his base salary. He will also receive an annual equity grant with a grant date value of no less than 325% of his base salary. In lieu of retirement benefits, we make tax deferred contributions on behalf of Mr. McCaffrey to our deferred compensation plan with an aggregate annual value of one times Mr. McCaffrey’s base salary. While
employed by us, Mr. McCaffrey will be eligible to participate in all benefit plans generally available to our executives and to receive an automobile allowance of $1,100 per month.
General Provisions
In the event of a dispute between us and Mr. McCaffrey with respect to any breach by Mr. McCaffrey of his employment agreement, the prevailing party will be entitled to recover from the non-prevailing party all reasonable costs incurred in connection with the dispute.
Pursuant to his Transaction Bonus and Noncompetition Agreement, as described above, upon and subject to the completion of the Merger, Mr. McCaffrey will be subject to a three year post-employment noncompetition restriction.
Specific Termination and Change of Control Provisions
In addition to the benefits described above, Mr. McCaffrey will be entitled to receive the following benefits and payments upon the occurrence of the following specified events. Upon Mr. McCaffrey’s death, incapacity, termination by us without “Cause,” resignation for “Good Reason” or upon a “Change of Control” (as defined in the employment agreement), Mr. McCaffrey will be entitled to (i) a lump-sum amount equal to the sum of (A) a prorated portion of 150% of Mr. McCaffrey’s then current salary, with the prorated amount to be determined based on the number of days that Mr. McCaffrey was employed by us in the year during which the termination date occurs, (B) Mr. McCaffrey’ salary for the remainder of the employment term, (C) the retirement contributions that would have been made during the remainder of the employment term, and (D) two times Mr. McCaffrey’s target bonus and (ii) a lump-sum amount equal to (A) any accrued and unpaid salary, automobile allowance, vacation time and benefits through the termination date and (B) any earned but unpaid bonuses payable to Mr. McCaffrey for any fiscal periods ending prior to the termination date. In addition, any equity awards granted to Mr. McCaffrey that would not vest on or prior to the termination date will vest and be exercisable immediately, and, notwithstanding any termination of employment provisions set forth in the applicable agreement or related plan, such equity awards will continue to be exercisable until their original stated expiration date.
If Mr. McCaffrey’s employment terminates for any other reason, he will not be entitled to severance payments.
Michael F. Senft. Mr. Senft is party to an employment agreement with us dated September 30, 2014, (effective as of the spin-off date) and amended and restated as of February 27, 2015, pursuant to which he serves as Vice President, Chief Financial Officer, or CFO. The employment agreement has a three-year term with automatic extension by one year on each anniversary of the effective date of the agreement unless either party gives at least 30 days’ written notice.
Mr. Senft’s employment agreement provides that Mr. Senft will receive a specified base salary, currently $470,019 per year, which may be increased in the discretion of our Board or the Committee. Mr. Senft will have an annual target bonus of no less than 75% of his base salary. He will also receive an annual equity grant with a targeted grant date value of no less than 175% of his base salary. Beginning 90 days after the effective date of Mr. Senft’s employment agreement, we make tax deferred contributions on behalf of Mr. Senft to our deferred compensation plan with an aggregate annual value of one times Mr. Senft’s base salary. While employed by us, Mr. Senft will be eligible to participate in all benefit plans generally available to our executives and to receive an automobile allowance of $1,100 per month.
General Provisions
Mr. Senft is also party to a proprietary rights agreement with us, pursuant to which he is subject to a perpetual confidentiality covenant. He is also subject to a noncompetition covenant during the term of his employment agreement and a nonsolicitation covenant during the term of his employment agreement and for two years thereafter.
In the event of a dispute between us and Mr. Senft with respect to any breach by Mr. Senft of his employment agreement, the prevailing party will be entitled to recover from the non-prevailing party all reasonable costs incurred in connection with the dispute.
Pursuant to his Transaction Bonus and Noncompetition Agreement, as described above, upon and subject to the completion of the Merger, Mr. Senft will be subject to a three year post-employment noncompetition restriction.
Specific Termination and Change of Control Provisions
In addition to the benefits described above, Mr. Senft will be entitled to receive the following benefits and payments upon the occurrence of the following specified events.
Upon Mr. Senft’s death, incapacity, termination by us without “Cause,” resignation for “Good Reason” or upon a “Change of Control” (as defined in the employment agreement), Mr. Senft will be entitled to (i) a lump-sum amount equal to the sum of (A) a prorated portion of 75% of Mr. Senft’s then current salary, with the prorated amount to be determined based on the number of days that Mr. Senft was employed by the Company in the year during which the termination date occurs, (B) Mr. Senft’s salary for the remainder of the employment term, (C) the retirement contributions that would have been made during the remainder of the employment term and (D) two times Mr. Senft’s target bonus and (ii) a lump-sum amount equal to (A) any accrued and unpaid salary, automobile allowance, vacation time and benefits through the termination date and (B) any earned but unpaid bonuses payable to Mr. Senft for any fiscal periods ending prior to the termination date. In addition, any equity awards granted to Mr. Senft that would not vest on or prior to the termination date will vest and be exercisable immediately, and, notwithstanding any termination of employment provisions set forth in the applicable agreement or related plan, such equity awards will continue to be exercisable until their original stated expiration date.
If Mr. Senft’s employment terminates for other reason, he will not be entitled to severance payments.
John A. Cuomo. Mr. Cuomo is party to an employment agreement with us dated February 26, 2015, and amended and restated as of December 22, 2015, and serves as our Vice President and General Manager, Aerospace Solutions Group. The employment agreement has a three-year term, with automatic annual renewals on each anniversary of the effective date unless the option not to renew is exercised by either party not less than 30 days prior to the anniversary date.
Mr. Cuomo’s employment agreement provides that he will receive a specified base salary, currently at $437,972, which may be increased at the discretion of our Board or Committee, an annual target bonus up to 75% of his salary, reimbursement of all reasonable business expenses, an automobile allowance of $1,100 per month and will be eligible to participate in all benefits plans made available to employees and executives generally and will be able to participate in our equity incentive plan.
Mr. Cuomo is also party to a proprietary rights agreement with us, pursuant to which he is subject to a perpetual confidentiality covenant. He is also subject to a noncompetition covenant and a nonsolicitation covenant during the term of his employment agreement and for two years thereafter.
Specific Termination and Change of Control Provisions
Upon Mr. Cuomo’s death, incapacity, termination without “Cause,” resignation for “Good Reason”, or a “Change of Control” (as defined in Mr. Cuomo’s employment agreement), Mr. Cuomo will be entitled to an amount equal to the sum of (i) a prorated portion of 75% of the Mr. Cuomo’s then current salary, with the prorated amount to be determined based on the number of days that Mr. Cuomo was employed by the Company in the year during which the termination date occurs, (ii) Mr. Cuomo’s salary for the remainder of the employment term, (iii) the maximum annual contribution under our deferred compensation plan of 7.5% of Mr. Cuomo’s total base salary and annual cash bonus (with such maximum amount to be determined in accordance with the terms of the applicable deferred compensation plan) that would have been made during the remainder of the employment period and (iv) two times Mr. Cuomo’s target bonus.
Roger M. Franks. Mr. Franks is party to an employment agreement, dated October 7, 2014, (effective as of the spin-off date), amended and restated as of February 27, 2015, and further amended and restated as of December 22, 2015, pursuant to which he serves as our General Counsel and Vice President—Law and Human Resources. The employment agreement has a three-year term with automatic extension by one year on each anniversary of the effective date of the agreement unless either party gives at least 30 days’ written notice.
Mr. Franks’s employment agreement provides that Mr. Franks will receive a specified base salary, currently $405,927 per year, which may be increased in the discretion of the Committee. Mr. Franks will have an annual target bonus of no less than 75% of his base salary. He will also receive an annual equity grant with a targeted grant date value of 150% of his base salary. While employed by us, Mr. Franks is eligible to participate in all benefit plans generally available to our executives and to receive an automobile allowance of $1,100 per month.
Mr. Franks is also party to a proprietary rights agreement with us, pursuant to which he is subject to a perpetual confidentiality covenant. He is also subject to a noncompetition covenant during the term of his employment agreement, and a nonsolicitation covenant during the term of his employment agreement and for two years thereafter.
Pursuant to his Transaction Bonus and Noncompetition Agreement, as described above, upon and subject to the completion of the Merger, Mr. Franks will be subject to a three year post-employment noncompetition restriction.
Specific Termination and Change of Control Provisions
In addition to the compensation and benefits described above, Mr. Franks will be entitled to receive the following benefits and payments upon the occurrence of the following specified events.
Upon Mr. Franks’s death, incapacity, termination by us without “Cause,” resignation for “Good Reason” or upon a “Change of Control” (as defined in the employment agreement), Mr. Franks will be entitled to a lump-sum amount equal to the sum of (i) a prorated portion of 75% of Mr. Franks’s then current salary, with the prorated amount to be determined based on the number of days that Mr. Franks was employed by us in the year during which the termination date occurs, (ii) Mr. Franks’s salary for the remainder of the employment term, (iii) the maximum annual contribution under our deferred compensation plan of 7.5% of Mr. Franks’s total base salary and annual cash bonus (with such maximum amount to be determined in accordance with the terms of the applicable deferred compensation plan) that would have been made during the remainder of the employment period and (iv) two times Mr. Franks’s target bonus.
If Mr. Franks’s employment terminates for any other reason, he will not be entitled to severance payments.
Potential Payments upon a Termination or Change of Control
The following tables summarize the potential compensation that would have been payable to each of our NEOs as a result of a termination of the NEO’s employment or a Change of Control. The tables generally assume that the NEOs employment terminated on January 31, 2018 and, if applicable, that the Change of Control occurred on January 31, 2018. In addition, for purposes of the calculations, we assume that the fair market value of our common stock was $70.66, which was the closing price of our common stock as quoted on the NASDAQ Global Select Market on January 31, 2018.
The tables below do not include the value of any vested and non-forfeitable payments or other benefits that the NEOs would have been entitled to receive on January 31, 2018, regardless of whether a termination event occurred on such date (e.g., benefits the executive would have received even if he voluntarily resigned on the assumed date of the change of control), including the following:
· Defined Contribution Plans. Each of the NEO’s account balances under the 401(k) plan, including any Company contributions, were fully vested as of January 31, 2018.
· Vested Equity Awards. Once vested, restricted stock awards are not forfeitable. The number and fair market value of all shares of restricted stock that were vested as of January 31, 2018 are set forth above in the Outstanding Equity Awards at Fiscal Year-End table.
· Life Insurance. Each of the NEOs is entitled to receive Company paid group term life insurance of one times his base salary. This plan is applicable to all of our employees on a nondiscriminatory basis.
· Deferred Compensation Plan. Employee deferrals are vested upon contribution, and unless otherwise specified by the Compensation Committee, Company contributions vest in equal installments on January 15th of each of the three years succeeding the year in which the Company contribution is made. In the case of death, disability, termination without cause and a change of control, Company contributions will fully vest.
The amounts shown in the tables below represent summary estimates of the payments to be made upon each specified termination event as if the event occurred on January 31, 2018, based upon each NEO’s employment agreement in effect as of January 31, 2018 (exclusive of actual accrued cash bonuses as of this date and giving effect to new target bonuses as of February 1, 2018), and do not reflect any actual payments to be received by the NEOs. In addition, the tables below do not reflect the amounts that may become payable to the executives in connection with the pending Merger pursuant to the above-referenced Transaction Bonus and Noncompetition Agreements, or, in the case of Mr. Khoury, the settlement payment in respect of the cancellation of his post-termination consulting arrangement to which was agreed in connection with the pending Merger:
Amin J. Khoury
|
Compensation Element |
|
Voluntary |
|
Termination by the |
|
Death, Incapacity, |
| |||
|
Accrued and Unpaid Salary and Other Benefits |
|
$ |
33,851 |
|
$ |
33,851 |
|
$ |
33,851 |
|
|
Earned but Unpaid Bonus |
|
2,238,834 |
|
2,238,834 |
|
2,238,834 |
| |||
|
Pro Rata Bonus (reflects bonus for full fiscal year) |
|
— |
|
1,925,287 |
|
3,850,574 |
| |||
|
Salary Component of Severance |
|
— |
|
4,468,358 |
|
4,468,358 |
| |||
|
SERP Through Employment Term |
|
— |
|
2,546,213 |
|
2,546,213 |
| |||
|
Two Times Target Bonus Pursuant to Employment Agreement |
|
— |
|
2,420,361 |
|
2,420,361 |
| |||
|
Total Cash Payments |
|
2,272,685 |
|
13,632,904 |
|
15,558,191 |
| |||
|
Acceleration of Unvested Equity Awards |
|
— |
|
24,913,585 |
|
24,913,585 |
| |||
|
TOTAL |
|
$ |
2,272,685 |
|
$ |
38,546,490 |
|
$ |
40,471,777 |
|
Thomas P. McCaffrey
|
Compensation Element |
|
Termination for |
|
Termination without |
|
Death, Incapacity, |
| |||
|
Accrued and Unpaid Salary and Other Benefits |
|
$ |
22,037 |
|
$ |
22,037 |
|
$ |
22,037 |
|
|
Earned but Unpaid Bonus |
|
— |
|
1,235,531 |
|
1,235,531 |
| |||
|
Salary Component of Severance |
|
— |
|
— |
|
2,511,891 |
| |||
|
SERP Through Employment Term |
|
— |
|
— |
|
1,458,186 |
| |||
|
Two Times Target Bonus Pursuant to Employment Agreement |
|
— |
|
— |
|
1,335,710 |
| |||
|
Total Cash Payments |
|
22,037 |
|
1,257,568 |
|
6,563,355 |
| |||
|
Acceleration of Unvested Equity Awards |
|
— |
|
— |
|
16,646,789 |
| |||
|
TOTAL |
|
$ |
22,037 |
|
$ |
1,257,568 |
|
$ |
23,210,144 |
|
Michael F. Senft
|
Compensation Element |
|
Termination for |
|
Termination without |
|
Death, Incapacity, |
| |||
|
Accrued and Unpaid Salary and Other Benefits |
|
$ |
30,515 |
|
$ |
30,515 |
|
$ |
30,515 |
|
|
Earned but Unpaid Bonus |
|
— |
|
608,675 |
|
608,675 |
| |||
|
Salary Component of Severance |
|
— |
|
— |
|
1,326,900 |
| |||
|
SERP Through Employment Term |
|
— |
|
— |
|
974,922 |
| |||
|
Two Times Target Bonus Pursuant to Employment Agreement |
|
— |
|
— |
|
658,027 |
| |||
|
Total Cash Payments |
|
30,515 |
|
639,190 |
|
3,599,038 |
| |||
|
Acceleration of Unvested Equity Awards |
|
— |
|
— |
|
5,111,050 |
| |||
|
TOTAL |
|
$ |
30,515 |
|
$ |
639,190 |
|
$ |
8,710,088 |
|
John A. Cuomo
|
Compensation Element |
|
Death |
|
Termination for Cause, |
|
Incapacity, |
| |||
|
Accrued and Unpaid Salary and Other Benefits |
|
$ |
39,866 |
|
$ |
39,460 |
|
$ |
51,757 |
|
|
Earned but Unpaid Bonus |
|
567,174 |
|
— |
|
567,174 |
| |||
|
Salary Component of Severance |
|
1,595,229 |
|
— |
|
1,595,229 |
| |||
|
SERP Contribution |
|
216,433 |
|
— |
|
216,433 |
| |||
|
Two Times Target Bonus Pursuant to Employment Agreement |
|
613,161 |
|
— |
|
613,161 |
| |||
|
Total Cash Payments |
|
3,031,862 |
|
39,460 |
|
3,043,754 |
| |||
|
Acceleration of Unvested Equity Awards |
|
4,194,378 |
|
— |
|
4,194,378 |
| |||
|
TOTAL |
|
$ |
7,226,240 |
|
$ |
39,460 |
|
$ |
7,238,131 |
|
Roger M. Franks
|
Compensation Element |
|
Death |
|
Termination for Cause, |
|
Incapacity, |
| |||
|
Accrued and Unpaid Salary and Other Benefits |
|
$ |
30,913 |
|
$ |
30,507 |
|
$ |
65,174 |
|
|
Earned but Unpaid Bonus |
|
525,675 |
|
— |
|
525,675 |
| |||
|
Salary Component of Severance |
|
1,478,511 |
|
— |
|
1,478,511 |
| |||
|
SERP Contribution |
|
200,597 |
|
— |
|
200,597 |
| |||
|
Two Times Target Bonus Pursuant to Employment Agreement |
|
568,298 |
|
— |
|
568,298 |
| |||
|
Total Cash Payments |
|
2,803,994 |
|
30,507 |
|
2,838,255 |
| |||
|
Acceleration of Unvested Equity Awards |
|
3,895,627 |
|
— |
|
3,895,627 |
| |||
|
TOTAL |
|
$ |
6,699,621 |
|
$ |
30,507 |
|
$ |
6,733,882 |
|
Background
As required by the Dodd-Frank Wall Street Reform and Consumer Protection Act, the SEC adopted a rule requiring companies to disclose the ratio of the median employee’s total annual compensation relative to total annual compensation of the CEO. The following section provides details on the methodology used to identify the median employee, as well as the 2017 results of this analysis, which were both determined in accordance with the SEC disclosure rules.
Measurement Date
We identified the median employee using our employee population as of November 12, 2017. As of that date, we had approximately 2,900 employees (excluding employees of de minimis and acquired entities as explained below).
Measurement Process
We identified the median employee by determining, based on an examination of our internal records, the actual Total Cash Compensation of each of our employees as of the measurement date for the +9 months period ending November 12, 2017, which, for permanent employees, we then annualized. We believe this methodology reasonably reflects the annual compensation of our employees. Total Cash Compensation includes base pay and annual bonus or sales incentives. Once the median employee was identified, we calculated the median employee’s annual total compensation in the same manner as we calculate the amount set forth in the “Total” column in the Summary Compensation Table (i.e., including items such as the value of retirement and benefit plans). We converted the amount of compensation paid to non-U.S. employees to U.S. dollars as of October 31, 2017, based on the month end spot rate. As permitted by SEC regulations, we excluded from the determination of our median employee approximately 100 employees from 5 countries (Italy, 27 employees; Poland, 27 employees; China, 21 employees; Australia, 14 employees; and Canada, 13 employees) under the SEC’s de minimis exception. As also permitted by SEC regulations we excluded from the determination of our median employee approximately 145 employees of two product lines we acquired in January 2018.
Pay Ratio
The pay ratio was calculated in a manner consistent with Item 402(u) of the Dodd-Frank Wall Street Reform and Consumer Protection Act, and we believe it constitutes a reasonable estimate. However, as contemplated by Item 402(u), we relied on methods and assumptions that we determined to be appropriate for calculating our pay ratio. Other public companies will use methods and assumptions that differ from the ones we chose but are appropriate for their circumstances. It may therefore be difficult, for this and other reasons, to compare our reported pay ratio to pay ratios reported by other companies.
Our median employee total annual compensation was $67,404. Our CEO’s total annual compensation was $7,282,381. Therefore, our CEO to median employee pay ratio is 108 to 1.
Compensation of Directors
Directors who are employees of the Company receive no additional compensation for serving on the Board. In August 2017, we adjusted our director compensation program consistent with a benchmarking study prepared by Pearl Meyer, which reduced the directors’ overall cash compensation and increased their overall equity compensation. The revised program was effective February 1, 2018 and under this program our non-employee directors now receive an annual cash retainer of $75,000 (previously $80,000). In addition, the chairs of our Audit Committee and Compensation Committee receive additional annual cash retainers of $40,000 (previously $15,000) and each member of these Committees (including the chairs) receive annual retainers of $15,000 (previously $20,000). The chair of the Nominating and Corporate Governance Committee receives an annual cash retainer of $18,813 (previously $7,500), and each member of the Nominating and Corporate Governance Committee (including the chair) receives an annual cash retainer of $5,000 (previously $10,000). All
cash payments are made quarterly in arrears. We do not pay any additional fees for attendance at Board or Committee meetings.
Non-employee directors are also entitled to receive an annual grant of restricted stock with a fair market value of $89,500, previously $57,000 (determined as of the date of grant) pursuant to our Long-Term Incentive Plan (“LTIP”). The LTIP awards will vest on each of the first, second, third and fourth anniversaries of the date of grant, provided the director remains in continuous service through the applicable vesting period.
Non-employee directors also receive an annual grant of common stock with a fair market value of $33,000 (determined as of the date of grant) made on a quarterly basis pursuant to our Non-Employee Directors Stock and Deferred Compensation Plan (the “NEDSDCP”). This grant is recorded as deferred stock units under the NEDSDCP, is fully vested upon grant and the shares are released at the termination of the director’s service.
Our directors may defer their annual cash retainers into the NEDSDCP, and any such deferred compensation will be held in a stock unit account or cash account (as elected by the director) under the plan until the termination of the director’s service and then is distributed in a lump sum or in up to ten annual installments, as elected by the director. The directors are fully vested in the deferred stock units and deferred cash account at all times but have no rights as stockholders in the deferred stock units until distribution. In the event of a Change of Control (as defined in the plan), the accounts under the plan will immediately be distributed to the directors.
We reimburse our non-employee directors for reasonable business and travel expenses incurred in connection with their service on the Board. In addition, non-employee directors are eligible to participate in our health and business travel accident insurance program on the same terms and conditions as employees generally. We do not provide our directors with any other perquisites or special benefits for their service on our Board.
Director compensation is approved by the Compensation Committee and ratified by the entire Board. Our Board established stock ownership guidelines for our NEOs and non-employee directors. Under these guidelines, directors are required to, after a reasonable period of time, own shares of the Company’s common stock with a market value of at least three times their annual cash retainers.
The Board considers all shares held by a director toward meeting the ownership guidelines, including shares owned outright (including family trusts and those held by a spouse), restricted shares subject to time-based vesting, and shares or share equivalents held in any deferred compensation plan. Progress toward meeting the guidelines is reviewed by the Compensation Committee annually.
Our Board established a policy that prohibits our directors and executive officers from engaging in short sales of KLX securities. Our officers and directors are also prohibited from selling or purchasing puts or calls, trading in or writing options, or engaging in other hedging activities with respect to KLX securities. Directors and executive officers are also prohibited from holding Company securities in a margin account or pledging KLX securities as collateral for a loan, unless our General Counsel, Vice President — Law and Human Resources provides pre-clearance after the director or executive officer clearly demonstrates the financial capability to repay the loan without resort to the pledged securities.
The following table summarizes the compensation paid to our non-employee directors during Fiscal 2017:
|
|
|
Fees Earned or |
|
Stock |
|
All Other |
|
|
| ||||
|
Name |
|
($) |
|
($) |
|
($) |
|
Total |
| ||||
|
John T. Collins |
|
$ |
125,000 |
|
$ |
90,111 |
|
$ |
— |
|
$ |
215,111 |
|
|
Peter V. Del Presto |
|
$ |
125,000 |
|
$ |
90,111 |
|
$ |
— |
|
$ |
215,111 |
|
|
Richard G. Hamermesh |
|
$ |
117,500 |
|
$ |
90,111 |
|
$ |
— |
|
$ |
207,611 |
|
|
Benjamin A. Hardesty |
|
$ |
110,000 |
|
$ |
90,111 |
|
$ |
— |
|
$ |
200,111 |
|
|
Stephen M. Ward, Jr. |
|
$ |
— |
|
$ |
200,308 |
|
$ |
— |
|
$ |
200,308 |
|
|
Theodore L. Weise |
|
$ |
110,000 |
|
$ |
90,111 |
|
$ |
— |
|
$ |
200,111 |
|
|
John T. Whates, Esq. |
|
$ |
110,000 |
|
$ |
90,111 |
|
$ |
— |
|
$ |
200,111 |
|
(1) Includes all cash retainers paid to our non-employee directors or deferred as cash pursuant to the NEDSDCP at the director’s election but excludes amounts deferred as stock units into the NEDSDCP.
(2) The amounts reported in the Stock Awards column represent the aggregate full grant date fair value of (i) the annual restricted stock awards issued under the LTIP and (ii) the deferred stock units allocated to each director’s account under the NEDSDCP calculated in accordance with Financial Accounting Standards Board Accounting Standards Codification Topic 718 (“FASB ASC 718”) (without any reduction for risk of forfeiture) and (iii) cash retainers earned and deferred as stock units into the NEDSDCP. For more information about our adoption of FASB ASC 718 and how we value stock-based awards (including assumptions made in such valuation), refer to Note 11 to our audited financial statements for the fiscal year ended January 31, 2018 included in our Annual Report on Form 10-K filed with the SEC on March 19, 2018.
As of January 31, 2018, the aggregate number of outstanding deferred stock units and unvested restricted stock awards held by each non-employee director was as follows:
|
Name |
|
Deferred Shares |
|
Unvested Stock Awards |
|
|
John T. Collins |
|
2,521 |
|
3,671 |
|
|
Peter V. Del Presto |
|
2,521 |
|
3,599 |
|
|
Richard G. Hamermesh |
|
2,521 |
|
3,644 |
|
|
Benjamin A. Hardesty |
|
2,521 |
|
3,545 |
|
|
Stephen M. Ward, Jr. |
|
7,568 |
|
3,153 |
|
|
Theodore L. Weise |
|
2,521 |
|
3,545 |
|
|
John T. Whates, Esq. |
|
2,521 |
|
3,617 |
|
ITEM 12. SECURITY OWNERSHIP OF CERTAIN BENEFICIAL OWNERS AND MANAGEMENT AND RELATED STOCKHOLDER MATTERS
The following table and notes thereto set forth certain information with respect to the beneficial ownership of the Company’s common stock as of May 1, 2018, except as otherwise noted, by (i) each person who is known to us to beneficially own more than 5% of the outstanding shares of common stock of the Company; (ii) each of the Company’s Chief Executive Officer, Chief Financial Officer and the three other most highly paid executive officers in 2017 (each a “NEO” and collectively, the “NEOs”), (iii) each of the Company’s directors; and (iv) all of the Company’s executive officers and directors as a group. Except as otherwise indicated, each stockholder named below has sole voting and investment power with respect to the shares of common stock beneficially owned:
|
|
|
Common Stock |
| ||
|
|
|
Beneficially Owned |
| ||
|
|
|
Number of |
|
Percent of |
|
|
|
|
|
|
|
|
|
BlackRock, Inc. |
|
6,758,972 |
(2) |
13.7% |
|
|
The Vanguard Group |
|
4,421,574 |
(3) |
8.77% |
|
|
Dimensional Fund Advisors LP |
|
3,640,409 |
(4) |
7.23% |
|
|
Amin J. Khoury+* |
|
338,917 |
(5) |
** |
|
|
John T. Collins* |
|
10,779 |
(6) |
** |
|
|
Peter V. Del Presto* |
|
11,253 |
(7) |
** |
|
|
Richard G. Hamermesh* |
|
11,010 |
(8) |
** |
|
|
Benjamin A. Hardesty* |
|
5,199 |
(9) |
** |
|
|
Stephen M. Ward, Jr. * |
|
10,173 |
(10) |
** |
|
|
Theodore L. Weise* |
|
5,199 |
(11) |
** |
|
|
John T. Whates, Esq. * |
|
5,656 |
(12) |
** |
|
|
Thomas P. McCaffrey+ |
|
233,208 |
(13) |
** |
|
|
Michael F. Senft+ |
|
21,147 |
(14) |
** |
|
|
John Cuomo+ |
|
28,617 |
(15) |
** |
|
|
Roger Franks+ |
|
8,429 |
(16) |
** |
|
|
All Directors and Executive Officers as a group (15 Persons) |
|
708,778 |
(17) |
** |
|
+ Named executive officer * Director of the Company ** Less than 1 percent
(1) As of May 1, 2018, the Company had 50,741,488 shares of common stock outstanding.
(2) Based solely on information in Schedule 13G/A, as of December 31, 2017, filed by BlackRock, Inc. on January 19, 2018.
(3) Based solely on information in Schedule 13G/A, as of December 31, 2017, filed by The Vanguard Group on February 9, 2018.
(4) Based solely on information in Schedule 13G, as of December 31, 2017, filed by Dimension Fund Advisors LP on February 9, 2018.
(5) Excludes 235,191 shares of our common stock underlying restricted stock awards, restricted stock units and performance stock units that do not vest within 60 days of May 1, 2018.
(6) Excludes 3,598 shares of our common stock underlying restricted stock awards that do not vest within 60 days of May 1, 2018.
(7) Excludes 3,562 shares of our common stock underlying restricted stock awards that do not vest within 60 days of May 1, 2018.
(8) Excludes 3,584 shares of our common stock underlying restricted stock awards that do not vest within 60 days of May 1, 2018.
(9) Excludes 3,535 shares of our common stock underlying restricted stock awards that do not vest within 60 days of May 1, 2018.
(10) Excludes 3,339 shares of our common stock underlying restricted stock awards that do not vest within 60 days of May 1, 2018.
(11) Excludes 3,535 shares of our common stock underlying restricted stock awards that do not vest within 60 days of May 1, 2018.
(12) Excludes 3,571 shares of our common stock underlying restricted stock awards that do not vest within 60 days of May 1, 2018.
(13) Includes 7,525 shares owned indirectly and excludes 156,739 shares of our common stock underlying restricted stock awards, restricted stock units, performance stock awards and performance stock units that do not vest within 60 days of May 1, 2018.
(14) Excludes 45,485 shares of our common stock underlying restricted stock awards, restricted stock units and performance stock units that do not vest within 60 days of May 1, 2018.
(15) Excludes 37,352 shares of our common stock underlying restricted stock awards, performance stock awards and performance stock units that do not vest within 60 days of May 1, 2018.
(16) Excludes 34,610 shares of our common stock underlying restricted stock awards, restricted stock units, performance stock awards and performance stock units that do not vest within 60 days of May 1, 2018.
(17) Excludes 589,603 shares of our common stock underlying restricted stock awards, restricted stock units, performance stock awards and performance stock units that do not vest within 60 days of May 1, 2018. Includes 680 shares of our common stock underlying restricted stock awards that will vest within 60 days of May 1, 2018.
ITEM 13. CERTAIN RELATIONSHIPS AND RELATED TRANSACTIONS, AND DIRECTOR INDEPENDENCE
We are leasing the real estate for some of our ESG facilities in Texas, Wyoming, North Dakota and Colorado from a limited liability company controlled by Gary Roberts, Vice President and General Manager of our ESG segment. The aggregate lease payments for all of these leases amount to approximately $650,000 annually. In addition, we pay approximately $125,000 annually to an LLC controlled by Mr. Roberts for entertainment expenses.
ITEM 14. PRINCIPAL ACCOUNTING FEES AND SERVICES
Deloitte & Touche LLP has audited the financial statements of the Company for the fiscal year ended January 31, 2018.
A representative of Deloitte & Touche LLP is expected to be present at the meeting and will be afforded the opportunity to make a statement if he or she desires to do so and to respond to appropriate questions from stockholders.
When considering Deloitte & Touche LLP’s independence, the Audit Committee considered whether its provision of services to the Company beyond those rendered in connection with its audit and review of the Company’s consolidated financial statements was compatible with maintaining its independence and has determined that such services do not interfere with that firm’s independence in the conduct of its auditing function. The Audit Committee also reviewed, among other things, the amount of fees paid to Deloitte & Touche LLP, the member firms of Deloitte Touche Tohmatsu Limited, and their respective affiliates for audit and non-audit services.
Principal Accountant Fees and Services
The following table sets forth by category of service the fees incurred in engagements performed by Deloitte & Touche LLP, the member firms of Deloitte Touche Tohmatsu Limited, and their respective affiliates, for professional services rendered to the Company for the fiscal years ended January 31, 2018 and January 31, 2017.
|
|
|
January 31, |
|
January 31, |
| ||
|
|
|
2018 |
|
2017 |
| ||
|
|
|
(in Thousands) |
|
(in Thousands) |
| ||
|
Audit Fees |
|
$ |
3,989 |
|
$ |
2,701 |
|
|
Audit-Related Fees |
|
125 |
|
60 |
| ||
|
Tax Fees |
|
169 |
|
52 |
| ||
|
All Other Fees |
|
— |
|
— |
| ||
|
Total |
|
$ |
4,283 |
|
$ |
2,813 |
|
Audit Fees
Audit fees in 2017 and 2016 consist of aggregate fees, including expenses, billed and reasonably expected to be billed by Deloitte & Touche LLP, the member firms of Deloitte Touche Tohmatsu Limited, and their respective affiliates in connection with the annual audit and the audit of internal controls over financial reporting (Sarbanes-Oxley Act Section 404), the reviews of the Company’s quarterly reports on Form 10-Q, statutory audits required for the Company’s subsidiaries and services provided in connection with filing registration statements with the SEC.
Audit-Related
Audit-related fees in 2017 and 2016 consist of the aggregate fees, including expenses, billed by Deloitte & Touche LLP, the member firms of Deloitte Touche Tohmatsu Limited, and their respective affiliates in connection with the Employee Stock Purchase Plan audit, acquisition-related and other services.
Tax Fees
Tax fees in 2017 and 2016 consist of the aggregate fees, including expenses, billed by Deloitte & Touche LLP, the member firms of Deloitte Touche Tohmatsu Limited, and their respective affiliates in connection with services for tax compliance, tax planning, tax advice and tax audit assistance.
All Other Fees
There were no other fees or expenses, billed by Deloitte & Touche LLP, the member firms of Deloitte Touche Tohmatsu Limited, and their respective affiliates not otherwise described above.
Pre-Approval Policies and Procedures
The Audit Committee approves all audit and audit-related services, tax services and other services provided by Deloitte & Touche LLP, the member firms of Deloitte Touche Tohmatsu Limited, and their respective affiliates. Any services provided by Deloitte & Touche LLP, the member firms of Deloitte Touche Tohmatsu Limited, and their respective affiliates that are not specifically included within the scope of the audit must be pre-approved by the Audit Committee in advance of any engagement. Under the Sarbanes Oxley Act of 2002, audit committees are permitted to approve certain fees for audit-related services, tax services and other services pursuant to a de minimis exception prior to the completion of an audit engagement. In 2016, $8,000 of the fees paid to Deloitte & Touche LLP, the member firms of Deloitte Touche Tohmatsu Limited, and their respective affiliates were approved pursuant to the de minimis exception. In 2017, $71,850 of the fees paid to Deloitte & Touche LLP, the member firms of Deloitte Touche Tohmatsu Limited, and their respective affiliates were approved pursuant to the de minimis exception.
In making its recommendation to appoint Deloitte & Touche LLP as the Company’s independent registered public accounting firm for the fiscal year ending January 31, 2019, the Audit Committee has considered whether the services provided by Deloitte & Touche LLP, the member firms of Deloitte Touche Tohmatsu Limited, and their respective affiliates are compatible with maintaining the independence of Deloitte & Touche LLP and has determined that such services do not interfere with that firm’s independence in the conduct of its auditing function.
ITEM 15. EXHIBITS AND FINANCIAL STATEMENT SCHEDULES
(a) The following documents are filed as part of this report:
3. Exhibits:
The exhibits listed in the exhibit index of the Original Filing and the exhibits listed in the exhibit index of this Amendment are filed with, or incorporated by reference, in this report/We are filing the following documents as exhibits to this Form 10-K/A:
|
Exhibit |
|
Description |
|
31.3 |
|
|
|
31.4 |
|
Pursuant to the requirements of Section 13 or 15(d) of the Securities Exchange Act of 1934, the registrant has duly caused this report to be signed on its behalf by the undersigned, thereunto duly authorized.
|
|
KLX INC. | |
|
|
|
|
|
|
By: |
/s/ Amin J. Khoury |
|
|
|
Amin J. Khoury |
|
|
|
Chairman and Chief Executive Officer |
Date: May 22, 2018