Attached files
| file | filename |
|---|---|
| EX-32.2 - EX-32.2 - KLX Inc. | klx-20170131ex322e8e870.htm |
| EX-32.1 - EX-32.1 - KLX Inc. | klx-20170131ex3219d21a8.htm |
| EX-31.2 - EX-31.2 - KLX Inc. | klx-20170131ex31265b4c9.htm |
| EX-31.1 - EX-31.1 - KLX Inc. | klx-20170131ex31167929f.htm |
| EX-23.1 - EX-23.1 - KLX Inc. | klx-20170131ex2315e08d6.htm |
| EX-21.1 - EX-21.1 - KLX Inc. | klx-20170131ex211a31b17.htm |
| EX-10.2 - EX-10.2 - KLX Inc. | klx-20170131ex102662e1a.htm |
| EX-4.1.1 - EX-4.1.1 - KLX Inc. | klx-20170131ex4117406fd.htm |
UNITED STATES
SECURITIES AND EXCHANGE COMMISSION
Washington, D.C. 20549
FORM 10‑K
|
(Mark One) |
|
|
☒ |
ANNUAL REPORT PURSUANT TO SECTION 13 OR 15(d) OF THE SECURITIES |
|
For the fiscal year ended: January 31, 2017 |
|
|
or |
|
|
☐ |
TRANSITION REPORT PURSUANT TO SECTION 13 OR 15(d) OF THE SECURITIES |
|
For the transition period from to . |
|
Commission File Number: 001‑36610
KLX INC.
(Exact name of registrant as specified in its charter)
|
Delaware |
47‑1639172 |
1300 Corporate Center Way,
Wellington, Florida
(Address of principal executive offices)
(561) 383‑5100
(Registrant’s telephone number, including area code)
Securities registered pursuant to Section 12(b) of the Act:
|
Title of Each Class |
Name of Each Exchange on Which Registered |
|
Common Stock, $0.01 Par Value |
The NASDAQ Global Select Market |
Securities registered pursuant to Section 12(g) of the Act: None.
Indicate by check mark if the registrant is a well‑known seasoned issuer, as defined in Rule 405 of the Securities Act. Yes ☒ No ☐.
Indicate by check mark if the registrant is not required to file reports pursuant to Section 13 or Section 15(d) of the Act. Yes ☐ No ☒.
Indicate by check mark whether the registrant (1) has filed all reports required to be filed by Section 13 or 15(d) of the Securities Exchange Act of 1934 during the preceding 12 months (or for such shorter period that the registrant was required to file such reports), and (2) has been subject to such filing requirements for the past 90 days: Yes ☒ No ☐.
Indicate by check mark whether the registrant has submitted electronically and posted on its corporate Web site, if any, every Interactive Data File required to be submitted and posted pursuant to Rule 405 of Regulation S‑T (§ 232.405 of this chapter) during the preceding 12 months (or for such shorter period that the registrant was required to submit and post such files). Yes ☒ No ☐.
Indicate by check mark if disclosure of delinquent filers pursuant to Item 405 of Regulation S‑K (§ 229.405 of this chapter) is not contained herein, and will not be contained, to the best of the registrant’s knowledge, in definitive proxy or information statements incorporated by reference in Part III of this Form 10‑K or any amendment to this Form 10‑K. ☐
Indicate by check mark whether the registrant is a large accelerated filer, an accelerated filer, a non‑accelerated filer, smaller reporting company, or an emerging growth company. See the definitions of “large accelerated filer,” “accelerated filer,” “smaller reporting company,” and “emerging growth company” in Rule 12b‑2 of the Exchange Act.
|
Large accelerated filer ☒ |
Accelerated filer ☐ |
Non‑accelerated filer ☐ |
Smaller reporting company ☐ |
Emerging growth company ☐ |
||
If an emerging growth company, indicate by check mark if the registrant has elected not to use the extended transition period for complying with any new or revised financial accounting standards provided pursuant to Section 13(a) of the Exchange Act. ☐
Indicate by check mark whether the registrant is a shell company (as defined in Rule 12b‑2 of the Exchange Act). Yes ☐ No ☒.
As of July 31, 2016 the aggregate market value of the registrant’s voting stock held by non‑affiliates was approximately $1,686 million. Shares of common stock held by executive officers and directors have been excluded since such persons may be deemed affiliates. This determination of affiliate status is not a determination for any other purpose. The number of shares of the registrant’s common stock, $0.01 par value, outstanding as of April 11, 2017 was 51,721,338 shares.
DOCUMENTS INCORPORATED BY REFERENCE
Certain sections of the registrant’s Proxy Statement to be filed with the Commission in connection with the 2017 Annual Meeting of Stockholders or Annual Report on Form 10‑K/A, to be filed with the Securities and Exchange Commission within 120 days after the close of the registrant’s fiscal year, are incorporated by reference in Part III of this Form 10‑K. With the exception of those sections that are specifically incorporated by reference in this Annual Report on Form 10‑K, such Proxy Statement shall not be deemed filed as part of this Report or incorporated by reference herein.
|
|
|
Page |
|
|
PART I |
|
|
4 |
||
|
16 |
||
|
36 |
||
|
37 |
||
|
38 |
||
|
38 |
||
|
|
PART II |
|
|
39 |
||
|
42 |
||
|
Management’s Discussion and Analysis of Financial Condition and Results of Operations |
44 |
|
|
54 |
||
|
55 |
||
|
Changes in and Disagreements with Accountants on Accounting and Financial Disclosure |
55 |
|
|
55 |
||
|
60 |
||
|
|
PART III |
|
|
61 |
||
|
66 |
||
|
Security Ownership of Certain Beneficial Owners and Management and Related Stockholder Matters |
66 |
|
|
Certain Relationships and Related Party Transactions, and Director Independence |
66 |
|
|
66 |
||
|
|
PART IV |
|
|
67 |
||
|
|
70 |
|
|
|
Index to Consolidated and Combined Financial Statements and Schedule |
F‑1 |
1
CAUTIONARY STATEMENT REGARDING FORWARD‑LOOKING STATEMENTS
The Private Securities Litigation Reform Act of 1995 provides a “safe harbor” for forward‑looking statements to encourage companies to provide prospective information to investors. This Annual Report on Form 10‑K (this “Form 10‑K”) includes forward‑looking statements that reflect our current expectations and projections about our future results, performance and prospects. Forward‑looking statements include all statements that are not historical in nature or are not current facts. We have tried to identify these forward‑looking statements by using forward‑looking words including “believe,” “expect,” “plan,” “intend,” “anticipate,” “estimate,” “predict,” “potential,” “continue,” “may,” “might,” “should,” “could,” “will” or the negative of these terms or similar expressions.
These forward‑looking statements are subject to a number of risks, uncertainties, assumptions and other factors that could cause our actual results, performance and prospects to differ materially from those expressed in, or implied by, these forward‑looking statements. These factors include the risks, uncertainties, assumptions and other factors discussed under the headings “Item 1A. Risk Factors,” as well as “Item 1. Business”, “Item 7. Management’s Discussion and Analysis of Financial Condition and Results of Operations” and elsewhere in this Form 10‑K, including the following factors:
|
· |
regulation of and dependence upon the aerospace and energy industries; |
|
· |
the cyclical nature of the aerospace and energy industries; |
|
· |
market prices for fuel, oil and natural gas; |
|
· |
competitive conditions; |
|
· |
legislative or regulatory changes and potential liability under federal and state laws and regulations; |
|
· |
risks inherent in international operations, including compliance with anti‑corruption laws and regulations of the U.S. government and various international jurisdictions; |
|
· |
doing business with the U.S. government; |
|
· |
reduction in government military spending; |
|
· |
just in time (“JIT”) contracts and long term agreements (“LTAs”) having no guarantee of future customer purchase requirements; |
|
· |
dependence on suppliers and on third‑party package delivery companies; |
|
· |
decreases in the rate at which oil or natural gas reserves are discovered or developed; |
|
· |
impact of technological advances on the demand for our products and services; |
|
· |
delays of customers obtaining permits for their operations; |
|
· |
hazards and operational risks that may not be fully covered by insurance; |
|
· |
the write‑off of a significant portion of intangible assets; |
|
· |
the need to obtain additional capital or financing, and the availability and/or cost of obtaining such capital or financing; |
2
|
· |
limitations that our organizational documents, debt instruments and U.S. federal income tax requirements may have on our financial flexibility, our ability to engage in strategic transactions or our ability to declare and pay cash dividends on our common stock; |
|
· |
failure to have the spin‑off qualified as a reorganization for U.S. federal income tax purposes under Sections 355 and 368(a)(1)(D) of the Code; |
|
· |
our credit profile; |
|
· |
changes in supply and demand of equipment; |
|
· |
oilfield anti‑indemnity provisions; |
|
· |
severe weather; |
|
· |
reliance on information technology resources and the inability to implement new technology; |
|
· |
increased labor costs or the unavailability of skilled workers; |
|
· |
inability to manage inventory; |
|
· |
inability to successfully consummate acquisitions or inability to manage potential growth; and |
|
· |
inability to achieve some or all of the benefits of the spin‑off. |
In light of these risks and uncertainties, you are cautioned not to put undue reliance on any forward‑looking statements in this Form 10‑K. These statements should be considered only after carefully reading this entire Form 10‑K. Except as required under the federal securities laws and rules and regulations of the SEC, we undertake no obligation to publicly update or revise any forward‑looking statements, whether as a result of new information, future events or otherwise. Additional risks that we may currently deem immaterial or that are not presently known to us could also cause the forward‑looking events discussed in this Form 10‑K not to occur.
Unless otherwise indicated, the industry data included in this Form 10‑K is from the January/February 2017 issue of the Airline Monitor, December 2016 report from the International Air Transport Association (“IATA”), the Current Boeing Market Outlook 2016, the Aircraft Analytical System (“ACAS”) database, the Airbus or Boeing corporate websites or the U.S. Energy Information Administration’s Annual Outlook 2013 Assumptions report.
3
PART I
Except as otherwise indicated or unless the context otherwise requires, “KLX,” “we,” “us” and “our” refer to KLX Inc. and its consolidated subsidiaries after giving effect to the internal reorganization and its spin‑off from B/E Aerospace, and “B/E Aerospace” refers to B/E Aerospace, Inc., its predecessors and its consolidated subsidiaries, other than, for all periods following the spin‑off, KLX Inc. and its consolidated subsidiaries. See “Item 7. Management’s Discussion and Analysis of Financial Condition and Results of Operations—Overview—The Spin‑off.”
Our Company
We believe, based on our experience in the industry, that we are one of the world’s leading independent distributors and value‑added service providers of aerospace fasteners and consumables, and that we offer one of the broadest ranges of aerospace hardware and consumables and inventory and supply chain management services worldwide. Our aerospace distribution business is the product of both organic growth and a number of strategic acquisitions beginning in 2001. Through our global facilities network and advanced information technology systems, we believe we offer unparalleled service to commercial airline, business jet and defense original equipment manufacturers and their subcontractors (“OEMs”), airlines, maintenance, repair and overhaul (“MRO”) operators, fixed base operators (“FBOs”) and domestic military depots. With a large and diverse global customer base, including virtually all of the world’s commercial airline, business jet and defense OEMs, OEM subcontractors, airlines and major MRO operators across five continents, as well as the U.S. military, we provide access to over one million stock keeping units (“SKUs”). We serve as a distributor for every major aerospace fastener manufacturer. In order to support our vast range of custom products and services, we have invested well in excess of $100 million in proprietary information technology (“IT”) systems to create a superior technology platform. Our systems support both internal distribution processes and part attributes, along with customer services, including JIT deliveries and kitting solutions. This business is operated within our Aerospace Solutions Group (“ASG”) segment. During the fiscal year ended January 31, 2017 (“Fiscal 2016”), ASG generated approximately 90% of our consolidated revenues.
Our ASG segment has maintained strong, collaborative, long‑standing relationships with its customers. As a result of our operational and information technology systems, we have historically been able to ship approximately 60% of our orders within 24 hours of receipt of the order. Our seasoned purchasing and sales teams, coupled with state‑of‑the‑art IT and automated parts retrieval systems, help us to sustain our reputation for highly dependable, rapid, on‑time delivery.
ASG sells fasteners and other consumable products to approximately 7,500 customers throughout the world. Its top five customers in Fiscal 2016 collectively accounted for approximately 31% of its Fiscal 2016 revenues.
In the latter part of 2013, we initiated an expansion into the energy services sector. In 2013 and 2014, we acquired seven companies dedicated to providing technical services and related rental equipment to oil and gas exploration and production companies. As a result, we now provide a broad range of solutions and equipment which bring value‑added resources to a new customer base, often in remote locations on an episodic or urgent 24/7 basis. Our customers include independent and major oil and gas companies that are engaged in the exploration and production (“E&P”) of oil and gas properties in onshore North America, including in the Northeast (Marcellus and Utica Shale), Rocky Mountains (Williston and Piceance Basins), Southwest (Permian Basin and Eagle Ford) and Mid‑Continent. This business is operated within our Energy Services Group (“ESG”) segment.
ESG has increased the number of its agreements with customers by over 115% from over 400 as of January 31, 2016 to over 900 as of January 31, 2017. These agreements enable us to work for substantially all of the major, regional and independent E&P companies in North America. ESG’s top five customers collectively represented approximately 21% of its Fiscal 2016 revenues.
Our management team has extensive industry experience and company tenure. Our executive officers have an average of more than 20 years of employment in the aerospace or energy services industries.
4
Industry Overview
Aerospace Solutions Group
ASG is generally segmented by end customer or sales channel. Based on our experience in this industry, we estimate that during Fiscal 2016 the market for the products and services provided by ASG was approximately $14.8 billion; of this amount, we estimate that approximately 50%, or $7.4 billion, is served by the manufacturers of these products and OEMs directly to the end customers and approximately 50%, or $7.4 billion, is served by distributors such as ASG.
We believe that there is a direct relationship between demand for fasteners and other consumable products and airliner fleet size, aircraft utilization and aircraft age, as well as new aircraft production rates. All aircraft must be serviced at regular intervals, which drives aftermarket demand for aerospace fasteners and consumable products. ASG generated approximately 60% of its Fiscal 2016 revenues supporting original equipment manufacturers of commercial and military aircraft or aircraft system components and derived approximately 40% of its Fiscal 2016 revenues from aftermarket sales to support the in‑service fleet of commercial and military aircraft, and aircraft systems. Historically, aerospace fastener and consumable products revenues have been derived from the following sources:
|
· |
Support for commercial, business jet and military aircraft OEMs; |
|
· |
Mandated aircraft maintenance; |
|
· |
Support for commercial aircraft, business jet and defense subcontractors; |
|
· |
Demand for structural aircraft modifications, cabin interior modifications and passenger‑to‑freighter conversions; and |
|
· |
Supply chain management and consumables hardware distribution for land-based military depot aftermarket customers and the U.S. Department of Defense (“DoD”). |
In addition, suppliers in the aerospace, defense and related industries often rely on companies such as ASG to provide a customized single point of contact for inventory management, customized invoicing, automated forecasting and usage monitoring, centralized communications and tracking across their broad and varied supply base.
Since 2010, as the global economy began to recover from recession, increased passenger traffic volumes and the return to profitability of the global airline industry have created significant demand for commercial aircraft. During 2016, global air traffic increased by 6.3% as compared with global traffic increases of 7.4% in 2015 and 6.0% in 2014. The overall increase in global traffic demand from 2014 through 2016 reflect the global macroeconomic environment. The Airline Monitor forecasts a 2017 global passenger traffic increase of approximately 6% and projects long‑term growth at an approximate compounded annual growth rate (“CAGR”) of 4.8% during the 2017‑2031 period.
IATA expects the global airline industry to generate a profit of approximately $35.6 billion in 2016, an increase of approximately 1% compared to 2015. Overall performance in 2016 has been positively impacted by strong passenger traffic growth, disciplined capacity management, positive macroeconomic factors, and improved airline offerings that stimulate demand. The record industry profits were delivered despite modest reduction in yields as compared with 2015. IATA expects global airline profits of $29.8 billion in 2017, or 16.3% lower than 2016, driven primarily by higher fuel and labor costs. The decrease in global airline profits in 2017 is expected after seven consecutive years of record profitability, and the airlines have substantially strengthened their balance sheets over the past several years through operating profits and by accessing capital markets. As a result, we believe airline balance sheets are much stronger than in any time in the past ten years.
Many airlines deferred the replacement of a large number of aging aircraft over the 2000‑2009 period. This, combined with recent more efficient new aircraft introductions, the growing requirements for more aircraft to support
5
projected long‑term traffic growth, record capacity utilization rates, high fuel costs and the low cost of financing new aircraft drove the global airline industry to place record orders for new aircraft. Backlogs at Airbus S.A.S. (“Airbus”) and The Boeing Company (“Boeing”) stood at record levels of 6,851 and 5,695 aircraft, respectively, at January 31, 2017. Airbus reported that they have an approximate ten-year backlog. As a result, most industry analysts believe the outlook for new aircraft production and deliveries will be strong for the foreseeable future.
The strong new aircraft delivery cycle has resulted in an increase in ASG’s revenues to support the global aerospace manufacturing base, including several new long‑term contract awards. However, unlike any prior new aircraft delivery cycle, a record number of new aircraft deliveries were to replace and retire older, less fuel efficient aircraft. The increase in our revenues derived from manufacturing customers combined with the decline in aftermarket revenues and higher margins associated with older aircraft, which have been retired, has resulted in a shift in our revenue mix and has impacted our gross margins. Our aftermarket revenues include both commercial aerospace customers and our business serving U.S. military depots. We expect aftermarket revenues to trend upwards in 2017 and beyond, as the approximately 11,000 new aircraft which have been delivered over the past eight years begin to require their first heavy maintenance, and our business serving military depots begins to reflect new contracts such as the recently signed 10 year, $135 million contract to supply the Corpus Christi Army Depot.
Defense spending has historically been driven by the timing of military aircraft orders and evolving government strategies and policies. We also support military depots for all five branches of our armed services, which maintain in-service aircraft and equipment. Defense spending began to decline in 2012 as the U.S. government implemented its sequestration program and began to sunset production of numerous military aircraft. As a result, we have seen demand from our military and defense manufacturing customers decline from peak levels experienced prior to 2012. Similarly, business jet manufacturing has declined since 2007 as a result of lower demand driven by austerity measures implemented by corporate customers, and the reduction in demand from businesses and countries affected by depressed conditions in the global oil and gas industry.
Other factors expected to affect the industries served by ASG include long‑term growth in worldwide fleet of passenger aircraft, an increase in the size of the existing installed base, aging of existing fleet and an expected improvement in the business jet market.
Energy Services Group
The oil and gas industry has historically been both cyclical and seasonal. Activity levels are driven primarily by drilling rig counts, technological advances, well completions and workover activity, the geological characteristics of the producing wells and their effect on the services required to commence and maintain production levels, and our customers’ capital and operating budgets. All of these indicators are driven by commodity prices, which are affected by both domestic and global supply and demand factors. In particular, while U.S. natural gas prices are correlated with global oil price movements, they are also affected by local weather and consumption patterns.
While global supply and demand factors will continue to result in commodity price volatility, we believe the secular outlook for the on-shore North American oil and gas industry remains positive due to:
|
· |
The projected long term growth in global energy demand, combined with the United States’ long‑term goal of energy independence. |
|
· |
According to the U.S. Energy Information Administration’s Annual Energy Outlook 2013 Assumptions report, currently identified recoverable reserves of 223 billion barrels of shale oil and 2,431 trillion cubic feet of shale gas are contained within the United States. |
|
· |
Almost all E&P companies outsource the services required by them to drill wells and maintain production. Drilling and completion activities require numerous services and products from time to time on an “as needed” basis. |
6
|
· |
The decline of conventional North American oil and natural gas reservoirs, together with the development of new recovery technologies, is leading to a shift toward the drilling and development of onshore unconventional oil and natural gas resources that require more wells to be drilled and active maintenance to sustain production and maximize total recoveries. While drilling activity has recently improved and we expect improving operating conditions for oil field service companies, a return to profitability will require that energy supply and demand reach equilibrium and commodity prices stabilize at a level where our customers can achieve an appropriate return on their investments. We believe the increased requirements of these unconventional resources will continue to support increasing service activity as the industry rebalances its allocation of assets to meet future growth. |
|
· |
Technologically driven breakthroughs, including (i) continued drilling activity supported by unconventional resources, (ii) the expanding use of horizontal drilling techniques and (iii) longer lateral lengths and increasing number of stages per well, have all created growing demand for services and products to support these advanced drilling activities, many of which are in remote areas with harsh environments. |
|
· |
The increasing complexity of technology used in the oil and natural gas exploration and development process requires additional technicians on location during drilling. In particular, the increasing trend of pursuing horizontal and directional wells as opposed to vertical wells requires additional expertise on location and, typically, longer drilling times. |
Other factors expected to affect the industry served by our ESG segment include:
Growing Demand for Natural Gas in the United States. We believe that natural gas will be in increasingly high demand in the United States over time because of its growing popularity as a cleaner burning fuel. The ongoing shift to the use of natural gas from coal-fired power plants and the increased access to residential customers from new pipeline projects is expected to support increased demand for natural gas. In addition, the recent commencement of liquefied natural gas shipments from the United States to foreign markets is also expected to increase demand for natural gas production.
Continued Outsourcing of Ancillary Services. Some of the services we provide have been historically handled by drilling contractors themselves. In many instances, these services are only ancillary to the primary activity of drilling and completing wells and represent only a minor portion of the total well drilling cost. Drilling contractors often elect to outsource these services to suppliers who have the expertise to be able to provide increasingly more complex, high‑quality and reliable services on a 24/7 basis.
Impact of Recent Industry Downturn. Starting in late 2014, the rapid decline in the prices of oil and natural gas caused a dramatic reduction in drilling and completion activity by oil and gas producers in all regions of North America. The severity of this decline in activity persisted throughout 2015 and into the first half of 2016, resulting in a severely negative impact on both volume and pricing of services. This in turn has driven substantial losses for all oil field service companies serving these markets. In response, companies across the oil field service industry implemented deep cuts in both personnel and operational capacity, and recorded billions of dollars in impairment charges. In addition, there have been a high number of bankruptcies, reorganizations and liquidations, which along with these personnel reductions and the migration of workers away from the industry has substantially reduced oil field service capacity. These factors are expected to support a recovery in activity levels, as well as pricing of our services, as commodity prices have begun to recover to levels sufficient to increase activity levels of our oil and gas producing customers, although there can be no assurance that commodity prices will continue to recover or that activity levels will increase in the near future.
7
Products and Services
We conduct our business through two operating segments: ASG and ESG. Information about each of our operating segments is included below.
Aerospace Solutions Group
We believe, based on our experience in the industry, that we are one of the world’s leading independent distributors and value‑added service providers of aerospace fasteners and consumables, and that we offer one of the broadest ranges of aerospace hardware, consumables and inventory and supply chain management services worldwide. ASG, which was formerly the consumables management segment of B/E Aerospace, Inc. (our Former Parent), has evolved into an industry leader through multiple acquisitions and strong organic growth. As of January 31, 2017, ASG’s global presence consisted of approximately 1.5 million square feet in 18 principal facilities with approximately 2,000 employees worldwide. We have substantially expanded the size, scope and nature of our business as a result of a number of acquisitions. B/E Aerospace acquired M&M Aerospace Hardware in 2001 and it became the platform upon which the rest of ASG was built. Between 2002 and 2016, we completed 7 acquisitions, for an aggregate purchase price of approximately $2.1 billion. In 2016, we acquired Herndon Aerospace and Defense LLC, which principally serves U.S. domestic military depots that support in-service aircraft and other equipment for the five branches of the armed forces. We believe our organic growth together with these acquisitions enabled us to position ourselves as a preferred global supplier to our customers. We have historically shipped approximately 60% of our orders within 24 hours of receipt of the order. With a large and diverse global customer base, including virtually all of the world’s commercial airline, business jet and defense OEMs, OEM subcontractors, major airlines and major MRO operators across five continents, we provide access to over one million SKUs that include aerospace fasteners and consumables, including chemicals, and related logistics services. Our service offerings include inventory management and replenishment, creative and differential supply chain solutions such as third‑party logistics programs, special packaging and bar‑coding, sophisticated parts kitting, quality assurance testing and a wide variety of purchasing assistance programs, plus the latest in electronic data interchange capability. Our seasoned purchasing and sales teams, coupled with state‑of‑the‑art IT and automated parts retrieval systems, help us to sustain our reputation for high‑quality products and rapid, on‑time delivery.
We service our global customer base with over 500 sales, marketing, product support and customer service specialists worldwide. Approximately 40% of our Fiscal 2016 ASG segment revenues were derived from the aerospace and airline aftermarket and approximately 60% from sales to OEMs and their suppliers to support manufacturing customers under long term agreements. We stock over one million SKUs, are an authorized distributor for more than 200 manufacturers and distribute products for over 2,400 manufacturers.
We offer an extensive range of products, which we believe serves as a key competitive advantage for our business. Our portfolio consists of:
|
· |
Fasteners. We stock inventory to support numerous commercial and military aircraft, business jets and helicopters. Our inventory position is highly diversified, supplying bolts, clips, hinges, rings, screws, carbon‑faced seals, gaskets, O‑rings and more. |
|
· |
Chemicals. We stock over 50,000 chemicals and specialty materials SKUs from approximately 1,180 manufacturers, which we distribute to over 6,300 customers globally. Among these products are chemicals, sealants and adhesives, lubricants, paints, cleaners and degreasers. |
|
· |
Honeywell Proprietary Parts. We hold an exclusive 20‑year license (with 11 years remaining on the original license), which will renew for two successive five‑year periods if certain operating metrics are maintained, on over 20,000 Honeywell proprietary parts. Among the product lines supported by these parts are auxiliary power units, propulsion engines, electrical/electro‑mechanical and airframe and engine accessories. We are also the primary supplier of these parts to Honeywell for their use during the manufacturing of the aforementioned products. |
8
|
· |
Bearings, Electrical, Clamps and Lighting. We sell lighting products to both OEMs and aftermarket customers. Other product families, such as bearings, tooling, electrical components and clamps, are more recent additions to our product line. |
Our product lines, which are deep and diverse, have an inventory valuation of approximately $1.4 billion.
We believe we offer best‑in‑class customer service, with over 60% of all orders shipped within 24 hours of order receipt. Among the core services we offer are:
|
· |
Sales and Technical Support. We routinely source alternate replacement parts, support part standardization, support our customers by avoiding stock outs, mitigating obsolete parts, actively defining and planning new products, locating suppliers who produce these engineered parts and increasing cost savings and operational and logistics readiness. |
|
· |
Delegated Inspection Authority. This service eliminates receiving inspection and reduces costs through lower record retention expenses, lower inspection expenses and less peer‑to‑peer engineering support and supplier oversight. Additionally, it allows for a better alignment of configuration and increases throughput. |
|
· |
Electronic Data Interchange (“EDI”). Reduces costs as it automatically places orders, processes documents, reduces lead times and stockholding and eliminates data entry errors. We offer two different systems, which are designed for specific customer types and/or their specific needs. |
|
· |
Symphony Direct Ship. Customers can place orders with us and then Symphony™, our proprietary inventory management system, routes these orders automatically to the appropriate supplier of these parts. The supplier will ship the parts directly to the customer by the date requested, eliminating a process queue and thus allowing for a database to be built over time. Products are stocked based on historical usage and forecasts. Through this process, we become the single point of contact for multiple approved suppliers to reduce our customers’ inventory and supplier base. Furthermore, we are able to offer a seamless order and billing process, while allowing full traceability of parts. |
|
· |
E‑Commerce. A new, state-of-the-art e-commerce site was launched in January 2015. This service provides our customers with real‑time connection to our systems and inventory, where they can cross‑reference part numbers and also see product price and availability. It also allows us to price based upon order quantity. E‑Commerce also provides customers with a customized solution and allows them to view usage reports for part planning and forecasting. |
Energy Services Group
We serve energy industry customers who focus on developing and producing oil and gas onshore in North America. We initiated our expansion in the U.S. onshore oil field services sector in August 2013 when we acquired seven oilfield service companies operating in all key oil and gas shale basins for an aggregate purchase price of $0.6 billion. We have integrated the operations of the seven acquisitions that comprise our current business and manage them both by service and product line offerings and by geographic markets. We offer a variety of services both individually and on a bundled basis as requested by our customers. Our E&P customers require numerous technical services and products on an “as needed” basis, including fishing (retrieval) services and equipment, wireline services, down-hole production services, pressure control, logging, pipe recovery and rental equipment to support these services. Much like the need for just‑in‑time delivery of consumables by ASG, ESG often is faced with just‑in‑time support requirements for our E&P customers that may be experiencing critical operating issues such as servicing an operating well under high pressures, or removing blockages during well drilling or production. As a result, our industry specialists (many with over 40 years of experience) are and may be on‑call (on a rotational basis) up to 24 hours a day, 7 days a week to meet our customers’ needs.
The market for services to support the drilling, completion and production of onshore oil and gas wells has expanded dramatically due to the technological advancements that allow for enhanced recovery from shale formations underlying much of the major onshore oil and gas reservoirs in the United States. This had led to growth in the market for the services we provide, culminating in record financial results for many oil field service providers in 2014.
9
However, the global production of oil and gas that year led to an imbalance of supply and demand that caused a rapid decline in commodity prices starting in late 2014 and continuing throughout 2015 and into the first half of 2016. These plummeting commodity prices resulted in record reductions in spending by our customers, which in turn severely impacted both volume and pricing of the services used by our customers. Capital budgets that had been scaled back by 40% or more in 2015 further declined another 50% or more during 2016. In response to this dramatic reduction in activity, companies across the oil field service industry implemented deep cuts in both personnel and operational capacity, and recorded billions of dollars in impairment charges. Notwithstanding these actions, there have been a high number of bankruptcies, reorganizations and liquidations, which along with these personnel reductions and the migration of workers away from the industry has substantially reduced oil field service capacity. These factors are expected to support a recovery in activity levels, as well as pricing of our services, once commodity prices recover sufficiently to increase activity levels of our oil and gas producing customers.
We have established a solid presence in all the major onshore oil and gas producing regions in the contiguous 48 states (other than California), including the Northeast (Marcellus and Utica Shales), Rocky Mountains (Williston, DJ and Piceance Basins), Southwest (Permian Basin and Eagle Ford) and Mid‑Continent regions in North America. We serve energy industry customers who focus on developing and producing oil and gas onshore in North America. We have integrated the operations of the seven acquisitions that comprise our current business and manage them by both service and product line offerings and by geographic markets. We provide high‑quality services and products (new and remanufactured after use and American Petroleum Institute (“API”) certified) to remote drilling sites using our manufacturing, certification, logistics and IT capabilities to properly prepare for deployment, store, locate and deliver our equipment and service teams, as needed, to support our customers’ drilling operations. We also have a growing in-house proprietary tool development team which is focused on designing innovative tools that will further differentiate our services and enhance the outcomes for our customers.
We offer a variety of complementary services, both individually and on a bundled basis, as requested by our customers. Our key service and product offerings include:
|
· |
Fishing Services and Tools: Our fishing tool business provides a range of specialized services and equipment that is utilized on a non-routine basis for both drilling and well services operations. When intervention is required at the well site, we provide solutions for our customers. When downhole problems develop and drilling or services operations or conditions require non-routine intervention, technicians intervene with specialized tools that are specifically suited to retrieve, or “fish,” and remove trapped equipment. This equipment may include overshots, spears, jarring equipment, internal and external cutters, Venturi tools, magnets and wash over equipment. In addition to our fishing services, we also provide drill‑out services to our clients consisting of downhole motors used to drill out frac plugs and sliding sleeves. |
|
· |
Wireline Services: Our wireline services are provided through mobile units that contain large spools of wire. This large spool of wire will spool and unspool, which in turn allows tools and equipment to be quickly conveyed in and out of a wellbore. These wireline units and personnel provide a variety of different downhole services. These services include composite frac plug pump downs, pipe recovery and perforation, as well as well evaluation and logging services. |
|
· |
Pressure Control: We offer a full line of pressure control services and rental equipment to assist our clients at the wellsite. When a client moves on a well to perform completion or production activities, they are required to have some means of containing the pressure of the wellbore. Through the use of frac stacks, pressure valves and blow out preventers properly sized for the operation, operators are able to contain any release of pressure from the wellbore. We provide a full line of hydraulic and manual equipment, as well as services to keep them in proper working condition. We service this equipment at our operations facilities to ensure our equipment performs at the wellsite. As part of this service, we also provide rental pipe, power swivels, reverse units and other equipment used to perform well service operations. |
|
· |
Completion Services: Onshore completion services include a variety of services and equipment related to the initial well stimulation, completion and production. These services include the placement and removal |
10
of flow control nipples and valves, completion packers, bridge plugs and composite flow through frac plugs, as well as a full line of downhole services tools to optimize oil and gas recovery. These tools and services coupled with our expertise assist our clients in performing operations to optimize oil and gas recovery. These services and equipment are utilized in both the completion of newly drilled wells and the completion of behind pipe reserves in wells which have been previously drilled but not completed. Downhole completion and production services utilize a wide range of tools consisting of packers, bridge plugs, wellbore clean out equipment and cementation equipment to provide services to the completion and work-over market. |
|
· |
Accommodations and Related Surface Rental Equipment: We provide a variety of mobile, customizable workforce accommodations and offices and associated rental equipment to our customers at their remote field locations to keep crews comfortable and dedicated to the job at hand. Our turnkey solutions can be designed for complex requirements, conditions and personnel. We provide a comprehensive range of value‑added offerings, including workforce housing and office systems, light towers, generators, pressure washers, pumps, forklifts, manlifts, transformers, satellite systems, water and sewer systems and waste management. Along with our product offerings, we provide on‑site customer service. |
|
· |
Center for Innovation: We have a dedicated team of engineers and product experts who work closely with our product line managers to develop new tools and adaptations to existing equipment that improve productivity and outcomes for our customers. During 2015 and 2016 our ESG innovation team developed 10 proprietary new tools and applied for 17 patents. We believe these proprietary tools provide differentiated service outcomes for our customers and help further develop the KLX “brand” as a market leader. |
|
· |
Remanufacturing Shop: Our operations facilities are positioned around the U.S. and allow our personnel to properly service, restore and test all pressure control equipment, valves, choke manifolds and closing units. By properly servicing and re-certifying our equipment, we can ensure our equipment works when it is deployed to a wellsite. In several of the operations facilities, we also offer machine shop services, which consist of CNC lathes, milling machines, spindle lathes and other machining equipment to rework and rectify damaged equipment and to design/build specialized fit‑for‑purpose tools. |
We believe that ESG offers services and products which create value for our customers by reducing their exposure to non‑productive time (“NPT”) during the drilling and production phases. We provide services and equipment that assist our customers with maintaining and increasing the permeability of the reservoir. We provide specialized experts and equipment to locate and remove blockages or lost equipment from the reservoir that impede drilling or production operations and a broad range of rental equipment to support the operations of our service personnel and our customers. We provide essentially all of our services and related rental equipment in all of our geo regions, providing consistency for our customers and the ability to manage our business on a best practices basis throughout the organization
Customers, Competition and Marketing
Aerospace Solutions Group
We market our aerospace fasteners and other consumables directly to suppliers to the commercial, business jet, military and defense airframe manufacturers, the airframe manufacturers, the airlines, aircraft leasing companies, MRO providers, domestic military depots, general aviation, and other distributors. We believe that our key competitive advantages are the breadth of our product offerings and our ability to deliver our products on a timely basis, combined with our core competencies in information management, purchasing and logistics management. Customers for our ASG segment include major commercial aircraft, business jet and military OEMs, aftermarket MRO providers and airlines. Approximately 53% of our ASG revenues in Fiscal 2016 were to customers in the Americas with 29% to customers in Europe and the balance to customers in Asia, the Pacific and the Middle East.
11
We believe the principal competitive factors in our industry include the ability to provide superior customer service and support, on‑time delivery, sufficient inventory availability, competitive pricing and an effective quality assurance program. Our competitors include both U.S. and foreign companies. Our principal competitors include AAA, Adept, Airbus, Alcoa/Arconic, Align, Aviall, Avic, Avio, Avnet, BASN, Boeing (corporate), Boeing Global Services, Champion, Fastenal, Heico, Jamaica Bearings, Pattonair, Precision Castparts, Satair, Wencor, and Wesco Aircraft.
As of January 31, 2017, we employed over 500 sales, marketing, product support and customer service personnel with an average of over 9 years of experience at our ASG segment.
Energy Services Group
ESG provides services and products and competes in a variety of distinct sub‑segments with a number of competitors. Substantially all of our ESG customers are engaged in the energy industry. Most of our sales are to regional or independent oil companies and these sales have resulted in a diversified and geographically balanced portfolio of more than 600 customers within North America. Revenues from ESG’s five largest customers collectively represented approximately 21% of ESG’s revenues in Fiscal 2016.
Our primary competitors are regional, which provide a more limited range of services and rental equipment and often have more limited financial resources to support their operations. With respect to certain of our services, we also compete with major, multinational companies, including Superior Energy Services, Schlumberger, Halliburton, Baker Hughes and Weatherford. Competition is based on a number of factors, including performance, safety, quality, reliability, service, price, response time and, increasingly, breadth of services and products.
ESG maintains both regional and product/services specialist sales teams. Although sales employees tend to be based locally in regions and field locations, we have established a corporate sales team to coordinate sales and marketing efforts with our key accounts. As of January 31, 2017, we had 17 corporate sales representatives and 48 regional sales representatives with an average of over 15 years of experience.
Suppliers and Procurement
Aerospace Solutions Group
We do not believe we are dependent on any single supplier for our raw materials or specified and designed component parts and, based upon the existing arrangements with vendors, our current and anticipated requirements, we believe that we have made adequate provisions for acquiring raw materials.
We have assembled a number of focused procurement teams which effectively source our broad range of products.
|
· |
Planning/Forecasting. We plan and forecast to individual part number level for global demand, as well as forecast for each customer contract part number, utilizing customized software planning tools. |
|
· |
Commodity Procurement. We have specific commodity strategies with industry experts leading each team and key supplier partnership. |
|
· |
Program Procurement. We have a single supply chain point of contact for each major program coordinating supply, supplier health, forecasting gap buys and cost targets. |
|
· |
Advanced Sourcing. We have quick turnaround for customer demand on non‑stock items. If a customer has emergency requests such as an aircraft hold of service pending receipt of hardware, we will procure for immediate need. We also source new items and qualify alternative parts. |
12
Energy Services Group
We purchase a wide variety of materials, components and partially completed and finished products from manufacturers and suppliers for our use. We are not dependent on any single source of supply for those parts, supplies, materials or equipment.
Customer Service
Aerospace Solutions Group
We believe that our customers place a very high value on customer service, on‑time delivery and product support and that the level of customer service we provide is a critical differentiating factor in our industry. Our ASG segment brings the resources of an integrated global network, real‑time inventory systems and one‑on‑one personal attention to our customer relationships everywhere in the world. The key elements of such service include:
|
· |
on‑time delivery; |
|
· |
immediate availability of spare parts for a broad range of products; and |
|
· |
prompt attention to customer needs, including unanticipated problems and on‑site customer training. |
Customer service is particularly important to the airlines due to the high costs associated with incorrect or late deliveries.
Energy Services Group
We are highly differentiated in each of the geographic markets that we serve with our services and associated product offerings. This is achieved by providing targeted, complementary services and related products and being responsive to our customers with both quality, as measured by the industry-standard NPT, and timely response to any request. The key elements include:
|
· |
24/7 operations; |
|
· |
recognized industry leading technicians in our principal service and product lines; |
|
· |
responsiveness to our customers’ requirements for ready‑to‑deploy API certified equipment and a “can do” philosophy; |
|
· |
technical interface with customers via product line management personnel; and |
|
· |
client intimacy. |
Warranty Product Liability, Insurance
Aerospace Solutions Group
We warrant our ASG products, or specific components thereof, for periods ranging from one to three years, depending on product and component type. We receive appropriate product warranties and certifications from the manufacturer, and in the event of a defective part, we look to the manufacturer for reimbursement. Historically, warranty costs have not been material at ASG.
13
Energy Services Group
The use of certain of our ESG rental equipment or the provision of technical services in connection therewith could involve operational risk and thereby expose us to liabilities. An accident involving our services or equipment, or the failure of a product, could result in personal injury, loss of life and damage to property, equipment or the environment. Damages from a catastrophic occurrence, such as a fire or explosion, could result in substantial claims for damages. We generally attempt to negotiate the terms of our MSAs consistent with industry practice. In general, we attempt to take responsibility for our own personnel and property, while our customers, such as the E&P companies and well operators, take responsibility for their own personnel, property and all liabilities arising from well and subsurface operations.
We maintain a risk management program that covers operating hazards, including product liability, property damage and personal injury claims as well as certain limited environmental claims. Our risk management program includes primary and excess umbrella liability policies of $77 million per occurrence, including sudden and accidental pollution claims. We believe that our insurance is sufficient to cover product liability claims.
Information Technology
Aerospace Solutions Group
We have invested over $100 million in proprietary IT systems within our ASG business. Our IT systems provide a powerful, highly distributed computing environment that enables us to quickly scale on demand as business dictates. Some of the benefits of our IT platform to our customers include services such as:
|
· |
Planning and Forecasting |
|
· |
Customized System/Database |
|
· |
Supplier and Customer Portals |
|
· |
EDI |
|
· |
E‑Commerce |
|
· |
Support of Value‑Added Services |
Our information technology infrastructure is based on a proprietary application that has been highly customized for our aerospace consumables management business over the last 15 years. Our IT systems support our order‑to‑cash, procure‑to‑pay, warehouse management and accounting processes on a global basis. Our key proprietary IT application interfaces with our customized proprietary applications together with leading specialty software packages such as JDA (Demand Planning), Sterling (EDI) and Oracle (Business Intelligence, Financial Consolidations and Financial Reporting). We utilize a Microsoft-based enterprise resource planning (“ERP”) system to support our ASG, ESG and Corporate activities.
We also employ virtualization technology to increase system availability, reduce hardware and maintenance costs and respond efficiently to market dynamics. Our systems are largely hosted on Microsoft “Cloud” platforms as well as a stand-alone data services infrastructure which runs 24/7 and is protected by network security technologies, an uninterrupted power supply and a backup generator. Remote access to our systems is provided via separate, high speed connections.
14
Energy Services Group
We have successfully integrated our acquisitions onto a single financial accounting platform using the aforementioned ERP system together with an industry leading rental asset management software “TrakQuip”. These IT systems provide us with a scalable integrated platform that facilitates highly efficient operations, consolidated invoicing and optimal equipment utilization on both a site and segment basis. Our operating strategy is based upon balancing high asset and personnel utilization levels with consistently superior customer service. As such, our IT systems are integral to effectively managing our business.
Government Regulation and Environmental Matters
Aerospace Solutions Group
Governmental agencies throughout the world, including the Federal Aviation Administration (the “FAA”), prescribe standards for aircraft components, including virtually all commercial airline and general aviation products, as well as regulations regarding the repair and overhaul of airframes, equipment and engines. Specific regulations vary from country to country, although compliance with FAA requirements generally satisfies regulatory requirements in other countries. In addition, the products we distribute must also be certified by aircraft and engine OEMs. If any of the material authorizations or approvals that allow us to supply products are revoked or suspended, then the sale of the related products would be prohibited by law, which would have an adverse effect on our business, financial condition and results of operations.
From time to time, the FAA or equivalent regulatory agencies in other countries propose new regulations or changes to existing regulations, which are usually more stringent than existing regulations. If these proposed regulations are adopted and enacted, we could incur significant additional costs to achieve compliance, which could have a material adverse effect on our business, financial condition and results of operations.
We are also subject to other government rules and regulations that include the U.S. Foreign Corrupt Practices Act of 1977 (“FCPA”), as amended, the UK Bribery Act of 2010 (“UK Bribery Act”), the International Traffic in Arms Regulations (“ITAR”), the Export Administration Regulations (“EAR”), sanctions regulations administered by the U.S. Department of Treasury’s Office of Foreign Assets Control (“OFAC regulations”) the False Claims Act and the European Union’s Registration, Evaluation and Authorization of Chemicals (“REACH”).
Energy Services Group
Our ESG operations are subject to extensive and changing federal, state and local laws and regulations establishing health, safety and environmental quality standards, including those governing discharges of pollutants into the air and water and the management and disposal of hazardous substances and wastes. We may be subject to liabilities or penalties for violations of those regulations. We are also subject to laws and regulations, such as the Federal Superfund Law and similar state statutes, governing remediation of contamination which could occur or might have occurred at facilities that we own or operate, or which we formerly owned or operated, or to which we send or have sent hazardous substances or wastes for treatment, recycling or disposal. We believe that we are currently compliant, in all material respects, with applicable environmental laws and regulations. However, we could become subject to future liabilities or obligations as a result of new or more stringent interpretations of existing laws and regulations. In addition, we may have liabilities or obligations in the future if we discover any environmental contamination or liability relating to our facilities or operations.
Employees
As of January 31, 2017, we had approximately 2,800 employees. As of January 31, 2017, our ASG segment had approximately 2,000 employees. Approximately 58% of ASG’s employees are engaged in distribution, operations, quality and purchasing, 29% in sales, marketing and product support and 13% in finance, human resources, IT and general administration. As of January 31, 2017, our ESG segment had approximately 800 employees. This represents a reduction of approximately 800 employees, or approximately 50% of our ESG workforce, from peak levels in 2014 in
15
order to align our capacity and associated labor costs with current business conditions. Approximately 77% of ESG’s employees are engaged in operations, quality and purchasing, 9% in sales, marketing and product support and 14% in finance, human resources, IT and general administration. Our employees are not unionized, and we consider our employee relations to be good.
Available Information
Our filings with the SEC, including this Form 10-K, our Quarterly Reports on Form 10-Q, our Proxy Statement, Current Reports on Form 8-K and amendments to any of those reports are available free of charge on our website, http://www.klx.com, as soon as reasonably practicable after they are filed with, or furnished to, the SEC. These reports may also be obtained at the SEC’s public reference room at 100F Street, N.E., Washington, DC 20549. The SEC also maintains a website at www.sec.gov that contains reports, proxy statements, information statements, and other information regarding SEC registrants, including KLX Inc. Information included in or connected to our website is not incorporated by reference in this annual report.
You should carefully consider each of the following risks and uncertainties, which we believe are the principal risks that we face and of which we are currently aware, and all of the other information in this Form 10‑K. Some of the risks and uncertainties described below relate to our business, while others relate to the spin‑off. Other risks relate principally to the securities markets and ownership of our common stock.
If any of the following events actually occur, our business, financial condition or financial results could be materially adversely affected, the trading price of our common stock could decline and you could lose all or part of your investment. Additional risks and uncertainties that we do not presently know about or currently believe are not material may also adversely affect our business and operations.
Risks Relating to Our Business
Risks Relating to the Aerospace Solutions Business
We sell products to the airline industry, which is a heavily regulated industry, and the ASG business may be adversely affected if our suppliers or customers lose government approvals, if more stringent government regulations are enacted or if industry oversight is increased.
The FAA prescribes standards and licensing requirements for aircraft components, including virtually all commercial airline and general aviation cabin interior products, and licenses component repair stations within the United States. Comparable agencies, such as the European Aviation Safety Agency, the Civil Aviation Administration of China and the Japanese Civil Aviation Board, regulate these matters in other countries. Our suppliers and customers must generally be certified by such governmental agencies. If any of our suppliers’ government certifications are revoked, we would be less likely to buy such supplier’s products and, as a result, would need to locate a suitable alternate supply of such products, which we may be unable to accomplish on commercially reasonable terms or at all. If any of our customers’ government certifications are revoked, their demand for the products we sell would decline. In each case, ASG’s results of operations and financial condition may be adversely affected.
From time to time, these regulatory agencies propose new regulations or heighten industry oversight. These new regulations generally cause an increase in costs of our suppliers and customers to comply with these regulations. In the case of our suppliers, these expenses may be passed on to us in the form of price increases, which we may be unable to pass along to our customers. In the case of our customers, these expenses may limit their ability to purchase products from us. In addition, the Trump administration has called for substantial change to fiscal and tax policies, which may include border tariffs and new trade deals, which could have significant effects on our customers and, in turn, on our suppliers, which may impact our business. In each case, ASG’s results of operations and financial condition may be adversely affected.
16
We are directly dependent upon the conditions in the airline, business jet and defense industries and an economic downturn could negatively impact our results of operations and financial condition.
We are directly dependent upon the airline and business jet industries, which are each sensitive to changes in global economic conditions. The airline industry is highly cyclical and the level of demand for air travel is correlated to the strength of the U.S. and global economies. Stagnant or weakening global economic conditions either in the United States or in other geographic regions, as we are currently experiencing, may have a material adverse effect on our business. Past periods of unfavorable economic conditions caused a reduction in spending for both leisure and business travel, resulting in the airline industry parking aircraft, delaying new aircraft purchases and deliveries, deferring retrofit programs and depleting existing inventories. The business jet industry is also severely impacted by both a weaker economy and by declining corporate profits. According to IATA, the economic downturn in 2008 and 2009, combined with the high fuel prices experienced during most of 2009, contributed to the worldwide airline industry’s loss of approximately $4.6 billion in 2009. In recent times, global financial markets have experienced volatility and disruption, in part due to the collapse in oil prices and the subsequent impact on emerging markets. Concerns over the tightening of the corporate credit markets, inflation, energy costs, the effect of the new U.S. presidential administration and other factors may continue to contribute to volatility in the global financial markets and may create further uncertainties for global economic conditions in the future. Furthermore, the environment in which the airline and business jet industries operate could continue to be affected by adverse foreign exchange impacts, fluctuating fuel prices, consolidation in the industry, changes in regulation, terrorism, safety, environmental, health concerns such as the Zika virus and labor issues. Many of these factors have, and could continue to have, a negative impact on air travel, which could materially adversely affect our business, results of operations, financial condition and cash flows.
Our business is also affected by risks that uniquely impact the airline and business jet industries. For instance, potential terrorist attacks, geopolitical conflict or security breaches, or fear of such events, even if not made directly on or involving the airline industry have, and could continue to have, a negative effect on the airline industry and as a result, our business as well. The global airline industry lost a total of approximately $52.8 billion during the period from 2001 to 2009 as a result of the decline in traffic and airfares caused by, among other things, the September 11, 2001 terrorist attacks, the SARS and H1N1 outbreaks, the conflicts in Iraq and Afghanistan, increases in fuel costs and heightened competition from low-cost carriers. During this period, a significant number of airlines worldwide declared bankruptcy or ceased operations. Any of these factors could potentially impact the airline and business jet industries in the future, and subsequently, materially adversely affect our business, results of operations, financial condition and cash flows.
Military spending, including spending on the products we sell, is dependent upon national defense budgets, and a reduction in military spending could have a material adverse effect on our business, financial condition and results of operations.
The military market is highly dependent upon government budgetary trends, particularly the U.S. Department of Defense (“DoD”) budget. Future DoD budgets could be negatively impacted by several factors, including, but not limited to, a change in defense spending policy by the current and future presidential administrations and Congress, including pursuant to mandated spending reductions under the so‑called “sequestration” process, the U.S. government’s budget deficits, spending priorities, the cost of sustaining the U.S. military presence in overseas operations and possible political pressure to reduce U.S. government military spending, each of which could cause the DoD budget to decline.
A decline in U.S. military expenditures could result in a reduction in military aircraft production or a reduction in spending at U.S. land-based military depots, both of which could have a material adverse effect on our results of operations and financial condition.
We may be materially adversely affected by fluctuating jet fuel prices.
Fluctuations in the global supply of crude oil and the possibility of changes in government policy on jet fuel production, transportation and marketing make it difficult to predict the future availability and price, volatility and cost of jet fuel. In the event of a natural disaster, changes in fuel-related governmental policy, changes in access to petroleum product pipelines and terminals, speculation in energy futures markets, changes in aircraft fuel production capacity, environmental concerns, political disruptions, outbreaks or escalations of hostilities or other conflicts or significant
17
disruptions in oil production or delivery in oil‑producing areas or elsewhere, there could be reductions in the production or importation of crude oil and significant increases in the cost of jet fuel. If there were major reductions in the availability of jet fuel or significant increases in its cost, commercial airlines will face increased operating costs. Due to the competitive nature of the airline industry, airlines are often unable to pass on future increases in fuel prices directly to customers by increasing fares. As a result, an increase in the price of jet fuel could result in a decrease in net income from either lower margins or, if airlines increase ticket fares, lower revenue resulting from reduced airline travel. Decreases in airline profitability could decrease the demand for new commercial aircraft, resulting in delays to or reductions in deliveries of commercial aircraft that utilize the products we sell, and, as a result, although rising oil and gas prices may benefit our ESG segment, ASG’s financial condition, results of operations and cash flows could be materially adversely affected.
We and our ASG customers are subject to federal, state, local and foreign laws and regulations regarding issues of health, safety, climate change and the protection of the environment, under which we or our ASG customers may become liable for penalties, damages or costs of remediation or other corrective measures. Changes in such laws or regulations could increase our or our ASG customers’ costs of doing business and adversely impact our business.
Our operations and our ASG customers’ operations are subject to stringent federal, state, local and foreign laws and regulations, including those relating to, among other things, natural resources, wetlands, endangered species, the environment, health and safety, waste management, waste disposal and the transportation of waste and other materials. Some environmental laws and regulations may impose strict liability, joint and several liability or both. Increased costs of regulatory compliance, claims for liability or sanctions for noncompliance and related costs could cause us or our ASG customers to incur substantial costs or losses. Clean‑up costs and other damages resulting from any contamination‑related liabilities and costs associated with changes in and compliance with environmental laws and regulations could result in the reduction or discontinuation of our or our ASG customers’ operations and in a material adverse effect on our financial condition and results of operations.
We have established policies and procedures designed to assist us and our personnel to comply with REACH. However, there can be no assurance that our policies and procedures will effectively prevent us from violating these regulations in every transaction in which we may engage, and such a violation could adversely affect our reputation, business, financial condition and results of operations.
Laws protecting the environment generally have become more stringent over time and we expect them to continue to do so, which could lead to material increases in our and our ASG customers’ costs for future environmental compliance and remediation.
Demand for ASG’s products and services is closely tied to the aerospace industry, which may exhibit pronounced cyclicality.
Demand for the products and services ASG offers is tied to the cyclical nature of the aerospace industry. During periods of economic expansion, when capital spending normally increases, we generally benefit from greater demand for our products. During periods of economic contraction, when capital spending normally decreases, we generally are adversely affected by declining demand for our products and services. Aerospace industry conditions are impacted by numerous factors over which we have no control, including political, regulatory, economic and military conditions, environmental concerns, weather conditions and fuel pricing. Any prolonged cyclical downturn could have an adverse impact on ASG’s operating results.
There are risks inherent in international operations that could have a material adverse effect on ASG’s business operations.
While the majority of ASG’s operations are based domestically, we have significant operations based internationally with distribution facilities in the United Kingdom, Germany and France. In addition, we sell our products to airlines all over the world. Our customers are located primarily in North America, Europe, Asia, the Pacific Rim, South America and the Middle East. As a result, approximately 47% of ASG’s revenues for the year ended January 31,
18
2017 were to customers located outside the United States. Volatile international economic, political and market conditions may have a negative impact on our operating results and our ability to achieve our goals.
In addition, we have several subsidiaries in foreign countries (primarily in Europe), which have sales outside the United States. As a result, we are exposed to currency exchange rate fluctuations as a portion of our revenues and expenses are denominated in currencies other than the U.S. dollar. Approximately 5% of ASG’s revenues during the year ended January 31, 2017 came from our foreign operations. Fluctuations in the value of foreign currencies affect the dollar value of our net investment in foreign subsidiaries, with these fluctuations being included in a separate component of stockholders’ equity. At January 31, 2017, we reported a cumulative foreign currency translation adjustment of approximately ($83.5) million in stockholders’ equity as a result of foreign currency adjustments, and we may incur additional adjustments in future periods. In addition, operating results of foreign subsidiaries are translated into U.S. dollars for purposes of our statement of earnings and comprehensive income at average monthly exchange rates. Moreover, to the extent that our revenues are not denominated in the same currency as our expenses, our net earnings could be materially adversely affected. For example, a portion of labor, material and overhead costs for our distribution facilities in the United Kingdom and Germany are incurred in British pounds or Euros but the related sales revenues may be denominated in U.S. dollars. Changes in the value of the U.S. dollar or other currencies could result in material fluctuations in foreign currency translation amounts or the U.S. dollar value of transactions and, as a result, our net earnings could be materially adversely affected.
Historically, we have not engaged in hedging transactions. However, we may engage in hedging transactions in the future to manage or reduce our foreign exchange risk. Our attempts to manage our foreign currency exchange risk may not be successful and, as a result, our results of operations and financial condition could be materially adversely affected.
Our foreign operations could also be subject to unexpected changes in regulatory requirements, tariffs and other market barriers and political, economic and social instability in the countries where we operate or sell our products and offer our services. The impact of any such events that may occur in the future could subject us to additional costs or loss of sales, which could materially adversely affect our operating results.
We are subject to a variety of risks associated with the sale of our products and services to the U.S. government directly and indirectly through our defense customers, which could negatively affect our revenues and results of operations.
As a supplier directly to the defense industry and as a subcontractor to suppliers of the U.S. government, we face risks that are specific to doing business with the U.S. government. The U.S. government has the ability to unilaterally suspend the award of new contracts to us in the event of any violations of procurement laws, or reviews of the same. It could also reduce the value of our existing contracts as well as audit our costs and fees. Many of our U.S. government contracts, or our customers’ contracts with the United States government, may be terminated for convenience by the government. Termination‑ for‑convenience provisions typically provide that we would recover only our incurred or committed costs, settlement expenses and profit on the work that we completed prior to termination. In such an event, we would not earn the revenue that we would have originally anticipated from such a terminated contract.
Government reviews can be costly and time consuming, and could divert our management resources away from running our business. As a result of such reviews, we could be required to provide a refund to the U.S. government or we could be asked to enter into an arrangement whereby our prices would be based on cost, or the U.S. government could seek to pursue alternative sources of supply for our products. These actions could have a negative effect on our management efficiency and could reduce our revenues and results of operations. Additionally, as a U.S. government contractor or subcontractor, we are subject to federal laws governing suppliers to the U.S. government, including potential application of the False Claims Act.
19
We do not have guaranteed future sales of the products we sell and we generally take the risk of cost overruns when we enter into JIT contracts and LTAs with our customers, and our business, financial condition, results of operations and operating margins may be negatively affected if we purchase more products than our customers require, product costs increase unexpectedly, we experience high start‑up costs on new contracts or our contracts are terminated.
Our JIT contracts and LTAs are long‑term, generally fixed‑price agreements with no guarantee of future customer purchase requirements, and may be terminated for convenience on short notice by our customers, often without meaningful penalties, provided that we are reimbursed for the cost of any inventory specifically procured for the customer. In addition, we purchase inventory based on our forecasts of anticipated future customer demand. As a result, we may take the risk of having excess inventory in the event that our customers do not place orders consistent with our forecasts. We also run the risk of not being able to pass along or otherwise recover unexpected increases in our product costs, including as a result of commodity price increases, which may increase above our established prices at the time we entered into the customer contract and established prices for parts we provide. When we are awarded new contracts, particularly JIT contracts, we may incur high costs, including salary and overtime costs to hire and train on‑site personnel, in the start‑up phase of our performance. In the event that we purchase more products than our customers require, product costs increase unexpectedly, we experience high start‑up costs on new contracts or our contracts are terminated, our results of operations and financial condition could be negatively affected.
Our international operations require us to comply with anti‑corruption laws and regulations of the U.S. government and various international jurisdictions, and our failure to comply with these laws and regulations could adversely affect our reputation, business, financial condition and results of operations.
Doing business on a worldwide basis requires us and our subsidiaries to comply with the laws and regulations of the U.S. government and various international jurisdictions, and our failure to successfully comply with these rules and regulations may expose us to liabilities. These laws and regulations apply to companies, individual directors, officers, employees and agents, and may restrict our operations, trade practices, investment decisions and partnering activities. In particular, our international operations are subject to U.S. and foreign anti‑corruption laws and regulations, such as the FCPA and the UK Bribery Act. The FCPA and UK Bribery Act generally prohibit us from providing anything of value to foreign officials for the purposes of influencing official decisions or obtaining or retaining business or otherwise obtaining favorable treatment, and requires companies to maintain adequate record‑keeping and internal accounting practices to accurately reflect the transactions of the company. As part of our business, we deal with state‑owned business enterprises, the employees and representatives of which may be considered foreign officials for purposes of the FCPA. The UK Bribery Act also prohibits commercial bribery. In addition, some of the international locations in which we operate lack a developed legal system and have elevated levels of corruption. As a result of the above activities, we are exposed to the risk of violating anti‑corruption laws.
We are also subject to U.S. and foreign export controls and sanctions laws and regulations, including the ITAR, the EAR and OFAC regulations. The ITAR generally requires export licenses from the U.S. Department of State for goods, technical data and services sent outside the United States that have military or strategic applications. The EAR regulates the export of certain “dual use” goods, software, and technologies, and in some cases requires export licenses from the U.S. Department of Commerce. OFAC regulations implement various sanctions programs that include prohibitions of restrictions on dealings with certain sanctioned countries, governments, entities and individuals. Violations of these legal requirements are punishable by criminal fines and imprisonment, civil penalties, disgorgement of profits, injunctions, debarment from government contracts as well as other remedial measures. We have established policies and procedures designed to assist us and our personnel to comply with applicable U.S. and international laws and regulations. However, there can be no assurance that our policies and procedures will effectively prevent us from violating these regulations in every transaction in which we may engage, and such a violation could adversely affect our reputation, business, financial condition and results of operations.
We are dependent on access to and the performance of third‑party package delivery companies.
Our ability to provide efficient distribution of the products we sell to our customers is an integral component of our overall business strategy. We do not maintain our own delivery networks, and instead rely on third‑party package delivery companies. We cannot assure you that we will always be able to ensure access to preferred delivery companies
20
or that these companies will continue to meet our needs or provide reasonable pricing terms. In addition, if the package delivery companies on which we rely on experience delays resulting from inclement weather or other disruptions, we may be unable to maintain products in inventory and deliver products to our customers on a timely basis, which may adversely affect our results of operations and financial condition.
Risks Relating to the Energy Services Business
We serve customers who are involved in drilling for and production of oil and natural gas. Demand for services in the oil and natural gas industry is cyclical and is currently experiencing a significant downturn, which has significantly affected the performance of our ESG segment. Additional adverse developments affecting this industry could have a material adverse effect on our financial condition and results of operations.
Our revenues in the ESG segment are primarily generated from customers who are engaged in drilling for and production of oil and natural gas. Demand for services in the oil and natural gas industry is cyclical, and we depend on our customers’ willingness to make capital and operating expenditures to explore for, develop and produce oil and natural gas in the United States. Additionally, developments that adversely affect oil and natural gas drilling and production services could reduce our customers’ willingness to make such expenditures and materially reduce our customers’ demand for our services and associated product offerings, resulting in a material adverse effect on our results of operations and financial condition.
The predominant factor that would reduce demand for ESG services and associated product offerings would be a reduction in land‑based drilling activity in the continental United States. The oil and gas industry experienced a significant downturn commencing in late 2014 that continued through 2015 and 2016 during which time the number of domestic land drilling rigs decreased by over 75% and our customers significantly cut back their capital expenditures resulting in both volume and pricing declines for oil field services. Commodity prices, and market expectations of potential changes in these prices, significantly affected activity levels in 2016 as well as the rates paid for our services. Worldwide political, economic and military events as well as natural disasters and other factors beyond our control contribute to oil and natural gas price levels and volatility and are likely to continue to do so in the future. Current levels in the price of natural gas, oil or natural gas liquids, as well as ongoing volatility, have had an adverse impact on the level of drilling, exploration and production activity, which could materially and adversely affect the demand for our services and the rates we are able to charge for our services in our ESG segment, although declines in the price of jet fuel may benefit our ASG segment. We negotiate the rates payable under our contracts based on prevailing market rates and rate books which are periodically updated and, as such, the rates we are able to charge will fluctuate with market conditions. However, higher commodity prices may not necessarily translate into increased drilling activity because our customers’ expectations of future prices also influence their activity. Lower demand for oilfield services could continue, which would adversely affect the rates that we are able to charge, and the demand for our services. Additionally, we may incur costs and have downtime any time our customers’ activities are refocused towards different drilling regions.
The domestic E&P industry in the United States underwent a substantial downturn in 2015 and much of 2016 with the beginning of a potential recovery commencing late in the third quarter of 2016 is placing unprecedented pressure on both our customers and competitors. We have reduced costs within our ESG business without compromising the business platform we have built. This includes a significant reduction in capital expenditures in 2016, as well as other workforce rightsizing and ongoing cost initiatives.
Another factor that would reduce the level of drilling and production activity is increased government regulation of that activity. Our customers’ drilling and production operations are subject to extensive federal, state, local and foreign laws and government regulations concerning: emissions of pollutants and greenhouse gases; hydraulic fracturing; the handling of oil and natural gas and byproducts thereof and other materials and substances used in connection with oil and natural gas operations, including drilling fluids and wastewater; well spacing; production limitations; plugging and abandonment of wells; unitization and pooling of properties; and taxation. More stringent legislation or regulation (including public pressure on governmental bodies and regulatory agencies to regulate the oil and natural gas industry), a moratorium on drilling or hydraulic fracturing, or increased taxation of oil and natural gas drilling activity could directly curtail such activity or increase the cost of drilling, resulting in reduced levels of drilling activity and therefore reduced demand for our ESG services and associated product offerings.
21
Spending by E&P companies can also be impacted by conditions in the capital markets. Limitations on the availability of capital, or higher costs of capital, for financing expenditures may cause E&P companies to make additional reductions to capital budgets in the future. Any cuts in capital spending would likely curtail drilling and completion programs as well as discretionary spending on wellsite services, which may result in a reduction in the demand for our services, the rates we can charge and the utilization of our services. Moreover, reduced discovery rates of new oil and natural gas reserves, or a decrease in the development rate of reserves in our market areas, whether due to increased governmental regulation, including with respect to environmental matters, limitations on exploration and drilling activity or other factors, could also have an impact on our business, even in a stronger oil and natural gas price environment. An adverse development in any of these areas could have an adverse impact on our customers’ operations or financial condition, which could in turn result in reduced demand for our services and associated product offerings.
Other factors over which we have no control that could affect our customers’ willingness to undertake drilling and completion spending activities include:
|
· |
domestic and foreign supply of and demand for oil and natural gas; |
|
· |
the availability, pricing and perceived safety of pipeline, trucking, train storage and other transportation capacity; |
|
· |
lead times associated with acquiring equipment and availability of qualified personnel; |
|
· |
the expected rates of decline in production from existing and prospective wells; |
|
· |
the discovery rates of new oil and natural gas reserves; |
|
· |
adverse weather conditions, including hurricanes and tornadoes, that can affect oil and natural gas operations over a wide area; |
|
· |
oil refining capacity; |
|
· |
merger and divestiture activity among oil and gas producers; |
|
· |
the availability of water resources and suitable proppants in sufficient quantities and on acceptable terms for use in hydraulic fracturing operations; |
|
· |
the availability, capacity and cost of disposal and recycling services for used hydraulic fracturing fluids; |
|
· |
the political environment in oil and natural gas producing regions, including uncertainty or instability resulting from civil disorder, terrorism or war; |
|
· |
advances in exploration, development and production technologies or in technologies affecting energy consumption; and |
|
· |
the price and availability of alternative fuels and energy sources. |
Any future changes in the rate at which oil or natural gas reserves are discovered or developed could decrease the demand for our energy services.
Reduced discovery rates of new oil and natural gas reserves, or a decrease in the development rate of reserves, in our market areas, whether due to increased governmental regulation, limitations on exploration and drilling activity or other factors, could have a material adverse impact on our financial condition and results of operations even in a stronger oil and natural gas price environment.
22
Conservation measures and technological advances could reduce demand for oil and natural gas.
Fuel conservation measures, alternative fuel requirements, increasing consumer demand for alternatives to oil and natural gas, technological advances in fuel economy and energy generation devices could reduce demand for oil and natural gas. We cannot predict the impact of the changing demand for oil and natural gas services, and any major changes may have a material adverse effect on ESG’s results of operations and financial condition.
Delays by us or our ESG customers in obtaining permits or the inability by us or our ESG customers to obtain or renew permits could impair our business.
We and our ESG customers are required to obtain permits from one or more governmental agencies in order to perform certain activities. Such permits are typically required by state agencies but can also be required by federal and local governmental agencies. The requirements for such permits vary depending on the type of operations, including the location where our ESG customers’ drilling and completion activities will be conducted. As with all governmental permitting processes, there is a degree of uncertainty as to whether a permit will be granted, the time it will take for a permit to be issued and the conditions which may be imposed in connection with the granting of the permit. Certain regulatory authorities have delayed or suspended the issuance of permits while the potential environmental impacts associated with issuing such permits can be studied and appropriate mitigation measures evaluated. Permitting delays, an inability to obtain or renew permits or revocation of our or our ESG customers’ current permits could cause a loss of revenue and could materially and adversely affect our results of operations and financial condition.
Our ESG business involves many hazards and operational risks, and we are not insured against all the risks we face.
ESG’s operations are subject to many hazards and risks, including the following:
|
· |
accidents resulting in serious bodily injury and the loss of life or property; |
|
· |
liabilities from accidents or damage by our equipment; |
|
· |
pollution and other damage to the environment; |
|
· |
well blow‑outs, the uncontrolled flow of natural gas, oil or other well fluids into or through the environment, including onto or into the ground or into the atmosphere, groundwater, surface water or an underground formation; |
|
· |
fires and explosions; |
|
· |
mechanical or technological failures; |
|
· |
spillage handling and disposing of materials; |
|
· |
adverse weather conditions; and |
|
· |
failure of our employees to comply with our internal environmental, health and safety guidelines. |
If any of these hazards materialize, they could result in suspension of operations, termination of contracts without compensation, damage to or destruction of our equipment and the property of others, or injury or death to our personnel or third parties and could expose us to substantial liability or losses. The frequency and severity of such incidents will affect operating costs, insurability and relationships with customers, employees and regulators. In addition, these risks may be greater for us upon the acquisition of another company that has not allocated significant resources and management focus to safety and has a poor safety record.
23
We are not fully insured against all risks inherent in our business. For example, although we are insured for environmental pollution resulting from certain environmental accidents that occur on a sudden and accidental basis, we may not be insured against all environmental accidents or events that might occur, some of which may result in toxic tort claims. If a significant accident or event occurs for which we are not adequately insured, it could adversely affect our financial condition and results of operations. Furthermore, we may not be able to maintain or obtain insurance of the type and amount we desire at reasonable rates. As a result of market conditions, premiums and deductibles for certain of our insurance policies may substantially increase. In some instances, certain insurance could become unavailable or available only for reduced amounts of coverage.
Our ESG business has been and may continue to be adversely affected by a deterioration in general economic conditions or a weakening of the broader energy industry.
The oil and gas industry has historically been both cyclical and seasonal. Activity levels are driven primarily by drilling rig counts, well completions and workover activity, the geological characteristics of the producing wells and their effect on the services required to commence and maintain production levels, and our customers’ capital and operating budgets. All of these indicators are driven by commodity prices, which are affected by both domestic and global supply and demand factors. In particular, while U.S. natural gas prices are correlated with global oil price movements, they are also affected by local market weather and consumption patterns. A prolonged economic slowdown, another recession in the United States, adverse events relating to the energy industry and local, regional and national economic conditions and factors, particularly a slowdown in the E&P industry, would continue to negatively impact our ESG operations and therefore adversely affect our results. The risks associated with our business are more acute during periods of economic slowdown or recession because such periods may be accompanied by decreased spending by our customers.
Through our ESG segment, we participate in a capital‑intensive industry, and may need to obtain additional capital or financing to fund expansion of our asset base, which could increase our financial leverage, or we may not be able to finance our capital needs.
In order to expand our ESG asset base, we may need to make significant capital expenditures. If we do not make sufficient or effective capital expenditures, we will be unable to organically expand our business operations. These expenditures may be significant because assets in our industry require significant capital to purchase and modify.
We intend to rely primarily on cash flows from operating activities and borrowings under our $750 million secured revolving credit facility, and existing cash balances to fund our capital expenditures. If our cash, cash flows from operating activities and borrowings under the secured revolving credit facility are not sufficient to fund our capital expenditures, we would be required to fund these expenditures through the issuance of additional debt or equity or pursue alternative financing plans, such as refinancing or restructuring our debt, selling assets or reducing or delaying acquisitions or capital investments, such as planned upgrades or acquisitions of equipment and refurbishments of equipment, even if previously publicly announced.
The terms of any future debt instruments may restrict us from adopting some of these alternatives. If debt and equity capital or alternative financing plans are not available on favorable terms or at all, we would be required to curtail our capital spending, and our ability to sustain or improve our profits may be adversely affected. Our ability to refinance or restructure our debt will depend on the condition of the capital markets and our financial condition at such time, among other things. Any refinancing of our debt could be at higher interest rates and may require us to comply with more onerous covenants, which could further restrict our business operations. In addition, incurring additional debt may significantly increase our interest expense and financial leverage, and issuing common stock may result in significant dilution to our current stockholders.
Shortages or increases in the costs of the equipment we use in our operations, or the availability of experienced personnel to perform our services could adversely affect our operations in the future.
We generally do not have specialized tools, trucks or long‑term contracts in place that provide for the delivery of equipment, including, but not limited to, replacement parts and other equipment. We could experience delays in the
24
delivery of the equipment that we have ordered and its placement into service due to factors that are beyond our control. New federal regulations regarding diesel engines, demand by other oilfield services companies and numerous other factors beyond our control could adversely affect our ability to procure equipment that we have not yet ordered or cause the prices of such equipment to increase. Price increases, delays in delivery and interruptions in supply may require us to increase capital and repair expenditures and incur higher operating costs. Each of these could have a material adverse effect on our financial condition and results of operations.
We are dependent on a small number of suppliers for key goods and services that we use in our operations.
We do not have long term contracts with third party suppliers of many of the goods and services that we use in large volumes in our ESG operations, including manufacturers of accommodations units, rental and fishing tools, chargers and other tools and equipment used in our operations. Especially during periods in which oilfield services are in high demand, the availability of certain goods and services used in our industry decreases and the price of such goods and services increases. We are dependent on a small number of suppliers for key goods and services. During the twelve months ended January 31, 2017, based on total purchase cost, our ten largest suppliers of goods and services represented approximately 26% of all such purchases. Our reliance on such suppliers could increase the difficulty of obtaining such goods and services in the event of a shortage in our industry or cause us to pay higher prices. Price increases, delays in delivery and interruptions in supply may require us to incur higher operating costs. Each of these could have a material adverse effect on our results of operations and financial condition.
Our inability to develop, obtain or implement new technology may cause us to become less competitive.
The energy services industry is subject to the introduction of new drilling and completion techniques and services using new technologies, some of which may be subject to patent protection or costly to obtain. As competitors and others use or develop new technologies in the future, we may be placed at a competitive disadvantage if we fail to keep pace with technological advancements within our industry. Furthermore, we may face competitive pressure to implement or acquire certain new technologies at a substantial cost. Some of our competitors have greater financial, technical and personnel resources that may allow them to enjoy technological advantages and implement new technologies before we can. We cannot be certain that we will be able to implement new technologies or products on a timely basis or at an acceptable cost. Thus, limits on our ability to effectively use and implement new and emerging technologies may have a material adverse effect on our results of operations and financial condition.
Oilfield anti‑indemnity provisions enacted by many states may restrict or prohibit a party’s indemnification of us.
We typically enter into agreements with our ESG customers governing the provision of our services, which usually include certain indemnification provisions for losses resulting from operations. These agreements may require each party to indemnify the other against certain claims regardless of the negligence or other fault of the indemnified party; however, many states place limitations on contractual indemnity agreements, particularly agreements that indemnify a party against the consequences of its own negligence. Furthermore, certain states, including Louisiana, New Mexico, Texas and Wyoming, have enacted statutes generally referred to as “oilfield anti‑indemnity acts” expressly prohibiting certain indemnity agreements contained in or related to oilfield services agreements. Such oilfield anti‑indemnity acts may restrict or void a party’s indemnification of us, which could have a material adverse effect on our results of operations and financial condition.
Changes in trucking regulations may increase our transportation costs and negatively impact our results of operations.
For the transportation and relocation of our oilfield services equipment, we operate trucks and other heavy equipment. Therefore, we are subject to regulation as a motor carrier by the U.S. Department of Transportation and by various state agencies, whose regulations include certain permit requirements of highway and safety authorities. These regulatory authorities exercise broad powers over our trucking operations, generally governing such matters as the authorization to engage in motor carrier operations, safety, equipment testing and specifications and insurance requirements. The trucking industry is subject to possible regulatory and legislative changes that may impact our operations, such as changes in fuel emissions limits, the hours of service regulations that govern the amount of time a
25
driver may drive or work in any specific period, limits on vehicle weight and size and other matters. On May 21, 2010, President Obama signed an executive memorandum directing the National Highway Traffic Safety Administration (the “NHTSA”) and the U.S. Environmental Protection Agency (the “EPA”) to develop new, stricter fuel efficiency standards for medium‑ and heavy‑duty trucks. On September 15, 2011, the NHTSA and the EPA published regulations, further amended on August 16, 2013 that regulate fuel efficiency and greenhouse gas emissions from medium‑ and heavy‑duty trucks, beginning with vehicles built for model year 2014. As a result of these regulations, we may experience an increase in costs related to truck purchases or rentals and maintenance, an impairment of equipment productivity, a decrease in the residual value of these vehicles and an increase in operating expenses. Proposals to increase federal, state or local taxes, including taxes on motor fuels, are also made from time to time, and any such increase would increase our operating costs. We cannot predict whether, or in what form, any legislative or regulatory changes applicable to our trucking operations will be enacted and to what extent any such legislation or regulations could increase our costs or otherwise adversely affect our results of operations and financial condition.
Changes in laws or government regulations regarding hydraulic fracturing could increase our customers’ costs of doing business, limit the areas in which our customers can operate and reduce oil and natural gas production by our customers, which could adversely impact our business.
The adoption of any future federal, state or local laws or implementing regulations imposing reporting obligations on, or limiting or banning, the hydraulic fracturing process could make it more difficult to complete natural gas and oil wells and could have a material adverse impact on ESG’s results of operations and financial condition. Presently, hydraulic fracturing is regulated primarily at the state level, typically by state oil and natural gas commissions and similar agencies. Several states have either adopted or proposed laws and/or regulations to require oil and natural gas operators to disclose chemical ingredients and water volumes used to hydraulically fracture wells, in addition to more stringent well construction and monitoring requirements. The EPA is conducting a study of the potential impacts of hydraulic fracturing activities on drinking water. This study or other studies that may be undertaken by the EPA or other governmental authorities, depending on their results, could spur initiatives to regulate hydraulic fracturing. If new federal, state or local laws or regulations that significantly restrict hydraulic fracturing are adopted, such legal requirements could result in delays, eliminate certain drilling activities and make it more difficult or costly for our customers to perform fracturing. Any such regulations limiting or prohibiting hydraulic fracturing could reduce oil and natural gas exploration and production activities by our customers and, therefore, adversely affect our business. Such laws or regulations could also materially increase our costs of compliance and doing business by more strictly regulating how hydraulic fracturing wastes are handled or disposed.
We and our ESG customers are subject to federal, state and local laws and regulations regarding issues of health, safety, climate change and the protection of the environment, under which we or our customers may become liable for penalties, damages or costs of remediation or other corrective measures. Changes in such laws or regulations could increase our or our customers’ costs of doing business and adversely impact our business.
Our operations and our ESG customers’ operations are subject to stringent federal, state and local laws and regulations, including those relating to, among other things, protection of natural resources, wetlands, endangered species, the environment, health and safety, waste management, waste disposal and the transportation of waste and other materials. Many of the facilities that are used for our ESG operations are leased, and such leases include varying levels of indemnity obligations to the landlord for environmental matters related to our use and occupation of such facilities. Our ongoing operations and our ESG customers’ operations pose risks of environmental liability, including leakage from operations to surface or subsurface soils, surface water or groundwater. Some environmental laws and regulations may impose strict liability, joint and several liability, or both. Additionally, an increase in regulatory requirements on oil and gas exploration and completion activities could significantly delay or interrupt our ESG customers’ operations. Increased costs of regulatory compliance, claims for liability or sanctions for noncompliance and related costs could cause us or our ESG customers to incur substantial costs or losses. Clean‑up costs and other damages resulting from any contamination‑related liabilities and costs associated with changes in and compliance with environmental laws and regulations could result in the reduction or discontinuation of our or our ESG customers’ operations, and in a material adverse effect on our financial condition and results of operations.
26
The U.S. Congress has considered adopting legislation to reduce emissions of greenhouse gases (“GHGs”) and almost one‑half of the states have already taken legal measures to reduce emissions of GHGs. The EPA has begun adopting and implementing regulations to restrict emissions of GHGs under existing provisions of the Clean Air Act. Although it is not possible at this time to estimate how potential future laws or regulations addressing GHG emissions could impact our business, any future federal, state or local laws or regulations that may be adopted to address GHG emissions in areas where our customers operate could require our customers to incur increased compliance and operating costs. Regulation of GHGs could also result in a reduction in demand for and production of oil and natural gas, which would result in a decrease in demand for our services. Moreover, incentives to conserve energy or use alternative energy sources could reduce demand for oil and natural gas.
Laws protecting the environment generally have become more stringent over time and could continue to do so, which could lead to material increases in our and our ESG customers’ costs for future environmental compliance and remediation.
We may be required to assume responsibility for environmental and other liabilities of companies we have acquired or will acquire.
We may incur liabilities in connection with environmental conditions currently unknown to us relating to our existing, prior or future operations or those of predecessor companies whose liabilities we may have assumed or acquired. We also could be subject to third‑party and governmental claims with respect to environmental matters, including claims under the Comprehensive Environmental Response, Compensation and Liability Act in instances where we are identified as a potentially responsible party. We believe that indemnities provided to us in certain of our pre‑existing acquisition agreements may cover certain environmental conditions existing at the time of the acquisition, subject to certain terms, limitations and conditions. However, if these indemnification provisions terminate or if the indemnifying parties do not fulfill their indemnification obligations, we may be subject to liability with respect to the environmental matters that those indemnification provisions address.
Increased labor costs or the unavailability of skilled workers could hurt our operations.
We are dependent upon a pool of available skilled employees to operate and maintain our business. We compete with other oilfield services businesses and other similar employers to attract and retain qualified personnel with the technical skills and experience required to provide the highest quality service. The demand for skilled workers is high and the supply is limited, and a shortage in the labor pool of skilled workers or other general inflationary pressures or changes in applicable laws and regulations could make it more difficult for us to attract and retain personnel and could require us to enhance our wage and benefits packages thereby increasing our operating costs.
Although our employees are not covered by a collective bargaining agreement, union organizational efforts could occur and, if successful, could increase our labor costs. A significant increase in the wages paid by competing employers or the unionization of groups of our employees could result in increases in the wage rates that we must pay. Likewise, laws and regulations to which we are subject, such as the Fair Labor Standards Act, which governs such matters as minimum wage, overtime and other working conditions, can increase our labor costs or subject us to liabilities to our employees. We cannot assure you that labor costs will not increase. Increases in our labor costs or unavailability of skilled workers could impair our capacity and diminish our profitability, having a material adverse effect on our business, financial condition and results of operations.
General
We operate in highly competitive markets and our failure to compete effectively may negatively impact our results of operations.
The markets in which we operate are highly competitive. Since we sell our ASG segment products around the world, we face competition in the aerospace solutions market from both U.S. and non‑U.S. companies. We believe that the principal competitive factors in this industry include the ability to provide superior customer service and support, on‑time delivery, sufficient inventory availability, competitive pricing and an effective quality assurance program.
27
In terms of the energy services market, price competition, equipment availability, location and suitability, experience of the workforce, safety records, reputation, operating integrity and condition of the equipment are all factors used by customers in awarding contracts. Our competitors are numerous, and many have more financial and technological resources. Contracts are traditionally awarded on the basis of competitive bids or direct negotiations with customers. The competitive environment has intensified as recent mergers among E&P companies have reduced the number of available ESG customers. The fact that certain oilfield services equipment is mobile and can be moved from one market to another in response to market conditions heightens the competition in the industry. In addition, any increase in the supply of hydraulic fracturing fleets could have a material adverse impact on market prices. This increased supply could also require higher capital investment to keep our services competitive.
Some of our competitors may have greater financial, technical, marketing and personnel resources than we do. Our future success and profitability will partly depend upon our ability to keep pace with our customers’ demands for awarding contracts.
If we lose significant customers, significant customers materially reduce their purchase orders or significant programs on which we rely are delayed, scaled back or eliminated, our business, financial condition and results of operations may be adversely affected.
Our significant customers change from year to year, in the case of ASG, depending on the level of overhaul, maintenance, repair and refurbishment activity and the level of new aircraft purchases, and in the case of ESG, depending on the level of E&P activity and the use of our services. During Fiscal 2016, 2015 and 2014, no single customer accounted for more than 10% of our consolidated revenues. ASG’s top five customers for Fiscal 2016 together accounted for approximately 31% of its revenues. ESG’s top five customers for Fiscal 2016 together accounted for approximately 21% of its revenues.
A reduction in purchasing our products or services by or loss of one of our larger customers for any reason, such as changes in manufacturing or drilling practices, loss of a customer as a result of the acquisition of such customer by a purchaser who, in the case of ASG, does not fully utilize a distribution model, or who uses a competitor, in‑sourcing by customers, a transfer of business to a competitor, an economic downturn, insolvency of a customer, failure to adequately service our clients, decreased production or a strike, could have a material adverse effect on our financial condition and results of operations.
We may be unable to effectively and efficiently manage our inventories and/or our equipment fleet as we expand our business, which could have an adverse effect on our financial condition.
We have substantially expanded the size, scope and nature of our business through acquisitions and organic means, resulting in an increase in the breadth of our product offerings and an expansion of our business geographically. Business expansion places increasing demands on us to increase the inventories that we carry and/or our equipment fleet. We must anticipate demand well out into the future in order to service our extensive customer base. The inability to effectively and efficiently manage our inventories to meet current and future needs of our customers, which may vary widely from what is originally forecast due to a number of factors beyond our control, could have an adverse effect on our results of operations and financial condition.
If suppliers are unable to supply us with the products we sell in a timely manner, in adequate quantities and/or at a reasonable cost, we may be unable to meet the demands of our customers, which could have a material adverse effect on our business, financial condition and results of operations.
We depend on manufacturing firms to support our operations through the timely supply of products. Our suppliers may experience capacity constraints that may result in their inability to supply us with products in a timely fashion, with adequate quantities or at a desired price. Factors affecting the manufacturing sector can include labor disputes, general economic issues, and changes in raw material and energy costs. Natural disasters such as earthquakes or hurricanes, as well as political instability and terrorist activities, may negatively impact the production or delivery capabilities of our suppliers as well. These factors could lead to increased prices for our inventory, curtailment of supplies and the unfavorable allocation of product by our suppliers, which could reduce our revenues and profit margins
28
and harm our customer relations. Significant disruptions in our supply chain could negatively impact our results of operations and financial condition.
Increased leverage could adversely impact our business and results of operations.
We may incur additional debt under our $750 million secured revolving credit facility or otherwise to finance our operations or for future growth, including funding acquisitions. A high degree of leverage could have important consequences to us. For example, it could:
|
· |
increase our vulnerability to adverse economic and industry conditions; |
|
· |
require us to dedicate a substantial portion of cash from operations to the payment of debt service, thereby reducing the availability of cash to fund working capital, capital expenditures and other general corporate purposes; |
|
· |
limit our ability to obtain additional financing for working capital, capital expenditures, general corporate purposes or acquisitions; |
|
· |
place us at a disadvantage compared to our competitors that are less leveraged; and |
|
· |
limit our flexibility in planning for, or reacting to, changes in our business and in our industry. |
We cannot ensure that any future acquisitions will be successful in delivering expected performance post‑acquisition, which could have a material adverse effect on our financial condition.
Our business was created largely through a series of acquisitions. We regularly evaluate acquisition opportunities, frequently engage in acquisition discussions and conduct due diligence activities and, where appropriate, engage in acquisition negotiations, some of which could be material to us. Our ability to continue to achieve our goals may depend upon our ability to effectively identify attractive businesses, access financing sources on acceptable terms, negotiate favorable transaction terms and successfully consummate and integrate any businesses we acquire, achieve cost efficiencies and to manage these businesses as part of our company.
Our acquisition activities may involve unanticipated delays, costs and other problems. If we encounter unanticipated problems with one of our acquisitions, our senior management may be required to divert attention away from other aspects of our business. Additionally, we may fail to consummate proposed acquisitions or divestitures, after incurring expenses and devoting substantial resources, including management time, to such transactions. Acquisitions also pose the risk that we may be exposed to successor liability relating to actions by an acquired company and its management before the acquisition. The due diligence we conduct in connection with an acquisition, and any contractual guarantees or indemnities that we receive from the sellers of acquired companies, may not be sufficient to protect us from, or compensate us for, actual liabilities. Additionally, depending upon the acquisition opportunities available, we also may need to raise additional funds through the capital markets or arrange for additional bank financing in order to consummate such acquisitions or to fund capital expenditures necessary to integrate the acquired business. We also may not be able to raise the substantial capital required for acquisitions and integrations on satisfactory terms, if at all.
We may experience future impairment charges.
To conduct our global business operations and execute our strategy, we acquire tangible and intangible assets, which affect the amount of future period amortization expense and possible impairment expense that we may incur. The determination of the value of such intangible assets requires management to make estimates and assumptions that affect our consolidated and combined financial statements. As part of our strategy, we may make one or more acquisitions, which may result in the addition of duplicative assets, particularly inventories of certain parts. In the event such an acquisition results in the combined assets of our company and the acquired assets being in excess of any reasonable forecast of future need, the excess portion of the book value of these assets may be judged to be impaired. In accordance
29
with ASC 360, Property, Plant, and Equipment, we assess potential impairment to long-lived assets (property and equipment and amortized intangible assets) when there is evidence that events or changes in circumstances indicate that the carrying amount of an asset may not be recovered. Our judgment regarding the existence of impairment indicators and future cash flows related to intangible assets is based on operational performance of our acquired businesses, expected changes in the global economy, aerospace industry projections, discount rates and other judgmental factors. We would be required to record any such impairment losses resulting from any such test as a charge to operating results. To perform the annual assessment, we utilize a combination of income and market-based approaches to value the reporting units. The income approach to valuation relies on a discounted cash flow analysis to determine the fair value of each reporting unit, which considers forecasted cash flows discounted at an appropriate discount rate. The annual goodwill impairment test requires us to make a number of assumptions and estimates concerning future levels of revenue growth, operating margins and working capital requirements, which are based upon our long-term strategic plan. The discount rate is an estimate of the overall after-tax rate of return required by a market participant, whose weighted average cost of capital includes both equity and debt, including a risk premium. Any future impairment loss could have a material adverse impact on our results of operations. As of January 31, 2017, our management believes the estimated fair value of each of our reporting units with goodwill balances, our indefinite lived intangible assets and each of our long-lived assets were each in excess of their carrying values. There were no indicators of goodwill or intangible asset impairment at January 31, 2017.
Our total assets include substantial intangible assets. The write‑off of a significant portion of intangible assets would negatively affect our reported financial results.
Our total assets reflect substantial intangible assets. At January 31, 2017, goodwill and identified intangibles, net, represented approximately 35% of our total assets. Intangible assets consist principally of goodwill and other identified intangible assets associated with our acquisitions. On at least an annual basis, we assess whether there has been an impairment in the value of goodwill and other intangible assets with indefinite lives. If the carrying value of the tested asset exceeds its estimated fair value, impairment is deemed to have occurred. In this event, the amount is written down to fair value. Under generally accepted accounting principles in the United States, this would result in a charge to operating earnings. Any determination requiring the write‑off of a significant portion of goodwill or unamortized identified intangible assets would negatively affect our results of operations and total capitalization, which could be material. For example, during the year ended January 31, 2016, we recorded a non-cash goodwill and identified intangibles impairment charge of $488.2. There were no impairment charges recorded in Fiscal 2016, 2014 or 2013. As of January 31, 2017, the balances of goodwill and intangible assets were $996.4 million and $314.8 million, respectively.
Our debt instruments have significant financial and operating restrictions that may have an adverse effect on our operations.
We entered into certain financing arrangements in connection with the spin‑ off. Our ability to make payments on and refinance our indebtedness, including the debt incurred in connection with the spin‑off as well as any future debt that we may incur, will depend on our ability to generate cash in the future from operations, financings or asset sales. Our ability to generate cash is subject to general economic, financial, competitive, legislative, regulatory and other factors that we cannot control. The debt instruments governing such arrangements contain numerous financial, operating and/or negative covenants that limit our ability to incur additional or repay existing indebtedness, to create liens or other encumbrances, to make certain payments and investments, including dividend payments, to engage in transactions with affiliates, to engage in sale/leaseback transactions, to guarantee indebtedness and to sell or otherwise dispose of assets and merge or consolidate with other entities. Agreements governing future indebtedness could also contain significant financial and operating restrictions. If we cannot service our debt or repay or refinance our debt as it becomes due, we may be forced to sell assets or take other disadvantageous actions, including (1) reducing financing in the future for working capital, capital expenditures and general corporate purposes or (2) dedicating an unsustainable level of our cash flow from operations to the payment of principal and interest on our indebtedness. In addition, our ability to withstand competitive pressures and to react to changes in the aerospace consumables and oilfield services industries could be impaired. The lenders or other investors who hold debt that we fail to service or on which we otherwise default could also accelerate amounts due, which could potentially trigger a default or acceleration of our other debt. We may not have, or may not be able to obtain, sufficient funds to make any required accelerated payments.
30
Our operations rely on an extensive network of information technology resources and a failure to maintain, upgrade and protect such systems could adversely impact our business, financial condition and results of operations.
Information technology plays a crucial role in all of our operations. To remain competitive, our hardware, software and related services must interact with our suppliers and customers efficiently, record and process our financial transactions accurately, and obtain the data and information to enable the analysis of trends and plans and the execution of our strategies.
The failure or unavailability of our information technology systems could directly impact our ability to interact with our customers and provide them with products and services when needed. Such failure to properly supply or service our customers could have an adverse effect on our business, financial condition and results of operations. Moreover, our customer relationships could be damaged well beyond the period of the downtime of our information technology systems.
We may be unable to retain personnel who are key to our operations.
Our success, among other things, is dependent on our ability to attract, develop and retain highly qualified senior management and other key personnel. Competition for key personnel is intense, and our ability to attract and retain key personnel is dependent on a number of factors, including prevailing market conditions and compensation packages offered by companies competing for the same talent. The inability to hire, develop and retain these key employees may adversely affect our operations.
We have been expanding our available products and services, and our business may continue to grow at a rapid pace. Our inability to properly manage or support the growth may have a material adverse effect on our business, financial condition, and results of operations and could cause the market value of our common stock to decline.
We have been expanding our available products and services in recent periods and intend to continue to grow our business both through acquisitions and internal expansion of products and services. Our growth could place significant demands on our management team and our operational, administrative and financial resources. We may not be able to grow effectively or manage our growth successfully, and the failure to do so could have a material adverse effect on our business, financial condition and results of operations and could cause the market value of our common stock to decline.
Severe weather conditions, including hurricanes, tornadoes and tropical storms, could have a material adverse effect on our business.
Adverse weather can directly impede our operations. Repercussions of severe weather conditions may include: curtailment of services; weather‑related damage to facilities and equipment, resulting in suspension of operations; in the case of our ESG segment, inability to deliver equipment and personnel to job sites in accordance with customer requirements; in the case of our ASG segment, inability to deliver products to customers in accordance with contract schedules or critical next‑day customer requirements and loss of productivity. These constraints could delay our operations and materially increase our operating and capital costs. The operations of our ESG customers could also be adversely affected by severe weather, such as unusually warm winters or cool summers decreasing demand for natural gas or droughts in semi‑arid regions impacting hydraulic fracturing operations, which could affect the demand for services of our ESG segment.
Additionally, our operations are particularly susceptible to the impact of hurricanes, tornadoes and tropical storms, as our corporate headquarters and certain of our principal facilities are located in Florida and Texas. A hurricane or tropical storm could result in major damage to our properties, inventory and equipment and the properties of our customers located in such areas. Additionally, a hurricane or tropical storm could delay or disrupt the delivery of supplies to our facilities, which could lead to delays in delivering our products to our customers. Related storm damage could also affect telecommunications capability, causing interruptions to our operations. These and other possible effects of hurricanes or tropical storms could have a material adverse effect on our business.
31
Risks Relating to the Spin‑Off
We may not achieve some or all of the expected benefits of the spin‑off, and the spin‑off may adversely affect our business.
We may not be able to achieve the full strategic and financial benefits expected to result from the spin‑off, or such benefits may be delayed or not occur at all. Some of these expected benefits include having a simplified, more focused business better able to dedicate resources to pursue unique growth/opportunities and greater flexibility to invest capital in our business, increased strategic flexibility to make acquisitions and form partnerships and alliances in target markets. We may not achieve these and other anticipated benefits for a variety of reasons. There also can be no assurance that the spin‑off will not adversely affect our business.
If the distribution, together with certain related transactions, were to fail to qualify as a reorganization for U.S. federal income tax purposes under Sections 355 and 368(a)(1)(D) of the Code, then we and/or B/E Aerospace and our stockholders could be subject to significant tax liabilities.
B/E Aerospace did not request a private letter ruling from the IRS in respect of the distribution because in 2013 the IRS announced in public guidance that it generally will no longer issue private letter rulings to the effect that, for U.S. federal income tax purposes, a spin‑off transaction (similar to the distribution together with certain related transactions) will qualify as a reorganization under Sections 355 and 368(a)(1)(D) of the Code. The distribution was, however, conditioned upon, among other matters, B/E Aerospace’s receipt of an opinion of Shearman & Sterling LLP, which remained in full force and effect at the time of distribution, to the effect that the distribution, together with certain related transactions, qualified as a reorganization for U.S. federal income tax purposes under Sections 355 and 368(a)(1)(D) of the Code. Shearman & Sterling LLP’s opinion, which B/E Aerospace has received, relies on certain representations, assumptions, undertakings and covenants, and the conclusions set forth in the opinion may be adversely affected if one or more of the representations and assumptions is incorrect or one or more of the undertakings and covenants is not complied with. These representations, assumptions, undertakings and covenants relate to, among other things, B/E Aerospace’s business reasons for proceeding with the distribution, the past and future conduct of our businesses and those of B/E Aerospace, the historical ownership and capital structures of B/E Aerospace and our and B/E Aerospace’s current plans and intentions to not materially modify our or B/E Aerospace’s respective ownership and capital structures following the distribution. Notwithstanding the opinion, the IRS could determine that the distribution should be treated as a taxable transaction if it determines that any of the representations, assumptions, undertakings or covenants upon which the opinion relied is incorrect or has not been completed or complied with or if it disagrees with the conclusions in the tax opinion. For more information regarding the tax opinion, see the section entitled “The Spin‑ Off—Material U.S. Federal Income Tax Consequences of the Distribution” included elsewhere in this annual report.
Following the distribution, on October 23, 2016, B/E Aerospace agreed to be acquired by Rockwell Collins, Inc., and the acquisition subsequently closed on April 13, 2017 (the “B/E Acquisition”). In certain circumstances, the acquisition of a company that had distributed one or more subsidiaries in a spin-off, such as B/E Aerospace, can result in a prior spin-off transaction retroactively failing to qualify for tax free treatment. Shearman & Sterling LLP has rendered opinions, on which we are entitled to rely, that the B/E Acquisition will not cause the distribution to fail to qualify for tax free treatment. The opinions of Shearman & Sterling LLP are not binding on the IRS, and no ruling will be sought regarding the effect, if any, of the B/E Acquisition on the distribution.
If the distribution fails to qualify for tax‑free treatment, B/E Aerospace would be subject to tax on gain, if any, as if it had sold our common stock in a taxable sale for its fair market value at the time of the distribution. In addition, if the distribution fails to qualify for tax‑free treatment, each of our initial public stockholders would be treated as if the stockholder had received a distribution from B/E Aerospace in an amount equal to the fair market value of our common stock that was distributed to the stockholder, which generally would be taxed as a dividend to the extent of the stockholder’s pro rata share of B/E Aerospace’s current and accumulated earnings and profits and then treated as a non‑taxable return of capital to the extent of the stockholder’s basis in the B/E Aerospace common stock and finally as capital gain from the sale or exchange of B/E Aerospace common stock. Furthermore, even if the distribution were otherwise to qualify under Sections 355 and 368(a)(1)(D) of the Code, it may be taxable to B/E Aerospace (but not to B/E Aerospace’s stockholders) under Section 355(e) of the Code, if the distribution were later deemed to be part of a plan (or series of related transactions) pursuant to which one or more persons acquire, directly or indirectly, stock
32
representing a 50% or greater interest in B/E Aerospace or us. For this purpose, any acquisitions of B/E Aerospace stock or of our common stock within the period beginning two years before the distribution and ending two years after the distribution are presumed to be part of such a plan, although we or B/E Aerospace may be able to rebut that presumption, including through the use of certain safe harbors contained in U.S. Treasury Regulations under Section 355(e) of the Code.
Under the Tax Sharing and Indemnification Agreement between B/E Aerospace and us, we would generally be required to indemnify B/E Aerospace against any tax resulting from the distribution to the extent that such tax resulted from any of the following events (among others): (1) an acquisition of all or a portion of our stock or assets, whether by merger or otherwise, (2) any negotiations, understandings, agreements or arrangements with respect to transactions or events that cause the distribution to be treated as part of a plan pursuant to which one or more persons acquire, directly or indirectly, stock representing a 50% or greater interest in us, (3) certain other actions or failures to act by us, or (4) any breach by us of certain of our representations or covenants. Our indemnification obligations to B/E Aerospace and its subsidiaries, officers and directors are not limited by any maximum amount. If we are required to indemnify B/E Aerospace or such other persons under the circumstances set forth in the Tax Sharing and Indemnification Agreement, we could be subject to substantial liabilities.
We have a limited operating history as an independent company and our historical financial information may not be a reliable indicator of our future results.
The historical financial information for periods prior to the spin-off that we have included in this annual report has been derived from B/E Aerospace’s consolidated financial statements and accounting records and does not necessarily reflect what our financial position, results of operations and cash flows would have been had we been a separate, stand‑alone entity during the periods presented. B/E Aerospace did not account for us, and we were not operated, as a single stand‑alone entity for the periods presented. Actual costs that may have been incurred if we had been a stand‑alone company would depend on a number of factors, including the chosen organizational structure, what functions were outsourced or performed by employees and strategic decisions made in areas such as information technology and infrastructure. In addition, the historical information may not be indicative of what our results of operations, financial position and cash flows will be in the future. For example, following the spin‑off, changes have occurred in our cost structure, funding and operations, including changes in our tax structure and increased costs associated with becoming a public, stand‑alone company.
The spin‑off may expose us to potential liabilities arising out of state and federal fraudulent conveyance laws and legal dividend requirements.
The spin‑off is subject to review under various state and federal fraudulent conveyance laws. Fraudulent conveyance laws generally provide that an entity engages in a constructive fraudulent conveyance when (1) the entity transfers assets and does not receive fair consideration or reasonably equivalent value in return and (2) the entity (a) is insolvent at the time of the transfer or is rendered insolvent by the transfer, (b) has unreasonably small capital with which to carry on its business or (c) intends to incur or believes it will incur debts beyond its ability to repay its debts as they mature. An unpaid creditor or an entity acting on behalf of a creditor (including, without limitation, a trustee or debtor‑in‑possession in a bankruptcy by us or B/E Aerospace or any of our respective subsidiaries) may bring a lawsuit alleging that the spin‑off or any of the related transactions constituted a constructive fraudulent conveyance. If a court accepts these allegations, it could impose a number of remedies, including, without limitation, voiding our claims against B/E Aerospace, requiring our stockholders to return to B/E Aerospace some or all of the shares of our common stock issued in the spin‑ off or providing B/E Aerospace with a claim for money damages against us in an amount equal to the difference between the consideration received by B/E Aerospace and the fair market value of our company at the time of the spin‑ off.
The measure of insolvency for purposes of the fraudulent conveyance laws will vary depending on which jurisdiction’s law is applied. Generally, an entity would be considered insolvent if (1) the present fair saleable value of its assets is less than the amount of its liabilities (including contingent liabilities); (2) the present fair saleable value of its assets is less than its probable liabilities on its debts as such debts become absolute and matured; (3) it cannot pay its debts and other liabilities (including contingent liabilities and other commitments) as they mature; or (4) it has unreasonably small capital for the business in which it is engaged. We cannot assure you what standard a court would
33
apply to determine insolvency or that a court would determine that we, B/E Aerospace or any of our respective subsidiaries were solvent at the time of or after giving effect to the spin‑off.
The distribution of our common stock is also subject to review under state corporate distribution statutes. Under the General Corporation Law of the State of Delaware (the “DGCL”), a corporation may only pay dividends to its stockholders either (1) out of its surplus (net assets minus capital) or (2) if there is no such surplus, out of its net profits for the fiscal year in which the dividend is declared and/or the preceding fiscal year. Although B/E Aerospace intends to make the distribution of our common stock entirely from surplus, we cannot assure you that a court will not later determine that some or all of the distribution to B/E Aerospace stockholders was unlawful.
Although we believe that B/E Aerospace and KLX were each solvent at the time of the spin‑off (including immediately after the distribution of shares of KLX common stock), that we are able to repay our debts as they mature following the spin‑off and have sufficient capital to carry on our businesses and the spin‑off and the distribution was made entirely out of surplus in accordance with Section 170 of the DGCL, we cannot assure you that a court would reach the same conclusions in determining whether B/E Aerospace or we were insolvent at the time of, or after giving effect to, the spin‑off, or whether lawful funds were available for the separation and the distribution to B/E Aerospace’s stockholders.
A court could require that we assume responsibility for obligations allocated to B/E Aerospace under the Separation and Distribution Agreement.
Under the Separation and Distribution Agreement, from and after the spin‑ off, each of B/E Aerospace and we are responsible for the debts, liabilities and other obligations related to the business or businesses which it owns and operates following the consummation of the spin‑off. Although we do not expect to be liable for any obligations that are not allocated to us under the Separation and Distribution Agreement, a court could disregard the allocation agreed to between the parties, and require that we assume responsibility for obligations allocated to B/E Aerospace (including, for example, environmental liabilities), particularly if B/E Aerospace were to refuse or were unable to pay or perform the allocated obligations.
We might have been able to receive better terms from unaffiliated third parties than the terms we receive in our agreements with B/E Aerospace.
The agreements related to the spin‑off, including the Separation and Distribution Agreement, the Employee Matters Agreement, the Tax Sharing and Indemnification Agreement, the Transition Services Agreement, the IT Services Agreement and any other agreements, were negotiated in the context of our separation from B/E Aerospace while we were still part of B/E Aerospace. Although these agreements are intended to be on an arm’s‑length basis, they may not reflect terms that would have resulted from arm’s‑length negotiations among unaffiliated third parties. The terms of the agreements negotiated in the context of our separation concern, among other things, allocations of assets, liabilities, rights, indemnifications and other obligations among B/E Aerospace and us.
Certain of our executive officers and directors may have actual or potential conflicts of interest because of their current or former positions in B/E Aerospace or their ownership of equity in the parent of B/E Aerospace.
Certain of the persons who are our executive officers and directors are former directors, officers or employees of B/E Aerospace. Two of our directors serve on the board of directors of Rockwell Collins, Inc., the parent of B/E Aerospace, and our Chairman and Chief Executive Officer serves as a consultant to B/E Aerospace. In addition, several of our executive officers and directors have an indirect financial interest in B/E Aerospace as a result of their ownership of stock and restricted stock of Rockwell Collins, Inc. These relationships and financial interests may create, or may create the appearance of, conflicts of interest when these directors and officers face decisions that could have different implications for B/E Aerospace than for us.
34
Risks Relating to Our Common Stock
We cannot assure you that we will pay dividends on our common stock, and our indebtedness could limit our ability to pay dividends on our common stock.
We do not currently intend to pay dividends. Our dividend policy will be established by our Board based on our financial condition, results of operations and capital requirements, as well as applicable law, regulatory constraints, industry practice and other business considerations that our Board considers relevant. In addition, the terms of the agreements governing debt that we incurred in connection with the spin‑off or in the future may limit or prohibit the payments of dividends. We cannot assure you that we will pay dividends in the future or continue to pay any dividends if we do commence the payment of dividends.
Additionally, our indebtedness could have important consequences for holders of our common stock. If we cannot generate sufficient cash flow from operations to meet our debt‑payment obligations, then our Board’s ability to declare dividends on our common stock will be impaired and we may be required to attempt to restructure or refinance our debt, raise additional capital or take other actions such as selling assets, reducing or delaying capital expenditures or reducing any proposed dividends. We cannot assure you that we will be able to effect any such actions or do so on satisfactory terms, if at all, or that such actions would be permitted by the terms of our debt or our other credit and contractual arrangements.
Certain provisions that our amended and restated certificate of incorporation and amended and restated bylaws contain, certain provisions of Delaware law and our agreements with B/E Aerospace may prevent or delay an acquisition of our Company or other strategic transactions, which could decrease the trading price of our common stock.
Prior to the distribution date, our Board and B/E Aerospace, as our sole stockholder, approved and adopted amended and restated versions of our certificate of incorporation and bylaws. Our amended and restated certificate of incorporation and amended and restated bylaws contain, and Delaware law contains, provisions that are intended to deter coercive takeover practices and inadequate takeover bids by making such practices or bids unacceptably expensive to the bidder and to encourage prospective acquirers to negotiate with our Board rather than to attempt a hostile takeover. These provisions include, among others:
|
· |
the inability of our stockholders to call a special meeting; |
|
· |
rules regarding how stockholders may present proposals or nominate directors for election at annual meetings; |
|
· |
the division of our Board into three classes of directors, with each class serving a staggered three‑year term; |
|
· |
a provision that our stockholders may only remove directors with cause and by the affirmative vote of at least at least 662/3 percent of our voting stock; |
|
· |
the ability of our directors, and not stockholders, to fill vacancies on our Board; and |
|
· |
the requirement of the affirmative vote of stockholders holding at least 662/3 percent of our voting stock to amend our amended and restated bylaws and certain provisions in our amended and restated certificate of incorporation, including those provisions providing for a classified board, provisions regarding the filling of vacancies on the Board and provisions providing for the removal of directors. |
In addition, because we have not chosen to be exempt from Section 203 of the DGCL, this provision could also delay or prevent a change of control that some stockholders may favor. Section 203 provides that, subject to limited exceptions, persons that acquire, or are affiliated with a person that acquires, more than 15 percent of the outstanding voting stock of a Delaware corporation shall not engage in any business combination with that corporation, including by merger, consolidation or acquisitions of additional shares, for a three‑year period following the date on which that person or its affiliates becomes the holder of more than 15 percent of the corporation’s outstanding voting stock.
35
We believe these provisions will protect our stockholders from coercive or otherwise unfair takeover tactics by requiring potential acquirers to negotiate with our Board and by providing our Board with more time to assess any acquisition proposal. These provisions are not intended to make us immune from takeovers. However, these provisions will apply even if the offer may be considered beneficial by some stockholders and could delay or prevent an acquisition that our Board determines is not in the best interests of our Company and our stockholders. These provisions may also prevent or discourage attempts to remove and replace incumbent directors.
Provisions in our agreements with B/E Aerospace may also delay or prevent a merger or acquisition that some stockholders may consider favorable. To preserve the tax free treatment to B/E Aerospace of the distribution and certain related transactions, under the Tax Sharing and Indemnification Agreement that we have entered into with B/E Aerospace, we will be prohibited from taking or failing to take any action that results in the distribution and certain related transactions being deemed to not be tax‑free. Further, for the two‑year period following the distribution, we may be prohibited, except in specified circumstances, from: (1) entering into any transaction resulting in an acquisition of our stock or our assets beyond certain thresholds, whether by merger or otherwise; (2) merging, consolidating or liquidating; (3) issuing equity securities beyond certain thresholds; (4) repurchasing our common stock; and (5) ceasing to actively conduct our aerospace consumables and energy services businesses. These restrictions may limit our ability to pursue strategic transactions or engage in new business or other transactions that may maximize the value of our business.
ITEM 1B. UNRESOLVED STAFF COMMENTS
None.
36
As of January 31, 2017, we had 41 principal operating facilities, which comprise an aggregate of approximately 2.0 million square feet of space. The following table describes the principal facilities and indicates the location, function, approximate size and ownership type of each location.
|
City |
|
Segment |
|
Sq. Feet |
|
Ownership |
|
|
Doral, FL |
|
ASG |
|
504,200 |
|
Lease |
|
|
Kaltenkirchen, Germany |
|
ASG |
|
297,100 |
|
Lease |
|
|
Wichita, KS |
|
ASG |
|
80,000 |
|
Lease |
|
|
Hamburg, Germany |
|
ASG |
|
80,000 |
|
Lease |
|
|
Evans City, PA |
|
ESG |
|
70,600 |
|
Own |
|
|
Stratford, CT |
|
ASG |
|
67,000 |
|
Lease |
|
|
Fort Smith, AR |
|
ESG |
|
60,000 |
|
Lease |
|
|
Burgess Hill, UK |
|
ASG |
|
60,000 |
|
Lease |
|
|
Carson, CA |
|
ASG |
|
56,500 |
|
Lease |
|
|
Chandler, AZ |
|
ASG |
|
47,400 |
|
Lease |
|
|
Earth City, MO |
|
ASG |
|
47,000 |
|
Lease |
|
|
Grand Prairie, TX |
|
ASG |
|
38,900 |
|
Lease |
|
|
Cotulla, TX |
|
ESG |
|
37,900 |
|
Own |
|
|
Houston, TX |
|
ASG |
|
35,100 |
|
Lease |
|
|
Senlis, France |
|
ASG |
|
34,400 |
|
Lease |
|
|
Williston, ND |
|
ESG |
|
32,000 |
|
Own |
|
|
Bridgeport, WV |
|
ESG |
|
25,600 |
|
Lease |
|
|
Boothwyn, PA |
|
ASG |
|
25,000 |
|
Lease |
|
|
Midland, TX |
|
ESG |
|
25,000 |
|
Lease |
|
|
Eunice, NM |
|
ESG |
|
23,100 |
|
Lease |
|
|
Everett, WA |
|
ASG |
|
21,700 |
|
Lease |
|
|
Houston, TX |
|
ESG |
|
21,000 |
|
Lease |
|
|
Banyo QLD, Australia |
|
ASG |
|
19,400 |
|
Lease |
|
|
Bossier City, LA |
|
ESG |
|
18,000 |
|
Lease |
|
|
Kenedy, TX |
|
ESG |
|
17,800 |
|
Lease |
|
|
Wellington, FL |
|
Corporate Administrative Headquarters |
|
17,000 |
|
Lease |
|
|
San Angelo, TX |
|
ESG |
|
16,800 |
|
Lease |
|
|
Oklahoma City, OK |
|
ESG |
|
16,600 |
|
Lease |
|
|
Midvale, OH |
|
ESG |
|
16,500 |
|
Lease |
|
|
Paramus, NJ |
|
ASG |
|
15,500 |
|
Lease |
|
|
Rock Springs, WY |
|
ESG |
|
14,300 |
|
Lease |
|
|
Tioga, PA |
|
ESG |
|
14,000 |
|
Lease |
|
|
Rzeszow, Poland |
|
ASG |
|
13,700 |
|
Lease |
|
|
Casper, WY |
|
ESG |
|
13,600 |
|
Lease |
|
|
Bossier City, LA |
|
ESG |
|
13,300 |
|
Lease |
|
|
Weatherford, TX |
|
ESG |
|
13,100 |
|
Own |
|
|
Sterling, CO |
|
ESG |
|
13,000 |
|
Lease |
|
|
Greensboro, NC |
|
ASG |
|
12,000 |
|
Lease |
|
|
Vernal, UT |
|
ESG |
|
12,000 |
|
Lease |
|
|
Dickinson, ND |
|
ESG |
|
11,600 |
|
Lease |
|
|
Midland, TX |
|
ESG |
|
10,100 |
|
Lease |
|
We believe that our facilities are suitable for their present intended purposes and are adequate for our present and anticipated level of operations.
37
We are a defendant in various legal actions arising in the normal course of business, the outcomes of which, in the opinion of management, neither individually nor in the aggregate are likely to result in a material adverse effect on our business, results of operations or financial condition. We previously disclosed an investigation into an alleged violation of regulations governing chemical substances in our German operations. This matter has been resolved for an immaterial amount.
There are no material pending legal proceedings, other than the ordinary routine litigation incidental to the business discussed above, to which we, or any of our subsidiaries, are a party or of which any of our property is the subject. See Note 8. Commitments, Contingencies and Off-Balance Sheet Arrangements.
ITEM 4. MINE SAFETY DISCLOSURES
Not Applicable.
38
PART II
ITEM 5. MARKET FOR REGISTRANT’S COMMON EQUITY, RELATED STOCKHOLDER MATTERS AND ISSUER PURCHASES OF EQUITY SECURITIES
Our common stock is quoted on the NASDAQ Global Select Market under the symbol “KLXI”. The following table sets forth, for the periods indicated, the range of high and low per share sales prices for the common stock as reported by NASDAQ.
|
|
|
Common Stock |
|
||||
|
|
|
High |
|
Low |
|
||
|
Fiscal 2015: |
|
|
|
|
|
|
|
|
First Quarter |
|
$ |
43.58 |
|
$ |
37.10 |
|
|
Second Quarter |
|
|
46.16 |
|
|
38.60 |
|
|
Third Quarter |
|
|
40.11 |
|
|
34.19 |
|
|
Fourth Quarter |
|
|
41.00 |
|
|
25.50 |
|
|
|
|
|
|
|
|
|
|
|
Fiscal 2016: |
|
|
|
|
|
|
|
|
First Quarter |
|
$ |
34.29 |
|
$ |
25.33 |
|
|
Second Quarter |
|
|
35.25 |
|
|
28.65 |
|
|
Third Quarter |
|
|
39.00 |
|
|
30.97 |
|
|
Fourth Quarter |
|
|
50.33 |
|
|
33.17 |
|
On April 11, 2017, the last reported sale price of our common stock as reported by NASDAQ was $46.28 per share. As of such date, based on information provided to us by Computershare, our transfer agent, we had 1,159 registered holders, and because many of these shares are held by brokers and other institutions on behalf of the beneficial holders, we are unable to estimate the number of beneficial stockholders represented by these holders of record.
39
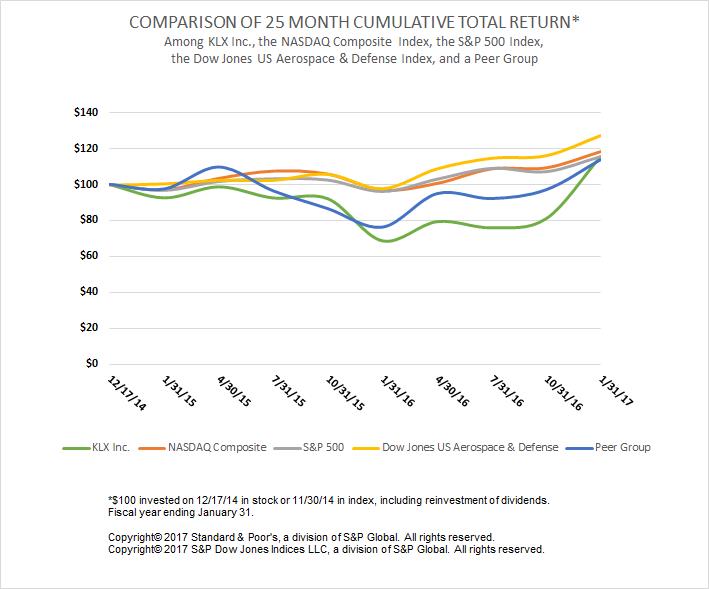
40
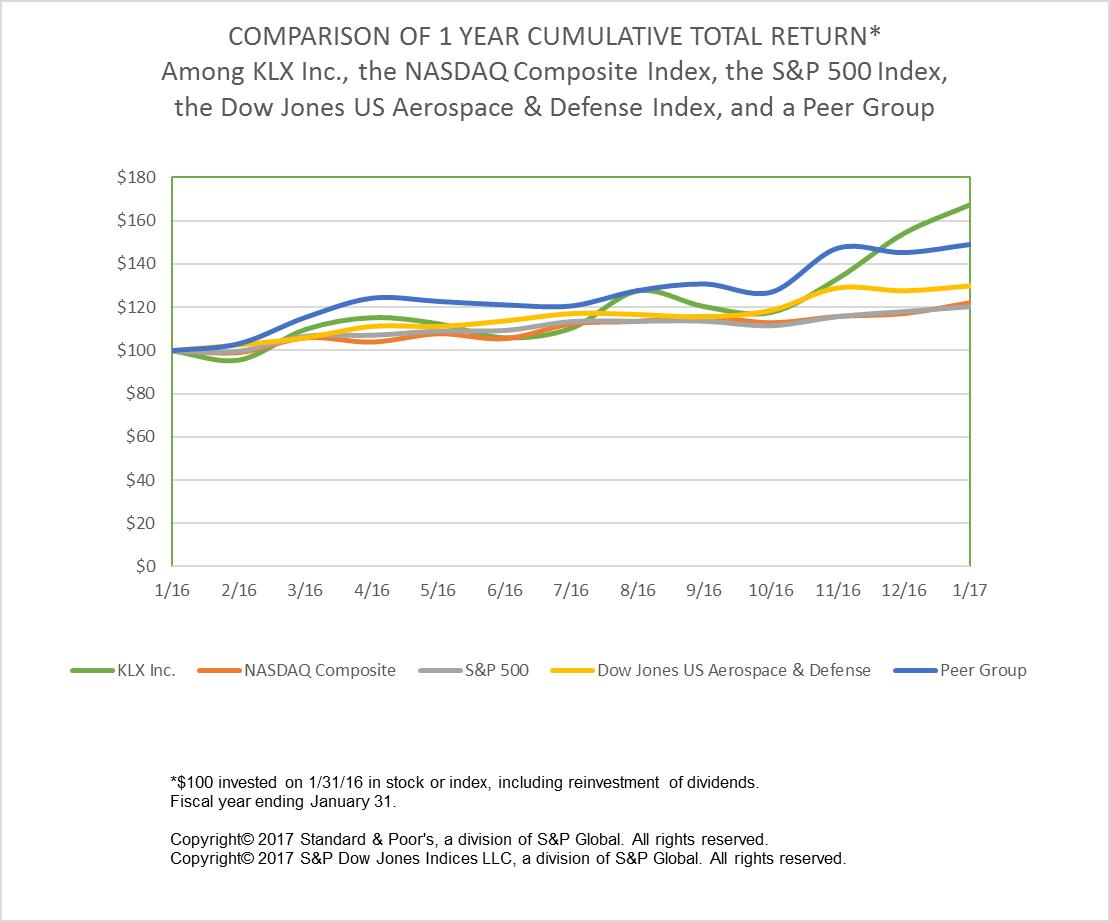
We do not currently intend to pay dividends. Our Board will establish our dividend policy based on our financial condition, results of operations and capital requirements, as well as applicable law, regulatory constraints, industry practice and other business considerations that our Board considers relevant. The terms of our debt agreements contain restrictions on our ability to pay dividends. The terms of agreements governing debt that we may incur in the future may also limit or prohibit dividend payments. Accordingly, we cannot assure you that we will either pay dividends in the future or continue to pay any dividend that we may commence in the future.
41
Unregistered Sales Of Equity Securities And Use Of Proceeds
Share Repurchases
($ in Millions, Except Shares and Per Share Data)
The following table presents the total number of shares of our common stock that we repurchased during the three months ended January 31, 2017:
|
Period |
|
Total number of shares purchased1 |
|
Average price paid per share2 |
|
Total number of shares purchased as part of publicly announced plans or programs |
|
Approximate dollar value of shares that may yet be purchased under the plans or programs |
|
||||
|
November 1, 2016 - November 30, 2016 |
|
|
— |
|
$ |
— |
|
|
— |
|
$ |
228.1 |
|
|
December 1, 2016 - December 31, 2016 |
|
|
453,251.0 |
|
|
45.81 |
|
|
453,251.0 |
|
|
207.3 |
|
|
January 1, 2017 – January 31, 2017 |
|
|
197,686.0 |
|
|
46.72 |
|
|
197,686.0 |
|
|
198.1 |
|
|
Total |
|
|
650,937.0 |
|
|
|
|
|
650,937.0 |
|
|
|
|
|
(1) |
In November 2014, our board of directors authorized a common stock repurchase program for up to $250. In March 2017, our board of directors has authorized an increase in the Company’s share repurchase authorization from $100 to $200 under the existing $250 repurchase program. |
|
(2) |
The average price paid per share of common stock repurchased under the stock repurchase program includes the commissions paid to the brokers. |
ITEM 6. SELECTED FINANCIAL DATA
In this section, dollar amounts are shown in millions, except for per share data or as otherwise specified.
The following tables present a summary of selected historical consolidated and combined financial data for the periods indicated below. We derived the selected historical condensed consolidated and combined statements of earnings data for the years ended January 31, 2017 and 2016, December 31, 2014 and the one month ended January 31, 2015 and the balance sheet data as of January 31, 2017 and 2016 from our audited consolidated and combined financial statements included elsewhere in this Form 10‑K. We derived the selected historical financial data as of December 31, 2014 and 2013, and for the fiscal years ended December 31, 2013 and 2012 from audited financial statements.
The historical statements of earnings and comprehensive income for periods prior to December 16, 2014 reflect allocations of general corporate expenses from B/E Aerospace including, but not limited to, executive management, finance, legal, information technology, human resources, employee benefits administration, treasury, risk management, procurement and other shared services. The allocations were made on a direct usage basis when identifiable, with the remainder allocated on the basis of revenues generated, costs incurred, headcount or other measures. Our management considers these allocations to be a reasonable reflection of the utilization of services by, or the benefits provided to, KLX. The allocations may not, however, reflect the expense we would have incurred as a stand‑alone company for such periods. Actual costs that may have been incurred if we had been a stand‑alone company would depend on a number of factors, including the chosen organizational structure, what functions were outsourced or performed by employees and strategic decisions made in areas such as information technology and infrastructure.
The financial statements for periods prior to the spin-off from B/E Aerospace on December 16, 2014 included in this Form 10‑K may not necessarily reflect our financial position, results of operations and cash flows as if we had operated as a stand‑alone public company during such periods. Accordingly, our historical results should not be relied upon as an indicator of our future performance.
42
In presenting the financial data in conformity with GAAP, we are required to make estimates and assumptions that affect the amounts reported. See “Management’s Discussion and Analysis of Financial Condition and Results of Operations—Critical Accounting Policies,” included elsewhere in this Form 10‑K for a detailed discussion of the accounting policies that we believe require subjective and complex judgments that could potentially affect reported results.
The following selected historical financial and other data should be read in conjunction with “Management’s Discussion and Analysis of Financial Condition and Results of Operations” and our audited consolidated and combined financial statements and related notes included elsewhere in this Form 10‑K.
|
|
|
Year Ended |
|
Month Ended |
||||||||||||||
|
|
|
January 31, 2017 |
|
January 31, 2016 |
|
December 31, 2014 |
|
December 31, 2013 |
|
December 31, 2012 |
|
January 31, 2015 |
||||||
|
Statements of Earnings Data: |
|
|
|
|
|
|
|
|
|
|
|
|
|
|
|
|
|
|
|
Revenues |
|
$ |
1,494.1 |
|
$ |
1,567.4 |
|
$ |
1,695.7 |
|
$ |
1,291.6 |
|
$ |
1,180.7 |
|
$ |
133.0 |
|
Cost of sales(1) |
|
|
1,126.1 |
|
|
1,202.4 |
|
|
1,194.9 |
|
|
872.8 |
|
|
803.5 |
|
|
95.6 |
|
Selling, general and administrative(1) |
|
|
238.6 |
|
|
261.6 |
|
|
254.0 |
|
|
180.3 |
|
|
159.3 |
|
|
19.7 |
|
Goodwill impairment charge |
|
|
— |
|
|
310.4 |
|
|
— |
|
|
— |
|
|
— |
|
|
— |
|
Long-lived asset impairment charge |
|
|
— |
|
|
329.8 |
|
|
— |
|
|
— |
|
|
— |
|
|
— |
|
Operating earnings (loss) |
|
|
129.4 |
|
|
(536.8) |
|
|
246.8 |
|
|
238.5 |
|
|
217.9 |
|
|
17.7 |
|
Interest expense (income), net |
|
|
75.9 |
|
|
77.3 |
|
|
3.0 |
|
|
(1.0) |
|
|
0.2 |
|
|
6.3 |
|
Earnings (loss) before income taxes |
|
|
53.5 |
|
|
(614.1) |
|
|
243.8 |
|
|
239.5 |
|
|
217.7 |
|
|
11.4 |
|
Income taxes |
|
|
5.3 |
|
|
(228.3) |
|
|
155.7 |
|
|
89.1 |
|
|
80.8 |
|
|
4.3 |
|
Net earnings (loss) |
|
$ |
48.2 |
|
$ |
(385.8) |
|
$ |
88.1 |
|
$ |
150.4 |
|
$ |
136.9 |
|
$ |
7.1 |
|
Basic net earnings (loss) per share(2): |
|
|
|
|
|
|
|
|
|
|
|
|
|
|
|
|
|
|
|
Net earnings (loss) |
|
$ |
0.93 |
|
$ |
(7.39) |
|
$ |
1.69 |
|
$ |
2.88 |
|
$ |
2.62 |
|
$ |
0.14 |
|
Weighted average common shares |
|
|
51.8 |
|
|
52.2 |
|
|
52.2 |
|
|
52.2 |
|
|
52.2 |
|
|
52.2 |
|
Diluted net earnings (loss) per share(2): |
|
|
|
|
|
|
|
|
|
|
|
|
|
|
|
|
|
|
|
Net earnings (loss) |
|
$ |
0.92 |
|
$ |
(7.39) |
|
$ |
1.68 |
|
$ |
2.88 |
|
$ |
2.62 |
|
$ |
0.14 |
|
Weighted average common shares |
|
|
52.2 |
|
|
52.2 |
|
|
52.3 |
|
|
52.3 |
|
|
52.3 |
|
|
52.3 |
|
Balance Sheet Data (end of period): |
|
|
|
|
|
|
|
|
|
|
|
|
|
|
|
|
|
|
|
Working capital |
|
$ |
1,702.5 |
|
$ |
1,761.6 |
|
$ |
1,788.4 |
|
$ |
1,366.1 |
|
$ |
1,300.3 |
|
$ |
1,792.0 |
|
Goodwill, intangible and other assets, net |
|
|
1,343.4 |
|
|
1,244.3 |
|
|
1,792.3 |
|
|
1,417.6 |
|
|
1,349.4 |
|
|
1,766.4 |
|
Total assets |
|
|
3,698.3 |
|
|
3,691.0 |
|
|
4,280.6 |
|
|
3,064.0 |
|
|
2,845.9 |
|
|
4,224.6 |
|
Stockholders’ equity |
|
|
2,221.1 |
|
|
2,202.5 |
|
|
2,620.3 |
|
|
2,798.7 |
|
|
2,635.5 |
|
|
2,601.1 |
|
Other Data: |
|
|
|
|
|
|
|
|
|
|
|
|
|
|
|
|
|
|
|
Depreciation and amortization |
|
|
66.9 |
|
|
75.0 |
|
|
68.0 |
|
|
27.8 |
|
|
22.8 |
|
|
7.3 |
|
(1) |
Cost of sales and selling, general and administrative (“SG&A”) expense include $30.3 and $37.2, respectively, of business separation and acquisition‑related costs in Fiscal 2015 (Cost of sales and SG&A include $3.5 and $53.4, respectively, of acquisition-related costs in 2014). |
|
(2) |
On December 16, 2014, B/E Aerospace, Inc. distributed to its stockholders of record as of the close of business on December 5, 2014 one share of KLX common stock for every two shares of B/E’s common stock held as of the record date. Basic and diluted earnings per common share and the average number of common shares outstanding were calculated using the number of KLX common shares outstanding immediately following the distribution. See Note 11, Stockholders’ Equity, of the notes to the Consolidated and Combined Financial Statements for information regarding earnings per common share. |
43
ITEM 7. MANAGEMENT’S DISCUSSION AND ANALYSIS OF FINANCIAL CONDITION AND RESULTS OF OPERATIONS
In this section, dollar amounts are shown in millions, except for per share data or as otherwise specified.
Overview
The Spin‑off
On December 16, 2014, B/E Aerospace distributed 100% of the outstanding shares of common stock of KLX to the B/E stockholders of record in a transaction intended to be tax‑free to B/E Aerospace, KLX and our initial stockholders for U.S. federal income tax purposes (other than with respect to any cash received in lieu of fractional shares) (“Spin-Off”).
For the year ended December 31, 2014, selling, general and administrative (“SG&A”) expense includes allocations of general corporate expenses from B/E Aerospace. The consolidated and combined statements of earnings and comprehensive income reflect allocations of general corporate expenses from B/E Aerospace, Inc. (“B/E Aerospace” or “Former Parent”) including, but not limited to, executive management, finance, legal, information technology, human resources, employee benefits administration, treasury, risk management, procurement and other shared services. The allocations were made on a direct usage basis when identifiable, with the remainder allocated on the basis of revenues generated, costs incurred, headcount or other measures. Our management considers these allocations to be a reasonable reflection of the utilization of services by, or the benefits provided to, KLX. The allocations may not, however, reflect the expense we would have incurred as a stand‑alone company for the periods presented. Actual costs that may have been incurred if we had been a stand‑alone company would depend on a number of factors, including the chosen organizational structure, what functions were outsourced or performed by employees and strategic decisions made in areas such as information technology and infrastructure. See Note 1 of the Consolidated and Combined Financial Statements, “Description of Business and Summary of Significant Accounting Policies—Basis of Presentation,” for a description of the costs allocated, the methods of allocation, the reasons for the allocations and how future actual costs may differ from the amounts allocated under the ownership of our Former Parent.
We entered into certain agreements with B/E Aerospace relating to transition services and IT services for a transitional period following the distribution. During Fiscal 2016, we incurred annual charges under those agreements for services provided to us by B/E Aerospace of approximately $8.7. As planned, subsequent to the Spin‑Off, we started bringing some of the functions that were previously provided to us through corporate allocations from B/E Aerospace in‑house, and we expect to be fully independent by the end of the first quarter of Fiscal 2017. In addition, at the time of the Spin-Off, we entered into an Employee Matters Agreement and a tax sharing and indemnification agreement with B/E Aerospace. We do not expect those agreements to have a material effect on our financial statements. We also entered into new financing arrangements in connection with the Spin‑Off. See “Liquidity and Capital Resources—New Financing Arrangements.”
Company Overview
We believe, based on our experience in the industry, that we are one of the world’s leading independent distributors and value‑added service providers of aerospace fasteners and consumables, and that we offer one of the broadest ranges of aerospace hardware and consumables and inventory management services worldwide. Through organic growth and a number of strategic acquisitions beginning in 2001, we believe we have become one of our industry’s leading providers of aerospace fasteners, consumable products and supply chain management services. Through our unmatched inventory base, global facilities, sales network and advanced information technology systems, we believe we offer unparalleled service to original equipment manufacturers of commercial and military aircraft or aircraft system components and the in-service fleet of commercial and military aircraft and aircraft systems. With a large and diverse global customer base, including virtually all of the world’s commercial airlines, business jet and defense OEMs, OEM subcontractors and major MRO operators across five continents, we provide access to over one million SKUs. We serve as a distributor for every major aerospace fastener manufacturer. In order to support our vast range of custom products and services, we have invested over $100 in proprietary IT systems to create a superior technology
44
platform. Our systems support both internal distribution processes and part attributes, along with customer services, including JIT deliveries and kitting solutions, which we believe are unmatched by any competitor. This business is operated within our ASG segment.
In May 2016, we acquired Herndon Aerospace & Defense, LLC (“Herndon”), a leading supply chain management and consumables hardware distributor serving principally military depot aftermarket customers, as well as commercial aerospace customers. The acquisition of Herndon expands our capability to provide comprehensive aftermarket supply chain management solutions to a broader portfolio of aftermarket customers. Herndon has established itself with the U.S. Department of Defense and its procurement arm, the Defense Logistics Agency (“DLA”), as a proven supplier of a broad range of consumables, resulting in a number of long term contracts with major military installations. Herndon’s very high rating as a supplier to the DLA gives us the ability to expand our military aftermarket business. This military aftermarket business represents a platform for the introduction of new product offerings.
In 2013, we initiated an expansion into the U.S. onshore oil and gas services sector. We acquired seven companies in the business of providing technical services and related rental equipment to oil and gas exploration and production companies operating in every major onshore oil and gas region in the U.S. other than California, and have consolidated these companies into a single, coordinated business to most effectively serve our customers. As a result, we now provide a broad range of solutions and equipment which bring value‑added resources to a new customer base, often in remote locations. Our customers include independent and major oil and gas companies that are engaged in the exploration and production of oil and gas properties in North America, including in the Northeast (Marcellus and Utica Shale), Rocky Mountains (Williston and Piceance Basins), Southwest (Permian Basin and Eagle Ford) and Mid‑Continent. This business is operated within our ESG segment.
The oil and gas industry experienced a significant downturn commencing in late 2014 that continued throughout 2015 and most of 2016, during which time plummeting commodity prices driven by excess global supply resulted in record reductions in spending by all of our customers. At its low point in the second quarter of 2016, the domestic onshore drilling rig count was cut by over 75% from its peak in 2014 of 1,931 rigs to 404 rigs. As a result of the severity of this decline and the uncertainty of when industry conditions would improve, during the third quarter of 2015, we performed an interim asset impairment test in which we concluded the carrying value of our assets were impaired, resulting in an approximately $640.2 pre-tax ($402.7 after-tax) non-cash impairment charge.
Current Industry Conditions
Within our ASG segment, we generally derive our revenues from aerospace products and consumable products for both the new build market and the aftermarket. Our ASG business achieved a record in both revenues and profitability in 2016, as a result of solid demand from our commercial aerospace and defense manufacturing customers, as well as the contribution from Herndon, which we acquired on May 19, 2016. Based upon aircraft manufacturers’ backlogs, we expect the current level of production to remain reasonably consistent; and, although we expect continued weak demand from our business jet manufacturing customers in 2017, we do expect an upswing in 2018 as numerous new business jet aircraft types enter into service. During 2016, ASG was awarded several new program awards from commercial aerospace manufacturing and military depot customers, which represent market share gains and which should supplement ASG’s growth in 2017 and beyond. With respect to demand from our defense related customer base, our customers have been affected by the budgetary constraints in Washington and the effects of sequestration on defense spending, including the sunsetting of certain legacy platforms for which we were a primary supplier of consumables. Our aftermarket revenues are generated in support of the installed base of commercial and military aircraft, their suppliers and maintenance systems. We expect aftermarket revenues to trend upwards in 2017 and beyond, as the approximately 11,000 new aircraft which have been delivered over the past eight years begin to require their first heavy maintenance, and our Herndon business begins to reflect new contracts such as the 10 year, $135 million contract to supply the Corpus Christi Army Depot we announced in October 2016 and which is expected to ramp up beginning late in 2017.
Within our ESG segment, the technological advancements over the past approximately thirty years that allow for enhanced recovery from shale formations underlying much of the major onshore oil and gas reservoirs in the United States have expanded the market for services to support the drilling, completion and production of onshore oil and gas wells dramatically. This has led to rapid growth in the market for the services we provide, culminating in record financial results for many oil field service providers in 2014. However, the global production of oil and gas that year led to an imbalance of supply and demand that caused a rapid decline in commodity prices starting in late 2014 and continuing
45
throughout 2015 and into 2016. These plummeting commodity prices resulted in record reductions in spending by our customers, which in turn severely impacted both volume and pricing of the services used by our customers. Capital budgets that had been scaled back by 40% or more in 2015 further declined another 50% or more during 2016. In response to this dramatic reduction in activity, companies across the oil field service industry implemented deep cuts in both personnel and operational capacity, and recorded billions of dollars in impairment charges. Notwithstanding these actions, there have been a high number of bankruptcy reorganizations and liquidations, which along with these personnel reductions and the migration of workers away from the industry has substantially reduced oil field service capacity. These factors are expected to support an eventual recovery in activity levels, as well as pricing of our services.
We believe ESG has effectively weathered the market turmoil of the past two years and is a much stronger organization positioned to benefit differentially as activity levels improve. Regardless of trends in market activity, ESG management will remain focused on making our business more efficient while providing the highest quality service to our customers.
Revenues by reportable segment for the years ended January 31, 2017 and 2016 and December 31, 2014 were as follows:
|
|
|
Year ended |
|
|
|||||||||||||||
|
|
|
January 31, 2017 |
|
|
January 31, 2016 |
|
|
December 31, 2014 |
|
|
|||||||||
|
|
|
|
Revenues |
|
% of Revenues |
|
|
|
Revenues |
|
% of Revenues |
|
|
|
Revenues |
|
% of Revenues |
|
|
|
Aerospace Solutions Group |
|
$ |
1,340.9 |
|
89.7 |
% |
|
$ |
1,312.5 |
|
83.7 |
% |
|
$ |
1,310.2 |
|
77.3 |
% |
|
|
Energy Services Group |
|
|
153.2 |
|
10.3 |
% |
|
|
254.9 |
|
16.3 |
% |
|
|
385.5 |
|
22.7 |
% |
|
|
Total revenues |
|
$ |
1,494.1 |
|
100.0 |
% |
|
$ |
1,567.4 |
|
100.0 |
% |
|
$ |
1,695.7 |
|
100.0 |
% |
|
Substantially all of our sales and purchases are denominated in U.S. dollars. Revenues by domestic and foreign operations for the years ended January 31, 2017 and 2016 and December 31, 2014 were as follows:
|
|
|
|
Year Ended |
|
|
|||||||
|
|
|
|
January 31, 2017 |
|
January 31, 2016 |
|
December 31, 2014 |
|
|
|||
|
Domestic |
|
|
$ |
1,423.8 |
|
$ |
1,453.4 |
|
$ |
1,505.3 |
|
|
|
Foreign |
|
|
|
70.3 |
|
|
114.0 |
|
|
190.4 |
|
|
|
Total revenues |
|
|
$ |
1,494.1 |
|
$ |
1,567.4 |
|
$ |
1,695.7 |
|
|
Revenues by geographic region (based on destination) for the years ended January 31, 2017 and 2016 and December 31, 2014 were as follows:
|
|
|
Year Ended |
|
|
|||||||||||||
|
|
|
January 31, 2017 |
|
January 31, 2016 |
|
December 31, 2014 |
|
|
|||||||||
|
|
|
|
|
|
% of |
|
|
|
|
% of |
|
|
|
|
% of |
|
|
|
|
|
Revenues |
|
Revenues |
|
Revenues |
|
Revenues |
|
Revenues |
Revenues |
|
|
||||
|
United States |
|
$ |
865.6 |
|
57.9 |
% |
$ |
955.3 |
|
61.0 |
% |
$ |
1,111.5 |
|
65.5 |
% |
|
|
Europe |
|
|
387.9 |
|
26.0 |
% |
|
376.3 |
|
24.0 |
% |
|
374.2 |
|
22.1 |
% |
|
|
Asia, Pacific Rim, Middle East and other |
|
|
240.6 |
|
16.1 |
% |
|
235.8 |
|
15.0 |
% |
|
210.0 |
|
12.4 |
% |
|
|
Total revenues |
|
$ |
1,494.1 |
|
100.0 |
% |
$ |
1,567.4 |
|
100.0 |
% |
$ |
1,695.7 |
|
100.0 |
% |
|
Founded in 1974 as M&M Aerospace Hardware, ASG, formerly the consumables management segment of B/E Aerospace, Inc., has evolved into one of the industries leaders through multiple acquisitions and strong organic growth. As of January 31, 2017, ASG’s global presence consisted of approximately 1.5 million square feet in 18 principal facilities with approximately 2,000 employees worldwide. We have substantially expanded the size, scope and nature of our business as a result of a number of acquisitions. B/E Aerospace acquired M&M in 2001. Between 2002 and 2016, we completed seven acquisitions, for an aggregate purchase price of approximately $2.1 billion. We believe our organic growth together with these acquisitions has enabled us to position ourselves as a preferred global supplier to our customers.
46
The Company initiated an expansion into the oilfield support services and associated rental equipment business during the second half of 2013. During 2013 and 2014, we acquired the assets of seven oilfield service companies operating in each of the key shale oil and gas basins in North America for an aggregate purchase price of $626.8. Through these energy services acquisitions, we have established a base of North American operations from which we are able to offer our oilfield support services and associated rental equipment in the major oil and gas regions of the U.S., including Northeastern U.S., Southwestern U.S., North Dakota, Rocky Mountains and the Mid‑Continent.
The Company is organized based on the products and services it offers. As a result, we determined that ASG and ESG met the requirements of a reportable segment. ESG’s operations in 2013 were immaterial. Each segment regularly reports its results of operations and makes requests for capital expenditures and acquisition funding to the Company’s chief operational decision‑making group. Each operating segment has separate management teams and infrastructures dedicated to providing a full range of products and services to their customers.
Year Ended January 31, 2017, as Compared to Year Ended January 31, 2016
The following is a summary of revenues by segment:
|
|
|
Revenues |
|
|
||||||
|
|
|
|
|
|
|
|
|
% |
|
|
|
Segment |
|
January 31, 2017 |
|
January 31, 2016 |
|
Change |
|
|
||
|
Aerospace Solutions Group |
|
$ |
1,340.9 |
|
$ |
1,312.5 |
|
2.2 |
% |
|
|
Energy Services Group |
|
|
153.2 |
|
|
254.9 |
|
(39.9) |
% |
|
|
Total |
|
$ |
1,494.1 |
|
$ |
1,567.4 |
|
(4.7) |
% |
|
The following discussion and analysis addresses the results of our operations for the years ended January 31, 2017 and 2016, the one month ended January 31, 2015, and the year ended December 31, 2014. In addition, the discussion and analysis addresses our liquidity, financial condition and other matters for these periods.
For Fiscal 2016, revenues of $1,494.1 decreased $73.3, or 4.7%, as compared with the prior year. The consolidated results reflect a 2.2%, or $28.4, increase in ASG revenues offset by a $101.7 decline in ESG revenues.
Cost of sales for Fiscal 2016 was $1,126.1, or 75.4% of sales, as compared to $1,202.4, or 76.7% of sales, for the year ended January 31, 2016 (“Fiscal 2015”). The year over year improvement is primarily related to cost reduction initiatives and the absence of spin-off related costs in Fiscal 2016.
Selling, general and administrative (“SG&A”) expense during Fiscal 2016 was $238.6, or 16.0% of revenues, as compared with $261.6, or 16.7% of revenues, in the prior year period. SG&A decreased in Fiscal 2016 as compared with the prior year by 70 basis points primarily due to post spin-off and business repositioning costs in the prior year period.
Operating earnings increased $666.2 to $129.4, primarily as a result of the $640.2 asset impairment charge at ESG in the prior year period compared to none in the current year period in addition to a 2.2% increase in revenues at ASG. The aforementioned results also reflect approximately $5.8 of costs and expenses associated with the Herndon acquisition.
Interest expense for the twelve months ended January 31, 2017 was $75.9 as compared to $77.3 for the twelve months ended January 31, 2016.
Income tax expense for the twelve months ended January 31, 2017 was $5.3, or 9.9% of earnings before income taxes, compared to income tax benefit of $228.3, or 37.2% of loss before income taxes, in the prior year period.
Net earnings and net earnings per diluted share for the year ended January 31, 2017 were $48.2 and $0.92, respectively, as compared to net loss and net loss per diluted share of $385.8 and $7.39, respectively, in Fiscal 2015. The increase was primarily related to the $640.2 asset impairment charge at ESG in the prior year compared to none in the current year.
47
Segment Results
The following is a summary of operating earnings (loss) by segment:
|
|
|
Operating (Loss) Earnings |
|
|
||||||
|
|
|
|
|
|
|
|
|
% |
|
|
|
Segment |
|
January 31, 2017 |
|
January 31, 2016(1) |
|
Change |
|
|
||
|
Aerospace Solutions Group |
|
$ |
220.6 |
|
$ |
211.6 |
|
4.3 |
% |
|
|
Energy Services Group |
|
|
(91.2) |
|
|
(748.4) |
|
87.8 |
% |
|
|
Total |
|
$ |
129.4 |
|
$ |
(536.8) |
|
124.1 |
% |
|
|
(1) |
Includes $67.5 ($29.0 at ASG, $38.5 at ESG) of Post Spin-Off and Business Repositioning Expenses and a $640.2 impairment charge at ESG for the year ended January 31, 2016. |
For the year ended January 31, 2017, ASG revenues of $1,340.9 increased 2.2%, driven principally by the contribution of Herndon’s military aftermarket business and increased aircraft maintenance activity. On a comparative basis with the prior year, ASG revenues in the first half of 2016 were negatively impacted by headwinds from our legacy military manufacturing customers and lower production levels at a number of commercial aerospace manufacturing customers. ASG revenues in the third and fourth quarters of 2016 reflect the inclusion of Herndon and an improvement in aftermarket demand due to an increase in aircraft maintenance activity. Operating earnings of $220.6 improved by 4.3% principally as a result of the increase in revenues from Herndon’s military aftermarket business and $29.0 of Post Spin-Off related costs in the prior year (none in Fiscal 2016) offset by the headwinds in the first half of 2016 discussed above.
For Fiscal 2016, ESG revenues of $153.2 declined $101.7, or 39.9%, as compared to the prior year, while operating loss improved by $657.2, or 87.8%, to ($91.2). ESG recorded an asset impairment charge of $640.2 in Fiscal 2015. Exclusive of this charge, ESG’s Fiscal 2016 operating loss improved by $17.0, or 15.7%. The improvement in operating loss reflects the intensive effort to consolidate facilities and align headcount with demand. We believe demand for oil field services may have troughed in the first half of 2016 and has begun to trend up.
One Month Ended January 31, 2015
Consolidated revenues for the one month ended January 31, 2015 were $133.0; ASG revenues were $93.1 and ESG revenues were $39.9. Cost of sales was $95.6, or 71.9% of sales, including $0.4 of costs and expenses related to Post Spin-Off and Business Repositioning Expenses. Consolidated SG&A expenses were $19.7, or 14.8% of revenues, including $0.3 of costs and expenses related to Post Spin-Off and Business Repositioning Expenses. Operating earnings were $17.7, or 13.3% of revenues. Interest expense was $6.3, and income taxes were $4.3, or approximately 37.7% of earnings before taxes. Net earnings were $7.1, or $0.14 per diluted share.
Year Ended January 31, 2016 Compared to the Year Ended December 31, 2014
For the twelve months ended January 31, 2016, revenues of $1,567.4 decreased 7.6% as compared with the prior year period ended December 31, 2014. The consolidated results reflect flat revenue growth at ASG (2.2% increase on a constant currency basis) and a 33.9% decline in ESG revenues.
Cost of sales for the year ended January 31, 2016 including Post Spin-Off and Business Repositioning Expenses of $30.3 was $1,202.4 (76.7% of revenues) and increased by $7.5, or 0.6%. Cost of sales as a percentage of revenues (70.5% in the prior year) increased in 2015 primarily due to a $14.0 increase in depreciation expense resulting from a full year of ESG depreciation in 2015 as compared to a partial year in 2014. Depreciation expense at ESG will be approximately $15.0 lower in 2016 than the annual run rate in 2015 before the impairment.
SG&A expense for the year ended January 31, 2016 including Post Spin-Off and Business Repositioning Expenses of $37.2 was $261.6, or 16.7% of revenues, as compared with $254.0, or 15.0% of revenues, in the prior year period. The higher level of SG&A expense as a percentage of revenues in fiscal year 2015 is primarily due to $30.7 of costs and expenses associated with being a stand-alone public company, $37.2 of Post Spin-Off and Business
48
Repositioning Expenses and higher SG&A related to ESG acquisitions completed in 2014 but included for a full year in 2015.
The continuing downturn in the oil and gas industry, including the approximately 75% decrease in the number of onshore drilling rigs and the resulting significant cutbacks in capital expenditures by our oil and gas customers, has resulted in both volume and pricing declines for oil field services. As a result, during 2015, the Company determined that the carrying value of ESG’s assets were impaired, resulting in an approximate $640.2 pre-tax (approximately $402.7 after-tax) non-cash impairment charge. The charges reflect the full value of the goodwill and identified intangible assets attributable to the ESG segment.
Operating loss for the year ended January 31, 2016 was $536.8 and includes Post Spin-Off and Business Repositioning Expenses of $67.5 and the goodwill and long-lived asset impairment charge of $640.2. Operating margin, exclusive of the impairment charge, for the year ended January 31, 2016 of 6.6% (14.6% in the prior year period) decreased primarily due to material declines in ESG sales volumes and pricing and $67.5 of expenses related to cost reduction initiatives and first year Post Spin-Off and Business Repositioning Expenses.
Interest expense for the year ended January 31, 2016 was $77.3, compared to interest expense in the prior year period of $3.0. The increase in interest expense is a result of interest incurred on the $1,200.0 of 5.875% senior unsecured notes issued in connection with the Spin‑Off.
Income tax benefit for the year ended January 31, 2016 of $228.3, or 37.2% of loss before income taxes, was a result of the pre-tax impairment charge of $640.2 and increased as compared to the prior year period effective tax rate of 36.3%. The Company’s effective tax rate can fluctuate as operations and the local country tax rates fluctuate due to the number of tax jurisdictions in which the Company operates.
Net loss and net loss per diluted share for the year ended January 31, 2016 were $385.8 and $7.39, respectively, as compared to net earnings and net earnings per diluted share of $88.1 and $1.68, respectively, in calendar 2014.
Liquidity and Capital Resources
Current Financial Condition
Cash on hand at January 31, 2017 decreased by $150.5 as compared with cash on hand at January 31, 2016 primarily as a result of the acquisition of Herndon for $220.8, net of cash acquired, $44.9 of purchases of treasury stock and $35.5 of capital expenditures offset by cash flows provided by operating activities of $150.9. Our liquidity requirements consist of working capital needs and ongoing capital expenditure requirements. Our primary requirements for working capital are directly related to the level of our operations. Our sources of liquidity are from cash on hand, cash flow from operations and our undrawn $750.0 Revolving Credit Facility. At January 31, 2017, we had $277.3 of cash and cash equivalents. The substantial majority of our cash is held within the United States, and we believe substantially all of our foreign cash may be brought back into the United States in a tax efficient manner.
During fiscal year 2015, our Board authorized repurchases of up to $100.0 of common stock under our existing $250.0 share repurchase program previously authorized by the Board. We have continued to repurchase shares in the open market and in privately negotiated transactions in compliance with Exchange Act Rule 10b-18, subject to market conditions, applicable legal requirements and other relevant factors. During Fiscal 2016, under the share repurchase program, we repurchased 982,062 shares of common stock at an average price of $41.20 per share for a total of $40.5. At January 31, 2017, we had $48.1 of authorization remaining under the share repurchase program. All decisions regarding future stock repurchases are at our sole discretion and will be evaluated from time to time in light of many factors, including our financial condition, earnings, capital requirements and debt covenants, if any, other contractual restrictions, as well as legal requirements (including compliance with published IRS guidelines for tax‑free spin‑offs), regulatory constraints, industry practice and other factors that we may deem relevant. The stock repurchase program may be modified, extended, suspended or discontinued by us at any time and we cannot provide any assurances regarding the number of shares that will be repurchased.
49
Working Capital
Working capital as of January 31, 2017 was $1,702.5, a decrease of $59.1 as compared with working capital at January 31, 2016. As of January 31, 2017, total current assets decreased by $63.2 and total current liabilities decreased by $4.1. The decrease in current assets is primarily related to the $150.5 decrease in cash as described above, offset by a $1.7 increase in accounts receivable driven by the increase in revenues in ASG, and an increase in inventories of $86.1 as a result of the acquisition of Herndon. The decrease in total current liabilities was primarily due to a decrease in accrued liabilities of $24.2 offset by an increase in accounts payable of $20.1.
Cash Flows
As of January 31, 2017, cash and cash equivalents were $277.3 as compared to $427.8 at January 31, 2016. Cash provided by operating activities was $150.9 for the year ended January 31, 2017 as compared to $217.2 in the prior year primarily reflecting net earnings of $48.2 adjusted by depreciation and amortization of $66.9 and a $6.9 decrease in accounts receivable ($40.3 decrease in the prior year period) offset by a $30.4 decrease in accrued liabilities ($18.8 increase in the prior year period) and an increase in inventory of $5.0 ($25.7 decrease in the prior year period). The primary uses of cash in investing activities during the year ended January 31, 2017 were related to capital expenditures of $35.5 and the acquisition of Herndon for $220.8, net of cash.
As of January 31, 2016, cash and cash equivalents were $427.8 as compared to $447.2 at January 31, 2015. Cash provided by operating activities was $217.2 for the year ended January 31, 2016 as compared to $107.5 in the prior year. The primary sources of cash provided by operating activities during the year ended January 31, 2016 were net earnings of $25.1 (after adjusting for the non-cash charge of ($229.3) to deferred income taxes and the impairment charge of $640.2), adjusted by depreciation and amortization of $75.0, as well as a decrease in accounts receivable and inventories of $40.3 and $25.7, respectively. The primary uses of cash in investing activities during the year ended January 31, 2016 were related to capital expenditures of $130.5.
Capital Spending
Our capital expenditures were $35.5, $130.5 and $136.8 during the years ended January 31, 2017, January 31, 2016 and December 31, 2014, respectively. Capital expenditures in 2016 were primarily related to ESG expansion initiatives and equipment maintenance and support of ASG IT systems. We expect to incur approximately $50.0 to $60.0 in capital expenditures for the year ended January 31, 2018, principally related to a new global headquarters and distribution facility for ASG. We expect to fund future capital expenditures from cash on hand, cash flow from operations and from funds available from our $750.0 secured revolving credit facility.
Outstanding Debt and Other Financing Arrangements
Long-term debt at January 31, 2017 consisted of $1,200.0 of 5.875% senior unsecured notes due 2022.
We also entered into a $500.0 secured revolving credit facility in connection with the Spin-Off, secured by substantially all of our assets and guaranteed by our subsidiaries, which bears interest at the London interbank offered rate (“LIBOR”) plus the applicable margin (as defined). On May 19, 2015, we amended and restated this secured Revolving Credit Facility to a structure tied to a borrowing base formula, and in the process, increased the size of the facility to $750.0 while reducing the interest rate margins applicable to any borrowings. No amounts were outstanding under this credit facility as of January 31, 2017. We believe that our cash flows, together with cash on hand and funds available under our $750.0 secured revolving credit facility will provide us with the ability to fund our operations, make planned capital expenditures payments and meet our debt service obligations for debt incurred in connection with the spin‑off for at least the next twelve months.
50
Contractual Obligations
The following chart reflects our contractual obligations and commercial commitments as of January 31, 2017. Commercial commitments include lines of credit, guarantees and other potential cash outflows resulting from a contingent event that requires performance by us or our subsidiaries pursuant to a funding commitment.
|
Contractual Obligations |
|
2017 |
|
2018 |
|
2019 |
|
2020 |
|
2021 |
|
Thereafter |
|
Total |
|
|||||||
|
Long-term debt and other non-current liabilities (1) |
|
$ |
1.3 |
|
$ |
0.8 |
|
$ |
1.0 |
|
$ |
1.0 |
|
$ |
1.0 |
|
$ |
1,219.6 |
|
$ |
1,224.7 |
|
|
Operating leases |
|
|
10.5 |
|
|
18.7 |
|
|
15.0 |
|
|
13.3 |
|
|
11.2 |
|
|
20.5 |
|
|
89.2 |
|
|
Future interest payments on outstanding debt (2) |
|
|
72.6 |
|
|
72.6 |
|
|
72.6 |
|
|
72.6 |
|
|
72.6 |
|
|
213.9 |
|
|
576.9 |
|
|
Total |
|
$ |
84.4 |
|
$ |
92.1 |
|
$ |
88.6 |
|
$ |
86.9 |
|
$ |
84.8 |
|
$ |
1,454.0 |
|
$ |
1,890.8 |
|
|
|
|
|
|
|
|
|
|
|
|
|
|
|
|
|
|
|
|
|
|
|
|
|
|
Commercial Commitments |
|
|
|
|
|
|
|
|
|
|
|
|
|
|
|
|
|
|
|
|
|
|
|
Letters of credit |
|
$ |
5.5 |
|
|
— |
|
|
— |
|
|
— |
|
|
— |
|
|
— |
|
$ |
5.5 |
|
|
(1) |
Our liability for unrecognized tax benefits of $7.2 and related interest and penalties of $1.2 at January 31, 2017 has been omitted from the above table because we cannot determine with certainty when this liability will be settled. It is reasonably possible that the amount of liability for unrecognized tax benefits will change in the next twelve months; however, we do not expect the change to have a material impact on our combined financial statements. |
|
(2) |
Interest payments include interest payments due on the 5.875% Notes based on the stated rate of 5.875%. To the extent we incur interest on our revolving credit facility, interest payments would fluctuate based on LIBOR or prime rate pursuant to the terms of our revolving credit facility. |
Off‑Balance Sheet Arrangements
Lease Arrangements
We finance our use of certain equipment under committed lease arrangements provided by various financial institutions. Since the terms of these arrangements meet the accounting definition of operating lease arrangements, the aggregate sum of future minimum lease payments is not reflected in our consolidated balance sheet. Future minimum lease payments under these arrangements aggregated approximately $89.2 at January 31, 2017.
Indemnities, Commitments and Guarantees
During the normal course of business, we made certain indemnities, commitments and guarantees under which we may be required to make payments in relation to certain transactions. These indemnities include non‑infringement of patents and intellectual property indemnities to our customers in connection with the delivery, design, manufacture and sale of our products, indemnities to various lessors in connection with facility leases for certain claims arising from such facility or lease, and indemnities to other parties to certain acquisition agreements. The duration of these indemnities, commitments and guarantees varies, and in certain cases, is indefinite. We believe that many of our indemnities, commitments and guarantees provide for limitations on the maximum potential future payments we could be obligated to make. However, we are unable to estimate the maximum amount of liability related to our indemnities, commitments and guarantees because such liabilities are contingent upon the occurrence of events that are not reasonably determinable. We believe that any liability for these indemnities, commitments and guarantees would not be material to our combined financial statements.
Backlog
We believe that backlog is not a relevant measure for our ASG segment, given the long‑term nature of our contracts with our customers. Few, if any, include minimum purchase requirements, annually or over the term of the agreement. Our ESG segment operates under MSAs with our E&P customers, which set forth the terms and conditions
51
for the provision of services and the rental of equipment. Rental tool and service contracts are typically based on a day rate with rates based on the type of equipment and competitive conditions. As a result, we do not record backlog.
Critical Accounting Policies
The discussion and analysis of our financial condition and results of operations is based upon our combined financial statements, which have been prepared in accordance with accounting principles generally accepted in the United States of America. The preparation of these financial statements requires us to make estimates and judgments that affect the reported amount of assets and liabilities, revenues and expenses and related disclosure of contingent assets and liabilities at the date of our financial statements. Actual results may differ from these estimates under different assumptions or conditions.
Critical accounting policies are defined as those that are reflective of significant judgments and uncertainties and potentially result in materially different results under different assumptions and conditions. We believe that our critical accounting policies are limited to those described below. For a detailed discussion on the application of these and other accounting policies, see Note 1 to our consolidated and combined financial statements.
Revenue Recognition
Sales of products and services are recorded when the earnings process is complete. This generally occurs when the products are shipped to the customer in accordance with the contract or purchase order, risk of loss and title has passed to the customer, collectability is reasonably assured and pricing is fixed and determinable. In instances where title does not pass to the customer upon shipment, we recognize revenue upon delivery or customer acceptance, depending on the terms of the sales contract. Management provides allowances for credits and returns, based on historic experience, and adjusts such allowances as considered necessary
In connection with the sales of our products, we also provide certain supply chain management services to certain of our customers. These services include the timely replenishment of products at the customer site, while also minimizing the customer’s on‑hand inventory. These services are provided by us contemporaneously with the delivery of the product, and as such, once the product is delivered, we do not have a post‑delivery obligation to provide services to the customer. The price of such services is generally included in the price of the products delivered to the customer, and revenue is recognized upon delivery of the product, at which point, we have satisfied our obligations to the customer. We do not account for these services as a separate element, as the services do not have stand‑alone value and cannot be separated from the product element of the arrangement.
Service revenues from oilfield technical services and related rental equipment are recorded when services are performed and/or equipment is rented pursuant to a completed purchase order or MSA that sets forth firm pricing and payment terms.
Accounts Receivable
We perform ongoing credit evaluations of our customers and adjust credit limits based upon payment history and the customer’s current creditworthiness, as determined by our review of their current credit information. We continuously monitor collections and payments from our customers and maintain an allowance for estimated credit losses based upon our historical experience and any specific customer collection issues that we have identified. If the actual uncollected amounts significantly exceed the estimated allowance, our operating results would be significantly adversely affected. While such credit losses have historically been within our expectations and the provisions established, we cannot guarantee that we will continue to experience the same credit loss rates that we have in the past.
Inventories
Inventories, made up of finished goods, primarily consist of aerospace fasteners and consumables. We value inventories at the lower of cost or market, using “first‑in, first‑out” (FIFO) or weighted average cost method. During Fiscal 2016, we revised our methodology for estimating the provision required for excess and obsolete (“E&O”)
52
inventories. The new methodology more adequately considers historical demand of our inventory to project future demand in order to estimate the provision required for E&O inventories. Other factors considered in the methodology include expected market growth rates and related elements. The implementation of the changes in methodology did not impact the current period or any prior period provision for E&O inventory. Demand for our products can fluctuate from period to period depending on customer activity. Our estimates of future product demand may prove to be inaccurate, in which case we may have understated or overstated the provision required for excess, obsolete and unmarketable inventories. In the future, if our inventories are determined to be overvalued, we would be required to recognize such costs in our cost of goods sold at the time of such determination. Likewise, if our inventories are determined to be undervalued, we may have over‑reported our costs of goods sold in previous periods and would be required to recognize such additional operating income at the time of sale. Inventory reserves were approximately $59.6 and $40.4 as of January 31, 2017 and 2016, respectively.
Substantially all of our inventory is comprised of aerospace grade fasteners which support OEM production and the aftermarket over the life of the airframe. Inventory with a limited shelf life is continually monitored and reserved for in advance of expiration. The reserve for inventory with limited shelf life is not material to the Company’s financial statements.
Long‑Lived Assets and Goodwill
To conduct our global business operations and execute our strategy, we acquire tangible and intangible assets, which affect the amount of future period amortization expense and possible impairment expense that we may incur. The determination of the value of such intangible assets requires management to make estimates and assumptions that affect our consolidated and combined financial statements.
In accordance with ASC 350, Intangibles—Goodwill and Other (“ASC 350”), we assess potential impairment to goodwill of a reporting unit and to indefinite lived intangible assets on an annual basis, or between annual tests if an event occurs or circumstances change that would more likely than not reduce the fair value of a reporting unit or indefinite lived intangible asset below its carrying amount. An impairment loss occurs if the amount of the recorded goodwill exceeds the implied goodwill. We would be required to record any such impairment losses. To perform the annual assessment, we utilize a combination of income and market-based approaches to value the reporting units. The income approach to valuation relies on a discounted cash flow analysis to determine the fair value of each reporting unit, which considers forecasted cash flows discounted at an appropriate discount rate. The annual goodwill impairment test requires us to make a number of assumptions and estimates concerning future levels of revenue growth, operating margins and working capital requirements, which are based upon our long-term strategic plan. The discount rate is an estimate of the overall after-tax rate of return required by a market participant, whose weighted average cost of capital includes both equity and debt, including a risk premium.
During Fiscal 2015, the continued downturn in the oil and gas industry, including the approximate 75% decrease in the number of onshore drilling rigs and the resulting significant cut backs in the capital expenditures of our customers, represented a significant adverse change in the business climate, which indicated that the ESG reporting unit’s goodwill may be impaired and ESG asset group’s long-lived assets may not be recoverable. As a result, during the third quarter ended October 31, 2015, the Company performed an interim goodwill impairment test and a long-lived asset recoverability test.
The valuation of the ESG reporting unit goodwill step one impairment test was estimated using the guideline public company analysis and the discounted cash flow analysis, which were equally weighted in the fair value analysis. See “Note 14 – Fair Value Information” for additional information regarding the fair value determination. The results of the first and second step of the goodwill impairment test indicated that goodwill was impaired, which resulted in a $310.4 goodwill impairment charge for Fiscal 2015.
In accordance with ASC 360, Property, Plant, and Equipment, we assess potential impairment to long lived assets (property and equipment and amortized intangible assets) when there is evidence that events or changes in circumstances indicate that the carrying amount of an asset may not be recovered. Our judgment regarding the existence of impairment indicators and future cash flows related to intangible assets is based on operational performance of our
53
acquired businesses, expected changes in the global economy, aerospace industry projections, discount rates and other judgmental factors.
The continued downturn in the oil and gas industry represented a change in circumstances indicating the carrying amount of long-lived assets may not be recovered. An impairment loss is recognized when the undiscounted cash flows expected to be generated by an asset (or group of assets) is less than its carrying amount. Any required impairment loss is measured as the amount by which the asset’s carrying value exceeds its fair value and is recorded as a reduction in the carrying value of the related asset and a charge to operating results. Based on the impairment indicators above, we performed a long-lived asset impairment analysis and concluded the carrying amount of the long-lived assets exceeded the undiscounted cash flows of the ESG asset group. As a result, we recorded a $329.8 long-lived asset impairment charge, $177.8 related to identified intangible assets and $152.0 related to property and equipment for Fiscal 2015. The charges eliminated the full value of the goodwill and identified intangible assets attributable to the ESG segment. The Company finalized the impairment analyses during the fourth quarter ended January 31, 2016. The accumulated goodwill impairment losses (incurred in 2008 and 2015) totaled $601.1 as of January 31, 2016. As goodwill related to ESG was substantially written off during the prior year period, there was no goodwill impairment in the year ended January 31, 2017. Similarly, there was no long lived asset impairment in the year ended January 31, 2017.
While we use the best available information to prepare our cash flow and discount rate assumptions, actual future cash flows or market conditions could differ significantly resulting in the potential for future impairment charges related to recorded goodwill balances. While there are always changes in assumptions to reflect changing business and market conditions, our overall methodology and assumptions used have remained unchanged. Any future impairment loss could have an adverse impact on our results of operations. As of January 31, 2017, our management believes the estimated fair value of each of our reporting units with goodwill balances, our indefinite lived intangible assets and each of our long lived assets were in excess of their carrying values. There were no indicators of goodwill or intangible asset impairment at January 31, 2017.
Accounting for Income Taxes
Significant management judgment is required in evaluating our tax positions and in determining our provision for income taxes, our deferred tax assets and liabilities and any valuation allowance recorded against our net deferred tax assets. We have recorded a valuation allowance of $17.8 as of January 31, 2017, due to uncertainties related to our ability to utilize our deferred tax assets, primarily consisting of our foreign net operating losses. The valuation allowance is based on our estimates of taxable income by jurisdiction in the jurisdictions in which we operate and the period over which our deferred tax assets will be recoverable. In the event that actual results differ from these estimates, or we revise these estimates in future periods, we may need to adjust the valuation allowance which could materially impact our financial position and results of operations. We have not provided for any residual U.S. income taxes on approximately $68.8 of earnings from our foreign subsidiaries because such earnings are intended to be indefinitely reinvested. It is not practicable to determine the amount of U.S. income and foreign withholding tax payable in the event all such foreign earnings are repatriated.
Effect of Inflation
Inflation has not had and is not expected to have a significant effect on our operations.
ITEM 7A. QUANTITATIVE AND QUALITATIVE DISCLOSURES ABOUT MARKET RISK
We are exposed to a variety of risks, including foreign currency fluctuations and changes in interest rates affecting the cost of our variable‑rate secured revolving credit facility.
Foreign currency—We have direct operations in Europe that receive revenues from customers primarily in U.S. dollars and we purchase raw materials and component parts from foreign vendors primarily in British pounds or Euros. Accordingly, we are exposed to transaction gains and losses that could result from changes in foreign currency exchange rates relative to the U.S. dollar. Our largest foreign currency exposure results from activity in British pounds and Euros.
54
In the future, we and our foreign subsidiaries may enter into foreign currency exchange contracts to manage risk on transactions conducted in foreign currencies. At January 31, 2017, we had no outstanding foreign currency exchange contracts. In addition, we have not entered into any other derivative financial instruments.
Interest Rates—As of January 31, 2017, we have no adjustable rate debt outstanding. We do not engage in transactions intended to hedge our exposure to changes in interest rates.
As of January 31, 2017, we maintained a portfolio of cash securities consisting mainly of taxable, interest‑bearing deposits with weighted average maturities of less than three months. If short‑term interest rates were to increase or decrease by 10%, we estimate interest income would increase or decrease by approximately $0.1.
ITEM 8. FINANCIAL STATEMENTS AND SUPPLEMENTARY DATA
The information required by this section is set forth beginning on page F‑1 of this Form 10‑K.
ITEM 9. CHANGES IN AND DISAGREEMENTS WITH ACCOUNTANTS ON ACCOUNTING AND FINANCIAL DISCLOSURE
None.
ITEM 9A. CONTROLS AND PROCEDURES
Evaluation of Disclosure Controls and Procedures
Our management, with the participation of our Chief Executive Officer (CEO), Chief Financial Officer (CFO) and Chief Operating Officer (COO), performed an evaluation of the effectiveness of the design and operation of our disclosure controls and procedures pursuant to Rule 13a‑15(e) of the Exchange Act as of January 31, 2017, the end of the period covered by this Annual Report on form 10-K. Based on such evaluation, our CEO, CFO and COO concluded that there was a material weakness in the design and operating effectiveness of the Company’s review controls related to the evaluation of the accounting treatment of significant events and transactions as of January 31, 2017, and that this material weakness also existed as of January 31, 2016. Due to the material weakness in internal control over financial reporting described below, our CEO, CFO and COO concluded the disclosure controls and procedures were not effective as of January 31, 2017.
Changes in Internal Control over Financial Reporting
Except as described below, there were no changes in our internal control over financial reporting identified in management’s evaluation pursuant to Rules 13a-15(d) or 15d-15(d) of the Exchange Act during the quarter ended January 31, 2017 that materially affected, or are reasonably likely to materially affect, our internal control over financial reporting.
55
MANAGEMENT’S ANNUAL REPORT ON INTERNAL CONTROL OVER FINANCIAL REPORTING
The management of KLX Inc. (“KLX” or the “Company”) is responsible for establishing and maintaining adequate internal control over financial reporting for the Company. Internal control over financial reporting is a process designed by, or under the supervision of, the Company’s principal executive and principal financial officers, and effected by the Company’s Board of Directors, management and other personnel, to provide reasonable assurance regarding the reliability of financial reporting and the preparation of the Company’s financial statements for external purposes in accordance with generally accepted accounting principles.
The Company’s internal control over financial reporting includes those policies and procedures that: (1) pertain to the maintenance of records that, in reasonable detail, accurately and fairly reflect the transactions and dispositions of the assets of the Company; (2) provide reasonable assurance that transactions are recorded as necessary to permit preparation of financial statements in accordance with generally accepted accounting principles and the receipts and expenditures of the Company are being made only in accordance with authorizations of the management and directors of the Company; and (3) provide reasonable assurance regarding prevention or timely detection of unauthorized acquisition, use or disposition of the Company’s assets that could have a material effect on the financial statements.
Because of its inherent limitations, internal control over financial reporting may not prevent or detect misstatements. Projections of any evaluation of effectiveness to future periods are subject to the risk that controls may become inadequate because of changes in conditions or that the degree of compliance with the policies or procedures may deteriorate.
The Company’s management assessed the effectiveness of the Company’s internal control over financial reporting as of January 31, 2017. The Company acquired the Herndon Aerospace and Defense LLC business on May 17, 2016 (“Herndon”). Management excluded from its assessment the internal control over financial reporting at the portion of the Herndon business which has not yet been integrated and whose financial statements constitute approximately 6.0% of total assets and approximately 5.0% of revenues of the consolidated financial statement amounts as of and for the year ended January 31, 2017. In making the assessment, the Company’s management used the criteria set forth by the Committee of Sponsoring Organizations of the Treadway Commission in Internal Control – Integrated Framework (2013).
On March 31, 2017, management concluded there was an error related to the Company’s application of an accounting principle on a long-term contract with a specific customer that resulted in revenue recognition related to end-of-program and end-of-contract claims, before all criteria were met. The correction of the error resulted in a reduction in revenues and operating earnings recognized for end-of-program and end-of-contract claims, as well as corresponding adjustments to inventories and accounts receivable. Revenues will be recognized under this long-term contract upon the settlement of the claims, which management expects to occur during 2017.
After consultation with the Audit Committee, management concluded that although the revenue recognition errors were not material, there was a material weakness in internal control over financial reporting due to the design and operating effectiveness of controls over the evaluation of the accounting treatment of significant events and transactions that existed as of January 31, 2017. This material weakness allowed the error in the application of the accounting principle on a long-term contract to go undetected. Accordingly, management has concluded that the Company’s internal control over financial reporting was not effective as of January 31, 2017, due to this material weakness.
The independent registered public accounting firm that audited the financial statements included in this annual report has issued an attestation report on the Company’s internal control over financial reporting.
56
REMEDIATION STATUS
As of the date of this filing, the Company now utilizes the correct accounting principle with respect to claims related to the new long-term contract, and management is evaluating controls related to significant events and transactions including the termination of programs under, or expiration of, this customer-specific, new long-term contract.
57
REPORT OF INDEPENDENT REGISTERED PUBLIC ACCOUNTING FIRM
To the Board of Directors and Stockholders of
KLX Inc.
Wellington, Florida
We have audited the internal control over financial reporting of KLX Inc. and subsidiaries (the "Company") as of January 31, 2017, based on criteria established in Internal Control — Integrated Framework (2013) issued by the Committee of Sponsoring Organizations of the Treadway Commission. As described in Management’s Annual Report on Internal Control over Financial Reporting, management excluded from its assessment the internal control over financial reporting a portion of Herndon Aerospace and Defense LLC which was acquired on May 17, 2016 and whose financial statements constitute approximately 6.0% of total assets and approximately 5.0% of revenues of the consolidated financial statement amounts as of and for the year ended January 31, 2017. The Company's management is responsible for maintaining effective internal control over financial reporting and for its assessment of the effectiveness of internal control over financial reporting, included in the accompanying Management’s Annual Report on Internal Control over Financial Reporting. Our responsibility is to express an opinion on the Company's internal control over financial reporting based on our audit.
We conducted our audit in accordance with the standards of the Public Company Accounting Oversight Board (United States). Those standards require that we plan and perform the audit to obtain reasonable assurance about whether effective internal control over financial reporting was maintained in all material respects. Our audit included obtaining an understanding of internal control over financial reporting, assessing the risk that a material weakness exists, testing and evaluating the design and operating effectiveness of internal control based on the assessed risk, and performing such other procedures as we considered necessary in the circumstances. We believe that our audit provides a reasonable basis for our opinion.
A company's internal control over financial reporting is a process designed by, or under the supervision of, the company's principal executive and principal financial officers, or persons performing similar functions, and effected by the company's board of directors, management, and other personnel to provide reasonable assurance regarding the reliability of financial reporting and the preparation of financial statements for external purposes in accordance with generally accepted accounting principles. A company's internal control over financial reporting includes those policies and procedures that (1) pertain to the maintenance of records that, in reasonable detail, accurately and fairly reflect the transactions and dispositions of the assets of the company; (2) provide reasonable assurance that transactions are recorded as necessary to permit preparation of financial statements in accordance with generally accepted accounting principles, and that receipts and expenditures of the company are being made only in accordance with authorizations of management and directors of the company; and (3) provide reasonable assurance regarding prevention or timely detection of unauthorized acquisition, use, or disposition of the company's assets that could have a material effect on the financial statements.
Because of the inherent limitations of internal control over financial reporting, including the possibility of collusion or improper management override of controls, material misstatements due to error or fraud may not be prevented or detected on a timely basis. Also, projections of any evaluation of the effectiveness of the internal control over financial reporting to future periods are subject to the risk that the controls may become inadequate because of changes in conditions, or that the degree of compliance with the policies or procedures may deteriorate.
A material weakness is a deficiency, or a combination of deficiencies, in internal control over financial reporting, such that there is a reasonable possibility that a material misstatement of the company’s annual or interim financial statements will not be prevented or detected on a timely basis. The following material weakness has been identified and included in management's assessment: a material weakness in the design and operating effectiveness of the Company’s controls over the evaluation of the accounting treatment of significant events and transactions. This material weakness was considered in determining the nature, timing, and extent of audit tests applied in our audit of the consolidated financial statements
58
and financial statement schedule as of and for the year ended January 31, 2017, of the Company and this report does not affect our report on such financial statements and financial statement schedule.
In our opinion, because of the effect of the material weakness identified above on the achievement of the objectives of the control criteria, the Company has not maintained effective internal control over financial reporting as of January 31, 2017, based on the criteria established in Internal Control — Integrated Framework (2013) issued by the Committee of Sponsoring Organizations of the Treadway Commission.
We have also audited, in accordance with the standards of the Public Company Accounting Oversight Board (United States), the consolidated financial statements and financial statement schedule as of and for the year ended January 31, 2017 of the Company and our report dated April 14, 2017 expressed an unqualified opinion on those financial statements and financial statement schedule.
/s/ Deloitte & Touche LLP
Certified Public Accountants
Boca Raton, Florida
April 14, 2017
59
60
PART III
ITEM 10. DIRECTORS, EXECUTIVE OFFICERS AND CORPORATE GOVERNANCE
Our Executive Officers
The following table sets forth information regarding our executive officers as of April 14, 2017.
|
Name and Title |
|
Business Experience |
||
|
Amin J. Khoury |
Amin J. Khoury has served as Chief Executive Officer and Chairman of the Board of Directors of KLX Inc. since its formation in December 2014. Mr. Khoury co‑founded B/E Aerospace in July 1987 and served as its Chairman of the Board until its sale to Rockwell Collins in April. Mr. Khoury served as Chief Executive Officer of B/E Aerospace from December 31, 2005 through December 31, 2013. Mr. Khoury also served as the Co‑Chief Executive Officer of B/E Aerospace from January 1, 2014 to December 16, 2014. Mr. Khoury was a Trustee of the Scripps Research Institute from May 2008 until July 2014 and was a director of Synthes Incorporated until its acquisition by Johnson & Johnson in 2012. Mr. Khoury holds an Executive Masters Professional Director Certification, the highest level, from the American College of Corporate Directors. |
|||
|
Thomas P. McCaffrey |
Thomas P. McCaffrey has served as President and Chief Operating Officer of KLX Inc. since December 16, 2014. Previously, Mr. McCaffrey served as Senior Vice President and Chief Financial Officer of B/E Aerospace from May 1993 until December 16, 2014. Prior to joining B/E Aerospace, Mr. McCaffrey was an Audit Director with Deloitte & Touche LLP from August 1989 through May 1993, and from 1976 through 1989 served in several capacities, including Audit Partner, with Coleman & Grant LLP. Mr. McCaffrey is a Certified Public Accountant licensed to practice in the states of Florida, California and Colorado. |
|||
|
Michael F. Senft |
Michael F. Senft has served as Vice President and Chief Financial Officer and Treasurer of KLX Inc. since December 16, 2014. Previously, Mr. Senft served on the Board of Directors of B/E Aerospace from February 2012 until September 2014. Mr. Senft previously was a Managing Director of Moelis & Company. For more than 20 years, he has advised on B/E Aerospace’s long‑term capital transactions and strategic acquisitions. Mr. Senft has also served on the Board of Directors of Moly Mines Ltd. and Del Monte Foods. Mr. Senft’s prior positions include Global Head of Leveraged Finance at CIBC and Global Co‑Head of Leveraged Finance at Merrill Lynch. |
|||
|
John Cuomo |
John Cuomo has served as Vice President and General Manager of the Aerospace Solutions Group segment of KLX Inc. since December 16, 2014. Previously, Mr. Cuomo served as Vice President and General Manager, Consumables Management business since July 2014. He has over 15 years of experience in the aerospace consumables distribution market and served in multiple roles and functions at B/E Aerospace Consumables Management from April 2000 to February 2014, with the most recent being Senior Vice President, Sales, Marketing and Business Development. Prior to joining B/E Aerospace, Mr. Cuomo served as an attorney at a large multi‑national law firm practicing commercial law, mergers and acquisitions and litigation. He has a Bachelor of Science in International Business, a Juris Doctorate from the University of Miami and a Master of Business Administration from the University of Florida. |
|||
61
|
Name and Title |
|
Business Experience |
||
|
Gary Roberts |
Gary Roberts has served as Vice President and General Manager of the Energy Services Group segment of KLX Inc. since December 16, 2014. Previously, Mr. Roberts served as Vice President and General Manager, Energy Services Group since April 2014. Previously, Mr. Roberts was the Chief Executive Officer of Vision Oil Tools, LLC, a private energy services company, from 2010 until its acquisition by B/E Aerospace. Before that, Mr. Roberts was General Manager for Complete Production Services, Inc. and worked for Weatherford International from 1991 to 2008, holding management positions with increasing levels of responsibility in Singapore, China, Indonesia and Qatar. Mr. Roberts brings to KLX Inc. over 30 years of oilfield experience. |
|||
|
Roger Franks |
Roger Franks served as Associate General Counsel of B/E Aerospace until December 16, 2014 when he joined the Company as General Counsel, Vice President—Law and Human Resources. Mr. Franks joined the B/E Aerospace Legal Department in January 2010, where he oversaw employee matters, commercial disputes, compliance and general corporate law. Prior to joining B/E Aerospace, he was on the Board of Directors of a mid‑size California law firm where he focused on commercial matters including employment law and litigation. |
|||
|
Heather Floyd |
Heather Floyd served as Vice President—Internal Audit of B/E Aerospace until December 16, 2014 when she joined the Company as Vice President—Finance and Corporate Controller. Ms. Floyd has over 13 years of combined accounting, auditing, financial reporting and Sarbanes‑Oxley compliance experience. Ms. Floyd joined B/E Aerospace in November 2010 as Director of Financial Reporting and Internal Controls. Prior to joining B/E Aerospace, Ms. Floyd served as an Audit Manager with Ernst & Young LLP and in various accounting roles at Corporate Express, now a subsidiary of Staples. |
|||
Our Board of Directors
The following table sets forth information regarding our directors as of April 14, 2017. The table contains each person’s biography as well as the qualifications and experience each person would bring to our Board. Our Board
62
consists of eight members, seven of whom will meet applicable regulatory and exchange listing independence requirements.
|
Name and Title |
|
Business Experience and Director Qualifications |
|
|
Amin J. Khoury |
78 |
Amin J. Khoury, our Chief Executive Officer and Chairman of our Board of Directors since our formation, co-founded B/E Aerospace in July 1987 and served as its Chairman of the Board. Mr. Khoury served as Chief Executive Officer of B/E Aerospace from December 31, 2005 through December 31, 2013. Mr. Khoury also served as the Co-Chief Executive Officer of B/E Aerospace from January 1, 2014 to December 16, 2014. Mr. Khoury was a Trustee of the Scripps Research Institute from May 2008 until July 2014. Mr. Khoury holds an Executive Masters Professional Director Certification, the highest level, from the American College of Corporate Directors. During his time at B/E Aerospace, Mr. Khoury was primarily responsible for the development and execution of B/E Aerospace's business strategies that resulted in its growth from a single product line business with $3.0 million in annual sales, to the leading global manufacturer of commercial aircraft and business jet cabin interior products and the world's leading distributor of aerospace consumable products, with annual revenues in 2013 of $3.5 billion. Mr. Khoury led the strategic planning and acquisition strategy of B/E Aerospace as well as its operational integration and execution strategies. He is a highly effective leader in organizational design and development matters and has been instrumental in identifying and attracting both our managerial talent and Board members. He has an intimate knowledge of the Company, its industry and its competitors which he has gained over the last 30 years at B/E Aerospace. All of the above experience and leadership roles uniquely qualify him to serve as our Company's Chairman of the Board. |
|
|
John T. Collins |
70 |
John T. Collins has been a Director since December 2014. Mr. Collins is the Chairman and Chief Executive Officer of The Collins Group, Inc., a manager of a private securities portfolio and minority interest holder in several privately held companies, since 1992. From 1986 to 1992, Mr. Collins served as the President and Chief Executive Officer of Quebecor Printing (USA) Inc., which was formed in 1986 by a merger with Semline Inc., where he had served in various positions since 1968, including since 1973 as President. During his term, Mr. Collins guided Quebecor Printing (USA) Inc. through several large acquisitions and situated the company to become one of the leaders in the industry. Mr. Collins previously served on the Board of Directors for several public companies including Federated Funds, Inc., Bank of America Corp., and FleetBoston Financial. In addition Mr. Collins has served as Chairman of the Board of Trustees of his alma mater, Bentley University. Our Board benefits from Mr. Collins's many years of experience in the management, acquisition, and development of several companies. |
|
63
|
Name and Title |
|
Business Experience and Director Qualifications |
|
|
Peter V. Del Presto |
66 |
Peter Del Presto has been a Director since December 2014. Mr. Del Presto is an adjunct professor of finance at the University of Pittsburgh, where he teaches courses covering capital markets, advanced valuation methods and private equity. From 1985 until his retirement in 2010, Mr. Del Presto was a partner with PNC Equity Partners, a private equity firm and an affiliate of PNC Bank targeting middle market companies for acquisition and investment. During his 25 years at PNC Equity Partners, Mr. Del Presto led the firm’s investment in 35 companies and participated as a member of the firm’s Investment Committee in over 200 investments. Mr. Del Presto was PNC Equity Partner’s representative on the boards of 24 companies where he was responsible for the development of value creation strategies in each. Mr. Del Presto is a director of Spencer Turbine Company and Markel Corporation, a member of the Board of Advisors of Sabert Corporation and the principal shareholder of two smaller companies. Mr. Del Presto is also a licensed private pilot. Our Board benefits from Mr. Del Presto’s background in engineering and business administration, his expertise in the field of finance, and 25 years of experience in the acquisition, investment and development of numerous companies. |
|
|
Richard G. Hamermesh |
69 |
Richard G. Hamermesh has been a Director since December 2014. Dr. Hamermesh is a Senior Fellow at the Harvard Business School, where he was formerly the MBA Class of 1961 Professor of Management Practice from 2002 to 2015. From 1987 to 2001, he was a co-founder and a Managing Partner of The Center for Executive Development, an executive education and development consulting firm. From 1976 to 1987, Dr. Hamermesh was a member of the faculty of Harvard Business School. He is also an active investor and entrepreneur, having participated as a principal, director and investor in the founding and early stages of more than 15 organizations. Dr. Hamermesh is a member of the Board of Directors of SmartCloud, Inc. and was a director of B/E Aerospace, Inc until its sale to Rockwell Collins in April 2012. |
|
|
Benjamin A. Hardesty |
67 |
Benjamin A. Hardesty has been a Director since December 2014. Mr. Hardesty has been the owner of Alta Energy LLC, a consulting business focused on oil and natural gas in the Appalachian Basin and onshore United States since 2010. In May 2010, Mr. Hardesty retired as president of Dominion E&P, Inc., a subsidiary of Dominion Resources Inc. engaged in the exploration and production of oil and natural gas in North America, a position he had held since September 2007. After joining Dominion Resources in 1995, Mr. Hardesty had previously also served in other executive positions, including president of Dominion Appalachian Development, Inc. and general manager and vice president Northeast Gas Basin. Mr. Hardesty has served on the Board of Directors of Antero Resources Corporation since its initial public offering in October 2013. He previously was a member of the Board of Directors of Blue Dot Energy Services, LLC from 2011 until its sale to B/E Aerospace in 2013. From 1982 to 1995, Mr. Hardesty served as an officer and director of Stonewall Gas Company, and from 1978 to 1982 as vice president of operations of Development Drilling Corporation. Mr. Hardesty is director emeritus and past president of the West Virginia Oil & Natural Gas Association and past president of the Independent Oil & Gas Association of West Virginia. Mr. Hardesty serves on the Visiting Committee of the Petroleum Natural Gas Engineering Department of the College of Engineering and Mineral Resources at West Virginia University. Mr. Hardesty’s significant experience in the oil and natural gas industry, including in our areas of operation, make him well suited to serve as a member of our Board. |
|
64
|
Name and Title |
|
Business Experience and Director Qualifications |
|
|
Stephen M. Ward, Jr. |
62 |
Stephen M. Ward, Jr., has been a Director since December 2014. Mr. Ward has been a director of Carpenter Technology Corporation since 2001, where he is Chair of the Corporate Governance Committee and a member of the Human Resources and Science and Technology Committees. Mr. Ward previously served as President and Chief Executive Officer of Lenovo Corporation, which was formed by the acquisition of IBM Corporation’s personal computer business by Lenovo of China. Mr. Ward had spent 26 years at IBM Corporation holding various management positions, including Chief Information Officer and Senior Vice President and General Manager, Personal Systems Group. Mr. Ward is a co-founder and Board member of C3-IoT, a company that develops and sells internet of things software for analytics and control, and the Chairman of the Board of QDVision, the developer and manufacturer of quantum dot technology for the computer, TV and display industries. Mr. Ward was previously a Board member and founder of E2open, a maker of enterprise software, and a Board member of E-Ink, a maker of high-tech screens for e-readers and computers. Mr. Ward’s broad executive experience and focus on innovation enables him to share with our Board valuable perspectives on a variety of issues relating to management, strategic planning, tactical capital investments, and international growth. |
|
|
Theodore L. Weise |
73 |
Theodore L. Weise has been a Director since December 2014. Mr. Weise is currently a business consultant and serves on the Board of Directors of Hawthorne Global Aviation Services. Mr. Weise joined Federal Express Corporation in 1972 during its formative years and retired in 2000 as its President and Chief Executive Officer. He held many officer positions including Executive Vice President of World Wide Operations and led the following divisions as its Senior Vice President: Air Operations, Domestic Ground Operations, Central Support Services, Business Service Centers, and Operations Planning. Prior to joining Federal Express Corporation, Mr. Weise flew on the US Air Force F 111 as a Flight Test Engineer for General Dynamics Corp. He has previously served on the boards of Federal Express Corporation, Computer Management Sciences, Inc., ResortQuest International, Inc. and Pogo Jet, Inc. Mr. Weise is a member of the Missouri University of Science and Technology Board of Trustees, of which he was a past President. Mr. Weise is a jet rated Airline Transport Pilot with over 5,700 flight hours. He holds an Executive Masters Professional Director Certification from the American College of Corporate Directors. Mr. Weise brings to our Board his extensive leadership experience. |
|
|
John T. Whates, Esq. |
69 |
John T. Whates has been a Director since December 2014. Mr. Whates has been an independent tax advisor and involved in venture capital and private investing since 2005. He is a member of the Board of Dynamic Healthcare Systems, Inc. and was the Chairman of the Compensation Committee of B/E Aerospace until its sale to Rockwell Collins in April 2017. From 1994 to 2011, Mr. Whates was a tax and financial advisor to B/E Aerospace, providing business and tax advice on essentially all of its significant strategic acquisitions. Previously, Mr. Whates was a tax partner in several of the largest public accounting firms, most recently leading the High Technology Group Tax Practice of Deloitte LLP in Orange County, California. He has extensive experience working with aerospace and other public companies in the fields of tax, equity financing and mergers and acquisitions. Mr. Whates is an attorney licensed to practice in California and was an Adjunct Professor of Taxation at Golden Gate University. Our Board benefits from Mr. Whates’s extensive experience, multi dimensional educational background, and thorough knowledge of our business and industry. |
|
Structure of the Board of Directors
Our Board is divided into three classes of directors. Directors of each class are chosen for three year terms upon the expiration of their current terms, and each year our stockholders elect one class of our directors. The directors
65
designated as Class I directors had terms that expired at our first annual meeting of stockholders in August 2015, the directors designated as Class II directors have terms expiring at our second annual meeting of stockholders in August 2016, and the directors designated as Class III directors have terms expiring at our third annual meeting of stockholders in August 2017. The current term for the Class I directors expires at our fourth annual meeting of stockholders, in August 2018.
Audit Committee
We have a separately‑designated standing Audit Committee established in accordance with Section 3(a)(58)(A) of the Exchange Act. Messrs. Del Presto, Hardesty, Weise and Whates currently serve as members of the Audit Committee. Under the current SEC rules and the rules of NASDAQ, all of the members are independent. Our Board has determined that Mr. Del Presto is an “audit committee financial expert” in accordance with current SEC rules. All members of the Audit Committee are independent, as that term is used in Item 407 of Regulation S‑K of the federal securities laws.
Section 16(a) Beneficial Ownership Reporting Compliance
Section 16(a) of the Exchange Act requires our directors and executive officers, and persons who own more than ten percent of a registered class of our equity securities, to file with the SEC initial reports of ownership and reports of changes in ownership of our common stock and other equity securities. Officer, directors and greater‑than‑ten percent stockholders are required by SEC regulations to furnish us with copies of all Section 16(a) forms they file.
Code of Business Conduct
Our Board has adopted a code of business conduct that applies to all our directors, officers and employees worldwide, including our principal executive officer, principal financial officer, controller, treasurer and all other employees performing a similar function. We maintain a copy of our code of business conduct, including any amendments thereto and any waivers applicable to any of our directors and officers, on our website at www.klx.com.
ITEM 11. EXECUTIVE COMPENSATION
Information set forth under the captions “Compensation of Directors” and “Compensation Discussion and Analysis” in the Proxy Statement or Annual Report on Form 10‑K/A is incorporated by reference herein.
ITEM 12. SECURITY OWNERSHIP OF CERTAIN BENEFICIAL OWNERS AND MANAGEMENT AND RELATED STOCKHOLDER MATTERS
Information set forth under the captions “Security Ownership of Certain Beneficial Owners and Management” in the Proxy Statement or Annual Report on Form 10‑K/A is incorporated by reference herein.
ITEM 13. CERTAIN RELATIONSHIPS AND RELATED PARTY TRANSACTIONS, AND DIRECTOR INDEPENDENCE
Information set forth under the captions “Certain Relationships and Related Party Transactions” in the Proxy Statement or Annual Report on Form 10‑ K/A is incorporated by reference herein.
ITEM 14. PRINCIPAL ACCOUNTANT FEES AND SERVICES
Information set forth under the caption “Principal Accountant Fees and Services” in the Proxy Statement or Annual Report on Form 10K/A is incorporated by reference herein.
66
PART IV
ITEM 15. EXHIBITS AND FINANCIAL STATEMENT SCHEDULES
(a)Financial Statements
The information required by this item is contained under the section “Index to Consolidated and Combined Financial Statements and Schedule” beginning on page F‑1 of this Form 10‑K.
(b)Exhibits
We are filing the following documents as exhibits to this Form 10‑K:
|
Exhibit No. |
Description |
|
2.1 |
Separation and Distribution Agreement, dated as of December 15, 2014, between B/E Aerospace, Inc. and KLX Inc. (incorporated by reference to Exhibit 2.1 to the Company’s Current Report on Form 8‑K filed with the SEC on December 19, 2014). |
|
2.2 |
Stock Purchase Agreement, dated as of May 17, 2016, by and among KLX Inc., Polytrade Holding Corp., Herndon Products Holding Corp., the Sellers and the Sellers’ Representative Named Therein (incorporated by reference to Exhibit 2.1 to the Company’s Quarterly Report on Form 10-Q filed with the SEC on September 9, 2016). |
|
3.1 |
Amended and Restated Certificate of Incorporation of KLX Inc. (incorporated by reference to Exhibit 3.1 to the Company’s Current Report on Form 8‑K filed with the SEC on December 19, 2014). |
|
3.2 |
Amended and Restated By‑Laws of KLX Inc. (incorporated by reference to Exhibit 3.1 to the Company’s Current Report on Form 8‑K filed with the SEC on August 13, 2015). |
|
4.1 |
Indenture (including form of notes), dated December 8, 2014, between KLX Inc., as the issuer, and Wilmington Trust, National Association, as trustee (incorporated by reference to Exhibit 4.1 to the Company’s Current Report on Form 8‑K filed with the SEC on December 12, 2014). |
|
4.1.1 |
First Supplemental Indenture, dated as of December 16, 2014, by and among KLX Inc., as Issuer, the Guarantors named therein and Wilmington Trust Company, as Trustee.** |
|
4.1.2 |
Second Supplemental Indenture, dated as of August 2, 2016, by and among KLX Inc., as Issuer, the Guarantors named therein and Wilmington Trust Company, as Trustee (incorporated by reference to Exhibit 4.1 to the Company’s Quarterly Report on Form 10-Q filed with the SEC on December 9, 2016). |
|
10.1 |
Tax Sharing and Indemnification Agreement, dated as of December 15, 2014, between B/E Aerospace, Inc. and KLX Inc. (incorporated by reference to Exhibit 10.1 to the Company’s Current Report on Form 8‑K filed with the SEC on December 19, 2014). |
|
10.2 |
First Amendment to Tax Sharing and Indemnification Agreement, dated as of October 23, 2016, between B/E Aerospace, Inc. and KLX Inc.** |
|
10.3 |
Employee Matters Agreement, dated as of December 15, 2014, between B/E Aerospace, Inc. and KLX Inc. (incorporated by reference to Exhibit 10.2 to the Company’s Current Report on Form 8‑K filed with the SEC on December 19, 2014). |
|
10.4 |
Transition Services Agreement, dated December 16, 2014, between B/E Aerospace, Inc. and KLX Inc. (incorporated by reference to Exhibit 10.3 to the Company’s Current Report on Form 8‑K filed with the SEC on December 19, 2014). |
|
10.5 |
IT Services Agreement, dated as of December 16, 2014, by and between B/E Aerospace, Inc. and KLX Inc. (incorporated by reference to Exhibit 10.4 to the Company’s Current Report on Form 8‑K filed with the SEC on December 19, 2014). |
|
10.6 |
Stock and Asset Purchase Agreement, dated June 9, 2008, between B/E Aerospace, Inc. and Honeywell International Inc. (incorporated by reference to Exhibit 2.1 to B/E Aerospace, Inc.’s Current Report on Form 8‑K dated June 9, 2008, filed with the SEC on June 11, 2008 (File No. 000‑18348)). |
|
10.7 |
Supply Agreement, dated as of July 28, 2008, between B/E Aerospace, Inc. and Honeywell International Inc. (incorporated by reference to Exhibit 10.5 to the Company’s Amendment No. 2 to Form 10 filed with the SEC on November 13, 2014).† |
67
|
Exhibit No. |
Description |
|
10.8 |
License Agreement, dated as of July 28, 2008, between B/E Aerospace, Inc. and Honeywell International Inc. (incorporated by reference to Exhibit 10.6 to the Company’s Amendment No. 2 to Form 10 filed with the SEC on November 13, 2014).† |
|
10.9 |
Stockholders Agreement, dated as of July 28, 2008, among B/E Aerospace, Inc. and Honeywell International Inc., Honeywell UK Limited, Honeywell Holding France SAS and Honeywell Deutschland GmbH (incorporated by reference to Exhibit 10.3 to B/E Aerospace, Inc.’s Quarterly Report on Form 10‑Q for the quarter ended September 30, 2008, filed with the SEC on November 7, 2008 (File No. 000‑ 18348)). |
|
10.10 |
Amended and Restated Employment Agreement between KLX Inc. and Amin J. Khoury, dated as of May 25, 2016 (incorporated by reference to Exhibit 10.1 to the Company’s Quarterly Report on Form10-Q filed with the SEC on September 9, 2016).* |
|
10.11 |
Death Benefit Agreement between KLX Inc. and Amin J. Khoury, dated as of May 25, 2016 (incorporated by reference to Exhibit 2.1 to the Company’s Quarterly Report on Form 10-Q filed with the SEC on September 9, 2016).* |
|
10.12 |
Employment Agreement between KLX Inc. and Thomas P. McCaffrey, dated as of February 27, 2015 (incorporated by reference to Exhibit 10.2 to the Company’s Quarterly Report on Form 10-Q filed with the SEC on May 28, 2015).* |
|
10.13 |
Employment Agreement between KLX Inc. and Michael F. Senft, dated as of February 27, 2015 (incorporated by reference to Exhibit 10.3 to the Company’s Quarterly Report on Form 10-Q filed with the SEC on May 28, 2015).* |
|
10.14 |
Employment Agreement between KLX Inc. and John Cuomo, dated as of December 22, 2015 (incorporated by reference to Exhibit 10.12 to the Company’s Annual Report on Form 10-K filed with the SEC on March 24, 2016).* |
|
10.15 |
Employment Agreement between KLX Inc. and Roger M. Franks, dated as of December 22, 2015 (incorporated by reference to Exhibit 10.13 to the Company’s Annual Report on Form 10-K filed with the SEC on March 24, 2016).* |
|
10.16 |
KLX Inc. Long‑Term Incentive Plan (incorporated by reference to Exhibit 4.3 to the Company’s Registration Statement on Form S‑8 (File No. 333‑200923) filed with the SEC on December 12, 2014).* |
|
10.17 |
KLX Inc. Employee Stock Purchase Plan (incorporated by reference to Exhibit 4.4 to the Company’s Registration Statement on Form S‑8 (File No. 333‑200923) filed with the SEC on December 12, 2014).* |
|
10.18 |
KLX Inc. Non‑Employee Directors Stock and Deferred Compensation Plan (incorporated by reference to Exhibit 4.5 to the Company’s Registration Statement on Form S‑8 (File No. 333‑200923) filed with the SEC on December 12, 2014). |
|
10.19 |
KLX Inc. 2014 Deferred Compensation Plan (incorporated by reference to Exhibit 4.3 to the Company’s Registration Statement on Form S‑8 (File No. 333‑200919) filed with the SEC on December 12, 2014).* |
|
10.20 |
Credit Agreement, dated as of May 19, 2015, by and between KLX Inc., the several Lenders, JPMorgan Chase Bank, N.A. (as Administrative Agent), J.P. Morgan Europe Limited (as European Collateral Agent), Citigroup Global Markets Inc., Goldman Sachs Bank, USA, Wells Fargo Bank, N.A., Royal Bank of Canada and Suntrust Bank (as Syndication Agents) and Barclays Bank PLC, Deutsche Bank Securities Inc., PNC Bank, National Association, Santander Bank, N.A and TD Bank, N.A. (as Documentation Agents) (incorporated by reference to Exhibit 10.1 to the Company’s Current Report on Form 8‑K filed with the SEC on May 20, 2015). |
|
10.21 |
Form of Restricted Stock Award Agreement (incorporated by reference to Exhibit 10.1 to the Company’s Current Report on Form 8‑K filed with the SEC on March 2, 2015).* |
|
10.22 |
Form of Restricted Stock Unit Award Agreement (incorporated by reference to Exhibit 10.2 to the Company’s Current Report on Form 8‑K filed with the SEC on March 2, 2015).* |
|
10.23 |
Form of Stock Option Award Agreement (incorporated by reference to Exhibit 10.3 to the Company’s Current Report on Form 8‑K filed with the SEC on March 2, 2015).* |
|
10.24 |
Medical Care Reimbursement Plan for Executives of KLX Inc. (incorporated by reference to Exhibit 10.1 to the Company’s Quarterly Report on Form 10-Q filed with the SEC on December 9, 2016).* |
|
21.1 |
List of subsidiaries of KLX Inc.** |
|
23.1 |
Consent of Independent Registered Public Accounting Firm—Deloitte & Touche LLP** |
|
31.1 |
Certification of Chief Executive Officer** |
68
|
Exhibit No. |
Description |
|
31.2 |
Certification of Chief Financial Officer** |
|
32.1 |
Certification of Chief Executive Officer pursuant to 18 U.S.C. Section 1350** |
|
32.2 101.INS 101.SCH 101.CAL 101.DEF 101.LAB 101.PRE |
Certification of Chief Financial Officer pursuant to 18 U.S.C. Section 1350** XBRL Instance Document XBRL Taxonomy Extension Schema Document XBRL Taxonomy Extension Calculation Linkbase Document XBRL Taxonomy Extension Definition Linkbase Document XBRL Extension Labels Linkbase XBRL Taxonomy Extension Presentation Linkbase Document
|
*Management contract or compensatory plan.
**Filed herewith.
†Portions of the exhibit were omitted and filed separately pursuant to a request for confidential treatment.
69
Pursuant to the requirements of Section 13 or 15(d) of the Securities Exchange Act of 1934, the registrant has duly caused this report to be signed on its behalf by the undersigned, thereunto duly authorized.
|
|
KLX INC. |
|
|
|
|
|
|
|
By: |
/s/ Amin J. Khoury
Amin J. Khoury |
Date: April 14, 2017
Pursuant to the requirements of the Securities Exchange Act of 1934, this report has been signed below by the following persons on behalf of the registrant and in the capacities and on the dates indicated.
|
|
|
|
|
/s/ Amin J. Khoury Amin J. Khoury |
Chairman and Chief Executive Officer (Principal Executive Officer) |
April 14, 2017 |
|
|
|
|
|
/s/ Michael F. Senft Michael F. Senft |
Vice President—Chief Financial Officer and Treasurer (Principal Financial Officer) |
April 14, 2017 |
|
|
|
|
|
/s/ Heather M. Floyd Heather M. Floyd |
Vice President—Finance and Corporate Controller (Principal Accounting Officer) |
April 14, 2017 |
|
|
|
|
|
/s/ John T. Collins John T. Collins |
Director |
April 14, 2017 |
|
|
|
|
|
/s/ Peter V. Del Presto Peter V. Del Presto |
Director |
April 14, 2017 |
|
|
|
|
|
/s/ Richard G. Hamermesh Richard G. Hamermesh |
Director |
April 14, 2017 |
|
|
|
|
|
/s/ Benjamin A. Hardesty Benjamin A. Hardesty |
Director |
April 14, 2017 |
|
|
|
|
|
/s/ Stephen M. Ward, Jr. Stephen M. Ward, Jr. |
Director |
April 14, 2017 |
|
|
|
|
|
/s/ Theodore L. Weise Theodore L. Weise |
Director |
April 14, 2017 |
|
|
|
|
|
/s/ John T. Whates John T. Whates |
Director |
April 14, 2017 |
70
INDEX TO CONSOLIDATED AND COMBINED FINANCIAL STATEMENTS AND SCHEDULE
|
|
Page |
|
F‑2 |
|
|
Consolidated and Combined Financial Statements: |
|
|
F‑3 |
|
|
F‑4 |
|
|
F‑5 |
|
|
F‑6 |
|
|
F‑7 |
|
|
Consolidated and Combined Financial Statement Schedule: |
|
|
F‑29 |
F-1
REPORT OF INDEPENDENT REGISTERED PUBLIC ACCOUNTING FIRM
To the Board of Directors and Stockholders of
KLX Inc.
Wellington, Florida
We have audited the accompanying consolidated balance sheets of KLX Inc. and subsidiaries (previously the Aerospace Solutions Group and Energy Services Group of B/E Aerospace, Inc. (“B/E”)) (the "Company") as of January 31, 2017 and 2016, and the related consolidated and combined statements of earnings and comprehensive income, stockholders' equity, and cash flows for each of the years ended January 31, 2017, January 31, 2016, and December 31, 2014 and for the one-month transition period ended January 31, 2015. Our audits also included the financial statement schedule listed in the Index at Item 15. These financial statements and financial statement schedule are the responsibility of the Company's management. Our responsibility is to express an opinion on the financial statements and financial statement schedule based on our audits.
We conducted our audits in accordance with the standards of the Public Company Accounting Oversight Board (United States). Those standards require that we plan and perform the audit to obtain reasonable assurance about whether the financial statements are free of material misstatement. An audit includes examining, on a test basis, evidence supporting the amounts and disclosures in the financial statements. An audit also includes assessing the accounting principles used and significant estimates made by management, as well as evaluating the overall financial statement presentation. We believe that our audits provide a reasonable basis for our opinion.
In our opinion, such consolidated and combined financial statements present fairly, in all material respects, the financial position of KLX Inc. and subsidiaries as of January 31, 2017 and 2016, and the results of their operations and their cash flows for the years ended January 31, 2017, January 31, 2016, December 31, 2014, and the one-month period ended January 31, 2015, in conformity with accounting principles generally accepted in the United States of America. Also, in our opinion, such financial statement schedule, when considered in relation to the basic consolidated financial statements taken as a whole, present fairly, in all material respects, the information set forth therein.
As discussed in Note 1 to the consolidated and combined financial statements, prior to the separation of the Company from B/E, the Company was comprised of the assets and liabilities used in managing and operating the Aerospace Solutions Group and Energy Services Group of B/E. For periods prior to the separation of the Company from B/E, the consolidated and combined financial statements also include allocations from B/E. These allocations may not be reflective of the actual level of assets, liabilities, or costs which would have been incurred had the Company operated as a separate entity apart from B/E. Included in Note 5 to the consolidated and combined financial statements is a summary of transactions with related parties.
We have also audited, in accordance with the standards of the Public Company Accounting Oversight Board (United States), the Company's internal control over financial reporting as of January 31, 2017, based on the criteria established in Internal Control — Integrated Framework (2013) issued by the Committee of Sponsoring Organizations of the Treadway Commission and our report dated April 14, 2017, expressed an adverse opinion on the Company's internal control over financial reporting because of a material weakness.
/s/ Deloitte & Touche LLP
Certified Public Accountants
Boca Raton, Florida
April 14, 2017
F-2
KLX INC.
CONSOLIDATED BALANCE SHEETS AS OF JANUARY 31, 2017 AND 2016
(In millions)
|
|
|
January 31, |
|
January 31, |
|
||
|
|
|
2017 |
|
2016 |
|
||
|
|
|
|
|
|
|
|
|
|
ASSETS |
|
|
|
|
|
|
|
|
|
|
|
|
|
|
|
|
|
Current assets: |
|
|
|
|
|
|
|
|
Cash and cash equivalents |
|
$ |
277.3 |
|
$ |
427.8 |
|
|
Accounts receivable–trade, less allowance for doubtful accounts ($13.5 at January 31, 2017 and $11.3 at January 31, 2016) |
|
|
261.3 |
|
|
259.6 |
|
|
Inventories, net |
|
|
1,381.4 |
|
|
1,295.3 |
|
|
Other current assets |
|
|
39.6 |
|
|
40.1 |
|
|
Total current assets |
|
|
1,959.6 |
|
|
2,022.8 |
|
|
|
|
|
|
|
|
|
|
|
Property and equipment, net of accumulated depreciation ($149.4 at January 31, 2017 and $109.3 at January 31, 2016) |
|
|
248.3 |
|
|
260.5 |
|
|
Goodwill |
|
|
996.4 |
|
|
954.9 |
|
|
Identifiable intangible assets, net |
|
|
314.8 |
|
|
262.7 |
|
|
Deferred income taxes |
|
|
147.0 |
|
|
163.4 |
|
|
Other assets |
|
|
32.2 |
|
|
26.7 |
|
|
|
|
$ |
3,698.3 |
|
$ |
3,691.0 |
|
|
|
|
|
|
|
|
|
|
|
LIABILITIES AND STOCKHOLDERS’ EQUITY |
|
|
|
|
|
|
|
|
|
|
|
|
|
|
|
|
|
Current liabilities: |
|
|
|
|
|
|
|
|
Accounts payable |
|
$ |
166.0 |
|
$ |
145.9 |
|
|
Accrued liabilities |
|
|
91.1 |
|
|
115.3 |
|
|
Total current liabilities |
|
|
257.1 |
|
|
261.2 |
|
|
|
|
|
|
|
|
|
|
|
Long-term debt |
|
|
1,182.0 |
|
|
1,179.5 |
|
|
Deferred income taxes |
|
|
5.0 |
|
|
16.2 |
|
|
Other non-current liabilities |
|
|
33.1 |
|
|
31.6 |
|
|
|
|
|
|
|
|
|
|
|
Commitments, contingencies and off-balance sheet arrangements (Note 8) |
|
|
|
|
|
|
|
|
Stockholders’ equity: |
|
|
|
|
|
|
|
|
Preferred stock, $0.01 par value; 1.0 million shares authorized; no shares outstanding |
|
|
— |
|
|
— |
|
|
Common stock, $0.01 par value; 250.0 million shares authorized; 53.5 million shares issued as of January 31, 2017 and 53.3 million shares issued as of January 31, 2016 |
|
|
0.5 |
|
|
0.5 |
|
|
Additional paid-in capital |
|
|
2,686.5 |
|
|
2,662.4 |
|
|
Treasury stock: 1.5 million shares at January 31, 2017 and 0.4 million shares at January 31, 2016 |
|
|
(54.4) |
|
|
(12.5) |
|
|
Accumulated deficit |
|
|
(328.0) |
|
|
(373.7) |
|
|
Accumulated other comprehensive loss |
|
|
(83.5) |
|
|
(74.2) |
|
|
Total stockholders’ equity |
|
|
2,221.1 |
|
|
2,202.5 |
|
|
|
|
$ |
3,698.3 |
|
$ |
3,691.0 |
|
See accompanying notes to consolidated and combined financial statements.
F-3
KLX INC.
CONSOLIDATED AND COMBINED STATEMENTS OF EARNINGS AND
FOR THE YEARS ENDED JANUARY 31, 2017 AND 2016, DECEMBER 31, 2014 AND THE ONE MONTH ENDED JANUARY 31, 2015
- (In millions)
|
|
|
|
|
|
|
|
|
|
|
|
|
|
|
|
|
Year Ended |
|
Month Ended |
||||||||
|
|
|
January 31, 2017 |
|
January 31, 2016 |
|
December 31, 2014 |
|
January 31, 2015 |
||||
|
Product revenues |
|
$ |
1,340.9 |
|
$ |
1,312.5 |
|
$ |
1,310.2 |
|
$ |
93.1 |
|
Service revenues |
|
|
153.2 |
|
|
254.9 |
|
|
385.5 |
|
|
39.9 |
|
Total revenues |
|
|
1,494.1 |
|
|
1,567.4 |
|
|
1,695.7 |
|
|
133.0 |
|
Cost of sales - products |
|
|
942.2 |
|
|
918.1 |
|
|
921.7 |
|
|
67.1 |
|
Cost of sales - services |
|
|
183.9 |
|
|
284.3 |
|
|
273.2 |
|
|
28.5 |
|
Total cost of sales |
|
|
1,126.1 |
|
|
1,202.4 |
|
|
1,194.9 |
|
|
95.6 |
|
Selling, general and administrative |
|
|
238.6 |
|
|
261.6 |
|
|
254.0 |
|
|
19.7 |
|
Goodwill impairment charge |
|
|
— |
|
|
310.4 |
|
|
— |
|
|
— |
|
Long-lived asset impairment charge |
|
|
— |
|
|
329.8 |
|
|
— |
|
|
— |
|
Operating earnings (loss) |
|
|
129.4 |
|
|
(536.8) |
|
|
246.8 |
|
|
17.7 |
|
Interest expense |
|
|
75.9 |
|
|
77.3 |
|
|
3.0 |
|
|
6.3 |
|
Earnings (loss) before income taxes |
|
|
53.5 |
|
|
(614.1) |
|
|
243.8 |
|
|
11.4 |
|
Income tax expense (benefit) |
|
|
5.3 |
|
|
(228.3) |
|
|
155.7 |
|
|
4.3 |
|
Net earnings (loss) |
|
$ |
48.2 |
|
$ |
(385.8) |
|
$ |
88.1 |
|
$ |
7.1 |
|
|
|
|
|
|
|
|
|
|
|
|
|
|
|
Other comprehensive (loss): |
|
|
|
|
|
|
|
|
|
|
|
|
|
Foreign currency translation adjustment |
|
|
(9.3) |
|
|
(18.7) |
|
|
(76.7) |
|
|
(27.0) |
|
Comprehensive income (loss) |
|
$ |
38.9 |
|
$ |
(404.5) |
|
$ |
11.4 |
|
$ |
(19.9) |
|
Net earnings (loss) per share - basic |
|
$ |
0.93 |
|
$ |
(7.39) |
|
$ |
1.69 |
|
$ |
0.14 |
|
Net earnings (loss) per share - diluted |
|
$ |
0.92 |
|
$ |
(7.39) |
|
$ |
1.68 |
|
$ |
0.14 |
|
Weighted average common shares - basic |
|
|
51.8 |
|
|
52.2 |
|
|
52.2 |
|
|
52.2 |
|
Weighted average common shares - diluted |
|
|
52.2 |
|
|
52.2 |
|
|
52.3 |
|
|
52.3 |
See accompanying notes to consolidated and combined financial statements.
F-4
KLX INC.
CONSOLIDATED AND COMBINED STATEMENTS OF STOCKHOLDERS’ EQUITY
FOR THE PERIODS ENDED JANUARY 31, 2017, 2016 AND 2015 AND DECEMBER 31, 2014
(In millions)
|
|
|
|
|
|
|
|
|
|
|
|
|
|
Former |
|
|
|
|
Accumulated |
|
|
|
|
||
|
|
|
|
|
|
|
|
Additional |
|
|
|
Parent |
|
Retained |
|
Other |
|
Total |
|
||||||
|
|
|
Common Stock |
|
Paid-in |
|
Treasury |
|
Company |
|
Earnings |
|
Comprehensive |
|
Stockholders’ |
|
|||||||||
|
|
|
Shares |
|
Amount |
|
Capital |
|
Stock |
|
Investment |
|
(Deficit) |
|
Income (Loss) |
|
Equity |
|
|||||||
|
Balance, December 31, 2013 |
|
— |
|
$ |
— |
|
$ |
— |
|
|
— |
|
$ |
2,750.5 |
|
$ |
— |
|
$ |
48.2 |
|
$ |
2,798.7 |
|
|
Net transfers from Former Parent |
|
— |
|
|
— |
|
|
— |
|
|
— |
|
|
(189.8) |
|
|
— |
|
|
— |
|
|
(189.8) |
|
|
Net earnings before spin-off |
|
— |
|
|
— |
|
|
— |
|
|
— |
|
|
83.9 |
|
|
— |
|
|
— |
|
|
83.9 |
|
|
Net earnings after spin-off |
|
— |
|
|
— |
|
|
— |
|
|
— |
|
|
— |
|
|
4.2 |
|
|
— |
|
|
4.2 |
|
|
Consummation of spin-off transaction on December 16, 2014 |
|
52.5 |
|
|
0.5 |
|
|
2,644.1 |
|
|
— |
|
|
(2,644.6) |
|
|
— |
|
|
— |
|
|
— |
|
|
Net foreign currency translation adjustments |
|
— |
|
|
— |
|
|
— |
|
|
— |
|
|
— |
|
|
— |
|
|
(76.7) |
|
|
(76.7) |
|
|
Balance, December 31, 2014 |
|
52.5 |
|
|
0.5 |
|
|
2,644.1 |
|
|
— |
|
|
— |
|
|
4.2 |
|
|
(28.5) |
|
|
2,620.3 |
|
|
Stock option expense |
|
— |
|
|
— |
|
|
0.2 |
|
|
— |
|
|
— |
|
|
— |
|
|
— |
|
|
0.2 |
|
|
Restricted stock expense, net of forfeitures |
|
0.3 |
|
|
— |
|
|
0.5 |
|
|
— |
|
|
— |
|
|
— |
|
|
— |
|
|
0.5 |
|
|
Net earnings |
|
— |
|
|
— |
|
|
— |
|
|
— |
|
|
— |
|
|
7.1 |
|
|
— |
|
|
7.1 |
|
|
Net foreign currency translation adjustments |
|
— |
|
|
— |
|
|
— |
|
|
— |
|
|
— |
|
|
— |
|
|
(27.0) |
|
|
(27.0) |
|
|
Balance, January 31, 2015 |
|
52.8 |
|
|
0.5 |
|
|
2,644.8 |
|
|
— |
|
|
— |
|
|
11.3 |
|
|
(55.5) |
|
|
2,601.1 |
|
|
Sale of stock under employee stock purchase plan |
|
— |
|
|
— |
|
|
1.8 |
|
|
— |
|
|
— |
|
|
— |
|
|
— |
|
|
1.8 |
|
|
Return to provision true-up related to pre spin-off and other |
|
— |
|
|
— |
|
|
1.0 |
|
|
— |
|
|
— |
|
|
— |
|
|
— |
|
|
1.0 |
|
|
Purchase of treasury stock |
|
— |
|
|
— |
|
|
— |
|
|
(12.5) |
|
|
— |
|
|
— |
|
|
— |
|
|
(12.5) |
|
|
Restricted stock grants, net of forfeitures and restricted stock unit vesting |
|
0.5 |
|
|
— |
|
|
14.8 |
|
|
— |
|
|
— |
|
|
0.8 |
|
|
— |
|
|
15.6 |
|
|
Net (loss) |
|
— |
|
|
— |
|
|
— |
|
|
— |
|
|
— |
|
|
(385.8) |
|
|
— |
|
|
(385.8) |
|
|
Net foreign currency translation adjustments |
|
— |
|
|
— |
|
|
— |
|
|
— |
|
|
— |
|
|
— |
|
|
(18.7) |
|
|
(18.7) |
|
|
Balance, January 31, 2016 |
|
53.3 |
|
|
0.5 |
|
|
2,662.4 |
|
|
(12.5) |
|
|
— |
|
|
(373.7) |
|
|
(74.2) |
|
|
2,202.5 |
|
|
Sale of stock under employee stock purchase plan |
|
— |
|
|
— |
|
|
2.0 |
|
|
— |
|
|
— |
|
|
— |
|
|
— |
|
|
2.0 |
|
|
Purchase of treasury stock |
|
— |
|
|
— |
|
|
— |
|
|
(41.9) |
|
|
— |
|
|
— |
|
|
— |
|
|
(41.9) |
|
|
Restricted stock expense, net of forfeitures, restricted stock unit vesting and stock option expense |
|
0.2 |
|
|
— |
|
|
22.1 |
|
|
— |
|
|
— |
|
|
(2.5) |
|
|
— |
|
|
19.6 |
|
|
Net earnings |
|
— |
|
|
— |
|
|
— |
|
|
— |
|
|
— |
|
|
48.2 |
|
|
— |
|
|
48.2 |
|
|
Net foreign currency translation adjustments |
|
— |
|
|
— |
|
|
— |
|
|
— |
|
|
— |
|
|
— |
|
|
(9.3) |
|
|
(9.3) |
|
|
Balance, January 31, 2017 |
|
53.5 |
|
$ |
0.5 |
|
$ |
2,686.5 |
|
|
(54.4) |
|
$ |
— |
|
$ |
(328.0) |
|
$ |
(83.5) |
|
$ |
2,221.1 |
|
See accompanying notes to consolidated and combined financial statements.
F-5
KLX INC.
CONSOLIDATED AND COMBINED STATEMENTS OF CASH FLOWS
FOR THE YEARS ENDED JANUARY 31, 2017 AND 2016, DECEMBER 31, 2014 AND THE ONE MONTH ENDED JANUARY 31, 2015
(In millions)
|
|
|
|
|
|
|
|
|
|
|
|
|
|
|
|
|
Year Ended |
|
Month Ended |
||||||||
|
|
|
January 31, 2017 |
|
January 31, 2016 |
|
December 31, 2014 |
|
January 31, 2015 |
||||
|
CASH FLOWS FROM OPERATING ACTIVITIES: |
|
|
|
|
|
|
|
|
|
|
|
|
|
Net earnings (loss) |
|
$ |
48.2 |
|
$ |
(385.8) |
|
$ |
88.1 |
|
$ |
7.1 |
|
Adjustments to reconcile net earnings (loss) to net cash flows provided by (used in) operating activities: |
|
|
|
|
|
|
|
|
|
|
|
|
|
Depreciation and amortization |
|
|
66.9 |
|
|
75.0 |
|
|
68.0 |
|
|
7.3 |
|
Deferred income taxes |
|
|
6.2 |
|
|
(229.3) |
|
|
42.8 |
|
|
(0.4) |
|
Asset impairment charge |
|
|
— |
|
|
640.2 |
|
|
— |
|
|
— |
|
Non-cash compensation |
|
|
20.2 |
|
|
15.8 |
|
|
3.7 |
|
|
0.7 |
|
Amortization of deferred financing fees |
|
|
4.3 |
|
|
4.0 |
|
|
— |
|
|
0.3 |
|
Tax impact from prior sales of restricted stock |
|
|
— |
|
|
0.2 |
|
|
(0.6) |
|
|
— |
|
Provision for inventory write-downs |
|
|
20.7 |
|
|
— |
|
|
— |
|
|
— |
|
Provision for doubtful accounts and sales return reserve |
|
|
3.2 |
|
|
3.3 |
|
|
12.4 |
|
|
(0.1) |
|
Loss on disposal of property, equipment and other |
|
|
3.3 |
|
|
2.9 |
|
|
6.6 |
|
|
— |
|
Changes in operating assets and liabilities, net of effects from acquisitions: |
|
|
|
|
|
|
|
|
|
|
|
|
|
Accounts receivable |
|
|
6.9 |
|
|
40.3 |
|
|
(83.6) |
|
|
1.9 |
|
Inventories |
|
|
(5.0) |
|
|
25.7 |
|
|
(67.2) |
|
|
(34.6) |
|
Other current and non-current assets |
|
|
(4.6) |
|
|
2.7 |
|
|
(21.9) |
|
|
(2.9) |
|
Accounts payable |
|
|
11.0 |
|
|
3.4 |
|
|
36.7 |
|
|
(7.2) |
|
Other current and non-current liabilities |
|
|
(30.4) |
|
|
18.8 |
|
|
22.5 |
|
|
12.8 |
|
Net cash flows provided by (used in) operating activities |
|
|
150.9 |
|
|
217.2 |
|
|
107.5 |
|
|
(15.1) |
|
|
|
|
|
|
|
|
|
|
|
|
|
|
|
CASH FLOWS FROM INVESTING ACTIVITIES: |
|
|
|
|
|
|
|
|
|
|
|
|
|
Capital expenditures |
|
|
(35.5) |
|
|
(130.5) |
|
|
(136.8) |
|
|
(6.2) |
|
Acquisitions, net of cash acquired |
|
|
(220.8) |
|
|
(4.3) |
|
|
(513.8) |
|
|
- |
|
Net cash flows used in investing activities |
|
|
(256.3) |
|
|
(134.8) |
|
|
(650.6) |
|
|
(6.2) |
|
|
|
|
|
|
|
|
|
|
|
|
|
|
|
CASH FLOWS FROM FINANCING ACTIVITIES: |
|
|
|
|
|
|
|
|
|
|
|
|
|
Purchase of treasury stock |
|
|
(44.9) |
|
|
(9.5) |
|
|
— |
|
|
— |
|
Cash proceeds from stock issuance |
|
|
1.5 |
|
|
1.5 |
|
|
— |
|
|
— |
|
Proceeds from long-term debt |
|
|
— |
|
|
— |
|
|
1,200.0 |
|
|
— |
|
Debt origination costs |
|
|
— |
|
|
— |
|
|
(27.9) |
|
|
— |
|
Tax impact from prior sales of restricted stock |
|
|
— |
|
|
(0.2) |
|
|
0.6 |
|
|
— |
|
Net transfers to B/E Aerospace, Inc. |
|
|
— |
|
|
— |
|
|
(233.3) |
|
|
— |
|
Deferred acquisition payments |
|
|
— |
|
|
(90.9) |
|
|
— |
|
|
— |
|
Net cash flows (used in) provided by financing activities |
|
|
(43.4) |
|
|
(99.1) |
|
|
939.4 |
|
|
— |
|
|
|
|
|
|
|
|
|
|
|
|
|
|
|
Effect of foreign exchange rate changes on cash and cash equivalents |
|
|
(1.7) |
|
|
(2.7) |
|
|
(4.1) |
|
|
(2.3) |
|
|
|
|
|
|
|
|
|
|
|
|
|
|
|
Net (decrease) increase in cash and cash equivalents |
|
|
(150.5) |
|
|
(19.4) |
|
|
392.2 |
|
|
(23.6) |
|
Cash and cash equivalents, beginning of period |
|
|
427.8 |
|
|
447.2 |
|
|
78.6 |
|
|
470.8 |
|
Cash and cash equivalents, end of period |
|
$ |
277.3 |
|
$ |
427.8 |
|
$ |
470.8 |
|
$ |
447.2 |
|
|
|
|
|
|
|
|
|
|
|
|
|
|
|
Supplemental disclosures of cash flow information: |
|
|
|
|
|
|
|
|
|
|
|
|
|
Cash paid during period for: |
|
|
|
|
|
|
|
|
|
|
|
|
|
Income taxes paid, net of refunds |
|
$ |
6.1 |
|
$ |
13.2 |
|
$ |
21.1 |
|
$ |
0.6 |
|
Interest |
|
|
72.1 |
|
|
71.0 |
|
|
— |
|
|
— |
|
Supplemental schedule of non-cash activities: |
|
|
|
|
|
|
|
|
|
|
|
|
|
Treasury stock |
|
$ |
— |
|
$ |
3.0 |
|
$ |
— |
|
$ |
— |
|
Contingent consideration |
|
|
— |
|
|
— |
|
|
92.2 |
|
|
— |
See accompanying notes to consolidated and combined financial statements.
F-6
KLX INC.
NOTES TO CONSOLIDATED AND COMBINED FINANCIAL STATEMENTS
FOR THE YEARS ENDED JANUARY 31, 2017 AND 2016, DECEMBER 31, 2014 AND THE ONE MONTH ENDED JANUARY 31, 2015
(In millions, except share and per share data)
1. DESCRIPTION OF BUSINESS AND SUMMARY OF SIGNIFICANT ACCOUNTING POLICIES
Description of Business
On December 17, 2014, B/E Aerospace, Inc. (“B/E Aerospace” or “Former Parent”) created an independent public company through a spin‑off of its Aerospace Solutions Group (“ASG”) and Energy Services Group (“ESG”) businesses to Former Parent’s stockholders (“Spin‑Off”). To effect the Spin‑Off, B/E Aerospace distributed 52.5 million shares of KLX Inc. (“KLX” or the “Company”) common stock to B/E Aerospace’s stockholders on December 17, 2014. Holders of B/E Aerospace’s common stock received one share of KLX common stock for every two shares of B/E Aerospace’s common stock held on December 5, 2014. B/E Aerospace structured the distribution to be tax free to its U.S. stockholders for U.S. federal income tax purposes. As a result of the Spin‑Off, KLX now operates as an independent, publicly traded company.
We believe, based on our experience in the industry, that we are the world’s leading distributor and value‑added service provider of aerospace fasteners and other consumables, offering one of the broadest ranges of aerospace hardware and consumables and inventory management services, selling to essentially every major airline in the world as well as leading maintenance, repair and overhaul (“MRO”) providers, the leading airframe manufacturers and their first and second tier suppliers. The Company also provides technical services and associated rental equipment to land‑based oil and gas exploration and drilling companies often in remote locations.
Basis of Presentation
On February 24, 2015, the Board of Directors approved a change in the Company’s fiscal year end from December 31 to January 31. This change to the new reporting cycle began February 1, 2015. As a result of the change, the Company is reporting a January 2015 fiscal month transition period.
The Company’s consolidated and combined financial statements include KLX and its wholly owned subsidiaries. Prior to the Spin‑Off on December 17, 2014, KLX’s financial statements were derived from B/E Aerospace’s consolidated financial statements and accounting records as if it was operated on a stand‑alone basis and were prepared in accordance with accounting principles generally accepted in the United States (GAAP). All intercompany transactions and account balances within the Company have been eliminated.
The consolidated and combined statements of earnings and comprehensive income for the periods prior to the spin-off reflect allocations of general corporate expenses from B/E Aerospace, including, but not limited to, executive management, finance, legal, information technology, human resources, employee benefits administration, treasury, risk management, procurement and other shared services. The allocations were made on a direct usage basis when identifiable, with the remainder allocated on the basis of revenues generated, costs incurred, headcount or other measures. Management of the Company considers these allocations to be a reasonable reflection of the utilization of services by, or the benefits provided, to the Company. The allocations may not, however, reflect the expense the Company would have incurred as a stand‑alone company for the periods presented. Actual costs that may have been incurred if the Company had been a stand‑alone company would depend on a number of factors, including the chosen organizational structure, what functions were outsourced or performed by employees and strategic decisions made in areas such as information technology and infrastructure.
F-7
Use of Estimates—The preparation of the consolidated and combined financial statements in conformity with GAAP requires management to make estimates and assumptions that affect the reported amounts and related disclosures. Actual results could differ from those estimates.
Revenue Recognition—Sales of products and services are recorded when the earnings process is complete. This generally occurs when the products are shipped to the customer in accordance with the contract or purchase order, risk of loss and title has passed to the customer, collectability is reasonably assured and pricing is fixed and determinable. In instances where title does not pass to the customer upon shipment, the Company recognizes revenue upon delivery or customer acceptance, depending on the terms of the sales contract. Management provides allowances for credits and returns, based on historic experience, and adjusts such allowances as considered necessary.
In connection with the sales of its products, the Company also provides certain supply chain management services to certain of its customers. These services include the timely replenishment of products at the customer site, while also minimizing the customer’s on‑hand inventory. These services are provided by the Company contemporaneously with the delivery of the product, and as such, once the product is delivered, the Company does not have a post‑delivery obligation to provide services to the customer. The price of such services is generally included in the price of the products delivered to the customer, and revenue is recognized upon delivery of the product, at which point, the Company has satisfied its obligations to the customer. The Company does not account for these services as a separate element, as the services do not have stand‑alone value and cannot be separated from the product element of the arrangement.
Service revenues from oilfield technical services and related rental equipment are recorded when services are performed and/or equipment is rented pursuant to a completed purchase order or master services agreement (“MSA”) that sets forth firm pricing and payment terms.
Income Taxes—The Company provides deferred income taxes for temporary differences between the amounts of assets and liabilities recognized for financial reporting purposes and such amounts recognized for income tax purposes. Deferred income taxes are computed using enacted tax rates that are expected to be in effect when the temporary differences reverse. A valuation allowance related to a deferred tax asset is recorded when it is more likely than not that some portion or the entire deferred tax asset will not be realized. The Company records uncertain tax positions within income tax expense and classifies interest and penalties related to income taxes as income tax expense.
Cash Equivalents—The Company considers all highly liquid debt instruments purchased with an original maturity of three months or less to be cash equivalents.
Accounts Receivable, Net—The Company performs ongoing credit evaluations of its customers and adjusts credit limits based upon payment history and the customer’s current creditworthiness, as determined by review of their current credit information. The Company continuously monitors collections and payments from its customers and maintains a provision for estimated credit losses based upon historical experience and any specific customer collection issues that have been identified. The allowance for doubtful accounts at January 31, 2017 and 2016 was $13.5 and $11.3, respectively.
Inventories—Inventories, made up of finished goods, primarily consist of aerospace fasteners and consumables. The Company values inventories at the lower of cost or market, using first‑in, first‑out or weighted average cost method. During Fiscal 2016, the Company revised its methodology for estimating the provision required for excess and obsolete (“E&O”) inventories. The new methodology more adequately considers historical demand of our inventory to project future demand in order to estimate the provision required for E&O inventories. Other factors considered in the methodology include expected market growth rates and related elements. The implementation of the new methodology did not impact the current period or any prior period reserve for E&O inventory. Demand for the Company’s products can fluctuate from period to period depending on customer activity. In accordance with industry practice, costs in inventory include amounts relating to long-term contracts with long production cycles and to inventory items with long production cycles, some of which are not expected to be realized within one year. As a result, the Company’s operating cycle is greater than a year and is closely tied to the lifecycle of an airframe. Reserves for excess and obsolete inventory were approximately $59.6 and $40.4 as of January 31, 2017 and 2016, respectively.
F-8
Substantially all of the Company’s inventory is comprised of aerospace grade fasteners which support OEM production and the aftermarket over the life of the airframe. Inventory with a limited shelf life is continually monitored and reserved for in advance of expiration. The reserve for inventory with limited shelf life is not material to the Company’s financial statements.
Property and Equipment, Net—Property and equipment are stated at cost and depreciated generally under the straight‑line method over their estimated useful lives of one to fifty years (or the lesser of the term of the lease for leasehold improvements, as appropriate).
Goodwill and Intangible Assets, Net—Under Financial Accounting Standards Board (“FASB”) Accounting Standards Codification (“ASC”) Topic 350, Intangibles—Goodwill and Other (“ASC 350”), goodwill and indefinite‑lived intangible assets are reviewed at least annually for impairment. Acquired intangible assets with definite lives are amortized over their individual useful lives. Other intangible assets are amortized using the straight‑line method over periods ranging from five to thirty years.
As of January 31, 2017, the Company had two reporting units, which were determined based on the guidelines contained in FASB ASC Topic 350, Subtopic 20, Section 35. Each reporting unit constitutes a business, for which there is discrete financial information available that is regularly reviewed by the management of the Company.
Goodwill is tested at least annually as of December 31st, and management assesses whether there has been any impairment in the value of goodwill by first comparing the fair value to the net carrying value of the reporting units. If the carrying value exceeds its estimated fair value, a second step is performed to compute the amount of the impairment. An impairment loss is recognized if the implied fair value of the asset being tested is less than its carrying value. In this event, the asset is written down accordingly. The fair values of the reporting units for goodwill impairment testing is determined using valuation techniques based on estimates, judgments and assumptions management believes are appropriate in the circumstances.
For the years ended January 31, 2017 and December 31, 2014 and the one month ended January 31, 2015, the Company’s annual impairment testing yielded no impairments of goodwill or the indefinite‑lived intangible asset. For the year ended January 31, 2016, the Company determined goodwill related to the ESG reporting unit was fully impaired and recorded a pre-tax impairment charge related to ESG’s goodwill of $310.4.
The indefinite‑lived intangible asset is tested at least annually for impairment. Impairment for the intangible asset with an indefinite life exists if the carrying value of the intangible asset exceeds its fair value. The fair value of the indefinite‑lived intangible asset is determined using valuation techniques based on estimates, judgments and assumptions management believes are appropriate in the circumstances.
Long‑Lived Assets—The Company assesses potential impairments to its long‑lived assets when there is evidence that events or changes in circumstances indicate that the carrying amount of an asset may not be recovered. An impairment loss is recognized when the undiscounted cash flows expected to be generated by an asset (or group of assets) is less than its carrying amount. Any required impairment loss is measured as the amount by which the asset’s carrying value exceeds its fair value and is recorded as a reduction in the carrying value of the related asset and a charge to operating results. For the years ended January 31, 2017 and December 31, 2014 and the one month ended January 31, 2015, there were no impairments of long lived assets. For the year ended January 31, 2016, the Company used a combination of a cost and market approaches for determining the fair value of the ESG asset group’s long lived assets and recognized impairment charges related to identified intangibles and property and equipment of $177.8 and $152.0, respectively.
Common Stock Equivalents—The Company has potential common stock equivalents related to its outstanding restricted stock awards, restricted stock units and employee stock purchase plan. These potential common stock equivalents are not included in diluted loss per share for any period presented in which there is a net loss because the effect would have been anti‑dilutive.
Accounting for Stock‑Based Compensation—The Company accounts for share‑based compensation arrangements in accordance with the provisions of FASB ASC 718, Compensation—Stock Compensation (“ASC 718”),
F-9
whereby share‑based compensation cost is measured on the date of grant, based on the fair value of the award, and is recognized over the requisite service period.
Compensation cost recognized during the year ended December 31, 2014 related to grants of restricted stock and restricted stock units granted by our Former Parent. No compensation cost related to stock options was recognized during that period as no options were granted during the year ended December 31, 2014, and all outstanding options were vested. All unvested shares of restricted stock were converted into unvested shares of KLX on the distribution date at a ratio equal to 1.8139. Compensation cost recognized during the years ended January 31, 2017 (“Fiscal 2016”) and 2016 (“Fiscal 2015”) and the one month ended January 31, 2015 related to unvested shares converted on the distribution date and new shares of KLX restricted stock and stock options granted during Fiscal 2016 and Fiscal 2015.
The Company has established a qualified Employee Stock Purchase Plan. The Employee Stock Purchase Plan allows qualified employees (as defined in the plan) to participate in the purchase of designated shares of KLX’s common stock at a price equal to 85% of the closing price for each semi‑annual stock purchase period. The fair value of employee purchase rights represents the difference between the closing price of KLX’s shares on the date of purchase and the purchase price of the shares. The value of the rights under this Plan (and that of our Former Parent’s) granted during the years ended January 31, 2017 and 2016 and December 31, 2014 was $0.3, $0.3 and $0.2, respectively, and was not material during the one month ended January 31, 2015.
Foreign Currency Translation—The assets and liabilities of subsidiaries located outside the United States are translated into U.S. dollars at the rates of exchange in effect at the balance sheet dates. Revenue and expense items are translated at the average exchange rates prevailing during the period. Gains and losses resulting from foreign currency transactions are recognized currently in income, and those resulting from translation of financial statements are accumulated as a separate component of Former Parent company equity and accumulated other comprehensive income (loss). The Company’s European subsidiaries primarily utilize the British pound or the Euro as their local functional currency.
Treasury Stock - The Company may periodically repurchase shares of its common stock from employees for the satisfaction of their individual payroll tax withholding upon vesting of restricted stock and restricted stock units in connection with the Company’s Long-Term Incentive Plan (“LTIP”). The Company’s repurchases of common stock are recorded at the average cost of the common stock. As part of the LTIP, the Company repurchased 35,009 shares of its common stock for $1.5 during the year ended January 31, 2017. On January 7, 2016, the Board of Directors authorized a $100.0 share repurchase under the existing $250.0 share repurchase program. During Fiscal 2016, the Company repurchased 982,062 shares of common stock at an average price of $41.20 per share for a total of $40.5 as part of the share repurchase program.
Concentration of Risk—In ASG, the Company’s products and services are primarily concentrated within the aerospace industry with customers consisting primarily of commercial airlines, a wide variety of business jet customers and commercial aircraft manufacturers. In ESG, the Company provides products and services to energy industry customers who focus on developing and producing oil and gas onshore in North America. The Company’s management performs ongoing credit evaluations on the financial condition of all of its customers and maintains allowances for uncollectible accounts receivable based on expected collectability. Credit losses have historically been within management’s expectations and the provisions established.
Significant customers change from year to year, in the case of ASG, depending on the level of refurbishment activity and/or the level of new aircraft purchases by such customers, and in the case of ESG, depending on the level of exploration and production activity and the use of our services. During the years ended January 31, 2017 and 2016 and December 31, 2014, no single customer accounted for more than 10% of the Company’s consolidated revenues.
Correction of Interim Data— During the year ended January 31, 2017, the Company restated its April 30, 2016 and July 31, 2016 interim financial statements to reflect the correction of errors that were identified. The Company has concluded the corrected errors are immaterial individually and in the aggregate. These items have been corrected and are discussed in more detail in Note 15. Selected Quarterly Data.
F-10
Recent Accounting Pronouncements
In January 2017, the FASB issued Accounting Standards Update (“ASU”) 2017-04, Intangibles – Goodwill and Other. ASU 2017-04 simplifies the subsequent measurement of goodwill by removing the second step of the two-step impairment test. The amendment requires an entity to perform its annual or interim goodwill impairment test by comparing the fair value of a reporting unit with its carrying amount. An impairment charge should be recognized for the amount by which the carrying amount exceeds the reporting unit's fair value; however, the loss recognized should not exceed the total amount of goodwill allocated to that reporting unit. The amendment should be applied on a prospective basis. ASU 2017-04 is effective for fiscal years beginning after December 15, 2019, including interim periods within those fiscal years. Early adoption is permitted for interim or annual goodwill impairment tests performed on testing dates after January 1, 2017. The adoption of ASU 2017-04 is not expected to have a material impact on the Company’s consolidated financial statements.
In January 2017, the FASB issued ASU 2017-01, Business Combinations. This update clarifies the definition of a business with the objective of adding guidance to assist entities with evaluating whether transactions should be accounted for as acquisitions (or disposals) of assets or businesses. This ASU is effective for fiscal years beginning after December 15, 2017, including interim periods within those fiscal years. The adoption of ASU 2017-01 is not expected to have a material impact on the Company’s consolidated financial statements.
In March 2016, the FASB issued ASU 2016-09, Improvements to Employee Share-Based Payment Accounting, which amends ASC Topic 718, Compensation – Stock Compensation. The ASU includes multiple provisions intended to simplify various aspects of the accounting for share-based payments. The ASU is effective for annual periods beginning after December 15, 2016, and interim periods within those years. Earlier adoption is permitted. The Company is currently evaluating the effect this update will have on its consolidated financial statements.
In February 2016, the FASB issued ASU 2016-02, Leases (“ASU 2016-02”), which supersedes ASC Topic 840, Leases, and creates a new topic, ASC Topic 842, Leases. This update is effective for fiscal years beginning after December 15, 2018 and interim periods within those fiscal years. Earlier adoption is permitted. ASU 2016-02 requires lessees to recognize a lease liability and a lease asset for all leases, including operating leases, with a term greater than 12 months on its balance sheet. The update also expands the required quantitative and qualitative disclosures surrounding leases. ASU 2016-02 will be applied using a modified retrospective transition approach for leases existing at, or entered into after, the beginning of the earliest comparative period presented in the financial statements. The Company is currently evaluating the effect of this update on its consolidated financial statements.
In May 2014, FASB issued ASU 2014-09, Revenue from Contracts with Customers, which updated the guidance in ASC Topic 606, Revenue Recognition. The core principle of the guidance is that an entity should recognize revenue to depict the transfer of promised goods or services to customers in an amount that reflects the consideration to which the entity expects to be entitled in exchange for those goods or services. To achieve that core principle, an entity should identify the contract(s) with a customer, identify the performance obligations in the contract, determine the transaction price, allocate the transaction price to the performance obligations in the contract and recognize revenue when (or as) the entity satisfies a performance obligation. In August 2015, the FASB issued ASU 2015-14, Revenue from Contracts with Customers (Topic 606): Deferral of the Effective Date. The amendments in this update deferred the effective date for implementation of ASU 2014-09 by one year and is now effective for annual reporting periods beginning after December 15, 2017. Early application is permitted only as of annual reporting periods beginning after December 15, 2016, including interim reporting periods within that period. In April 2016, FASB issued ASU 2016-10, Revenue from Contracts with Customers (Topic 606): Identifying Performance Obligations and Licensing, and in May 2016, ASU 2016-12, Revenues from Contracts with Customers (Topic 606): Narrow-Scope Improvements and Practical Expedients both of which provide supplemental adoption guidance and clarification to ASU 2014-09. ASU 2016-10 and ASU 2016-12 must be adopted concurrently with the adoption of ASU 2014-09. The Company has not determined the impact this guidance will have on the financial statements. However, the identification of implementation project team members and the inventorying of contracts with customers, particularly large customer contracts, has begun. Other than increased disclosures, the impact of the revised accounting guidance to the results of operations and cash flows of the Company cannot be determined until the assessment process is complete.
F-11
2. BUSINESS COMBINATIONS
On May 17, 2016, the Company acquired Herndon Aerospace & Defense LLC (“Herndon”), an aftermarket aerospace supply chain management and consumables hardware distributor servicing principally aftermarket military depots as well as the commercial aerospace aftermarket for an aggregate purchase price of $220.8 (net of cash acquired). The Company adjusted the allocation of the Herndon purchase price to increase goodwill, deferred taxes and liabilities by $6.1, $2.6 and $9.0, respectively, related to the Company’s preliminary purchase price allocation. The impact of the purchase price adjustment to the Company’s consolidated statement of earnings from the date of acquisition was not material.
Based on the Company’s preliminary purchase price allocation, the excess of the purchase price over the fair value of the identifiable assets acquired approximated $119.7, of which $68.9 was allocated to identifiable intangible assets consisting of customer contracts and relationships and covenants not to compete, and $50.8 is included in goodwill. The useful life assigned to the customer contracts and relationships is 20 years, and the covenants not to compete are being amortized over their contractual periods of five years.
The Herndon acquisition was accounted for as a purchase under FASB ASC 805, Business Combinations (“ASC 805”). The assets purchased and liabilities assumed have been reflected in the accompanying consolidated balance sheet as of January 31, 2017. The results of operations for the Herndon acquisition are included in the accompanying consolidated and combined statements of earnings from the date of acquisition. The valuation of certain assets, principally inventories and tax-related items, related to the acquisition is not yet complete, and as such, the Company has not yet finalized its allocation of the purchase price for the acquisition.
The following table summarizes the current estimates of fair values of assets acquired and liabilities assumed in the Herndon acquisition in accordance with ASC 805, which are currently recorded based on management’s estimates as follows:
|
|
|
|
|
|
|
|
|
|
|
|
|
|
|
|
|
|
|
Accounts receivable-trade |
|
$ |
12.3 |
|
|
Inventories |
|
|
103.7 |
|
|
Other current and non-current assets |
|
|
3.7 |
|
|
Property and equipment |
|
|
2.1 |
|
|
Goodwill |
|
|
50.8 |
|
|
Identified intangibles |
|
|
68.9 |
|
|
Accounts payable |
|
|
(9.7) |
|
|
Other current and non-current liabilities |
|
|
(11.0) |
|
|
Total consideration paid |
|
$ |
220.8 |
|
Goodwill and intangible assets of $114.3 are expected to be deductible for tax purposes.
The Company has begun integrating Herndon into its ASG segment systems. As a result, it is not practicable to report stand-alone revenues and operating earnings of the acquired business since the acquisition date.
F-12
On a pro forma basis to give effect to the Herndon acquisition, as if it occurred on February 1, 2015, revenues and net earnings for the years ended January 31, 2017 and 2016 would have been as follows:
|
|
|
|
UNAUDITED |
||||
|
|
|
|
YEAR ENDED |
||||
|
|
|
|
January 31, 2017 |
|
January 31, 2016 |
||
|
|
|
|
Pro forma |
|
Pro forma |
||
|
Revenues |
|
|
$ |
1,544.3 |
|
$ |
1,699.8 |
|
Net earnings |
|
|
|
51.7 |
|
|
(376.7) |
|
Earnings (loss) per diluted share |
|
|
|
0.99 |
|
|
(7.21) |
3. PROPERTY AND EQUIPMENT, NET
Property and equipment consist of the following:
|
|
|
Useful |
|
January 31, |
|
January 31, |
||||
|
|
|
Life (Years) |
|
2017 |
|
2016 |
||||
|
Land, buildings and improvements |
|
1 |
- |
50 |
|
$ |
40.9 |
|
$ |
35.5 |
|
Machinery |
|
2 |
- |
20 |
|
|
119.8 |
|
|
89.5 |
|
Computer equipment and software |
|
3 |
- |
15 |
|
|
105.5 |
|
|
96.1 |
|
Furniture and equipment |
|
3 |
- |
14 |
|
|
131.5 |
|
|
148.7 |
|
|
|
|
|
|
|
|
397.7 |
|
|
369.8 |
|
Less accumulated depreciation |
|
|
|
|
|
|
149.4 |
|
|
109.3 |
|
|
|
|
|
|
|
$ |
248.3 |
|
$ |
260.5 |
Depreciation expense was $47.3, $51.3, $37.4 and $4.5 for the years ended January 31, 2017 and 2016, December 31, 2014 and the one month ended January 31, 2015, respectively.
4. GOODWILL AND LONG-LIVED ASSETS, NET
The following sets forth the intangible assets by major asset class, all of which were acquired through business purchase transactions:
|
|
|
|
|
|
|
January 31, 2017 |
|
January 31, 2016 |
|
|||||||||||||||||
|
|
|
Useful Life |
|
Original |
|
Accumulated |
|
Net Book |
|
Original |
|
Accumulated |
|
Impairment |
|
Net Book |
|
|||||||||
|
|
|
(Years) |
|
Cost |
|
Amortization |
|
Value |
|
Cost |
|
Amortization |
|
Charge |
|
Value |
|
|||||||||
|
Customer contracts and relationships |
|
8 |
- |
30 |
|
$ |
422.0 |
|
$ |
129.1 |
|
$ |
292.9 |
|
$ |
536.9 |
|
$ |
124.2 |
|
$ |
167.1 |
|
$ |
245.6 |
|
|
Covenants not to compete |
|
5 |
|
|
5.5 |
|
|
3.6 |
|
|
1.9 |
|
|
18.2 |
|
|
7.4 |
|
|
10.7 |
|
|
0.1 |
|
||
|
Developed technologies |
|
15 |
|
|
3.3 |
|
|
0.2 |
|
|
3.1 |
|
|
— |
|
|
— |
|
|
— |
|
|
— |
|
||
|
Trade names |
|
Indefinite |
|
|
16.9 |
|
|
— |
|
|
16.9 |
|
|
17.0 |
|
|
— |
|
|
— |
|
|
17.0 |
|
||
|
|
|
|
|
|
|
$ |
447.7 |
|
$ |
132.9 |
|
$ |
314.8 |
|
$ |
572.1 |
|
$ |
131.6 |
|
$ |
177.8 |
|
$ |
262.7 |
|
Amortization expense of intangible assets was $19.6, $23.7, $30.5 and $2.8 for the years ended January 31, 2017 and 2016, December 31, 2014 and the one month ended January 31, 2015, respectively. Amortization expense is expected to be approximately $19.0 in each of the next five years.
In accordance with ASC 350, goodwill is not amortized but is subject to an annual impairment test. For the years ended January 31, 2017 and December 31, 2014 and the one month ended January 31, 2015, the Company’s annual impairment testing yielded no impairments of goodwill or the indefinite lived intangible asset. During the year ended January 31, 2016, the continued downturn in the oil and gas industry, including the nearly 75% decrease in the number of onshore drilling rigs and the resulting significant cutbacks in the capital expenditures of our customers, represented a significant adverse change in the business climate, which indicated that the ESG reporting unit’s goodwill was impaired and ESG asset group’s long-lived assets may not be recoverable. As a result, during the third quarter ended October 31, 2015, the Company performed an interim goodwill impairment test and a long-lived asset recoverability test. The results of the goodwill impairment testing indicated that goodwill was impaired which resulted in a $310.4 pre-tax goodwill impairment charge for the year ended January 31, 2016.
F-13
Long-lived assets, such as property and equipment and purchased intangibles subject to amortization, are tested for impairment when there is evidence that events or changes in circumstances indicate that the carrying amount of an asset may not be recovered. An impairment loss is recognized when the undiscounted cash flows expected to be generated by an asset (or group of assets) is less than its carrying amount. Any required impairment loss is measured as the amount by which the asset’s carrying value exceeds its fair value and is recorded as a reduction in the carrying value of the related asset and a charge to operating results. For the years ended January 31, 2017 and December 31, 2014 and the one month ended January 31, 2015, there were no impairments of long lived assets. For the year ended January 31, 2016, the Company performed a long-lived asset impairment analysis and concluded the carrying amount of the long-lived assets exceeded the undiscounted cash flows of the ESG asset group. As a result, we recorded a $329.8 long-lived asset impairment charge, $177.8 related to identified intangible assets and $152.0 related to property and equipment for the year ended January 31, 2016.
The goodwill and long-lived asset impairment charges reflected the full value of the goodwill and identified intangible assets attributable to the ESG segment. The accumulated goodwill impairment losses (incurred in 2008 and 2015) totaled $601.1 as of January 31, 2016.
The changes in the carrying amount of goodwill for the years ended January 31, 2017 and 2016 and the one month ended January 31, 2015 are as follows:
|
Balance, December 31, 2014 |
|
$ |
1,328.7 |
|
|
Purchase Price Adjustments |
|
|
(21.7) |
|
|
Effect of foreign currency translation |
|
|
(20.5) |
|
|
Balance, January 31, 2015 |
|
|
1,286.5 |
|
|
Acquisitions |
|
|
2.5 |
|
|
Purchase Price Adjustments |
|
|
(10.3) |
|
|
Effect of foreign currency translation |
|
|
(13.4) |
|
|
Impairment |
|
|
(310.4) |
|
|
Balance, January 31, 2016 |
|
|
954.9 |
|
|
Acquisitions |
|
|
50.8 |
|
|
Purchase Price Adjustments |
|
|
(2.5) |
|
|
Effect of foreign currency translation |
|
|
(6.8) |
|
|
Balance, January 31, 2017 |
|
$ |
996.4 |
|
5. RELATED PARTY TRANSACTIONS
The consolidated and combined statements of earnings and comprehensive income for the year ended December 31, 2014 includes an allocation of general corporate expenses from B/E Aerospace. These costs were allocated to the Company on a systematic and reasonable basis utilizing a direct usage basis when identifiable, with the remainder allocated on the basis of costs incurred, headcount or other measures.
Allocations for general corporate expenses, including management costs and corporate support services provided to the Company, totaled $31.7 for fiscal year 2014. These amounts include costs for functions including executive management, finance, legal, information technology, human resources, employee benefits administration, treasury, risk management, procurement and other shared services.
In connection with the Spin‑off, we have created some of the functions that were previously provided to us through corporate allocations from B/E Aerospace in‑house. In addition, we entered into certain agreements with B/E Aerospace relating to transition services and IT services for a transitional period of approximately 24 months following the distribution with an option to extend for up to one year. In addition, we entered into an employee matters agreement and a tax sharing and indemnification agreement with B/E Aerospace in connection with the Spin‑off. This transitional support will enable KLX Inc. to establish its stand‑alone processes for various activities that were previously provided by B/E Aerospace and does not constitute significant continuing support of KLX Inc.’s operations. Expenses incurred under
F-14
those agreements totaled $8.7 and $9.6 for the years ended January 31, 2017 and 2016. The amount was not material for the year ended December 31, 2014 and the one month ended January 31, 2015.
Sales to B/E Aerospace for the years ended January 31, 2017 and 2016, December 31, 2014 and the one month ended January 31, 2015 were $24.1, $19.0, $16.2 and $1.5, respectively.
6. ACCRUED LIABILITIES
Accrued liabilities consist of the following:
|
|
|
January 31, 2017 |
|
January 31, 2016 |
|
||
|
Accrued salaries, vacation and related benefits |
|
$ |
31.6 |
|
$ |
28.7 |
|
|
Accrued commissions |
|
|
8.7 |
|
|
6.2 |
|
|
Income taxes payable |
|
|
10.3 |
|
|
11.4 |
|
|
Accrued interest |
|
|
11.7 |
|
|
11.7 |
|
|
Other accrued liabilities |
|
|
28.8 |
|
|
57.3 |
|
|
|
|
$ |
91.1 |
|
$ |
115.3 |
|
7. LONG‑TERM DEBT
Long-term debt consists of the following:
|
|
|
January 31, 2017 |
|
January 31, 2016 |
|
||
|
Senior unsecured notes |
|
$ |
1,200.0 |
|
$ |
1,200.0 |
|
|
Less unamortized original issue discount and debt issue costs |
|
|
18.0 |
|
|
20.5 |
|
|
|
|
$ |
1,182.0 |
|
$ |
1,179.5 |
|
In December 2014, in connection with the Spin‑off, the Company issued $1,200.0 aggregate principal amount of 5.875% senior unsecured notes due 2022 (the “5.875% Notes”), in an offering pursuant to the Securities Act of 1933, as amended. The net proceeds from the issuance of the 5.875% Notes were approximately $1,172.1, of which $750.0 was distributed to Former Parent, leaving KLX with net proceeds of approximately $422.1. The 5.875% Notes are senior unsecured debt obligations of the Company. We also entered into a $750.0 secured revolving credit facility dated as of December 16, 2014 and amended May 19, 2015 (the “Revolving Credit Facility”). As of January 31, 2017 and 2016, long‑term debt consisted of $1,200.0 of our 5.875% Notes.
Letters of credit outstanding under the Revolving Credit Facility aggregated $5.5 at January 31, 2017.
The Revolving Credit Facility is tied to a borrowing base formula, has no financial covenants and has $744.5 of availability as of January 31, 2017. The Revolving Credit Facility bears interest at an annual rate equal to the London interbank offered rate (“LIBOR”) plus the applicable margin (as defined), and expires in May 2020. No amounts were outstanding under the Revolving Credit Facility as of January 31, 2017.
F-15
Maturities of long‑term debt are as follows:
|
Year Ending January 31, |
|
|
|
|
|
2018 |
|
$ |
— |
|
|
2019 |
|
|
— |
|
|
2020 |
|
|
— |
|
|
2021 |
|
|
— |
|
|
2022 |
|
|
— |
|
|
Thereafter |
|
|
1,200.0 |
|
|
Total |
|
$ |
1,200.0 |
|
Interest expense amounted to $75.9, $77.7, $3.3 and $6.3 for the years ended January 31, 2017 and 2016, December 31, 2014 and the one month ended January 31, 2015, respectively.
8. COMMITMENTS, CONTINGENCIES AND OFF‑BALANCE‑SHEET ARRANGEMENTS
Lease Commitments—The Company finances its use of certain facilities and equipment under committed lease arrangements provided by various institutions. Since the terms of these arrangements meet the accounting definition of operating lease arrangements, the aggregate sum of future minimum lease payments is not reflected on the consolidated and combined balance sheets. At January 31, 2017, future minimum lease payments under these arrangements approximated $89.2, of which $85.2 is related to long‑term real estate leases.
Rent expense for the years ended January 31, 2017 and 2016 and December 31, 2014 was $28.9, $37.7 and $26.4, respectively. Future payments under operating leases with terms greater than one year as of January 31, 2017 are as follows:
|
Year Ending January 31, |
|
|
|
|
|
2018 |
|
$ |
10.5 |
|
|
2019 |
|
|
18.7 |
|
|
2020 |
|
|
15.0 |
|
|
2021 |
|
|
13.3 |
|
|
2022 |
|
|
11.2 |
|
|
Thereafter |
|
|
20.5 |
|
|
Total |
|
$ |
89.2 |
|
Litigation—The Company is a defendant in various legal actions arising in the normal course of business, the outcomes of which, in the opinion of management, neither individually nor in the aggregate are likely to result in a material adverse effect on the Company’s consolidated and combined financial statements.
On January 6, 2016, a putative class action complaint was filed against us and certain of our executive officers and directors in the United States District Court for the Southern District of Florida (the “Court”). The complaint alleged violations of Section 10(b) of the Exchange Act and Rule 10b-5 promulgated thereunder, as well as, in the case of the individual defendants, the control person provisions of the Exchange Act. The complaint principally alleged that the defendants knowingly made incorrect statements regarding the value of the identifiable intangible assets and goodwill associated with ESG prior to the impairment of such assets during the third quarter of 2015. On February 7, 2017, the Court dismissed the case with prejudice.
Indemnities, Commitments and Guarantees—During its normal course of business, the Company has made certain indemnities, commitments and guarantees under which it may be required to make payments in relation to certain transactions. These indemnities include indemnities to various lessors in connection with facility leases for certain claims arising from such facility or lease and indemnities to other parties to certain acquisition agreements. The duration of these indemnities, commitments and guarantees varies, and in certain cases, is indefinite. Many of these indemnities, commitments and guarantees provide for limitations on the maximum potential future payments the Company could be obligated to make. However, the Company is unable to estimate the maximum amount of liability related to its
F-16
indemnities, commitments and guarantees because such liabilities are contingent upon the occurrence of events that are not reasonably determinable. Management believes that any liability for these indemnities, commitments and guarantees would not be material to the accompanying consolidated and combined financial statements. Accordingly, no significant amounts have been accrued for indemnities, commitments and guarantees.
The Company has employment and compensation agreements with key officers of the Company. An agreement with one of the officers provides for the officer to earn a minimum of $1.0 per year, subject to increases as determined from time to time by the Company's Board of Directors or the Compensation Committee of the Board of Directors, for a three-year period from the effective date (as defined in such agreement), with automatic extension by one year on each anniversary of the effective date of the agreement unless either party provides notice of non-renewal, as well as quarterly contributions to a tax-deferred compensation plan which in the aggregate, on an annual basis, would amount to a contribution equal to 100% of such officer's base salary in effect at the time, to be reduced to 30% effective for fiscal quarters commencing on or after February 1, 2017.
One other agreement provides for an officer to receive annual minimum compensation of $0.7 per year, which may be increased in the discretion of the Company’s Board of Directors or the Compensation Committee of the Board of Directors, for a three-year period from the effective date (as defined in such agreement) with automatic extension by one year on each anniversary of the effective date of the agreement unless either party provides notice of non-renewal, and to receive quarterly contributions to a tax-deferred compensation plan which in the aggregate, on an annual basis, would amount to a contribution equal to 100% of such officer’s base salary in effect at the time.
In addition, the Company has employment agreements with certain other key members of management expiring on various dates. The Company's employment agreements generally provide for certain protections in the event of a change of control. These protections generally include the payment of severance and related benefits under certain circumstances in the event of a change of control.
9. INCOME TAXES
Income taxes as presented are calculated on a separate tax return basis. The Company determined the provision for income taxes using the asset and liability approach. Under this approach, deferred income taxes represent the expected future tax consequences of temporary differences between the carrying amounts and tax basis of assets and liabilities.
Valuation allowances are established when necessary to reduce deferred tax assets to the amounts expected to be realized. In assessing the need for a valuation allowance, the Company looked to the future reversal of existing taxable temporary differences, taxable income in carryback years and the feasibility of tax planning strategies and estimated future taxable income. The need for a valuation allowance can be affected by changes to tax laws, changes to statutory tax rates and changes to future taxable income estimates.
The Company recognizes tax benefits from uncertain tax positions only if it is more likely than not that the tax position will be sustained on examination by the taxing authorities, based on the technical merits of the position. The tax benefits recognized in the consolidated and combined financial statements from such positions are measured based on the largest benefit that has a greater than 50% likelihood of being realized upon ultimate settlement.
As of January 31, 2017, the Company has recorded a tax indemnity payable to B/E Aerospace totaling $4.7, of which $0.1 is classified in other current liabilities and $4.6 is classified in other long‑term liabilities.
F-17
Components of earnings (loss) before incomes taxes were:
|
|
|
Year Ended |
|
Month Ended |
||||||||
|
|
|
January 31, 2017 |
|
January 31, 2016 |
|
December 31, 2014 |
|
January 31, 2015 |
||||
|
Earnings (loss) before income taxes |
|
|
|
|
|
|
|
|
|
|
|
|
|
United States |
|
$ |
41.3 |
|
$ |
(624.4) |
|
$ |
210.9 |
|
$ |
11.3 |
|
Foreign |
|
|
12.2 |
|
|
10.3 |
|
|
32.9 |
|
|
0.1 |
|
Earnings (loss) before income taxes |
|
$ |
53.5 |
|
$ |
(614.1) |
|
$ |
243.8 |
|
$ |
11.4 |
Income tax expense (benefit) consists of the following:
|
|
|
Year Ended |
|
Month Ended |
||||||||
|
|
|
January 31, 2017 |
|
January 31, 2016 |
|
December 31, 2014 |
|
January 31, 2015 |
||||
|
Current: |
|
|
|
|
|
|
|
|
|
|
|
|
|
Federal |
|
$ |
— |
|
$ |
0.7 |
|
$ |
75.4 |
|
$ |
3.5 |
|
State |
|
|
0.3 |
|
|
(1.5) |
|
|
8.5 |
|
|
0.4 |
|
Foreign |
|
|
(1.3) |
|
|
3.8 |
|
|
29.0 |
|
|
0.8 |
|
|
|
|
(1.0) |
|
|
3.0 |
|
|
112.9 |
|
|
4.7 |
|
Deferred: |
|
|
|
|
|
|
|
|
|
|
|
|
|
Federal |
|
|
14.4 |
|
|
(213.3) |
|
|
42.8 |
|
|
— |
|
State |
|
|
1.3 |
|
|
(17.4) |
|
|
3.5 |
|
|
— |
|
Foreign |
|
|
(9.4) |
|
|
(0.6) |
|
|
(3.5) |
|
|
(0.4) |
|
|
|
|
6.3 |
|
|
(231.3) |
|
|
42.8 |
|
|
(0.4) |
|
Total income tax expense (benefit) |
|
$ |
5.3 |
|
$ |
(228.3) |
|
$ |
155.7 |
|
$ |
4.3 |
The difference between income tax expense (benefit) and the amount computed by applying the statutory U.S. federal income tax rate (35%) to the pre‑tax earnings consists of the following:
|
|
|
Year Ended |
|
Month Ended |
||||||||
|
|
|
January 31, 2017 |
|
January 31, 2016 |
|
December 31, 2014 |
|
January 31, 2015 |
||||
|
Statutory federal income tax expense (benefit) |
|
$ |
18.7 |
|
$ |
(214.9) |
|
$ |
85.3 |
|
$ |
4.0 |
|
U.S. state income taxes |
|
|
1.5 |
|
|
(17.5) |
|
|
6.0 |
|
|
0.3 |
|
Foreign tax rate differential |
|
|
0.1 |
|
|
(0.2) |
|
|
(3.7) |
|
|
0.8 |
|
Change in unrecognized tax benefits |
|
|
(7.8) |
|
|
0.4 |
|
|
— |
|
|
— |
|
Change in valuation allowance on foreign |
|
|
(1.6) |
|
|
5.3 |
|
|
— |
|
|
— |
|
Other, net |
|
|
1.3 |
|
|
2.0 |
|
|
0.8 |
|
|
(0.8) |
|
Non-taxable/non-deductible items |
|
|
(6.9) |
|
|
(3.4) |
|
|
|
|
|
|
|
Exit taxes |
|
|
— |
|
|
— |
|
|
67.3 |
|
|
— |
|
|
|
$ |
5.3 |
|
$ |
(228.3) |
|
$ |
155.7 |
|
$ |
4.3 |
F-18
The tax effects of temporary differences and carryforwards that give rise to deferred income tax assets and liabilities consist of the following:
|
|
|
January 31, 2017 |
|
January 31, 2016 |
|
||
|
Deferred tax assets: |
|
|
|
|
|
|
|
|
Inventory reserves |
|
$ |
24.8 |
|
$ |
15.4 |
|
|
Accrued liabilities |
|
|
12.9 |
|
|
15.7 |
|
|
Intangible Assets |
|
|
44.2 |
|
|
84.2 |
|
|
Net operating loss carryforward |
|
|
81.2 |
|
|
59.5 |
|
|
Inventory capitalization |
|
|
14.9 |
|
|
10.7 |
|
|
Other |
|
|
19.9 |
|
|
5.2 |
|
|
|
|
$ |
197.9 |
|
$ |
190.7 |
|
|
Deferred tax liabilities: |
|
|
|
|
|
|
|
|
Intangible assets |
|
|
(12.8) |
|
|
(16.1) |
|
|
Depreciation |
|
|
(25.3) |
|
|
(5.5) |
|
|
|
|
|
(38.1) |
|
|
(21.6) |
|
|
Net deferred tax asset before valuation allowance |
|
|
159.8 |
|
|
169.1 |
|
|
Valuation allowance |
|
|
(17.8) |
|
|
(21.9) |
|
|
Net deferred tax asset |
|
$ |
142.0 |
|
$ |
147.2 |
|
A reconciliation of the beginning and ending amounts of gross uncertain tax positions is presented below:
|
|
|
January 31, 2017 |
|
January 31, 2016 |
|
January 31, 2015 |
|
|||
|
Unrecognized tax benefit at beginning of period |
|
$ |
9.0 |
|
$ |
9.4 |
|
$ |
10.1 |
|
|
Additions for current year tax positions |
|
|
4.6 |
|
|
— |
|
|
— |
|
|
Additions for prior year tax positions |
|
|
1.3 |
|
|
— |
|
|
— |
|
|
Decreases for prior year tax positions |
|
|
(7.6) |
|
|
— |
|
|
— |
|
|
Currency fluctuations |
|
|
(0.1) |
|
|
(0.4) |
|
|
(0.7) |
|
|
Unrecognized tax benefit at end of period |
|
$ |
7.2 |
|
$ |
9.0 |
|
$ |
9.4 |
|
Included in the balance of unrecognized tax benefits as of January 31, 2017, 2016 and 2015 are $4.4, $9.0 and $9.4, respectively, of tax benefits that, if recognized, would affect the effective tax rate.
The Company does not anticipate that the total unrecognized tax benefits will significantly change due to the settlement of audits or the expiration of statutes of limitation within twelve months of this reporting date. The Company classifies interest and penalties related to income tax as income tax expense. The amount included in the Company’s liability for unrecognized tax benefits for interest and penalties was immaterial as of January 31, 2017, 2016 and 2015.
The Company is subject to taxation in the United States, various states and foreign jurisdictions. The Company has significant operations in the United States, the United Kingdom, France and Germany. Tax years that remain subject to examinations by major tax jurisdictions vary by legal entity but are generally open for the U.S. for tax years ending in 2014 and after and outside the U.S. for the tax years ending after 2007.
As of January 31, 2017, the Company has federal net operating loss carryforwards of $148.9 expiring beginning in 2035 and state net operating loss carryforwards of $97.9 expiring between 2020 and 2035 with the majority expiring in 2035. The Company has $88.1 of foreign net operating loss carryforwards as of January 31, 2017 for which a valuation allowance of $66.1 has been recognized.
All of the Company’s foreign net operating losses have an indefinite carryforward period. The Company’s future tax provision will reflect any favorable or unfavorable adjustments to its estimated tax liabilities when resolved. The Company is unable to predict the outcome of these matters. However, the Company believes that none of these matters will have a material effect on the results of operations or financial condition of the Company.
F-19
As a result of certain realization requirements of ASC 718, the table of deferred tax assets and liabilities does not include certain deferred tax assets as of January 31, 2017 that arose directly from (or the use of which was postponed by) tax deductions related to equity compensation that are greater than the compensation recognized for financial reporting. Equity will be increased by $0.5 if and when such deferred tax assets are ultimately realized. We use FASB ASC 740, Income Taxes ordering when determining when excess tax benefits have been realized.
Undistributed earnings of certain of the Company’s foreign subsidiaries amounted to $68.8 at January 31, 2017. Those earnings are considered to be permanently reinvested and no provision for U.S. federal and state income taxes has been made. Distribution of these earnings in the form of dividends or otherwise could result in U.S. federal taxes (subject to an adjustment for foreign tax credits) and withholding taxes payable in various foreign countries. It is not currently practical to determine the amount of U.S. income and foreign withholding tax payable in the event all such foreign earnings are repatriated.
The Company’s effective tax rate can fluctuate as operations and the local country tax rates fluctuate due to the number of tax jurisdictions in which the Company operates.
The Company recorded deferred charges during the year ended January 31, 2017 related to the deferral of income tax expense on intra-entity profits that resulted from the sale of our intellectual property rights (including intellectual property acquired during the current year) in Germany to our U.S. parent, KLX Inc. The deferred charges are included in the “Other current assets” and “Other assets” lines in the accompanying consolidated balance sheet as of January 31, 2017 in the amounts of $0.3 and $7.6, respectively. The deferred charges are amortized as a component of income tax expense over the fifteen year economic life of the intellectual property.
Under the tax sharing and indemnity agreement between the Company and B/E Aerospace, B/E Aerospace generally assumes liability for all federal and state income taxes for all tax periods ending on or prior to December 31, 2014. B/E Aerospace assumes the liability for all federal and state income taxes of KLX’s U.S. operations through the distribution date. KLX assumes all other federal taxes, foreign income tax/non‑income taxes and state/local non‑income taxes related to its business for all periods and B/E Aerospace assumes all other federal taxes, foreign income tax/non‑income taxes and state/local non‑income taxes related to their business for all periods. Additional taxes incurred related to the internal restructuring to separate the businesses to complete the spin‑off shall be shared equally between B/E Aerospace and KLX. Taxes incurred related to certain international tax initiatives for the KLX business shall be assumed by KLX subject to the calculation provisions of the tax sharing and indemnity agreement. In addition, B/E Aerospace transferred to KLX all the deferred tax assets and liabilities related to the KLX business as of December 16, 2014.
10. EMPLOYEE RETIREMENT PLANS
The Company sponsors and contributes to a qualified, defined contribution savings and investment plan, covering substantially all U.S. employees. The KLX Inc. Retirement Plan was established pursuant to Section 401(k) of the Internal Revenue Code. Under the terms of this plan, covered employees may contribute up to 100% of their pay, limited to certain statutory maximum contributions. Participants are vested in matching contributions immediately and the matching percentage is 100% of the first 3% of employee contributions and 50% on the next 2% of employee contributions. For all periods other than the year ended January 31, 2017, KLX employees participated in a plan sponsored by our Former Parent. Total expense for the plan was $3.4, $3.6, $2.8 and $0.4 for the years ended January 31, 2017 and 2016, December 31, 2014 and the one month ended January 31, 2015, respectively. The Company also sponsors and contributes to a supplemental executive retirement plan (“SERP”), which was established pursuant to Section 409A of the Internal Revenue Code, for certain employees. The SERP is an unfunded plan maintained for the purpose of providing deferred compensation for certain employees. This plan allows certain employees to annually elect to defer a portion of their compensation, on a pre‑tax basis, until their retirement. The retirement benefit to be provided is based on the amount of compensation deferred. Compensation expense under this program was $2.5, $2.4 and $0.1 for the years ended January 31, 2017 and 2016 and December 31, 2014, respectively. Compensation expense was immaterial under this program for the one month ended January 31, 2015. The Company and its subsidiaries participate in government‑sponsored programs in certain foreign countries. The Company funds these plans based on legal requirements, tax considerations, local practices and investment opportunities.
F-20
11. STOCKHOLDERS’ EQUITY
Earnings Per Share—Basic net earnings per common share is computed using the weighted average of common shares outstanding during the year. Diluted net earnings per common share reflects the potential dilution from assumed conversion of all dilutive securities such as stock options and unvested restricted stock using the treasury stock method. When the effects of the outstanding stock options, restricted stock awards or restricted stock units are anti‑dilutive, they are not included in the calculation of diluted earnings per common share. For the years ended January 31, 2017 and 2016 no shares were excluded from the determination of diluted earnings per common share and for the year ended December 31, 2014 and the one month ended January 31, 2015, approximately 0.1 and 0.1 million shares, respectively, were excluded from the determination of diluted earnings per common share because the effect would have been anti‑dilutive.
The following table sets forth the computation of basic and diluted net earnings per share for the years ended January 31, 2017 and 2016, December 31, 2014 and the one month ended January 31, 2015:
|
|
|
Year Ended |
|
Month Ended |
||||||||
|
|
|
January 31, 2017 |
|
January 31, 2016 |
|
December 31, 2014 |
|
January 31, 2015 |
||||
|
Numerator: net earnings (loss) |
|
$ |
48.2 |
|
$ |
(385.8) |
|
$ |
88.1 |
|
$ |
7.1 |
|
Denominator: |
|
|
|
|
|
|
|
|
|
|
|
|
|
Denominator for basic earnings per share—Weighted average shares (in millions) |
|
|
51.8 |
|
|
52.2 |
|
|
52.2 |
|
|
52.2 |
|
Effect of dilutive securities—Dilutive securities (in millions) |
|
|
0.4 |
|
|
— |
|
|
0.1 |
|
|
0.1 |
|
Denominator for diluted earnings per share—Adjusted weighted average shares (in millions) |
|
|
52.2 |
|
|
52.2 |
|
|
52.3 |
|
|
52.3 |
|
Basic net earnings (loss) per share(1) |
|
$ |
0.93 |
|
$ |
(7.39) |
|
$ |
1.69 |
|
$ |
0.14 |
|
Diluted net earnings (loss) per share(1) |
|
$ |
0.92 |
|
$ |
(7.39) |
|
$ |
1.68 |
|
$ |
0.14 |
|
(1) |
On December 16, 2014, the distribution date, B/E Aerospace stockholders of record as of the close of business on December 5, 2014 received one share of KLX common stock for every two shares of B/E Aerospace’s common stock held as of the record date. Basic and diluted earnings per common share and the average number of common shares outstanding were calculated using the number of KLX common shares outstanding immediately following the distribution. |
Long‑Term Incentive Plan—B/E Aerospace has a Long‑Term Incentive Plan (“LTIP”) under which the Former Parent’s Compensation Committee may grant stock options, stock appreciation rights, restricted stock, restricted stock units or other forms of equity based or equity related awards. KLX adopted an LTIP similar to the Former Parent’s upon the Spin‑off, and unvested shares in the Former Parent were transferred with the employees to KLX on the same terms and conditions on an exchange ratio of 1.8139 such that the impact was neutral to employees at the date of the Spin‑off.
During 2014, B/E Aerospace granted restricted stock under the LTIP to certain members of the Company’s management. Restricted stock grants vest over four years and are granted at the discretion of the Compensation Committee of the B/E Aerospace’s Board of Directors. Certain awards also vest upon attainment of performance goals. Compensation cost is recorded on a straight‑line basis over the vesting term of the shares based on the grant date value using the closing trading price. Share based compensation of $15.6, $11.4, $3.5 and $0.5 was recorded during fiscal year 2016, 2015 and 2014 and the one month ended January 31, 2015, respectively. Unrecognized compensation cost related to these grants was $32.5 at January 31, 2017.
F-21
The following table summarizes shares of restricted stock that were granted, vested, forfeited and outstanding:
|
|
|
January 31, 2017 |
|
January 31, 2016 |
|
||||||||||
|
|
|
|
|
|
|
|
Weighted |
|
|
|
|
|
|
Weighted |
|
|
|
|
|
|
Weighted |
|
Average |
|
|
|
Weighted |
|
Average |
|
||
|
|
|
|
|
Average |
|
Remaining |
|
|
|
Average |
|
Remaining |
|
||
|
|
|
Shares |
|
Grant Date |
|
Vesting Period |
|
Shares |
|
Grant Date |
|
Vesting Period |
|
||
|
|
|
(in thousands) |
|
Fair Value |
|
(in years) |
|
(in thousands) |
|
Fair Value |
|
(in years) |
|
||
|
Outstanding, beginning of period |
|
827.2 |
|
$ |
35.96 |
|
3.12 |
|
559.2 |
|
$ |
38.09 |
|
2.97 |
|
|
Shares granted |
|
264.2 |
|
|
41.64 |
|
|
|
497.8 |
|
|
33.42 |
|
|
|
|
Shares vested |
|
(246.5) |
|
|
35.72 |
|
|
|
(171.4) |
|
|
34.65 |
|
|
|
|
Shares forfeited |
|
(76.6) |
|
|
35.96 |
|
|
|
(58.4) |
|
|
38.56 |
|
|
|
|
Outstanding, end of period |
|
768.3 |
|
$ |
37.99 |
|
2.48 |
|
827.2 |
|
$ |
35.96 |
|
3.12 |
|
Our stock options are eligible to vest over three years in three equal annual installments, subject to continued employment on each vesting date. Vested options are exercisable at any time until 10 years from the date of the option grant, subject to earlier expirations under certain terminations of service and other conditions. The stock options granted have an exercise price equal to the closing stock price of our common stock on the grant date.
At January 31, 2017 and January 31, 2016, we have outstanding 298,298 and 596,598 unvested time-based stock options, respectively, under the KLX Inc. Long-Term Incentive Plan (the “Plan”), which stock options vest on the basis of continuous employment. All of the time-based options vest ratably during the period of service.
The following table sets forth the summary of options activity under the Plan (dollars in thousands except per share data):
|
|
|
January 31, 2017 |
|
|
January 31, 2016 |
|
|||||||||||||||
|
|
|
|
|
|
|
|
Weighted |
|
|
|
|
|
|
|
|
|
Weighted |
|
|
|
|
|
|
|
|
|
Weighted |
|
Average |
|
|
|
|
|
|
Weighted |
|
Average |
|
|
|
|
||
|
|
|
|
|
Average |
|
Remaining |
|
Aggregate |
|
|
|
|
Average |
|
Remaining |
|
|
Aggregate |
|
||
|
|
|
Number |
|
Exercise |
|
Contractual Life |
|
Intrinsic |
|
|
Number |
|
Exercise |
|
Contractual Life |
|
|
Intrinsic |
|
||
|
|
|
of Shares |
|
Price |
|
(in years) |
|
Value (1) |
|
|
of Shares |
|
Price |
|
(in years) |
|
|
Value (1) |
|
||
|
Outstanding, beginning of period |
|
894,899 |
|
$ |
39.08 |
|
8.96 |
$ |
— |
|
|
894,899 |
|
$ |
39.08 |
|
9.96 |
|
$ |
205.8 |
|
|
Granted |
|
— |
|
|
— |
|
|
|
|
|
|
— |
|
|
— |
|
|
|
|
|
|
|
Exercised |
|
— |
|
|
— |
|
|
|
|
|
|
— |
|
|
— |
|
|
|
|
|
|
|
Canceled |
|
— |
|
|
— |
|
|
|
|
|
|
— |
|
|
— |
|
|
|
|
|
|
|
Outstanding, end of period |
|
894,899 |
|
$ |
39.08 |
|
7.96 |
$ |
8,868.4 |
|
|
894,899 |
|
$ |
39.08 |
|
8.96 |
|
$ |
— |
|
|
|
|
|
|
|
|
|
|
|
|
|
|
|
|
|
|
|
|
|
|
|
|
|
Exercisable, end of period |
|
596,601 |
|
$ |
39.08 |
|
7.96 |
$ |
5,912.3 |
|
|
298,301 |
|
$ |
39.08 |
|
8.96 |
|
$ |
— |
|
|
(1) |
Aggregate intrinsic value is calculated based on the difference between our closing stock price at year end and the exercise price, multiplied by the number of in-the-money options and represents the pre-tax amount that would have been received by the option holders, had they all exercised all their options on the fiscal year end date. |
For the year ended January 31, 2017 and the one month ended January 31, 2015, we recorded $3.9 and $0.2, respectively, of stock-based compensation expense related to these options that is included within selling, general and administrative expenses. At January 31, 2017 and January 31, 2016, the unrecognized stock-based compensation related to these options was $7.7 and $7.5, respectively, and is expected to be recognized over a weighted-average period of 0.87 and 1.87 years, respectively.
We use the Black-Scholes option pricing model to determine the fair value of stock options. The determination of the fair value of stock-based payment awards on the date of grant using an option-pricing model is affected by our
F-22
stock price as well as assumptions regarding complex and subjective variables. These variables include the expected stock price volatility over the term of the awards, risk-free interest rate and expected dividends.
Due to the limited trading history of our common stock, we estimated expected volatility based on historical data of comparable public companies. The expected term, which represents the period of time that options granted are expected to be outstanding, is estimated based on guidelines provided in U.S. Securities and Exchange Commission Staff Accounting Bulletin No. 110 and represents the average of the vesting tranches and contractual terms. The risk-free rate assumed in valuing the options is based on the U.S. Treasury rate in effect at the time of grant for the expected term of the option. We do not anticipate paying any cash dividends in the foreseeable future and, therefore, used an expected dividend yield of zero in the option pricing model. Compensation expense is recognized only for those options expected to vest with forfeitures estimated based on our historical experience at B/E Aerospace and future expectations. Stock-based compensation awards are amortized on a straight line basis over a three year period.
The weighted average assumptions used to value the option grants are as follows:
|
|
|
January 31, |
|
|
|
|
2015 |
|
|
Expected life (in years) |
|
6.50 |
|
|
Volatility |
|
30.0% |
|
|
Risk free interest rate |
|
1.5% |
|
|
Dividend yield |
|
- |
|
The weighted average fair value per option at the grant date for options issued during the one month ended January 31, 2015 was $12.99.
12. EMPLOYEE STOCK PURCHASE PLAN
KLX has established a qualified Employee Stock Purchase Plan, the terms of which allow for qualified employees (as defined in the Plan) to participate in the purchase of designated shares of KLX’s common stock at a price equal to 85% of the closing price on the last business day of each semi‑annual stock purchase period. KLX issued approximately 51,000 and 50,000 shares of common stock to employees of the Company during the years ended January 31, 2017 and January 31, 2016, respectively, at a weighted average price per share of $31.09 and $30.62, respectively. B/E Aerospace had a similar plan and issued approximately 19,000 shares of common stock to employees of the Company during the year ended December 31, 2014, pursuant to this plan at a weighted average price per share of $71.40. No shares of common stock were issued during the one month ended January 31, 2015.
13. SEGMENT REPORTING
The Company is organized based on the products and services it offers. The Company’s reportable segments, which are also its operating segments, are comprised of ASG and ESG. Each segment regularly reports its results of operations and makes requests for capital expenditures and acquisition funding to the Company’s chief operational decision‑making group. This group is comprised of the Chairman and Chief Executive Officer and the President and Chief Operating Officer.
The following table presents revenues and other financial information by business segment:
|
|
|
|
|
|
|
|
|
|
|
|
|
|
|
Year Ended January 31, 2017 |
|
|||||||
|
|
|
Aerospace Solutions Group |
|
Energy Services Group |
|
Consolidated |
|
|||
|
Revenues |
|
$ |
1,340.9 |
|
$ |
153.2 |
|
$ |
1,494.1 |
|
|
Operating earnings (loss)(1) |
|
|
220.6 |
|
|
(91.2) |
|
|
129.4 |
|
|
Total assets(2) |
|
|
3,471.4 |
|
|
226.9 |
|
|
3,698.3 |
|
|
Goodwill |
|
|
996.4 |
|
|
— |
|
|
996.4 |
|
|
Capital expenditures(3) |
|
|
11.0 |
|
|
24.5 |
|
|
35.5 |
|
|
Depreciation and amortization |
|
|
30.4 |
|
|
36.5 |
|
|
66.9 |
|
F-23
|
|
|
|
|
|
|
|
|
|
|
|
|
|
|
Year Ended January 31, 2016 |
|
|||||||
|
|
|
Aerospace Solutions Group |
|
Energy Services Group |
|
Consolidated |
|
|||
|
Revenues |
|
$ |
1,312.5 |
|
$ |
254.9 |
|
$ |
1,567.4 |
|
|
Operating earnings (loss)(1) |
|
|
211.6 |
|
|
(748.4) |
|
|
(536.8) |
|
|
Total assets(2) |
|
|
3,422.8 |
|
|
268.2 |
|
|
3,691.0 |
|
|
Goodwill |
|
|
952.4 |
|
|
2.5 |
|
|
954.9 |
|
|
Capital expenditures(3) |
|
|
30.4 |
|
|
100.1 |
|
|
130.5 |
|
|
Depreciation and amortization |
|
|
28.1 |
|
|
46.9 |
|
|
75.0 |
|
|
|
|
|
|
|
|
|
|
|
|
|
|
|
|
Year Ended December 31, 2014 |
|
|||||||
|
|
|
Aerospace Solutions Group |
|
Energy Services Group |
|
Consolidated |
|
|||
|
Revenues |
|
$ |
1,310.2 |
|
$ |
385.5 |
|
$ |
1,695.7 |
|
|
Operating earnings(1) |
|
|
192.0 |
|
|
54.8 |
|
|
246.8 |
|
|
Total assets(2) |
|
|
3,298.4 |
|
|
982.2 |
|
|
4,280.6 |
|
|
Goodwill |
|
|
986.3 |
|
|
342.4 |
|
|
1,328.7 |
|
|
Capital expenditures(3) |
|
|
17.7 |
|
|
119.1 |
|
|
136.8 |
|
|
Depreciation and amortization |
|
|
28.0 |
|
|
40.0 |
|
|
68.0 |
|
|
|
|
|
|
|
|
|
|
|
|
|
|
|
|
Month Ended January 31, 2015 |
|
|||||||
|
|
|
Aerospace Solutions Group |
|
Energy Services Group |
|
Consolidated |
|
|||
|
Revenues |
|
$ |
93.1 |
|
$ |
39.9 |
|
$ |
133.0 |
|
|
Operating earnings(1) |
|
|
12.9 |
|
|
4.8 |
|
|
17.7 |
|
|
Total assets(2) |
|
|
3,252.2 |
|
|
972.4 |
|
|
4,224.6 |
|
|
Goodwill |
|
|
965.8 |
|
|
320.7 |
|
|
1,286.5 |
|
|
Capital expenditures(3) |
|
|
1.7 |
|
|
4.5 |
|
|
6.2 |
|
|
Depreciation and amortization |
|
|
2.4 |
|
|
4.9 |
|
|
7.3 |
|
|
(1) |
Operating earnings includes an allocation of corporate IT costs, employee benefits and general and administrative costs. The allocations were made on a direct usage basis when identifiable, with the remainder allocated on the basis of revenues generated, costs incurred, headcount or other measures. |
|
(2) |
Corporate assets (including cash and cash equivalents) of $378.2, $559.5, $451.6 and $508.4 at January 31, 2017, 2016 and 2015 and December 31, 2014, respectively, have been allocated to the above segments based on each segment’s percentage of total assets. |
|
(3) |
Corporate capital expenditures have been allocated to the above segments based on each segment’s percentage of total capital expenditures. |
Geographic Information
The Company operates principally in three geographic areas, the United States, Europe (primarily Germany) and emerging markets, such as Asia, the Pacific Rim and the Middle East. There were no significant transfers among geographic areas during these periods.
F-24
The following table presents revenues and operating earnings (loss) based on the originating location for the years ended January 31, 2017 and 2016, December 31, 2014 and the one month ended January 31, 2015. Additionally, it presents all identifiable assets related to the operations in each geographic area as of January 31, 2017 and 2016:
|
|
|
Year Ended |
|
Month Ended |
||||||||
|
|
|
January 31, 2017 |
|
January 31, 2016 |
|
December 31, 2014 |
|
January 31, 2015 |
||||
|
Revenues: |
|
|
|
|
|
|
|
|
|
|
|
|
|
Domestic |
|
$ |
1,423.8 |
|
$ |
1,453.4 |
|
$ |
1,505.3 |
|
$ |
124.1 |
|
Foreign |
|
|
70.3 |
|
|
114.0 |
|
|
190.4 |
|
|
8.9 |
|
|
|
$ |
1,494.1 |
|
$ |
1,567.4 |
|
$ |
1,695.7 |
|
$ |
133.0 |
|
Operating earnings (loss): |
|
|
|
|
|
|
|
|
|
|
|
|
|
Domestic |
|
$ |
109.3 |
|
$ |
(561.0) |
|
$ |
195.5 |
|
$ |
15.0 |
|
Foreign |
|
|
20.1 |
|
|
24.2 |
|
|
51.3 |
|
|
2.7 |
|
|
|
$ |
129.4 |
|
$ |
(536.8) |
|
$ |
246.8 |
|
$ |
17.7 |
|
|
|
|
|
|
|
|
|
|
|
|
January 31, 2017 |
|
January 31, 2016 |
|
||
|
Identifiable assets: |
|
|
|
|
|
|
|
|
Domestic |
|
$ |
3,214.1 |
|
$ |
3,182.2 |
|
|
Foreign |
|
|
484.2 |
|
|
508.8 |
|
|
|
|
$ |
3,698.3 |
|
$ |
3,691.0 |
|
Revenues by geographic area, based on destination, for the years ended January 31, 2017 and 2016, December 31, 2014 and the one month ended January 31, 2015 were as follows:
|
|
|
Year Ended |
|
|
Month Ended |
|
||||||||||||||||
|
|
|
January 31, 2017 |
|
January 31, 2016 |
|
December 31, 2014 |
|
|
January 31, 2015 |
|
||||||||||||
|
|
|
|
|
|
% of |
|
|
|
|
% of |
|
|
|
|
% of |
|
|
|
|
|
% of |
|
|
|
|
Revenues |
|
Revenues |
|
Revenues |
|
Revenues |
|
Revenues |
Revenues |
|
|
Revenues |
|
Revenues |
|
|||||
|
United States |
|
$ |
865.6 |
|
57.9 |
% |
$ |
955.3 |
|
61.0 |
% |
$ |
1,111.5 |
|
65.5 |
% |
|
$ |
90.1 |
|
67.7 |
% |
|
Europe |
|
|
387.9 |
|
26.0 |
% |
|
376.3 |
|
24.0 |
% |
|
374.2 |
|
22.1 |
% |
|
|
28.3 |
|
21.3 |
% |
|
Asia, Pacific Rim, Middle East and other |
|
|
240.6 |
|
16.1 |
% |
|
235.8 |
|
15.0 |
% |
|
210.0 |
|
12.4 |
% |
|
|
14.6 |
|
11.0 |
% |
|
Total revenues |
|
$ |
1,494.1 |
|
100.0 |
% |
$ |
1,567.4 |
|
100.0 |
% |
$ |
1,695.7 |
|
100.0 |
% |
|
$ |
133.0 |
|
100.0 |
% |
Export revenues from the United States to customers in foreign countries amounted to $511.1, $457.9, $414.3 and $29.6 in the years ended January 31, 2017 and 2016, December 31, 2014 and the one month ended January 31, 2015, respectively.
14. FAIR VALUE INFORMATION
All financial instruments are carried at amounts that approximate estimated fair value. The fair value is the price at which an asset could be exchanged in a current transaction between knowledgeable, willing parties. Assets measured at fair value are categorized based upon the lowest level of significant input to the valuations.
Level 1—quoted prices in active markets for identical assets and liabilities.
Level 2—quoted prices for identical assets and liabilities in markets that are not active or observable inputs other than quoted prices in active markets for identical assets and liabilities.
Level 3—unobservable inputs in which there is little or no market data available, which require the reporting entity to develop its own assumptions.
F-25
The carrying amounts of cash and cash equivalents (which the Company classifies as Level 1 assets), accounts receivable‑trade and accounts payable represent their respective fair values due to their short‑term nature. There was no debt outstanding under the Revolving Credit Facility as of January 31, 2017 and 2016. The fair value of the Company’s 5.875% Notes, based on market prices for publicly‑traded debt (which the Company classifies as Level 2 inputs), was $1,260.7 and $1,136.4 as of January 31, 2017 and 2016, respectively.
Goodwill and long-lived assets, including property and equipment and purchased intangibles subject to amortization were impaired and written down to their estimated fair values during the third quarter of Fiscal 2015. The goodwill level 3 fair value was determined using an income based approach utilizing estimates of future cash flow, discount rate and long-term growth rate, all of which were unobservable. The long-lived asset level 3 fair value was determined using a combination of the cost approach and the market approach, which used inputs that included replacement costs (unobservable), physical deterioration estimates (unobservable), economic obsolescence (unobservable), and market sales data for comparable assets.
The following table summarizes impairments of goodwill and long-lived assets and the related post impairment fair values of the corresponding ESG assets for the year ended January 31, 2016:
|
|
|
Year Ended |
||||
|
|
|
January 31, 2016 |
||||
|
|
|
Impairment |
|
Fair Value |
||
|
Property and equipment, net |
|
$ |
152.0 |
|
$ |
174.3 |
|
Goodwill |
|
|
310.4 |
|
|
— |
|
Intangible assets |
|
|
177.8 |
|
|
— |
|
|
|
$ |
640.2 |
|
$ |
174.3 |
Fair value is measured as of the impairment date using Level 3 inputs. See Note 4 for a discussion of the asset impairment charge recorded during the third quarter of Fiscal 2015.
The fair value information presented herein is based on pertinent information available to management at January 31, 2017 and 2016, respectively. Although management is not aware of any factors that would significantly affect the estimated fair value amounts, such amounts have not been comprehensively revalued for purposes of these consolidated and combined financial statements since those dates, and current estimates of fair value may differ significantly from the amounts presented herein.
15. SELECTED QUARTERLY DATA (Unaudited)
During the year ended January 31, 2017, the Company corrected errors in previously reported financial statements related to the application of an accounting principle on claims related to the termination of programs under a long-term contract and other errors associated with inventory and sales reserves.
Immaterial restatements to the three month period ended April 30, 2016 and the three and six month periods ended July 31, 2016 will be made when information for such periods are included in the Company’s Form 10-Q’s for the quarters ending April 30, 2017 and July 31, 2017, respectively. The impact of the immaterial restatements will be noted in these Form 10-Q filings for Fiscal 2017 and is summarized in the table below:
F-26
|
|
|
2016 Three Months Ended |
|
||||||||||
|
|
|
As Reported |
|
As Restated |
|
As Reported |
|
As Restated |
|
||||
|
|
|
First |
|
First |
|
Second |
|
Second |
|
||||
|
|
|
Quarter |
|
Quarter |
|
Quarter |
|
Quarter |
|
||||
|
Accounts Receivable - trade(1) |
|
$ |
267.8 |
|
$ |
252.4 |
|
$ |
289.0 |
|
$ |
261.1 |
|
|
Inventories, net(1) |
|
|
1,284.0 |
|
|
1,293.5 |
|
|
1,367.5 |
|
|
1,386.9 |
|
|
Stockholders' equity(1) |
|
|
2,234.0 |
|
|
2,230.4 |
|
|
2,228.3 |
|
|
2,223.0 |
|
|
Revenues(1) |
|
|
368.2 |
|
|
352.8 |
|
|
391.4 |
|
|
378.9 |
|
|
Cost of sales(1) |
|
|
278.7 |
|
|
269.3 |
|
|
296.3 |
|
|
286.4 |
|
|
Net earnings(1) |
|
|
6.2 |
|
|
2.5 |
|
|
9.6 |
|
|
8.0 |
|
|
Basic net earnings per share(2) |
|
|
0.12 |
|
|
0.05 |
|
|
0.18 |
|
|
0.15 |
|
|
Diluted net earnings per share(2) |
|
|
0.12 |
|
|
0.05 |
|
|
0.18 |
|
|
0.15 |
|
|
|
|
Year Ended January 31, 2017 |
|
||||||||||
|
|
|
(Restated) |
|
(Restated) |
|
|
|
|
|
||||
|
|
|
First |
|
Second |
|
Third |
|
Fourth |
|
||||
|
|
|
Quarter |
|
Quarter |
|
Quarter |
|
Quarter |
|
||||
|
Revenues(1) |
|
$ |
352.8 |
|
$ |
378.9 |
|
$ |
389.0 |
|
$ |
373.4 |
|
|
Cost of sales(1) |
|
|
269.3 |
|
|
286.4 |
|
|
289.0 |
|
|
281.4 |
|
|
Net earnings(1) |
|
|
2.5 |
|
|
8.0 |
|
|
19.8 |
|
|
17.9 |
|
|
Basic net earnings per share(2) |
|
|
0.05 |
|
|
0.15 |
|
|
0.38 |
|
|
0.35 |
|
|
Diluted net earnings per share(2) |
|
|
0.05 |
|
|
0.15 |
|
|
0.38 |
|
|
0.34 |
|
|
(1) |
The restated first quarter results include the correction of prior period errors which resulted in a reduction of revenue, cost of goods sold and net earnings of $12.1 million, $6.6 million and $3.4 million, respectively. The impact of these prior period errors was not material to the year ended January 31, 2017 or to any prior periods. |
|
(2) |
Net earnings per share are computed individually for each quarter presented. Therefore, the sum of the quarterly net earnings per share may not necessarily equal the total for the year. |
F-27
|
|
|
Year Ended January 31, 2016 |
|
||||||||||
|
|
|
First |
|
Second |
|
Third |
|
Fourth |
|
||||
|
|
|
Quarter |
|
Quarter |
|
Quarter(3) |
|
Quarter(4) |
|
||||
|
Revenues |
|
$ |
431.5 |
|
$ |
412.7 |
|
$ |
365.0 |
|
$ |
358.2 |
|
|
Cost of sales |
|
|
323.9 |
|
|
315.3 |
|
|
279.1 |
|
|
284.1 |
|
|
Net earnings (loss) |
|
|
17.9 |
|
|
7.4 |
|
|
(400.8) |
|
|
(10.3) |
|
|
Basic net earnings (loss) per share(1) |
|
|
0.34 |
|
|
0.14 |
|
|
(7.68) |
|
|
(0.20) |
|
|
Diluted net earnings (loss) per share(1)(2) |
|
|
0.34 |
|
|
0.14 |
|
|
(7.68) |
|
|
(0.20) |
|
|
(1) |
Net earnings per share are computed individually for each quarter presented. Therefore, the sum of the quarterly net earnings per share may not necessarily equal the total for the year. |
|
(2) |
The Company has potential common stock equivalents related to its outstanding restricted stock awards, restricted stock units and employee stock purchase plan. These potential common stock equivalents were not included in diluted loss per share for the three months ended January 31, 2016 because the effect would have been anti‑dilutive. Accordingly, basic and diluted loss per common share and the weighted average number of shares used in the computation are the same for the three months ended January 31, 2016. For each of the other periods presented, the Company had potential common stock equivalents related to its outstanding restricted stock awards, restricted stock units and employee stock purchase plan as of January 31, 2016 that were considered in the Company’s diluted earnings per share calculation. |
|
(3) |
Net loss in the third quarter includes an impairment charge of $640.2 including a goodwill impairment of $310.4, $177.8 related to identifiable intangibles and $152.0 related to PP&E. |
|
(4) |
Net loss in the fourth quarter includes $32.4 of non‑recurring costs, including acquisition and integration costs, severance and other Spin‑off related costs. |
F-28
SCHEDULE II—VALUATION AND QUALIFYING ACCOUNTS
FOR THE YEARS ENDED JANUARY 31, 2017 AND 2016, DECEMBER 31, 2014 AND THE ONE MONTH ENDED JANUARY 31, 2015
(In millions)
|
|
|
Balance At |
|
|
|
|
|
|
|
|
|
|
Balance At |
|
||
|
|
|
Beginning |
|
|
|
|
|
|
|
Write-Offs/ |
|
End |
|
|||
|
|
|
Of Period |
|
Expenses |
|
Other |
|
Disposals |
|
Of Period |
|
|||||
|
Deducted From Assets: |
|
|
|
|
|
|
|
|
|
|
|
|
|
|
|
|
|
Allowance for doubtful accounts: |
|
|
|
|
|
|
|
|
|
|
|
|
|
|
|
|
|
Year ended January 31, 2017 |
|
$ |
11.3 |
|
$ |
4.0 |
|
$ |
— |
|
$ |
1.8 |
|
$ |
13.5 |
|
|
Year ended January 31, 2016 |
|
|
8.0 |
|
|
4.1 |
|
|
— |
|
|
0.8 |
|
|
11.3 |
|
|
Month ended January 31, 2015 |
|
|
8.1 |
|
|
0.1 |
|
|
— |
|
|
0.2 |
|
|
8.0 |
|
|
Year ended December 31, 2014 |
|
|
6.0 |
|
|
12.4 |
|
|
0.2 |
|
|
10.5 |
|
|
8.1 |
|
|
Reserve for obsolete inventory: |
|
|
|
|
|
|
|
|
|
|
|
|
|
|
|
|
|
Year ended January 31, 2017 |
|
$ |
40.4 |
|
$ |
20.7 |
|
$ |
— |
|
$ |
1.5 |
|
$ |
59.6 |
|
|
Year ended January 31, 2016 |
|
|
33.5 |
|
|
7.7 |
|
|
— |
|
|
0.8 |
|
|
40.4 |
|
|
Month ended January 31, 2015 |
|
|
33.0 |
|
|
0.7 |
|
|
— |
|
|
0.2 |
|
|
33.5 |
|
|
Year ended December 31, 2014 |
|
|
30.3 |
|
|
4.6 |
|
|
— |
|
|
1.9 |
|
|
33.0 |
|
|
Deferred tax asset valuation allowance: |
|
|
|
|
|
|
|
|
|
|
|
|
|
|
|
|
|
Year ended January 31, 2017 |
|
$ |
21.9 |
|
$ |
— |
|
$ |
(1.6) |
|
$ |
(2.5) |
|
$ |
17.8 |
|
|
Year ended January 31, 2016 |
|
|
24.8 |
|
|
— |
|
|
5.3 |
|
|
(8.2) |
|
|
21.9 |
|
|
Month ended January 31, 2015 |
|
|
24.8 |
|
|
— |
|
|
— |
|
|
— |
|
|
24.8 |
|
|
Year ended December 31, 2014 |
|
|
12.8 |
|
|
— |
|
|
12.0 |
|
|
— |
|
|
24.8 |
|
F-29