Attached files
| file | filename |
|---|---|
| 8-K - 8-K - ICC Holdings, Inc. | icch-20180522x8k.htm |

2018 Annual Shareholder Meeting May 22, 2018
Forward-looking statements As a reminder, we will be presenting certain forward-looking statements, within the meaning of the Private Securities Litigation Reform Act of 1995, or the Reform Act, during this presentation which may include, but are not limited to, statements regarding the Company’s, plans, objectives, expectations and intentions and other statements contained in this presentation that are not historical facts. The forward-looking statements are based on management's current views and assumptions regarding future events and operating performance, and are inherently subject to significant business, economic, and competitive uncertainties and contingencies and changes in circumstances, many of which are beyond the Company’s control. The statements in this presentation are made as of the date of this presentation, even if subsequently made available by the Company on its website or otherwise. The Company does not undertake any obligation to update or revise these statements to reflect events or circumstances occurring after the date of this press release.
Although the Company does not make forward-looking statements unless it believes it has a reasonable basis for doing so, the Company cannot guarantee their accuracy. The foregoing factors, among others, could cause actual results to differ materially from those described in these forward-looking statements. For a list of other factors which could affect the Company’s results, see the Company’s filings with the Securities and Exchange Commission, “Item 2. Management's Discussion and Analysis of Financial Condition and Results of Operations,” including “Forward-Looking Information,” set forth in the Company’s Quarterly Report on Form 10-Q for the period ended March 31, 2018. No undue reliance should be placed on any forward-looking statements.

Contents Corporate Structure 2017 Highlights Operations and Financial Results
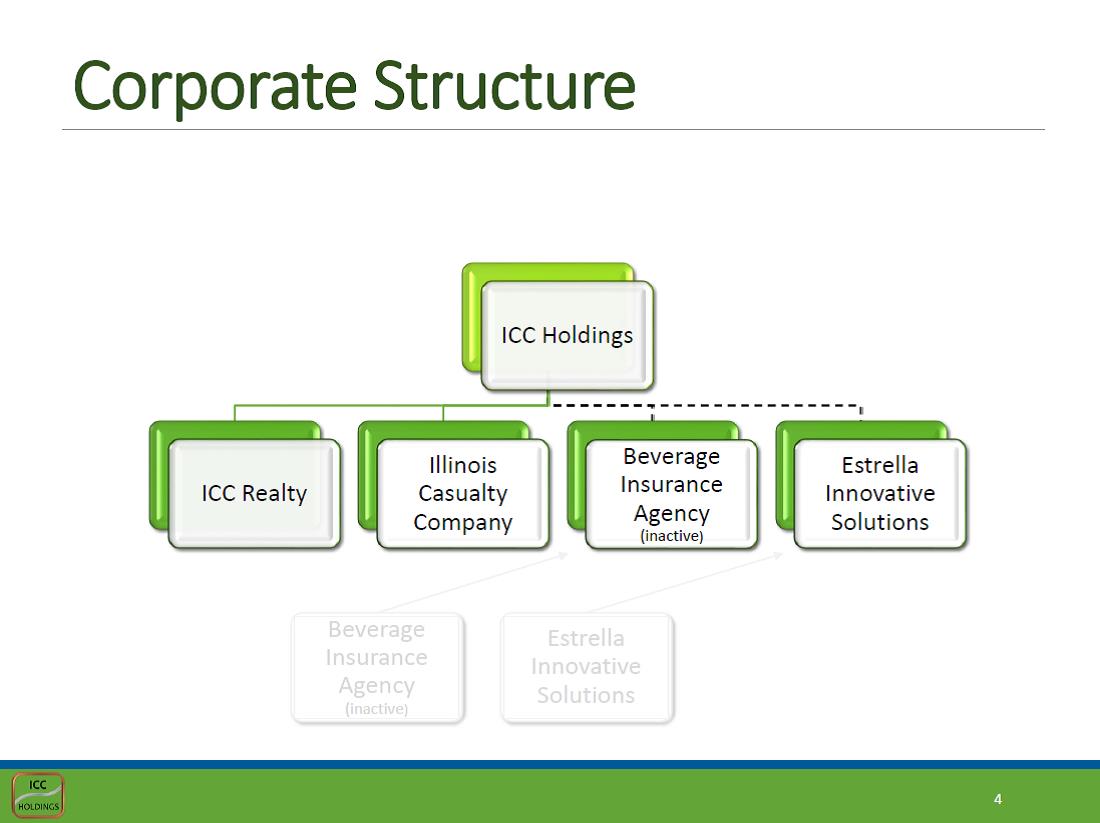
Corporate Structure
Contents Corporate Structure 2017 Highlights Operations and Financial Results

2017 Highlights Positive Premium Growth Successful Geographic Expansion
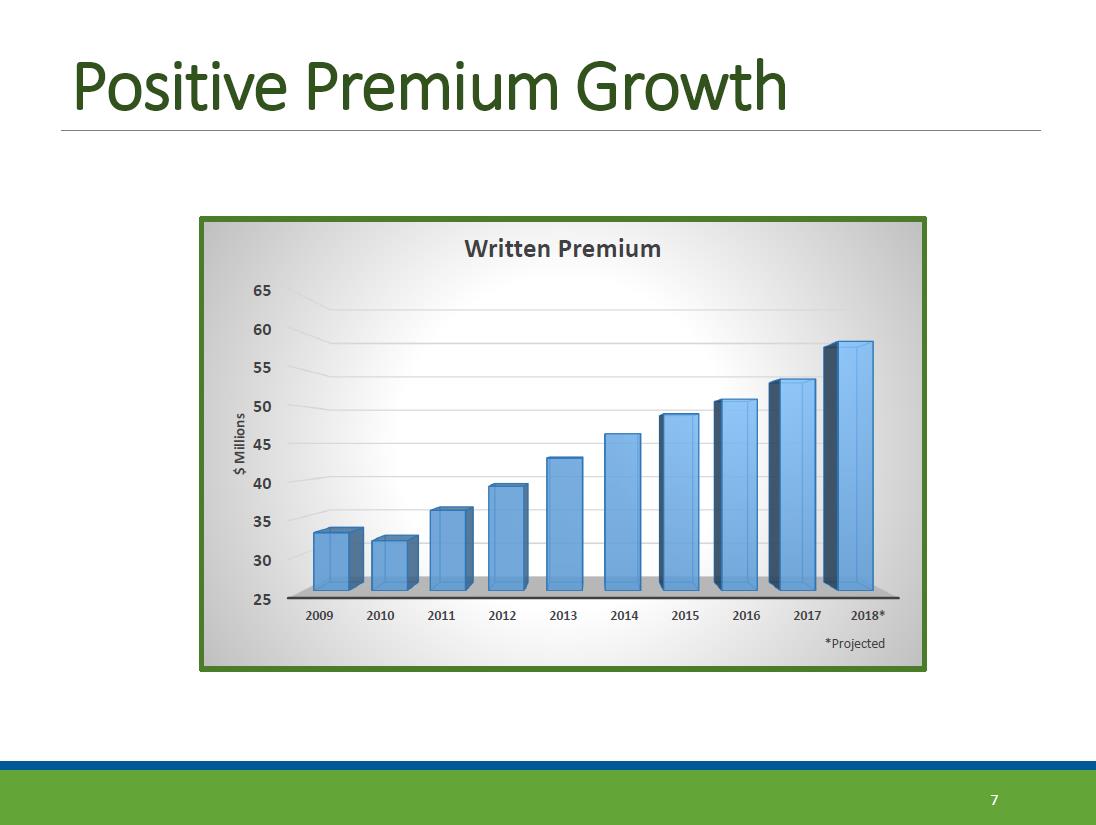
Positive Premium Growth Written Premium
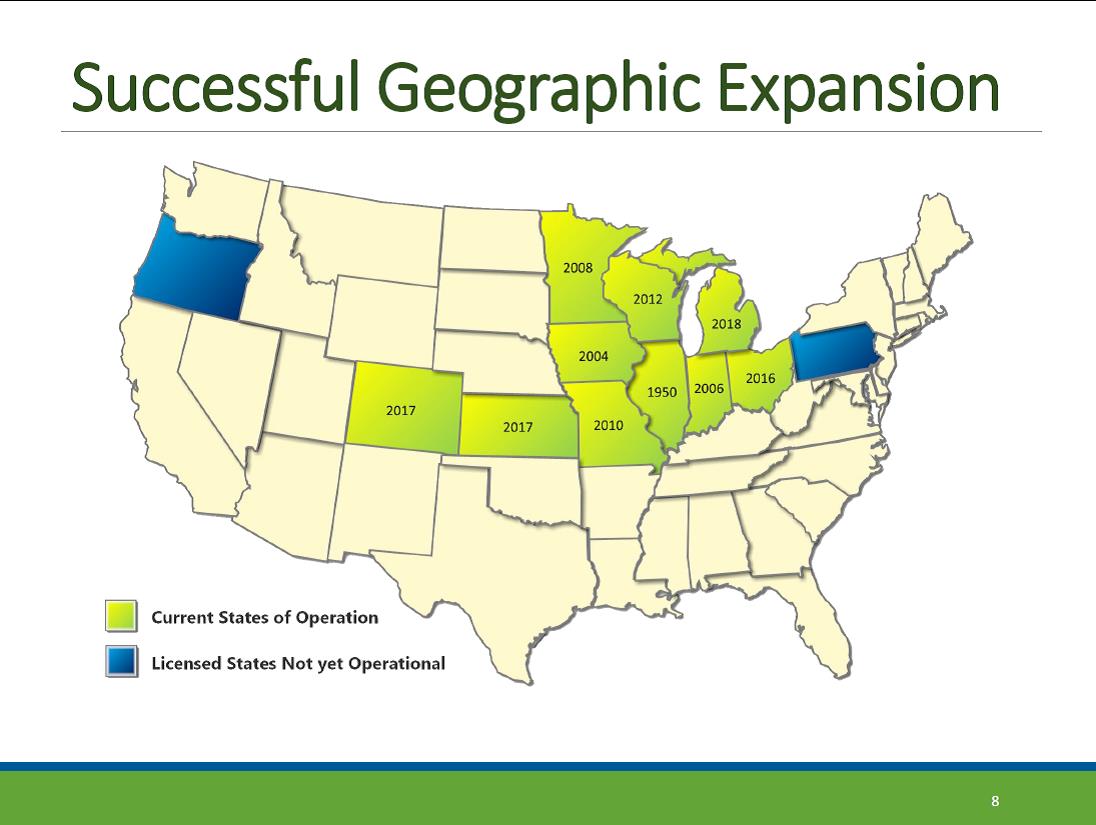
Successful Geographic Expansion Current States of Operation Licenses States Not yet Operational
Contents Corporate Structure 2017 Highlights Operations and Financial Results

|
|
|
2017 |
|
2016 |
|
2015 |
||||||
|
Net premiums earned |
|
$ |
44,213,271 |
|
$ |
42,611,365 |
|
$ |
40,219,861 | |||
|
Net investment income |
|
|
2,632,498 |
|
|
1,967,938 |
|
|
1,332,520 | |||
|
Net realized investment gains |
|
|
1,064,577 |
|
|
249,923 |
|
|
80,527 | |||
|
Other-than-temporary impairment losses |
|
|
(57,316) |
|
|
(212,731) |
|
|
— |
|||
|
Other income |
|
|
325,127 |
|
|
254,447 |
|
|
189,902 | |||
|
Consolidated revenues |
|
|
48,178,157 |
|
|
44,870,942 |
|
|
41,822,810 | |||
|
Losses and settlement expenses |
|
|
29,009,833 |
|
|
24,344,551 |
|
|
23,800,514 | |||
|
Policy acquisition costs and other operating expenses |
|
|
17,307,700 |
|
|
15,848,547 |
|
|
14,555,411 | |||
|
Interest expense on debt |
|
|
225,379 |
|
|
226,095 |
|
|
136,295 | |||
|
General corporate expenses |
|
|
555,109 |
|
|
464,383 |
|
|
314,120 | |||
|
Total expenses |
|
|
47,098,021 |
|
|
40,883,576 |
|
|
38,806,340 | |||
|
Earnings before income taxes |
|
|
1,080,136 |
|
|
3,987,366 |
|
|
3,016,470 | |||
|
Income tax expense: |
|
|
|
|
|
|
|
|
|
|||
|
Current |
|
|
197,200 |
|
|
986,066 |
|
|
461,567 | |||
|
Deferred |
|
|
175,085 |
|
|
190,903 |
|
|
400,175 | |||
|
Total income tax expense |
|
|
372,285 |
|
|
1,176,969 |
|
|
861,742 | |||
|
Net earnings |
|
$ |
707,851 |
|
$ |
2,810,397 |
|
$ |
2,154,728 | |||
|
|
|
|
|
|
|
|
|
|
|
|||
|
Other comprehensive earnings (loss), net of tax |
|
$ |
706,414 |
|
$ |
624,078 |
|
$ |
(1,023,847) | |||
|
Comprehensive earnings |
|
$ |
1,414,265 |
|
$ |
3,434,475 |
|
$ |
1,130,881 | |||

Operations and Financial Results Income Statement Year Ended December 31

|
|
|
|
2017 |
|
|
2016 |
|
|
2015 |
|
Assets |
|
|
|
|
|
|
|
|
|
|
Investments and cash: |
|
|
|
|
|
|
|
|
|
|
Available for sale securities, at fair value |
|
|
|
|
|
|
|
|
|
|
Fixed maturity securities |
|
$ |
89,605,073 |
|
$ |
64,134,023 |
|
$ |
65,195,308 |
|
Common stocks |
|
|
8,534,109 |
|
|
6,982,547 |
|
|
8,884,951 |
|
Preferred stocks |
|
|
3,867,429 |
|
|
2,798,413 |
|
|
— |
|
Property held for investment, at cost, net of accumulated depreciation of |
|
|
3,126,566 |
|
|
2,207,424 |
|
|
561,051 |
|
Cash and cash equivalents |
|
|
6,876,519 |
|
|
4,376,847 |
|
|
2,179,511 |
|
Total investments and cash |
|
|
112,009,696 |
|
|
80,499,254 |
|
|
76,820,821 |
|
Accrued investment income |
|
|
687,453 |
|
|
524,156 |
|
|
580,786 |
|
Premiums and reinsurance balances receivable, net |
|
|
19,013,262 |
|
|
17,479,487 |
|
|
15,637,909 |
|
Ceded unearned premiums |
|
|
274,972 |
|
|
270,751 |
|
|
57,304 |
|
Reinsurance balances recoverable on unpaid losses and settlement expenses, net |
|
|
10,029,834 |
|
|
12,114,998 |
|
|
19,535,058 |
|
Federal income taxes |
|
|
922,405 |
|
|
1,037,506 |
|
|
2,173,858 |
|
Deferred policy acquisition costs, net |
|
|
4,592,415 |
|
|
4,162,927 |
|
|
3,982,734 |
|
Property and equipment, at cost, net of accumulated depreciation of |
|
|
3,503,904 |
|
|
3,719,535 |
|
|
3,680,048 |
|
Other assets |
|
|
1,301,420 |
|
|
2,351,347 |
|
|
904,864 |
|
Total assets |
|
$ |
152,335,361 |
|
$ |
122,159,961 |
|
$ |
123,373,382 |
|
Liabilities and Equity |
|
|
|
|
|
|
|
|
|
|
Liabilities: |
|
|
|
|
|
|
|
|
|
|
Unpaid losses and settlement expenses |
|
$ |
51,074,126 |
|
$ |
52,817,254 |
|
$ |
61,055,626 |
|
Unearned premiums |
|
|
26,555,582 |
|
|
24,777,712 |
|
|
23,948,476 |
|
Reinsurance balances payable |
|
|
327,483 |
|
|
109,790 |
|
|
— |
|
Corporate debt |
|
|
4,339,208 |
|
|
3,786,950 |
|
|
3,273,560 |
|
Accrued expenses |
|
|
4,274,002 |
|
|
4,827,042 |
|
|
4,096,190 |
|
Other liabilities |
|
|
1,663,415 |
|
|
2,241,003 |
|
|
833,795 |
|
Total liabilities |
|
|
88,233,816 |
|
|
88,559,751 |
|
|
93,207,647 |
|
Equity: |
|
|
|
|
|
|
|
|
|
|
Common stock |
|
|
35,000 |
|
|
— |
|
|
— |
|
Additional paid-in capital |
|
|
32,333,290 |
|
|
— |
|
|
— |
|
Accumulated other comprehensive earnings, net of tax |
|
|
2,227,069 |
|
|
1,154,175 |
|
|
530,097 |
|
Retained earnings |
|
|
32,787,406 |
|
|
32,446,035 |
|
|
29,635,638 |
|
Less: Unearned Employee Stock Ownership Plan shares at cost3 |
|
|
(3,281,220) |
|
|
— |
|
|
— |
|
Total equity |
|
|
64,101,545 |
|
|
33,600,210 |
|
|
30,165,735 |
|
Total liabilities and equity |
|
$ |
152,335,361 |
|
$ |
122,159,961 |
|
$ |
123,373,382 |

Operations and Financial Results Balance Sheet - Year Ended December 31
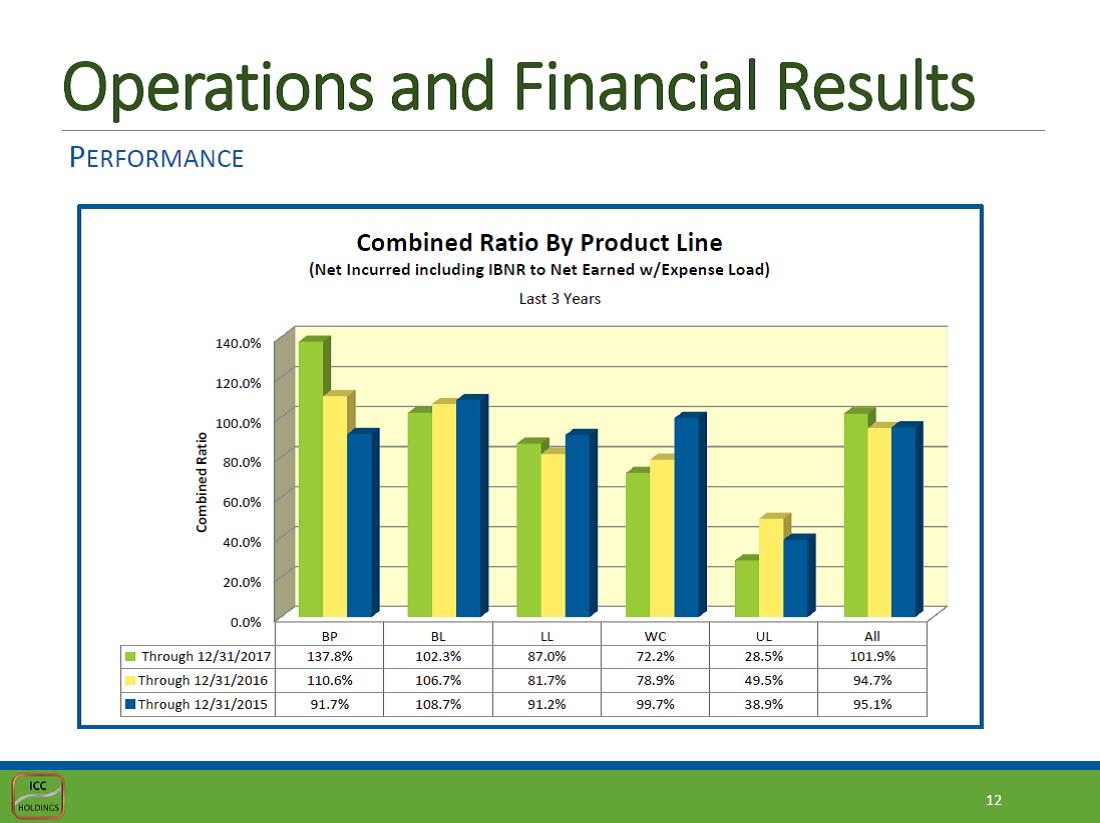
Operations and Financial Results Performance Combined Ratio by Product Line (net incurred including IBNR to Net earned w Expense load) last 3 years Through 12/31/2017 12/31/2016 12/31/2015 BP BL LL WC UL All 137.8% 102.3% 87.0% 72.2% 28.5% 101.9% 110.6% 106.7% 81.7% 78.9% 49.5% 94.7% 91.7% 108.7% 91.2% 99.7% 38.9% 95.1%
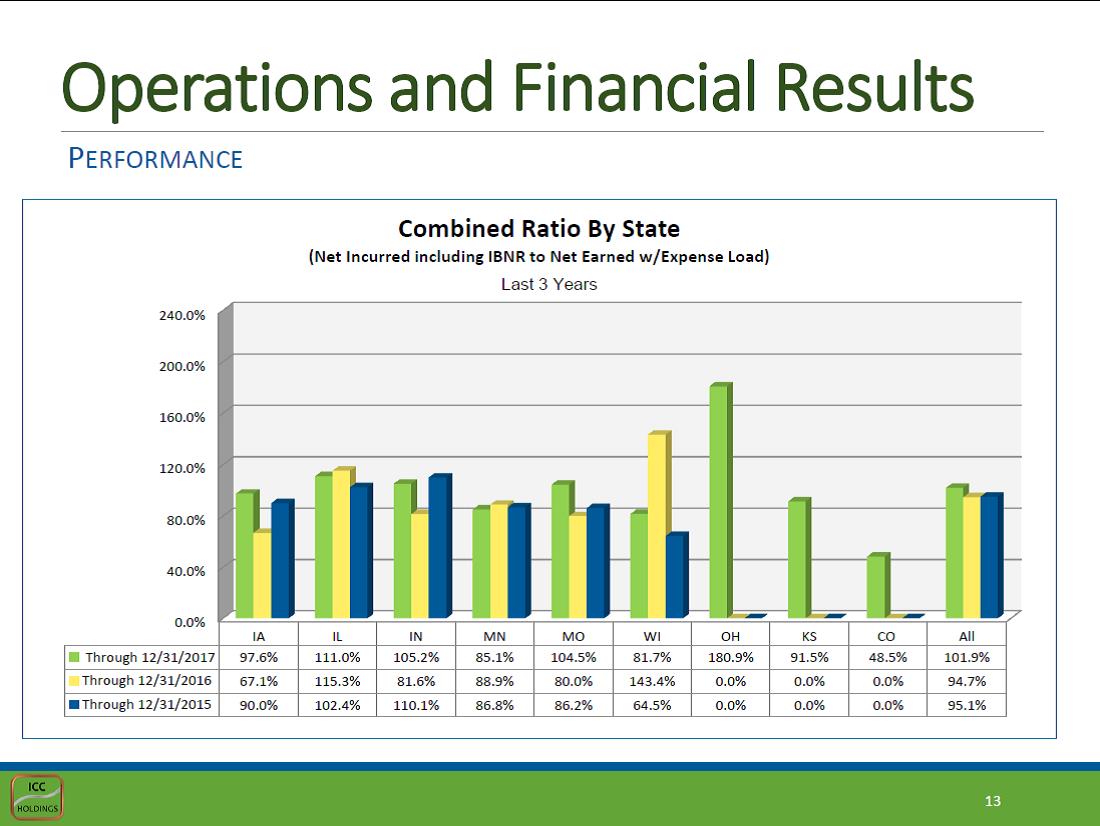
Operations and Financial Results Performance Combined Ratio by State (net incurred including IBNR to Net earned w Expense load) last 3 years Through 12/31/2017 12/31/2016 12/31/2015 IA IL IN MN MO WI OH KS CO All 97.6% 111.0% 105.2% 85.1% 104.5% 81.7% 180.9% 91.5% 48.5% 101.9% 67.1% 115.3% 81.6% 88.9% 80.0% 143.4% 0.0% 94.7% 90.0% 102.4% 110.1% 86.8% 86.2% 64.5% 95.1%
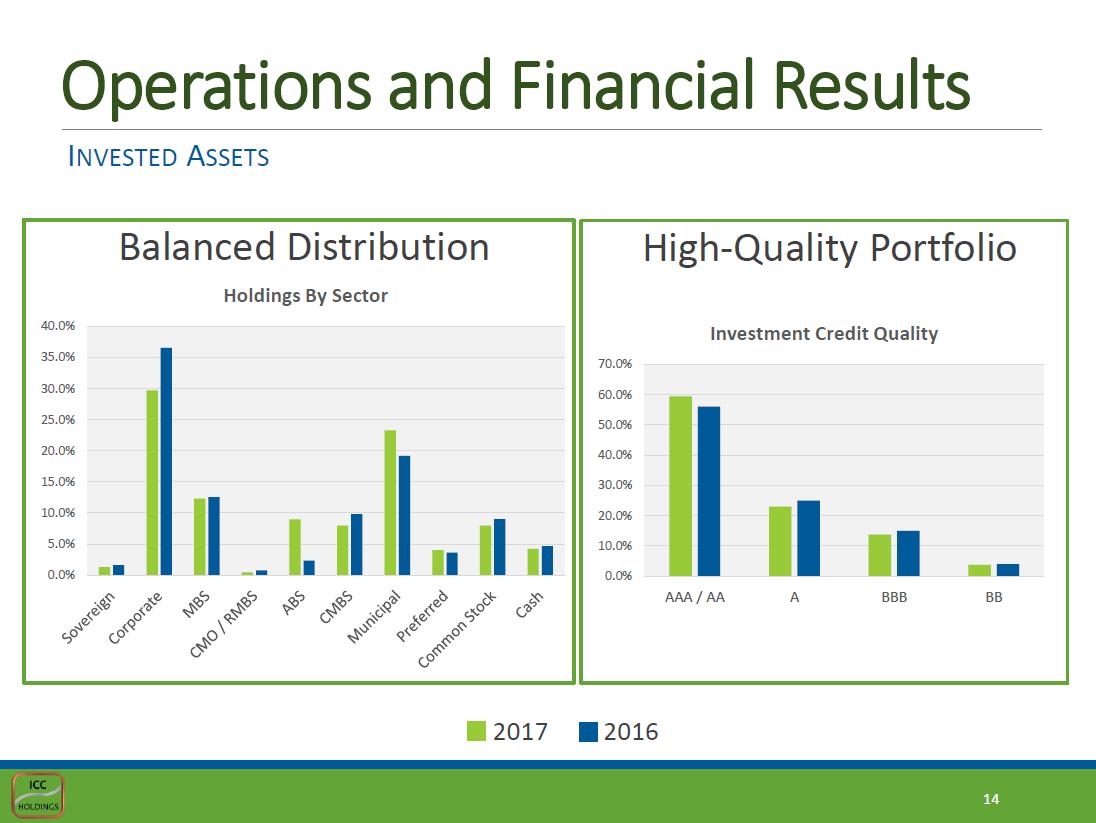
Operations and Financial Invest Assets Balanced Distribution Holdings by sector high-quality portfolio investment credit quality Sovereign corporate mbs cmo / rmbs abs cmbs municipal preferred common stock cash AAA / AA A BBB BB 2017 2016

Questions

Thank you