Attached files
| file | filename |
|---|---|
| EX-32.2 - EX-32.2 - ICC Holdings, Inc. | icch-20161231xex32_2.htm |
| EX-32.1 - EX-32.1 - ICC Holdings, Inc. | icch-20161231xex32_1.htm |
| EX-31.2 - EX-31.2 - ICC Holdings, Inc. | icch-20161231xex31_2.htm |
| EX-31.1 - EX-31.1 - ICC Holdings, Inc. | icch-20161231xex31_1.htm |
| EX-23.1 - EX-23.1 - ICC Holdings, Inc. | icch-20161231xex23_1.htm |
UNITED STATES
SECURITIES AND EXCHANGE COMMISSION
Washington, D.C. 20549
_______________________________
FORM 10-K
_______________________________
(Mark One)
|
☒ |
ANNUAL REPORT PURSUANT TO SECTION 13 OR 15(d) OF THE SECURITIES EXCHANGE ACT OF 1934 |
For the fiscal year ended December 31, 2016
or
|
☐ |
TRANSITION REPORT PURSUANT TO SECTION 13 OR 15(d) OF THE SECURITIES EXCHANGE ACT OF 1934 |
For transition period from to .
Commission File Number: 333-214081
ICC Holdings, Inc.
(Exact name of registrant as specified in its charter)
_______________________________
|
Pennsylvania
(State or other jurisdiction of
|
|
81-3359409
(I.R.S. Employer
|
|
225 20th Street, Rock Island, Illinois (Address of principal executive offices)
|
|
61201 (Zip Code)
|
(309) 793-1700
(Registrant’s telephone number, including area code)
Securities registered pursuant to Section 12(b) of the Act:
|
|
|
|
|
Common Stock, par value $0.01 per share Title of each class |
|
The NASDAQ Stock Market, LLC Name of exchange on which registered |
Securities registered pursuant to Section 12(g) of the Act: None
Indicate by check mark if the Registrant is a well-known seasoned issuer, as defined in Rule 405 of the Securities Act. Yes ☐ No ☒
Indicate by check mark if the Registrant is not required to file reports pursuant to Section 13 or 15(d) of the Act. Yes ☐ No ☒
Indicate by check mark whether the Registrant: (1) has filed all reports required to be filed by Section 13 or 15(d) of the Securities Exchange Act of 1934 during the preceding 12 months (or for such shorter period that the Registrant was required to file such reports), and (2) has been subject to such filing requirements for the past 90 days. Yes ☒ No ☐
Indicate by check mark whether the Registrant has submitted electronically and posted on its corporate website, if any, every Interactive Data File required to be submitted and posted pursuant to Rule 405 of Regulation S-T (§232.405 of this chapter) during the preceding 12 months (or for such shorter period that the Registrant was required to submit and post such files). Yes ☒ No ☐
Indicate by check mark if disclosure of delinquent filers pursuant to Item 405 of Regulation S-K (§229.405) is not contained herein, and will not be contained, to the best of Registrant’s knowledge, in definitive proxy or information statements incorporated by reference in Part III of this Form 10-K or any amendment to this Form 10‑K. ☒
Indicate by check mark whether the registrant is a large accelerated filer, an accelerated filer, a non-accelerated filer, or a smaller reporting company. See the definitions of “large accelerated filer,” “accelerated filer” and “smaller reporting company” in Rule 12b-2 of the Exchange Act. (Check one):
|
|
Large accelerated filer ☐ |
Accelerated filer ☐ |
|
|
Non-accelerated filer ☐ (Do not check if a smaller reporting company) |
Smaller reporting company ☒ |
Indicate by check mark whether the registrant is a shell company (as defined in Rule 12b-2 of the Exchange Act). Yes ☐ No ☒
As of June 30, 2016, the last business day of the Registrant’s most recently completed second fiscal quarter, there was no established public market for the Registrant’s common stock. The Registrant therefore cannot calculate the aggregate market value of its voting and non-voting common equity held by non-affiliates as of such date. The Registrant’s Common Stock began trading on The NASDAQ Stock Market, LLC on March 23,2017.
The number of shares of the registrant’s common stock outstanding as of March 28,2017 was 3,500,000.
DOCUMENTS INCORPORATED BY REFERENCE:
Portions of the definitive Proxy Statement for our 2017 Annual Meeting of Shareholders which is to be filed within 120 days after the end of the fiscal year ended December 31, 2016, are incorporated by reference into Part III of this Form 10-K, to the extent described in Part III.
|
|
Page |
|
|
PART I |
||
|
Item 1. |
3 | |
|
Item 1A. |
22 | |
|
Item 1B. |
33 | |
|
Item 2. |
33 | |
|
Item 3. |
33 | |
|
Item 3A. |
34 | |
|
Item 4. |
35 | |
|
|
||
|
PART II |
||
|
Item 5. |
Market for Registrant’s Common Equity, Related Stockholder Matters and |
36 |
|
Item 6. |
37 | |
|
Item 7. |
Management’s Discussion and Analysis of Financial Condition and Results of Operations |
39 |
|
Item 7A. |
59 | |
|
Item 8. |
61 | |
|
Item 9. |
Changes in and Disagreements with Accountants on Accounting and Financial Disclosure |
93 |
|
Item 9A. |
93 | |
|
Item 9B. |
93 | |
|
|
||
|
PART III |
||
|
Items 10-14. |
93 | |
|
|
||
|
PART IV |
||
|
Item 15. |
94 | |
|
|
||
| 95 | ||
| 96 | ||
~ 2 ~
Overview
ICC Holdings, Inc. is a Pennsylvania corporation that was organized in 2016. ICC Holdings, Inc. was formed so that it could acquire all of the capital stock of Illinois Casualty Company (ICC) in a mutual-to-stock conversion. Prior to the conversion, ICC Holdings, Inc did not engage in any operations. After the conversion, ICC Holdings, Inc’s primary assets are the outstanding capital stock of ICC, the outstanding membership interests of ICC Realty, LLC and a portion of the net proceeds from the stock offering completed in connection with the mustual-to-stock conversion. As of December 31, 2016, ICC was the ultimate reporting entity and the financial statements herein are for that entity.
As used in this Form 10-K, references to “the Company,” “we,” “us,” and “our” refer to the consolidated group. On a stand-alone basis ICC Holdings, Inc is referred to as the “Parent Company.” The consolidated group consists of the holding company, ICC Holdings, Inc., an operating insurance company, ICC, and ICC’s three wholly-owned subsidiaries, Beverage Insurance Agency, Inc., an inactive insurance agency, Estrella Innovative Solutions, Inc., an outsourcing company, and ICC Realty, LLC, a real estate services and holding company. ICC is an Illinois insurance company.
We are a regional, multi-line property and casualty insurance company focusing exclusively on the food and beverage industry. During 2016, we had $51.0 million in direct written premiums.
We primarily market our products through a network of approximately 140 independent agents in Illinois, Iowa, Indiana, Minnesota, Missouri, Ohio and Wisconsin. ICC has been assigned a “B++” (Good) financial strength rating by A.M. Best Company, Inc. (A.M. Best), which is the fifth highest out of fifteen possible ratings. ICC’s most recent evaluation by A.M. Best occurred on March 28, 2017, when A.M. Best affirmed its Financial Strength Rating (FSR) of “B++” and Issuer Credit Rating (ICR) of “bbb” (Good). The outlook of the FSR is stable, while the outlook of the Long-Term ICR remains positive. A.M. Best also assigned a Long-Term ICR of “bb” to ICC Holdings, Inc. The outlook assigned to the Credit Rating of the Company is positive.
For over 66 years, ICC has specialized in providing customized insurance products and aggressive claims defense for customers exclusively in the food and beverage industry.
ICC was founded as an inter-insurance exchange in 1950 based upon the recognition that establishments serving alcohol require unique insurance protection. Beginning in 1998, we expanded the scope of our product offerings beyond liquor liability to include property, general liability, umbrella, and workers compensation coverage. Our goal was to meet the full range of business insurance needs of our clients in the food and beverage industry.
In 1999, ICC recognized the significant need to automate. Upon determining available commercial software was inadequate to meet our long-term vision, we contracted the development of an integrated platform to handle agency, policy, and vendor management. Introduced in 2001, the first module successfully improved productivity and reporting capabilities. We built on that success by adding document imaging, claims, billing, and risk management modules. As it has grown, our information management system has provided us with a unique and comprehensive ability to automate processes, track and examine risk traits, and monitor claims development. As a result, ICC has constructed and leveraged a multi-variant pricing algorithm that allows us to better segment our business in order to more effectively price to actual exposure.
ICC mutualized in 2004 and began to expand its territory geographically within the Midwest. We are an admitted carrier in nine states: Colorado, Illinois, Iowa, Indiana, Minnesota, Michigan, Missouri, Ohio and Wisconsin. We currently issue policies in seven states, including Ohio where we began writing policies in the third quarter of 2016, and expect to begin writing premium in Michigan as early as 2018. As we expanded our territory and product lines over the last 66 years, we have maintained our focus and commitment to the food and beverage industry. As a result, we have developed unsurpassed expertise in our niche, particularly within the areas of underwriting, loss control, and claims management. ICC continues to leverage that experience into the ongoing development of innovative insurance products and services uniquely tailored to the food and beverage industry.
ICC is subject to examination and comprehensive regulation by the Illinois Department of Insurance. See Item 1. Business — Regulation.
Our executive offices are located at 225 20th Street, Rock Island, Illinois 61201, and our phone number is (309) 793-1700. Our web site address is www.ilcasco.com. Information contained on our website is not incorporated by reference into this Annual Report on Form 10-K and such information should not be considered to be part of this Annual Report on Form 10-K.
~ 3 ~
Our Business Strategies
We believe that our mission is to deliver expertly crafted insurance products and services for the food and beverage industry. Accordingly, we believe that this focus positions us to write profitable business in both hard insurance markets (where industry capital is constricted, competition is low, and premium rates are rising) and soft insurance markets (where industry capital is rising, competition is high and premium rates are falling). As part of our business process, we have developed our business strategy and focus using the following guiding principles to reflect the essence of who ICC aspires to be:
|
· |
we endeavor to return value to our stakeholders in the form of strong financial performance and sustained surplus growth; |
|
· |
we conduct our business with the highest ethics and unquestionable integrity; |
|
· |
we recognize and reward the commitment of all of our associates who make ICC a success, by challenging our associates, by valuing them and recognizing their contribution, while cultivating a mutually supporting culture; |
|
· |
we believe that an independent agency system is mutually beneficial to both the agent and ICC because of the drive to deliver the highest quality products at competitive prices; |
|
· |
customer service, which is understanding and meeting the needs and expectations of our policyholders and agents, is at the fundamental core of our existence; |
|
· |
we believe we can succeed in the marketplace given our unique understanding of the food and beverage industry, offering customized products and aggressively defending our insureds; |
|
· |
we focus on innovation, which drives our efficiency, quality and effectiveness; |
|
· |
we identify worthy causes to support with our corporate and associate resources and promote good corporate citizenship; and |
|
· |
we strive to improve our products and processes through intelligent investment in talent and technology that meets our exacting needs and those of our customers. |
In order to effectuate our mission and guiding principles, we have identified the following core strategies to achieve our long-term success:
|
· |
design and market commercial property and casualty products customized for the food and beverage industry, through our in-depth knowledge and research of the industry; |
|
· |
pursue deliberate geographic expansion; |
|
· |
Provide and market comprehensive policies with flexible a la carte options; |
|
· |
foster true partnerships with independent agents who have a significant presence in the food and beverage industry and an appreciation for ICC’s commitment and expertise to obtain optimal market share in the food and beverage industry; |
|
· |
leverage business intelligence to maximize performance, increase operational efficiency, and price our products for sustained profitability; |
|
· |
implement an investment strategy that maximizes return within acceptable risk tolerances; |
|
· |
promote a culture of excellence that encourages teamwork and contributes to talent retention and development; and |
|
· |
maintain a robust and comprehensive enterprise risk management program, focused on upside optimization and downside mitigation. |
Competitive Growth Strategies
Technology – We believe that existing and developing technology and information systems are and will continue to impact the insurance industry’s use of risk analysis in the underwriting process, provide tools for reduction of claims, and modernize the claims handling process. As part of our focus, we have internally developed a completely integrated policy management system. This system allows us to leverage loss control data for predictive analytics in both the claims and underwriting areas. For example, in the underwriting area, we create pricing models taking into account the unique characteristics of our customers, with industry-specific variables such as latest hour of close, type and frequency of on-site entertainment, and average alcoholic beverage pricing. We also have achieved better efficiency by moving to a more paperless organization and integrate off-site employees in our claims, underwriting, accounting, loss control and IT development areas. We intend to remain a leader in the industry in utilizing technology and data analysis to price our coverage based on the risk assumed, reduce accidents and provide prompt claims response.
~ 4 ~
Industry Expertise – We have been providing the food and beverage industry with insurance products and services since 1950. By leveraging our experience, we better understand our customers and their needs, which allows us to better price our products and services and defend claims aggressively and economically, using the experience of our in-house Legal Department and an established network of specialized defense attorneys. As a result, we are the endorsed carrier for the Missouri Restaurant Association, the Indiana Restaurant Association, the Illinois Licensed Beverage Association and the Minnesota Licensed Beverage Association. We also provide insurance agents continuing education on industry topics, such as liquor liability, kitchen fire prevention and alcohol server training. For policyholders serving liquor, we provide certified alcohol server training as a value-added service and risk elimination/mitigation tool. Our associates are also regular panel speakers at local and national claims conferences.
Enterprise Risk Management – As part of our effort to grow responsibly, we have put in place a cross-functional, multi-dimensional enterprise risk management program. The program is focused on financial, organization, operational, tactical, market and legal risks and managed at three different levels: the enterprise risk committee of our board of directors, our internal enterprise risk management committee and our internal audit committee. The focus of the enterprise risk committee of our board of directors is on oversight, top tier risk, emerging risks, and risk optimization. The internal enterprise risk committee is comprised of our senior management team, which is focused on conducting a review of all risks attendant to ICC at least annually; rating triaged risks for severity, frequency, and control; completing risk control reports for stress testing, risk tolerance, and mitigation plans; measuring and monitoring risk on an ongoing basis; and tying enterprise risk management to individual performance evaluations and compensation. Our internal audit function focuses on policy and procedure compliance and mitigation plans.
Growth Strategies
While we have established a significant market share in our existing territories, we believe that there is still opportunity for growth within our existing footprint. We will continue to seek out insurance agency partners who have a commitment to our niche and an ability to sell the value represented by our products. Our long-term growth plan also involved expanding geographically into states where we believe current insurance laws provide an attractive market within our niche for our existing products and services. Current state expansion plans include Colorado, Kansas, and Michigan. Additionally, we are currently evaluating expansion into Arizona, Massachusetts, Oregon, Pennsylvania, and Tennessee. We will consider geographic expansion opportunities that allow us to leverage existing agency relationships whose footprints overlap our own. Growth opportunities will always be carefully evaluated with long term profitability at the forefront of the decision making process.
Although we do not have any current plans or intent to expand or grow our business by acquisition, we will consider opportunities that are presented to us. The completion of this offering will supply additional capital needed to support substantially increased premium volume, which we expect to result from the implementation of these growth strategies.
Reaction to Market Cycles
Many insurance companies sporadically target businesses within our niche; however, a relatively small number make a long-term commitment to the niche through changing insurance market cycles. When the insurance market is “hard” and premium growth is achievable in less specialized segments, many carriers exit this niche. Large and diversified insurance carriers have the ability to shift their focus and resources to less challenging areas. When market conditions “soften,” those same carriers often aggressively move back into our niche for premium growth. Because we specialize in the niche, we do not shift resources to other market segments. Therefore, the Company generally maintains pricing stability throughout market cycles by relying on our strong loss control, underwriting, and claims expertise and our customer service commitment. We react to market cycles by adjusting our appetite for risks based on pricing and cycle conditions, but we maintain a consistent commitment to the food and beverage industry. Due to the relatively small number of insurance companies that make a long-term commitment to this niche, the insurance market does not fluctuate to the same extent as the insurance market for the general commercial market.
~ 5 ~
Our Challenges
Our business faces significant challenges that can impede our goal of growing our business while realizing operating profits, including the following:
Estimating Our Loss Reserves.
We maintain loss reserves to cover our estimated ultimate liability for unpaid losses and settlement expenses for reported and unreported claims incurred as of the end of each accounting period. These reserves represent management’s estimates of what the ultimate settlement and administration of claims will cost. Pursuant to applicable insurance regulations, these reserves are reviewed by an independent actuary on at least an annual basis. Setting reserves is inherently uncertain and there can be no assurance that current or future reserves will prove adequate. If our loss reserves are inadequate, it will have an unfavorable impact on our results. See Item 1. Business — Losses and Settlement Expense for a summary of the favorable and unfavorable developments in our loss reserves in the previous 10-year period.
Reliance on Independent Agents.
Our product is distributed through a contracted network of independent insurance agents. Independent agents are typically contracted with a number of insurance carriers. The producers within an agency will determine which product is most appropriate to recommend to their client or prospective client. The agency will select a product based on a variety of factors such as: premium; coverage; service including billing and claims; agency compensation and agency/company relationship. Establishing and maintaining long term financially successful agency relationships is very important to the long term success of a company.
Maintaining Our Financial Strength Ratings.
In March 2017, A.M. Best affirmed ICC’s financial strength rating of “B++” positive outlook. A key to achieving our goal of significant growth in our premiums written, is obtaining an A.M. Best rating of “A-” or better. Increasing our capitalization and maintaining strong operating performance, are significant rating components reviewed by A.M. Best. This is combined with a review of various other rating requirements. If we are not able to increase our rating or if A.M. Best downgrades our rating, it is likely that we will not be able to compete as effectively and our ability to sell insurance policies could decline. As a result, our financial results would be adversely affected. A.M. Best reviews our rating approximately once per year.
Attracting, Developing and Retaining Experienced Personnel.
To sustain our growth as a property and casualty insurance company operating in a specialty niche market, we must continue to attract, develop and retain management, marketing, distribution, underwriting, customer service, and claims personnel with expertise in the products we offer. The loss of key personnel, or our inability to recruit, develop and retain additional qualified personnel, could materially and adversely affect our business, growth and profitability.
Competitive Strengths
Our opportunity for growth is driven by our competitive strengths, which include the following:
Use of Data and Metrics to Improve our Underwriting Results.
Our analysis of data available through both governmental and other industry resources, combined with our internal data, drive our underwriting and pricing decisions. We have developed a multi-variant risk grading system and pricing algorithm that combines both objective and subjective inputs that drive both whether to provide coverage and pricing. This information helps us avoid providing coverage to higher risk insureds while improving our overall risk profile. Every risk we insure is inspected within the first 60 days of policy binding, which permits us to cancel the policy if we determine that the insured is not an acceptable risk or pricing is inadequate. Each inspection consists of an extensive risk profile questionnaire as well as between 25 to 100 pictures of the insured’s place of business. We believe this approach reduces claims frequency.
~ 6 ~
Focus on niche food and beverage business.
We target niche markets within the food and beverage industry that support adequate pricing and believe we are able to adapt to changing market needs ahead of our competitors through our strategic focus. We develop and deliver specialty insurance products priced to meet our customers’ needs and strive to generate consistent underwriting profit. We believe that our extensive experience and expertise specific to underwriting and claims management in the food and beverage industry will allow continued loss ratio improvement in 2017 and going forward. The Company is committed to retaining this underwriting and claim handling expertise as a core competency as the volume of business increases.
Strong market presence with name recognition and long-standing producer relationships.
We have been writing insurance for the food and beverage industry in Illinois since 1950. Approximately 36.9% of current total premium is written in Illinois.
Great care is taken in building the ICC brand in all states of operation and the Company holds significant market share in nearly all states serviced. ICC acknowledges that each state, each agency and each customer is unique. A commitment to quality of product and services is universally important and recognized.
Scalable operations positioned for growth.
We are focused on automation and operating efficiencies across its core functional areas. We have consistently increased premium per full time equivalent employee for five consecutive years and are positioned to continue that trend with current growth plans. We believe we are well-positioned in both terms of personnel and systems to increase written premiums and to expand into new geographic markets with better than industry level profitability using the efficient operating infrastructure we have developed over the last few years.
Experienced management team.
We are managed by an experienced group of executives led by Arron K. Sutherland, our President and Chief Executive Officer. Mr. Sutherland has served in his current position since June 2010, joined ICC in 2006 and has worked in the insurance industry for over 20 years. Michael R. Smith, our Vice President – Chief Financial Officer, has served with ICC since 2011. Mr. Smith has more than 20 years of experience in the financial services industry, including 15 years with insurance organizations. Howard J. Beck, our Vice President – Chief Underwriting Officer, has been with ICC since 2004 and has over 24 years of underwriting experience. Norman D. Schmeichel, our Vice President – Chief Information Officer, has served with ICC since 2002. Mr. Schmeichel has more than 20 years’ experience in information technologies and 14 years’ experience in the insurance industry. Additionally, Julia B. Suiter, our Chief Legal Officer, has served with ICC since 2009 and has over 20 years’ experience in insurance defense and contract law. Rickey Plunkett, our Director of Claims, has served with ICC since 2010 and has over 35 years of experience in the claims field. Kathleen S. Springer, our Director of Human Resources, has served with ICC since 2008 and has over 20 years’ experience in benefits, compensation, and talent acquisition and more than 8 years’ experience in the insurance industry. As a group, our executive officers have on average more than 20 years’ experience in the property and casualty insurance industry.
Products
ICC has specialized in the food and beverage industry since 1950. Our product language is based on Insurance Services Offices (ISO) forms, which is an industry standard, but tailored to the specific needs of our clients. We began by writing liquor liability or dram shop insurance and that remains a prominent line of business today. Commercial property and liability are written in a single policy as a business owners policy (BOP). ICC also writes workers compensation and commercial umbrella policies which are written as complementary lines to the BOP and liquor liability and are not offered on a stand-alone basis. As of December 31, 2016, ICC writes 4,863 BOP policies, 4,683 liquor liability policies, 1,742 worker’s compensation policies and 1,187 commercial umbrella policies. 90.5% of BOP policies and 89.7% of liquor liability policies are for either restaurants or taverns. While we do not currently write commercial auto insurance, we do insure risks associated with the delivery of food or beverage.
Marketing and Distribution
Our commercial insurance product is sold by over 140 independent insurance agents in Illinois, Iowa, Indiana, Minnesota, Missouri, Ohio and Wisconsin. These agencies access multiple insurance companies and are typically established businesses in the communities in which they operate. We view these agents as our primary customers because they are in a position to recommend either our insurance products or those of a competitor to their customers. We consider our relationships with these agencies to be a core strength of the Company.
~ 7 ~
We manage our producers through quarterly business reviews utilizing various internally generated reports. Our quantitative agency review (QAR) measures each agency on a variety of weighted metrics and ranks them from high to low. The measurement is updated on a weekly basis and is available for all company employees’ review.
For the year ended December 31, 2016, only two of our producers were responsible for more than 5% of our direct premiums written and our top 10 producers accounted for approximately 37.5% of direct premiums written.
Our agency partners are supported by our Marketing Department. These representatives also identify and train new agents. We conduct regularly scheduled webinars for agents as well as onsite training on company products and services. These include technical training about our products as well as sales training to effectively market our products. We also offer our agents industry specific training that qualifies for continuing education credit for state insurance license requirements.
Agents are compensated through a fixed base commission with an opportunity for profit sharing depending on the producer’s premiums written and profitability. Agents receive commission as a percentage of premiums (generally 15% for most lines, except worker’s compensation policies which are generally at 7.5%) as their primary compensation from us. We offer a contingent compensation plan as an incentive for producers to place high-quality business with us and to support our loss control efforts. We believe that the contingent compensation paid to our producers is comparable with those offered by other insurance companies and is designed to reward agents for growth and profitability.
Our marketing efforts are also supported by our Claims, Litigation, Billing, Underwriting and Loss Control Departments. As industry specialists, we are able to offer expertise in all interactions with agents and/or policyholders. For example, our claims philosophy is to provide prompt and efficient service and claims processing, resulting in a positive experience for both the agents and policyholders. We take an aggressive, defense-oriented position on third party liability claims which is recognized and appreciated by our policyholders. We believe that these positive experiences result in higher policyholder retention and create new business opportunities for our agents. While we rely on our agents for front line distribution and customer support, underwriting, billing, loss control and claim handling responsibilities are retained by us. Many of our agents have had direct relationships with us for a number of years.
Underwriting, Risk Assessment and Pricing
Our underwriting philosophy is aimed at consistently generating profits through sound risk selection, stringent loss control and pricing discipline. One key element in sound risk selection is our use of risk characteristic metrics. Through 66 years of focused underwriting, we have identified predictive metrics of data that many other insurance companies do not recognize or measure. Use of these metrics allows us to more effectively price risks, thereby improving our profitability and allowing us to compete favorably with other insurance carriers. We also are very active in leveraging our onsite loss control inspections. An example would be the monitoring of kitchen fire suppression systems servicing to reduce kitchen fire losses.
Our philosophy is to understand our industry and be disciplined in our underwriting efforts. We will not compromise profitability for top line growth.
Our competitive strategy in underwriting is:
|
· |
Maximize the use of available information acquired through a wide variety of industry resources. |
|
· |
Allow our internal metrics and rating to establish risk pricing and use sound underwriting judgement for risk selection and pricing modification. |
|
· |
Utilize our risk grading system, which combines both objective and subjective inputs, to quantify desirability of risks and improve our overall risk profile. |
|
· |
Physically inspect every new insured within the first 60 days of policy binding with our in-house loss control representatives. Our inspection consists of an extensive risk profile questionnaire and includes 25 to 100 electronic photos of the insured’s place of business. Inspections that demonstrate that a risk is not desirable is a basis for revoking coverage. |
|
· |
Provide very high-quality service to our agents and insureds by responding quickly and effectively to information requests and policy submissions. Treat our agents as partners and have the same expectation of them. |
Our Underwriting Department works in teams with each agent assigned to one of three teams. We underwrite our accounts by evaluating each risk with consistently applied standards. Each policy undergoes a thorough evaluation process prior to every renewal.
~ 8 ~
Our underwriting staff of 24 employees has an average of 12 years of insurance industry experience. Howard J. Beck, our Vice President – Chief Underwriting Officer, has been with ICC since 2004 and has over 27 years of insurance experience with 20 years of property and casualty underwriting experience.
We strive to be disciplined in our pricing by pursuing targeted rate changes to continually improve our underwriting profitability while still being able to attract and retain profitable customers. Our pricing reviews involve evaluating our claims experience, loss trends, data acquired from inspections, applications and other data sources to identify characteristics that drive the frequency and severity of our claims. These results drive changes to rates and rating metrics as well as understanding what portions of our business are most profitable.
This knowledge and analysis enables us to price risks accurately, improve account retention, and drive profitable new business.
Claims and Litigation Management
Our claims team supports our underwriting strategy by working to provide a timely, good faith claims handling response to our policyholders. Claims excellence is achieved by timely investigation and handling of claims, settlement of meritorious claims for equitable amounts, maintenance of adequate case reserves, and control of claims loss settlement expenses.
Claims on insurance policies are received directly from the insured or through our independent agents. Our Claims Department supports our producer relationship strategy by working to provide a consistently responsive level of claim service to our policyholders.
Rickey Plunkett, our Director of Claims, supervises a staff of 16 employees with considerable years of experience in processing property and casualty insurance claims. Mr. Plunkett joined ICC in 2010 and has over 30 years of experience in claims management.
Julia B. Suiter, our Chief Legal Officer, supervises a staff of three employees, two of whom are also attorneys. Ms. Suiter joined ICC in 2009 and has been practicing law both in-house and in private practice for 24 years.
Technology
Our technology efforts are focused on supporting our strategy of differentiating ourselves from our competitors through use of data mining, business intelligence solutions, and data analysis to determine profitability of new and existing business and to better price risks that we underwrite.
We have streamlined internal processes to achieve operational efficiencies through the implementation of a policy and claim imaging and workflow system. This system provides online access to electronic copies of policies, quotes, inspections, and any other correspondence enabling our associates to quickly and efficiently underwrite policies and adjust claims as well as respond to our producers’ inquiries.
Since the system integrates all aspects of the policy life cycle, from underwriting to billing to claims, we are able to better automate all internal workflows through electronic routing thus lowering costs and providing better service to our customers. This system allows us to leverage loss control data for predictive analytics in both the claims and underwriting areas. For example, in the underwriting area, we can create pricing models taking into account the unique characteristics of our customers, such as neighborhoods, entertainment on site and average alcoholic beverage pricing.
We have implemented best in class virus or malware protections while still enabling our employees to work from any location. We are tested on a periodic basis to ensure our protections are sufficient.
We have the ability to scale since we are almost entirely a paperless organization. This allows us to integrate off-site employees just as if they are in the office. We intend to remain a leader in the industry by utilizing technology and data analysis to price our coverage based on the risk assumed and to both reduce accidents and provide a prompt response to claims.
As part of our disaster recovery program, we utilize a third party backup system to provide a complete copy of our production systems at an off-site location that is updated on a daily basis. We also have a generator that will allow the home office to operate in the event that power or access to our headquarters is disrupted. We test this disaster recovery plan bi-annually as well as continually expand its capabilities to eliminate business interruption to the best of our ability.
~ 9 ~
Reinsurance
In accordance with insurance industry practice, we reinsure a portion of our exposure and pay to the reinsurers a portion of the premiums received on all policies reinsured. Insurance policies written by us are reinsured with other insurance companies principally to:
|
· |
reduce net liability on individual risks; |
|
· |
mitigate the effect of individual loss occurrences (including catastrophic losses); |
|
· |
stabilize underwriting results; |
|
· |
decrease leverage; and |
|
· |
increase our underwriting capacity. |
Reinsurance can be facultative or treaty. Under facultative reinsurance, each policy or portion of a risk is reinsured individually. Under treaty reinsurance, an agreed-upon portion of a class of business is automatically reinsured. Reinsurance also can be classified as quota share reinsurance, pro rata reinsurance or excess of loss reinsurance. Under quota share reinsurance and pro rata reinsurance, the insurance company issuing the policy cedes a percentage of its insurance liability to the reinsurer in exchange for a like percentage of premiums, less a ceding commission. The company issuing the policy in turn recovers from the reinsurer the reinsurer’s share of all loss and settlement expenses incurred on those risks. Under excess of loss reinsurance, an insurer limits its liability to all or a particular portion of the amount in excess of a predetermined deductible or retention. Regardless of type, reinsurance does not legally discharge the insurance company issuing the policy from primary liability for the full amount due under the reinsured policies. However, the assuming reinsurer is obligated to reimburse the company issuing the policy to the extent of the coverage ceded.
We determine the amount and scope of reinsurance coverage to purchase each year based on a number of factors. These factors include the evaluation of the risks accepted, consultations with reinsurance intermediates and a review of market conditions, including the availability and pricing of reinsurance. A primary factor in the selection of reinsurers from whom we purchase reinsurance is their financial strength. Our reinsurance arrangements are generally renegotiated annually. We expect a 3.1% increase in spend for our 2017 reinsurance contracts. For the year ended December 31, 2016, we ceded to reinsurers $8.1 million of written premiums, compared to $7.8 million of written premiums for the year ended December 31, 2015. Of the $8.1 million spent on 2016 reinsurance premiums, $0.6 was from new contracts. Without the new contracts, 2016 spend would have been $7.5 million, or a decrease of 3.8%.
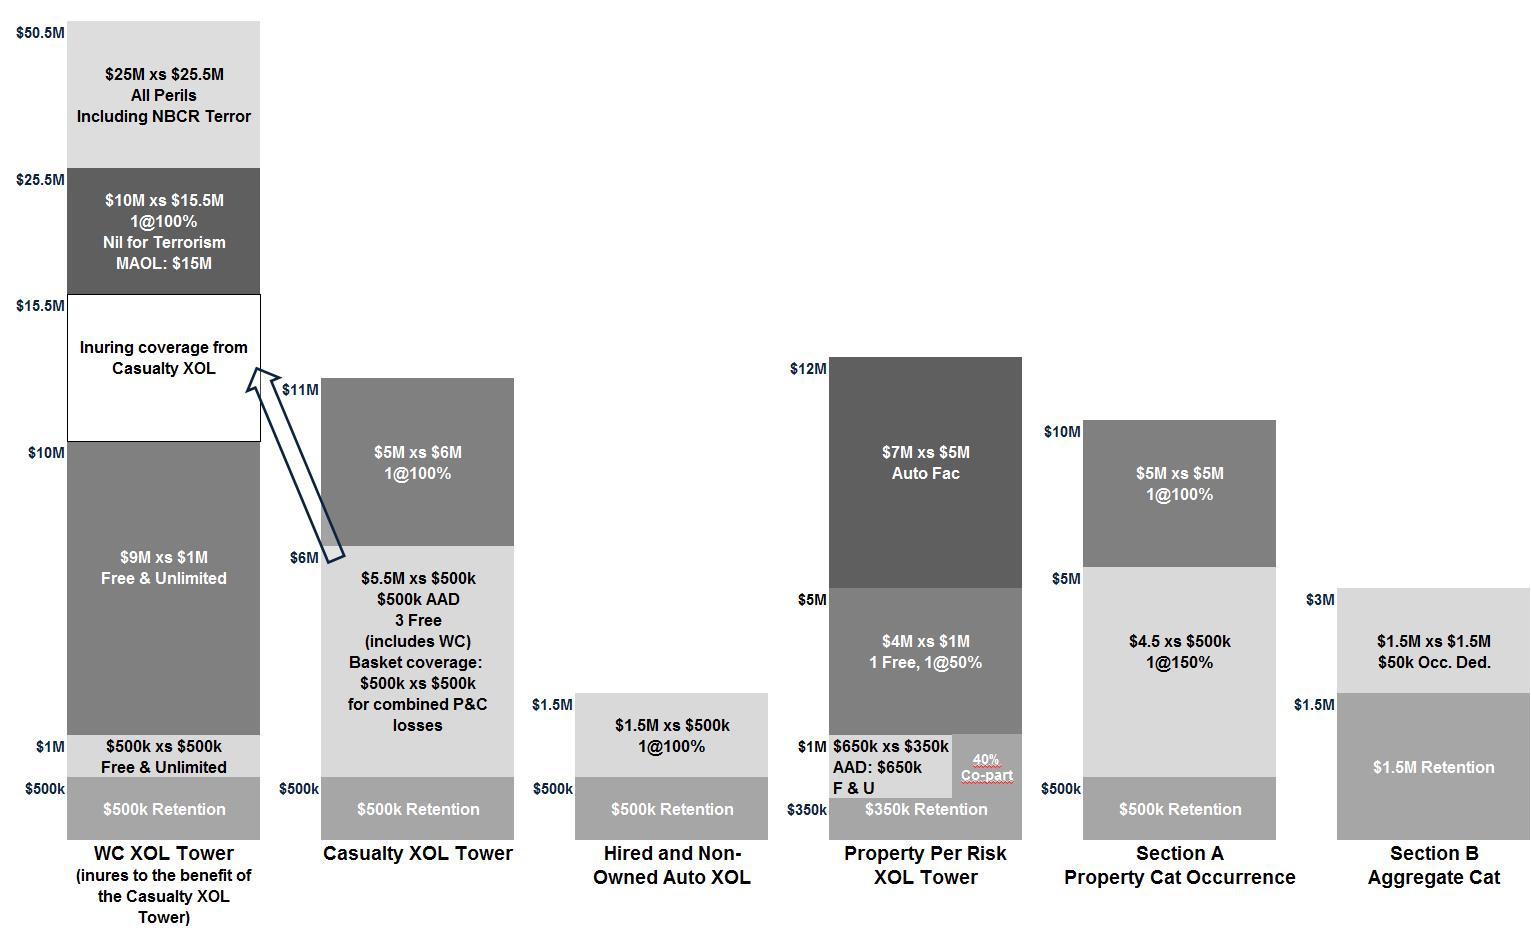
The chart below illustrates the 2017 reinsurance coverage under our excess of loss treaty for individual liability and property risks (with the defined terms listed below the chart):
~ 10 ~
|
|
|
|
|
Term |
|
Meaning |
|
1 @ x% |
|
“1” refers to the number of times that we reinstate the coverage. The number prior to the “%” sign indicates the overall cost to us when reinstating coverage. |
|
|
|
|
|
Aggregate Catastrophe |
|
An aggregate catastrophe treaty is a reinsurance cover designed to help us manage the effects of multiple extreme weather events on our results. |
|
|
|
|
|
Basket Coverage |
|
Excess liability insurance that attaches once retained losses for several lines of coverage (e.g., Workers compensation, Business Owners Liability, or Liquor Liability) reach a certain specified level. If we have one loss occurrence with $500,000 incurred on both a workers compensation claim and a liquor liability claim, this coverage limits our retention to $500,000 and not $500,000 per claim. |
|
|
|
|
|
Casualty |
|
For this chart, this refers to our liquor liability, business owners liability, workers compensation and any umbrella policies. |
|
|
|
|
|
|
|
|
|
Free & Unlimited |
|
This refers to the number and cost of reinstating the reinsurance coverage. With this wording, each separate loss occurrences above the retention will be covered by the treaty. |
|
|
|
|
|
Inures |
|
Our Workers Compensation Reinsurance contracts are first applied to reduce the loss subject to the Casualty XOL contract and are said to inure to the benefit of the Casualty XOL contract. |
|
|
|
|
|
MAOL |
|
This reinsurance sublimit puts a cap on the maximum loss any one life/claimant can contribute to the reinsurance recoverable. |
|
|
|
|
|
Per Risk |
|
Reinsurance in which the reinsurance limit and our loss retention apply “per risk,” rather than per accident, per event, or in the aggregate. |
|
|
|
|
|
Retention |
|
The amount of loss and settlement expense retained by us either per occurrence on casualty losses or per risk on property claims |
|
|
|
|
|
WC |
|
This is short for Workers Compensation. |
|
|
|
|
|
XOL |
|
This is short for Excess of Loss reinsurance coverage. |
|
|
|
|
|
xs |
|
This is short for Excess. For example, our Property per Risk tower has three separate contracts providing coverage. The top layer in that tower provides $7.0 million coverage for each risk with losses in excess of $5.0 million. |
We retain the first $500,000 of workers compensation losses. Losses in excess of the $500,000 are covered under our workers compensation excess of loss program (WC XOL Tower) up to $1.0 million. Losses above the $1.0 million are then covered under the second workers compensation treaty through $10.0 million. Above $10.0 million, losses would fall back to the casualty tower for an additional $5.5 million of coverage per employee. Losses above $15.5 million are covered under a new workers compensation cover that provides $10.0 million in excess of $15.5 million. We purchased a new cover that provideds $25.0 million of coverage in excess of $25.5 million for four direct policies issued by the Company.
Casualty risks (Casualty XOL Tower) (business owners property, liability, liquor liability, umbrella) are covered for $10.5 million in loss above a $500,000 retention for each loss occurrence.
Property per risk excess of loss program (Property Per Risk XOL Tower) provides coverage above our $350,000 retention up to $12.0 million on a treaty basis and facultative for a few risks above that to their full limits.
Property catastrophe reinsurance (Section A Property Cat Occurrence) provides coverage in any one event for $10.0 million of loss in excess of our $500,000 retention.
We also have aggregate catastrophe protection (Section B Aggregate Catastrophe) in the event that catastrophe losses retained by us exceeds $1.5 million in such year. This program allows us to aggregate storms losses where losses exceed $50,000 but fall below the $500,000 occurrence retention.
The insolvency or inability of any reinsurer to meet its obligations to us could have a material adverse effect on our results of operations or financial condition. Our reinsurance providers, the majority of whom are longstanding partners who understand our business, are all carefully selected with the help of our reinsurance broker. We monitor the solvency of reinsurers through regular review of their financial statements and, if available, their A.M. Best ratings. All of our reinsurance partners have at least an “A-” rating from A.M. Best. According to A.M. Best, companies with a rating of “A-” or better “have an excellent ability to meet their ongoing obligations to policyholders.”
~ 11 ~
The following table sets forth the largest amounts of loss and loss expenses recoverable from reinsurers as of December 31, 2016:
|
|
||||||||||
|
|
Losses and Settlement |
|||||||||
|
|
Expense Recoverable |
Percentage of |
||||||||
|
|
On Unpaid Claims |
Total |
A.M. Best |
|||||||
|
Reinsurance Company |
(In thousands) |
Recoverable |
Rating |
|||||||
|
Everest Reinsurance Company |
$ |
3,128 | 25.8% |
A+ |
||||||
|
Partner Reinsurance Company |
2,026 | 16.7% |
A+ |
|||||||
|
Aspen Insurance UK Ltd |
1,973 | 16.3% |
A |
|||||||
|
Hannover Ruckversicherungs |
1,934 | 16.0% |
A+ |
|||||||
|
Toa Reinsurance Company |
1,504 | 12.4% |
A+ |
|||||||
|
Swiss Reinsurance |
1,039 | 8.6% |
A+ |
|||||||
|
Platinum Underwriters |
874 | 7.2% |
A |
|||||||
|
Endurance |
612 | 5.0% |
A |
|||||||
|
Allied World Reinsurance |
588 | 4.9% |
A |
|||||||
|
Lloyd's Syndicate Number 435 |
29 | 0.2% |
A+ |
|||||||
|
All other reinsurers including anticipated subrogation |
(1,592) |
-13.1% |
A- or better |
|||||||
|
Total |
$ |
12,115 | 100.0% | |||||||
Losses and Settlement Expense Reserves
We are required by applicable insurance laws and regulations to maintain reserves for payment of loss and settlement expenses. These reserves are established for both reported claims and for claims incurred but not reported (IBNR), arising from the policies we have issued. The laws and regulations require that provision be made for the ultimate cost of those claims without regard to how long it takes to settle them or the time value of money. The determination of reserves involves actuarial and statistical projections of what we expect to be the cost of the ultimate settlement and administration of such claims. The reserves are set based on facts and circumstances then known, estimates of future trends in claims severity, and other variable factors such as inflation and changing judicial theories of liability.
Estimating the ultimate liability for losses and settlement expense is an inherently uncertain process. Therefore, the reserve for losses and settlement expense does not represent an exact calculation of that liability. Our reserve policy recognizes this uncertainty by maintaining reserves at a level providing for the possibility of adverse development relative to the estimation process. We do not discount our reserves to recognize the time value of money.
When a claim is reported to us, our claims personnel establish a “case reserve” for the estimated amount of the ultimate payment. This estimate reflects an informed judgment based upon general insurance reserving practices and on the experience and knowledge of our claims staff. In estimating the appropriate reserve, our claims staff considers the nature and value of the specific claim, the severity of injury or damage, and the policy provisions relating to the type of loss. Case reserves are adjusted by our claims staff as more information becomes available. It is our policy to resolve each claim as expeditiously as possible.
We maintain IBNR reserves to provide for already incurred claims that have not yet been reported and developments on reported claims. The IBNR reserve is determined by estimating our ultimate net liability for both reported and IBNR claims and then subtracting the case reserves and paid loss and settlement expnse for reported claims.
Each quarter, we compute our estimated ultimate liability using principles and procedures applicable to the lines of business written. However, because the establishment of loss reserves is an inherently uncertain process, we cannot provide assurance that ultimate losses will not exceed the established loss reserves. Adjustments in aggregate reserves, if any, are reflected in the operating results of the period during which such adjustments are made.
~ 12 ~
The following table provides information about open claims, reserves, and paid loss and settlement expense by business line on a direct basis only:
|
|
||||||||||
|
|
As of and for the year ended December 31, 2016 |
|||||||||
|
(In millions, except open claims count) |
Open Claims |
|
Total Reserves1 |
|
Case Reserves |
|
IBNR Reserves |
|
Paid Losses and Settlement Expense |
|
|
Commercial Multi-Peril (non-liability portion) |
147 |
$ 3.84 |
$ 3.95 |
$ (0.11) |
$ 8.33 |
|||||
|
Commercial Multi-Peril (liability portion) |
439 |
22.66 | 12.84 | 9.82 | 7.95 | |||||
|
Workers Compensation |
210 |
8.50 | 4.15 | 4.36 | 3.43 | |||||
|
Other Liability - occurrence |
177 |
17.37 | 6.56 | 10.81 | 5.83 | |||||
|
Grand Total |
973 |
$ 52.37 |
$ 27.49 |
$ 24.88 |
$ 25.54 |
|||||
|
|
||||||||||
| 1 |
Assumed reserves of $0.45 million are excluded from the Total Gross Reserves. Workers Compensation ($0.42 million assumed reserve) and Umbrella Liability ($0.03 million assumed reserve) are the only lines of business that have assumed reserves. |
|||||||||
The following table provides a reconciliation of beginning and ending unpaid losses and settlement expense reserve balances for the years ended December 31, 2016 and 2015, prepared in accordance with GAAP.
|
(In thousands) |
2016 |
2015 |
||||
|
Unpaid losses and settlement expense - beginning of the period: |
||||||
|
Gross |
$ |
61,056 |
$ |
64,617 | ||
|
Less: Ceded |
19,158 | 25,822 | ||||
|
Net |
41,898 | 38,795 | ||||
|
Increase (decrease) in incurred losses and settlement expense: |
||||||
|
Current year |
25,620 | 24,293 | ||||
|
Prior years |
(1,275) | (493) | ||||
|
Total incurred |
24,345 | 23,800 | ||||
|
Deduct: Loss and settlement expense payments for claims incurred: |
||||||
|
Current year |
7,649 | 6,466 | ||||
|
Prior years |
17,892 | 14,231 | ||||
|
Total paid |
25,541 | 20,697 | ||||
|
Net unpaid losses and settlement expense - end of the period |
40,702 | 41,898 | ||||
|
Plus: Reinsurance recoverable on unpaid losses |
12,115 | 19,158 | ||||
|
Gross unpaid losses and settlement expense - end of the period |
$ |
52,817 |
$ |
61,056 | ||
The estimation process for determining the liability for unpaid losses and settlement expense inherently results in adjustments each year for claims incurred (but not paid) in preceding years. Negative amounts reported for claims incurred related to prior years are a result of claims being settled for amounts less than originally estimated (favorable development). Positive amounts reported for claims incurred related to prior years are a result of claims being settled for amounts greater than originally estimated (unfavorable or adverse development).
Reconciliation of Reserve for Loss and Settlement Expenses
The following table shows the development of our reserves for unpaid loss and settlement expense from 2007 through 2016 on a GAAP basis. The top line of the table shows the liabilities at the balance sheet date, including losses incurred but not yet reported. The upper portion of the table shows the cumulative amounts subsequently paid as of successive years with respect to the liability. The lower portion of the table shows the reestimated amount of the previously recorded liability based on experience as of the end of each succeeding year. The estimates change as more information becomes known about the frequency and severity of claims for individual years. The redundancy (deficiency) exists when the reestimated liability for each reporting period is less (greater) than the prior liability estimate. The “cumulative redundancy (deficiency)” depicted in the table, for any particular calendar year, represents the aggregate change in the initial estimates over all subsequent calendar years.
Gross deficiencies and redundancies may be significantly more or less than net deficiencies and redundancies due to the nature and extent of applicable reinsurance.
~ 13 ~
As noted in the table below, since 2007 the Company has consistently selected initial ultimate loss picks that have proven to be redundant over time.
|
|
Year Ended December 31, |
|||||||||||||||||||
|
(In thousands) |
2007 |
2008 |
2009 |
2010 |
2011 |
2012 |
2013 |
2014 |
2015 |
2016 |
||||||||||
|
Liability for unpaid loss and settlement expense, net of reinsurance recoverable |
$ |
33,393 |
$ |
40,040 |
$ |
39,932 |
$ |
37,708 |
$ |
36,204 |
$ |
35,976 |
$ |
36,340 |
$ |
38,795 |
$ |
41,898 |
$ |
40,702 |
|
Cumulative amount of liability paid through: |
|
|
|
|
|
|
|
|
|
|
|
|
|
|
|
|
|
|
|
|
|
One year later |
10,115 | 10,740 | 11,878 | 12,926 | 12,194 | 12,226 | 12,442 | 14,156 | 17,892 | |||||||||||
|
Two years later |
16,146 | 19,865 | 21,240 | 22,003 | 21,128 | 20,870 | 22,678 | 27,092 |
— |
|||||||||||
|
Three years later |
22,419 | 25,914 | 27,712 | 28,749 | 27,235 | 27,520 | 30,071 |
— |
— |
|||||||||||
|
Four years later |
25,498 | 30,217 | 31,840 | 32,561 | 31,167 | 32,086 |
— |
— |
— |
|||||||||||
|
Five years later |
27,696 | 32,210 | 34,044 | 34,429 | 33,183 |
— |
— |
— |
— |
|||||||||||
|
Six years later |
28,720 | 33,544 | 35,179 | 35,563 |
— |
— |
— |
— |
— |
|||||||||||
|
Seven years later |
29,184 | 34,352 | 35,923 |
— |
— |
— |
— |
— |
— |
|||||||||||
|
Eight years later |
29,460 | 34,888 |
— |
— |
— |
— |
— |
— |
— |
|||||||||||
|
Nine years later |
29,791 |
— |
— |
— |
— |
— |
— |
— |
— |
|||||||||||
|
Liability estimated after: |
||||||||||||||||||||
|
One year later |
33,441 | 37,860 | 38,222 | 36,699 | 35,553 | 35,151 | 36,698 | 38,305 | 40,623 | |||||||||||
|
Two years later |
32,242 | 37,709 | 37,212 | 36,840 | 35,763 | 35,545 | 36,210 | 39,813 |
— |
|||||||||||
|
Three years later |
32,156 | 36,205 | 37,239 | 37,170 | 36,083 | 35,418 | 36,914 |
— |
— |
|||||||||||
|
Four years later |
30,950 | 35,857 | 37,099 | 37,211 | 35,544 | 36,215 |
— |
— |
— |
|||||||||||
|
Five years later |
30,654 | 35,349 | 36,689 | 36,627 | 35,377 |
— |
— |
— |
— |
|||||||||||
|
Six years later |
30,194 | 35,111 | 36,445 | 36,645 |
— |
— |
— |
— |
— |
|||||||||||
|
Seven years later |
30,059 | 35,201 | 36,632 |
— |
— |
— |
— |
— |
— |
|||||||||||
|
Eight years later |
30,120 | 35,309 |
— |
— |
— |
— |
— |
— |
— |
|||||||||||
|
Nine years later |
30,118 |
— |
— |
— |
— |
— |
— |
— |
— |
|||||||||||
|
Cumulative total redundancy (deficiency) |
|
|
|
|
|
|
|
|
|
|
|
|
|
|
|
|
|
|
|
|
|
Gross liability - end of year |
50,207 | 59,039 | 58,295 | 56,012 | 51,432 | 54,623 | 57,334 | 64,618 | 61,054 | 52,817 | ||||||||||
|
Reinsurance recoverable |
16,814 | 18,999 | 18,363 | 18,304 | 15,228 | 18,647 | 20,994 | 25,823 | 19,156 | 12,115 | ||||||||||
|
Net liability - end of year |
33,393 | 40,040 | 39,932 | 37,708 | 36,204 | 35,976 | 36,340 | 38,795 | 41,898 | 40,702 | ||||||||||
|
Gross reestimated liability - latest |
42,847 | 49,792 | 54,228 | 57,315 | 54,278 | 58,018 | 59,072 | 67,392 | 60,573 | |||||||||||
|
Reestimated reinsurance recoverables - latest |
|
12,729 |
|
14,483 |
|
17,596 |
|
20,670 |
|
18,901 |
|
21,803 |
|
22,158 |
|
27,579 |
|
19,950 |
|
|
|
Net reestimated liability - latest |
30,118 | 35,309 | 36,632 | 36,645 | 35,377 | 36,215 | 36,914 | 39,813 | 40,623 | |||||||||||
|
Gross cumulative redundancy (deficiency) |
3,275 | 4,731 | 3,300 | 1,063 | 827 | (239) | (574) | (1,018) | 1,275 | |||||||||||
Investments
Our investments in debt and equity securities are classified as available for sale and are carried at fair value with unrealized gains and losses reflected as a component of equity net of taxes. The goal of our investment activities is to complement and support our overall mission. As such, the investment portfolio’s goal is to maximize after-tax investment income and price appreciation while maintaining the portfolio’s target risk profile.
An important component of our operating results has been the return on invested assets. Our investment objectives are (i) to preserve and grow capital and surplus, in order to improve our competitive position and allow for expansion of insurance operations; (ii) to ensure sufficient cash flow and liquidity to fund expected liability payments and otherwise support our underwriting strategy; (iii) to provide a reasonable and stable level of income; and (iv) to maintain a portfolio which will assist in attaining the highest possible rating from A.M. Best. See Item 7. Management’s Discussion and Analysis of Financial Condition and Results of Operations —Quantitative and Qualitative Information about Market Risk.
In addition to any investments prohibited by the insurance laws and regulations of Illinois and any other applicable states, our investment policy prohibits the following investments and investing activities:
|
· |
short sales; |
|
· |
purchase of securities on margin; |
|
· |
hedge funds; |
~ 14 ~
|
· |
derivatives; |
|
· |
investment in commodities; |
|
· |
mortgage derivatives such as inverse floaters, interest only strips and principal only strips; |
|
· |
options, puts and futures contracts; |
|
· |
private placements; |
|
· |
non-U.S. dollar denominated securities; |
|
· |
any security that would not be in compliance with the regulations of the Illinois Department of Insurance. |
Our board of directors developed our investment policy and reviews the policy periodically. Exceptions to prohibitions discussed above are allowed with express written authority of the board of directors investment committee, but under no circumstance may such exception exceed 5% of our invested assets.
Our investment portfolio is managed by an independent third party firm.
The following table sets forth information concerning our investments in available for sale securities.
|
|
2016 |
2015 |
|||||||||
|
(In thousands) |
Cost or Amortized Cost |
|
Estimated Fair Value |
|
Cost or Amortized Cost |
|
Estimated Fair Value |
||||
|
Fixed maturity securities: |
|||||||||||
|
U.S. treasury |
$ |
1,244 |
$ |
1,241 |
$ |
1,243 |
$ |
1,233 | |||
|
MBS/ABS/CMBS |
19,751 | 19,677 | 17,949 | 18,011 | |||||||
|
Corporate |
27,594 | 28,345 | 29,537 | 29,595 | |||||||
|
Municipal |
14,340 | 14,871 | 15,266 | 16,356 | |||||||
|
Total fixed maturity securities |
62,929 | 64,134 | 63,995 | 65,195 | |||||||
|
Equity securities: |
|||||||||||
|
Common Equity/ETF securities1 |
6,312 | 6,983 | 9,282 | 8,885 | |||||||
|
Preferred Stocks |
2,925 | 2,798 |
— |
— |
|||||||
|
Total equity securities |
9,237 | 9,781 | 9,282 | 8,885 | |||||||
|
Total AFS securities |
$ |
72,166 |
$ |
73,915 |
$ |
73,277 |
$ |
74,080 | |||
|
1 Equity securities consist of exchange traded funds (ETF) |
|||||||||||
The following table summarizes the distribution of our portfolio of fixed maturity investments as a percentage of total estimated fair value based on credit ratings assigned by Standard & Poor’s Corporation (S&P):
|
|
2016 |
2015 |
|||||||||||
|
Rating1 |
|
Estimate Fair Value |
|
Percent of Total2 |
|
Estimate Fair Value |
|
Percent of Total2 |
|||||
|
AAA |
$ |
9,235 | 14.4% |
$ |
6,585 | 10.1% | |||||||
|
AA |
24,820 | 38.7% | 27,447 | 42.1% | |||||||||
|
A |
17,893 | 27.9% | 20,471 | 31.4% | |||||||||
|
BBB |
10,069 | 15.7% | 10,692 | 16.4% | |||||||||
|
BB |
2,116 | 3.3% |
— |
0.0% | |||||||||
|
Total |
$ |
64,134 | 100% |
$ |
65,195 | 100.0% | |||||||
|
|
|||||||||||||
|
1The ratings set forth in this table are based on the ratings assigned by S&P. If S&P’s ratings were unavailable, the equivalent ratings supplied by Moody’s Investor Service, Fitch Investors Service, Inc. or the NAIC were used where available. |
|||||||||||||
|
|
|||||||||||||
|
2Represents percent of fair value for classification as a percent of the total portfolio. |
|||||||||||||
~ 15 ~
The table below sets forth the maturity profile of our debt securities December 31, 2016. Expected maturities could differ from contractual maturities because borrowers may have the right to call or prepay obligations, with or without call or prepayment penalties.
|
(In thousands) |
Amortized Cost |
Estimated Fair Value1 |
|||
|
Less than one year |
$ |
2,518 |
$ 2,526 |
||
|
One through five years |
15,961 | 16,292 | |||
|
Five through ten years |
15,996 | 16,753 | |||
|
Greater than ten years |
8,703 | 8,886 | |||
|
MBS/ABS |
19,751 | 19,677 | |||
|
Total debt securities |
$ |
62,929 |
$ 64,134 |
||
|
|
|||||
|
1Debt securities are carried at fair value in our financials statements |
|||||
At December 31, 2016, the average maturity of our fixed maturity investment portfolio was 6.71 years and the average duration was 4.87 years. As a result, the fair value of our investments may fluctuate significantly in response to changes in interest rates. In addition, we may experience investment losses to the extent our liquidity needs require the disposition of fixed maturity securities in unfavorable interest rate environments.
We use quoted values and other data provided by independent pricing services as inputs in our process for determining fair values of our investments. The pricing services cover substantially all of the securities in our portfolio for which publicly quoted values are not available. The pricing services’ evaluations represent an exit price, a good faith opinion as to what a buyer in the marketplace would pay for a security in a current sale. The pricing is based on observable inputs either directly or indirectly, such as quoted prices in markets that are active, quoted prices for similar securities at the measurement date, or other inputs that are observable.
Our independent third party investment manager provides us with pricing information that they obtain from independent pricing services, to determine the fair value of our fixed maturity securities. After performing a detailed review of the information obtained from the pricing service, limited adjustments may be made by the manager to the values provided.
Our average cash and invested assets, net investment income and return on average cash and invested assets for the years ended December 31, 2016 and 2015 were as follows:
|
(In thousands) |
2016 |
2015 |
||||||
|
Average cash and invested assets |
$ |
78,660 |
$ |
74,869 | ||||
|
Net investment income |
1,968 | 1,333 | ||||||
|
Return on average cash and invested assets |
2.5% | 1.8% | ||||||
A.M. Best Rating
A.M. Best Company, Inc. (“A.M. Best”) rates insurance companies based on factors of concern to policyholders. A.M. Best currently assigns a “B++” (Good) rating to ICC. This rating is the fifth highest out of 15 rating classifications. The latest rating evaluation by A.M. Best occurred on February 23, 2016. According to the A.M. Best guidelines, companies rated “B++” are considered by A.M. Best to have “a good ability to meet their ongoing insurance obligations.” The rating evaluates the claims paying ability of a company, and is not a recommendation on the merits of an investment in our common stock.
In evaluating a company’s financial and operating performance, A.M. Best reviews:
|
· |
the company’s profitability, leverage and liquidity; |
|
· |
its book of business; |
|
· |
the adequacy and soundness of its reinsurance; |
|
· |
the quality and estimated fair value of its assets; |
|
· |
the adequacy of its reserves and surplus; |
|
· |
its capital structure; |
|
· |
the experience and competence of its management; and |
|
· |
its marketing presence. |
~ 16 ~
In its ratings report on ICC, A.M. Best stated that ICC’s rating reflected ICC’s improved operating results and risk-adjusted capitalization over the past five years, the ability of current management to continue to improve rates and grow premium while maintaining a slow growing policy count, ICC’s combined ratios trending in a positive direction with results under 100% for 2014, 2015, and 2016, traction gained with respect to expense initiatives, strength in loss reserves with redundancies on both an accident and calendar year basis and strong underwriting expertise and a long-standing position within the food and beverage industry in the Midwest. These factors were somewhat offset by ICC’s overall weak operating return measures. Although underwriting results are improving, the past five years have fluctuated. A.M. Best has affirmed ICC’s outlook as positive.
Competition
Given our exclusive focus on providing insurance products and services for the food and beverage industry, the market conditions for our business and, accordingly, our competition, varies geographically based upon the states in which we operate and also by the segment of the food and beverage industry (e.g., bars versus fine dining). In the most competitive states in which we operate (Illinois, Indiana and Wisconsin), our primary competitors are insurance companies with products targeting the food and beverage industry, such as Society Mutual Insurance Company in all three states, as well as Badger Mutual Insurance Company, Wilson Mutual Insurance Company and West Bend Mutual Insurance Company in Wisconsin. In other jurisdictions, such as Iowa and Minnesota, we compete with both the carriers with products identified above (such as Badger Mutual Insurance Company, Wilson Mutual Insurance Company and Founders Insurance Company) and excess and surplus line insurance companies (such as Scottsdale Insurance Company and Lloyd’s of London). In other jurisdictions, like Missouri, our primary competitors are larger regional and national insurance companies without a focus on the food and beverage industry (such as Allied Insurance Company, Auto-Owners Insurance Company and Travelers Insurance Company) and excess and surplus line insurance companies (such as EverGuard Insurance Services, Inc. and Lloyd’s of London). When evaluating the franchise and fine dining segment of the food and beverage industry, we compete with national insurance carriers, such as Allied Insurance Company, Travelers Insurance Company and The Hartford Insurance Company.
Despite significant competition, we believe we continue to maintain strong market share.
|
|
Number of Eating and Drinking Places in 2015 |
Number of Locations Insured by ICC at December 31, 2016 |
Approximate Market Share (%) |
||
|
Illinois |
27,189 |
2,736 |
10.1% |
||
|
Iowa |
6,129 |
1,296 |
21.1% |
||
|
Indiana |
11,620 |
593 |
5.1% |
||
|
Michigan1 |
16,110 |
N/A |
N/A |
||
|
Minnesota |
9,709 |
922 |
9.5% |
||
|
Missouri |
10,903 |
1,030 |
9.4% |
||
|
Ohio2 |
22,023 |
31 |
0.1% |
||
|
Wisconsin |
12,170 |
262 |
2.2% |
||
|
Total |
115,853 |
6,870 |
5.9% |
||
|
Total (w/o MI) |
99,743 |
6,870 |
6.9% |
||
|
|
|||||
|
Source: National Restaurant Association; ICC |
|||||
|
|
|||||
|
1We expect to begin writing premium in Michigan as early as 2018 |
|||||
|
|
|||||
|
2We began accepting business in Ohio in August 2016 |
|||||
Employees
As of December 31, 2016, we had 91 full-time equivalent employees. None of these employees are covered by a collective bargaining agreement, and we believe that our employee relations are good.
~ 17 ~
Regulation
General
We are subject to extensive regulation, particularly at the state level. The method, extent and substance of such regulation varies by state, but generally has its source in statutes and regulations that establish standards and requirements for conducting the business of insurance and that delegate regulatory authority to state insurance regulatory agencies. In general, such regulation is intended for the protection of those who purchase or use insurance products, not the companies that write the policies. These laws and regulations have a significant impact on our business and relate to a wide variety of matters including accounting methods, agent and company licensure, claims procedures, corporate governance, examinations, investing practices, policy forms, pricing, trade practices, reserve adequacy and underwriting standards.
State insurance laws and regulations require ICC to file financial statements with state insurance departments everywhere it does business, and the operations of ICC and its accounts are subject to examination by those departments at any time. ICC prepares statutory financial statements in accordance with accounting practices and procedures prescribed or permitted by these departments.
Premium rate regulation varies greatly among jurisdictions and lines of insurance. In most states in which our subsidiaries write insurance, premium rates for the various lines of insurance are subject to either prior approval or limited review upon implementation. States require rates for property-casualty insurance that are adequate, not excessive, and not unfairly discriminatory.
Many jurisdictions have laws and regulations that limit an insurer’s ability to withdraw from a particular market. For example, states may limit an insurer’s ability to cancel or non-renew policies. Laws and regulations that limit cancellation and non-renewal may restrict our ability to exit unprofitable marketplaces in a timely manner.
Examinations
Examinations are conducted by the Illinois Department of Insurance every three to five years. The Illinois Department of Insurance’s last examination of ICC was in February 2012 covering the period from 2007-2011. The examination did not result in any adjustments to our financial position. In addition, there were no substantive qualitative matters indicated in the examination report that had a material adverse impact on our operations.
NAIC Risk-Based Capital Requirements
In addition to state-imposed insurance laws and regulations, the NAIC has adopted risk-based capital requirements that require insurance companies to calculate and report information under a risk-based formula. These risk-based capital requirements attempt to measure statutory capital and surplus needs based on the risks in a company’s mix of products and investment portfolio. Under the formula, a company first determines its “authorized control level” risk-based capital. This authorized control level takes into account (i) the risk with respect to the insurer’s assets; (ii) the risk of adverse insurance experience with respect to the insurer’s liabilities and obligations, (iii) the interest rate risk with respect to the insurer’s business; and (iv) all other business risks and such other relevant risks as are set forth in the risk-based capital instructions. A company’s “total adjusted capital” is the sum of statutory capital and surplus and such other items as the risk-based capital instructions may provide. The formula is designed to allow state insurance regulators to identify weakly capitalized companies.
The requirements provide for four different levels of regulatory attention. The “company action level” is triggered if a company’s total adjusted capital is less than 2.0 times its authorized control level but greater than or equal to 1.5 times its authorized control level. At the company action level, the company must submit a comprehensive plan to the regulatory authority that discusses proposed corrective actions to improve the capital position. The “regulatory action level” is triggered if a company’s total adjusted capital is less than 1.5 times but greater than or equal to 1.0 times its authorized control level. At the regulatory action level, the regulatory authority will perform a special examination of the company and issue an order specifying corrective actions that must be followed. The “authorized control level” is triggered if a company’s total adjusted capital is less than 1.0 times but greater than or equal to 0.7 times its authorized control level; at this level the regulatory authority may take action it deems necessary, including placing the company under regulatory control. The “mandatory control level” is triggered if a company’s total adjusted capital is less than 0.7 times its authorized control level; at this level the regulatory authority is mandated to place the company under its control. The capital levels of ICC have never triggered any of these regulatory capital levels. We cannot provide assurance, however, that the capital requirements applicable to ICC will not increase in the future.
~ 18 ~
NAIC Ratios
The NAIC also has developed a set of 13 financial ratios referred to as the Insurance Regulatory Information System (IRIS). On the basis of statutory financial statements filed with state insurance regulators, the NAIC annually calculates these IRIS ratios to assist state insurance regulators in monitoring the financial condition of insurance companies. The NAIC has established an acceptable range for each of the IRIS financial ratios. If four or more of its IRIS ratios fall outside the range deemed acceptable by the NAIC, an insurance company may receive inquiries from individual state insurance departments. During each of the years ended December 31, 2016, 2015 and 2014, ICC did not receive inquiries from regulators on results for any of the IRIS tests.
Enterprise Risk Assessment
In 2012, the NAIC adopted the NAIC Amendments. The NAIC Amendments, when adopted by the various states, are designed to respond to perceived gaps in the regulation of insurance holding company systems in the United States. One of the major changes is a requirement that an insurance holding company system’s ultimate controlling person submit annually to its lead state insurance regulator an “enterprise risk report” that identifies activities, circumstances or events involving one or more affiliates of an insurer that, if not remedied properly, are likely to have a material adverse effect upon the financial condition or liquidity of the insurer or its insurance holding company system as a whole. Other changes include requiring a controlling person to submit prior notice to its domiciliary insurance regulator of its divestiture of control, having detailed minimum requirements for cost sharing and management agreements between an insurer and its affiliates and expanding of the agreements between an insurer and its affiliates to be filed with its domiciliary insurance regulator. In addition, in 2012 the NAIC adopted the Own Risk Solvency Assessment (ORSA) Model Act. The ORSA Model Act, when adopted by the various states, will require an insurance holding company system’s chief risk officer to submit at least annually to its lead state insurance regulator a confidential internal assessment appropriate to the nature, scale and complexity of an insurer, conducted by that insurer of the material and relevant risks identified by the insurer associated with an insurer’s current business plan and the sufficiency of capital resources to support those risks. Although ICC is exempt from ORSA because of its size, we intend to incorporate those elements of ORSA that we believe constitute “best practices” into its annual internal enterprise risk assessment.
Market Conduct Regulation
State insurance laws and regulations include numerous provisions governing trade practices and the marketplace activities of insurers, including provisions governing the form and content of disclosure to consumers, illustrations, advertising, sales practices and complaint handling. State regulatory authorities generally enforce these provisions through periodic market conduct examinations.
Property and Casualty Regulation
Our property and casualty operations are subject to rate and policy form approval, as well as laws and regulations covering a range of trade and claim settlement practices. State insurance regulatory authorities have broad discretion in approving an insurer’s proposed rates. The extent to which a state restricts underwriting and pricing of a line of business may adversely affect an insurer’s ability to operate that business profitably in that state on a consistent basis.
State insurance laws and regulations require us to participate in mandatory property-liability “shared market,” “pooling” or similar arrangements that provide certain types of insurance coverage to individuals or others who otherwise are unable to purchase coverage voluntarily provided by private insurers. Shared market mechanisms include assigned risk plans and fair access to insurance requirement or “FAIR” plans. In addition, some states require insurers to participate in reinsurance pools for claims that exceed specified amounts. Our participation in these mandatory shared market or pooling mechanisms generally is related to the amount of our direct writings for the type of coverage written by the specific arrangement in the applicable state. We cannot predict the financial impact of our participation in these arrangements. See Item 7. Management’s Discussion and Analysis of Financial Condition and Results of Operations.
Guaranty Fund Laws
All states have guaranty fund laws under which insurers doing business in the state can be assessed to fund policyholder liabilities of insolvent insurance companies. Under these laws, an insurer is subject to assessment depending upon its market share in the state of a given line of business. For the years ended December 31, 2016 and 2015, we recovered $49,000 and incurred $77,000, respectively, in assessments pursuant to state insurance guaranty association laws. We establish reserves relating to insurance companies that are subject to insolvency proceedings when we are notified of assessments by the guaranty associations. We cannot predict the amount and timing of any future assessments on ICC under these laws. See Item 7. Management’s Discussion and Analysis of Financial Condition and Results of Operations.
~ 19 ~
Federal Regulation
The U.S. federal government generally has not directly regulated the insurance industry except for certain areas of the market, such as insurance for flood, nuclear and terrorism risks. However, the federal government has undertaken initiatives or considered legislation in several areas that may impact the insurance industry, including tort reform, corporate governance and the taxation of reinsurance companies. The Dodd-Frank Act established the Federal Insurance Office which is authorized to study, monitor and report to Congress on the insurance industry and to recommend that the Financial Stability Oversight Council designate an insurer as an entity posing risks to the U.S. financial stability in the event of the insurer’s material financial distress or failure. In December 2013, the Federal Insurance Office issued a report on alternatives to modernize and improve the system of insurance regulation in the United States, including by increasing national uniformity through either a federal charter or effective action by the states. Changes to federal legislation and administrative policies in several areas, including changes in federal taxation, can also significantly impact the insurance industry and us.
Sarbanes-Oxley Act of 2002
Enacted in 2002, the stated goals of the Sarbanes-Oxley Act of 2002, or SOX, are to increase corporate responsibility, to provide for enhanced penalties for accounting and auditing improprieties at publicly traded companies and to protect investors by improving the accuracy and reliability of corporate disclosures pursuant to the securities laws. We became subject to most of the provisions of the SOX immediately after completion of the mutual-to-stock conversion.
The SOX includes very specific disclosure requirements and corporate governance rules and requires the SEC and securities exchanges to adopt extensive additional disclosure, corporate governance and other related regulations.
Terrorism Risk Insurance Act of 2002
In January 2015, Congress passed the Terrorism Risk Insurance Program Reauthorization Act of 2015, which amended and extended the Terrorism Insurance Program through December 31, 2020. Under this law, coverage provided by an insurer for losses caused by certified acts of terrorism is partially reimbursed by the United States under a formula under which the government pays 85% of covered terrorism losses exceeding a prescribed deductible. Under the new law, the government’s percentage of compensation for losses will be reduced during each program year by 1% until it equals 80%. The act limits an insurer’s exposure to certified terrorist acts (as defined by the act) to the prescribed deductible amount. The insurance industry’s aggregate deductible (currently $27.5 billion) will increase by $2 billion per calendar year until it equals $37.5 billion. Each insurer’s deductible is capped at 20% of the insurer’s direct earned premium for commercial property and casualty policies. Coverage under the act must be offered to all property, casualty and surety insureds.
The new law also amended the Gramm-Leach-Bliley Act to establish the National Association of Registered Agents and Brokers as a nonprofit corporation with the purpose of prescribing licensing and producer qualification requirements and conditions on a multi-state basis.
Privacy
As mandated by the Gramm-Leach-Bliley Act, states continue to promulgate and refine laws and regulations that require financial institutions, including insurance companies, to take steps to protect the privacy of certain consumer and customer information relating to products or services primarily for personal, family or household purposes. A recent NAIC initiative that affected the insurance industry was the adoption in 2000 of the Privacy of Consumer Financial and Health Information Model Regulation, which assisted states in promulgating regulations to comply with the Gramm-Leach-Bliley Act. In 2002, to further facilitate the implementation of the Gramm-Leach-Bliley Act, the NAIC adopted the Standards for Safeguarding Customer Information Model Regulation. Several states have now adopted similar provisions regarding the safeguarding of customer information. We have implemented procedures to comply with the Gramm-Leach-Bliley Act’s related privacy requirements.
OFAC
The Treasury Department’s Office of Foreign Asset Control (OFAC) maintains a list of “Specifically Designated Nationals and Blocked Persons” (the SDN List). The SDN List identifies persons and entities that the government believes are associated with terrorists, rogue nations or drug traffickers. OFAC’s regulations prohibit insurers, among others, from doing business with persons or entities on the SDN List. If the insurer finds and confirms a match, the insurer must take steps to block or reject the transaction, notify the affected person and file a report with OFAC.
~ 20 ~
JOBS Act
We are an “emerging growth company,” as defined in the Jumpstart Our Business Startups Act of 2012 (the “JOBS Act”), and we may take advantage of certain exemptions from various reporting requirements that are applicable to other public companies that are not emerging growth companies, such as reduced public company reporting, accounting and corporate governance requirements. We currently avail ourselves of the reduced disclosure obligations regarding executive compensation.
Section 107 of the JOBS Act also provides that an “emerging growth company” can take advantage of the extended transition period provided in Section 7(a)(2)(B) of the Securities Act for complying with new or revised accounting standards. In other words, an “emerging growth company” can delay the adoption of certain accounting standards until those standards would otherwise apply to private companies. We have taken advantage of the extended transition period provided by Section 107 of the JOBS Act. We decided to comply with the effective dates for financial accounting standards applicable to emerging growth companies at a later date in compliance with the requirements in Sections 107(b)(2) and (3) of the JOBS Act. Such decision is irrevocable.
We will remain an “emerging growth company” for up to five years following our IPO, or until the earliest of (i) the last day of the first fiscal year in which our annual gross revenue exceeds $1 billion, (ii) the date that we become a “large accelerated filer” as defined in Rule 12b-2 under the Securities Exchange Act of 1934, as amended (the “Exchange Act”), which would occur if the market value of our common stock that is held by non-affiliates exceeds $700 million as of the last business day of our most recently completed second fiscal quarter, or (iii) the date on which we have issued more than $1 billion in non-convertible debt during the preceding three year period.
In addition, as an emerging growth company, we are exempt from Section 14A (a) and (b) of the Securities Exchange Act of 1934, which require shareholder approval of executive compensation and golden parachutes.
Dividends
Illinois law sets the maximum amount of dividends that may be paid by ICC during any twelve-month period after notice to, but without prior approval of, the Illinois Department of Insurance. This amount cannot exceed the greater of 10% of the insurance company’s surplus as regards policyholders as reported on the most recent annual statement filed with the Illinois Department of Insurance, or the insurance company’s statutory net income for the period covered by the annual statement as reported on such statement. As of December 31, 2016, the amount available for payment of dividends by ICC in 2017 without the prior approval of the Illinois Department of Insurance is approximately $3.4 million. “Extraordinary dividends” in excess of the foregoing limitations may only be paid with prior notice to, and approval of, the Illinois Department of Insurance. See Item 7. Management Discussion and Analysis – Liquidity and Capital Resources.
Holding Company Laws
Most states have enacted legislation that regulates insurance holding company systems. Each insurance company in a holding company system is required to register with the insurance supervisory agency of its state of domicile and furnish certain information. This includes information concerning the operations of companies within the holding company group that may materially affect the operations, management or financial condition of the insurers within the group. Pursuant to these laws, the Illinois Department of Insurance requires disclosure of material transactions involving ICC and its affiliates, and requires prior notice and/or approval of certain transactions, such as “extraordinary dividends” distributed by ICC. Under these laws, the Illinois Department of Insurance also has the right to examine us at any time.
All transactions within our consolidated group affecting ICC must be fair and equitable. Notice of certain material transactions between ICC and any person or entity in our holding company system will be required to be given to the Illinois Department of Insurance. Certain transactions cannot be completed without the prior approval of the Illinois Department of Insurance.
Approval of the state insurance commissioner is required prior to any transaction affecting the control of an insurer domiciled in that state. In Illinois, the acquisition of 10% or more of the outstanding voting securities of an insurer or its holding company is presumed to be a change in control. Illinois law also prohibits any person or entity from (i) making a tender offer for, or a request or invitation for tenders of, or seeking to acquire or acquiring any voting security of a Illinois insurer if, after the acquisition, the person or entity would be in control of the insurer, or (ii) effecting or attempting to effect an acquisition of control of or merger with a Illinois insurer, unless the offer, request, invitation, acquisition, effectuation or attempt has received the prior approval of the Illinois Department of Insurance.
~ 21 ~
In addition to all other information contained in this Annual Report on Form 10-K, a potential investor should carefully consider the following risk factors in deciding whether to purchase our common stock.
Risks Related to Our Business
A reduction in our A.M. Best rating could affect our ability to write new business or renew our existing business.
Ratings assigned by A.M. Best are an important factor influencing the competitive position of insurance companies. A.M. Best ratings, which are reviewed at least annually, represent independent opinions of financial strength and ability to meet obligations to policyholders and are not directed toward the protection of investors. Therefore, our A.M. Best rating should not be relied upon as a basis for an investment decision to purchase our common stock.
ICC holds a financial strength rating of “B++” (Good) by A.M. Best, the fifth highest rating out of 15 rating classifications. Our most recent evaluation by A.M. Best occurred on March 28, 2017, when A.M. Best affirmed its outlook as positive for ICC’s issuer credit rating, and affirmed its financial strength rating of “B++” and issuer credit rating of “bbb” (Good). Financial strength ratings are used by producers and customers as a means of assessing the financial strength and quality of insurers. Issuer credit ratings is an opinion by A.M. Best of an entity’s ability to meet its ongoing financial obligations. If our financial position deteriorates, we may not maintain our favorable financial strength and issuer credit ratings from A.M. Best. A downgrade of our rating could severely limit or prevent us from writing desirable business or from renewing our existing business. In addition, a downgrade could negatively affect our ability to implement our strategy. See Item 1. Business — A.M. Best Rating.
Our food and beverage customers have been the target of claims and lawsuits. Proceedings of this nature, if successful, could result in our payment of substantial costs and damages.
Occasionally, patrons of our food and beverage industry insured customers file complaints or lawsuits against our insureds alleging a variety of claims arising in the ordinary course of their business, including personal injury claims, contract claims and claims alleging violations of federal and state laws. In addition, certain of our insured customers who serve alcohol are subject to state “dram shop” or similar laws that generally allow a person to sue our customer if that person was injured by a legally intoxicated person who was wrongfully served alcoholic beverages by our customer. A number of these lawsuits in the food and beverage industry have resulted in the payment of substantial damages by us on behalf of our insureds.
Additionally, states have, from time to time, explored lowering the blood alcohol content levels for criminal statutes related to driving under the influence or similar laws, removing or increasing caps for liability with respect to injuries by a legally intoxicated person, or preventing or limiting rate changes by insurance companies.
Regardless of whether any claims against our customers are valid or whether they are liable, claims may be expensive to defend and may result in significant liabilities. Defense costs, even for unfounded claims, or a judgment or other liability in excess of our reinsurance limits for any claims or any adverse publicity resulting from claims could adversely affect our business, results of operations and financial condition.
Our strategy for growing our business may not be profitable.
Over the past several years, we have made, and our current plans are to continue to make, investments in our lines of business, and we have increased expenses in order to, among other things, strengthen our product offerings and service capabilities, expand into new geographic areas, improve technology and our operating models, build expertise in our personnel, and expand our distribution capabilities, with the ultimate goal of achieving significant, sustained growth. The ability to achieve significant profitable premium growth in order to earn adequate returns on such investments and expenses, and to grow further without proportionate increases in expenses, is an important part of our current strategy. There can be no assurance that we will be successful at profitably growing our business, or that we will not alter our current strategy due to changes in our markets or an inability to successfully maintain acceptable margins on new business or for other reasons, in which case premiums written and earned, operating income and net book value could be adversely affected.
~ 22 ~
Our investment performance may suffer as a result of adverse capital market developments, which may affect our financial results and ability to conduct business.
We invest the premiums we receive from policyholders until cash is needed to pay insured claims or other expenses. We had net realized investment gains of $37,000 and $81,000 for the years ended December 31, 2016 and Decemeber 2015, respectively. Our investments will be subject to a variety of investment risks, including risks relating to general economic conditions, market volatility, interest rate fluctuations, liquidity risk and credit risk. An unexpected increase in the volume or severity of claims may force us to liquidate securities, which may cause us to incur capital losses. If we do not structure the duration of our investments to match our insurance liabilities, we may be forced to liquidate investments prior to maturity at a significant loss to cover such payments. Investment losses could significantly decrease our asset base and statutory surplus, thereby affecting our ability to conduct business. See Item 7. Management’s Discussion and Analysis of Financial Condition and Results of Operations —Quantitative and Qualitative Information About Market Risk.
The geographic distribution of our business exposes us to significant natural disasters, which may negatively affect our financial and operating results.
For the year ended December 31, 2016, approximately 36.9% of our direct premiums written originated from business written in Illinois, and therefore, we have a greater exposure to catastrophic or other significant natural or man-made losses in that geographic region. The incidence and severity of such events are inherently unpredictable. In recent years, changing climate conditions have increased the unpredictability, severity and frequency of tornados, hurricanes, and other storms.
States and regulators from time to time have taken action that has the effect of limiting the ability of insurers to manage these risks, such as prohibiting insurers from reducing exposures or withdrawing from catastrophe-prone areas, or mandating that insurers participate in residual markets. Our ability or willingness to manage our exposure to these risks may be limited due to considerations of public policy, the evolving political environment, or social responsibilities. We may choose to write business in catastrophe-prone geographic areas that we might not otherwise write for strategic purposes, such as improving our access to other underwriting opportunities.
Our ability to properly estimate reserves related to tornados and storms can be affected by the inability to access portions of the impacted areas, the complexity of factors contributing to the losses, the legal and regulatory uncertainties, and the nature of the information available to establish the reserves. These complex factors include, but are not limited to the following:
|
· |
determining whether damages were caused by flooding versus wind; |
|
· |
evaluating general liability and pollution exposures; |
|
· |
the impact of increased demand for products and services necessary to repair or rebuild damaged properties; |
|
· |
infrastructure disruption; |
|
· |
fraud; |
|
· |
the effect of mold damage; |
|
· |
business interruption costs; and |
|
· |
reinsurance collectability. |
The estimates related to catastrophes are adjusted as actual claims are filed and additional information becomes available. This adjustment could reduce income during the period in which the adjustment is made, which could have a material adverse impact on our financial condition and results of operations.
Large-scale natural disasters may have a material adverse effect on our business, financial condition and results of operations.
The Midwest has historically been at a relatively high risk of natural disasters such as tornados, blizzards and flooding. If the Midwest were to experience a large-scale natural disaster, claims incurred would likely increase and our insured’s properties may incur substantial damage, which could have a material adverse effect on our business, financial condition and results of operations.
~ 23 ~
Our results may fluctuate as a result of many factors, including cyclical changes in the insurance industry, which may lead to reduced premium volume.
Results of companies in the insurance industry, and particularly the property and casualty insurance industry, historically have been subject to significant fluctuations and uncertainties. The industry’s profitability can be affected significantly by:
|
· |
rising levels of actual costs that are not known by companies at the time they price their products; |
|
· |
volatile and unpredictable developments, including man-made and natural catastrophes; |
|
· |
changes in reserves resulting from the general claims and legal environments as different types of claims arise and judicial interpretations relating to the scope of insurers’ liability develop; and |
|
· |
fluctuations in interest rates, inflationary pressures and other changes in the investment environment, which affect returns on invested capital and may impact the ultimate payout of losses. |
Historically, the financial performance of the insurance industry has fluctuated in cyclical periods of low premium rates and excess underwriting capacity resulting from increased competition (a so-called “soft market”), followed by periods of high premium rates and a shortage of underwriting capacity resulting from decreased competition (a so-called “hard market”). Fluctuations in underwriting capacity, demand and competition, and the impact on our business of the other factors identified above, could have a negative impact on our results of operations and financial condition.
Because estimating future losses is difficult and uncertain, if our actual losses exceed our loss reserves, our operating results may be adversely affected.
We maintain reserves to cover amounts we estimate will be needed to pay for insured losses and for the expenses necessary to settle claims. Estimating loss and loss expense reserves is a difficult and complex process involving many variables and subjective judgments. We regularly review our reserve estimate protocols and our overall amount of reserves. We review historical data and consider the impact of various factors such as:
|
· |
trends in claim frequency and severity; |
|
· |
information regarding each claim for losses; |
|
· |
legislative enactments, judicial decisions and legal developments regarding damages; and |
|
· |
trends in general economic conditions, including inflation. |
Our actual losses could exceed our reserves. If we determine that our loss reserves are inadequate, we will have to increase them. This adjustment would reduce income during the period in which the adjustment is made, which could have a material adverse impact on our financial condition and results of operations. Such adjustments to loss reserve estimates are referred to as “loss development.” If existing loss reserves exceed the revised estimate, it is referred to as positive loss development. Negative loss development occurs when the revised estimate of expected losses with respect to a calendar year exceed existing loss reserves. For additional information, see Item 1. Business — Loss and Settlement Expense Reserves.
If our reinsurers do not pay our claims in accordance with our reinsurance agreements, we may incur losses.
We are subject to loss and credit risk with respect to the reinsurers with whom we deal because buying reinsurance does not relieve us of our liability to policyholders. If our reinsurers are not capable of fulfilling their financial obligations to us, our insurance losses would increase. For the year ended December 31, 2016, we ceded 15.8% of our gross written premiums to our reinsurers. We secure reinsurance coverage from a number of reinsurers. The lowest A.M. Best rating issued to any of our reinsurers is “A-” (Excellent), which is the fourth highest of fifteen ratings. See Item 1. Business — Reinsurance.
~ 24 ~
The property and casualty insurance market in which we operate is highly competitive, which limits our ability to increase premiums for our products and recruit new producers.
Competition in the property and casualty insurance business is based on many factors. These factors include the perceived financial strength of the insurer, premiums charged, policy terms and conditions, services provided, reputation, financial ratings assigned by independent rating agencies and the experience of the insurer in the line of insurance to be written. We compete with stock insurance companies, mutual companies, local cooperatives and other underwriting organizations. Many of these competitors have substantially greater financial, technical and operating resources than we have. Many of the lines of insurance we write are subject to significant price competition. If our competitors price their products aggressively, our ability to grow or renew our business may be adversely affected. We pay producers on a commission basis to produce business. Some of our competitors may offer higher commissions or insurance at lower premium rates through the use of salaried personnel or other distribution methods that do not rely on independent agents. Increased competition could adversely affect our ability to attract and retain business and thereby reduce our profits from operations.
Our results of operations may be adversely affected by any loss of business from key producers.
Our products are primarily marketed by independent agents. Other insurance companies compete with us for the services and allegiance of these producers. These producers may choose to direct business to our competitors, or may direct less desirable risks to us. We had two producers that were responsible for more than 5% of our direct premiums written. One producer accounted for $2.8 million or approximately 5.5% while the other producer accounted for $2.6 million or 5.1% of our direct premiums written in 2016. No other producer accounted for more than 5% of our 2016 direct premiums written. If we experience a significant decrease in business from, or lose entirely, our largest producers, it would have a material adverse effect on us.
Our revenues may fluctuate with our investment results and changes in interest rates.
Our investment portfolio contains a significant amount of fixed income securities. The fair values of these invested assets fluctuate depending upon economic conditions, particularly changes in interest rates. We may not be able to prevent or minimize the negative impact of interest rate changes. Additionally, unforeseen circumstances may force us to sell certain of our invested assets at a time when their fair values are less than their original cost, resulting in realized capital losses, which would reduce our net income.
Proposals to federally regulate the insurance business could affect our business.
Currently, the U.S. federal government does not directly regulate the insurance business. However, federal legislation and administrative policies in several areas can significantly and adversely affect insurance companies. These areas include financial services regulation, securities regulation, pension regulation, privacy, tort reform legislation and taxation. In addition, various forms of direct federal regulation of insurance have been proposed. These proposals generally would maintain state-based regulation of insurance, but would affect state regulation of certain aspects of the insurance business, including rates, producer and company licensing, and market conduct examinations. We cannot predict whether any of these proposals will be adopted, or what impact, if any, such proposals or, if enacted, such laws may have on our business, financial condition or results of operations.
If we fail to comply with insurance industry regulations, or if those regulations become more burdensome, we may not be able to operate profitably.
We are regulated by the Illinois Department of Insurance, as well as, to a more limited extent, the federal government and the insurance departments of other states in which we do business. For the year ended December 31, 2016, approximately 36.9% of our direct premiums written originated from business written in Illinois. Therefore, the cancellation or suspension of our license in Illinois, as a result of any failure to comply with the applicable insurance laws and regulations, may negatively impact our operating results.
Most insurance regulations are designed to protect the interests of policyholders rather than shareholders and other investors. These regulations relate to, among other things:
|
· |
approval of policy forms and premium rates; |
|
· |
standards of solvency, including establishing requirements for minimum capital and surplus, and for risk-based capital; |
~ 25 ~
|
· |
classifying assets as admissible for purposes of determining solvency and compliance with minimum capital and surplus requirements; |
|
· |
licensing of insurers and their producers; |
|
· |
advertising and marketing practices; |
|
· |
restrictions on the nature, quality and concentration of investments; |
|
· |
assessments by guaranty associations and mandatory pooling arrangements; |
|
· |
restrictions on the ability to pay dividends; |
|
· |
restrictions on transactions between affiliated companies; |
|
· |
restrictions on the size of risks insurable under a single policy; |
|
· |
requiring deposits for the benefit of policyholders; |
|
· |
requiring certain methods of accounting; |
|
· |
periodic examinations of our operations and finances; |
|
· |
claims practices; |
|
· |
prescribing the form and content of reports of financial condition required to be filed; and |
|
· |
requiring reserves for unearned premiums, losses and other purposes. |
The Illinois Department of Insurance also conducts periodic examinations of the affairs of insurance companies and requires the filing of annual and other reports relating to financial condition, holding company issues and other matters. These regulatory requirements may adversely affect or inhibit our ability to achieve some or all of our business objectives. Our last examination by the Illinois Department of Insurance was in February 2012.
In addition, regulatory authorities have relatively broad discretion to deny or revoke licenses for various reasons, including the violation of regulations. Further, changes in the level of regulation of the insurance industry or changes in laws or regulations themselves or interpretations by regulatory authorities could adversely affect our ability to operate our business.
Our ability to manage our exposure to underwriting risks depends on the availability and cost of reinsurance coverage.
Reinsurance is the practice of transferring part of an insurance company’s liability and premium under an insurance policy to another insurance company. We use reinsurance arrangements to limit and manage the amount of risk we retain, to stabilize our underwriting results and to increase our underwriting capacity. The availability and cost of reinsurance are subject to current market conditions and may vary significantly over time. Any decrease in the amount of our reinsurance will increase our risk of loss. We may be unable to maintain our desired reinsurance coverage or to obtain other reinsurance coverage in adequate amounts and at favorable rates. If we are unable to renew our expiring coverage or obtain new coverage, it will be difficult for us to manage our underwriting risks and operate our business profitably.
It is also possible that the losses we experience on risks we have reinsured will exceed the coverage limits on the reinsurance. If the amount of our reinsurance coverage is insufficient, our insurance losses could increase substantially.
We could be adversely affected by the loss of our existing management or key employees.
The success of our business is dependent, to a large extent, on our ability to attract and retain key employees, in particular our senior officers. Our business may be adversely affected if labor market conditions make it difficult for us to replace our current key officers with individuals having equivalent qualifications and experience at compensation levels competitive for our industry. In particular, because of the shortage of experienced underwriters and claims personnel who have experience or training in the liquor liability sector of the insurance industry, replacing key employees in that line of our business could be challenging. Our key officers include: Arron K. Sutherland, our President and Chief Executive Officer, Michael R. Smith, our Vice President – Chief Financial Officer, Norman D. Schmeichel, our Vice President – Chief Information Officer, Howard J. Beck, our Vice President – Chief Underwriting Officer, Julia B. Suiter, our Chief Legal Officer, Rickey Plunkett, our Director of Claims, and Kathleen S. Springer, our Director of Human Resources. These key officers have an average of more than 20 years of experience in the property and casualty insurance industry.
~ 26 ~
We do not have agreements not to compete or employment agreements with our employees, except for our employment agreement with Mr. Sutherland and change in control agreements with certain officers, including Messrs. Smith, Schmeichel, Beck, and Plunkett and Mesdames Suiter and Springer. Each of our employment agreement with Mr. Sutherland and change in control agreements has change of control provisions that provide for certain payments and the continuation of certain benefits in the event such officer is terminated without cause or such officer voluntarily quits for good reason after a change in control.
Losses resulting from political instability, acts of war or terrorism may negatively affect our financial and operating results.
Numerous classes of business are exposed to terrorism related catastrophic risks. The frequency, number and severity of these losses are unpredictable. As a result, we have changed our underwriting protocols to address terrorism and the limited availability of terrorism reinsurance. However, given the uncertainty of the potential threats, we cannot be sure that we have addressed all the possibilities.
The Terrorism Risk Insurance Act of 2002, as extended by the Terrorism Risk Insurance Program Reauthorization Act of 2015, is effective through December 31, 2020. Prior to the act, insurance coverage by private insurers for losses (other than workers’ compensation) arising out of acts of terrorism was severely limited. The act provides, among other things, that all licensed insurers must offer coverage on most commercial lines of business for acts of terrorism. Losses arising out of acts of terrorism that are certified as such by the Secretary of the Treasury of the United States and that exceed $120 million for calendar year 2016 will be reimbursed by the federal government subject to a limit of $100 billion in any year, which loss trigger increases each year by $20 million until it reaches $200 million in 2020 and any calendar year thereafter. Each insurance company is responsible for a deductible equal to 20% of its direct earned premiums in the previous calendar year. For 2016, our deductible is approximately $9.5 million. For losses in excess of the deductible, the federal government will reimburse 84% of the insurer’s loss, up to the insurer’s proportionate share of the $100 billion. Such reimbursement percentage will be reduced by one percentage point each year until it reaches 80%.
Notwithstanding the protection provided by reinsurance and the Terrorism Risk Insurance Act of 2002, the risk of severe losses to us from acts of terrorism has not been eliminated. Our reinsurance contracts include various limitations or exclusions limiting the reinsurers’ obligation to cover losses caused by acts of terrorism. Accordingly, events constituting acts of terrorism may not be covered by, or may exceed the capacity of, our reinsurance and could adversely affect our business and financial condition.
We could be adversely affected by any interruption to our ability to conduct business at our current location.
Our business operations could be substantially interrupted by flooding, snow, ice, and other weather-related incidents, or from fire, power loss, telecommunications failures, terrorism, or other such events. In such an event, we may not have sufficient redundant facilities to cover a loss or failure in all aspects of our business operations and to restart our business operations in a timely manner. Any damage caused by such a failure or loss may cause interruptions in our business operations that may adversely affect our service levels and business. See Item 1. Business — Technology.
Changes in accounting standards issued by the Financial Accounting Standards Board (FASB) or other standard-setting bodies may adversely affect our consolidated financial statements.
Our consolidated financial statements are subject to the application of GAAP, which is periodically revised and/or expanded. Accordingly, we are required to adopt new or revised accounting standards from time to time issued by recognized authoritative bodies, including the FASB. It is possible that future changes we are required to adopt could change the current accounting treatment that we apply to our consolidated financial statements and that such changes could have a material effect on our financial condition and results of operations.
~ 27 ~
Assessments and premium surcharges for state guaranty funds, second injury funds and other mandatory pooling arrangements may reduce our profitability.
Most states require insurance companies licensed to do business in their state to participate in guaranty funds, which require the insurance companies to bear a portion of the unfunded obligations of impaired, insolvent or failed insurance companies. These obligations are funded by assessments, which are expected to continue in the future. State guaranty associations levy assessments, up to prescribed limits, on all member insurance companies in the state based on their proportionate share of premiums written in the lines of business in which the impaired, insolvent or failed insurance companies are engaged. Accordingly, the assessments levied on us may increase as we increase our written premiums. Some states also have laws that establish second injury funds to reimburse insurers and employers for claims paid to injured employees for aggravation of prior conditions or injuries. These funds are supported by either assessments or premium surcharges based on incurred losses. See Item 1. Business — Regulation.
In addition, as a condition to conducting business in some states, insurance companies are required to participate in residual market programs to provide insurance to those who cannot procure coverage from an insurance carrier on a negotiated basis. Insurance companies generally can fulfill their residual market obligations by, among other things, participating in a reinsurance pool where the results of all policies provided through the pool are shared by the participating insurance companies. Although we price our insurance to account for our potential obligations under these pooling arrangements, we may not be able to accurately estimate our liability for these obligations. Accordingly, mandatory pooling arrangements may cause a decrease in our profits. At December 31, 2016, we participated in mandatory pooling arrangements in three states. As we write policies in new states that have mandatory pooling arrangements, we will be required to participate in additional pooling arrangements. Further, the impairment, insolvency or failure of other insurance companies in these pooling arrangements would likely increase the liability for other members in the pool. The effect of assessments and premium surcharges or increases in such assessments or surcharges could reduce our profitability in any given period or limit our ability to grow our business. See Item 7. Management’s Discussion and Analysis of Financial Condition and Results of Operations.
Risk Factors Related to our Recent Initial Public Offering and Ownership of Our Common Stock
A small number of shareholders collectively own a substantial portion of our common stock and voting power, and, because of restrictions on their ability to buy or sell our shares, our public float will be limited.
Collectively, the three investors purchasing shares from us pursuant to investment agreements (the Clinton-Flood Purchasers, Rock Island Investors, LLC and Tuscarora Wayne) own or exercise voting and investment control of 1.4 million of our shares, or 40% of our outstanding common stock. Pursuant to their respective purchase agreement, each investor has agreed to, among other things, vote as recommended by our board of directors (subject to limited exceptions), agree to a standstill provision, including from purchasing shares of our common stock except as provided by a contractual preemptive right, for up to seven years, agreed to restrictions on their respective ability to sell their shares of our common stock.
If and for so long as an investor beneficially owns two percent (2.0%) or more of the shares of our common stock and a standstill termination event has not occurred, the investor shall generally vote and cause to be voted all shares of common stock beneficially owned by such investor (a) for persons nominated and recommended by ICC Holdings’ Board of Directors for election as directors of ICC Holdings’ Board of Directors and against any person nominated for election as a director by any other person or entity, and (b) as directed or recommended by ICC Holdings’ Board of Directors with respect to any proposal presented at any meeting of ICC Holdings’ shareholders, including, but not limited to (i) the entire slate of directors recommended for election by the ICC Holdings’ Board of Directors to the shareholders of ICC Holdings at any meeting of ICC Holdings’ shareholders at which any directors are elected, (ii) any shareholder proposal submitted for a vote at any meeting of ICC Holdings’ shareholders, and (iii) any proposal submitted by ICC Holdings for a vote at any meeting of ICC Holdings’ shareholders relating (A) to the appointment of ICC Holdings’ accountants, or (B) an equity compensation plan of ICC Holdings and/or any material revisions thereto. This provision may have the effect of entrenching our board of directors and management team and may deprive a shareholder of the opportunity to sell shares to potential acquirers at a premium over prevailing prices. As a result, other shareholders may be prevented from affecting matters involving our company, including:
|
· |
the composition of our board of directors and, through it, any determination with respect to our business direction and policies, including the appointment and removal of officers; |
|
· |
any determinations with respect to mergers or other business combinations; |
|
· |
our acquisition or disposition of assets; and |
|
· |
our corporate financing activities. |
~ 28 ~
Furthermore, this concentration of voting power could have the effect of delaying, deterring or preventing a change of control or other business combination that might otherwise be beneficial to our shareholders. This significant concentration of share ownership may also adversely affect the trading price for our common stock because investors may perceive disadvantages in owning stock in a company that is controlled by a small number of shareholders.
In addition, these investors are restricted from buying or selling shares of our common stock pursuant to their respective investment agreements and, in some cases, by restrictions under applicable securities laws. For three years following the closing, each of the investors are generally prohibited from selling any shares of our common stock. Beginning on the third anniversary of the closing date, subject to our right of first refusal in favor of us, each investor could sell no more than six and one-quarter percent (6-1/4%) of the number of shares purchased at the closing of the offering every ninety days. Upon the occurrence of a death or disability of R. Kevin Clinton, no more than six and one-quarter percent (6-1/4%) of the number of shares purchased at the closing of the offering by R. Kevin Clinton and certain other purchasers who together purchased 600,000 shares of our common stock every ninety days by their trusts, estate or spouse could be sold beginning, unless an earlier date has been approved by a majority of the members of our board of directors other than R. Kevin Clinton or his replacement on our board of directors, (a) one year following such occurrence, if such event occurs during the first year following the closing date, (b) six months following such occurrence, if such event occurs during the second year following the closing date, or (c) following such occurrence, if such event occurs during the third year following the closing date. Until the expiration of the standstill provision discussed below, each investor is restricted from buying any shares of our common stock other than those acquired pursuant to their respective investment agreements and pursuant to their respective preemptive right thereunder. As a result, the liquidity of our common stock relative to what it would have been had these shares been purchased by other investors may be reduced.
For so long as an investor beneficially owns two percent (2.0%) or more of the issued and outstanding shares of our common stock, these standstill provisions will continue until the earliest of (a) the seventh anniversary of the closing of the offering, or (b) the date on which ICC Holdings includes a balance sheet in a filing with the SEC in which its “adjusted shareholders’ equity” at the end of such fiscal quarter is less than 85% of the “starting shareholders’ equity”. We received gross proceeds of $35.0 million in the offering, using information as of December 31, 2016 as the starting shareholders’ equity, the adjusted shareholders equity would have to be $9.5 million lower in order to trigger a termination of the standstill provisions. Following the expiration of the standstill and other provisions, if these investors retain their ownership levels, such investors together may be able to exhibit significant control over us and our management and will have significant influence over matters requiring shareholder approval, including future amendments to our amended and restated articles of incorporation or other significant or extraordinary transactions. The interests of these investors may differ from the interests of our other shareholders with respect to certain matters.
Our ESOP and stock-based incentive plan will increase our costs, which will reduce our income.
Our ESOP purchased 10.0% of the shares of common stock sold in the offering with funds borrowed from us prior to the expiration of the offering. The cost of acquiring the shares of common stock for the ESOP, and therefore the amount of the loan was $3.5 million. The loan will be repaid over a fifteen year period. We will record annual employee stock ownership plan expense in an amount equal to the fair value of the shares of common stock committed to be released to employees under the ESOP for each year. If shares of our common stock appreciate in value over time, compensation expense relating to the employee stock ownership plan will increase.
Our board of directors intends to adopt a stock-based incentive plan that we will submit to our shareholders for approval. Under this plan, we may award participants restricted shares of our common stock, restricted stock units denominated in shares of our common stock, or options to purchase shares of our common stock. Restricted stock and restricted stock unit awards will be made at no cost to the participants. Restricted stock units are payable in shares of common stock or in cash in the discretion of the compensation committee. The number of shares of common stock that may be issued pursuant to restricted stock and restricted stock unit awards (to the extent that such restricted stock unit awards are not paid in cash) or upon exercise of stock option awards under the stock-based incentive plan may not exceed 10% and 4%, respectively, of the total number of shares sold in the offering.
~ 29 ~
The costs associated with the grant of restricted stock awarded under the stock-based incentive plan will be recognized and expensed over the vesting period of the award at the fair market value of the shares on the date they are awarded. If the restricted shares of common stock to be awarded under the plan are repurchased in the open market (rather than issued directly from our authorized but unissued shares of common stock) and cost the same as the purchase price in the offering, the reduction to shareholders’ equity due to the plan will be $3.5 million. To the extent we repurchase such shares in the open market and the price of such shares exceeds the offering price of $10.00 per share, the reduction to shareholders’ equity would exceed the range described above. Conversely, to the extent the price of such shares is below the offering price of $10.00 per share, the reduction to shareholders’ equity would be less than the range described above. The costs associated with the grant of restricted stock unit awards to be settled in cash will similarly be recognized and expensed over their vesting period at the fair market value of the shares on the date they are awarded. However, unlike awards of restricted stock, the fair market value will be remeasured on a quarterly basis until the award vests or is otherwise settled. Therefore, in addition to reducing our net income by recording this compensation and benefit expense, increases in our stock price will increase this expense for restricted stock unit awards settled in cash, thereby further reducing our net income.
Finally, accounting rules require companies to recognize as compensation expense the award-date fair value of stock options. This compensation expense will be recognized over the appropriate service period. When we record an expense for the award of options using the fair value method, we will incur significant compensation and benefits expense, which will reduce our net income.
The implementation of the stock-based incentive plan may dilute an individual shareholder’s percentage ownership interest and may also result in downward pressure on the price of our stock.
The proposed stock-based incentive plan will be funded through either open market purchases or from the issuance of authorized but unissued shares. In the event that authorized but unissued shares are used to fund restricted stock or restricted stock unit awards and the exercise of stock option awards under the plan in an amount equal to 10% and 4%, respectively, of the shares issued in a midpoint offering, shareholders would experience a reduction in ownership interest of approximately 12.3%. In addition, the number of shares of common stock available for issuance pursuant to restricted stock or restricted stock unit awards and upon exercise of stock option awards following the approval of our stock-based incentive plan may be perceived by the market as having a dilutive effect, which could lead to a decrease in the price of our common stock.
The valuation of our common stock in the recent initial public offering is not necessarily indicative of the future price of our common stock, and the price of our common stock may decline.
There can be no assurance that shares of our common stock will be able to be sold in the market at or above the $10.00 per share initial offering price in the future. The final aggregate purchase price of our common stock in the offering was based upon an independent appraisal. The appraisal is not intended, and should not be construed, as a recommendation of any kind as to the advisability of purchasing shares of common stock. The valuation is based on estimates of a number of matters, all of which are subject to change from time to time. See “The Conversion and Offering — The Valuation” in our final prospectus filed with the SEC on February 13, 2017 for the factors considered by Feldman Financial in determining the appraisal.
The price of shares of our common stock may decline for many reasons, some of which are beyond our control, including among others:
|
· |
Capital market conditions generally; |
|
· |
quarterly variations in our results of operations; |
|
· |
changes in expectations as to our future results of operations, including financial estimates by securities analysts and investors; |
|
· |
announcements by third parties of claims against us; |
|
· |
changes in law and regulation; |
|
· |
results of operations that vary from those expected by investors; and |
|
· |
future sales of shares of our common stock. |
In addition, the stock market routinely experiences substantial price and volume fluctuations that sometimes have been unrelated or disproportionate to the operating performance of companies. As a result, the trading price of shares of our common stock may be below the initial public offering price, and a shareholder may not be able to sell shares at or above the price paid to purchase them.
~ 30 ~
Statutory provisions and our articles and bylaws may discourage takeover attempts on the Company that shareholders may believe are in their best interests or that might result in a substantial profit to them.
We are subject to provisions of Pennsylvania corporate law and Illinois insurance law that hinder a change of control. Illinois law requires the Illinois Department of Insurance’s prior approval of a change of control of an insurance holding company. Under Illinois law, the acquisition of 10% or more of the outstanding voting stock of an insurer or its holding company is presumed to be a change in control. Approval by the Illinois Department of Insurance may be withheld even if the transaction would be in the shareholders’ best interest if the Illinois Department of Insurance determines that the transaction would be detrimental to policyholders.
Our articles of incorporation and bylaws also contain provisions that may discourage a change in control. These provisions include:
|
· |
a prohibition on a person, including a group acting in concert, from acquiring voting control of more than 10% of our outstanding stock without prior approval of the board of directors; |
|
· |
a classified board of directors divided into three classes serving for successive terms of three years each; |
|
· |
the prohibition of cumulative voting in the election of directors; |
|
· |
the requirement that nominations for the election of directors made by shareholders and any shareholder proposals for inclusion on the agenda at any annual meeting must be made by notice (in writing) delivered or mailed to us not less than 90 days prior to the meeting; |
|
· |
the prohibition of shareholders’ action without a meeting and of shareholders’ right to call a special meeting; |
|
· |
unless otherwise waived by the board of directors, to be elected as a director, a person must be a shareholder of ICC Holdings, Inc. for the lesser of one year or the time that has elapsed since the completion of the conversion; |
|
· |
the requirement imposing a mandatory tender offering requirement on a shareholder that has a combined voting power of 25% or more of the votes that our shareholders are entitled to cast; |
|
· |
the requirement that certain provisions of our articles of incorporation can only be amended by an affirmative vote of shareholders entitled to cast at least 80% of all votes that shareholders are entitled to cast, unless approved by an affirmative vote of at least 80% of the members of the board of directors; and |
|
· |
the requirement that certain provisions of our bylaws can only be amended by an affirmative vote of shareholders entitled to cast at least 66 2/3%, or in certain cases 80%, of all votes that shareholders are entitled to cast. |
These provisions may serve to entrench management and may discourage a takeover attempt that a shareholder may consider to be in his or her best interest or in which the shareholder would receive a substantial premium over the current market price. These provisions may make it extremely difficult for any one person, entity or group of affiliated persons or entities to acquire voting control of the Company, with the result that it may be extremely difficult to bring about a change in the board of directors or management. Some of these provisions also may perpetuate present management because of the additional time required to cause a change in the control of the board. Other provisions make it difficult for shareholders owning less than a majority of the voting stock to be able to elect even a single director.
We have broad discretion over the use of the net proceeds that we retain from the offering.
Although we expect to use part of the net proceeds of the offering to potentially make open market purchases of our shares for our stock incentive plan, our management has a broad discretion with respect to the use of the net proceeds that are contributed to ICC. Except as specified above, we expect to use the net proceeds for general corporate purposes, which may include, among other things, purchasing investment securities and further expanding our insurance operations.
If ICC is not sufficiently profitable, our ability to pay dividends will be limited.
We are a separate entity with no operations of our own other than holding the stock of ICC. We depend primarily on dividends paid by ICC and any proceeds from the offering that are not contributed to ICC to pay the debt service on our existing loans and to provide funds for the payment of dividends. Following the acquisition of ICC Realty, LLC from ICC by ICC Holdings, we may receive distributions from ICC Realty, LLC. We will receive dividends only after all of ICC’s obligations and regulatory requirements with the Illinois Department of Insurance have been satisfied. During any twelve-month period, the amount of dividends paid by ICC to us, without the prior approval of the Illinois Department of Insurance, may not exceed the greater of 10% of ICC’s surplus as regards policyholders as reported on its most recent annual statement filed with the Illinois Department of Insurance or ICC’s statutory net income as reported on such statement. We presently do not intend to pay dividends to our shareholders. If ICC is not sufficiently profitable, our ability to pay dividends in the future will be limited.
~ 31 ~
Compliance with the requirements of the Securities Exchange Act and the Sarbanes-Oxley Act could result in higher operating costs and adversely affect our results of operations.
With the completion of our initial public offering, we are now subject to the periodic reporting, proxy solicitation, insider trading prohibitions and other obligations imposed under the Securities Exchange Act. In addition, certain of the provisions of the Sarbanes-Oxley Act became applicable to us at the completion of the offering. Compliance with these requirements will increase our legal, accounting and other compliance costs and the cost of directors and officer’s liability insurance, and will require management to devote substantial time and effort to ensure initial and ongoing compliance with these obligations. A key component of compliance under the Exchange Act is to produce quarterly and annual financial reports within prescribed time periods after the close of our fiscal year and each fiscal quarter. Historically, we have not been required to prepare such financial reports within these time periods. Failure to satisfy these reporting requirements may result in delisting of our common stock by the NASDAQ Capital Market, and inquiries from or sanctions by the SEC. Moreover, the provision of the Sarbanes-Oxley Act that requires public companies to review and report on the adequacy of their internal controls over financial reporting may be applicable to us in 2022. We expect these rules, regulations and requirements to significantly increase our accounting, legal, compliance and other costs and to make some activities more time-consuming and costly. We also will need to hire additional accounting, legal, compliance and administrative staff with experience working for public companies. We may be unable to hire such additional staff on terms that are favorable to us, or at all. In addition, such additional staff may not be able to provide such services at levels sufficient to comply with these requirements. Moreover, the rules that became applicable to us as a public company could make it more difficult and expensive for us to attract and retain qualified members of our board of directors and qualified executive officers. We also anticipate that these rules will make it more expensive for us to obtain directors’ and officers’ insurance, and we may be required to incur substantially higher costs to obtain such coverage. If we fail to predict these costs accurately or to manage these costs effectively, our operating results could be adversely affected.
Failure to achieve and maintain effective internal controls in accordance with Section 404 of the Sarbanes-Oxley Act could have a material adverse effect on our ability to accurately report our financial results or prevent fraud.
Upon completion of the offering, we became a public reporting company. The federal securities laws and regulations of the Exchange Act and the Sarbanes-Oxley Act require that we file annual, quarterly and current reports, that we maintain effective disclosure controls and procedures and internal controls over financial reporting and that we certify the adequacy of our internal controls and procedures. Before this offering, we and our independent registered public accounting firm did not, and were not required to, perform an evaluation of our internal controls over financial reporting in accordance with the provisions of the Sarbanes-Oxley Act.
Our high price-to-earnings ratio may cause our stock to trade at less than $10 per share in the secondary market obtained in the offering.
Because of our relatively low returns on equity in recent reporting periods, the price-to-earnings ratio of our shares may be substantially higher than our peers after completion of our initial public offering. This may result in our shares trading in the secondary market after completion of the offering at less than the $10 per share offering price.
If we fail to maintain the necessary requirements to be listed on the NASDAQ Capital Market, the price and liquidity of our stock may be adversely affected.
In order to remain listed on the NASDAQ Capital Market, we must meet certain minimum requirements for our shareholders’ equity, net income, the market value and number of publicly held shares, the number of shareholders, and the market price of our stock. In addition, we must have up to four market makers making a market in our stock under certain continued listing standards. Delisting from the NASDAQ Capital Market may adversely affect the market price for our stock and reduce the liquidity of our common stock, and therefore, make it more difficult for a shareholder to sell our stock. For more information regarding the reduced liquidity as a result of our agreements with the investors, see Item 1A. Risk Factors—Risks Related to the Ownership of Our Common Stock — A small number of shareholders will collectively own a substantial portion of our common stock and voting power, and, because of restrictions on their ability to buy or sell our shares, our public float will be limited.
Item 1B. Unresolved Staff Comments
None.
~ 32 ~
Our headquarters are located at 225 20th Street, Rock Island, Illinois. We own this approximately 24,000 square foot facility. We also own and operate investment property comprising of 35 apartment rental units located in Rock Island and Moline, Illinois.
We are a party to litigation in the normal course of business. Based upon information presently available to us, we do not consider any litigation to be material. However, given the uncertainties attendant to litigation, we cannot provide assurance that our results of operations and financial condition will not be materially adversely affected by any litigation.
~ 33 ~
Item 3A. Forward-Looking Information
The Private Securities Litigation Reform Act of 1995 (the “Reform Act”) provides a safe harbor for forward-looking statements made by or on behalf of ICC Holdings, Inc. ICC Holdings, Inc. and its representatives may, from time to time, make written or verbal forward-looking statements, including statements contained in ICC Holdings, Inc.'s filings with the Securities and Exchange Commission (SEC) and its reports to shareholders. Generally, the inclusion of the words “anticipates,” “believe,” “estimate,” “expect,” “future,” “intend,” “estimate,” “may,” “plans,” “seek”, “will,” or the negative of such terms and similar expressions identify statements that constitute “forward-looking statements” within the meaning of Section 27A of the Securities Act of 1933 and Section 21E of the Securities Exchange Act of 1934 and that are intended to come within the safe harbor protection provided by those sections. All statements addressing operating performance, events, or developments that ICC Holdings, Inc. expects or anticipates will occur in the future, including statements relating to sales growth, earnings or earnings per share growth, and market share, as well as statements expressing optimism or pessimism about future operating results, are forward-looking statements within the meaning of the Reform Act. The forward-looking statements are and will be based on management’s then-current beliefs and assumptions regarding future events and operating performance and on information currently available to management, and are applicable only as of the dates of such statements.
Forward-looking statements involve risks, uncertainties and assumptions, including, among other things, the factors discussed under the heading “Item 1A. Risk Factors” and those listed below. Although we do not make forward-looking statements unless we believe we have a reasonable basis for doing so, we cannot guarantee their accuracy. Actual results may differ materially from those expressed in these forward-looking statements due to a number of uncertainties and risks, including the risks described in this Annual Report on Form 10-K and other unforeseen risks. Readers should not put undue reliance on any forward-looking statements. These statements speak only as of the date of this Annual Report on Form 10-K, even if subsequently made available by us on our website or otherwise, and we undertake no obligation to update or revise these statements to reflect events or circumstances occurring after the date of this Annual Report on Form 10-K.
All of these factors are difficult to predict and many are beyond our control. These important factors include those discussed under Item 1A. Risk Factors and those listed below:
|
· |
the potential impact of fraud, operational errors, systems malfunctions, or cybersecurity incidents; |
|
· |
future economic conditions in the markets in which we compete that are less favorable than expected; |
|
· |
our ability to expand geographically; |
|
· |
the effects of weather-related and other catastrophic events; |
|
· |
the effect of legislative, judicial, economic, demographic and regulatory events in the jurisdictions where we do business, especially changes with respect to laws, regulations and judicial decisions relating to liquor liability; |
|
· |
our ability to enter new markets successfully and capitalize on growth opportunities either through acquisitions or the expansion of our producer network; |
|
· |
financial market conditions, including, but not limited to, changes in interest rates and the stock markets causing a reduction of investment income or investment gains and a reduction in the value of our investment portfolio; |
|
· |
heightened competition, including specifically the intensification of price competition, the entry of new competitors and the development of new products by new or existing competitors, resulting in a reduction in the demand for our products; |
|
· |
the impact of acts of terrorism and acts of war; |
|
· |
the effects of terrorist related insurance legislation and laws; |
|
· |
changes in general economic conditions, including inflation, unemployment, interest rates and other factors; |
|
· |
the cost, availability and collectability of reinsurance; |
|
· |
estimates and adequacy of loss reserves and trends in loss and settlement expenses; |
|
· |
changes in the coverage terms selected by insurance customers, including higher limits; |
|
· |
our inability to obtain regulatory approval of, or to implement, premium rate increases; |
|
· |
our ability to obtain reinsurance coverage at reasonable prices or on terms that adequately protect us; |
|
· |
the potential impact on our reported net income that could result from the adoption of future auditing or accounting standards issued by the Public Company Accounting Oversight Board or the Financial Accounting Standards Board or other standard-setting bodies; |
|
· |
unanticipated changes in industry trends and ratings assigned by nationally recognized rating organizations; |
~ 34 ~
|
· |
adverse litigation or arbitration results; and |
|
· |
adverse changes in applicable laws, regulations or rules governing insurance holding companies and insurance companies, and environmental, tax or accounting matters including limitations on premium levels, increases in minimum capital and reserves, and other financial viability requirements, and changes that affect the cost of, or demand for our products. |
Because forward-looking information is subject to various risks and uncertainties, actual results may differ materially from that expressed or implied by the forward-looking information.
ALL SUBSEQUENT WRITTEN AND ORAL FORWARD-LOOKING INFORMATION ATTRIBUTABLE TO ICC HOLDINGS, INC OR ANY PERSON ACTING ON OUR BEHALF IS EXPRESSLY QUALIFIED IN ITS ENTIRETY BY THE CAUTIONARY STATEMENTS CONTAINED OR REFERRED TO IN THIS SECTION.
Item 4. Mine Safety Disclosures
Not applicable.
~ 35 ~
Item 5. Market for Registrant’s Common Equity, Related Stockholder Matters and Issuer Purchases of Equity Securities
In March 2017, the Company completed its IPO. The Company’s common stock trades on the NASDAQ Capital Market under the symbol “ICCH.” As of March 28, 2017, there were approximately 450 registered holders of the Company’s common stock.
Use of Proceeds from Initial Public Offering of Common Stock
The Registration Statement on Form S-1 (File No. 333-214081) for the IPO of our common stock was declared effective by the SEC on February 14, 2017. There has been no material change in the planned use of proceeds from our initial public offering as described in our final prospectus filed with the SEC on February 13, 2017, pursuant to Rule 424(b)(4).
~ 36 ~
Item 6. Selected Financial Data
The following table sets forth selected financial data for ICC prior to the offering. The selected statements of operations and expenses data for each of the years ended December 31, 2016 and 2015 and the selected balance sheet data as of December 31, 2016 and 2015 are derived from the audited consolidated financial statements of ICC and its subsidiaries contained herein. This data should be read in conjunction with “Management’s Discussion and Analysis of Financial Condition and Results of Operations” and our financial statements and the related notes thereto included elsewhere in this report.
We evaluate our insurance operations by monitoring certain key measures of growth and profitability. In addition to GAAP measures, we utilize certain non-GAAP financial measures that we believe are valuable in managing our business and for providing comparisons to our peers. These non-GAAP measures are loss and settlement expense ratios, expense ratios and combined ratios, written premiums, and net written premiums to statutory surplus ratio.
These historical results are not necessarily indicative of future results.
The selected historical financial data of ICC Holdings, Inc. have not been presented as ICC Holdings, Inc. is a newly incorporated entity, has had no business transactions or activities to date and had no assets or liabilities during the periods presented in this section.
|
|
At or for the years ended December 31, |
||||||||
|
(In thousands) |
2016 |
2015 |
2014 |
||||||
|
Statement of Earnings Data: |
|||||||||
|
Direct premiums written |
$ |
51,031 |
$ |
49,047 |
$ |
46,340 | |||
|
Net premiums written |
$ |
43,227 |
$ |
41,631 |
$ |
41,077 | |||
|
Net premiums earned |
$ |
42,611 |
$ |
40,220 |
$ |
38,121 | |||
|
Net investment income |
1,968 | 1,333 | 1,141 | ||||||
|
Net realized investment gains |
37 | 81 | 459 | ||||||
|
Other income |
255 | 189 | 112 | ||||||
|
Consolidated revenue |
$ |
44,871 |
$ |
41,823 |
$ |
39,833 | |||
|
Expenses: |
|||||||||
|
Losses and settlement expenses |
$ |
24,345 |
$ |
23,801 |
$ |
22,748 | |||
|
Amortization of deferred acquisition costs |
7,125 | 6,814 | 6,821 | ||||||
|
Underwriting and administrative expense |
8,724 | 7,742 | 7,501 | ||||||
|
Other operating expenses |
690 | 450 | 398 | ||||||
|
Total expenses |
$ |
40,884 |
$ |
38,806 |
$ |
37,469 | |||
|
Earnings before income taxes |
$ |
3,987 |
$ |
3,017 |
$ |
2,364 | |||
|
Income tax expense |
1,177 | 862 | 779 | ||||||
|
Net earnings |
$ |
2,810 |
$ |
2,155 |
$ |
1,585 | |||
~ 37 ~
|
|
At or for the years ended December 31, |
||||||||
|
(In thousands) |
2016 |
2015 |
2014 |
||||||
|
Balance Sheet Data: |
|||||||||
|
Total investments, cash and cash equivalents |
$ |
80,499 |
$ |
76,821 |
$ |
72,917 | |||
|
Premiums receivable, net of allowance |
17,479 | 15,638 | 14,522 | ||||||
|
Reinsurance receivable |
12,115 | 19,535 | 25,855 | ||||||
|
Total assets |
122,160 | 123,373 | 123,428 | ||||||
|
Unpaid loss and settlemeent expenses |
52,817 | 61,056 | 64,617 | ||||||
|
Unearned premiums |
24,778 | 23,948 | 22,498 | ||||||
|
Total liabilities |
88,560 | 93,208 | 94,393 | ||||||
|
Equity |
33,600 | 30,166 | 29,035 | ||||||
|
Non-GAAP Ratios: |
|||||||||
|
Losses and settlement expense ratio1 |
57.13% | 59.18% | 59.67% | ||||||
|
Expense ratio2 |
37.19% | 36.19% | 37.57% | ||||||
|
Combined ratio3 |
94.32% | 95.37% | 97.24% | ||||||
|
Return on average equity |
8.81% | 7.28% | 5.74% | ||||||
|
Statutory Data: |
|||||||||
|
Statutory net income (loss) |
$ |
3,446 |
$ |
1,849 |
$ |
1,381 | |||
|
Statutory surplus |
29,957 | 26,856 | 25,193 | ||||||
|
Ratio of net premiums written to statutory surplus4 |
144.30% | 155.02% | 163.05% | ||||||
|
|
|||||||||
|
|
|||||||||
|
1Calculated by dividing loss and settlement expenses by net premiums earned. |
|||||||||
|
2Calculated by dividing amortization of deferred policy acquisition costs and underwriting and administrative expenses by net premiums earned. |
|||||||||
|
3The sum of the losses and settlement expense ratio and the expense ratio. A combined ratio of under 100% indicates an underwriting profit. A combined ratio over 100% indicates an underwriting loss. |
|||||||||
~ 38 ~
Item 7. Management’s Discussion and Analysis of Financial Condition and Results of Operations
The following discussion and analysis of our financial condition and results of operations should be read in conjunction with the financial statements and accompanying notes included elsewhere in this Form 10-K. Some of the information contained in this discussion and analysis or set forth elsewhere in this Form 10-K constitutes forward-looking information that involves risks and uncertainties. Please see Item 3A. Forward-Looking Information and Item 1A. Risk Factors for more information. Please see Item 1A. Risk Factors for a discussion of important factors that could cause actual results to differ materially from the results described, or implied by, the forward-looking statements contained herein.
Overview
ICC is a regional property and casualty insurance company incorporated in Illinois and focused exclusively on the food and beverage industry. On the effective date of the conversion, ICC became a wholly owned subsidiary of ICC Holdings, Inc. The consolidated financial statements of ICC prior to the conversion will become the consolidated financial statements of ICC Holdings, Inc. upon completion of the conversion.
For the year ended December 31, 2016, we had direct written premium of $51.0 million, net premiums earned of $42.6 million, and net income of $2.8 million. For the year ended December 31, 2015, we had direct premiums written of $49.0 million, net premiums earned of $40.2 million, and net income of $2.2 million. At December 31, 2016, we had total assets of $122.2 million and equity of $33.6 million. At December 31, 2015 we had total assets of $123.4 million and equity of $30.2 million.
We are an “emerging growth company” as defined in the JOBS Act, and we may take advantage of certain exemptions from various reporting requirements that are applicable to other public companies that are not “emerging growth companies” including, but not limited to: not required to comply with the auditor attestation requirements of Section 404 of the Sarbanes-Oxley Act; reduced disclosure obligations regarding executive compensation in our periodic reports and proxy statements; exemptions from the requirements of holding an annual non-binding advisory vote on executive compensation and nonbinding stockholder approval of any golden parachute payments not previously approved.
In addition, Section 107 of the JOBS Act also provides that an “emerging growth company” can take advantage of the extended transition period provided in Section 7(a)(2)(B) of the Securities Act for complying with new or revised accounting standards. In other words, an “emerging growth company” can delay the adoption of certain accounting standards until those standards would otherwise apply to private companies. We have taken advantage of the extended transition period provided by Section 107 of the JOBS Act. We decided to comply with the effective dates for financial accounting standards applicable to emerging growth companies at a later date in compliance with the requirements in Sections 107(b)(2) and (3) of the JOBS Act. Such decision is irrevocable.
Principal Revenue and Expense Items
We derive our revenue primarily from premiums earned, net investment income and net realized gains (losses) from investments.
Gross and net premiums written
Gross premiums written is equal to direct and assumed premiums before the effect of ceded reinsurance. Net premiums written is the difference between gross premiums written and premiums ceded or paid to reinsurers (ceded premiums written).
Premiums earned
Premiums earned is the earned portion of our net premiums written. Gross premiums written include all premiums recorded by an insurance company during a specified policy period. Insurance premiums on property and casualty insurance contracts are recognized in proportion to the underlying risk insured and are earned ratably over the duration of the policies. At the end of each accounting period, the portion of the premiums that is not yet earned is included in unearned premiums and is realized as revenue in subsequent periods over the remaining term of the policy. Our policies typically have a term of twelve months. Thus, for example, for a policy that is written on July 1, 2016, one-half of the premiums would be earned in 2016 and the other half would be earned in 2017.
~ 39 ~
Net investment income and net realized gains (losses) on investments
We invest our surplus and the funds supporting our insurance liabilities (including unearned premiums and unpaid loss and settlement expenses) in cash, cash equivalents, equities, fixed maturity securities and real estate. Investment income includes interest and dividends earned on invested assets. Net realized gains and losses on invested assets are reported separately from net investment income. We recognize realized gains when invested assets are sold for an amount greater than their cost or amortized cost (in the case of fixed maturity securities) and recognize realized losses when investment securities are written down as a result of an other than temporary impairment or sold for an amount less than their cost or amortized cost, as applicable. Our portfolio of investment securities is managed by an independent third party and manager specializing in the insurance industry.
ICC’s expenses consist primarily of:
Loss and settlement expense
Loss and settlement expenses represent the largest expense item and include: (1) claim payments made, (2) estimates for future claim payments and changes in those estimates for prior periods, and (3) costs associated with investigating, defending and adjusting claims.
Amortization of deferred policy acquisition costs and underwriting and administrative expenses
Expenses incurred to underwrite risks are referred to as policy acquisition expenses. Variable policy acquisition costs consist of commission expenses, premium taxes and certain other underwriting expenses that vary with and are primarily related to the writing and acquisition of new and renewal business. These policy acquisition costs are deferred and amortized over the effective period of the related insurance policies. Fixed policy acquisition costs, referred to herein as underwriting and administrative expenses are expensed as incurred. These costs include salaries, rent, office supplies, depreciation and all other operating expenses not otherwise classified separately.
Income taxes
We use the asset and liability method of accounting for income taxes. Deferred income taxes arise from the recognition of temporary differences between financial statement carrying amounts and the tax bases of our assets and liabilities. A valuation allowance is provided when it is more likely than not that some portion of the deferred tax asset will not be realized. The effect of a change in tax rates is recognized in the period of the enactment date.
Key Financial Measures
We evaluate our insurance operations by monitoring certain key measures of growth and profitability. In addition to reviewing our financial performance based on results determined in accordance with generally accepted accounting principles in the United States (GAAP), we utilize certain non-GAAP financial measures that we believe are valuable in managing our business and for comparison to our peers. These non-GAAP measures are combined ratio, written premiums, underwriting income, the loss and settlement expense ratio, the expense ratio, the ratio of net written premiums to statutory surplus and return on average equity.
We measure growth by monitoring changes in gross premiums written and net premiums written. We measure underwriting profitability by examining losses and settlement expense, underwriting expense and combined ratios. We also measure profitability by examining underwriting income (loss) and net income (loss).
Loss and settlement expense ratio
The loss and settlement expense ratio is the ratio (expressed as a percentage) of loss and settlement expenses incurred to premiums earned. We measure the loss ratio on an accident year and calendar year loss basis to measure underwriting profitability. An accident year loss ratio measures loss and settlment expenses for insured events occurring in a particular year, regardless of when they are reported, as a percentage of premiums earned during that year. A calendar year loss ratio measures loss and settlement expense for insured events occurring during a particular year and the change in loss reserves from prior accident years as a percentage of premiums earned during that year.
~ 40 ~
Expense ratio
The underwriting expense ratio is the ratio (expressed as a percentage) of amortization of deferred policy acquisition costs and net underwriting and administrative expenses (attributable to insurance operations) to premiums earned, and measures our operational efficiency in producing, underwriting and administering our insurance business.
GAAP combined ratio
Our GAAP combined ratio is the sum of the loss and settlement expense ratio and the expense ratio and measures our overall underwriting profit. If the GAAP combined ratio is below 100%, we are making an underwriting profit. If our combined ratio is at or above 100%, we are not profitable without investment income and may not be profitable if investment income is insufficient.
Net premiums written to statutory surplus ratio
The net premiums written to statutory surplus ratio represents the ratio of net premiums written, after reinsurance ceded, to statutory surplus. This ratio measures our exposure to pricing errors in our current book of business. The higher the ratio, the greater the impact on surplus should pricing prove inadequate.
Underwriting income (loss)
Underwriting income (loss) measures the pre-tax profitability of our insurance operations. It is derived by subtracting loss and settlement expense, amortization of deferred policy acquisition costs, and underwriting and administrative expenses from earned premiums. Each of these items is presented as a caption in our statements of earnings.
Net earnings (loss) and return on average equity
We use net earnings (loss) to measure our profit and return on average equity to measure our effectiveness in utilizing equity to generate net income. In determining return on average equity for a given year, net earnings (loss) is divided by the average of the beginning and ending equity for that year.
Critical Accounting Policies
General
The preparation of financial statements in accordance with GAAP requires both the use of estimates and judgment relative to the application of appropriate accounting policies. We are required to make estimates and assumptions in certain circumstances that affect amounts reported in our financial statements and related footnotes. We evaluate these estimates and assumptions on an on-going basis based on historical developments, market conditions, industry trends and other information that we believe to be reasonable under the circumstances. There can be no assurance that actual results will conform to our estimates and assumptions and that reported results of operations will not be materially adversely affected by the need to make accounting adjustments to reflect changes in these estimates and assumptions from time to time. We believe the following policies are the most sensitive to estimates and judgments.
Investments
The Company classifies its investments in all debt and equity securities as available-for-sale.
Available-for-Sale Securities—Debt and equity securities are classified as available-for-sale and reported at fair value. Unrealized gains and losses on these securities are excluded from net earnings but are recorded as a separate component of comprehensive earnings and policyholders’ equity, net of deferred income taxes.
Other Than Temporary Impairment—Under current accounting standards, an OTTI write-down of debt securities, where fair value is below amortized cost, is triggered by circumstances where (1) an entity has the intent to sell a security, (2) it is more likely than not that the entity will be required to sell the security before recovery of its amortized cost basis or (3) the entity does not expect to recover the entire amortized cost basis of the security. If an entity intends to sell a security or if it is more likely than not the entity will be required to sell the security before recovery, an OTTI write-down is recognized in earnings equal to the difference between the security’s amortized cost and its fair value. If an entity does not intend to sell the security or it is not more likely than not that it will be required to sell the security before recovery, the OTTI write-down is separated into an amount representing the credit loss, which is recognized in earnings, and the amount related to all other
~ 41 ~
factors, which is recognized in other comprehensive income. Impairment losses result in a reduction of the underlying investment’s cost basis.
The Company regularly evaluates its fixed income and equity securities using both quantitative and qualitative criteria to determine impairment losses for other-than-temporary declines in the fair value of the investments. The following are the key factors for determining if a security is other-than-temporarily impaired:
|
· |
The extent to which the fair value is less than cost, |
|
· |
The assessment of significant adverse changes to the cash flows on a fixed income investment, |
|
· |
The occurrence of a discrete credit event resulting in the issuer defaulting on a material obligation, the issuer seeking protection from creditors under the bankruptcy laws, the issuer proposing a voluntary reorganization under which creditors are asked to exchange their claims for cash or securities having a fair value substantially lower than par value, |
|
· |
The probability that the Company will recover the entire amortized cost basis of the fixed income securities prior to maturity, |
|
· |
The ability and intent to hold fixed income securities until maturity or |
|
· |
For equity securities, the expectation of recovery to cost within a reasonable period of time. |
Quantitative and qualitative criteria are considered during this process to varying degrees depending on the sector the analysis is being performed:
Corporates—The Company performs a qualitative evaluation of holdings that fall below the price threshold. The analysis begins with an opinion of industry and competitive position. This includes an assessment of factors that enable the profit structure of the business (e.g., reserve profile for exploration and production companies), competitive advantage (e.g., distribution system), management strategy, and an analysis of trends in return on invested capital. Analysts may also review other factors to determine whether an impairment exists including liquidity, asset value cash flow generation, and industry multiples.
Municipals—The Company analyzes the screened impairment candidates on a quantitative and qualitative basis. This includes an assessment of the factors that may be contributing to the unrealized loss and whether the recovery value is greater or less than current market value.
Structured Securities—The “stated assumptions” analytic approach relies on actual 6-month average collateral performance measures (voluntary prepayment rate, gross default rate, and loss severity) sourced through third party data providers or remittance reports. The analysis applies the stated assumptions throughout the remaining term of the transaction using forecasted cash flows, which are then applied through the transaction structure (reflecting the priority of payments and performance triggers) to determine whether there is a loss to the security (“Loss to Tranche”). For securities or sectors for which no actual loss or minimal loss has been observed (certain Prime Residential Mortgage Backed Securities (RMBS) and Commercial Mortgage Backed Securities (CMBS), for example), sector-based assumptions are applied or an alternative quantitative or qualitative analysis is performed.
Property Held for Investment—Property held for investment purposes is initially recorded at the purchase price, which is generally fair value, and is subsequently reported at cost less accumulated depreciation. Buildings are depreciated on a straight-line bases over the estimated useful lives of the building, which we estimate to be 39 years. Income from property held for investment is reported as net investment income
Investment Income—Interest on fixed maturities and short-term investments is credited to earnings on an accrual basis. Premiums and discounts are amortized or accreted over the lives of the related fixed maturities. Dividends on equity securities are credited to earnings on the ex-dividend date. Realized gains and losses on disposition of investments are based on specific identification of the investments sold on the settlement date, which does not differ significantly from trade date accounting.
Cash and Cash Equivalents
Cash consists of uninvested balances in bank accounts. Cash equivalents consist of investments with original maturities of 90 days or less, primarily AAA-rated prime and government money market funds. Cash equivalents are carried at cost, which approximates fair value. The Company has not experienced losses on these instruments.
~ 42 ~
Loss and Settlement Expense Reserves
We maintain reserves for the payment of claims (incurred losses) and expenses related to adjusting those claims (loss settlement expenses). Our loss reserves consist of case reserves, which are reserves for claims that have been reported to us, loss settlement expense reserve, which includes all defense and litigation-related expenses, whether internal or external to us, and reserves for claims that have been incurred but have not yet been reported or for case reserve deficiencies or redundancies (IBNR).
When a claim is reported to us, our claims personnel establish a case reserve for the estimated amount of the ultimate payment. The amount of the loss reserve for the reported claim is based primarily upon a claim-by-claim evaluation of coverage, liability, injury severity or scope of property damage, and any other information considered pertinent to estimating the exposure presented by the claim. Each claim is settled individually based upon its merits, and some claims may take years to settle, especially if legal action is involved. Case reserves are reviewed on a regular basis and are updated as new data becomes available.
In addition to case reserves, we maintain an estimate of reserves for loss and settlement expenses incurred but not reported. Some claims may not be reported for several years. As a result, the liability for unpaid loss and settlement expense reserves includes significant estimates for IBNR.
We utilize an independent actuary to assist with the estimation of our loss and settlement expense reserves bi-annually. This actuary prepares estimates of the ultimate liability for unpaid losses and settlement expenses based on established actuarial methods described below. Our management reviews these estimates and supplements the actuarial analysis with information not fully incorporated into the actuarially based estimate, such as changes in the external business environment and changes in internal company processes and strategy. We may adjust the actuarial estimates based on this supplemental information in order to arrive at the amount recorded in the financial statements.
Reserving Methods
In developing our loss and settlement expense reserve estimates, we relied upon five widely used and accepted loss reserving methods (described below). Based on the deemed predictive qualities of each of the applied methods, we selected estimated ultimates by year in order to determine our reserve estimates. Our estimates can be considered actuarial central estimates, which means that they represent an expected value over the range of reasonably possible outcomes.
Loss Development Methods (Paid and Incurred Loss and Settlement Expense)—Loss development ultimates are determined by multiplying current reported values by cumulative loss development factors. Incremental loss development factors are determined by analyzing historical development of losses and assuming that future development will mimic historical. Cumulative development factors are calculated from the selection of incremental factors.
This method is also applied to incurred settlement expense to incurred loss ratios and paid settlement expense to paid loss ratios to estimate ultimate settlement expense.
Loss development methods are particularly appropriate when historical loss development patterns have been relatively stable and can be predicted with reasonable accuracy.
Expected Loss Ratio Method— The expected loss ratio method applies a selected ultimate loss ratio to premium to determine ultimate losses and settlement expenses. Expected loss ratios for 2007 and prior were selected based on the results of the loss development methods discussed above, industry experience, actual loss experience of ICC to date and general industry conditions. Beginning with 2008, expected loss ratios have been calculated based on the prior expected loss ratios, rate changes and loss trend.
Bornhuetter-Ferguson (B-F) Methods (Paid and Incurred Loss)—The Loss Development Methods rely heavily on data as of the most recent evaluation date, and a relatively small swing in early reported (or paid) losses may result in a large swing in the ultimate loss projections. Therefore, other methods may also be considered.
The B-F Methods offer a blend of stability and responsiveness by estimating ultimate losses as a weighted combination of an expected loss estimate and current loss data. The weight applied to the expected loss estimate is based on the appropriate cumulative loss development factor from the Loss Development Methods. This percentage is multiplied by expected losses to determine expected future development. This estimate of future loss development is then added to losses as of the current evaluation date to project ultimate losses.
~ 43 ~
A&OE Method—During 2012, we began to implement a new approach to reserving for unpaid Adjusting & Other Expenses (A&OE). This method is referred to as the “Wendy Johnson Method” where historical A&OE payments are measured against certain claim units to develop an average rate for projecting into future years. These claim units are defined as a means of measuring the overall level of claim activity in a year as follows:
Units =
2 x (Newly Reported Claims in Year X) +
(Number of Claims Open at Start of Year X)
Future A&OE costs are projected by inflating the selected average A&OE per unit rate, 1.0% annually, against future units calculated by claims runoff patterns.
Range of Estimates
In addition to our actuarial central estimate, we have also developed a range of estimates. This range is not designed to represent minimum or maximum possible outcomes. It is developed to represent low and high ends for a reasonable range of expected outcomes given the selection of alternative, but reasonable assumptions. Actual results may fall outside of this range.
High and low net reserve estimates were developed by stressing our expected loss ratio and loss development factor selections. By applying a factor to increase (and decrease) these assumptions, we developed high (and low) ultimate loss and settlement expense estimates. These estimates, along with paid and incurred loss information, result in a range of reserves. The gross reserve range is based on selected percentages which produce a range which is slightly wider than the net range.
We estimate IBNR reserves by first deriving an actuarially based estimate of the ultimate cost of total loss and settlement expenses incurred by line of business as of the financial statement date. We then reduce the estimated ultimate loss and settlement expenses by loss and settlement expense payments and case reserves carried as of the financial statement date. The actuarially determined estimate is based upon indications from one of the above actuarial methodologies or uses a weighted average of these results. The specific method used to estimate the ultimate losses for individual lines of business, or individual accident years within a line of business, will vary depending on the judgment of the actuary as to what is the most appropriate method for a line of business’ unique characteristics. Finally, we consider other factors that impact reserves that are not fully incorporated in the actuarially based estimate, such as changes in the external business environment and changes in internal company processes and strategy.
The process of estimating loss reserves involves a high degree of judgment and is subject to a number of variables. These variables can be affected by both internal and external events, such as changes in claims handling procedures, economic inflation, legal trends, and legislative changes, among others. The impact of many of these items on ultimate costs for claims and claim adjustment expenses is difficult to estimate. Loss reserve estimation difficulties also differ significantly by line of business due to differences in claim complexity, the volume of claims, the potential severity of individual claims, the determination of occurrence date for a claim, and reporting lags (the time between the occurrence of the policyholder event and when it is actually reported to the insurer). Informed judgment is applied throughout the process, including the application of various individual experiences and expertise to multiple sets of data and analyses. We continually refine our loss reserve estimates in a regular ongoing process as historical loss experience develops and additional claims are reported and settled. We consider all significant facts and circumstances known at the time loss reserves are established.
Due to the inherent uncertainty underlying loss reserve estimates, final resolution of the estimated liability for loss and settlement expenses may be higher or lower than the related loss reserves at the reporting date. Therefore, actual paid losses, as claims are settled in the future, may be materially higher or lower in amount than current loss reserves. We reflect adjustments to loss reserves in the results of operations in the period the estimates are changed.
We accrue liabilities for unpaid loss and settlment expenses based upon estimates of the ultimate amount payable.
Policy Acquisition Costs
The Company defers commissions, premium taxes, and certain other costs that are incrementally or directly related to the successful acquisition of new or renewal insurance contracts. Acquisition-related costs may be deemed ineligible for deferral when they are based on contingent or performance criteria beyond the basic acquisition of the insurance contract or when efforts to obtain or renew the insurance contract are unsuccessful. All eligible costs are capitalized and charged to expense in proportion to premium revenue recognized. The method followed in computing deferred policy acquisition costs limits the amount of such deferred costs to their estimated realizable value. This deferral methodology applies to both gross and ceded premiums and acquisition costs.
~ 44 ~
Premiums
Premiums are recognized ratably over the term of the contracts, net of ceded reinsurance. Unearned premiums represent the portion of premiums written relative to the unexpired terms of coverage. Unearned premiums are calculated on a daily pro rata basis.
Reinsurance
Ceded unearned premiums and reinsurance balances recoverable on paid and unpaid losses and settlement expenses are reported separately as assets instead of being netted with the related liabilities, since reinsurance does not relieve us of our legal liability to our policyholders.
Quarterly, the Company monitors the financial condition of its reinsurers. The Company’s monitoring efforts include, but are not limited to, the review of annual summarized financial data and analysis of the credit risk associated with reinsurance balances recoverable by monitoring the A.M. Best and Standard & Poor’s (S&P) ratings. In addition, the Company subjects its reinsurance recoverables to detailed recoverable tests, including an analysis based on average default by A.M. Best rating. Based upon the review and testing, the Company’s policy is to charge to earnings, in the form of an allowance, an estimate of unrecoverable amounts from reinsurers. This allowance is reviewed on an ongoing basis to ensure that the amount makes a reasonable provision for reinsurance balances that the Company may be unable to recover.
Income Taxes
The Company files a consolidated federal income tax return. Federal income taxes are accounted for using the asset and liability method under which deferred income taxes are recognized for the tax consequences of “temporary differences” by applying enacted statutory tax rates applicable to future years to differences between the financial statement carrying amounts and the tax bases of existing assets and liabilities, operating losses and tax credit carry forwards. The effect on deferred taxes for a change in tax rates is recognized in income in the period that includes the enactment date. Deferred tax assets are reduced by a valuation allowance if it is more likely than not all or some of the deferred tax assets will not be realized.
The Company considers uncertainties in income taxes and recognizes those in its financial statements as required. As it relates to uncertainties in income taxes, unrecognized tax benefits, including interest and penalty accruals, are not considered material to the consolidated financial statements. Also, no tax uncertainties are expected to result in significant increases or decreases to unrecognized tax benefits within the next 12-month period. Penalties and interest related to income tax uncertainties, should they occur, would be included in income tax expense in the period in which they are incurred.
As an insurance company, the Company is subject to minimal state income tax liabilities. On a state basis, since the majority of income is from insurance operations, the Company pays premium taxes in lieu of state income tax. Premium taxes are a component of policy acquisition costs and calculated as a percentage of gross premiums written.
Comprehensive Earnings
Comprehensive earnings include net earnings plus unrealized gains/losses on available-for-sale investment securities, net of tax. In reporting the components of comprehensive earnings on a net basis in the statement of earnings, the Company used a 34% tax rate.
Results of Operations
Our results of operations are influenced by factors affecting the property and casualty insurance industry in general. The operating results of the United States property and casualty insurance industry are subject to significant variations due to competition, weather, catastrophic events, regulation, general economic conditions, judicial trends, fluctuations in interest rates and other changes in the investment environment.
Our premium growth and underwriting results have been, and continue to be, influenced by market conditions. Pricing in the property and casualty insurance industry historically has been cyclical. During a soft market cycle, price competition is more significant than during a hard market cycle and makes it difficult to attract and retain properly priced commercial business. A hard market typically has a positive effect on premium growth.
~ 45 ~
The major components of operating revenues and net earnings (loss) are as follows:
|
|
Years ended December 31, |
|||||
|
(In thousands) |
2016 |
2015 |
||||
|
Revenues |
||||||
|
Total premiums earned |
$ |
42,611 |
$ |
40,220 | ||
|
Investment income, net of investment expense |
1,968 | 1,333 | ||||
|
Realized investment gains (losses), net |
37 | 81 | ||||
|
Other income |
255 | 189 | ||||
|
Total revenues |
$ |
44,871 |
$ |
41,823 | ||
|
Summarized components of net earnings (loss) |
||||||
|
Underwriting income |
$ |
2,417 |
$ |
1,864 | ||
|
Investment income, net of investment expense |
1,968 | 1,333 | ||||
|
Realized investment gains, net |
37 | 81 | ||||
|
Other income |
255 | 189 | ||||
|
General corporate expenses |
464 | 314 | ||||
|
Interest expense |
226 | 136 | ||||
|
Earnings, before income taxes |
3,987 | 3,017 | ||||
|
Income tax expense |
1,177 | 862 | ||||
|
Net earnings |
$ |
2,810 |
$ |
2,155 | ||
|
Total other comprehensive earnings (loss) |
624 | (1,024) | ||||
|
Comprehensive earnings |
$ |
3,434 |
$ |
1,131 | ||
Year Ended December 31, 2016 Compared to Year Ended December 31, 2015
Premiums
Direct premiums written increased by $2.0 million, or 4.0%, primarily from organic growth from 2015 to 2016, while net written premium was essentially flat, growing by $1.6, or 3.8%, during the same period. Net premiums earned grew by $2.4 million, or 5.9%, for the year ended December 31, 2016 as compared to 2015 primarily due to increased organic growth and lower levels of premium ceded to reinsurance.
For the year ended December 31, 2016, we ceded to reinsurers $7.9 million of earned premiums, compared to $7.7 million of earned premiums for the year ended December 31, 2015. Ceded earned premiums as a percent of direct premiums written were 15.5% in 2016, and 15.7% in 2015. This favorable, slight decrease is a result of an overall softer reinsurance market pricing.
Premiums are earned ratably over the term of the policy whereas written premiums are reflected on the effective date of the policy.
Other income
Substantially all other income is derived from policies we write and represents additional charges to policyholders for services outside of the premium charge, such as installment billing or policy issuance costs. Other income grew by $66,000, or 34.9%, in 2016 as compared to 2015 primarily as a result of the growth in premium volume.
~ 46 ~
Unpaid Losses and Settlement Expenses
The following table details our unpaid losses and settlement expenses.
|
(In thousands) |
2016 |
2015 |
||||
|
Unpaid losses and settlement expense - beginning of the period: |
||||||
|
Gross |
$ |
61,056 |
$ |
64,617 | ||
|
Less: Ceded |
19,158 | 25,822 | ||||
|
Net |
41,898 | 38,795 | ||||
|
Increase (decrease) in incurred losses and settlement expense: |
||||||
|
Current year |
25,620 | 24,293 | ||||
|
Prior years |
(1,275) | (493) | ||||
|
Total incurred |
24,345 | 23,800 | ||||
|
Deduct: Loss and settlement expense payments for claims incurred: |
||||||
|
Current year |
7,649 | 6,466 | ||||
|
Prior years |
17,892 | 14,231 | ||||
|
Total paid |
25,541 | 20,697 | ||||
|
Net unpaid losses and settlement expense - end of the period |
40,702 | 41,898 | ||||
|
Plus: Reinsurance recoverable on unpaid losses |
12,115 | 19,158 | ||||
|
Gross unpaid losses and settlement expense - end of the period |
$ |
52,817 |
$ |
61,056 | ||
Differences from the initial reserve estimates emerged as changes in the ultimate loss estimates as those estimates were updated through the reserve analysis process. The recognition of the changes in initial reserve estimates occurred over time as claims were reported, initial case reserves were established, initial reserves were reviewed in light of additional information and ultimate payments were made on the collective set of claims incurred as of that evaluation date. The new information on the ultimate settlement value of claims is updated until all claims in a defined set are settled. As a small specialty insurer with a niche product portfolio, our experience will ordinarily exhibit fluctuations from period to period. While management attempts to identify and react to systematic changes in the loss environment, management must also consider the volume of experience directly available to us and interpret any particular period’s indications with a realistic technical understanding of the reliability of those observations.
For calendar year 2016, we experienced favorable development relative to prior years’ reserve estimates in the casualty line of business primarily from the 2015 accident year. Liquor Liability and Workers’ Compensation were the largest contributors to the favorable development, partially offset by adverse development in BOP Liability.
For calendar year 2015, the Company experienced favorable development relative to prior years’ reserve estimates in its property line of business primarily from the 2014 accident year. This was partially offset by adverse development in the casualty line of business in Liquor Liability, with approximately 89.4% of the development coming from this business.
Policy Acquisition Costs and Expense Ratio
Policy acquisition costs are costs we incur to issue policies, which include commissions, premium taxes, underwriting reports, and underwriter compensation costs. The Company offsets the direct commissions it pays with ceded commissions it receives from reinsurers. Policy acquisition costs were increased by $1.3 million, or 8.9%.
Our expense ratio is calculated by dividing the sum of policy acquisition costs and operating expenses by net earned premiums. We use the expense ratio to evaluate the operating efficiency of our consolidated operations. Costs that cannot be readily identifiable as a direct cost of a product line remain in Corporate and Other.
Our expense ratio increased 100 basis points from 36.2% to 37.2% for the year ended December 31, 2016 as compared to 2015, due primarily to the increased cost of our self-funded healthcare plan as well as costs related to increased use of temporary employees for projectes related to our mutual-to-stock conversion. As our earned premiums grow year-over-year on an expense structure that is less variable to premium volume, we expect this trend to continue in the near future, but at a slower pace.
~ 47 ~
General Corporate Expenses
General corporate expenses consist primarily of occupancy costs, such as rent and utilities. These costs are largely fixed and, therefore, do not vary significantly with premium volume but do vary with the Company’s changes in properties held for investment. Accordingly, our general corporate expenses increased by $150,000, or 47.8%, in 2016 as compared to 2015.
Investment Income
Our investment portfolio consisted of 86.8% and 88.0% of readily marketable, investment-grade fixed-maturity securities as of December 31, 2016 and 2015, respectively. The remainder of the portfolio is comprised of rental real estate, highly liquid exchange traded funds, and preferred stock. Net investment income is primarily comprised of interest earned and dividends paid on these securities and rental income on investment real estate, net of related investment expenses, and excludes realized gains and losses.
Net investment income increased by $635,000 for the year ended December 31, 2016 as compared to 2015, primarily from the growth of the investment portfolio. Average invested assets for 2016 were $78.7 million compared to $74.9 million for 2015, an increase of $3.8 million, or 5.1%. The increase in the portfolio was primarily due to net cash provided by operating activities of $4.6 million.
For additional information, see Item 1. Business — Investments above.
Interest Expense
Interest expense increased to $226,000 for the year ended December 31, 2016 from $136,000 for the year ended December 31, 2015. This 66.2% increase year over year reflects the Company’s financing of certain assets under financial sales-leaseback transactions in September 2015, again in March of 2016 and most recently from a debt agreement in September 2016. The Company does not anticipate expanding these borrowings over the next twelve months.
Income Tax Expense
We reported an income tax expense of $1.2 million in 2016, as compared to an income tax expense of $862,000 in 2015. The income tax expense increase for 2016 relates to an increase in earnings before income taxes in 2016 compared to 2015.
The Company has not established a valuation allowance against any of the net deferred tax assets.
~ 48 ~
Financial Position
The major components of our assets and liabilities are as follows:
|
|
December 31, |
|||||
|
(In thousands) |
2016 |
2015 |
||||
|
Assets |
||||||
|
Investments and cash: |
||||||
|
Available for sale securities, at fair value |
||||||
|
Fixed maturity securities (amortized cost - $62,929 at 12/31/2016 |
$ |
64,134 |
$ |
65,195 | ||
|
and $63,995 at 12/31/2015) |
||||||
|
Equity securities (cost - $6,312 at 12/31/2016 and $9,282 at 12/31/2015) |
6,983 | 8,885 | ||||
|
Preferred Stocks (cost - $2,925 at12/31/2016 and $0 at 12/31/2015) |
2,798 |
— |
||||
|
Property held for investment, at cost, net of accumulated depreciation of |
2,207 | 561 | ||||
|
$51 at 12/31/2016 and $3 at 12/31/2015 |
||||||
|
Cash and cash equivalents |
4,377 | 2,180 | ||||
|
Total investments and cash |
80,499 | 76,821 | ||||
|
Accrued investment income |
524 | 581 | ||||
|
Premiums and reinsurance balances receivable, net of allowances for |
17,480 | 15,638 | ||||
|
uncollectible amounts of $50 at 12/31/2016 and $100 at 12/31/2015 |
||||||
|
Ceded unearned premiums |
271 | 57 | ||||
|
Reinsurance balances recoverable on unpaid losses and settlement |
12,115 | 19,535 | ||||
|
expenses, net of allowances for uncollectible amounts of |
||||||
|
$0 at 12/31/2016 and 12/31/2015 |
||||||
|
Current federal income taxes |
149 | 773 | ||||
|
Net deferred federal income taxes |
888 | 1,401 | ||||
|
Deferred policy acquisition costs, net |
4,163 | 3,983 | ||||
|
Property and equipment, at cost, net of accumulated depreciation of |
3,720 | 3,680 | ||||
|
$4,308 at 12/31/2016 and $3,553 at 12/31/2015 |
||||||
|
Other assets |
2,351 | 905 | ||||
|
Total assets |
$ |
122,160 |
$ |
123,374 | ||
|
|
||||||
|
Liabilities and Equity |
||||||
|
Liabilities: |
||||||
|
Unpaid losses and settlement expenses |
$ |
52,817 |
$ |
61,056 | ||
|
Unearned premiums |
24,778 | 23,948 | ||||
|
Reinsurance balances payable |
110 |
— |
||||
|
Corporate debt |
3,787 | 3,274 | ||||
|
Accrued expenses |
4,827 | 4,096 | ||||
|
Other liabilities |
2,241 | 834 | ||||
|
Total liabilities |
88,560 | 93,208 | ||||
|
|
||||||
|
Equity: |
||||||
|
Accumulated other comprehensive earnings, net of tax |
1,154 | 530 | ||||
|
Retained earnings |
32,446 | 29,636 | ||||
|
Total equity |
33,600 | 30,166 | ||||
|
Total liabilities and equity |
$ |
122,160 |
$ |
123,374 | ||
~ 49 ~
Unpaid Losses and Settlement Expense
Our reserves for unpaid loss and settlement expense are summarized below:
|
|
December 31, |
||||
|
(In thousands) |
2016 |
2015 |
|||
|
Case reserves |
$ |
20,171 |
$ |
23,139 | |
|
IBNR reserves |
20,531 | 18,759 | |||
|
Net unpaid losses and settlement expense |
40,702 | 41,898 | |||
|
Reinsurance recoverable on unpaid loss and settlement expense |
12,115 | 19,158 | |||
|
Reserves for unpaid loss and settlement expense |
$ |
52,817 |
$ |
61,056 | |
Actuarial Ranges
The selection of the ultimate loss is based on information unique to each line of business and accident year and the judgment and expertise of our actuary and management.
The following table provides case and IBNR reserves for losses and settlement expenses as of December 31, 2016 and 2015.
As of December 31, 2016
|
|
Actuarially Determinded |
|||||||||||||
|
(In thousands) |
Case Reserves |
|
IBNR Reserves |
|
Total Reserves |
|
Low |
|
High |
|||||
|
Commercial liability |
$ |
15,627 |
$ |
14,655 |
$ |
30,282 | ||||||||
|
Property |
2,652 | 4,036 | 6,688 | |||||||||||
|
Other |
1,892 | 1,840 | 3,732 | |||||||||||
|
Total net reserves |
20,171 | 20,531 | 40,702 |
$ |
36,178 |
$ |
41,107 | |||||||
|
Reinsurance recoverables |
7,595 | 4,520 | 12,115 | 9,431 | 12,637 | |||||||||
|
Gross reserves |
$ |
27,766 |
$ |
25,051 |
$ |
52,817 |
$ |
45,609 |
$ |
53,744 | ||||
As of December 31, 2015
|
|
Actuarially Determinded |
|||||||||||||
|
(In thousands) |
Case Reserves |
|
IBNR Reserves |
|
Total Reserves |
|
Low |
|
High |
|||||
|
Commercial liability |
$ |
17,713 |
$ |
13,850 |
$ |
31,563 | ||||||||
|
Property |
1,984 | 1,295 | 3,279 | |||||||||||
|
Other |
3,443 | 3,613 | 7,056 | |||||||||||
|
Total net reserves |
23,140 | 18,758 | 41,898 |
$ |
37,725 |
$ |
42,886 | |||||||
|
Reinsurance recoverables |
10,230 | 8,928 | 19,158 | 13,773 | 17,799 | |||||||||
|
Gross reserves |
$ |
33,370 |
$ |
27,686 |
$ |
61,056 |
$ |
51,498 |
$ |
60,685 | ||||
Our actuary determined a range of reasonable reserve estimates which reflect the uncertainty inherent in the loss reserve process. This range does not represent the range of all possible outcomes. We believe that the actuarially-determined ranges represent reasonably likely changes in the loss and settlement expense estimates, however actual results could differ significantly from these estimates. The range was determined by line of business and accident year after a review of the output generated by the various actuarial methods utilized. The actuary reviewed the variance around the select loss reserve estimates for each of the actuarial methods and selected reasonable low and high estimates based on his knowledge and judgment. In making these judgments the actuary typically assumed, based on his experience, that the larger the reserve the less volatility and that property reserves would exhibit less volatility than casualty reserves. In addition, when selecting these low and high estimates, the actuary considered:
|
· |
historical industry development experience in our business line; |
|
· |
historical company development experience; |
|
· |
the impact of court decisions on insurance coverage issues, which can impact the ultimate cost of settling claims; |
~ 50 ~
|
· |
changes in our internal claims processing policies and procedures; and |
|
· |
trends and risks in claim costs, such as risk that medical cost inflation could increase. |
Our actuary is required to exercise a considerable degree of judgment in the evaluation of all of these and other factors in the analysis of our loss and settlement expense reserves, and related range of anticipated losses. Because of the level of uncertainty impacting the estimation process, it is reasonably possible that different actuaries would arrive at different conclusions. The method of determining the reserve range has not changed and the reserve range generated by our actuary is consistent with the observed development of our loss reserves over the last few years.
The width of the range in reserves arises primarily because specific losses may not be known and reported for some period and the ultimate losses paid and settlement expenses incurred with respect to known losses may be larger than currently estimated. The ultimate frequency or severity of these claims can be very different than the assumptions we used in our estimation of ultimate reserves for these exposures.
Specifically, the following factors could impact the frequency and severity of claims, and therefore, the ultimate amount of loss and settlement expense paid:
|
· |
the rate of increase in labor costs, medical costs, and material costs that underlie insured risks; |
|
· |
development of risk associated with our expanding producer relationships and our growth in new states or states where we currently have small market share; and |
|
· |
impact of changes in laws or regulations. |
The estimation process for determining the liability for unpaid loss and settlement expense inherently results in adjustments each year for claims incurred (but not paid) in preceding years. Negative amounts reported for claims incurred related to prior years are a result of claims being settled for amounts less than originally estimated (favorable development). Positive amounts reported for claims incurred related to prior years are a result of claims being settled for amounts greater than originally estimated (unfavorable development). For the years ended December 31, 2016 and 2015, we experienced favorable development of $1.3 million and $0.5 million, respectively.
Potential for variability in our reserves is evidenced by this development. As further illustration of reserve variability, we initially estimated unpaid loss and settlement expense net of reinsurance at the end of 2015 at $41.9 million. As of December 31, 2016, that reserve was re-estimated at $40.6 million, which is $1.3 million, or 3.1%, lower than the initial estimate.
As discussed earlier, the estimation of our reserves is based on several actuarial methods, each of which incorporates many quantitative assumptions. The judgment of the actuary plays an important role in selecting among various loss development factors and selecting the appropriate method, or combination of methods, to use for a given accident year. The ranges presented above represent the expected variability around the actuarially determined central estimate. The total range around our actuarially determined estimate varies from (1.9)% to 11.5%. As shown in the table below, since 2011 the variance in our originally estimated accident year loss reserves has ranged from (4.0%) deficient to 12.0% redundant as of December 31, 2016.
Recent Variabilities of Incurred Losses and Settlement Expense, Net of Reinsurance
|
|
Accident Year Data |
||||||||||||||
|
(In thousands) |
2011 |
2012 |
2013 |
2014 |
2015 |
||||||||||
|
As originally estimated |
|
$ |
19,420 |
|
$ |
19,276 |
|
$ |
22,064 |
|
$ |
22,267 |
|
$ |
24,293 |
|
As estimated at December 31, 2016 |
18,290 | 19,185 | 21,589 | 23,156 | 21,374 | ||||||||||
|
Net cumulative redundancy (deficiency) |
$ |
1,130 |
$ |
91 |
$ |
475 |
$ |
(889) |
$ |
2,919 | |||||
|
% redundancy (deficiency) |
5.8% | 0.5% | 2.2% |
(4.0)% |
12.0% | ||||||||||
~ 51 ~
The table below summarizes the impact on equity, net of tax, from changes in estimates of net unpaid loss and settlement expense:
|
|
December 31, |
||||||||||
|
|
2016 |
2015 |
|||||||||
|
(In thousands) |
Aggregate Loss and Settlement Reserve |
Percentage Change in Equity |
Aggregate Loss and Settlement Reserve |
Percentage Change in Equity |
|||||||
|
Reserve Range for Unpaid Losses and Settlement Expense |
|||||||||||
|
Low End |
$ |
36,178 | 8.9% |
$ |
37,725 | 9.1% | |||||
|
Recorded |
40,702 | 0.0% | 41,898 | 0.0% | |||||||
|
High End |
41,107 |
(0.8)% |
42,886 |
(2.2)% |
|||||||
If the net loss and settlement expense reserves were recorded at the high end of the actuarially-determined range as of Decemeber 31, 2016, the loss and settlement expense reserves would increase by $405,000 before taxes. This increase in reserves would have the effect of decreasing net income and equity as of December 31, 2016 by $267,000. If the loss and settlement expense reserves were recorded at the low end of the actuarially-determined range, the net loss and settlement expense reserves at December 31, 2016 would be reduced by $4.5 million with corresponding increases in net income and equity of $3.0 million.
Investments
Our fixed maturity and equity securities investments are classified as available-for-sale and carried at estimated fair value as determined by management based upon quoted market prices or a recognized pricing service at the reporting date for those or similar investments. Changes in unrealized investment gains or losses on our investments, net of applicable income taxes, are reflected directly in equity as a component of comprehensive income (loss) and, accordingly, have no effect on net income (loss). Investment income is recognized when earned, and capital gains and losses are recognized when investments are sold, or other-than-temporarily impaired.
The fair value and unrealized losses for our securities that were temporarily impaired are as follows:
|
|
December 31, 2016 |
||||||||||||||||
|
|
Less than 12 Months |
12 Months or Longer |
Total |
||||||||||||||
|
(In thousands) |
Fair Value |
Unrealized Losses |
Fair Value |
Unrealized Losses |
Fair Value |
Unrealized Losses |
|||||||||||
|
U.S. Treasury |
$ |
994 |
$ |
(6) |
$ |
— |
$ |
— |
$ |
994 |
$ |
(6) | |||||
|
MBS/ABS/CMBS |
10,713 | (257) | 323 | (1) | 11,036 | (258) | |||||||||||
|
Corporate |
5,476 | (76) | 984 | (15) | 6,460 | (91) | |||||||||||
|
Municipal |
2,995 | (135) |
— |
— |
2,995 | (135) | |||||||||||
|
Total fixed maturities |
20,178 | (474) | 1,307 | (17) | 21,485 | (491) | |||||||||||
|
Common equity/ETF securities |
— |
— |
446 | (34) | 446 | (34) | |||||||||||
|
Preferred stocks |
2,328 | (132) |
— |
— |
2,328 | (132) | |||||||||||
|
Total temporarily impaired securities |
$ |
22,506 |
$ |
(606) |
$ |
1,753 |
$ |
(50) |
$ |
24,259 |
$ |
(656) | |||||
~ 52 ~
|
|
December 31, 2015 |
||||||||||||||||
|
|
Less than 12 Months |
12 Months or Longer |
Total |
||||||||||||||
|
(In thousands) |
Fair Value |
Unrealized Losses |
Fair Value |
Unrealized Losses |
Fair Value |
Unrealized Losses |
|||||||||||
|
U.S. Treasury |
$ |
1,233 |
$ |
(10) |
$ |
— |
$ |
— |
$ |
1,233 |
$ |
(10) | |||||
|
MBS/ABS/CMBS |
9,405 | (126) | 729 | (18) | 10,134 | (144) | |||||||||||
|
Corporate |
11,205 | (480) | 1,263 | (42) | 12,468 | (522) | |||||||||||
|
Total fixed maturities |
21,843 | (616) | 1,992 | (60) | 23,835 | (676) | |||||||||||
|
Common equity/ETF securities |
398 | (31) | 3,222 | (387) | 3,620 | (418) | |||||||||||
|
Preferred stocks |
— |
— |
— |
— |
— |
— |
|||||||||||
|
Total temporarily impaired securities |
$ |
22,241 |
$ |
(647) |
$ |
5,214 |
$ |
(447) |
$ |
27,455 |
$ |
(1,094) | |||||
The unrealized losses as of December 31, 2016 and 2015 were primarily related to changes in the interest rate environment. Fair values of interest rate sensitive instruments may be affected by increases and decreases in prevailing interest rates which generally translate, respectively, into decreases and increases in fair values of fixed maturity investments. The fair values of interest rate sensitive instruments also may be affected by the credit worthiness of the issuer, prepayment options, relative values of other investments, the liquidity of the instrument, and other general market conditions.
We monitor our investment portfolio and review securities that have experienced a decline in fair value below cost to evaluate whether the decline is other than temporary. When assessing whether the amortized cost basis of the security will be recovered, we compare the present value of the cash flows likely to be collected, based on an evaluation of all available information relevant to the collectability of the security, to the amortized cost basis of the security. The shortfall of the present value of the cash flows expected to be collected in relation to the amortized cost basis is referred to as the “credit loss.” If there is a credit loss, the impairment is considered to be other-than-temporary. If we identify that an other-than-temporary impairment loss has occurred, we then determine whether we intend to sell the security, or if it is more likely than not that we will be required to sell the security prior to recovering the amortized cost basis less any current-period credit losses. If we determine that we do not intend to sell, and it is not more likely than not that we will be required to sell the security, the amount of the impairment loss related to the credit loss will be recorded in earnings, and the remaining portion of the other-than-temporary impairment loss will be recognized in other comprehensive income (loss), net of tax. If we determine that we intend to sell the security, or that it is more likely than not that we will be required to sell the security prior to recovering its amortized cost basis less any current-period credit losses, the full amount of the other-than-temporary impairment will be recognized in earnings.
For the year ended December 31, 2016, the Company incurred $0.2 million of OTTI losses on two securities that were impaired and subsequently sold during the last three months of 2016. During 2015 the Company did not recognize any impairment losses. Adverse investment market conditions, or poor operating results of underlying investments, could result in impairment charges in the future.
We use quoted values and other data provided by independent pricing services in our process for determining fair values of our investments. The evaluations of such pricing services represent an exit price and a good faith opinion as to what a buyer in the marketplace would pay for a security in a current sale. This pricing service provides us with one quote per instrument. For fixed maturity securities that have quoted prices in active markets, market quotations are provided. For fixed maturity securities that do not trade on a daily basis, the independent pricing service prepares estimates of fair value using a wide array of observable inputs including relevant market information, benchmark curves, benchmarking of like securities, sector groupings, and matrix pricing. The observable market inputs that our independent pricing service utilizes may include (listed in order of priority for use) benchmark yields, reported trades, broker-dealer quotes, issuer spreads, two-sided markets, benchmark securities, market bids/offers, and other reference data on markets, industry, and the economy. Additionally, the independent pricing service uses an option adjusted spread model to develop prepayment and interest rate scenarios. The pricing service did not use broker quotes in determining fair values of our investments.
Should the independent pricing service be unable to provide a fair value estimate, we would attempt to obtain a non-binding fair value estimate from a number of broker-dealers and review this estimate in conjunction with a fair value estimate reported by an independent business news service or other sources. In instances where only one broker-dealer provides a fair value for a fixed maturity security, we use that estimate. In instances where we are able to obtain fair value estimates from more than one broker-dealer, we would review the range of estimates and would select the most appropriate value based on the facts and circumstances. Should neither the independent pricing service nor a broker-dealer provide a fair value estimate, we would develop a fair value estimate based on cash flow analyses and other valuation techniques that utilize certain unobservable inputs. Accordingly, we would classify such a security as a Level 3 investment.
~ 53 ~
The fair value estimates of our investments provided by the independent pricing service at December 31, 2016 and December 31, 2015, respectively, were utilized, among other resources, in reaching a conclusion as to the fair value of our investments.
Management reviews the reasonableness of the pricing provided by the independent pricing service by employing various analytical procedures. We review all securities to identify recent downgrades, significant changes in pricing, and pricing anomalies on individual securities relative to other similar securities. This will include looking for relative consistency across securities in common sectors, durations, and credit ratings. This review will also include all fixed maturity securities rated lower than “A” by Moody’s or S&P. If, after this review, management does not believe the pricing for any security is a reasonable estimate of fair value, then it will seek to resolve the discrepancy through discussions with the pricing service. In our review we did not identify any such discrepancies for the years ended December 31, 2016 and 2015, and no adjustments were made to the estimates provided by the pricing service. The classification within the fair value hierarchy of Accounting Standards Codification (ASC) Topic 820, Fair Value Measurement, is then confirmed based on the final conclusions from the pricing review.
Deferred Policy Acquisition Costs
Certain acquisition costs consisting of direct and ceded commissions, premium taxes and certain other direct underwriting expenses that vary with and are primarily related to the production of business are deferred and amortized over the effective period of the related insurance policies as the underlying policy premiums are earned. At December 31, 2016 and 2015, deferred acquisition costs and the related unearned premium reserves were as follows:
|
|
December 31, |
||||
|
|
2016 |
2015 |
|||
|
Deferred acquisition costs |
$ |
4,163 |
$ |
3,983 | |
|
Unearned premium reserves |
24,778 | 23,948 | |||
The method followed in computing deferred acquisition costs limits the amount of deferred costs to their estimated realizable value, which gives effect to the premium to be earned, related investment income, loss and settlement expenses, and certain other costs expected to be incurred as the premium is earned. Future changes in estimates, the most significant of which is expected loss and settlement expenses, may require adjustments to deferred policy acquisition costs. If the estimation of net realizable value indicates that the deferred acquisition costs are not recoverable, they would be written off.
Income Taxes
We use the asset and liability method of accounting for income taxes. Deferred income taxes arise from the recognition of temporary differences between financial statement carrying amounts and the tax bases of our assets and liabilities. A valuation allowance is provided when it is more likely than not that some portion of the deferred tax asset will not be realized. The effect of a change in tax rates is recognized in the period of the enactment date.
We had net deferred tax assets of $0.9 million and $1.4 million at December 31, 2016 and 2015, respectively. A valuation allowance is required to be established for any portion of the deferred tax asset for which we believe it is more likely than not that it will not be realized. At December 31, 2016 and 2015, we had no valuation allowance with respect to our deferred tax asset.
We exercise significant judgment in evaluating the amount and timing of recognition of the resulting tax liabilities and assets. These judgments require us to make projections of future taxable income. The judgments and estimates we make in determining our deferred tax assets, which are inherently subjective, are reviewed on a continual basis as regulatory and business factors change. Any reduction in estimated future taxable income may require us to record an additional valuation allowance against our deferred tax assets.
As of December 31, 2016 and 2015, we had no material unrecognized tax benefits or accrued interest and penalties. Federal tax years 2013 through 2015 are open for examination. The tax return related to the year ended December 31, 2016 has not yet been filed.
Other Assets
As of December 31, 2016 and 2015, other assets totaled $2.4 million and $0.9 million, respectively. Deferred stock offering and conversion expenses account for $1.3 million of the increase.
~ 54 ~
Outstanding Debt
As of December 31, 2016 and 2015, outstanding debt balances totaled $3.8 million and $3.3 million, respectively. On August 31, 2016, surplus notes, with an initial par value of $250,000 and remaining outstanding principal of $71,000 as of such date, matured. We incurred interest expense for the years ended December 31, 2016 and 2015 of $226,000 and $136,000, respectively. The average interest rate on debt in was 5.0% in 2016 compared to 4.8% in 2015. The debt balance is comprised of surplus notes, leasehold obligations, debt obligations, home office mortgage, and our revolving line of credit.
Surplus Notes
We had $1.85 million and $1.9 million of surplus notes issued, for cash, and outstanding as of December 31, 2016 and 2015, respectively. Payment of principal and interest on all surplus notes requires specific approval by the Illinois Department of Insurance. Our obligation to pay principal and interest on surplus notes is subordinate to the insurance claims of policyholders of ICC in accordance with terms of Section 56 of the Illinois Insurance Code.
Subject to the approval of the Director of Insurance of the State of Illinois and the applicable provisions of the Illinois Insurance Code, the noteholder had the right at the time of a stock conversion of ICC, upon not less than thirty (30) days’ written notice to us, to convert all or any portion of the outstanding principal amount of the note into shares of our common stock.
Additional information regarding each surplus note follows:
|
|
Principal |
Total |
Unapproved |
|||||||||||
|
|
Par Value |
Carrying |
and/or |
Principal |
Principal |
|||||||||
|
|
Interest |
(Face Amount |
Value of |
Interest Paid |
and/or |
and/or |
Date of |
|||||||
|
Date Issued |
Rate |
of Notes) |
Note |
Current Year |
Interest Paid |
Interest |
Maturity |
|||||||
|
12/31/2003 |
5.35% | 1,600,000 | 1,600,000 | 85,600 | 1,116,800 |
— |
12/31/2033 |
|||||||
|
7/15/2004 |
7.00% | 410,000 | 250,000 | 17,500 | 461,207 |
— |
7/15/2034 |
|||||||
|
8/31/2004 |
7.00% | 250,000 |
— |
72,857 | 413,161 |
— |
8/31/2016 |
|||||||
|
|
2,260,000 | 1,850,000 | 175,957 | 1,991,168 |
— |
Note holders are entitled to 1/28th of the principal each year. To date, the note holders of the surplus notes maturing on December 31, 2033 and July 15, 2034 have elected to waive principal repayment. The terms of the note allow for the conversion to equity should the company convert from a mutual insurance company to a stock insurance company.
Leasehold Obligations
We entered into a sale leaseback arrangement in 2016 that is accounted for as a capital lease. Under the agreement, the third party finance company purchased electronic data processing software and titled vehicles which are leased to us. These assets remain on our books due to provisions within the agreement that trigger capital lease accounting. To secure the lowest rate possible of 4.7%, we pledged bonds totaling $0.8 million during 2016, bringing the total pledged to $1.8 million and $0.9 million as of December 31, 2016 and 2015, respectively. There was no gain or loss recognized as part of this transaction. Lease payments totaled $454,000 and $64,000 for the years ended Decemeber 31, 2016 and 2015, respectively. The term of the electronic data processing lease is 48 months and the term of the titled vehicles lease is 36 months. The outstanding lease obligation at December 31, 2016, was $1.2 million and was included in corporate debt on the consolidated balance sheet.
Future minimum lease payments for the five succeeding years as of December 31, 2016 are:
|
Year |
Amount |
|||||||||||||
|
2017 |
$ |
501,972 | ||||||||||||
|
2018 |
501,972 | |||||||||||||
|
2019 |
361,374 | |||||||||||||
|
2020 |
30,190 | |||||||||||||
|
Total payments |
1,395,508 | |||||||||||||
|
Less: Interest portion |
167,967 | |||||||||||||
|
Total oustanding lease obligation |
$ |
1,227,541 | ||||||||||||
~ 55 ~
Debt Obligation
Additionally, the Company entered into two debt agreements in 2016; one agreement for $500,000 and another debt agreement for $75,000. The terms of the loans are 36 months, but the Company has the option to prepay after 12 months. The loans bear interest at 4.7%. Interest paid for the twelve months ended December 31, 2016 and 2015 was $8,146 and $0, respectively.
Home Office Mortgage
We maintain a mortgage on our home office. Interest is charged at a fixed rate of 2.6% and the loan matures in 2017. The building is used as collateral to secure the loan. The loan balance at year end 2016 and 2015 was $184,000 and $492,000, respectively. The interest paid on the loan in 2016 was $9,000 and $17,000 in 2015.
Payments due subsequent to December 31, 2016 are summarized below:
|
Year |
Amount |
|||||||||||||
|
2017 |
$ |
185,395 | ||||||||||||
|
Less: Interest portion |
25000 | 1,605 | ||||||||||||
|
Total outstanding mortgage obligation |
$ |
183,790 | ||||||||||||
Revolving Line of Credit
We maintain a revolving line of credit with American Bank & Trust, which permits borrowing up to an aggregate principal amount of $2.0 million. This facility was entered into during 2013 and is renewed annually with a current expiration of August 1, 2017. The line of credit is priced at 30 day LIBOR plus 2% with a floor of 3.5%. Interest paid on the line of credit in 2016 was immaterial. There are no financial covenants governing this agreement. For the years ended December 31, 2016 and 2015, no amounts were outstanding on this facility.
For information regarding our reinsurance program, investment portfolio, unpaid losses and settlement information, see Item 1. Business.
ESOP
In connection with the offering, the ESOP purchased 350,000 shares, or 10.0% of the common stock issued. The Company borrowed $3.5 million at an interest rate of 3.65% to fund the purchase of these shares and will make annual contributions to the ESOP sufficient to repay that loan.
Stock-based Incentive Plan
Under the stock-based incentive plan, we may issue a total number of shares equal to 14% of the shares of common stock that are issued in the offering. Of this amount, an amount equal to 10% of the shares of common stock issued in the offering may be used to make restricted stock and stock-settled restricted stock unit awards and 4% of the shares of common stock issued in the offering may be used to award stock options under the stock-based incentive plan. The grant-date fair value of any common stock used for restricted stock and restricted stock unit awards will represent unearned compensation. As we accrue compensation expense to reflect the vesting of such shares, unearned compensation will be reduced accordingly. We will also compute compensation expense at the time stock options are awarded based on the fair value of such options on the date they are granted. This compensation expense will be recognized over the appropriate service period. Implementation of the stock-based incentive plan is subject to shareholder approval.
Liquidity and Capital Resources
We generate sufficient funds from our operations and maintain a high degree of liquidity in our investment portfolio to meet the demands of claim settlements and operating expenses. The primary sources of funds are premium collections, investment earnings and maturing investments.
We maintain investment and reinsurance programs that are intended to provide sufficient funds to meet our obligations without forced sales of investments. We maintain a portion of our investment portfolio in relatively short-term and highly liquid assets to ensure the availability of funds.
~ 56 ~
Upon completion of the offering, we became subject to the proxy solicitation, periodic reporting, insider trading prohibitions and other requirements of the Exchange Act and to most of the provisions of the Sarbanes-Oxley Act of 2002. We estimate that the cost of initial compliance with the requirements of the Sarbanes-Oxley Act will be approximately $300,000 and that compliance with the ongoing requirements of the Exchange Act and the Sarbanes-Oxley Act will result in an increase of approximately $200,000 in our annual operating expenses.
Cash flows from continuing operations for the years ended December 31, 2016 and 2015 were as follows:
|
|
Years ended December 31, |
||||
|
(In thousands) |
2016 |
2015 |
|||
|
Net cash provided by operating activities |
$ |
4,592 |
$ |
5,745 | |
|
Net cash used in investing activities |
(1,602) | (5,195) | |||
|
Net cash (used in) provided by financing activities |
(792) | 488 | |||
|
Net increase (decrease) in cash and cash equivalents |
$ |
2,198 |
$ |
1,038 | |
ICC Holdings, Inc’s principal source of liquidity will be dividend payments and other fees received from ICC and ICC Realty, LLC. ICC is restricted by the insurance laws of Illinois as to the amount of dividends or other distributions it may pay to us. Under Illinois law, there is a maximum amount that may be paid by ICC during any twelve-month period. ICC may pay dividends to us after notice to, but without prior approval of the Illinois Department of Insurance in an amount “not to exceed” the greater of (i) 10% of the surplus as regards policyholders of ICC as reported on its most recent annual statement filed with the Illinois Department of Insurance, or (ii) the statutory net income of ICC for the period covered by such annual statement. Dividends in excess of this amount are considered “extraordinary” and are subject to the approval of the Illinois Department of Insurance.
The amount available for payment of dividends from ICC in 2017 without the prior approval of the Illinois Department of Insurance is approximately $3.4 million based upon the insurance company’s 2016 annual statement. Prior to its payment of any dividend, ICC is required to provide notice of the dividend to the Illinois Department of Insurance. This notice must be provided to the Illinois Department of Insurance 30 days prior to the payment of an extraordinary dividend and 10 days prior to the payment of an ordinary dividend. The Illinois Department of Insurance has the power to limit or prohibit dividend payments if ICC is in violation of any law or regulation. These restrictions or any subsequently imposed restrictions may affect our future liquidity.
The following table summarizes, as of December 31, 2016, our future payments under contractual obligations and estimated claims and claims related payments for continuing operations.
|
|
Payments due by period |
|||||||||||||
|
(In thousands) |
Total |
Less than 1 year |
1-3 years |
3-5 years |
More than 5 years |
|||||||||
|
Estimated gross loss and settlment expense payments |
$ |
52,817 |
|
$ |
20,863 |
|
$ |
20,704 |
|
$ |
7,130 |
|
$ |
4,120 |
|
Operating lease obligations |
79 | 44 | 35 |
— |
— |
|||||||||
|
Total |
$ |
52,896 |
$ |
20,906 |
$ |
20,739 |
$ |
7,130 |
$ |
4,120 | ||||
The timing of the amounts of the gross loss and settlement expense payments is an estimate based on historical experience and the expectations of future payment patterns. However, the timing of these payments may vary from the amounts stated above.
Off-Balance Sheet Arrangements
We have no off-balance sheet arrangements that have or are reasonably likely to have a current or future effect on our financial condition, changes in financial condition, revenues or expenses, results of operations, liquidity, capital expenditures, or capital reserves.
Recent Accounting Pronouncements
In August 2016, Financial Accounting Standards Board (FASB) issued Accounting Standards Update (ASU) No. 2016 15, Statement of Cash Flows – Classification of Certain Cash Receipts and Cash Payments. The guidance addresses eight specific cash flow issues with the objective of reducing existing diversity in practice. The new guidance is effective beginning after December 15, 2018, and it is not expected to have a material impact on the Company’s cash flows.
~ 57 ~
In June 2016, the FASB issued ASU No. 2016 13, Financial Instruments Credit Losses. The guidance affects the recognition of expected credit losses. Credit losses relating to available for sale securities will be recorded through an allowance for credit losses. The amendments will be applied to fiscal years beginning after December 15, 2020 and early adoption is permitted as of fiscal years beginning after December 15, 2018. The effect of applying the new guidance on accounting for credit losses has not yet been determined.
In February 2016, FASB issued ASU No. 2016 02, Leases, which will supersede the current lease requirements in ASC 840. The ASU requires lessees to recognize a right of use asset and related lease liability for all leases, with a limited exception for short term leases. Leases will be classified as either finance or operating, with the classification affecting the pattern of expense recognition in the statement of operations. Currently, leases are classified as either capital or operating, with only capital leases recognized on the balance sheet. The reporting of lease related expenses in the statements of operations and cash flows will be generally consistent with the current guidance. The new lease guidance will be effective for the Company’s year ending December 31, 2020 and will be applied using a modified retrospective transition method to the beginning of the earliest period presented. The effect of applying the new lease guidance on the consolidated financial statements is expected to be minimal due to current and future lease obligations being immaterial.
In January 2016, FASB issued ASU No. 2016 01, Financial Instruments Overall: Recognition and Measurement of Financial Assets and Financial Liabilities. The guidance affects the accounting for equity investments, financial liabilities under the fair value option, and the presentation and disclosure requirements of financial instruments. The amendments will be applied to fiscal years beginning after December 15, 2018. Early adoption is permitted for the accounting guidance on financial liabilities under the fair value option. The Company will make a cumulative-effect adjustment to the balance sheet as of the beginning of the fiscal year of adoption. The primary impact this guidance will have on our financial statements relates to recognizing changes in the fair value of equity securities through the statement of earnings. The impact to our statement of earnings will vary depending upon the level of volatility in the performance of the securities held in our equity portfolio and the overall market.
In May 2015, FASB issued ASU No. 2015-09, Disclosure about Short-Duration Contracts. The guidance addresses enhanced disclosure requirements for insurers relating to short-duration insurance contract claims and the unpaid claims liability rollforward for long and short-duration contracts. This ASU is effective for annual reporting periods beginning after December 15, 2015, and for interim periods after December 15, 2016. Early adoption is permitted. The Company has adopted this ASU for the year ended December 31, 2017 and while disclosures will be increased, management does not believe adoption will have a material effect on the Company’s financial statements.
In May 2014, FASB issued ASU No. 2014 09, Revenue from Contracts with Customers (Topic 606), which will supersede the current revenue recognition requirements in Topic 605, Revenue Recognition. The ASU is based on the principle that revenue is recognized to depict the transfer of goods or services to customers in an amount that reflects the consideration to which the entity expects to be entitled in exchange for those goods or services. The ASU also requires additional disclosure about the nature, amount, timing, and uncertainty of revenue and cash flows arising from customer contracts, including significant judgments and changes in judgments and assets recognized from costs incurred to obtain or fulfill a contract. The new guidance will be effective for the Company’s year ending December 31, 2019. The effect of applying this on the consolidated financial statements is not expected to have a material impact.
~ 58 ~
Item 7A. Quantitative and Qualitative Information about Market Risk
Market Risk
Market risk is the risk that we will incur losses due to adverse changes in the fair value of financial instruments. We have exposure to three principal types of market risk through our investment activities: interest rate risk, credit risk and equity risk. Our primary market risk exposure is to changes in interest rates. We have not entered, and do not plan to enter, into any derivative financial instruments for hedging, trading or speculative purposes.
Interest Rate Risk
Interest rate risk is the risk that we will incur economic losses due to adverse changes in interest rates. Our exposure to interest rate changes primarily results from our significant holdings of fixed rate investments. Fluctuations in interest rates have a direct impact on the fair value of these securities.
The average maturity of the debt securities in our investment portfolio at December 31, 2016, was 6.71 years. Our debt securities investments include U.S. government bonds, securities issued by government agencies, obligations of state and local governments and governmental authorities, and corporate bonds, most of which are exposed to changes in prevailing interest rates and which may experience moderate fluctuations in fair value resulting from changes in interest rates. We carry these investments as available for sale. This allows us to manage our exposure to risks associated with interest rate fluctuations through active review of our investment portfolio by our management and board of directors and consultation with our third party investment manager.
Fluctuations in near-term interest rates could have an impact on our results of operations and cash flows. Certain of these securities may have call features. In a declining interest rate environment these securities may be called by their issuer and replaced with securities bearing lower interest rates. If we are required to sell these securities in a rising interest rate environment we may recognize losses.
As a general matter, we attempt to match the durations of our assets with the durations of our liabilities. Our investment objectives include maintaining adequate liquidity to meet our operational needs, optimizing our after-tax investment income, and our after-tax total return, all of which are subject to our tolerance for risk.
The table below shows the interest rate sensitivity of our fixed maturity investments measured in terms of fair value (which is equal to the carrying value for all of our investment securities that are subject to interest rate changes):
|
|
December 31, 2016 |
|||||
|
Hypothetical Change in Interest Rates (In thousands) |
Estimated Change in Fair Value |
Fair Value |
||||
|
200 basis point increase |
$ |
(5,746) |
$ |
58,388 | ||
|
100 basis point increase |
(2,950) | 61,184 | ||||
|
No change |
— |
64,134 | ||||
|
100 basis point decrease |
2,931 | 67,065 | ||||
|
200 basis point decrease |
5,246 | 69,380 | ||||
Credit Risk
Credit risk is the potential economic loss principally arising from adverse changes in the financial condition of a specific debt issuer. We address this risk by investing primarily in fixed maturity securities that are rated investment grade and at least 70% of our investment securities must be rated at least “A” by Moody’s or an equivalent rating quality. We also independently, and through our independent third party investment manager, monitor the financial condition of all of the issuers of fixed maturity securities in the portfolio. To limit our exposure to risk, we employ diversification rules that limit the credit exposure to any single issuer or asset class.
Equity Risk
Equity price risk is the risk that we will incur economic losses due to adverse changes in equity prices.
~ 59 ~
Impact of Inflation
Inflation increases our customers’ needs for property and casualty insurance coverage due to the increase in the value of the property covered and any potential liability exposure. Inflation also increases claims incurred by property and casualty insurers as property repairs, replacements and medical expenses increase. These cost increases reduce profit margins to the extent that rate increases are not implemented on an adequate and timely basis. We establish property and casualty insurance premiums levels before the amount of loss and loss expenses, or the extent to which inflation may impact these expenses, are known. Therefore, we attempt to anticipate the potential impact of inflation when establishing rates. Because inflation has remained relatively low in recent years, financial results have not been significantly affected by it.
~ 60 ~
Item 8. Financial Statements and Supplementary Data
Index to Financial Statements
~ 61 ~
Report of Independent Registered Public Accounting Firm
Audit Committee, Board of Directors and Policyholders
Illinois Casualty Company
Rock Island, Illinois
We have audited the accompanying consolidated balance sheets of Illinois Casualty Company as of December 31, 2016 and 2015, and the related consolidated statements of earnings and comprehensive earnings, policyholders’ equity and cash flows for each of the years then ended. The Company's management is responsible for these financial statements. Our responsibility is to express an opinion on these financial statements based on our audits.
We conducted our audits in accordance with the standards of the Public Company Accounting Oversight Board (United States). Those standards require that we plan and perform the audits to obtain reasonable assurance about whether the financial statements are free of material misstatement. The Company is not required to have, nor were we engaged to perform, an audit of its internal control over financial reporting. Our audits included consideration of internal control over financial reporting as a basis for designing auditing procedures that are appropriate in the circumstances, but not for the purpose of expressing an opinion on the effectiveness of the Company's internal control over financial reporting. Accordingly, we express no such opinion. Our audits also included examining, on a test basis, evidence supporting the amounts and disclosures in the financial statements, assessing the accounting principles used and significant estimates made by management and evaluating the overall financial statement presentation. We believe that our audits provide a reasonable basis for our opinion.
In our opinion, the consolidated financial statements referred to above present fairly, in all material respects, the financial position of Illinois Casualty Company as of December 31, 2016, and 2015, and the results of its operations and its cash flows for each of the years then ended, in conformity with accounting principles generally accepted in the United States of America.
BKD, LLP
Cincinnati, Ohio
March 31, 2017
~ 62 ~
Illinois Casualty Company and Subsidiaries
Consolidated Balance Sheets
|
|
December 31, |
|||||
|
|
2016 |
2015 |
||||
|
Assets |
||||||
|
Investments and cash: |
||||||
|
Available for sale securities, at fair value |
||||||
|
Fixed maturity securities (amortized cost - $62,929,091 at |
$ |
64,134,023 |
$ |
65,195,308 | ||
|
12/31/2016 and $63,994,827 at 12/31/2015) |
||||||
|
Common equity securities (cost - $6,311,708 at |
6,982,547 | 8,884,951 | ||||
|
12/31/2016 and $9,282,252 at 12/31/2015) |
||||||
|
Preferred stocks (cost - $2,925,434 at |
2,798,413 |
— |
||||
|
12/31/2016 and $0 at 12/31/2015) |
||||||
|
Property held for investment, at cost, net of accumulated depreciation of |
2,207,424 | 561,051 | ||||
|
$50,948 at 12/31/2016 and $3,155 at 12/31/2015 |
||||||
|
Cash and cash equivalents |
4,376,847 | 2,179,511 | ||||
|
Total investments and cash |
80,499,254 | 76,820,821 | ||||
|
Accrued investment income |
524,156 | 580,786 | ||||
|
Premiums and reinsurance balances receivable, net of allowances for |
17,479,487 | 15,637,909 | ||||
|
uncollectible amounts of $50,000 at 12/31/2016 and $100,000 at 12/31/2015 |
||||||
|
Ceded unearned premiums |
270,751 | 57,304 | ||||
|
Reinsurance balances recoverable on unpaid losses and settlement |
12,114,998 | 19,535,058 | ||||
|
expenses, net of allowances for uncollectible amounts of |
||||||
|
$0 at 12/31/2016 and 12/31/2015 |
||||||
|
Current federal income taxes |
149,252 | 773,206 | ||||
|
Net deferred federal income taxes |
888,254 | 1,400,652 | ||||
|
Deferred policy acquisition costs, net |
4,162,927 | 3,982,734 | ||||
|
Property and equipment, at cost, net of accumulated depreciation of |
3,719,535 | 3,680,048 | ||||
|
$4,308,246 at 12/31/2016 and $3,553,073 at 12/31/2015 |
||||||
|
Other assets |
2,351,347 | 904,864 | ||||
|
Total assets |
$ |
122,159,961 |
$ |
123,373,382 | ||
|
|
||||||
|
Liabilities and Equity |
||||||
|
Liabilities: |
||||||
|
Unpaid losses and settlement expenses |
$ |
52,817,254 |
$ |
61,055,626 | ||
|
Unearned premiums |
24,777,712 | 23,948,476 | ||||
|
Reinsurance balances payable |
109,790 |
— |
||||
|
Corporate debt |
3,786,950 | 3,273,560 | ||||
|
Accrued expenses |
4,827,042 | 4,096,190 | ||||
|
Other liabilities |
2,241,003 | 833,795 | ||||
|
Total liabilities |
88,559,751 | 93,207,647 | ||||
|
|
||||||
|
Equity: |
||||||
|
Accumulated other comprehensive earnings, net of tax |
1,154,175 | 530,097 | ||||
|
Retained earnings |
32,446,035 | 29,635,638 | ||||
|
Total equity |
33,600,210 | 30,165,735 | ||||
|
Total liabilities and equity |
$ |
122,159,961 |
$ |
123,373,382 | ||
See accompanying notes to consolidated financial statements.
~ 63 ~
Illinois Casualty Company and Subsidiaries
Consolidated Statements of Earnings and Comprehensive Earnings
|
|
Years ended December 31, |
|||||
|
|
2016 |
2015 |
||||
|
Net premiums earned |
$ |
42,611,365 |
$ |
40,219,861 | ||
|
Net investment income |
1,967,938 | 1,332,520 | ||||
|
Net realized investment gains |
249,923 | 80,527 | ||||
|
Other-than-temporary impairment charges |
(212,731) |
— |
||||
|
Other income |
254,447 | 189,902 | ||||
|
Consolidated revenues |
44,870,942 | 41,822,810 | ||||
|
Losses and settlement expenses |
24,344,551 | 23,800,514 | ||||
|
Policy acquisition costs |
15,848,547 | 14,555,411 | ||||
|
Interest expense on debt |
226,095 | 136,295 | ||||
|
General corporate expenses |
464,383 | 314,120 | ||||
|
Total expenses |
40,883,576 | 38,806,340 | ||||
|
Earnings before income taxes |
3,987,366 | 3,016,470 | ||||
|
Income tax expense: |
||||||
|
Current |
986,066 | 461,567 | ||||
|
Deferred |
190,903 | 400,175 | ||||
|
Total income tax expense |
1,176,969 | 861,742 | ||||
|
Net earnings |
$ |
2,810,397 |
$ |
2,154,728 | ||
|
|
||||||
|
Other comprehensive earnings (loss), net of tax |
||||||
|
Unrealized gains and losses on investments: |
||||||
|
Unrealized holding gains (losses) arising during the period, |
||||||
|
net of income tax expense of $334,139 in 2016 |
||||||
|
and income tax (benefit) of $(500,057) in 2015 |
$ |
648,625 |
$ |
(970,699) | ||
|
Reclassification adjustment for (gains) included in net |
||||||
|
income, net of income tax expense of $12,645 in 2016 |
||||||
|
and expense of $27,379 in 2015 |
(24,547) | (53,148) | ||||
|
Total other comprehensive earnings (loss) |
624,078 | (1,023,847) | ||||
|
Comprehensive earnings |
$ |
3,434,475 |
$ |
1,130,881 | ||
See accompanying notes to consolidated financial statements.
~ 64 ~
Illinois Casualty Company and Subsidiaries
Consolidated Statements of Policyholders’ Equity
|
|
Retained |
Accumulated |
Total equity |
||||||
|
Balance, January 1, 2015 |
$ |
27,480,910 |
$ |
1,553,944 |
$ |
29,034,854 | |||
|
Net earnings |
2,154,728 | 2,154,728 | |||||||
|
Other comprehensive loss, net of tax |
(1,023,847) | (1,023,847) | |||||||
|
Balance, December 31, 2015 |
29,635,638 | 530,097 | 30,165,735 | ||||||
|
Net earnings |
2,810,397 | 2,810,397 | |||||||
|
Other comprehensive earnings, net of tax |
624,078 | 624,078 | |||||||
|
Balance, December 31, 2016 |
$ |
32,446,035 |
$ |
1,154,175 |
$ |
33,600,210 | |||
See accompanying notes to consolidated financial statements.
~ 65 ~
Illinois Casualty Company and Subsidiaries
Consolidated Statements of Cash Flows
|
|
|||||
|
|
Years ended December 31, |
||||
|
|
2016 |
2015 |
|||
|
Cash flows from operating activities: |
|||||
|
Net earnings |
$ |
2,810,397 |
$ |
2,154,728 | |
|
Adjustments to reconcile net earnings to net cash provided |
|||||
|
by operating activities |
|||||
|
Net realized investment gains |
(249,923) | (80,527) | |||
|
Other-than-temporary impairment charges |
212,731 |
— |
|||
|
Depreciation |
817,774 | 505,555 | |||
|
Deferred income tax |
190,903 | 400,175 | |||
|
Amortization of bond premium and discount |
246,470 | 278,496 | |||
|
Change in: |
|||||
|
Accrued investment income |
56,630 | (41,768) | |||
|
Premiums and reinsurance balances receivable (net) |
(1,841,578) | (1,116,020) | |||
|
Reinsurance balances payable |
109,790 |
— |
|||
|
Ceded unearned premium |
(213,447) | (39,452) | |||
|
Reinsurance balances recoverable on unpaid losses |
7,420,060 | 6,319,975 | |||
|
Deferred policy acquisition costs |
(180,193) | (182,190) | |||
|
Accrued expenses |
730,852 | 350,415 | |||
|
Unpaid losses and settlement expenses |
(8,238,372) | (3,561,384) | |||
|
Unearned premiums |
829,236 | 1,450,871 | |||
|
Current federal income tax |
623,954 | (488,433) | |||
|
Other |
1,266,466 | (205,914) | |||
|
Net cash provided by operating activities |
4,591,750 | 5,744,527 | |||
|
Cash flows from investing activities: |
|||||
|
Purchases of: |
|||||
|
Fixed income, available-for-sale |
(10,410,051) | (13,319,250) | |||
|
Common equity/ETF securities, available-for-sale |
(1,897,147) | (221,233) | |||
|
Preferred stock, available-for-sale |
(3,036,468) |
— |
|||
|
Property and equipment |
(856,504) | (644,805) | |||
|
Property held for investment |
(1,703,690) | (561,051) | |||
|
Proceeds from sales, maturities and calls of: |
|||||
|
Fixed income, available-for-sale |
11,437,484 | 9,486,713 | |||
|
Common equity/ETF securities, available-for-sale |
4,708,756 |
— |
|||
|
Preferred stock, available-for-sale |
98,998 |
— |
|||
|
Property and equipment |
47,036 | 65,104 | |||
|
Property held for investment |
9,524 | ||||
|
Net cash used in investing activities |
(1,602,062) | (5,194,522) | |||
|
Cash flows from financing activities: |
|||||
|
Proceeds from loan |
575,000 | ||||
|
Proceeds from sale leaseback |
777,643 | 911,527 | |||
|
Repayments of borrowed funds |
(839,254) | (423,677) | |||
|
Demutualization and initial public offering costs |
(1,305,741) |
— |
|||
|
Net cash (used in) provided by financing activities |
(792,352) | 487,850 | |||
|
Net increase in cash |
2,197,336 | 1,037,855 | |||
|
Cash and cash equivalents at beginning of year |
2,179,511 | 1,141,656 | |||
|
Cash and cash equivalents at end of year |
$ |
4,376,847 |
$ |
2,179,511 | |
|
Supplemental information: |
|||||
|
Federal income tax paid |
$ |
300,000 |
$ |
950,000 | |
|
Interest paid |
$ |
225,964 |
$ |
136,506 | |
See accompanying notes to consolidated financial statements.
~ 66 ~
Notes to Consolidated Financial Statements
1. SUMMARY OF SIGNIFICANT ACCOUNTING POLICIES
A. DESCRIPTION OF BUSINESS
ICC Holdings, Inc. is a Pennsylvania corporation that was organized in 2016. ICC Holdings, Inc. was formed so that it could acquire all of the capital stock of Illinois Casualty Company (ICC) in the mutual-to-stock conversion. Prior to the conversion on March 30, 2017, ICC Holdings, Inc did not engage in any operations. After the conversion, ICC Holdings, Inc’s primary assets are the outstanding capital stock of ICC, the outstanding membership interests of ICC Realty, LLC and a portion of the net proceeds from the stock offering completed in connection with the mutual-to-stock conversion. These financial statements presented herein are for ICC, as it was the ultimate reporting entity as of December 31, 2016.
As used in this Form 10-K, references to “the Company,” “we,” “us,” and “our” refer to the consolidated group. On a stand-alone basis ICC Holdings, Inc is referred to as the “Parent Company.” The consolidated group consists of the holding company, ICC Holdings, Inc., an operating insurance company, ICC, and ICC’s three wholly-owned subsidiaries, Beverage Insurance Agency, Inc., an inactive insurance agency, Estrella Innovative Solutions, Inc., an outsourcing company, and ICC Realty, LLC, a real estate services and holding company. ICC is an Illinois insurance company.
We are a specialty insurance carrier primarily underwriting commercial multi-peril, liquor liability, workers’ compensation, and umbrella liability coverages for the food and beverage industry through our subsidiary insurance company, ICC. ICC writes business in Illinois, Iowa, Indiana, Minnesota, Missouri, Wisconsin, and Ohio and markets through independent agents. Approximately 36.9% and 35.7% of the premium is written in Illinois for the years ended December 31, 2016 and 2015, respectively. The Company has three wholly owned subsidiaries, Beverage Insurance Agency, Estrella Innovative Solutions, Inc., and ICC Realty, LLC.; however the Company operates as a single segment.
B. PRINCIPLES OF CONSOLIDATION AND BASIS OF PRESENTATION
The accompanying consolidated financial statements were prepared in conformity with U.S. generally accepted accounting principles (GAAP), which differ in some respects from those followed in reports to insurance regulatory authorities. The consolidated financial statements include the accounts of our subsidiaries. All significant intercompany balances and transactions have been eliminated.
In preparing the consolidated financial statements, management is required to make estimates and assumptions that affect the reported amounts of assets and liabilities as of the date of the balance sheet, revenues and expenses for the periods then ended, and the accompanying notes to the financial statements. Such estimates and assumptions could change in the future as more information becomes known which could impact the amounts reported and disclose herein. The most significant of these amounts is the liability for unpaid losses and settlement expenses. Other estimates include investment valuation and other than temporary impairments (OTTIs), the collectability of reinsurance balances, recoverability of deferred tax assets, and deferred policy acquisition costs. These estimates and assumptions are based on management’s best estimates and judgment. Management evaluates its estimates and assumptions on an ongoing basis using historical experience and other factors, including the current economic environment, which management believes to be reasonable under the circumstances. Management adjusts such estimates and assumptions when facts and circumstances dictate. Although recorded estimates are supported by actuarial computations and other supportive data, the estimates are ultimately based on expectations of future events. As future events and their effects cannot be determined with precision, actual results could differ significantly from these estimates. Changes in those estimates resulting from continuing changes in the economic environment will be reflected in the consolidated financial statements in future periods.
C. INVESTMENTS:
The Company classifies its investments in all debt and equity securities as available-for-sale.
AVAILABLE-FOR-SALE SECURITIES
Debt and equity securities are classified as available-for-sale (AFS) and reported at fair value. Unrealized gains and losses on these securities are excluded from net earnings but are recorded as a separate component of comprehensive earnings and shareholders’ equity, net of deferred income taxes.
~ 67 ~
OTHER THAN TEMPORARY IMPAIRMENT
Under current accounting standards, an OTTI write-down of debt securities, where fair value is below amortized cost, is triggered by circumstances where (1) an entity has the intent to sell a security, (2) it is more likely than not that the entity will be required to sell the security before recovery of its amortized cost basis or (3) the entity does not expect to recover the entire amortized cost basis of the security. If an entity intends to sell a security in a loss position or if it is more likely than not the entity will be required to sell the security before recovery, an OTTI write-down is recognized in earnings equal to the difference between the security’s amortized cost and its fair value. If an entity does not intend to sell the security or it is not more likely than not that it will be required to sell the security before recovery, the OTTI write-down is separated into an amount representing the credit loss, which is recognized in earnings, and the amount related to all other factors, which is recognized in other comprehensive income. Impairment losses result in a reduction of the underlying investment’s cost basis.
The Company regularly evaluates its fixed income and equity securities using both quantitative and qualitative criteria to determine impairment losses for other-than-temporary declines in the fair value of the investments. The following are the key factors for determining if a security is other-than-temporarily impaired as follows:
|
· |
The extent to which the fair value is less than cost, |
|
· |
The assessment of significant adverse changes to the cash flows on a fixed income investment, |
|
· |
The occurrence of a discrete credit event resulting in the issuer defaulting on a material obligation, the issuer seeking protection from creditors under the bankruptcy laws, the issuer proposing a voluntary reorganization under which creditors are asked to exchange their claims for cash or securities having a fair value substantially lower than par value, |
|
· |
The probability that the Company will recover the entire amortized cost basis of the fixed income securities prior to maturity, |
|
· |
The ability and intent to hold fixed income securities until maturity or |
|
· |
For equity securities, the expectation of recovery to cost within a reasonable period of time. |
Quantitative and qualitative criteria are considered during this process to varying degrees depending on the sector the analysis is being performed as follows:
Corporates
The Company performs a qualitative evaluation of holdings that fall below the price threshold. The analysis begins with an opinion of industry and competitive position. This includes an assessment of factors that enable the profit structure of the business (e.g., reserve profile for exploration and production companies), competitive advantage (e.g., distribution system), management strategy, and an analysis of trends in return on invested capital. Analysts may also review other factors to determine whether an impairment exists including liquidity, asset value cash flow generation, and industry multiples.
Municipals
The Company analyzes the screened impairment candidates on a quantitative and qualitative basis. This includes an assessment of the factors that may be contributing to the unrealized loss and whether the recovery value is greater or less than current market value.
Structured Securities
The “stated assumptions” analytic approach relies on actual 6-month average collateral performance measures (voluntary prepayment rate, gross default rate, and loss severity) sourced through third party data providers or remittance reports. The analysis applies the stated assumptions throughout the remaining term of the transaction using forecasted cashflows, which are then applied through the transaction structure (reflecting the priority of payments and performance triggers) to determine whether there is a loss to the security (“Loss to Tranche”). For securities or sectors for which no actual loss or minimal loss has been observed (certain Prime Residential Mortgage Backed Securities (RMBS) and Commercial Mortgage Backed Securities (CMBS), for example), sector-based assumptions are applied or an alternative quantitative or qualitative analysis is performed.
~ 68 ~
Investment Income
Interest on fixed maturities and short-term investments is credited to earnings on an accrual basis. Premiums and discounts are amortized or accreted over the lives of the related fixed maturities. Dividends on equity securities are credited to earnings on the ex-dividend date. Realized gains and losses on disposition of investments are based on specific identification of the investments sold on the settlement date, which does not differ significantly from trade date accounting.
D. PROPERTY HELD FOR INVESTMENT
Property held for investment purposes is initially recorded at the purchase price, which is generally fair value, and is subsequently reported at cost less accumulated depreciation. Buildings are depreciated on a straight-line bases over the estimated useful lives of the building, which we estimate to be 39 years. Income from property held for investment is reported as net investment income.
E. CASH AND CASH EQUIVALENTS
Cash consists of uninvested balances in bank accounts. Cash equivalents consist of investments with original maturities of 90 days or less, primarily AAA-rated prime and government money market funds. Cash equivalents are carried at cost, which approximates fair value. The Company has not experienced losses on these instruments.
F. REINSURANCE
Ceded unearned premiums and reinsurance balances recoverable on paid and unpaid losses and settlement expenses are reported separately as assets instead of being netted with the related liabilities, since reinsurance does not relieve us of our legal liability to our policyholders.
Quarterly, the Company monitors the financial condition of its reinsurers. The Company’s monitoring efforts include, but are not limited to, the review of annual summarized financial data and analysis of the credit risk associated with reinsurance balances recoverable by monitoring the A.M. Best and Standard & Poor’s (S&P) ratings. In addition, the Company subjects its reinsurance recoverables to detailed recoverable tests, including an analysis based on average default by A.M. Best rating. Based upon the review and testing, the Company’s policy is to charge to earnings, in the form of an allowance, an estimate of unrecoverable amounts from reinsurers. This allowance is reviewed on an ongoing basis to ensure that the amount makes a reasonable provision for reinsurance balances that the Company may be unable to recover.
G. POLICY ACQUISITION COSTS
The Company defers commissions, premium taxes, and certain other costs that are incrementally or directly related to the successful acquisition of new or renewal insurance contracts. Acquisition-related costs may be deemed ineligible for deferral when they are based on contingent or performance criteria beyond the basic acquisition of the insurance contract or when efforts to obtain or renew the insurance contract are unsuccessful. All eligible costs are capitalized and charged to expense in proportion to premium revenue recognized. The method followed in computing deferred policy acquisition costs limits the amount of such deferred costs to their estimated realizable value. This deferral methodology applies to both gross and ceded premiums and acquisition costs.
~ 69 ~
H. PROPERTY AND EQUIPMENT
Property and equipment are presented at cost, less accumulated depreciation, and are depreciated using accelerated methods for financial statement purposes for a period based on their economic life. Computer equipment is depreciated over 3 years and equipment over a range of 5 to 7 years. Buildings are depreciated over 39 years and related improvements over 15 years. Annually, the Company reviews the major asset classes held for impairment. For the years ended December 31, 2016 and 2015, the Company recognized no impairments. Property and equipment are summarized as follows:
|
|
December 31, |
|||||
|
|
2016 |
2015 |
||||
|
Automobiles |
$ |
668,794 |
$ |
460,790 | ||
|
Furniture and fixtures |
516,318 | 474,213 | ||||
|
Computer equipment and software |
3,151,676 | 2,690,705 | ||||
|
Home office |
3,690,994 | 3,607,413 | ||||
|
Total cost |
8,027,782 | 7,233,121 | ||||
|
Accumulated depreciation |
(4,308,246) | (3,553,073) | ||||
|
Net property and equipment |
$ |
3,719,535 |
$ |
3,680,048 | ||
I. UNPAID LOSSES AND SETTLEMENT EXPENSES
The liability for unpaid losses and settlement expenses represents estimates of amounts needed to pay reported and unreported claims and related expenses. The estimates are based on certain actuarial and other assumptions related to the ultimate cost to settle such claims. Such assumptions are subject to occasional changes due to evolving economic, social, and political conditions. All estimates are periodically reviewed and, as experience develops and new information becomes known, the reserves are adjusted as necessary. Such adjustments are reflected in the results of operations in the period in which they are determined. Due to the inherent uncertainty in estimating reserves for losses and settlement expenses, there can be no assurance that the ultimate liability will not exceed recorded amounts. If actual liabilities do exceed recorded amounts, there will be an adverse effect. Based on the current assumptions used in estimating reserves, we believe that our overall reserve levels at December 31, 2016, make a reasonable provision to meet our future obligations. See Note 7 – Unpaid Losses and Settlement Expenses for further discussion.
J. PREMIUMS
Premiums are recognized ratably over the term of the contracts, net of ceded reinsurance. Unearned premiums represent the portion of premiums written relative to the unexpired terms of coverage. Unearned premiums are calculated on a daily pro rata basis.
K. GENERAL CORPORATE EXPENSE
General corporate expenses consist primarily of real estate and occupancy costs, such as utilities and maintenance. These costs do not vary significantly with premium volume but rather with square footage of real estate owned.
L. INCOME TAXES
The Company files a consolidated federal income tax return. Federal income taxes are accounted for using the asset and liability method under which deferred income taxes are recognized for the tax consequences of “temporary differences” by applying enacted statutory tax rates applicable to future years to differences between the financial statement carrying amounts and the tax bases of existing assets and liabilities, operating losses and tax credit carry forwards. The effect on deferred taxes for a change in tax rates is recognized in income in the period that includes the enactment date. Deferred tax assets are reduced by a valuation allowance if it is more likely than not all or some of the deferred tax assets will not be realized.
The Company considers uncertainties in income taxes and recognizes those in its financial statements as required. As it relates to uncertainties in income taxes, unrecognized tax benefits, including interest and penalty accruals, are not considered material to the consolidated financial statements. Also, no tax uncertainties are expected to result in significant increases or decreases to unrecognized tax benefits within the next 12-month period. Penalties and interest related to income tax uncertainties, should they occur, would be included in income tax expense in the period in which they are incurred.
~ 70 ~
ICC is subject to minimal state income tax liabilities. On a state basis, since the majority of income is from insurance operations, the Company pays premium taxes in lieu of state income tax. Premium taxes are a component of policy acquisition costs and calculated as a percentage of gross premiums written.
M. COMPREHENSIVE EARNINGS
Comprehensive earnings include net earnings plus unrealized gains/losses on available-for-sale investment securities, net of tax. In reporting the components of comprehensive earnings on a net basis in the statement of earnings, the Company used a 34% tax rate. Other comprehensive earnings (loss), as shown in the consolidated statements of earnings and comprehensive earnings, is net of tax expense (benefit) of $346,785 and $(472,678) for 2016 and 2015, respectively.
The following table provides the reclassifications out of accumulated other comprehensive income for the periods presented:
|
|
|
|
|
|
|
|
|
|
|
|
|
|
|
|
|
|
|
|
|
Amounts Reclassified from |
||||||||
|
Accumulated Other Comprehensive Income |
||||||||
|
Details about Accumulated Other |
|
Twelve-Months Ended December 31, |
|
Affected Line Item in the Statement |
||||
|
Comprehensive Earnings Component |
|
2016 |
|
2015 |
|
where Net Earnings is Presented |
||
|
Unrealized gains on AFS investments: |
|
|
|
|
|
|
|
|
|
|
|
$ |
(249,923) |
|
$ |
(80,527) |
|
Net realized investment gains |
|
|
|
|
212,731 |
|
|
— |
|
Other-than-temporary impairment charges |
|
|
|
|
12,645 |
|
|
27,379 |
|
Income tax expense |
|
Total reclassification adjustment |
|
$ |
(24,547) |
|
$ |
(53,148) |
|
Net of tax |
N. PROSPECTIVE ACCOUNTING STANDARDS
The dates presented below, represent the implementation dates for publicly traded entities. The Company’s status as an Emerging Growth Company could delay the required adoption of each of these standards.
Statement of Cash Flows – Classification of Certain Cash Receipts and Cash Payments (ASU 2016-15) – This guidance addresses eight specific cash flow issues with the objective of reducing existing diversity in practice. The new guidance is effective beginning after December 15, 2018, and it is not expected to have a material impact on the Company’s cash flows.
Financial Instruments Credit Losses (ASU 2016-13) – This guidance affects the recognition of expected credit losses. Credit losses relating to available for sale securities will be recorded through an allowance for credit losses. The amendments will be applied to fiscal years beginning after December 15, 2019, and early adoption is permitted as of fiscal years beginning after December 15, 2018. The effect of applying the new guidance on accounting for credit losses has not yet been determined.
Leases (ASU 2016-02) – This update will supersede the current lease requirements in ASC 840. The ASU requires lessees to recognize a right of use asset and related lease liability for all leases, with a limited exception for short term leases. Leases will be classified as either finance or operating, with the classification affecting the pattern of expense recognition in the statement of operations. Currently, leases are classified as either capital or operating, with only capital leases recognized on the balance sheet. The reporting of lease related expenses in the statements of operations and cash flows will be generally consistent with the current guidance. The new lease guidance will be effective for the Company’s year ending December 31, 2020 and will be applied using a modified retrospective transition method to the beginning of the earliest period presented. The effect of applying the new lease guidance on the consolidated financial statements is expected to be minimal due to current and future lease obligations being immaterial.
Financial Instruments – Recognition and Measurement (ASU 2016-01) – This guidance affects the accounting for equity investments, financial liabilities under the fair value option, and the presentation and disclosure requirements of financial instruments. The amendments will be applied to fiscal years beginning after December 15, 2018. Early adoption is permitted for the accounting guidance on financial liabilities under the fair value option. The Company will make a cumulative-effect adjustment to the balance sheet as of the beginning of the fiscal year of adoption. The primary impact this guidance will have on our financial statements relates to recognizing changes in the fair value of equity securities through the statement of earnings. The impact to our statement of earnings will vary depending upon the level of volatility in the performance of the securities held in our equity portfolio and the overall market.
~ 71 ~
Short-Duration Contracts Disclosures (ASU 2015-09) – This guidance addresses enhanced disclosure requirements for insurers relating to short-duration insurance contract claims and the unpaid claims liability rollforward for long and short-duration contracts. This ASU is effective for annual reporting periods beginning after December 15, 2015, and for interim periods after December 15, 2016. Early adoption is permitted. As an emerging growth company, the Company is permitted to and intends to defer adoption until required for private entities. The Company will adopt this ASU for the year ended December 31, 2017 and while disclosures will be increased, management does not believe adoption will have a material effect on the Company’s financial statements.
Revenue Recognition (ASU 2014-09) This will supersede the current revenue recognition requirements in Topic 605, Revenue Recognition. The ASU is based on the principle that revenue is recognized to depict the transfer of goods or services to customers in an amount that reflects the consideration to which the entity expects to be entitled in exchange for those goods or services. The ASU also requires additional disclosure about the nature, amount, timing, and uncertainty of revenue and cash flows arising from customer contracts, including significant judgments and changes in judgments and assets recognized from costs incurred to obtain or fulfill a contract. The new guidance will be effective for the Company’s year ending December 31, 2019. The effect of applying this on the consolidated financial statements is not expected to have a material impact as the Company’s primary revenue is derived from insurance contracts which are excluded from the scope of ASU 2014-09.
O. RISKS AND UNCERTAINTIES:
Certain risks and uncertainties are inherent to day-to-day operations and to the process of preparing the Company’s consolidated financial statements. The more significant risks and uncertainties, as well as the Company’s attempt to mitigate, quantify, and minimize such risks, are presented below and throughout the notes to the consolidated financial statements.
Catastrophe Exposures
The Company’s insurance coverages include exposure to catastrophic events. All catastrophe exposures are monitored by quantifying exposed policy limits in each region and by using computer-assisted modeling techniques. Additionally, the Company limits its risk to such catastrophes through restraining the total policy limits written in each region and by purchasing reinsurance. The Company’s major catastrophe exposure is to losses caused by tornado and hail to commercial properties throughout the Midwest.
The catastrophe reinsurance treaty renewed on January 1, 2016, and the Company had protection of $9.5 million in excess of $500,000 first-dollar retention for both of the years ended December 31, 2016 and 2015. The catastrophe program is actively managed to keep net retention in line with risk tolerances and to optimize the risk/return trade off.
Reinsurance
Reinsurance does not discharge the Company from its primary liability to policyholders, and to the extent that a reinsurer is unable to meet its obligations, the Company would be liable. On a quarterly basis, the financial condition of prospective and existing reinsurers is monitored. As a result, the Company purchases reinsurance from a number of financially strong reinsurers. Accordingly, no allowance for reinsurance balances deemed uncollectible has been made. See Note 6 –Reinsurance for further discussion.
Investment Risk
The investment portfolio is subject to market, credit, and interest rate risks. The equity portfolio will fluctuate with movements in the overall stock market. While the equity portfolio has been constructed to have lower downside risk than the market, the portfolio is sensitive to movements in the market. The bond portfolio is affected by interest rate changes and movement in credit spreads. The Company attempts to mitigate its interest rate and credit risks by constructing a well-diversified portfolio with high-quality securities with varied maturities. Downturns in the financial markets could have a negative effect on the portfolio. However, the Company attempts to manage this risk through asset allocation, duration, and security selection.
~ 72 ~
Liquidity Risk
Liquidity is essential to the Company’s business and a key component of the concept of asset-liability matching. The Company’s liquidity may be impaired by an inability to collect premium receivable or reinsurance recoverable balances in a timely manner, an inability to sell assets or redeem investments, unforeseen outflows of cash or large claim payments, or an inability to access debt. Liquidity risk may arise due to circumstances that the Company may be unable to control, such as a general market disruption, an operational problem that affects third parties or the Company, or even by the perception among market participants that the Company, or other market participants, are experiencing greater liquidity risk.
The Company’s A.M. Best rating is important to its liquidity. A reduction in credit ratings could adversely affect the Company’s liquidity and competitive position, by increasing borrowing costs or limiting access to the capital markets.
External Factors
The Company is highly regulated by the state of Illinois and by the states in which it underwrites business. Such regulations, among other things, limit the amount of dividends, impose restrictions on the amount and types of investments, and regulates rates insurers may charge for various coverages. The Company is also subject to insolvency and guarantee fund assessments for various programs designed to ensure policyholder indemnification. Assessments are generally accrued during the period in which it becomes probable that a liability has been incurred from an insolvency and the amount of the related assessment can be reasonably estimated.
The National Association of Insurance Commissioners (NAIC) has developed Property/Casualty Risk-Based Capital (RBC) standards that relate an insurer’s reported statutory surplus to the risks inherent in its overall operations. The RBC formula uses the statutory annual statement to calculate the minimum indicated capital level to support asset (investment and credit) risk and underwriting (loss reserves, premiums written and unearned premium) risk. The NAIC model law calls for various levels of regulatory action based on the magnitude of an indicated RBC capital deficiency, if any. As of December 31, 2016, the Company determined that its capital levels are well in excess of the minimum capital requirements for all RBC action levels and that its capital levels are sufficient to support the level of risk inherent in its operations. See Note 10 – Statutory Information and Dividend Restrictions for further discussion of statutory information and related insurance regulatory restrictions.
In addition, ratings are a critical factor in establishing the competitive position of insurance companies. The Company is rated by A.M. Best. This rating reflects their opinion of the insurance company’s financial strength, operating performance, strategic position, and ability to meet its obligations to policyholders.
P. RECLASSIFICATIONS
Certain reclassifications have been made to the 2015 financial statements to conform to the 2016 financial statement presentation. These reclassifications had no effect on net earnings.
2. INVESTMENTS
NET INVESTMENT INCOME
A summary of net investment income for the years ended December 31, 2016 and 2015 is as follows:
|
|
2016 |
2015 |
||||
|
AFS, fixed maturity securities |
$ |
2,050,205 |
$ |
2,014,504 | ||
|
Investment property |
348,393 | 20,055 | ||||
|
AFS, equity securities |
372,151 | 312,751 | ||||
|
Cash and short-term investments |
17,189 | 11,351 | ||||
|
Investment revenue |
2,787,938 | 2,358,661 | ||||
|
Less investment expenses |
(820,000) | (1,026,141) | ||||
|
Net investment income |
$ |
1,967,938 |
$ |
1,332,520 | ||
~ 73 ~
INVESTMENT RELATED GAINS (LOSSES)
The following is a summary of the proceeds from sales, maturities, and calls of AFS securities and the related gross realized gains and losses, excluding OTTI, for the years ended December 31, 2016 and 2015.
|
|
Net realized |
|||||||||||
|
|
Proceeds |
Gains |
Losses |
gain |
||||||||
|
2016 |
||||||||||||
|
Fixed maturity securities |
$ |
11,437,484 |
$ |
216,803 |
$ |
(3,737) |
$ |
213,066 | ||||
|
Common equity/ETF securities |
4,708,756 | 73,186 | (26,287) | 46,899 | ||||||||
|
Preferred stocks |
98,998 |
— |
(10,042) | (10,042) | ||||||||
|
2015 |
||||||||||||
|
Fixed maturity securities |
$ |
9,486,713 |
$ |
80,527 |
$ |
— |
$ |
80,527 | ||||
The amortized cost and estimated fair value of fixed income AFS securities at December 31, 2016, are shown by contractual maturity below.
|
|
||||||
|
|
Amortized Cost |
Fair Value |
||||
|
Due in one year or less |
$ |
2,517,549 |
$ |
2,525,754 | ||
|
Due after one year through five years |
15,961,679 | 16,291,691 | ||||
|
Due after five years through 10 years |
15,995,789 | 16,753,674 | ||||
|
Due after 10 years |
8,702,937 | 8,885,704 | ||||
|
Asset and mortgage backed securities without a specific due date |
19,751,137 | 19,677,200 | ||||
|
Total fixed maturity securities |
$ |
62,929,091 |
$ |
64,134,023 | ||
Expected maturities may differ from contractual maturities due to call provisions on some existing securities. The net unrealized appreciation of AFS fixed income and equity securities totaled $1,748,750 and $803,180 at December 31, 2016 and 2015, respectively.
In addition, the following table is a schedule of amortized costs and estimated fair values of investments in fixed maturity and equity securities as of December 31, 2016 and 2015:
|
|
Cost or |
Gross Unrealized |
||||||||||
|
|
Amortized Cost |
Fair Value |
Gains |
Losses |
||||||||
|
2016 |
||||||||||||
|
Fixed maturity securities: |
||||||||||||
|
U.S. treasury |
$ |
1,244,542 |
$ |
1,241,125 |
$ |
2,527 |
$ |
(5,944) | ||||
|
MBS/ABS/CMBS |
19,751,138 | 19,677,200 | 183,175 | (257,113) | ||||||||
|
Corporate |
27,593,568 | 28,344,907 | 842,782 | (91,443) | ||||||||
|
Municipal |
14,339,843 | 14,870,791 | 665,790 | (134,842) | ||||||||
|
Total fixed maturity securities |
62,929,091 | 64,134,023 | 1,694,274 | (489,342) | ||||||||
|
Equity securities: |
||||||||||||
|
Common equity/ETF securities1 |
6,311,708 | 6,982,547 | 704,768 | (33,929) | ||||||||
|
Preferred stocks |
2,925,434 | 2,798,413 | 5,425 | (132,446) | ||||||||
|
Total equity securities |
9,237,142 | 9,780,960 | 710,193 | (166,375) | ||||||||
|
Total AFS securities |
$ |
72,166,233 |
$ |
73,914,983 |
$ |
2,404,467 |
$ |
(655,717) | ||||
~ 74 ~
|
|
Cost or |
Gross Unrealized |
||||||||||
|
|
Amortized Cost |
Fair Value |
Gains |
Losses |
||||||||
|
2015 |
||||||||||||
|
Fixed maturity securities: |
||||||||||||
|
U.S. treasury |
$ |
1,242,679 |
$ |
1,233,023 |
$ |
— |
$ |
(9,656) | ||||
|
MBS/ABS/CMBS |
17,948,856 | 18,010,566 | 205,253 | (143,543) | ||||||||
|
Corporate |
29,537,101 | 29,595,269 | 580,469 | (522,301) | ||||||||
|
Municipal |
15,266,191 | 16,356,450 | 1,090,259 |
— |
||||||||
|
Total fixed maturity securities |
63,994,827 | 65,195,308 | 1,875,981 | (675,500) | ||||||||
|
Common Equity/ETF securities1 |
9,282,252 | 8,884,951 | 21,200 | (418,501) | ||||||||
|
Total AFS securities |
$ |
73,277,079 |
$ |
74,080,259 |
$ |
1,897,181 |
$ |
(1,094,001) | ||||
1Equity securities consist of exchange traded funds (ETF) made up of Dividends Select, the S&P 500, and one bond ETF.
MORTGAGE-BACKED, COMMERCIAL MORTGAGE-BACKED AND ASSET-BACKED SECURITIES
All of the Company’s collateralized securities carry an average credit rating of AA+ by one or more major rating agency and continue to pay according to contractual terms. Included within MBS/ABS/CMBS are residential mortgage backed securities with fair values of $10,288,405 and $9,201,791 and commercial mortgage backed securities of $7,600,109 and $6,874,455 at December 31, 2016 and 2015, respectively.
CORPORATE BONDS
Net unrealized gains in the corporate bond portfolio increased $693,171 in 2016 from a gain of $58,168 in 2015 to a gain of $751,339 in 2016 as interest rates decreased during the year. This increase was due to corporate spreads tightening throughout the year. Of particular interest, the risk premiums associated with energy sector holdings (which comprise about 19% of the corporate portfolio) decrease substantially in the second half of the year as oil prices rallied from a low of about $30/barrel to end the year at $55/barrel. The corporate bond portfolio has an overall rating of A+.
MUNICIPAL BONDS
As of December 31, 2016 and 2015, municipal bonds totaled $14,870,791 and $16,356,450, respectively with net unrealized gains of $530,948 and $1,090,259, respectively. Unlike corporates, municipal spreads widened in 2016 especially after the U.S. Presidential election. As of December 31, 2016, approximately 13% of the municipal fixed income securities in the investment portfolio were general obligations of state and local governments, 44% were revenue based, 34% were pre-refunded, and the remaining 9% were taxable. The municipal bond portfolio has an overall rating of AA.
EQUITY SECURITIES
The equity portfolio consists of ETFs and preferred stock. Net unrealized gains in the equity portfolio increased $949,119 and decreased $487,516 in 2016 and 2015, respectively. Given the intent to hold and expectation of recovery to cost within a reasonable period of time, the Company does not consider any of its equities to be other-than-temporarily impaired.
~ 75 ~
UNREALIZED LOSSES ON AFS SECURITIES
The following table is also used as part of the impairment analysis and displays the total value of securities that were in an unrealized loss position as of December 31, 2016 and 2015. The table segregates the securities based on type, noting the fair value, cost (or amortized cost), and unrealized loss on each category of investment as well as in total. The table further classifies the securities based on the length of time they have been in an unrealized loss position.
|
|
||||||||||||||||||
|
|
December 31, 2016 |
December 31, 2015 |
||||||||||||||||
|
|
12 Mos |
12 Mos |
||||||||||||||||
|
|
< 12 Mos. |
& Greater |
Total |
< 12 Mos. |
& Greater |
Total |
||||||||||||
|
U.S. Treasury |
||||||||||||||||||
|
Fair value |
$ |
993,576 |
$ |
— |
$ |
993,576 |
$ |
1,233,023 |
$ |
— |
$ |
1,233,023 | ||||||
|
Cost or Amortized cost |
999,520 |
— |
999,520 | 1,242,679 |
— |
1,242,679 | ||||||||||||
|
Unrealized Loss |
(5,944) |
— |
(5,944) | (9,656) |
— |
(9,656) | ||||||||||||
|
|
||||||||||||||||||
|
MBS/ABS/CMBS |
||||||||||||||||||
|
Fair value |
10,712,987 | 322,641 | 11,035,628 | 9,404,729 | 728,591 | 10,133,320 | ||||||||||||
|
Cost or Amortized cost |
10,968,840 | 323,901 | 11,292,741 | 9,530,244 | 746,619 | 10,276,863 | ||||||||||||
|
Unrealized Loss |
(255,853) | (1,260) | (257,113) | (125,515) | (18,028) | (143,543) | ||||||||||||
|
|
||||||||||||||||||
|
Corporate |
||||||||||||||||||
|
Fair value |
5,476,442 | 984,115 | 6,460,557 | 11,205,004 | 1,263,357 | 12,468,361 | ||||||||||||
|
Cost or Amortized cost |
5,552,624 | 999,376 | 6,552,000 | 11,685,419 | 1,305,243 | 12,990,662 | ||||||||||||
|
Unrealized Loss |
(76,182) | (15,261) | (91,443) | (480,415) | (41,886) | (522,301) | ||||||||||||
|
|
||||||||||||||||||
|
Municipal |
||||||||||||||||||
|
Fair value |
2,995,362 |
— |
2,995,362 |
— |
— |
— |
||||||||||||
|
Cost or Amortized cost |
3,130,204 |
— |
3,130,204 |
— |
— |
— |
||||||||||||
|
Unrealized Loss |
(134,842) |
— |
(134,842) |
— |
— |
— |
||||||||||||
|
|
||||||||||||||||||
|
Subtotal, fixed income |
||||||||||||||||||
|
Fair value |
20,178,367 | 1,306,756 | 21,485,123 | 21,842,756 | 1,991,948 | 23,834,704 | ||||||||||||
|
Cost or Amortized cost |
20,651,188 | 1,323,277 | 21,974,465 | 22,458,342 | 2,051,862 | 24,510,204 | ||||||||||||
|
Unrealized Loss |
(472,821) | (16,521) | (489,342) | (615,586) | (59,914) | (675,500) | ||||||||||||
|
|
||||||||||||||||||
|
Common Equity Securities |
||||||||||||||||||
|
Fair value |
— |
445,872 | 445,872 | 398,194 | 3,222,192 | 3,620,386 | ||||||||||||
|
Cost or Amortized cost |
— |
479,801 | 479,801 | 429,530 | 3,609,357 | 4,038,887 | ||||||||||||
|
Unrealized Loss |
— |
(33,929) | (33,929) | (31,336) | (387,165) | (418,501) | ||||||||||||
|
|
||||||||||||||||||
|
Preferred Stock |
||||||||||||||||||
|
Fair value |
2,328,345 |
— |
2,328,345 |
— |
— |
— |
||||||||||||
|
Cost or Amortized cost |
2,460,791 |
— |
2,460,791 |
— |
— |
— |
||||||||||||
|
Unrealized Loss |
(132,446) |
— |
(132,446) |
— |
— |
— |
||||||||||||
|
|
||||||||||||||||||
|
Total |
||||||||||||||||||
|
Fair value |
22,506,712 | 1,752,628 | 24,259,340 | 22,240,950 | 5,214,140 | 27,455,090 | ||||||||||||
|
Cost or amortized cost |
23,111,979 | 1,803,078 | 24,915,057 | 22,887,872 | 5,661,219 | 28,549,091 | ||||||||||||
|
Unrealized Loss |
$ |
(605,267) |
$ |
(50,450) |
$ |
(655,717) |
$ |
(646,922) |
$ |
(447,079) |
$ |
(1,094,001) | ||||||
As of December 31, 2016 and 2015, the Company held 21 equity securities that were in unrealized loss positions. The total unrealized loss on these securities in 2016 and 2015 was $166,375 and $418,501, respectively.
~ 76 ~
The fixed income portfolio contained 58 securities in an unrealized loss position as of December 31, 2016. Of these 58 securities, 4 have been in an unrealized loss position for 12 consecutive months or longer and represent $16,521 in unrealized losses. All fixed income securities in the investment portfolio continue to pay the expected coupon payments under the contractual terms of the securities. Credit-related impairments on fixed income securities that we do not plan to sell, and for which we are not more likely than not to be required to sell, are recognized in net earnings. Any non-credit related impairment is recognized in comprehensive earnings. Based on management’s analysis, the fixed income portfolio is of a high credit quality and it is believed it will recover the amortized cost basis of the fixed income securities. Management monitors the credit quality of the fixed income investments to assess if it is probable that the Company will receive its contractual or estimated cash flows in the form of principal and interest.
For the year ended Decemeber 31, 2016, the Company recognized in net earnings $212,731 of OTTI losses on two securities that were impaired and subsequently sold during the last three months of 2016. During 2015, the Company did not recognize any impairment losses. For all fixed income securities at a loss at December 31, 2016, management believes it is probable that the Company will receive all contractual payments in the form of principal and interest. In addition, the Company is not required to, nor does it intend to sell these investments prior to recovering the entire amortized cost basis of each security, which may be maturity. Management does not consider these investments to be other-than-temporarily impaired at December 31, 2016. Based on management’s analysis, it was concluded that the securities in an unrealized loss position were not other-than-temporarily impaired at December 31, 2016, and 2015.
As required by law, certain fixed maturity investments amounting to $2,958,297 and $2,950,105 at December 31, 2016 and 2015, respectively, were on deposit with either regulatory authorities or banks. In addition, $1,808,523 and $947,554 was pledged as of December 31, 2016 and 2015, respectively, as part of a capital lease arrangement.
PROPERTY HELD FOR INVESTMENT
In 2016, investment property comprised of 35 apartment rental units located in Rock Island and Moline, Illinois. Property held for investment is net of accumulated depreciation of $50,948 and $3,155 as of December 31, 2016, and 2015, respectively. Related depreciation expense was $47,793 and $3,155 for the years ended December 31, 2016, and 2015, respectively.
3. FAIR VALUE DISCLOSURES
Fair value is defined as the price in the principal market that would be received for an asset to facilitate an orderly transaction between market participants on the measurement date. We determined the fair value of certain financial instruments based on their underlying characteristics and relevant transactions in the marketplace. GAAP guidance requires an entity to maximize the use of observable inputs and minimize the use of unobservable inputs when measuring fair value. The guidance also describes three levels of inputs that may be used to measure fair value.
The following are the levels of the fair value hierarchy and a brief description of the type of valuation inputs that are used to establish each level:
|
· Level 1 is applied to valuations based on readily available, unadjusted quoted prices in active markets for identical assets. |
|
· Level 2 is applied to valuations based upon quoted prices for similar assets in active markets, quoted prices for identical or similar assets in inactive markets; or valuations based on models where the significant inputs are observable (e.g. interest rates, yield curves, prepayment speeds, default rates, loss severities) or can be corroborated by observable market data. |
|
· Level 3 is applied to valuations that are derived from techniques in which one or more of the significant inputs are unobservable. Financial assets are classified based upon the lowest level of significant input that is used to determine fair value. |
As a part of the process to determine fair value, management utilizes widely recognized, third-party pricing sources to determine fair values. Management has obtained an understanding of the third-party pricing sources’ valuation methodologies and inputs. The following is a description of the valuation techniques used for financial assets that are measured at fair value, including the general classification of such assets pursuant to the fair value hierarchy.
~ 77 ~
Corporate, Agencies, and Municipal Bonds—The pricing vendor employs a multi-dimensional model which uses standard inputs including (listed in order of priority for use) benchmark yields, reported trades, broker/dealer quotes, issuer spreads, two-sided markets, benchmark securities, market bids/offers and other reference data. The pricing vendor also monitors market indicators, as well as industry and economic events. All bonds valued using these techniques are classified as Level 2. All Corporate, Agencies, and Municipal securities are deemed Level 2.
Mortgage-backed Securities (MBS)/Collateralized Mortgage Obligations (CMO) and Asset-backed Securities (ABS)—The pricing vendor evaluation methodology includes principally interest rate movements and new issue data. Evaluation of the tranches (non-volatile, volatile, or credit sensitivity) is based on the pricing vendors’ interpretation of accepted modeling and pricing conventions. This information is then used to determine the cash flows for each tranche, benchmark yields, pre-payment assumptions and to incorporate collateral performance. To evaluate CMO volatility, an option adjusted spread model is used in combination with models that simulate interest rate paths to determine market price information. This process allows the pricing vendor to obtain evaluations of a broad universe of securities in a way that reflects changes in yield curve, index rates, implied volatility, mortgage rates, and recent trade activity. MBS/CMO and ABS with corroborated and observable inputs are classified as Level 2. All MBS/CMO and ABS holdings are deemed Level 2.
U.S. Treasury Bonds and Common Equity/ETF Securities—U.S. treasury bonds and exchange traded equities have readily observable price levels and are classified as Level 1 (fair value based on quoted market prices). All common stock holdings are deemed Level 1.
Preferred Stock—Preferred stocks do not have readily observable prices, but do have quoted prices for similar assets or liabilities in active markets; quoted prices for identical or similar assets in markets that are not active; and inputs other than quoted prices are classificed as Level 2. All preferred stock holdings are deemed Level 2.
Due to the relatively short-term nature of cash, cash equivalents, and the mortgage on the home office, their carrying amounts are reasonable estimates of fair value. The surplus notes, leasehold obligations, and debt obligations reported under Note 5–Debt, are carried at face value and given that there is no readily available market for these to trade in, management believes that face value accurately reflects fair value. Cash and cash equivalents are classified as Level 1 of the hierarchy. The mortgage on the home office and the surplus notes are carried at Level 2 of the hierarchy.
Assets measured at fair value on a recurring basis as of December 31, 2016, are as summarized below:
|
|
Significant |
|||||||||||
|
|
Quoted in Active |
Other |
Significant |
|||||||||
|
|
Markets for |
Observable |
Unobservable |
|||||||||
|
|
Identical Assets |
Inputs |
Inputs |
|||||||||
|
|
(Level 1) |
(Level 2) |
(Level 3) |
Total |
||||||||
|
AFS securities |
||||||||||||
|
Fixed maturity securities |
||||||||||||
|
U.S. treasury |
$ |
1,241,125 |
$ |
— |
$ |
— |
$ |
1,241,125 | ||||
|
MBS/ABS/CMBS |
— |
19,677,200 |
— |
19,677,200 | ||||||||
|
Corporate |
— |
28,344,907 |
— |
28,344,907 | ||||||||
|
Municipal |
— |
14,870,791 |
— |
14,870,791 | ||||||||
|
Total fixed maturity securities |
1,241,125 | 62,892,898 |
— |
64,134,023 | ||||||||
|
Equity securities |
||||||||||||
|
Common equity/ETF securities1 |
6,982,547 |
— |
— |
6,982,547 | ||||||||
|
Preferred stocks |
— |
2,798,413 |
— |
2,798,413 | ||||||||
|
Total equity securities |
6,982,547 | 2,798,413 |
— |
9,780,960 | ||||||||
|
Total AFS securities |
$ |
8,223,672 |
$ |
65,691,311 |
$ |
— |
$ |
73,914,983 | ||||
~ 78 ~
Assets measured at fair value on a recurring basis as of December 31, 2015, are as summarized below:
|
|
Significant |
|||||||||||
|
|
Quoted in Active |
Other |
Significant |
|||||||||
|
|
Markets for |
Observable |
Unobservable |
|||||||||
|
|
Identical Assets |
Inputs |
Inputs |
|||||||||
|
|
(Level 1) |
(Level 2) |
(Level 3) |
Total |
||||||||
|
AFS securities |
||||||||||||
|
Fixed maturity securities |
||||||||||||
|
U.S. treasury |
$ |
1,233,023 |
$ |
— |
$ |
— |
$ |
1,233,023 | ||||
|
MBS/ABS/CMBS |
— |
18,010,566 |
— |
18,010,566 | ||||||||
|
Corporate |
— |
29,595,269 |
— |
29,595,269 | ||||||||
|
Municipal |
— |
16,356,450 |
— |
16,356,450 | ||||||||
|
Total fixed maturity securities |
1,233,023 | 63,962,285 |
— |
65,195,308 | ||||||||
|
Common equity/ETF securities1 |
8,884,951 |
— |
— |
8,884,951 | ||||||||
|
Total AFS seuciriteis |
$ |
10,117,974 |
$ |
63,962,285 |
$ |
— |
$ |
74,080,259 | ||||
As noted in the previous tables, the Company did not have any assets measured at fair value on a recurring basis using significant unobservable inputs (Level 3) as of December 31, 2016 and 2015. Additionally, there were no securities transferred in or out of levels 1 or 2 during the years ended December 31, 2016 and 2015.
4. POLICY ACQUISITION COSTS
Policy acquisition costs deferred and amortized to income for the years ended December 31 are summarized as follows:
|
|
||||
|
|
2016 |
2015 |
||
|
Deferred policy acquisition costs (DAC), beginning of year |
$ 3,982,734 |
$ 3,800,544 |
||
|
Deferred: |
||||
|
Direct commission |
7,156,434 | 6,885,761 | ||
|
Premium taxes |
723,067 | 620,726 | ||
|
Ceding commissions |
(959,451) | (851,412) | ||
|
Underwriting |
384,814 | 341,006 | ||
|
Net deferred |
7,304,865 | 6,996,082 | ||
|
Amortized |
7,124,672 | 6,813,891 | ||
|
DAC, end of year |
$ 4,162,927 |
$ 3,982,734 |
||
|
|
||||
|
Policy acquisition costs: |
||||
|
Amortized to expense |
$ 7,124,672 |
$ 6,813,891 |
||
|
Period costs: |
||||
|
Contingent commission |
1,826,944 | 1,528,651 | ||
|
Other underwriting expenses |
6,896,931 | 6,212,869 | ||
|
Total policy acquisition costs |
$ 15,848,547 |
$ 14,555,411 |
5. DEBT
As of December 31, 2016 and 2015, outstanding debt balances totaled $3,786,950 and $3,273,560, respectively. The Company incurred interest expense for the years ended December 31, 2016 and 2015 of $226,095 and $136,295, respectively. The average rate on debt was 5.0% in 2016 compared to 4.5% in 2015. The debt balance is comprised of the following:
Surplus Notes
The Company has $1,850,000 and $1,921,428 of surplus notes issued, for cash, and outstanding as of December 31, 2016 and 2015, respectively. Payment of principal and interest on all surplus notes requires specific approval by the Illinois Department of Insurance. The Company’s obligation to pay principal and interest on surplus notes is subordinate to the insurance claims of policyholders of the Company in accordance with terms of Section 56 of the Illinois Insurance Code.
~ 79 ~
Subject to the approval of the Director of Insurance of the State of Illinois and the applicable provisions of the Illinois Insurance Code, the noteholder shall have the right at the time of a stock conversion of the Company, upon not less than thirty (30) days’ written notice to the Company, to convert all or any portion of the outstanding principal amount of the note into common shares of the Company.
Additional information regarding each surplus note follows:
|
|
Principal |
Total |
Unapproved |
|||||||||||
|
|
Par Value |
Carrying |
and/or |
Principal |
Principal |
|||||||||
|
|
Interest |
(Face Amount |
Value of |
Interest Paid |
and/or |
and/or |
Date of |
|||||||
|
Date Issued |
Rate |
of Notes) |
Note |
Current Year |
Interest Paid |
Interest |
Maturity |
|||||||
|
12/31/2003 |
5.35% | 1,600,000 | 1,600,000 | 85,600 | 1,116,800 |
— |
12/31/2033 |
|||||||
|
7/15/2004 |
7.00% | 410,000 | 250,000 | 17,500 | 461,207 |
— |
7/15/2034 |
|||||||
|
8/31/2004 |
7.00% | 250,000 |
— |
72,857 | 413,161 |
— |
8/31/2016 |
|||||||
|
|
2,260,000 | 1,850,000 | 175,957 | 1,991,168 |
— |
Note holders are entitled to 1/28th of the principal each year. To date, the note holders of the surplus notes maturing on 12/31/2033 and 7/15/2034 have elected to waive principal repayment. The terms of the note allow for the conversion to equity should the company convert from a mutual insurance company to a stock insurance company.
Leasehold Obligations
The Company entered into a sale leaseback arrangement in 2016 that is accounted for as a capital lease. Under the agreement, BofI Federal Bank purchased electronic data processing software, vehicles, and other assets which are leased to the Company. These assets remain on the Company’s books due to provisions within the agreement that trigger capital lease accounting. To secure the lowest rate possible of 4.7%, the Company pledged additional bonds totaling $860,969 during 2016, bringing the total pledged to $1,808,523 and $947,554 as of December 31, 2016 and 2015, respectively. There was no gain or loss recognized as part of this transaction. Lease payments totaled $438,593 and $64,182 for the years ended December 31, 2016 and 2015, respectively. The term of the electronic data processing lease is 48 months and the term of the titled vehicles lease is 36 months. The outstanding lease obligation at December 31, 2016, was $1,227,541 compared to $859,818 at Decemeber 31, 2015.
Future minimum lease payments for the four succeeding years as of December 31, 2016 are:
|
Year |
Amount |
|||||||||||||
|
2017 |
$ |
501,972 | ||||||||||||
|
2018 |
501,972 | |||||||||||||
|
2019 |
361,374 | |||||||||||||
|
2020 |
30,190 | |||||||||||||
|
Total payments |
1,395,508 | |||||||||||||
|
Less: Interest portion |
167,967 | |||||||||||||
|
Total oustanding lease obligation |
$ |
1,227,541 | ||||||||||||
Debt Obligation
Additionally, the Company entered into two debt agreements in 2016; one agreement for $500,000 and another debt agreement for $75,000. The terms of the loans are 36 months, but the Company has the option to prepay the $500,000 loan after 12 months. The total balance of debt agreements at year end 2016 and 2015 was $525,620 and $0, respectively. The loans bear interest at 4.7%. Interest paid for the twelve months ended December 31, 2016 and 2015 was $8,146 and $0, respectively.
Home Office Mortgage
The Company maintains a mortgage on its home office. Interest is charged at a fixed rate of 2.6% and the loan matures in 2017. The building is used as collateral to secure the loan. The loan balance at year end 2016 and 2015 was $183,790 and $492,315, respectively. The interest paid on the loan in 2016 was $9,163 and $17,153 in 2015.
~ 80 ~
Payment due subsequent to December 31, 2016 are summarized below:
|
Year |
Amount |
|||||||||||||
|
2017 |
$ |
185,395 | ||||||||||||
|
Less: Interest portion |
25000 | 1,605 | ||||||||||||
|
Total outstanding mortgage obligation |
$ |
183,790 | ||||||||||||
Revolving Line of Credit
We maintain a revolving line of credit with American Bank & Trust, which permits borrowing up to an aggregate principal amount of $2.0 million. This facility was entered into during 2013 and is renewed annually with a current expiration of August 1, 2017. The line of credit is priced at 30 day LIBOR plus 2% with a floor of 3.5%. Interest paid on the line of credit in 2016 was immaterial. There are no financial covenants governing this agreement. For the years ended December 31, 2016 and 2015, no amounts were outstanding on this facility.
6. REINSURANCE
In the ordinary course of business, the Company assumes and cedes premiums and selected insured risks with other insurance companies, known as reinsurance. A large portion of the reinsurance is put into effect under contracts known as treaties and, in some instances, by negotiation on each individual risk (known as facultative reinsurance). In addition, there are several types of treaties including quota share, excess of loss and catastrophe reinsurance contracts that protect against losses over stipulated amounts arising from any one occurrence or event. The arrangements allow the Company to pursue greater diversification of business and serve to limit the maximum net loss to a single event, such as a catastrophe. Through the quantification of exposed policy limits in each region and the extensive use of computer-assisted modeling techniques, management monitors the concentration of risks exposed to catastrophic events.
Through the purchase of reinsurance, the Company also generally limits its net loss on any individual risk to a maximum of $500,000, although certain treaties contain an annual aggregate deductible before reinsurance applies.
Premiums, written and earned, along with losses and settlement expenses incurred for the years ended December 31 are summarized as follows:
|
|
2016 |
2015 |
||||
|
WRITTEN |
||||||
|
Direct |
$ |
51,031,003 |
$ |
49,047,060 | ||
|
Reinsurance assumed |
307,597 | 346,280 | ||||
|
Reinsurance ceded |
(8,111,446) | (7,762,059) | ||||
|
Net |
$ |
43,227,154 |
$ |
41,631,281 | ||
|
EARNED |
||||||
|
Direct |
$ |
50,190,888 |
$ |
47,616,234 | ||
|
Reinsurance assumed |
318,476 | 326,234 | ||||
|
Reinsurance ceded |
(7,898,000) | (7,722,607) | ||||
|
Net |
$ |
42,611,365 |
$ |
40,219,861 | ||
|
LOSSES AND SETTLEMENT EXPENSES INCURRED |
||||||
|
Direct |
$ |
33,388,283 |
$ |
28,462,833 | ||
|
Reinsurance assumed |
149,719 | 220,831 | ||||
|
Reinsurance ceded |
(9,193,451) | (4,883,150) | ||||
|
Net |
$ |
24,344,551 |
$ |
23,800,514 | ||
The reinsurance assumed business consists of assigned risk pools, which require the Company to participate in certain workers’ compensation and other liability pools, as a result of their licensure and premium writings in the various states in which it does business.
At December 31, 2016 and 2015, the Company had prepaid reinsurance premiums and recoverables on paid and unpaid losses and settlement expenses totaling $12,114,998 and $19,158,224, respectively. More than 98% of the Company’s reinsurance recoverables are due from companies with financial strength ratings of “A” or better by A.M. Best.
~ 81 ~
The following table displays net reinsurance balances recoverable, after consideration of collateral, from the Company’s top 10 reinsurers as of December 31, 2016. These reinsurers all have financial strength ratings of “A” or better by A.M. Best. Also shown are the amounts of written premium ceded to these reinsurers during the calendar year 2016.
|
|
|||||||||||
|
|
Net Reinsurer |
Ceded |
|||||||||
|
|
A.M. Best |
S & P |
Exposure as of |
Percent of |
Premiums |
Percent of |
|||||
|
(In thousands) |
Rating |
Rating |
December 31, 2016 |
Total |
Written |
Total |
|||||
|
Everest Reinsurance Company |
A+ |
A+ |
3,327 | 23.4% | 1,875 | 23.1% | |||||
|
Partner Reinsurance Company |
A |
A+ |
2,431 | 17.1% | 548 | 6.8% | |||||
|
Hannover Ruckversicherungs |
A+ |
AA- |
2,099 | 14.8% | 969 | 11.9% | |||||
|
Aspen Insurance UK Ltd |
A |
A |
2,030 | 14.3% | 1,090 | 13.4% | |||||
|
Toa Reinsurance Company |
A+ |
A+ |
1,798 | 12.6% |
— |
0.0% | |||||
|
Platinum Underwriters |
A |
A- |
1,109 | 7.8% |
— |
0.0% | |||||
|
Swiss Reinsurance |
A+ |
AA- |
1,068 | 7.5% | 571 | 7.0% | |||||
|
Endurance |
A |
A |
637 | 4.5% | 818 | 10.1% | |||||
|
Allied World Reinsurance |
A |
A |
607 | 4.3% | 896 | 11.0% | |||||
|
Lloyd's Syndicate Number 1880 |
A |
A+ |
116 | 0.8% | 233 | 2.9% | |||||
|
All other reinsurers including anticipated subrogation |
|
|
|
|
(994) |
|
-7.0% |
|
1,111 |
|
13.7% |
|
|
14,228 | 100.0% | 8,111 | 100.0% |
Ceded unearned premiums and reinsurance balances recoverable on paid losses and settlement expenses are reported separately as an asset, rather than being netted with the related liability, since reinsurance does not relieve the Company of its liability to policyholders. Such balances are subject to the credit risk associated with the individual reinsurer. On a quarterly basis, the financial condition of the Company’s reinsurers is monitored. As part of the monitoring efforts, management reviews annual summarized financial data and publically available information. The credit risk associated with the reinsurance balances recoverable is analyze by monitoring the A.M. Best and S&P ratings of the reinsurers. In addition, the Company subjects its reinsurance recoverables to detailed recoverability tests, including one based on average default by A.M. Best rating.
Once regulatory action (such as receivership, finding of insolvency, order of conservation or order of liquidation) is taken against a reinsurer, the paid and unpaid recoverable for the reinsurer are specifically identified and written off through the use of the allowance for estimated unrecoverable amounts from reinsurers. When such a balance is written off, it is done in full. The Company then re-evaluates the remaining allowance and determines whether the balance is sufficient as detailed above, and if needed, an additional allowance is recognized and income charged. The Company had no allowance recorded related to uncollectible amounts on paid and unpaid recoverables at December 31, 2016 and 2015. The Company has no receivables with a due date that extends beyond 90 days from the date of billing that are not included in the allowance for uncollectible amounts.
~ 82 ~
7. UNPAID LOSSES AND SETTLEMENT EXPENSES
The following table is a reconciliation of the Company’s unpaid losses and settlement expenses for the years 2016 and 2015.
|
(In thousands) |
2016 |
2015 |
||||
|
Unpaid losses and settlement expense - beginning of the period: |
||||||
|
Gross |
$ |
61,056 |
$ |
64,617 | ||
|
Less: Ceded |
19,158 | 25,822 | ||||
|
Net |
41,898 | 38,795 | ||||
|
Increase (decrease) in incurred losses and settlement expense: |
||||||
|
Current year |
25,620 | 24,293 | ||||
|
Prior years |
(1,275) | (493) | ||||
|
Total incurred |
24,345 | 23,800 | ||||
|
Deduct: Loss and settlement expense payments for claims incurred: |
||||||
|
Current year |
7,649 | 6,466 | ||||
|
Prior years |
17,892 | 14,231 | ||||
|
Total paid |
25,541 | 20,697 | ||||
|
Net unpaid losses and settlement expense - end of the period |
40,702 |
$ |
41,898 | |||
|
Plus: Reinsurance recoverable on unpaid losses |
12,115 | 19,158 | ||||
|
Gross unpaid losses and settlement expense - end of the period |
$ |
52,817 |
$ |
61,056 | ||
|
|
||||||
|
(In thousands) |
2016 |
2015 |
||||
|
Supplemental ceded unpaid losses and settlement expense at end of year disclosure: |
||||||
|
Reinsurance balances recoverable on unpaid losses and settlement expenses, |
||||||
|
net of allowances for uncollectible amounts of $0 in 2016 and $0 in 2015 |
$ |
12,115 |
$ |
19,535 | ||
|
Less : Reinsurance balances payable |
— |
377 | ||||
|
Reinsurance recoverable on unpaid losses |
$ |
12,115 |
$ |
19,158 | ||
Differences from the initial reserve estimates emerged as changes in the ultimate loss estimates as those estimates were updated through the reserve analysis process. The recognition of the changes in initial reserve estimates occurred over time as claims were reported, initial case reserves were established, initial reserves were reviewed in light of additional information and ultimate payments were made on the collective set of claims incurred as of that evaluation date. The new information on the ultimate settlement value of claims is updated until all claims in a defined set are settled. As a small specialty insurer with a niche product portfolio, the Company’s experience will ordinarily exhibit fluctuations from period to period. While management attempts to identify and react to systematic changes in the loss environment, they must also consider the volume of experience directly available to the Company and interpret any particular period’s indications with a realistic technical understanding of the reliability of those observations.
A discussion of significant components of reserve development for the two most recent calendar years follows:
2016
The Company experienced favorable development relative to prior years’ reserve estimates in its casualty line of business primarily from the 2015 accident year. Liquor Liability and Workers’ Compensation were the largest contributors to the favorable development, partially offset by adverse development in Business Liability.
2015
For calendar year 2015, the Company experienced favorable development relative to prior years’ reserve estimates in its property line of business primarily from the 2014 accident year. This was partially offset by adverse development in the casualty line of business in Liquor Liability, with approximately 89.4% of the development coming from this business.
~ 83 ~
8. INCOME TAXES
The tax effects of temporary differences that give rise to significant portions of the deferred tax assets and deferred tax liabilities are summarized as follows:
|
|
||||||
|
|
December 31, |
|||||
|
|
2016 |
2015 |
||||
|
Deferred tax assets: |
||||||
|
Tax discounting of claim reserves |
$ |
730,161 |
$ |
830,440 | ||
|
Unearned premium reserve |
1,710,498 | 1,660,239 | ||||
|
AMT credit carryforward |
— |
166,535 | ||||
|
Deferred compensation |
356,650 | 275,992 | ||||
|
Provision for uncollectible accounts |
17,000 | 34,000 | ||||
|
Property and equipment |
837 |
— |
||||
|
Other |
88,393 | 478,386 | ||||
|
Deferred tax assets before allowance |
2,903,539 | 3,445,592 | ||||
|
Less valuation allowance |
— |
— |
||||
|
Total deferred tax assets |
$ |
2,903,539 |
$ |
3,445,592 | ||
|
Deferred tax liabilities: |
||||||
|
Net unrealized appreciation of securities |
$ |
594,575 |
$ |
273,080 | ||
|
Deferred policy acquisition costs |
1,415,395 | 1,354,130 | ||||
|
Property and equipment |
— |
23,271 | ||||
|
Other |
5,315 | 394,459 | ||||
|
Total deferred tax liabilities |
2,015,285 | 2,044,940 | ||||
|
Net deferred tax asset |
$ |
888,254 |
$ |
1,400,652 | ||
Income tax expense attributable to income from operations for the years ended December 31, 2016 and 2015, differed from the amounts computed by applying the U.S. federal tax rate of 34% to pretax income from continuing operations as demonstrated in the following table:
|
|
||||||
|
|
Years ended December 31, |
|||||
|
|
2016 |
2015 |
||||
|
Provision for income taxes at the statutory federal tax rates |
$ |
1,355,704 |
$ |
1,025,600 | ||
|
Increase (reduction) in taxes resulting from: |
||||||
|
Dividends received deduction |
(36,414) |
— |
||||
|
Tax-exempt interest income |
(163,011) | (174,808) | ||||
|
15% proration of tax exempt interest |
29,914 | 26,222 | ||||
|
Officer life insurance, net |
(1,292) | 3,474 | ||||
|
Nondeductible expenses |
47,766 | 35,313 | ||||
|
Prior year true-ups and other |
(55,698) | (54,059) | ||||
|
Total |
$ |
1,176,969 |
$ |
861,742 | ||
The Company’s effective tax rate was 29.5% and 28.6% for 2016 and 2015, respectively. Effective rates are dependent upon components of pretax earnings and the related tax effects.
The Company has recorded its deferred tax assets and liabilities using the statutory federal tax rate of 34%. Management believes it is more likely than not that all deferred tax assets will be recovered given the carry back availability as well as the results of future operations, which will generate sufficient taxable income to realize the deferred tax asset. In addition, it is believed that when these deferred items reverse in future years, taxable income will be taxed at an effective rate of 34%.
Federal and state income taxes paid in 2016 and 2015 amounted to $300,000 and $950,000, respectively. As of December 31, 2016, the Company does not have any capital or operating loss carryforwards. Periods still subject to Internal Revenue Service (IRS) audit include 2013 through current year. There are currently no open tax exams.
~ 84 ~
9. EMPLOYEE BENEFITS
401(K) AND BONUS AND INCENTIVE PLANS
The Company maintains a 401(k) and bonus and incentive plans covering executives, managers, and associates. Excluding the 401(k), at the CEO’s discretion, funding of these plans is primarily dependent upon reaching predetermined levels of combined ratio, growth in statutory surplus, growth in direct written premium, and overall renewal retention ratios. Bonuses are earned as the Company generates earnings in excess of this required return. While some management incentive plans may be affected somewhat by other performance factors, the larger influence of corporate performance ensures that the interests of the executives, managers, and associates corresponds with those of the stakeholders.
The 401(k) plan offers a matching percentage up to 4% of eligible compensation, as well as a profit sharing percentage of each employee’s compensation. Participants are 100% vested in the matching percentage and vest at a rate of 25% per year for the profit sharing distribution. Additionally, bonuses may be awarded to executives, managers, and associates through company incentive plans, provided certain financial or operational goals are met. Annual expenses for these incentive plans totaled $724,965 and $776,390 for 2016 and 2015, respectively.
DEFERRED COMPENSATION
In November 2012, the Company entered into a deferred compensation agreement with an executive of the Company. The agreement requires the Company to make payments to the executive beginning at retirement (age 62). In the event of separation of service without cause prior to age 62, benefits under this agreement vest 25% in November 2017, 50% in November 2022, 75% in November 2027, and 100% on January 1, 2032. In the event of death prior to retirement, benefits become fully vested and are payable to the executive’s beneficiaries. Using a discount rate of 4.14%, the fully vested obligation under the agreement would total approximately $1,610,932 on January 1, 2032. As of December 31, 2016 and 2015, the accrued liability related to this agreement totaled $153,409 and $173,676, respectively. The Company’s recognized $20,267 of benefit and $68,000 of expense in 2016 and 2015, respectively.
10. STATUTORY INFORMATION AND DIVIDEND RESTRICTIONS
The statutory financial statements of ICC are presented on the basis of accounting practices prescribed or permitted by the Illinois Department of Insurance, which has adopted the National Association of Insurance Commissioners (NAIC) statutory accounting practices as the basis of its statutory accounting practices. ICC did not use any permitted statutory accounting practices that differ from NAIC prescribed statutory accounting practices. In converting from statutory to GAAP, typical adjustments include deferral of policy acquisition costs, the inclusion of statutory non-admitted assets and the inclusion of net unrealized holding gains or losses in equity relating to AFS investment securities, and the reclassification of surplus notes from equity to debt.
The NAIC has Risk-based capital (RBC) requirements that require insurance companies to calculate and report information under a risk-based formula, which measures statutory capital and surplus needs based upon a regulatory definition of risk relative to the company’s balance sheet and mix of products. As of December 31, 2016 and 2015, ICC had RBC amounts in excess of the authorized control level RBC, as defined by the NAIC. ICC had an authorized control level RBC of $6,314,396 and $6,175,978 as of December 31, 2016 and 2015, respectively, compared to actual statutory capital and surplus of $29,957,250 and $26,855,678, respectively, for these same periods.
Year-end statutory surplus for 2016 and 2015 presented in the table below includes $51,207 and $115 of Estrella Innovative Solutions, LLC common stock (cost basis of $270,078 and $170,078) held by ICC. This investment is eliminated in the GAAP consolidated financial statements.
The following table includes selected information for our insurance subsidiary:
|
|
||||||
|
|
As of and years ended December 31, |
|||||
|
|
2016 |
2015 |
||||
|
Net income, statutory basis |
$ |
3,445,706 |
$ |
1,849,291 | ||
|
Consolidated surplus, statutory basis |
$ |
29,957,250 |
$ |
26,855,678 | ||
~ 85 ~
No Illinois domiciled company may pay any extraordinary dividend or make any other extraordinary distribution to its security holders until: (a) 30 days after the Director has received notice of the declaration thereof and has not within such period disapproved the payment, or (b) the Director approves such payment within the 30-day period. For purposes of this subsection, an extraordinary dividend or distribution is any dividend or distribution of cash or other property whose fair market value, together with that of other dividends or distributions, made within the period of 12 consecutive months ending on the date on which the proposed dividend is scheduled for payment or distribution exceeds the greater of: (a) 10% of the company’s surplus as regards policyholders as of the 31st day of December next preceding, or (b) the net income of the company for the 12-month period ending the 31st day of December next preceding, but does not include pro rata distributions of any class of the company’s own securities.
The Company did not pay any dividends to security holders in 2016 or 2015. It did however, make cash dividend payments in the amount of $1,838 and $1,452 in 2016 and 2015, respectively, to Wisconsin policyholders in accordance with policy contractual obligations.
11. RELATED PARTY
Mr. John R. Klockau, a director of the Company, holds two surplus note from the Company totaling $1,150,000. The first note is for $1,000,000 and bears interest at 5.35%. The second note is for $150,000 and bears interest at 7.00%. Mr. Klockau was paid interest in the amount of $64,000 in both 2016 and 2015. Additionally, Mr. Klockau is a claims consultant and was paid $12,944 and $14,011 in 2016 and 2015, respectively, related to his services to the Company.
Mr. Scott T. Burgess is a director of the Company and a Senior Managing Director of Griffin Financial Group. Mr. Burgess was paid $2,190 and $2,284 in 2016 and 2015, respectively. Griffin Financial Group was paid $9,910 and $75,000 in 2016 and 2015, respectively. Griffin and Stevens & Lee are affiliated. Stevens & Lee is a full-service law firm that was paid $630,125 and $0 as of December 31, 2016 and 2015, respectively.
Mr. Dan Porters is a director of the Company and the Chairman and CEO of Management Resource Group, Ltd (MRG). MRG was paid $4,900 and $0 in 2016 and 2015, respectively.
12. COMMITMENTS AND CONTINGENT LIABILITIES
The Company is party to numerous claims, losses, and litigation matters that arise in the normal course of business. Many of such claims, losses, or litigation matters involve claims under policies that the Company underwrites as an insurer. Management believes that the resolution of these claims and losses will not have a material adverse effect on the Company’s financial condition, results of operations, or cash flows.
The Company has operating lease obligations related to managing the business. Minimum future rental payments under non-cancellable agreements are as follows:
|
|
|||
|
Year |
Payments |
||
|
2017 |
$ |
43,532 | |
|
2018 |
18,257 | ||
|
2019 |
16,736 | ||
|
2020 |
— |
||
|
2021 |
— |
||
|
Total |
$ |
78,525 | |
Rent expense totaled $3,643 and $32,457 in 2016 and 2015, respectively.
13. SUBSEQUENT EVENTS
Subsequent events have been evaluated through the date the financial statements were issued.
On February 1, 2017, the Illinois Department of Insurance approved the Company’s Plan of Conversion filing to convert from a mutual to a stock insurance company.
On February 7, 2017, the Company received preliminary approval for expansion into the state of Colorado. On March 20, 2017, we received our license to write business in the state of Kansas.
~ 86 ~
On February 14, 2017, the SEC approved the Company's initial public offering. As of March 15, 2017, the Company received common stock orders for an amount in excess of the offering range referenced in the prospectus. The plan of conversion was approved by ICC policyholders at a special meeting on March 17, 2017. Simultaneously, surplus notes totaling $1.65 million were converted into 165,000 shares of the Company’s common stock. Included in the conversion of surplus notes, John R. Klockau, a director of the Company, converted $1.15 million in exchange for 115,000 shares of the Company’s common stock. John R. Klockau received a payment for interest on the surplus note of $12,975. The Company’s offering closed on March 24, 2017, and on March 28, 2017, the Company’s stocks began trading on the NASDAQ Capital Market under the “ICCH” ticker. The Company paid $978,150 of underwriting fees to Griffin Financial Group, LLC. Proceeds received from the offering totaled $3.5 million.
Upon closing of the offering, R. Kevin Clinton became a member of our Board of Directors on March 24, 2017.
On March 28, 2017, the Company borrowed $3.5 million from American Bank & Trust at an interest rate of 3.65%. Our line of credit was decreased from $2.0 million to $1.75 million. Additionally, we pledged the ESOP shares and $1.5 million in trust assets.
~ 87 ~
Report of Independent Registered Public Accounting Firm on
Financial Statement Schedules
Audit Committee, Board of Directors and Policyholders
Illinois Casualty Company
Rock Island, Illinois
In connection with our audit of the consolidated financial statements of Illinois Casualty Company for each of the two years in the period ended December 31, 2016, we have also audited Schedules III, IV, V, and VI on pages 89 through 92. These financial statement schedules are the responsibility of the Company’s management. Our responsibility is to express an opinion on these financial statement schedules based on our audits of the basic financial statements. The schedules are presented for purposes of complying with the Securities and Exchange Commission's rules and regulations and are not a required part of the consolidated financial statements.
In our opinion, the financial statement schedules referred to above, when considered in relation to the basic consolidated financial statements taken as a whole, present fairly, in all material respects, the information required to be included therein.
BKD, LLP
/s/ BKD, LLP
Cincinnati, Ohio
March 31, 2017
~ 88 ~
ILLINOIS CASUALTY COMPANY AND SUBSIDIARIES
Schedule III — Supplemental Insurance Information
Years ended December 31, 2016 and 2015
|
|
Future policy |
||||||||||||||
|
|
benefits, losses, |
Other policy |
|||||||||||||
|
|
Deferred policy |
claims and loss |
Unearned |
and benefits |
Net premiums |
||||||||||
|
(In thousands) |
acquisition costs |
expenses |
premiums |
payable |
earned |
||||||||||
|
December 31, 2016 |
|||||||||||||||
|
Commercial Business |
$ |
4,163 |
$ |
52,817 |
$ |
24,778 |
$ |
110 |
$ |
42,611 | |||||
|
Total |
$ |
4,163 |
$ |
52,817 |
$ |
24,778 |
$ |
110 |
$ |
42,611 | |||||
|
December 31, 2015 |
|||||||||||||||
|
Commercial Business |
$ |
3,983 |
$ |
61,056 |
$ |
23,948 |
$ |
— |
$ |
40,220 | |||||
|
Total |
$ |
3,983 |
$ |
61,056 |
$ |
23,948 |
$ |
— |
$ |
40,220 | |||||
|
|
Benefits, claims, |
||||||||||||||
|
|
losses and |
||||||||||||||
|
|
Net investment |
settlement |
Amortization |
Other operating |
Net premiums |
||||||||||
|
(In thousands) |
income |
expenses |
of DAC |
expenses |
written |
||||||||||
|
December 31, 2016 |
|||||||||||||||
|
Commercial Business |
$ |
1,968 |
$ |
24,345 |
$ |
7,125 |
$ |
9,414 |
$ |
43,227 | |||||
|
Total |
$ |
1,968 |
$ |
24,345 |
$ |
7,125 |
$ |
9,414 |
$ |
43,227 | |||||
|
December 31, 2015 |
|||||||||||||||
|
Commercial Business |
$ |
1,333 |
$ |
23,801 |
$ |
6,814 |
$ |
8,192 |
$ |
41,631 | |||||
|
Total |
$ |
1,333 |
$ |
23,801 |
$ |
6,814 |
$ |
8,192 |
$ |
41,631 | |||||
See accompanying notes to consolidated financial statements and report of independent registered public accounting firm.
~ 89 ~
ILLINOIS CASUALTY COMPANY AND SUBSIDIARIES
Schedule IV — Reinsurance
Years ended December 31, 2016 and 2015
|
|
||||||||||||||
|
(In thousands) |
Ceded to |
Assumed From |
Percentage of |
|||||||||||
|
Premiums |
Gross |
Other |
Other |
Amount |
||||||||||
|
Earned |
Amount |
Companies |
Companies |
Net Amount |
Assumed to Net |
|||||||||
|
2016 |
$ |
50,191 |
$ |
7,898 |
$ |
318 |
$ |
42,611 | 0.7% | |||||
|
2015 |
$ |
47,616 |
$ |
7,723 |
$ |
326 |
$ |
40,220 | 0.8% | |||||
See accompanying notes to consolidated financial statements and report of independent registered public accounting firm.
~ 90 ~
ILLINOIS CASUALTY COMPANY AND SUBSIDIARIES
Schedule V — Allowance for Uncollectible Premiums and Other Receivables
Years ended December 31, 2016 and 2015
|
(In thousands) |
2016 |
2015 |
||||
|
Beginning balance |
$ |
100 |
$ |
50 | ||
|
Additions |
— |
50 | ||||
|
Deletion |
(50) |
— |
||||
|
Ending balance |
$ |
50 |
$ |
100 | ||
See accompanying notes to consolidated financial statements and report of independent registered public accounting firm.
~ 91 ~
ILLINOIS CASUALTY COMPANY AND SUBSIDIARIES
Schedule VI — Supplemental Information
Years ended December 31, 2016 and 2015
|
|
||||||||||||||||||
|
|
Deferred |
Reserve for |
||||||||||||||||
|
|
policy |
Losses and |
Discount if |
Net |
||||||||||||||
|
|
acquisition |
settlement |
any deducted |
Unearned |
Net earned |
investment |
||||||||||||
|
(In thousands) |
costs |
expenses |
from reserves |
premium |
premiums |
income |
||||||||||||
|
2016 |
$ |
4,163 |
$ |
52,817 |
$ |
— |
$ |
24,778 |
$ |
42,611 |
$ |
1,968 | ||||||
|
2015 |
$ |
3,983 |
$ |
61,056 |
$ |
— |
$ |
23,948 |
$ |
40,220 |
$ |
1,333 | ||||||
|
|
Paid losses |
|||||||||||||||||
|
|
Losses and settlment |
and |
||||||||||||||||
|
|
expenses incurred related to |
Amortization |
settlement |
Net written |
||||||||||||||
|
(In thousands) |
Current year |
Prior year |
of DAC |
expenses |
premiums |
|||||||||||||
|
2016 |
$ |
25,620 |
$ |
(1,275) |
$ |
7,125 |
$ |
(25,541) |
$ |
43,227 | ||||||||
|
2015 |
$ |
24,293 |
$ |
(493) |
$ |
6,814 |
$ |
(20,697) |
$ |
41,631 | ||||||||
See accompanying notes to consolidated financial statements and report of independent registered public accounting firm.
~ 92 ~
Item 9. Changes in and Disagreements with Accountants on Accounting and Financial Disclosure
None.
Item 9A. Controls and Procedures
A control system, no matter how well conceived and operated, can provide only reasonable, not absolute, assurance that the objectives of the control system are met. Further, the design of a control system must reflect the fact that there are resource constraints, and the benefits of controls must be considered relative to their costs. Because of the inherent limitations in all control systems, no evaluation of controls can provide absolute assurance that all control issues and instances of fraud, if any, within the Company have been detected.
Disclosure Controls and Procedures
The Company maintains disclosure controls and procedures (as defined in Rules 13a-15(e) and 15d-15(e) under the Securities Exchange Act of 1934, as amended (the “Exchange Act”) that are designed to ensure that required information is recorded, processed, summarized and reported within the required timeframe as specified in the SEC’s rules and forms of the SEC. Our disclosure controls and procedures are also designed to ensure that information required to be disclosed is accumulated and communicated to the Company’s management, including our Chief Executive Officer and Chief Financial Officer, to allow timely decisions regarding required disclosure.
Our management, with the participation of the Chief Executive Officer and the Chief Financial Officer, evaluated the effectiveness of our disclosure controls and procedures at December 31, 2016. Based on this evaluation, the Chief Executive Officer and the Chief Financial Officer concluded that our disclosure controls and procedures were effective, at the reasonable assurance level, as of December 31, 2016.
Changes in Internal Control over Financial Reporting
There were no changes in our internal control over financial reporting (as defined in Rule 13a-15(f) of the Exchange Act) during the year ended December 31, 2016 that have materially affected, or are reasonably likely to materially affect, the Company’s internal control over financial reporting.
Management's Report on Internal Control Over Financial Reporting and Attestation Report of the Registered Public Accounting Firm
This Annual Report does not include a report of management's assessment regarding internal control over financial reporting or an attestation report of our independent registered public accounting firm due to a transition period established by the rules of the SEC for newly public companies.
None.
Items 10 through 14 (inclusive) of this Part III are not included herein because the Company will file a definitive Proxy Statement with the SEC that will include the information required by such Items, and such information is incorporated herein by reference. The Company’s Proxy Statement will be filed with the SEC and delivered to stockholders in connection with the Annual Meeting of Shareholders to be held on May 23, 2017, and the information under the following captions is included in such incorporation by reference: “Directors, Executive Officers and Corporate Governance,” “Executive Compensation,” “Security Ownership of Certain Beneficial Owners and Management and Related Stockholder Matters,” “Certain Relationships and Related Transactions, and Director Independence,” and “Principal Accounting Fees and Services.”
~ 93 ~
Item 15. Exhibits, Financial Statement Schedules
|
(a) |
(1-2) See Item 8 for Consolidated Financials Statements and Schedules included in this report. |
(3) Exhibits. See Exhibit Index on page 94.
|
(b) |
Exhibits. See Exhibit Index on page 94. |
|
(c) |
Financial Statement Schedules. See Financial Statement Schedules on pages 86-89. |
~ 94 ~
Pursuant to the requirements of Section 13 or 15(d) of the Securities Exchange Act of 1934, the registrant has duly caused this report to be signed on its behalf by the undersigned, thereunto duly authorized.
|
|
|
|
|
|
|
|
|
|
|
ICC HOLDINGS, INC. |
||
|
|
|||||
|
|
|
|
By: |
|
/s/ Arron K. Sutherland |
|
|
|
|
|
|
Arron K. Sutherland, President and Chief Executive Officer |
Pursuant to the requirements of the Securities Exchange Act of 1934, this report has been signed below by the following persons on behalf of the registrant and in the capacities and on the dates indicated.
|
|
|
|
|
|
|
Signature |
|
Capacity |
|
Date |
|
|
||||
|
/s/ Arron K. Sutherland Arron K. Sutherland |
|
President and Chief Executive Officer (Principal Executive Officer) |
|
March 31, 2017 |
|
|
|
|
|
|
|
/s/ Joel K. Heriford |
||||
|
Joel K. Heriford |
|
Director |
|
March 31, 2017 |
|
|
||||
|
Gerald J. Pepping |
|
Director |
|
March 31, 2017 |
|
|
||||
|
/s/ Mark J. Schwab Mark J. Schwab |
|
Director |
|
March 31, 2017 |
|
|
||||
|
/s/ Scott T. Burgess Scott T. Burgess |
|
Director |
|
March 31, 2017 |
|
|
||||
|
James R. Dingman |
|
Director |
|
March 31, 2017 |
|
|
||||
|
/s/ John R. Klockau John R. Klockau |
|
Director |
|
March 31, 2017 |
|
|
||||
|
/s/ Daniel H. Portes Daniel H. Portes |
|
Director |
|
March 31, 2017 |
|
|
||||
|
/s/ Christine C. Schmitt Christine C. Schmitt |
|
Director |
|
March 31, 2017 |
|
|
||||
|
/s/ Michael R. Smith Michael R. Smith |
|
Chief Financial Officer (Principal Financial and Accounting Officer) |
|
March 31, 2017 |
~ 95 ~
|
Exhibit |
Description |
|
| 1.1 |
Form of Agency Agreement among ICC Holdings, Inc., Illinois Casualty Company and Griffin Financial Group, LLC (incorporated by reference to Exhibit 1.1 to Amendment No. 1 to the Registrant’s Registration Statement on Form S-1 (File No. 333-214081) filed on November 7, 2016) |
|
| 2.1 |
Plan of Conversion from mutual to stock form of Illinois Casualty Company, dated as of February 16, 2016, as amended and restated November 14, 2016 (incorporated by reference to Exhibit 2.1 to Amendment No. 2 to the Registrant’s Registration Statement on Form S-1 (File No. 333-214081) filed on December 23, 2016) |
|
| 3.1 |
Form of Amended and Restated Articles of Incorporation of ICC Holdings, Inc. (incorporated by reference to Exhibit 3.1 to Amendment No. 2 to the Registrant’s Registration Statement on Form S-1 (File No. 333-214081) filed on December 23, 2016) |
|
| 3.2 |
Form of Amended and Restated Bylaws of ICC Holdings, Inc. (incorporated by reference to Exhibit 3.2 to Amendment No. 2 to the Registrant’s Registration Statement on Form S-1 (File No. 333-214081) filed on December 23, 2016) |
|
| 4.1 |
Form of certificate evidencing shares of common stock of ICC Holdings, Inc. (incorporated by reference to Exhibit 4.1 to Amendment No. 2 to the Registrant’s Registration Statement on Form S-1 (File No. 333-214081) filed on December 23, 2016) |
|
| 10.1 |
Employment Agreement among ICC Holdings, Inc., Illinois Casualty Company and Arron K. Sutherland (incorporated by reference to Exhibit 10.1 to Amendment No. 1 to the Registrant’s Registration Statement on Form S-1 (File No. 333-214081) filed on November 7, 2016) |
|
| 10.2 |
Form of Change of Control Agreement among ICC Holdings, Inc., Illinois Casualty Company and an employee (incorporated by reference to Exhibit 10.2 to Amendment No. 1 to the Registrant’s Registration Statement on Form S-1 (File No. 333-214081) filed on November 7, 2016) |
|
| 10.3 |
ICC Holdings, Inc. Employee Stock Ownership Plan (incorporated by reference to Exhibit 10.3 to Amendment No. 1 to the Registrant’s Registration Statement on Form S-1 (File No. 333-214081) filed on November 7, 2016) |
|
| 10.4 |
Purchase Agreement among ICC Holdings, Inc., Illinois Casualty Company, and certain investors, including R. Kevin Clinton (incorporated by reference to Exhibit 10.4 to the Registrant’s Registration Statement on Form S-1 (File No. 333-214081) filed on October 13, 2016) |
|
| 10.5 |
Purchase Agreement among ICC Holdings, Inc., Illinois Casualty Company, and Rock Island Investors, LLC (incorporated by reference to Exhibit 10.5 to the Registrant’s Registration Statement on Form S-1 (File No. 333-214081) filed on October 13, 2016) |
|
| 10.6 |
Purchase Agreement among ICC Holdings, Inc., Illinois Casualty Company, and Tuscarora Wayne (incorporated by reference to Exhibit 10.6 to the Registrant’s Registration Statement on Form S-1 (File No. 333-214081) filed on October 13, 2016) |
|
| 10.7 |
Illinois Casualty Company Profit Sharing Cash Bonus Program (incorporated by reference to Exhibit 10.7 to the Registrant’s Registration Statement on Form S-1 (File No. 333-214081) filed on October 13, 2016) |
|
| 10.8 |
Property Per Risk First and Second Excess of Loss Reinsurance Contract between Illinois Casualty Company and certain reinsurers (incorporated by reference to Exhibit 10.8 to Amendment No. 3 to the Registrant’s Registration Statement on Form S-1 (File No. 333-214081) filed on February 1, 2017) |
|
| 10.9 |
Combined Property Catastrophe and Aggregate Catastrophe First and Second Excess of Loss Reinsurance Contract between Illinois Casualty Company and certain reinsurers (incorporated by reference to Exhibit 10.9 to Amendment No. 3 to the Registrant’s Registration Statement on Form S-1 (File No. 333-214081) filed on February 1, 2017) |
|
| 10.1 |
Casualty Excess of Loss Reinsurance Contract between Illinois Casualty Company and certain reinsurers (incorporated by reference to Exhibit 10.10 to Amendment No. 3 to the Registrant’s Registration Statement on Form S-1 (File No. 333-214081) filed on February 1, 2017) |
|
| 10.11 |
Property Facultative Per Risk Excess of Loss Reinsurance Contract between Illinois Casualty Company and certain reinsurers (incorporated by reference to Exhibit 10.11 to Amendment No. 3 to the Registrant’s Registration Statement on Form S-1 (File No. 333-214081) filed on February 1, 2017) |
|
| 10.12 |
|
Cyber Protection Insurance Quota Share Reinsurance Contract between Illinois Casualty Company and certain reinsurers (incorporated by reference to Exhibit 10.12 to Amendment No. 3 to the Registrant’s Registration Statement on Form S-1 (File No. 333-214081) filed on February 1, 2017) |
~ 96 ~
| 10.13 |
Workers Compensation First, Second, and Third Excess of Loss Reinsurance Contract between Illinois Casualty Company and certain reinsurers (incorporated by reference to Exhibit 10.13 to Amendment No. 3 to the Registrant’s Registration Statement on Form S-1 (File No. 333-214081) filed on February 1, 2017) |
|
| 21.1 |
Subsidiaries of ICC Holdings, Inc. (incorporated by reference to Exhibit 21.1 to the Registrant’s Registration Statement on Form S-1 (File No. 333-214081) filed on October 13, 2016) |
|
| 23.1 |
Consent of BKD, LLP |
|
| 31.1 |
Certification Pursuant to Section 302 of the Sarbanes-Oxley Act of 2002 |
|
| 31.2 |
Certification Pursuant to Section 302 of the Sarbanes-Oxley Act of 2002 |
|
| 32.1 |
Certification Pursuant to 18 U.S.C. Section 1350, as Adopted Pursuant to Section 906 of the Sarbanes-Oxley Act of 2002 |
|
| 32.2 |
Certification Pursuant to 18 U.S.C. Section 1350, as Adopted Pursuant to Section 906 of the Sarbanes-Oxley Act of 2002 |
~ 97 ~