Attached files
| file | filename |
|---|---|
| 8-K - 8-K - Atlantic Capital Bancshares, Inc. | acb-form8xkinvestorpresent.htm |
NASDAQ TICKER: ACBI INVESTOR PRESENTATION | MAY 2018
Forward‐Looking Statements This presentation contains forward‐looking statements within the meaning of section 27A of the Securities Act of 1933, as amended, and section 21E of the Securities Exchange Act of 1934, as amended. These forward‐looking statements reflect our current views with respect to, among other things, future events and our financial performance. These statements are often, but not always, made through the use of words or phrases such as “may,” “should,” “could,” “predict,” “potential,” “believe,” “will likely result,” “expect,” “continue,” “will,” “anticipate,” “seek,” “estimate,” “intend,” “plan,” “projection,” “would” and “outlook,” or the negative version of those words or other comparable of a future or forward‐looking nature. These forward‐looking statements are not historical facts, and are based on current expectations, estimates and projections about our industry, management’s beliefs and certain assumptions made by management, many of which, by their nature, are inherently uncertain and beyond our control. Accordingly, we caution you that any such forward‐looking statements are not guarantees of future performance and are subject to risks, assumptions and uncertainties that are difficult to predict. Although we believe that the expectations reflected in these forward‐looking statements are reasonable as of the date made, actual results may prove to be materially different from the results expressed or implied by the forward‐looking statements. The following risks, among others, could cause actual results to differ materially from the anticipated results or other expectations expressed in the forward‐looking statements: changes in our business strategy implemented following the integration with First Security Group, Inc. may result in the expected benefits of the acquisition not being fully realized; costs associated with, and fluctuations in income resulting from, strategic decisions with respect to particular markets, locations or lines of business; loss of income from out trust business following our exit of this business; changes in asset quality and credit risk; the cost and availability of capital; customer acceptance of our products and services; customer borrowing, repayment, investment and deposit practices; the introduction, withdrawal, success and timing of business initiatives; the impact, extent, and timing of technological changes; severe catastrophic events in our geographic area; a weakening of the economies in which we conduct operations may adversely affect our operating results; the U.S. legal and regulatory framework, including those associated with the Dodd‐Frank Wall Street Reform and Consumer Protection Act (the “Dodd‐Frank Act”), could adversely affect the operating results of the company; an increasing interest rate environment may compress margins and adversely affect net interest income; changes in trade, monetary and fiscal policies of various governmental bodies and central banks could affect the economic environment in which we operate; our ability to determine accurate values of certain assets and liabilities; adverse developments in securities, public debt, and capital markets, including changes in market liquidity and volatility; our ability to anticipate or respond to interest rate changes correctly and manage interest rate risk presented through unanticipated changes in our interest rate risk position and/or short‐ and long‐term interest rates; unanticipated changes in our liquidity position, including but not limited to our ability to enter the financial markets to manage and respond to any changes to our liquidity position; adequacy of our risk management program; increased costs associated with operating as a public company; increased competitive pressure due to consolidation in the financial services industry; risks related to security breaches, cybersecurity attacks and other significant disruptions in our information technology systems, including attacks focused on the financial industry, may result in costs and liabilities related to compromised personal information of our customers; the effect of changes in tax law, such as the effect of the Tax Cuts and Jobs Act that was enacted on December 22, 2017; or other risks and factors identified in our Annual Report on Form 10‐KasfiledwiththeSecuritiesandExchangeCommission on March 15, 2018 in Part I, Item 1A under the headings “Risk Factors” and “Management’s Discussion and Analysis of Financial Condition and 2 Results of Operations.”
Non‐GAAP Financial Information Statements included in this presentation include non‐GAAP financial measures and should be read long with the accompanying tables, which provide a reconciliation of non‐GAAP financial measures to GAAP financial measures. Atlantic Capital management uses non‐GAAP financial measures, including: (i) operating net income; (ii) taxable equivalent interest income; (iii) taxable equivalent net interest income; (iv) taxable equivalent net interest margin; (v) operating income before taxes; (vi) operating income tax expense; (vii) operating return on average assets; (viii) operating return on average equity; (ix) tangible common equity; (x) operating diluted earnings per share; and (xi) tangible book value per common share, in its analysis of the Company's performance. Operating net income excludes the revaluation of net deferred tax assets. Tangible common equity excludes goodwill and other intangible assets from shareholders' equity. Management believes that non‐GAAP financial measures provide a greater understanding of ongoing performance and operations, and enhance comparability with prior periods. Non‐GAAP financial measures should not be considered as an alternative to any measure of performance or financial condition as determined in accordance with GAAP, and investors should consider Atlantic Capital’s performance and financial condition as reported under GAAP and all other relevant information when assessing the performance or financial condition of the Company. Non‐GAAP financial measures have limitations as analytical tools, and investors should not consider them in isolation or as a substitute for analysis of the results or financial condition as reported under GAAP. Non‐GAAP financial measures may not be comparable to non‐GAAP financial measures presented by other companies. 3
Our Company Highlights Positioned for Growth TOTAL ASSETS MARKET CAP . Atlanta $2.7 Billion ~$523 Million . Nationwide business lines Fundamentally Sound Emerging Growth and Entrepreneurial focus . Proven underwriting and High-touch, customized service delivery superior credit quality Product breadth and depth Focusing Strategy Operating in the Atlanta, Chattanooga and . Realignment in Tennessee Knoxville metropolitan markets . Scalable core strategies and discipline Achievable Operating Leverage . >1.0% ROA in 2019 4 Financial data as of 3/31/2018; Market data as of 5/15/2018
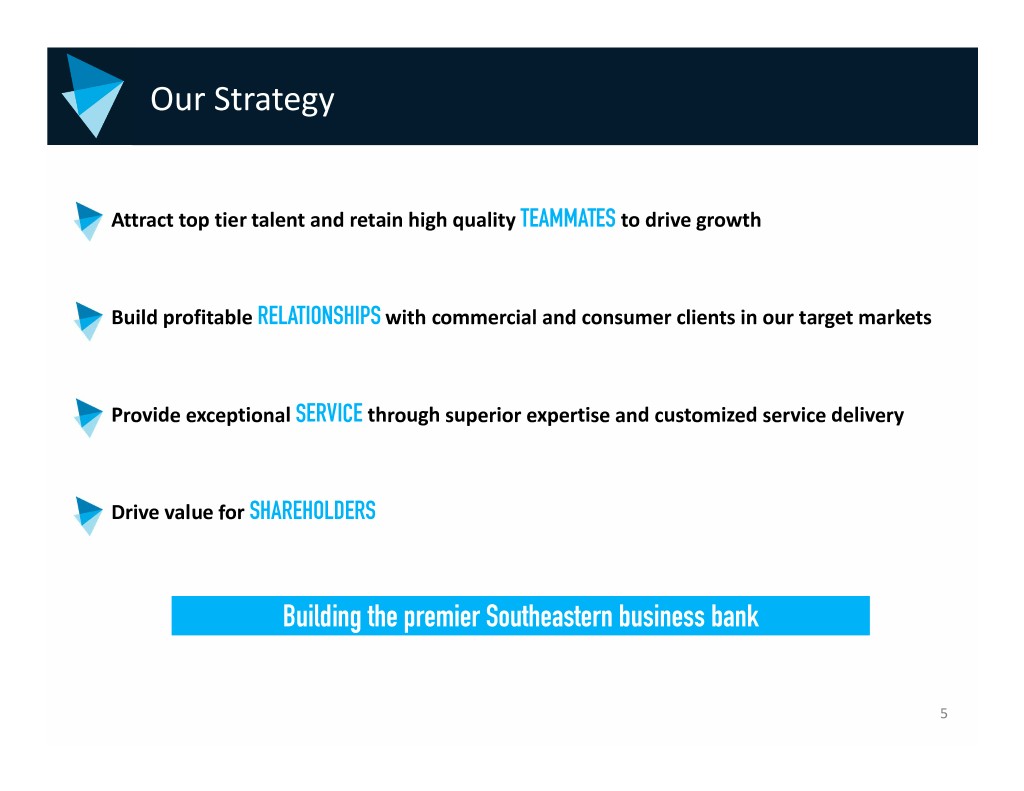
Our Strategy Attract top tier talent and retain high quality TEAMMATES to drive growth Build profitable RELATIONSHIPS with commercial and consumer clients in our target markets Provide exceptional SERVICE through superior expertise and customized service delivery Drive value for SHAREHOLDERS Building the premier Southeastern business bank 5
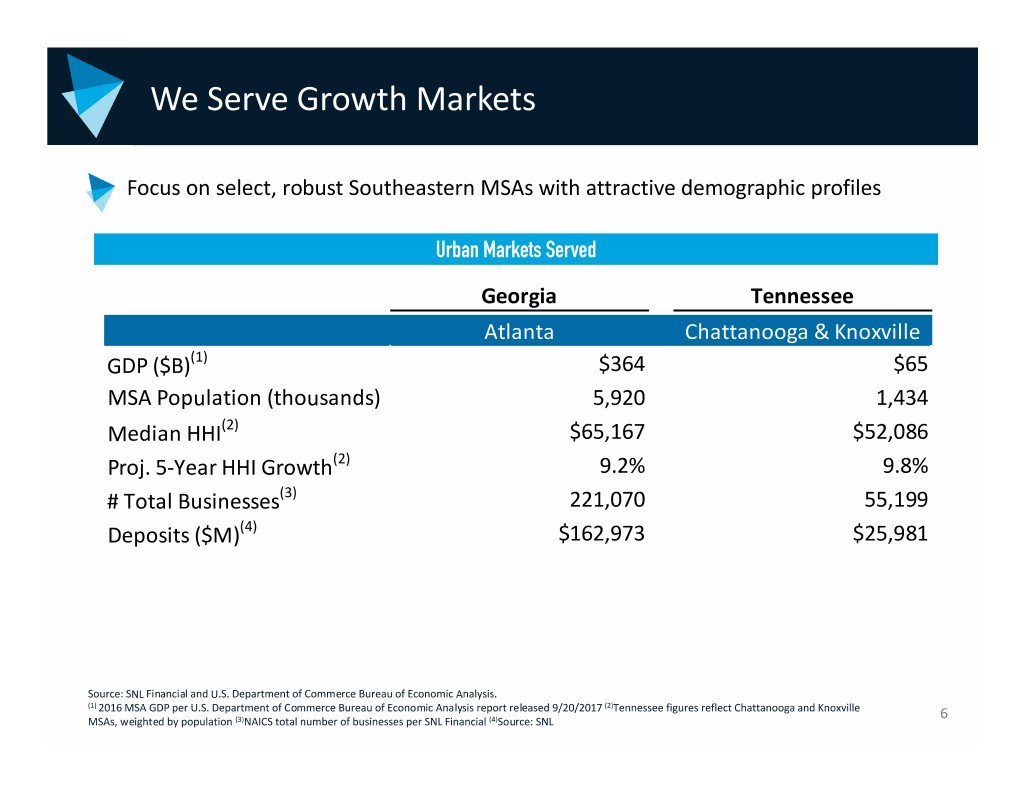
We Serve Growth Markets Focus on select, robust Southeastern MSAs with attractive demographic profiles Urban Markets Served Georgia Tennessee Atlanta Chattanooga & Knoxville GDP ($B)(1) $364 $65 MSA Population (thousands) 5,920 1,434 Median HHI(2) $65,167 $52,086 Proj. 5‐Year HHI Growth(2) 9.2% 9.8% # Total Businesses(3) 221,070 55,199 Deposits ($M)(4) $162,973 $25,981 Source: SNL Financial and U.S. Department of Commerce Bureau of Economic Analysis. (1) (2) 2016 MSA GDP per U.S. Department of Commerce Bureau of Economic Analysis report released 9/20/2017 Tennessee figures reflect Chattanooga and Knoxville 6 MSAs, weighted by population (3)NAICS total number of businesses per SNL Financial (4)Source: SNL
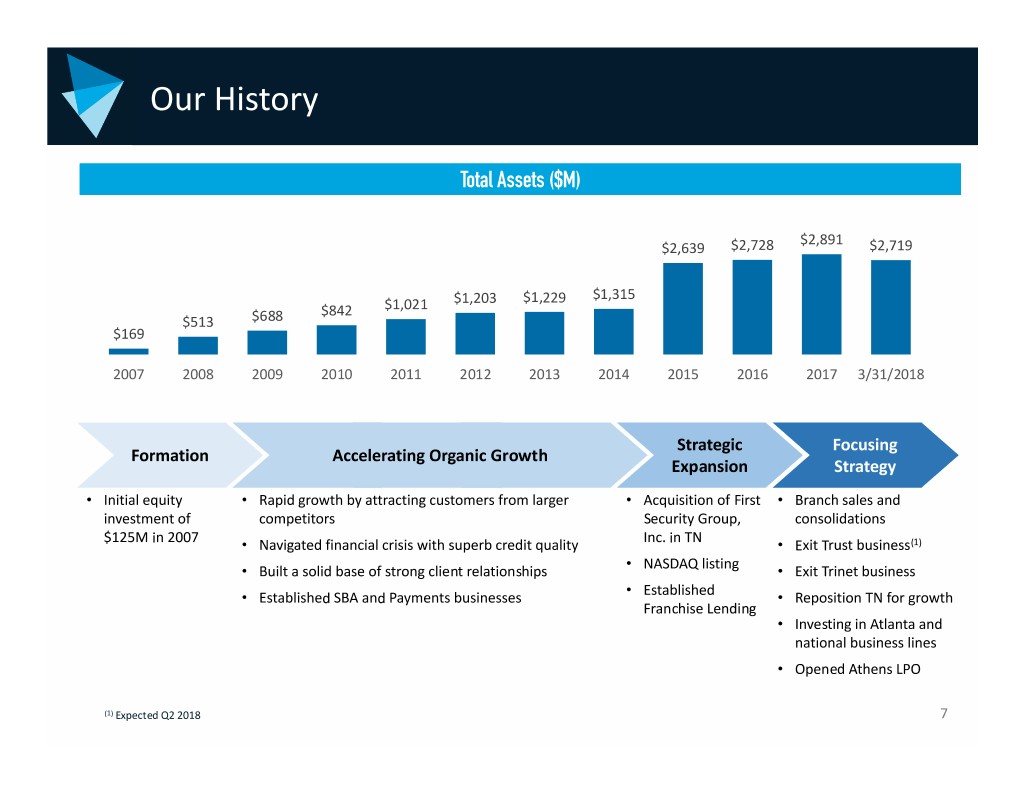
Our History Total Assets ($M) $2,891 $2,639 $2,728 $2,719 $1,203 $1,229 $1,315 $842 $1,021 $513 $688 $169 2007 2008 2009 2010 2011 2012 2013 2014 2015 2016 2017 3/31/2018 Strategic Focusing Formation Accelerating Organic Growth Expansion Strategy • Initial equity • Rapid growth by attracting customers from larger • Acquisition of First • Branch sales and investment of competitors Security Group, consolidations $125M in 2007 Inc. in TN • Navigated financial crisis with superb credit quality • Exit Trust business(1) • NASDAQ listing • Built a solid base of strong client relationships • Exit Trinet business • Established • Established SBA and Payments businesses • Reposition TN for growth Franchise Lending • Investing in Atlanta and national business lines • Opened Athens LPO (1) Expected Q2 2018 7
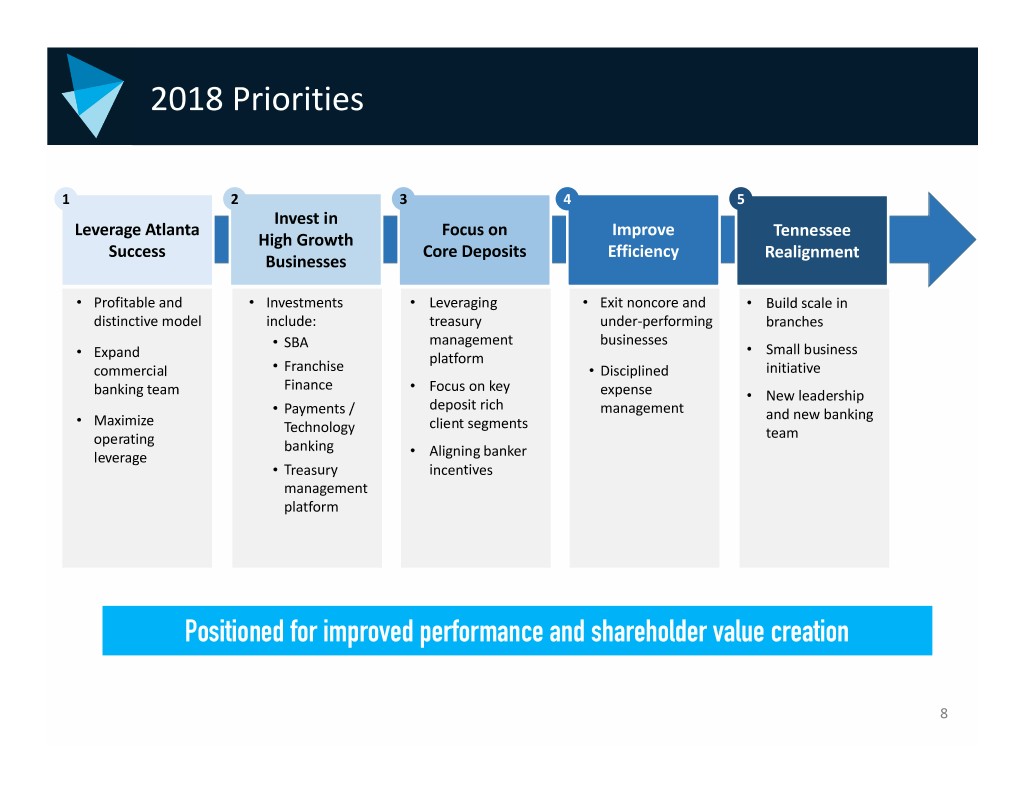
2018 Priorities 1 2 3 4 5 Invest in Leverage Atlanta Focus on Improve Tennessee High Growth Success Core Deposits Efficiency Realignment Businesses • Profitable and • Investments • Leveraging • Exit noncore and • Build scale in distinctive model include: treasury under‐performing branches management businesses • SBA • Small business • Expand platform commercial • Franchise • Disciplined initiative Finance • Focus on key banking team expense • New leadership deposit rich • Payments / management and new banking • Maximize client segments Technology team operating banking leverage • Aligning banker • Treasury incentives management platform Positioned for improved performance and shareholder value creation 8
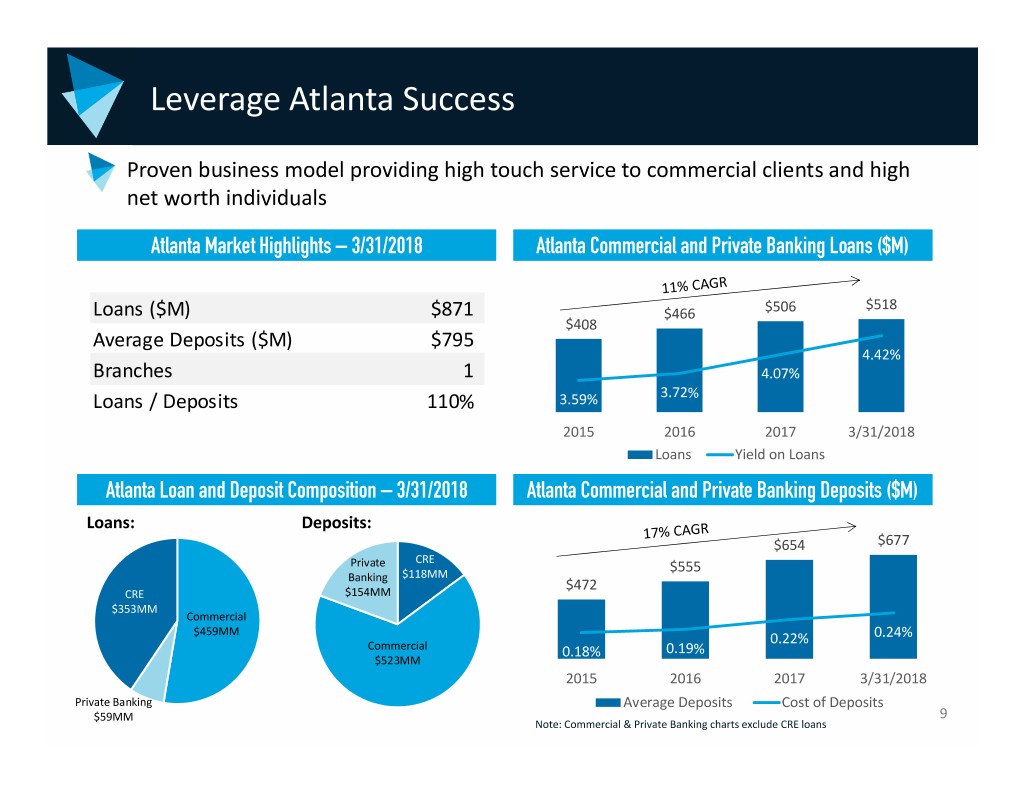
Leverage Atlanta Success Proven business model providing high touch service to commercial clients and high net worth individuals Atlanta Market Highlights – 3/31/2018 Atlanta Commercial and Private Banking Loans ($M) $518 Loans ($M) $871 $466 $506 $408 Average Deposits ($M) $795 4.42% Branches 1 4.07% Loans / Deposits 110% 3.59% 3.72% 2015 2016 2017 3/31/2018 Loans Yield on Loans Atlanta Loan and Deposit Composition – 3/31/2018 Atlanta Commercial and Private Banking Deposits ($M) Loans: Deposits: $654 $677 Private CRE $118MM $555 Banking $472 CRE $154MM $353MM Commercial $459MM 0.22% 0.24% Commercial 0.18% 0.19% $523MM 2015 2016 2017 3/31/2018 Private Banking Average Deposits Cost of Deposits $59MM 9 Note: Commercial & Private Banking charts exclude CRE loans
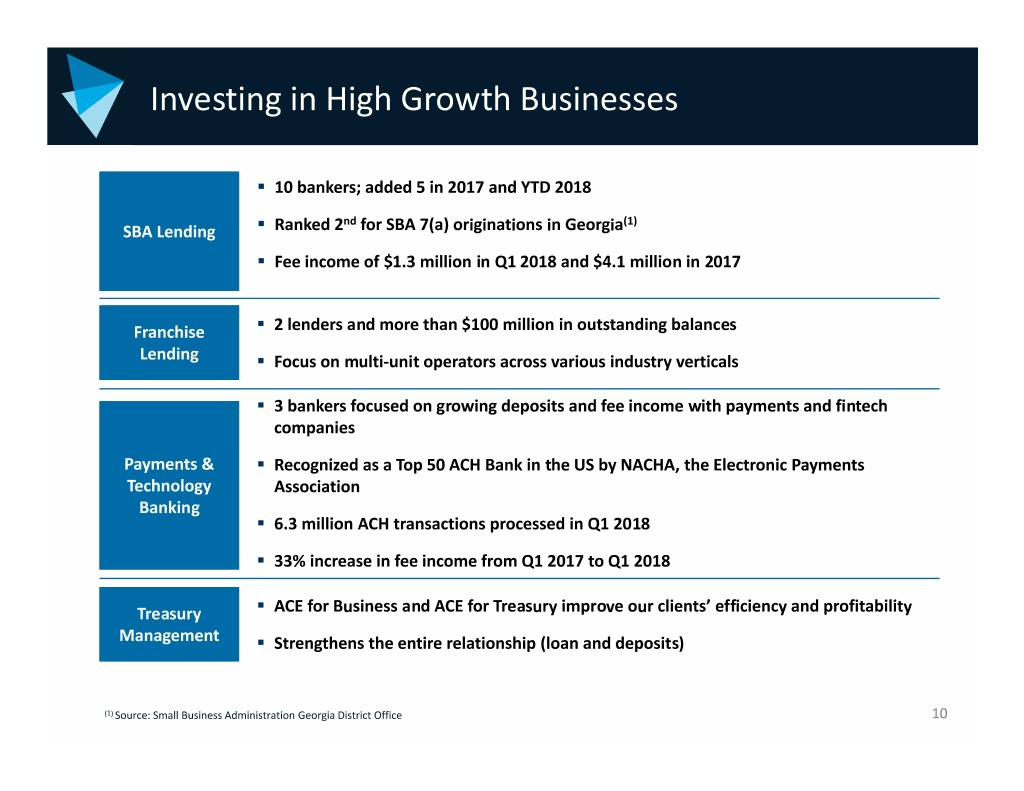
Investing in High Growth Businesses . 10 bankers; added 5 in 2017 and YTD 2018 nd (1) SBA Lending . Ranked 2 for SBA 7(a) originations in Georgia . Fee income of $1.3 million in Q1 2018 and $4.1 million in 2017 Franchise . 2 lenders and more than $100 million in outstanding balances Lending . Focus on multi‐unit operators across various industry verticals . 3 bankers focused on growing deposits and fee income with payments and fintech companies Payments & . Recognized as a Top 50 ACH Bank in the US by NACHA, the Electronic Payments Technology Association Banking . 6.3 million ACH transactions processed in Q1 2018 . 33% increase in fee income from Q1 2017 to Q1 2018 Treasury . ACE for Business and ACE for Treasury improve our clients’ efficiency and profitability Management . Strengthens the entire relationship (loan and deposits) (1) Source: Small Business Administration Georgia District Office 10
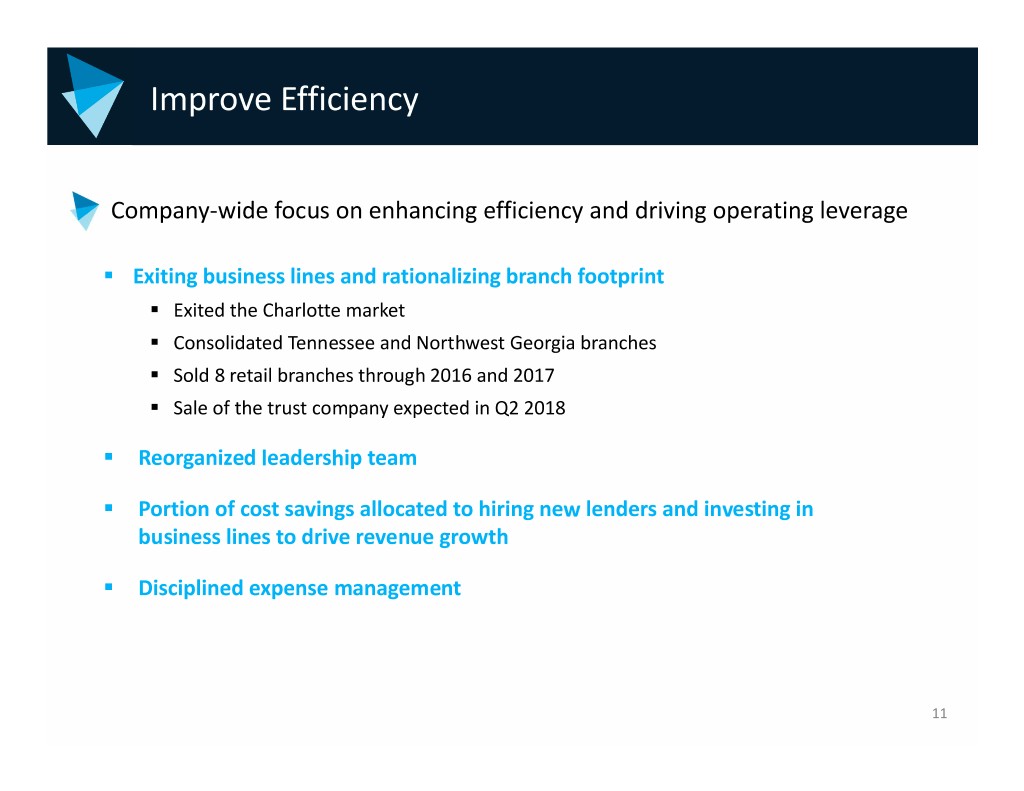
Improve Efficiency Company‐wide focus on enhancing efficiency and driving operating leverage . Exiting business lines and rationalizing branch footprint . Exited the Charlotte market . Consolidated Tennessee and Northwest Georgia branches . Sold 8 retail branches through 2016 and 2017 . Sale of the trust company expected in Q2 2018 . Reorganized leadership team . Portion of cost savings allocated to hiring new lenders and investing in business lines to drive revenue growth . Disciplined expense management 11
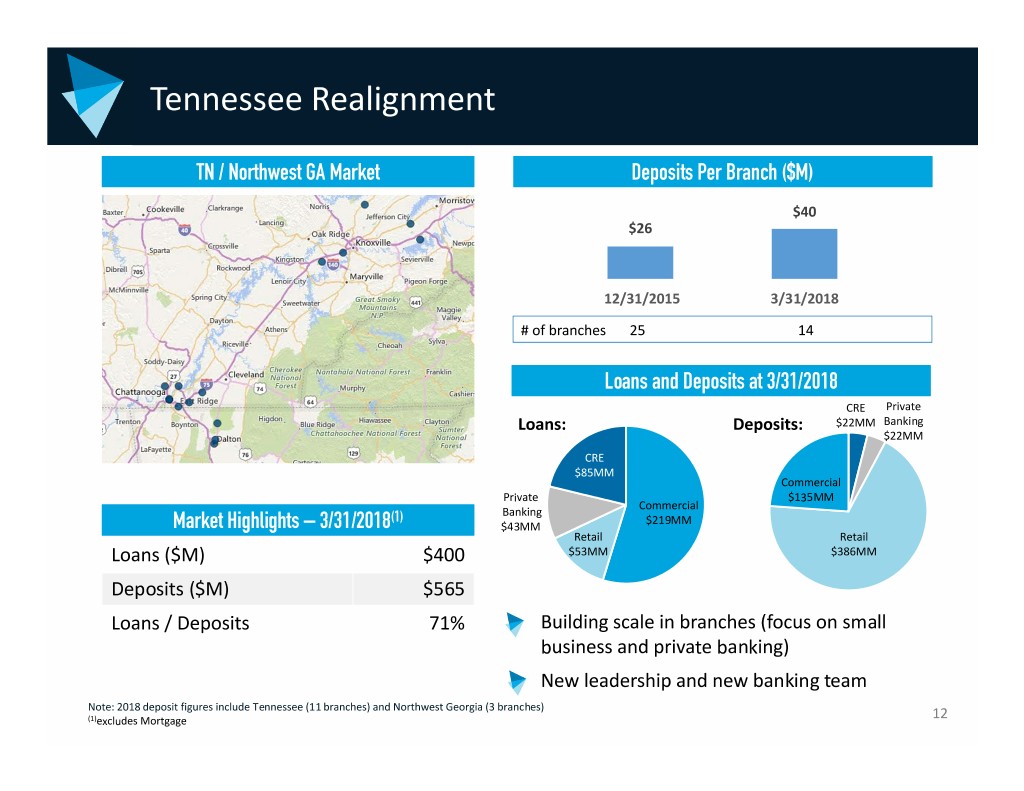
Tennessee Realignment TN / Northwest GA Market Deposits Per Branch ($M) $40 $26 12/31/2015 3/31/2018 # of branches 25 14 Loans and Deposits at 3/31/2018 CRE Private Loans: Deposits: $22MM Banking $22MM CRE $85MM Commercial Private $135MM Commercial Banking (1) $219MM Market Highlights – 3/31/2018 $43MM Retail Retail Loans ($M) $400 $53MM $386MM Deposits ($M) $565 Loans / Deposits 71% . Building scale in branches (focus on small business and private banking) . New leadership and new banking team Note: 2018 deposit figures include Tennessee (11 branches) and Northwest Georgia (3 branches) (1)excludes Mortgage 12
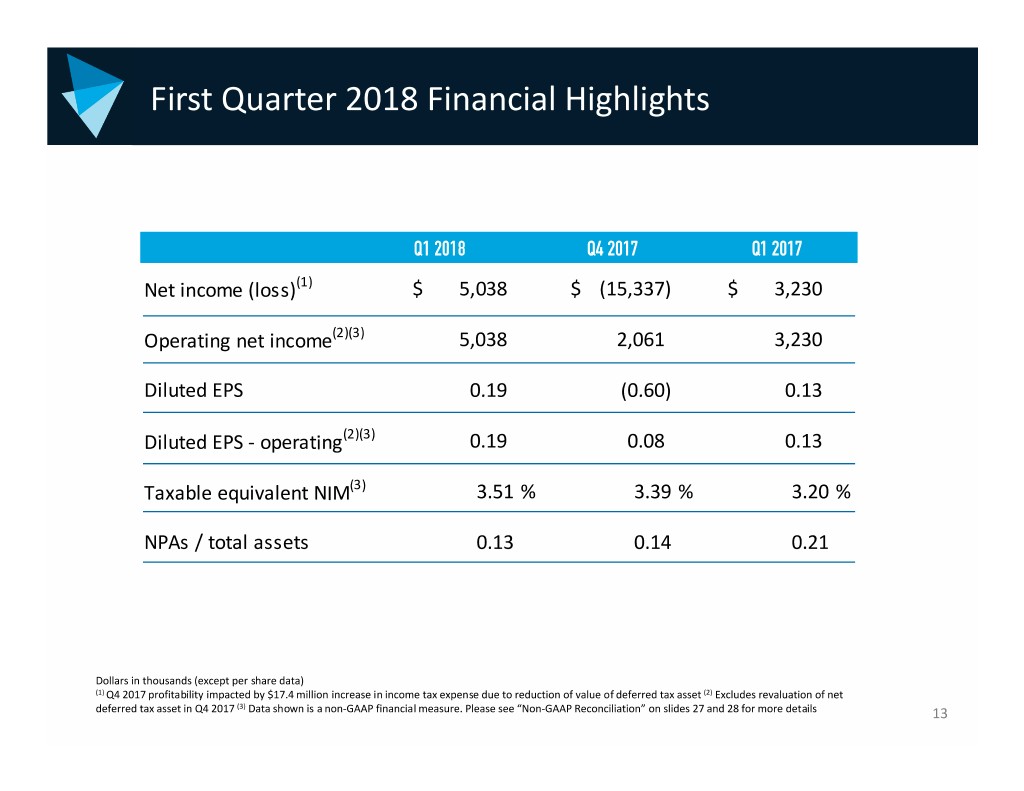
First Quarter 2018 Financial Highlights Q1 2018 Q4 2017 Q1 2017 Net income (loss)(1) $5,038 $ (15,337) $ 3,230 Operating net income(2)(3) 5,038 2,061 3,230 Diluted EPS 0.19 (0.60) 0.13 Diluted EPS ‐ operating(2)(3) 0.19 0.08 0.13 Taxable equivalent NIM(3) 3.51 % 3.39 % 3.20 % NPAs / total assets 0.13 0.14 0.21 Dollars in thousands (except per share data) (1) Q4 2017 profitability impacted by $17.4 million increase in income tax expense due to reduction of value of deferred tax asset (2) Excludes revaluation of net deferred tax asset in Q4 2017 (3) Data shown is a non‐GAAP financial measure. Please see “Non‐GAAP Reconciliation” on slides 27 and 28 for more details 13
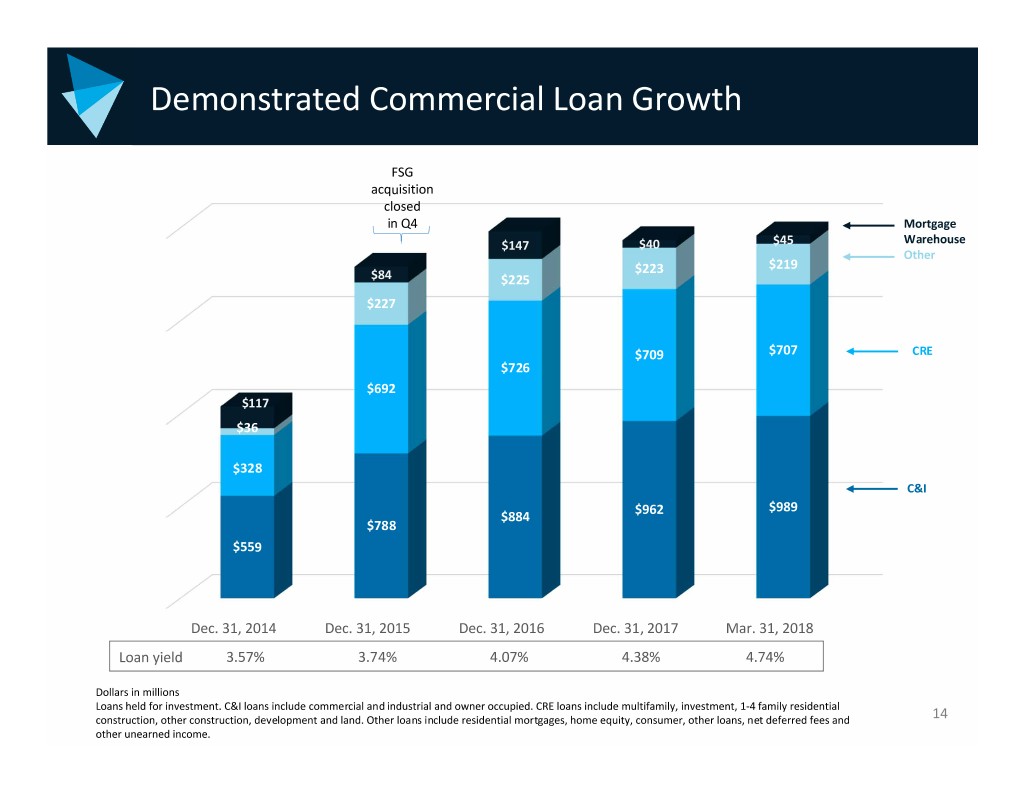
Demonstrated Commercial Loan Growth FSG acquisition closed in Q4 Mortgage $147 $40 $45 Warehouse Other $223 $219 $84 $225 $227 $709 $707 CRE $726 $692 $117 $36 $328 C&I $962 $989 $884 $788 $559 Dec. 31, 2014 Dec. 31, 2015 Dec. 31, 2016 Dec. 31, 2017 Mar. 31, 2018 Loan yield 3.57% 3.74% 4.07% 4.38% 4.74% Dollars in millions Loans held for investment. C&I loans include commercial and industrial and owner occupied. CRE loans include multifamily, investment, 1‐4 family residential construction, other construction, development and land. Other loans include residential mortgages, home equity, consumer, other loans, net deferred fees and 14 other unearned income.
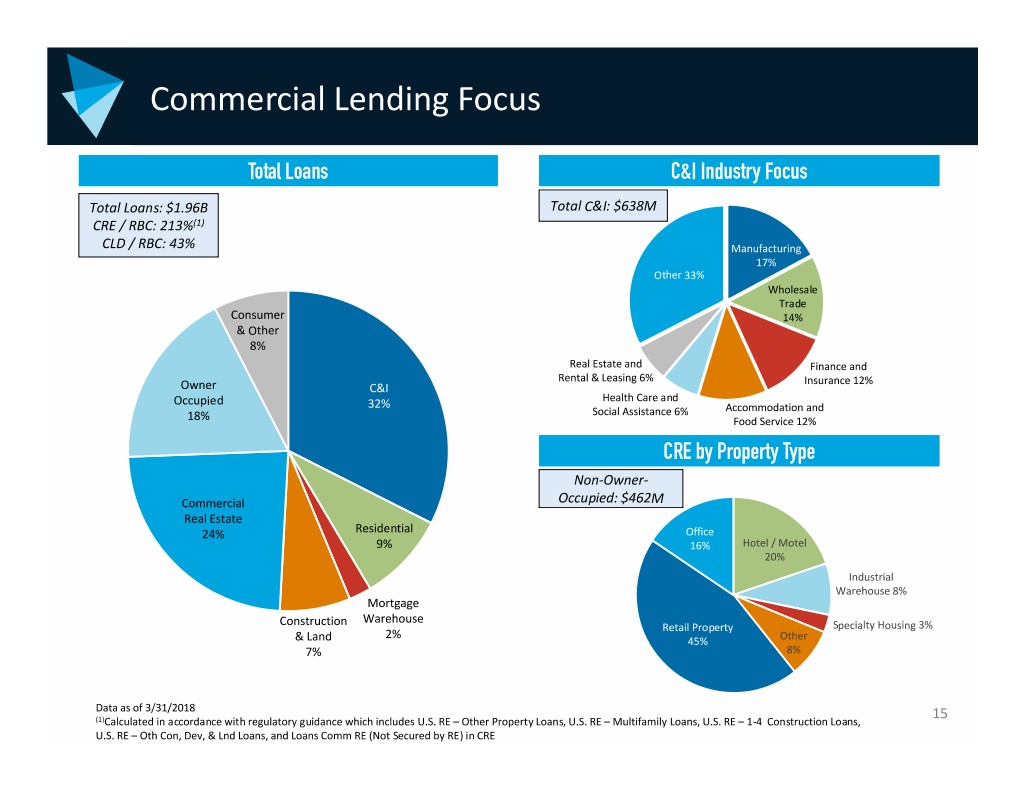
Commercial Lending Focus Total Loans C&I Industry Focus Total Loans: $1.96B Total C&I: $638M CRE / RBC: 213%(1) CLD / RBC: 43% Manufacturing 17% Other 33% Wholesale Trade Consumer 14% & Other 8% Real Estate and Finance and Rental & Leasing 6% Insurance 12% Owner C&I Occupied 32% Health Care and Social Assistance 6% Accommodation and 18% Food Service 12% CRE by Property Type Non‐Owner‐ Commercial Occupied: $462M Real Estate 24% Residential Office 9% 16% Hotel / Motel 20% Industrial Warehouse 8% Mortgage Warehouse Construction Retail Property Specialty Housing 3% 2% & Land 45% Other 7% 8% Data as of 3/31/2018 15 (1)Calculated in accordance with regulatory guidance which includes U.S. RE –Other Property Loans, U.S. RE – Multifamily Loans, U.S. RE –1‐4 Construction Loans, U.S. RE –Oth Con, Dev, & Lnd Loans, and Loans Comm RE (Not Secured by RE) in CRE
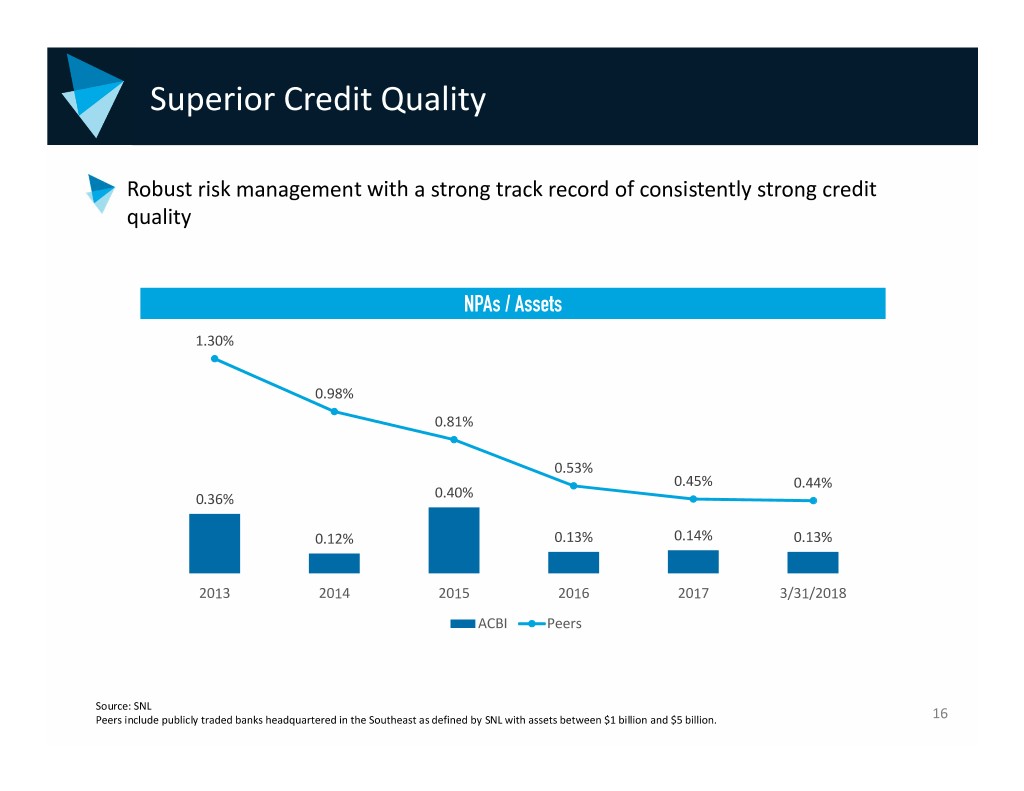
Superior Credit Quality Robust risk management with a strong track record of consistently strong credit quality NPAs / Assets 1.30% 0.98% 0.81% 0.53% 0.45% 0.44% 0.36% 0.40% 0.12% 0.13% 0.14% 0.13% 2013 2014 2015 2016 2017 3/31/2018 ACBI Peers Source: SNL Peers include publicly traded banks headquartered in the Southeast as defined by SNL with assets between $1 billion and $5 billion. 16
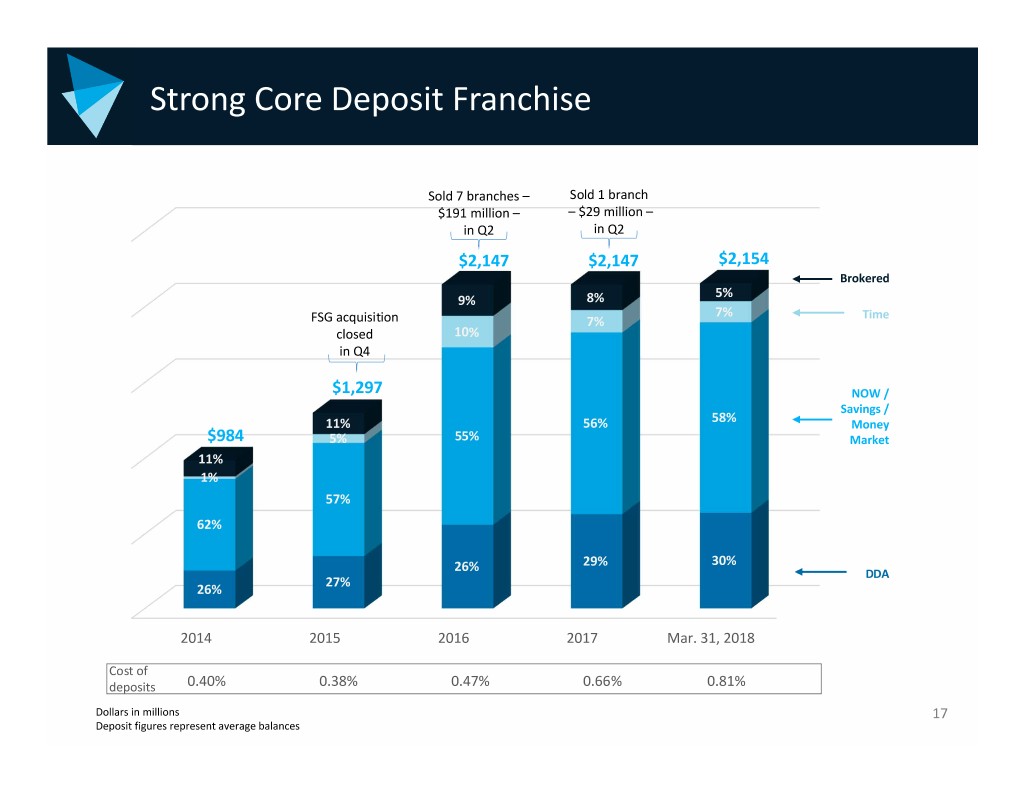
Strong Core Deposit Franchise Sold 7 branches – Sold 1 branch $191 million – – $29 million – in Q2 in Q2 $2,147 $2,147 $2,154 Brokered 5% 9% 8% 7% Time FSG acquisition 7% closed 10% in Q4 $1,297 NOW / Savings / 11% 56% 58% Money $984 5% 55% Market 11% 1% 57% 62% 26% 29% 30% DDA 27% 26% 2014 2015 2016 2017 Mar. 31, 2018 Cost of deposits 0.40% 0.38% 0.47% 0.66% 0.81% Dollars in millions 17 Deposit figures represent average balances
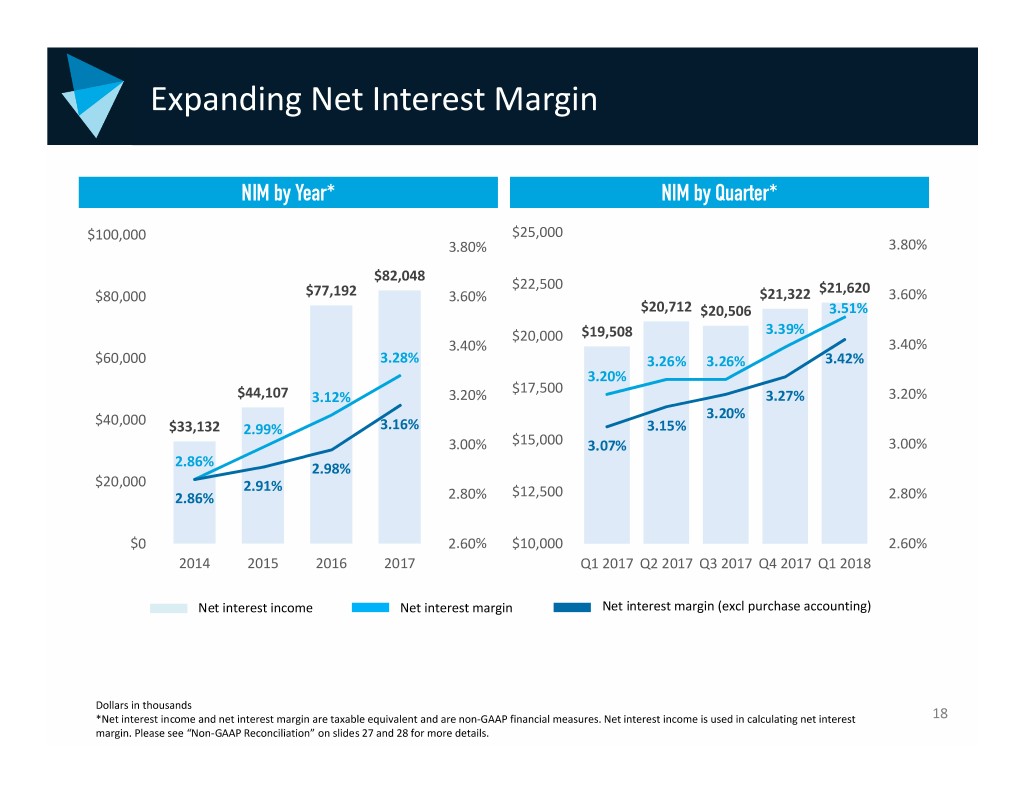
Expanding Net Interest Margin NIM by Year* NIM by Quarter* $100,000 $25,000 3.80% 3.80% $82,048 $22,500 $21,620 $80,000 $77,192 3.60% $21,322 3.60% $20,712 $20,506 3.51% $20,000 $19,508 3.39% 3.40% 3.40% $60,000 3.28% 3.26% 3.26% 3.42% 3.20% $17,500 $44,107 3.12% 3.20% 3.27% 3.20% $40,000 3.20% $33,132 2.99% 3.16% 3.15% 3.00% $15,000 3.07% 3.00% 2.86% 2.98% $20,000 2.91% 2.86% 2.80% $12,500 2.80% $0 2.60% $10,000 2.60% 2014 2015 2016 2017 Q1 2017 Q2 2017 Q3 2017 Q4 2017 Q1 2018 Net interest income Net interest margin Net interest margin (excl purchase accounting) Dollars in thousands *Net interest income and net interest margin are taxable equivalent and are non‐GAAP financial measures. Net interest income is used in calculating net interest 18 margin. Please see “Non‐GAAP Reconciliation” on slides 27 and 28 for more details.
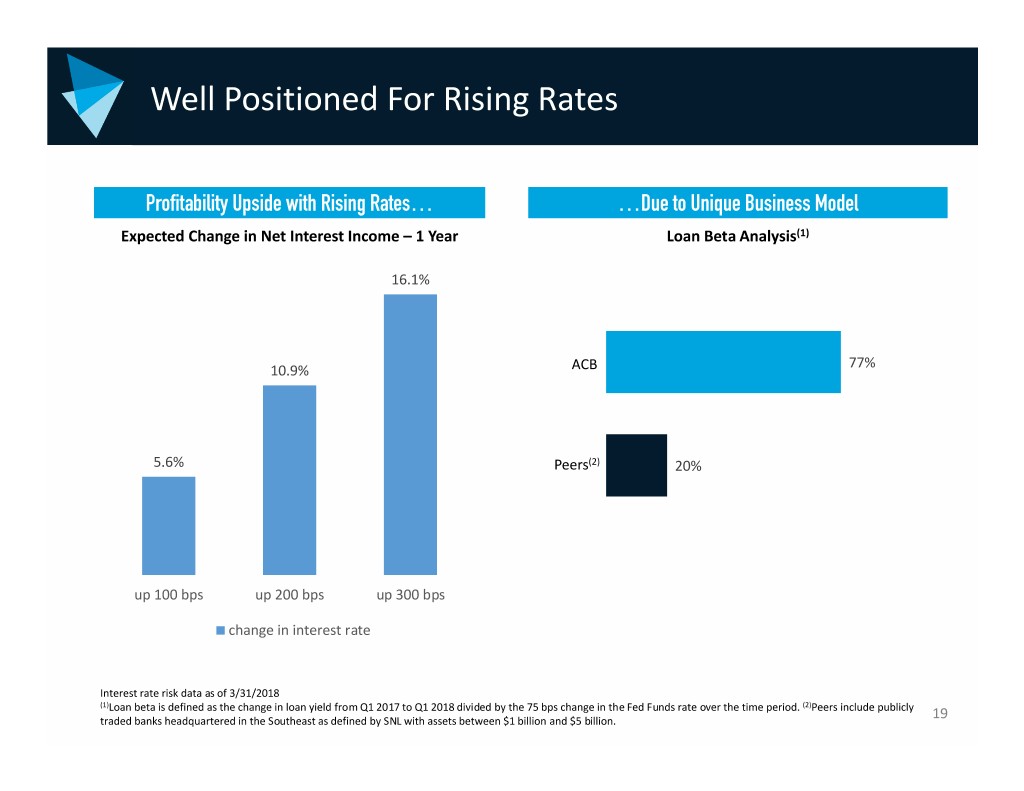
Well Positioned For Rising Rates Profitability Upside with Rising Rates… …Due to Unique Business Model Expected Change in Net Interest Income –1 Year Loan Beta Analysis(1) 16.1% 77% 10.9% ACB 5.6% Peers(2) 20% up 100 bps up 200 bps up 300 bps change in interest rate Interest rate risk data as of 3/31/2018 (1)Loan beta is defined as the change in loan yield from Q1 2017 to Q1 2018 divided by the 75 bps change in the Fed Funds rate over the time period. (2)Peers include publicly traded banks headquartered in the Southeast as defined by SNL with assets between $1 billion and $5 billion. 19
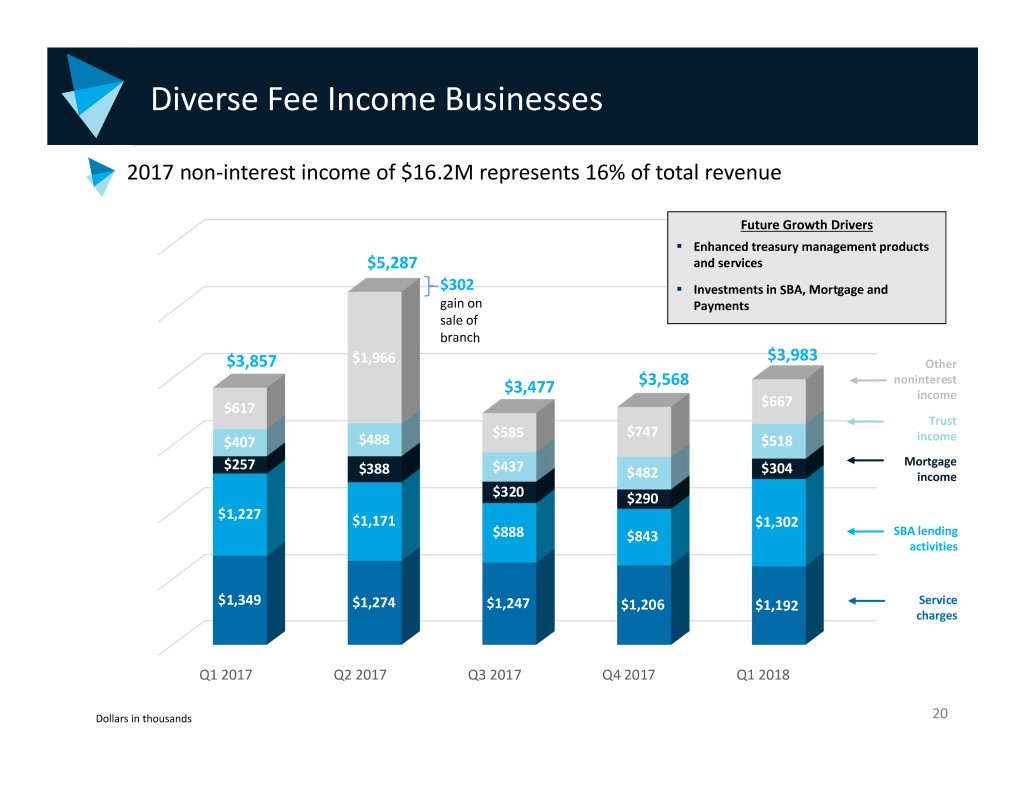
Diverse Fee Income Businesses 2017 non‐interest income of $16.2M represents 16% of total revenue Future Growth Drivers . Enhanced treasury management products $5,287 and services $302 . Investments in SBA, Mortgage and gain on Payments sale of branch $3,857 $1,966 $3,983 Other $3,568 noninterest $3,477 income $617 $667 Trust $585 $747 $407 $488 $518 income $257 $388 $437 $304 Mortgage $482 income $320 $290 $1,227 $1,171 $1,302 $888 $843 SBA lending activities $1,349 $1,274 $1,247 $1,206 $1,192 Service charges Q1 2017 Q2 2017 Q3 2017 Q4 2017 Q1 2018 Dollars in thousands 20
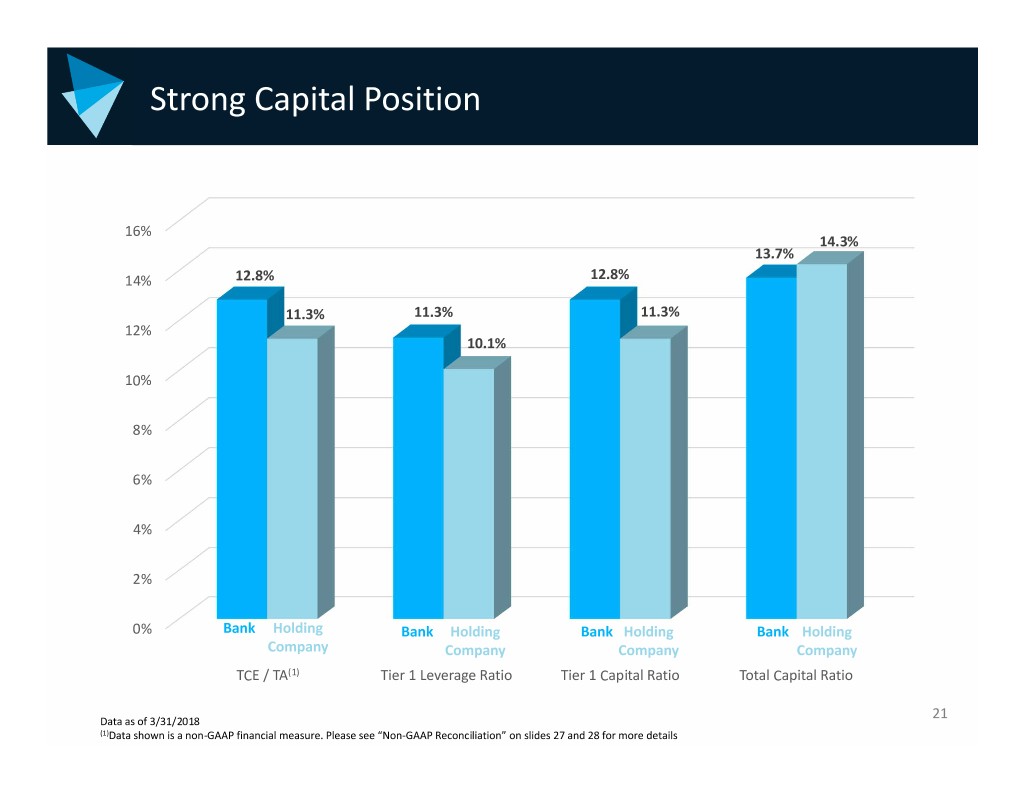
Strong Capital Position 16% 14.3% 13.7% 14% 12.8% 12.8% 11.3% 11.3% 11.3% 12% 10.1% 10% 8% 6% 4% 2% 0% Bank Holding Bank Holding BankHolding Bank Holding Company Company Company Company TCE / TA(1) Tier 1 Leverage Ratio Tier 1 Capital Ratio Total Capital Ratio 21 Data as of 3/31/2018 (1)Data shown is a non‐GAAP financial measure. Please see “Non‐GAAP Reconciliation” on slides 27 and 28 for more details
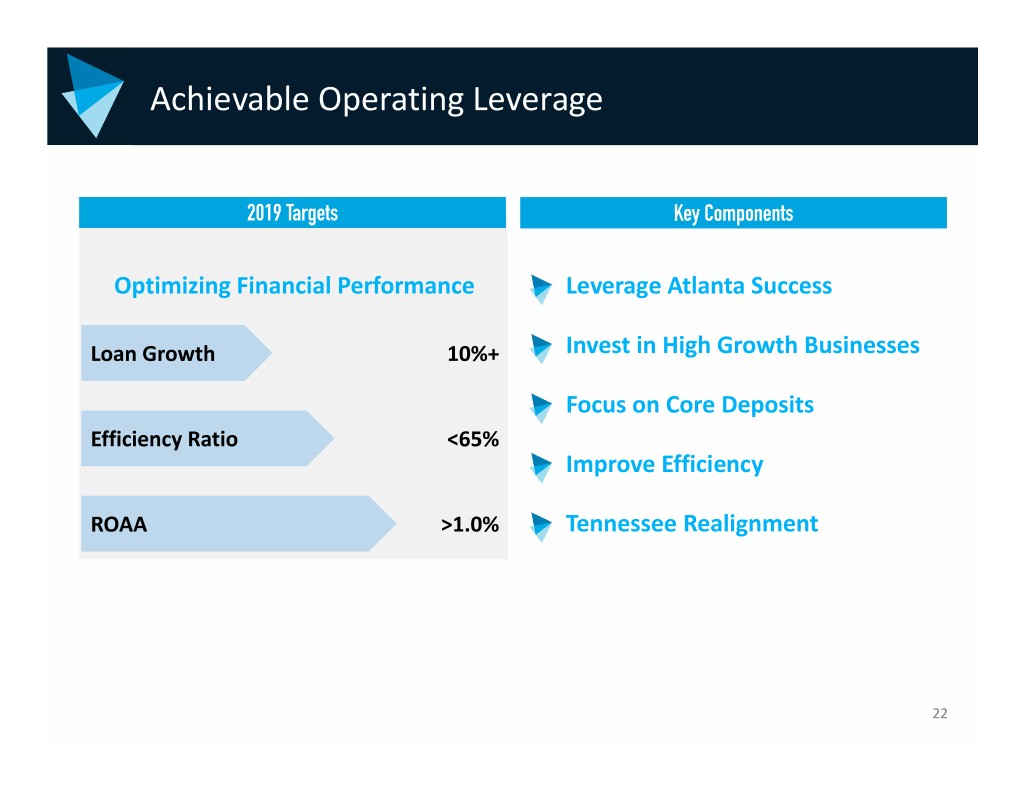
Achievable Operating Leverage 2019 Targets Key Components Optimizing Financial Performance Leverage Atlanta Success Loan Growth 10%+ Invest in High Growth Businesses Focus on Core Deposits Efficiency Ratio <65% Improve Efficiency ROAA >1.0% Tennessee Realignment 22
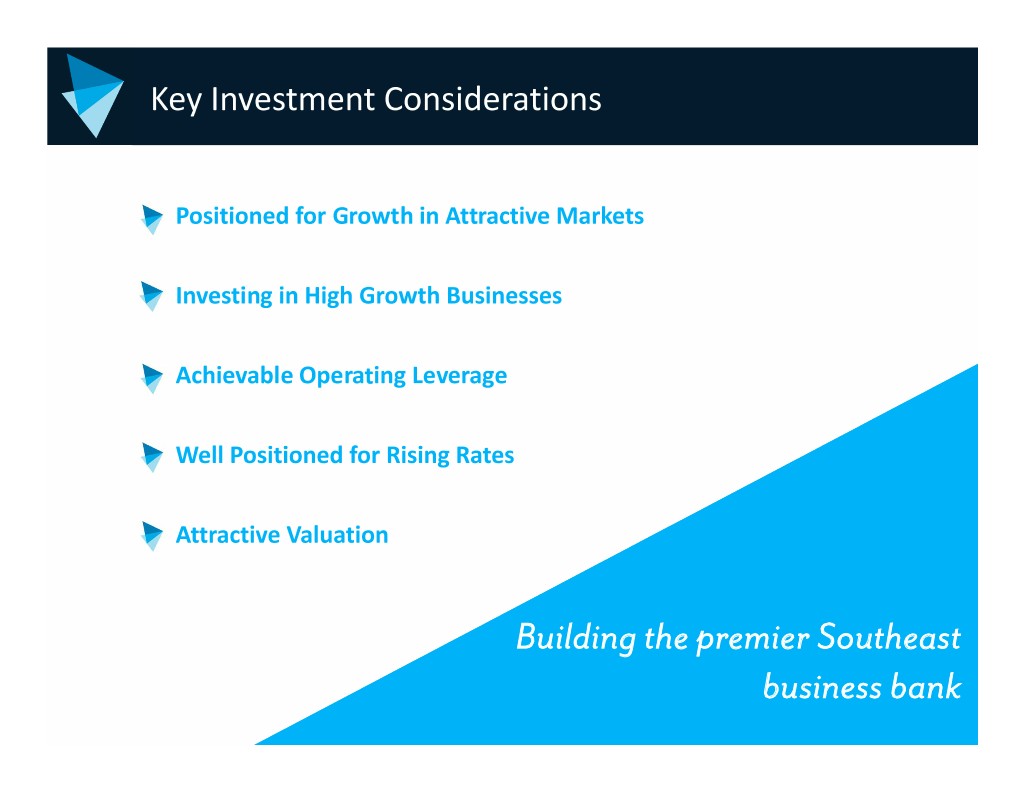
Key Investment Considerations Positioned for Growth in Attractive Markets Investing in High Growth Businesses Achievable Operating Leverage Well Positioned for Rising Rates Attractive Valuation Building the premier Southeast business bank 23

APPENDIX INVESTOR APPENDIX PRESENTATION MARCH 2018 THE SOUTHEAST’S BUSINESS BANK
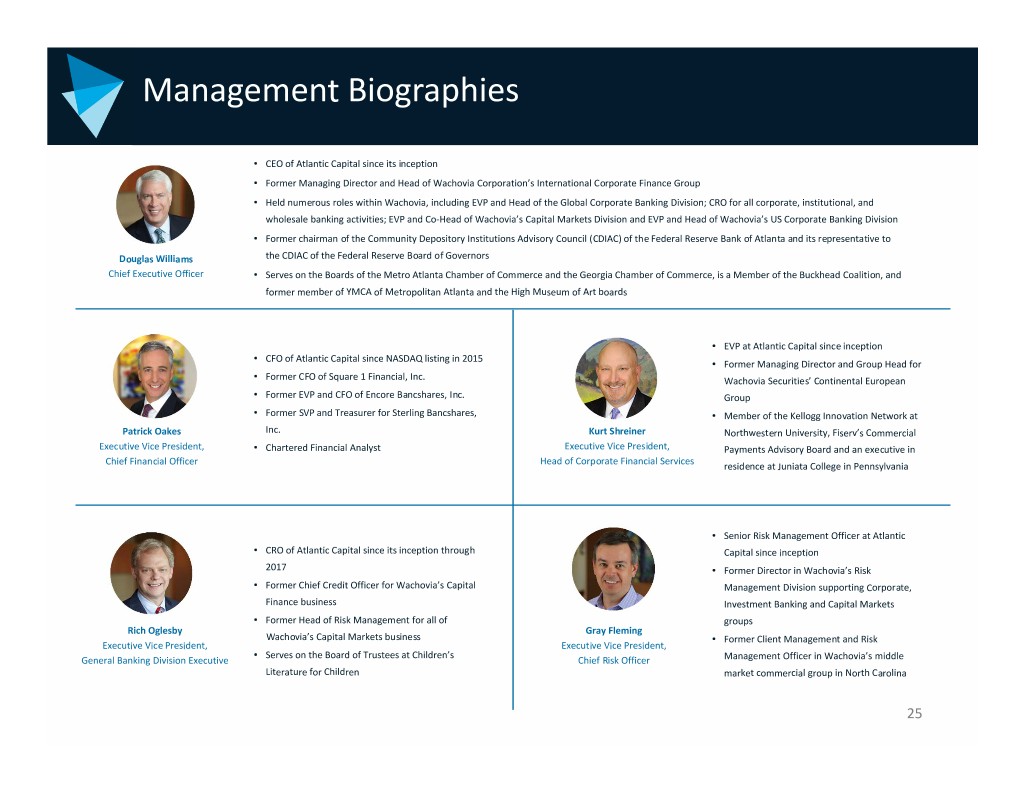
Management Biographies • CEO of Atlantic Capital since its inception • Former Managing Director and Head of Wachovia Corporation’s International Corporate Finance Group • Held numerous roles within Wachovia, including EVP and Head of the Global Corporate Banking Division; CRO for all corporate, institutional, and wholesale banking activities; EVP and Co‐Head of Wachovia’s Capital Markets Division and EVP and Head of Wachovia’s US Corporate Banking Division • Former chairman of the Community Depository Institutions Advisory Council (CDIAC) of the Federal Reserve Bank of Atlanta and its representative to Douglas Williams the CDIAC of the Federal Reserve Board of Governors Chief Executive Officer • Serves on the Boards of the Metro Atlanta Chamber of Commerce and the Georgia Chamber of Commerce, is a Member of the Buckhead Coalition, and former member of YMCA of Metropolitan Atlanta and the High Museum of Art boards • EVP at Atlantic Capital since inception • CFO of Atlantic Capital since NASDAQ listing in 2015 • Former Managing Director and Group Head for • Former CFO of Square 1 Financial, Inc. Wachovia Securities’ Continental European • Former EVP and CFO of Encore Bancshares, Inc. Group • Former SVP and Treasurer for Sterling Bancshares, • Member of the Kellogg Innovation Network at Patrick Oakes Inc. Kurt Shreiner Northwestern University, Fiserv’s Commercial Executive Vice President, • Chartered Financial Analyst Executive Vice President, Payments Advisory Board and an executive in Head of Corporate Financial Services Chief Financial Officer residence at Juniata College in Pennsylvania • Senior Risk Management Officer at Atlantic • CRO of Atlantic Capital since its inception through Capital since inception 2017 • Former Director in Wachovia’s Risk • Former Chief Credit Officer for Wachovia’s Capital Management Division supporting Corporate, Finance business Investment Banking and Capital Markets • Former Head of Risk Management for all of groups Rich Oglesby Gray Fleming Wachovia’s Capital Markets business • Former Client Management and Risk Executive Vice President, Executive Vice President, • Serves on the Board of Trustees at Children’s General Banking Division Executive Chief Risk Officer Management Officer in Wachovia’s middle Literature for Children market commercial group in North Carolina 25
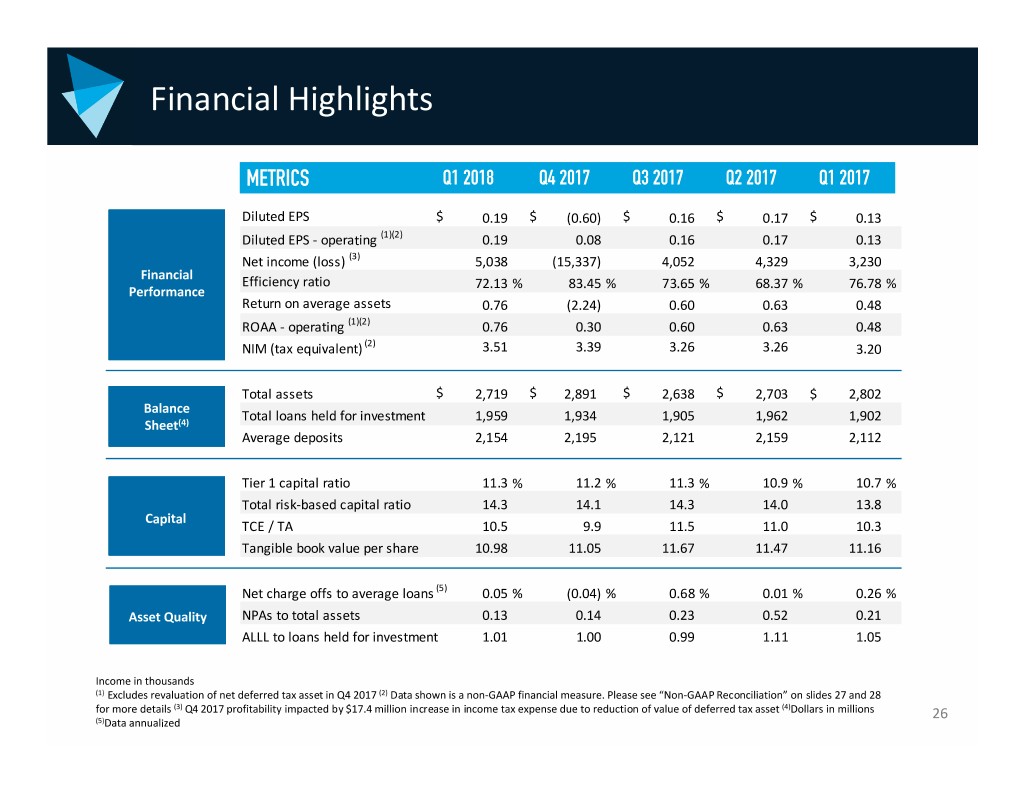
Financial Highlights METRICS Q1 2018Q4 2017 Q3 2017 Q2 2017 Q1 2017 Diluted EPS $ 0.19 $ (0.60) $ 0.16 $ 0.17 $ 0.13 Diluted EPS ‐ operating (1)(2) 0.19 0.08 0.16 0.17 0.13 Net income (loss) (3) 5,038 (15,337) 4,052 4,329 3,230 Financial Efficiency ratio 72.13% 83.45% 73.65% 68.37% 76.78% Performance Return on average assets 0.76 (2.24) 0.60 0.63 0.48 ROAA ‐ operating (1)(2) 0.76 0.30 0.60 0.63 0.48 NIM (tax equivalent) (2) 3.51 3.39 3.26 3.26 3.20 Total assets $ 2,719 $ 2,891 $ 2,638 $ 2,703 $ 2,802 Balance Total loans held for investment 1,959 1,934 1,905 1,962 1,902 Sheet(4) Average deposits 2,154 2,195 2,121 2,159 2,112 Tier 1 capital ratio 11.3 % 11.2 % 11.3 % 10.9 % 10.7 % Total risk‐based capital ratio 14.3 14.1 14.3 14.0 13.8 Capital TCE / TA 10.5 9.9 11.5 11.0 10.3 Tangible book value per share 10.98 11.05 11.67 11.47 11.16 Net charge offs to average loans (5) 0.05 % (0.04) % 0.68 % 0.01 % 0.26 % Asset Quality NPAs to total assets 0.13 0.14 0.23 0.52 0.21 ALLL to loans held for investment 1.01 1.00 0.99 1.11 1.05 Income in thousands (1) Excludes revaluation of net deferred tax asset in Q4 2017 (2) Data shown is a non‐GAAP financial measure. Please see “Non‐GAAP Reconciliation” on slides 27 and 28 for more details (3) Q4 2017 profitability impacted by $17.4 million increase in income tax expense due to reduction of value of deferred tax asset (4)Dollars in millions 26 (5)Data annualized
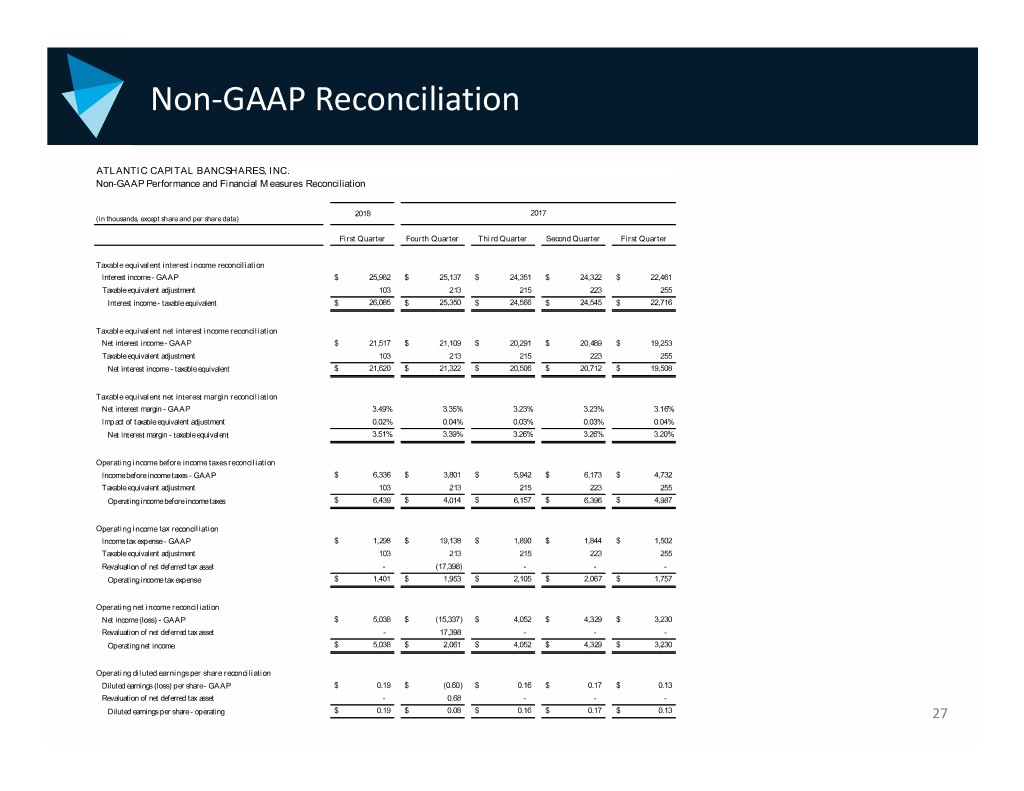
Non‐GAAP Reconciliation ATLANTIC CAPITAL BANCSHARES, INC. Non-GAAP Performance and Financial Measures Reconciliation 2018 2017 (in thousands, except share and per share data) First Quarter Fourth Quarter Third Quarter Second Quarter First Quarter Taxable equivalent interest income reconciliation Interest income - GAAP $ 25,982 $ 25,137 $ 24,351 $ 24,322 $ 22,461 Taxable equivalent adjustment 103 213 215 223 255 Interest income - taxable equivalent $ 26,085 $ 25,350 $ 24,566 $ 24,545 $ 22,716 Taxable equivalent net interest income reconciliation Net interest income - GAAP $ 21,517 $ 21,109 $ 20,291 $ 20,489 $ 19,253 Taxable equivalent adjustment 103 213 215 223 255 Net interest income - taxable equivalent $ 21,620 $ 21,322 $ 20,506 $ 20,712 $ 19,508 Taxable equivalent net interest margin reconciliation Net interest margin - GAAP 3.49% 3.35% 3.23% 3.23% 3.16% Impact of taxable equivalent adjustment 0.02% 0.04% 0.03% 0.03% 0.04% Net interest margin - taxable equivalent 3.51% 3.39% 3.26% 3.26% 3.20% Operating income before income taxes reconciliation Income before income taxes - GAAP $ 6,336 $ 3,801 $ 5,942 $ 6,173 $ 4,732 Taxable equivalent adjustment 103 213 215 223 255 Operating income before income taxes $ 6,439 $ 4,014 $ 6,157 $ 6,396 $ 4,987 Operating income tax reconciliation Income tax expense - GAAP $ 1,298 $ 19,138 $ 1,890 $ 1,844 $ 1,502 Taxable equivalent adjustment 103 213 215 223 255 Revaluation of net deferred tax asset - (17,398) - - - Operating income tax expense $ 1,401 $ 1,953 $ 2,105 $ 2,067 $ 1,757 Operating net income reconciliation Net income (loss) - GAAP $ 5,038 $ (15,337) $ 4,052 $ 4,329 $ 3,230 Revaluation of net deferred tax asset - 17,398 - - - Operating net income $ 5,038 $ 2,061 $ 4,052 $ 4,329 $ 3,230 Operating diluted earnings per share reconciliation Diluted earnings (loss) per share - GAAP $ 0.19 $ (0.60) $ 0.16 $ 0.17 $ 0.13 Revaluation of net deferred tax asset - 0.68 - - - Diluted earnings per share - operating $ 0.19 $ 0.08 $ 0.16 $ 0.17 $ 0.13 27
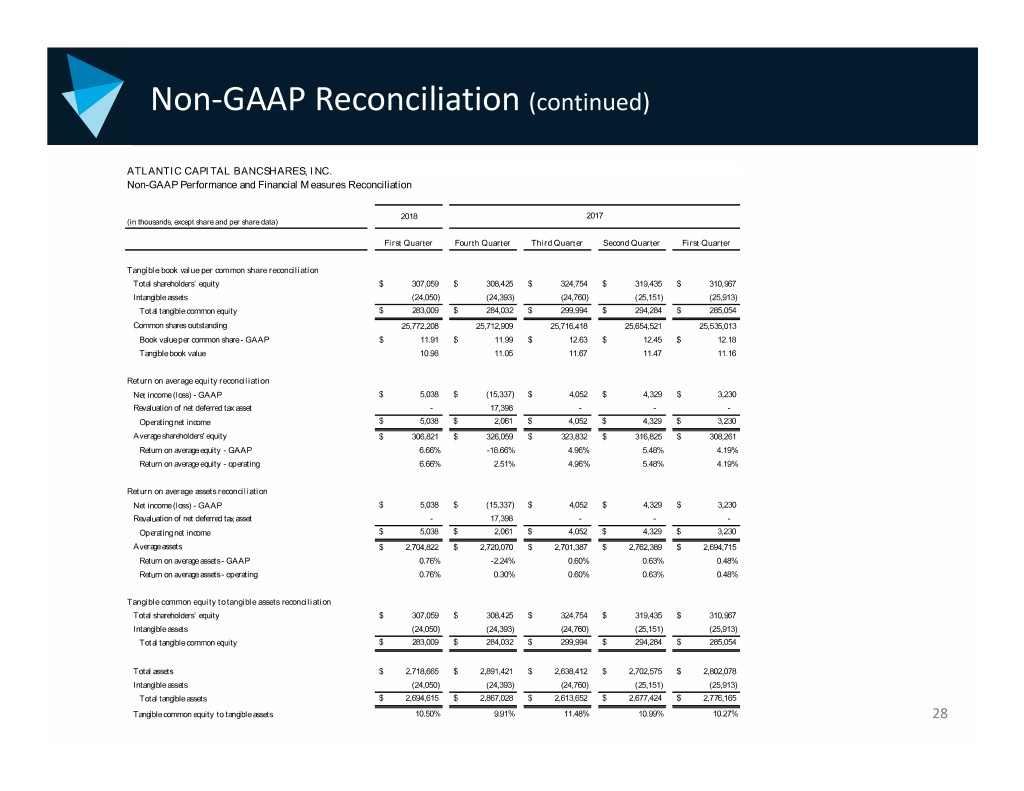
Non‐GAAP Reconciliation (continued) ATLANTIC CAPITAL BANCSHARES, INC. Non-GAAP Performance and Financial Measures Reconciliation 2018 2017 (in thousands, except share and per share data) First Quarter Fourth Quarter Third Quarter Second Quarter First Quarter Tangible book value per common share reconciliation Total shareholders’ equity $ 307,059 $ 308,425 $ 324,754 $ 319,435 $ 310,967 Intangible assets (24,050) (24,393) (24,760) (25,151) (25,913) Total tangible common equity $ 283,009 $ 284,032 $ 299,994 $ 294,284 $ 285,054 Common shares outstanding 25,772,208 25,712,909 25,716,418 25,654,521 25,535,013 Book value per common share - GAAP $ 11.91 $ 11.99 $ 12.63 $ 12.45 $ 12.18 Tangible book value 10.98 11.05 11.67 11.47 11.16 Return on average equity reconciliation Net income (loss) - GAAP $ 5,038 $ (15,337) $ 4,052 $ 4,329 $ 3,230 Revaluation of net deferred tax asset - 17,398 - - - Operating net income $ 5,038 $ 2,061 $ 4,052 $ 4,329 $ 3,230 Average shareholders' equity $ 306,821 $ 326,059 $ 323,832 $ 316,825 $ 308,261 Return on average equity - GAAP 6.66% -18.66% 4.96% 5.48% 4.19% Return on average equity - operating 6.66% 2.51% 4.96% 5.48% 4.19% Return on average assets reconciliation Net income (loss) - GAAP $ 5,038 $ (15,337) $ 4,052 $ 4,329 $ 3,230 Revaluation of net deferred tax asset - 17,398 - - - Operating net income $ 5,038 $ 2,061 $ 4,052 $ 4,329 $ 3,230 Average assets $ 2,704,822 $ 2,720,070 $ 2,701,387 $ 2,762,389 $ 2,694,715 Return on average assets - GAAP 0.76% -2.24% 0.60% 0.63% 0.48% Return on average assets - operating 0.76% 0.30% 0.60% 0.63% 0.48% Tangible common equity to tangible assets reconciliation Total shareholders’ equity $ 307,059 $ 308,425 $ 324,754 $ 319,435 $ 310,967 Intangible assets (24,050) (24,393) (24,760) (25,151) (25,913) Total tangible common equity $ 283,009 $ 284,032 $ 299,994 $ 294,284 $ 285,054 Total assets $ 2,718,665 $ 2,891,421 $ 2,638,412 $ 2,702,575 $ 2,802,078 Intangible assets (24,050) (24,393) (24,760) (25,151) (25,913) Total tangible assets $ 2,694,615 $ 2,867,028 $ 2,613,652 $ 2,677,424 $ 2,776,165 Tangible common equity to tangible assets 10.50% 9.91% 11.48% 10.99% 10.27% 28
