Attached files
| file | filename |
|---|---|
| 8-K - 8-K - FIRST UNITED CORP/MD/ | tv494288_8k.htm |
Exhibit 99.1
Slide 1: Cover Slide
FIRST UNITED CORPORATION
2018 Annual Meeting of Shareholders’ Presentation
May 17, 2018
JOHN W. McCULLOUGH
Slide 2: John W. McCullough
With the voting complete, the business portion of the meeting is now closed. I now present to you, Carissa L. Rodeheaver, Chairman of the Board, President, and Chief Executive Officer, who will bring you, the shareholder, up to date on the business of the Corporation.
Clip #1
CARISSA RODEHEAVER
Slide 3: Carissa Rodeheaver
Good Morning fellow shareholders, and welcome to the 2018 Shareholders Meeting. I appreciate your interest in attending and for your support over the last year.
Slide 4: Forward-Looking Statements
Before we begin our presentation, I would like to direct your attention to the Forward-Looking Statement Disclosure, which is displayed on the screen for your review.
Slide 5: Journey
Today, I am going to ask you to go on a journey with me. A journey filled with images of the future. A journey full of possibilities. A journey into your financial future. This journey is full of bright colors, friendly, knowledgeable people, the convenience of technology and a myriad of ways to conduct your personal and business banking.
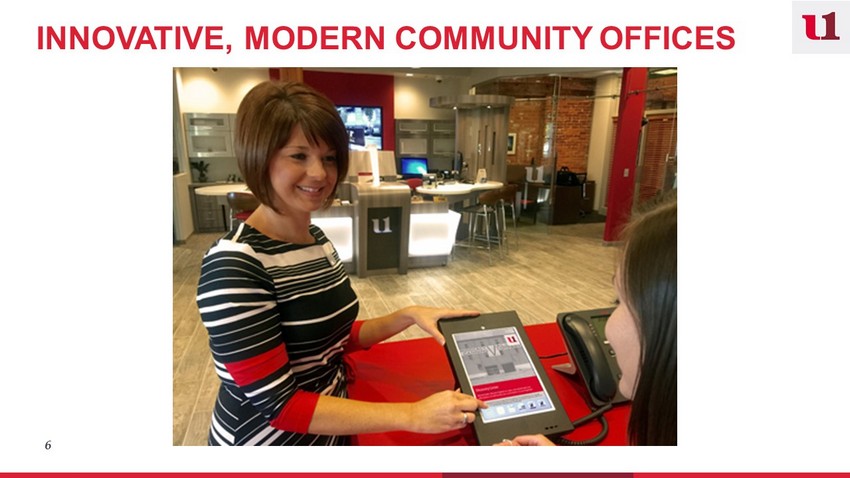
Slide 6: Community Offices
Imagine a banking office that is modern, bright and full of knowledgeable, caring people who are dedicated to making sure you have an exceptional, uncommon experience using state of the art technology.
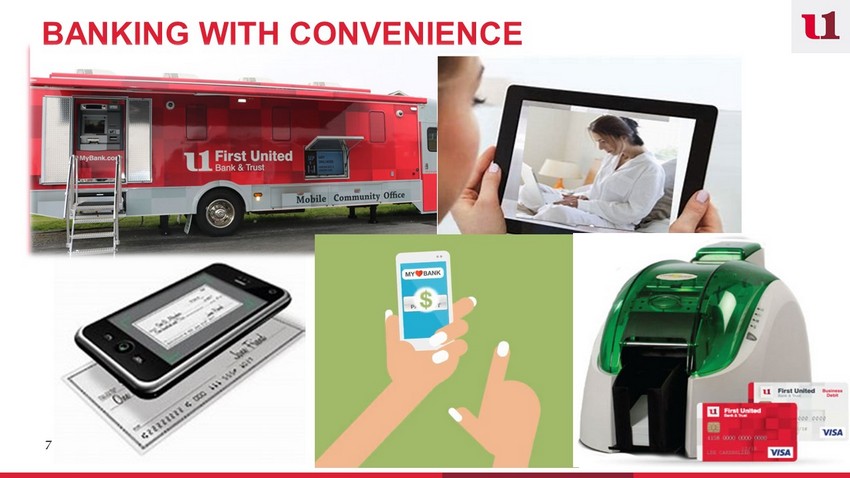
Slide 7: Banking with Convenience
Imagine having dinner with a friend and instead of paying your half of the bill in cash, you pick up your phone and with a few keystrokes, you send a deposit directly from your checking account to your friend’s account.
Imagine opening your mail to find a reimbursement check from your insurance carrier. You quickly use your mobile device to take a picture of the front and back of your check and snap! Deposit is completed.
Imagine realizing that you have lost your debit card, moments before you are heading out of town on vacation. No problem, you stop by your local branch and receive an instant issue debit card. Convenience and peace of mind – instantly!
Imagine your bank coming to you – at work, at community events, at school! Mobile banking at its best!
Imagine sitting in your pajamas at home, opening your computer and within minutes, you are reviewing your investment portfolio with your wealth advisor – virtual face to face.
If you are sitting there thinking you can do all those things today, you are right. The future of banking is now! We offer all these banking services today – person to person bill pay, mobile deposit capture, instant issue debit cards, a mobile branch and Skype meetings. You can take advantage of these services in our updated branch environments, from the comfort of your home, from your office or when you are out of town traveling.
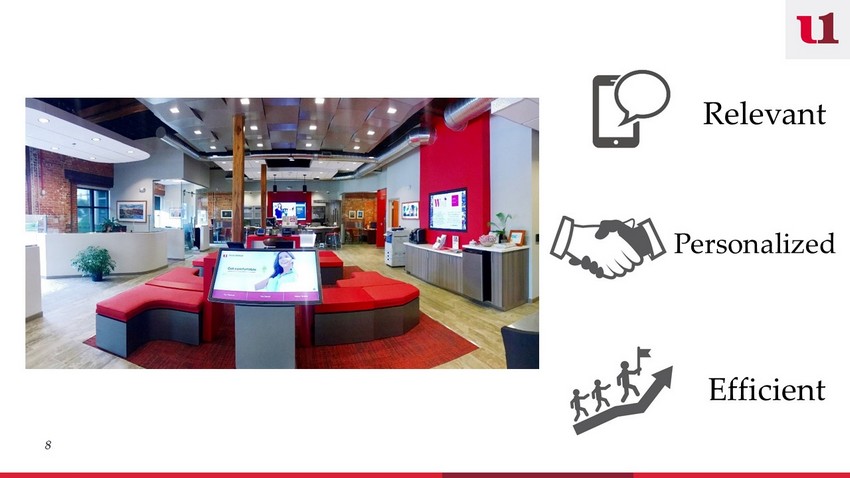
Slide 8: Relevant, Personalized, Efficient
So, have we moved away from personal, face-to-face banking? Absolutely not! We are renovating our offices, hiring the best talent in our communities and training our associates to ask questions, listen to our customers and to offer customized financial solutions. Every day, in every way.
I have been asked many times over the last couple of years if these renovations and changes are really necessary. Should we be spending this money? My answer is absolutely! I will say the same thing this year that I said in my shareholder address last year. To effectively compete, we must remain relevant to all customers across all demographics, whether they bank in our community offices, through internet banking, or through use of our mobile banking applications. We must deliver the perfect blend of personalized customer service and enhanced technology, making the banking experience for our customers both efficient and welcoming. We must have a passion for knowing and understanding our customers and we must continue to provide unique, customized financial solutions.
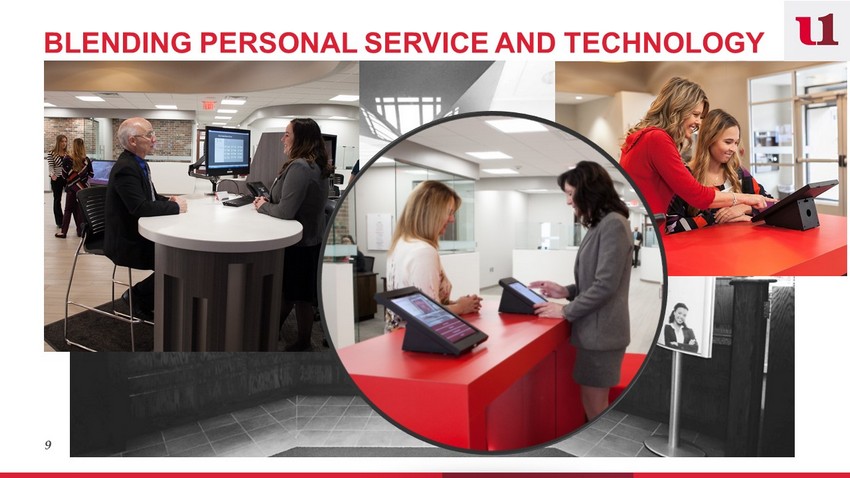
Slide 9: Blending Personal Service and Technology
We are removing the barriers, including the physical barriers like the old teller lines, to allow our associates to more closely interact with our customers – hip to hip, face to face. We are also educating our customers to remove mental barriers like the fear of technology. We can now easily share a screen with our customers or demonstrate with hands on technology how to set up or maneuver an internet banking transaction. We use machine technology to count cash, freeing up our time to interact and have personal conversations. The blend of personal service and technology will create operational efficiencies in the future which will help to offset the cost of the renovations and will allow us to attract new customers and grow relationships with our existing customers. Besides these practical and innovative reasons for our physical changes, we also recognize that we have a financial investment in our branch locations and it is our duty to maintain and update this real estate to protect that investment for you, our shareholders.
I am pleased to report that we are hearing from our communities, customers and associates how impressed they are with our new look, enhanced technology and innovative offerings. Don’t just take my word for it, let me share a few words from our associates.
Clip #2
Slide 10: Community Support
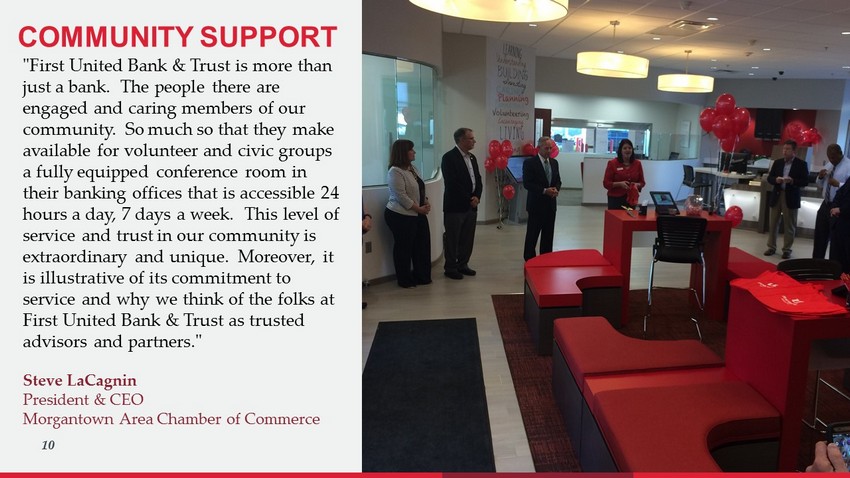
Our communities echo these thoughts. At our recent grand re-opening of our newly transformed Suncrest Office in Morgantown, West Virginia, Steve LaCagnin, President and Chief Executive Officer of the Morgantown Area Chamber of Commerce, and Special Counsel with Jackson Kelly PLLC, commented, "First United Bank & Trust is more than just a Bank. The people there are engaged and caring members of our community. So much so that they make available for volunteer and civic groups a fully equipped conference room in their banking offices that is accessible 24 hours a day, 7 days a week. This level of service and trust in our community is extraordinary and unique. Moreover, it is illustrative of its commitment to service and why we think of the folks at First United Bank & Trust as trusted advisors and partners."
Slide 11: Map
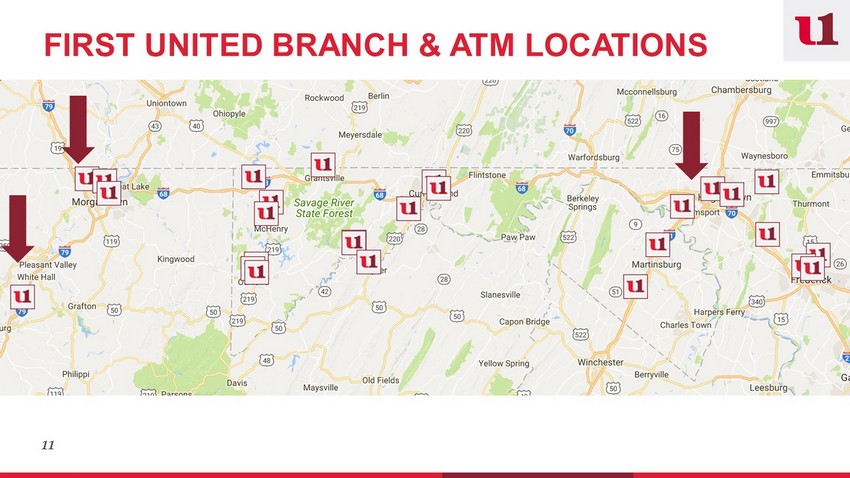
Our renewed passion extends beyond our look and our enhanced ability to serve our customers with state of the art technology. We are also excited to announce growth in our core operations. Late last year, we opened a financial center in a leased space in Bridgeport, West Virginia. This is a new market for us and is being served by a commercial lender, wealth management officer and one retail relationship advisor. We offer full banking services in this low-cost environment. It is my pleasure to report that after just a few months, this office is already showing profit. We like this model and plan to use it more in the future as an entry point into other markets and a way to expand our presence in our existing markets. In late 2018 and early 2019, we plan to open new full-service locations to better serve our customers in Hagerstown, Maryland and Morgantown, West Virginia.
Beyond our geographic growth, our core income has improved in the last couple of years as loan production, increased activity in wealth management and brokerage, and an improved deposit mix are increasing the bottom line. Tonya Sturm, your Chief Financial Officer, will now provide more detailed information on our financial performance.
TONYA STURM
Slide 12: Tonya Sturm
Thank you, Carissa. Good Morning!
Today, I will highlight our 2017 financial performance as well as a few highlights for the first quarter of 2018, which were released last week in the Quarterly Report on Form 10-Q. For more details, I encourage you to read the discussions of our financial condition and results of operations contained in our 2017 Annual Report on Form 10-K and in our Quarterly Report on Form 10-Q for the quarter ended March 31, 2018, which are both available to all shareholders on our website.
Slide 13: Trend in Total Assets
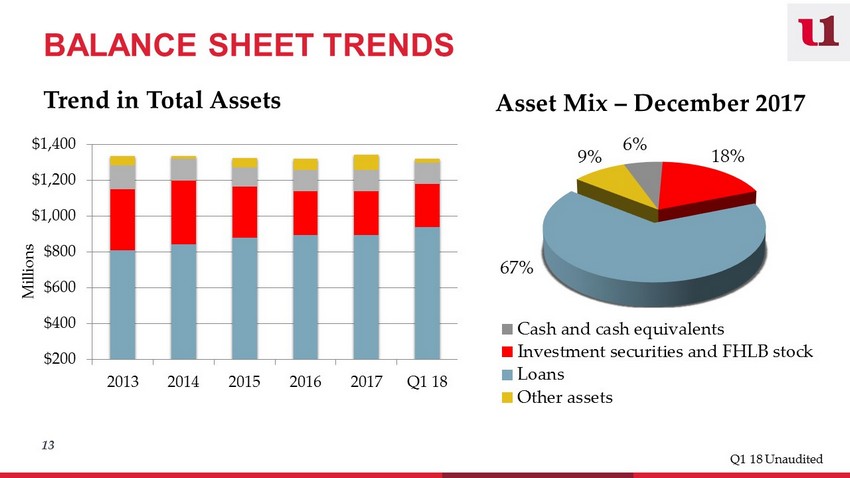
The two key components that most impact the balance sheet are profitably growing high quality assets and improving capital ratios.
Margin and core earnings are strongly influenced by asset growth and the composition of our asset mix. As indicated on the left side of this chart, we saw an increase in total assets from 2016 through 2017. As we discussed last year, during 2017, we continued to use the cash flow from the investment portfolio to fund loan growth. This strategy positively impacts the net interest margin by replacing the cash flow from lower earning investments into higher yielding loans.
At March 31, 2018, we saw a decline in assets when compared to December 31, 2017. This decline was due primarily a reduction of cash balances and a decline in deposits that were offset by a robust increase in loan balances. I will highlight this shortly.
The right side of this slide shows the composition, or asset mix. As we continue to see, the Bank is predominantly invested in loans. This can be seen in the blue section of this chart. The percentage of investments decreased slightly in 2017 when compared to December 31, 2016 as we used excess cash and the maturing cash flows from investments to provide funding for higher yielding loans.
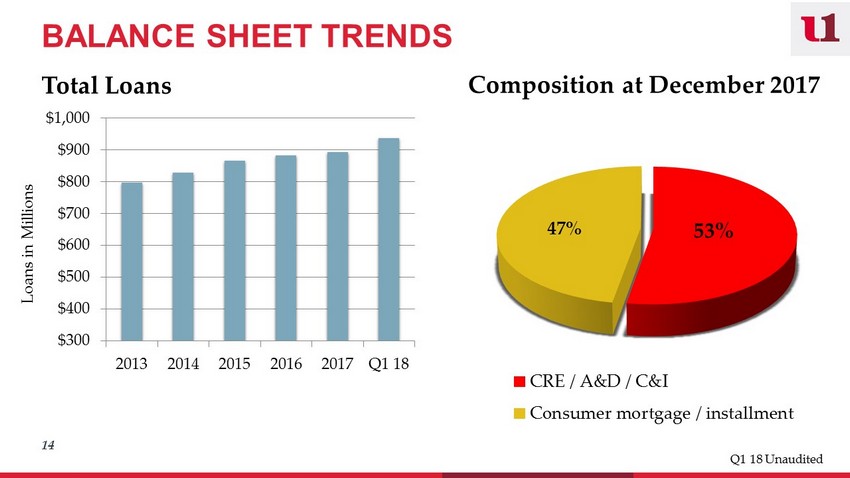
Slide 14: Trend in Loan Balances
Loan balances remained relatively flat for 2017 when compared to 2016. Residential mortgage loans, including home equity loans, grew by $5.2 million; however, this growth was offset by reductions in the commercial loan portfolio. The residential loan growth was slowed by the continued rate increases by the Fed as customers’ preference was the longer-term, fixed rate product. We continued to sell these fixed rate loans to Fannie Mae. Although commercial loan production was strong in 2017, large loan payoffs exceeded the production resulting in a slight reduction in commercial loan balances as compared to 2016.
The chart on the right side of this slide shows the composition of the loan portfolio at December 31, 2017. Residential mortgage and other consumer loans comprise 47% of total loans and are represented by the gold section. The Commercial portfolio, at 53% of total loans, is diversified in commercial real estate, commercial and industrial, and acquisition and development loans, and is represented by the red section in the chart. This composition remained the same as 2016.
As I mentioned earlier, loan growth was strong for the first quarter of 2018 where balances grew by $45.0 million. Residential mortgage loans, including home equity loans, grew by $19.8 million. This growth includes the purchase of a $15.0 million pool of 1-4 family mortgage loans and $4.8 million of organic growth. The commercial portfolio also posted strong growth in the first quarter of $15.3 million.
During the first quarter of 2018, your management team introduced a new insured student loan product for our customers. This product is available not only for in-school funding, it is also available for customers to refinance their existing student loans. We believe this new option will complement our product offerings for the community-oriented business owner and other professionals seeking to consolidate their debt. In the first quarter of 2018, consumer loans increased due to our purchase of a $10.0 million pool of student loans.
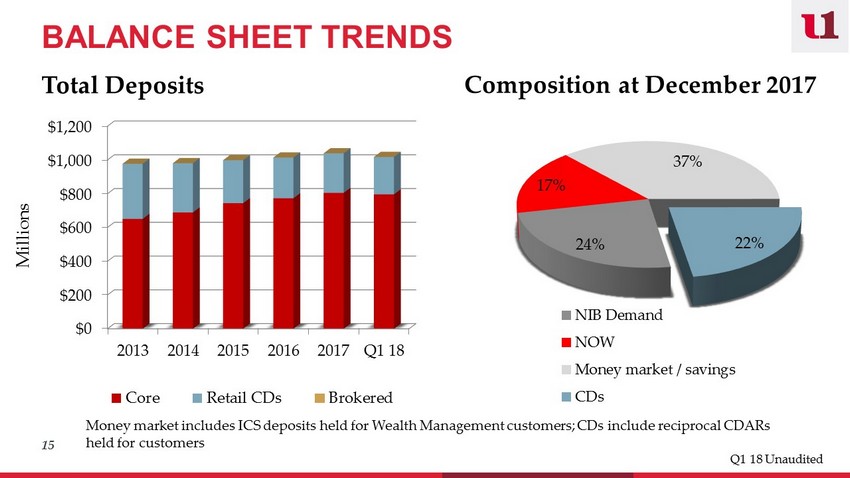
Slide 15: Trend in Deposits
Total deposits increased $25.2 million in 2017. Despite increasing pricing competition within each of our markets, we were able to continue to lag the market with increased deposit rates and used empowerment to maintain and attract new money from our full relationship customers. And, as we have discussed in prior years, we continued to see the shift of our mix of deposits from higher cost certificates of deposit to lower cost core money market and demand deposit accounts. The bar chart on the left side of this slide shows this shift as the retail CDs and brokered deposits, or the gold and blue portions of the bars, have decreased as compared to 2016, and the core, retail deposits, or the red portion of the bars, have increased.
Moving to the chart on the right side of this slide, core accounts, or the light and dark gray and bright red sections, make up 78% of total deposits with certificates of deposit, the blue section, comprise 22% of total deposits.
For first quarter 2018, deposit balances declined by $21.5 million. This decline was primarily attributable to a cash re-allocation within our trust money market accounts and the maturity of certificates of deposit for a municipality. Core, retail balances remained relatively stable as compared to December 31, 2017.
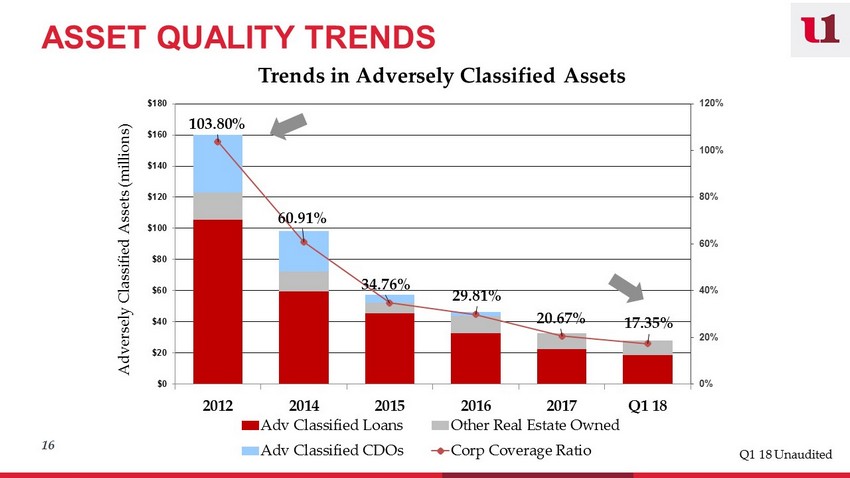
Slide 16: Asset Quality Trends
The main ratio we monitor with respect to asset quality is the coverage ratio. This ratio compares our exposure to substandard loans, investments, and other real estate owned to our tier one capital plus capital that has been set aside in the allowance for loan losses. It is essentially a measure of the risk that these adversely classified assets pose to our capital and is represented by the red line on this chart. As a result of reducing each of the substandard asset classes, we have successfully reduced our adversely classified assets as a percentage of capital from 104% at December 31, 2012 to just slightly over 20% at December 31, 2017. You can see further decline for the first quarter of 2018 to just under 18% which is a more normalized level. The red portion of each bar represents substandard loans, the gray represents other real estate owned and the blue represents substandard investments in collateralized debt obligations, which were all pass rated as of the second quarter of 2017; therefore, having no impact on this ratio.
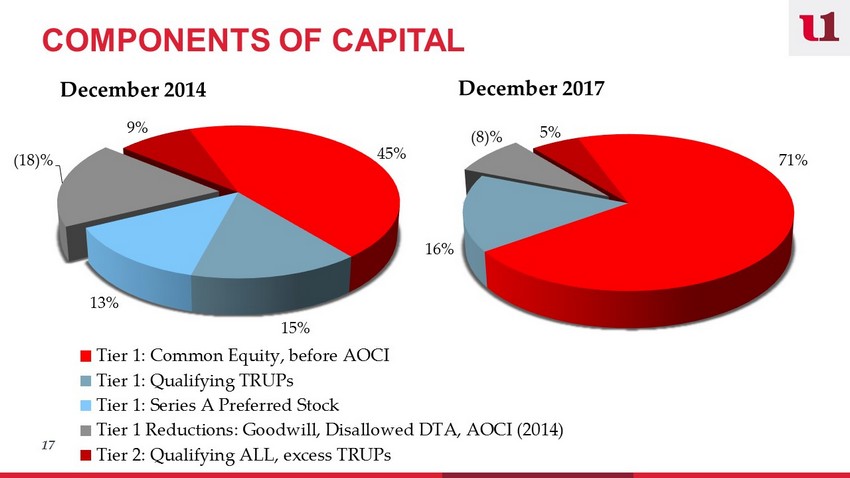
Slide 17: Components of Capital
As we have discussed in prior years, we have been focused on shifting the mix in our capital composition to higher levels of tangible common equity.
As we discussed last year, in March 2017, we used the net proceeds of $9.2 million from the common stock rights offering to redeem $10.0 million of Series A Preferred Stock and repay $10.8 million of trust preferred debentures. In November 2017, we redeemed the final $10.0 million of Series A Preferred Stock. The effect of these actions was to increase common equity, the red portion, from 45% of total capital at December 31, 2014 to 71% at December 31, 2017 and decrease the Series A Preferred Stock, the blue portion, from 13% in 2014 to full redemption in 2017.
Slide 18: Net Interest Margin
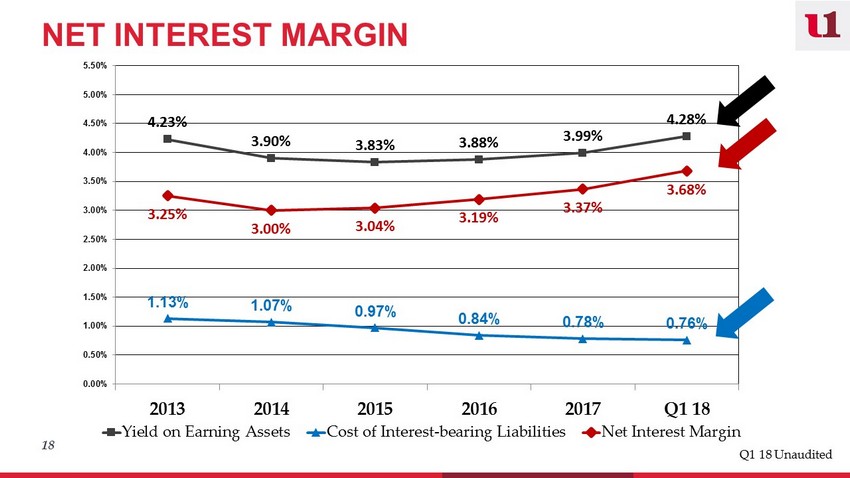
The largest component with the biggest impact to strengthening core earnings is net interest income which is interest earned on loans and investments less interest paid on deposits and borrowings.
Net interest income is measured by the net interest margin. The yield on earning assets has been favorably impacted over the past several years by changes in the asset mix and more recently, the increasing rate environment. With three Federal Reserve rate increases in December 2016, and March and June 2017, loans repricing at higher rates and new loan production booked at higher rates, we recorded higher interest income. The result of these actions can be seen by the black trend line for the yield on earning assets. The liability side of the balance sheet impacts the cost of funds. During 2017, we continued to see the shift in deposits from higher cost certificates of deposit to lower cost core accounts and continued our focus on empowerment pricing for the full relationship customer.
The repayment of the $10.8 million of trust preferred debt in March 2017 also positively impacted the cost of funds by reducing interest expense on long-term borrowings. The blue trend line shows this steady decline in the cost of funds. These efforts resulted in an increase in the net interest margin to 3.37% at December 31, 2017, from 3.19% at December 31, 2016, which can be seen by the red trend line in the middle of this chart.
As we continued these efforts into 2018, combined with Federal Reserve rate increases in December 2017 and March 2018, we reported an increase in the net interest margin to 3.68% at March 31, 2018.
Slide 19: Other Operating Income and Expense
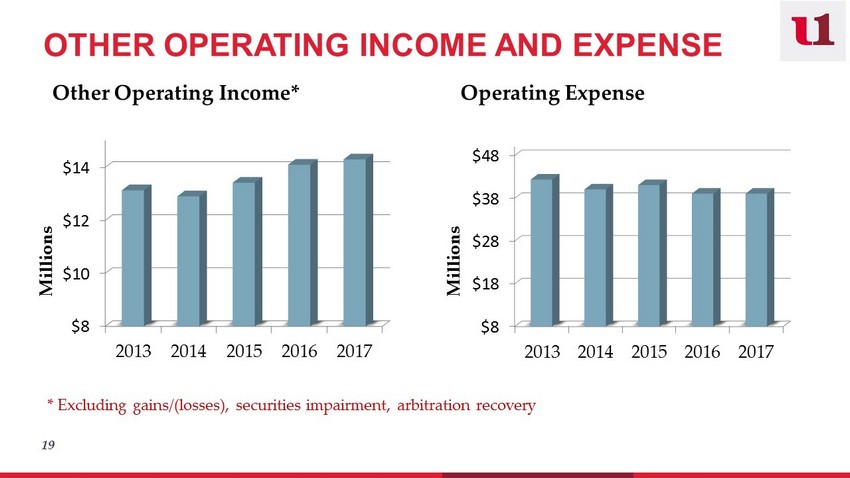
The final two core components of earnings are other operating income and expense. Other operating income includes wealth management income, service charge income, debit card income and income from bank owned life insurance. Other operating income, excluding gains and losses booked on the sale of investments and other real estate owned increased slightly in 2017 when compared to 2016. Increases in wealth management and debit card income were offset slightly by decreased service charge and bank owned life insurance income.
Other operating expenses remained relatively consistent for the year ended 2017 when compared to 2016. We saw an increase in salaries and benefits, primarily from new hires and increased health care costs, an increase in data processing expenses due to new services implemented in late 2016 and early 2017, and an increase in equipment expense from increased depreciation expense from the branch renovations related to our new branding efforts throughout the Company. These increases were successfully offset by decreases in FDIC premiums, professional services, other real estate owned expenses, and other miscellaneous expenses.
Slide 20: Wealth Management
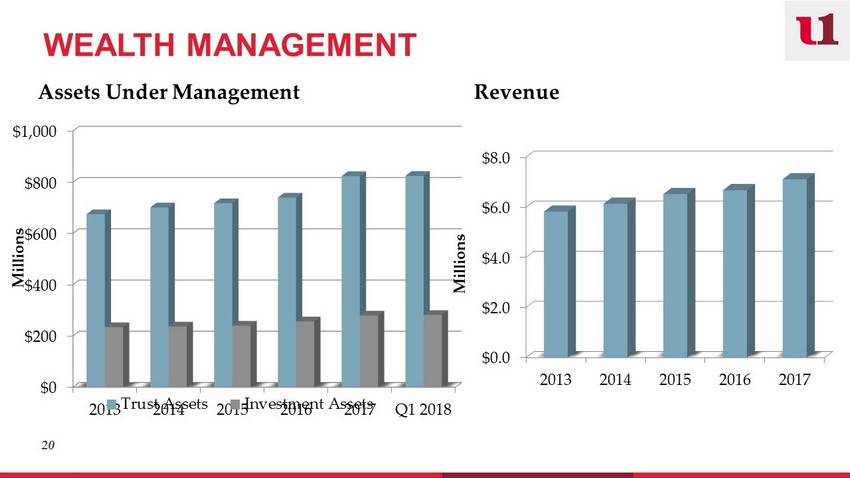
Revenue in Wealth Management is primarily attributable to assets under management. The growth in market values and successful sales from our Wealth Management sales teams increased assets under management to $824 million in Trust and $280 million in Investment Services.
Our Wealth Management group posted a 6% increase in revenues in 2017 over 2016 to $7.1 million. Wealth Management income continues to be a focus in 2018.
Slide 21: Net Income Available to Common Shareholders
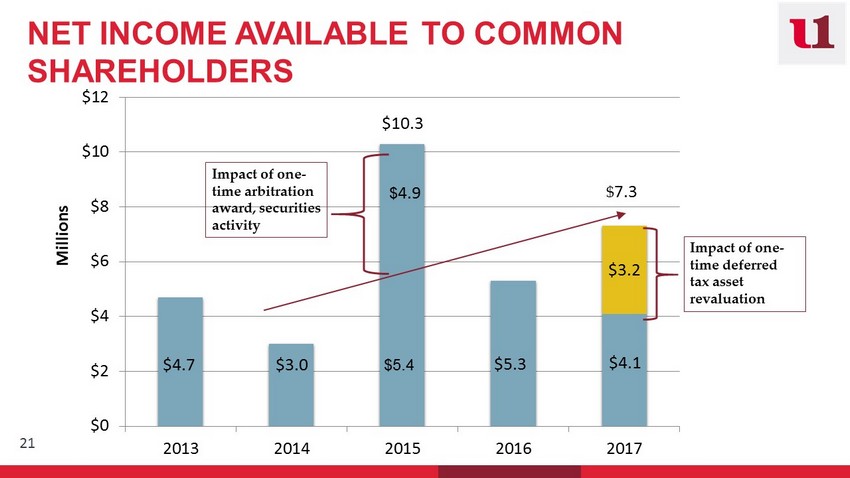
Consolidated net income available to common shareholders for 2017 was $4.1 million compared to $5.3 million for 2016. The reduction in earnings was attributable to the increased tax expense recorded in 2017.
On December 22, 2017, the Tax Cuts and Jobs Act was announced which reduced the federal tax rate from 35% to 21%. As a part of the Tax Act, we were required to revalue our deferred tax assets and liabilities. The impact of this revaluation was $3.2 million of additional tax expense for 2017 as can be seen by the gold portion of the bar.
Last week, your Company announced earnings of $2.5 million for the quarter ended March 31, 2018, which resulted from maintaining net interest income, increased other operating income and reductions in operating expenses. For more details on the first quarter of 2018 results, I encourage you to read the Quarterly Report on Form 10-Q which is posted on our website.
Slide 22: Earnings per Common Share
This next slide shows the earnings per common share of $.58 for 2017 as compared to $.84 for 2016. The decrease in earnings per common share was attributable to the additional tax expense as we just discussed. The additional $3.2 million of tax expense equated to a reduction of $.49 per common share, or the gold portion of the bar.
For the first quarter of 2018, earnings per common share was $.35 related to $2.5 million of net income available to common shareholders.
At this time, I will turn the presentation back over to Carissa.
Thank you!
CARISSA RODEHEAVER
Slide 23: Carissa Rodeheaver
Thank you, Tonya!
Slide 24: Rights Offering
The financial progress that we have experienced in the past few years has enabled us to execute our capital plan. Last year, on March 20, 2017 we closed a very successful common stock rights offering. The participation of our long-time shareholders, including associates, executives and directors, was remarkable. We received oversubscriptions totaling almost three times the number of offered shares. We raised net proceeds of $9.2 million and used the proceeds to offset repayment of our Series A Preferred Stock and our junior subordinated debentures as Tonya discussed earlier. These actions will reduce future preferred dividend and interest expense by approximately $2.9 million per year. From a shareholder perspective, the stock raise and subsequent repayment of the preferred stock and debentures was accretive to future earnings and was only slightly dilutive to tangible book value.
Slide 25: Common Stock Dividend
These steps in our plan allowed us to resume payment of a cash dividend on our common stock. We paid $.09 per share on May 2, 2018.
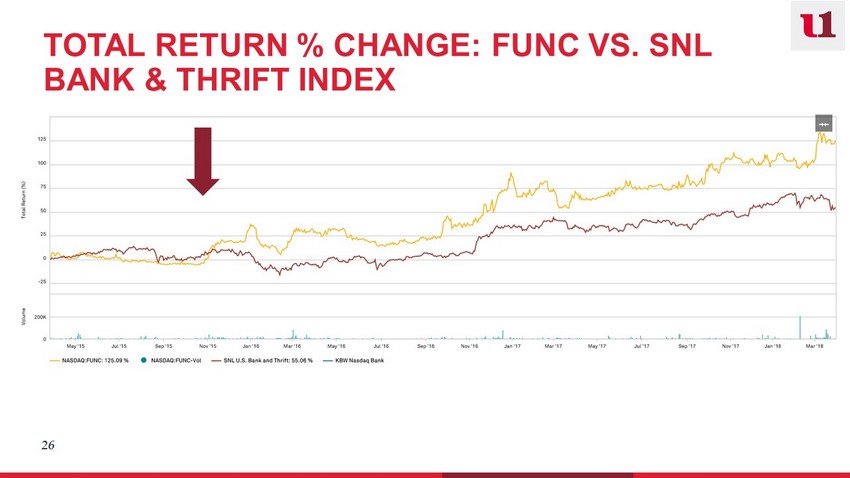
Slide 26: Total Return
The capital actions just described along with the improved financial performance has been reflected in the price of our stock. This chart shows that the % change in total return on First United Corporation stock, represented by the gold line, has outperformed the SNL Bank & Thrift Index, the blue line, since late in 2015.
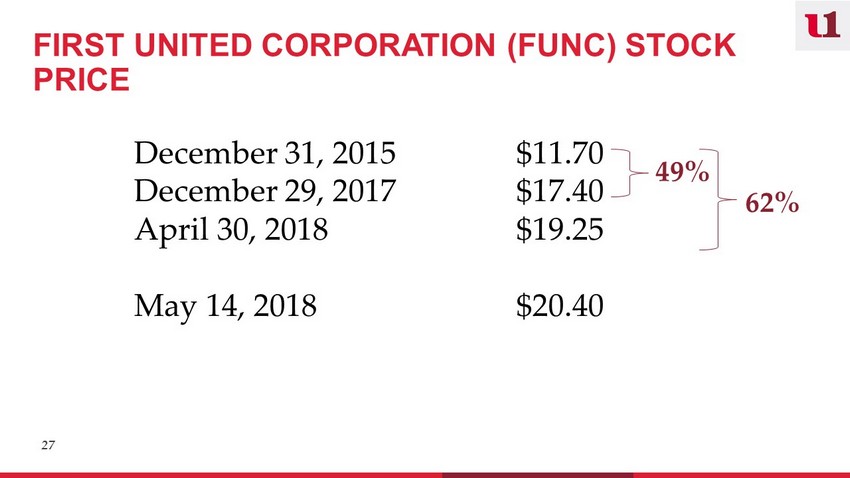
Slide 27: Stock Price
The price of our common stock improved from $11.70 per share at December 31, 2015 to $17.40 per share at December 29, 2017, a 49% increase. We have continued to experience an increase in stock price thus far in 2018. For those shareholders who participated in the rights offering at the cost of $11.93 per share, you have been rewarded with a 62% return on those shares through April 30, 2018.
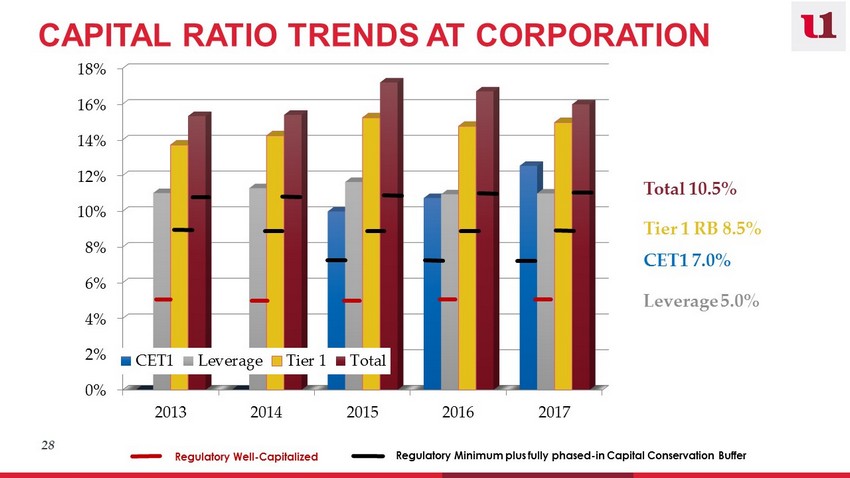
Slide 28: Capital Ratios
All of these capital actions have been possible due to our strong capital ratios. We continue to have a strong capital position, well in excess of regulatory minimums to be considered well-capitalized, even including the capital conservation buffer requirements under Basel III. We are well poised in both stock currency and capital for future growth.
Slide 29: 2018 Strategic Initiatives
As we turn our focus to 2018, our strategic focus centers around improving our core earnings. We have created regional business plans incorporating specific financial metrics, goals and team incentives for achievement of these goals. This closely ties individual contribution to the overall financial performance of the Bank. We are focusing on the customer experience, both internal and external. This involves improved processes, streamlined account openings and loan applications and a review of our products and services.
Slide 30: You First
With this in mind, we are excited to announce a new approach to checking where we put you first. Watch for more information as we launch this product next month.
Slide 31: 2018 Strategic Initiatives
Our 2018 plan also continues our focus of seeking growth opportunities in and around our market areas. A few of these initiatives are underway and were discussed earlier. These three initiatives, along with educating our customers on our enhanced technology offerings are designed to enhance your shareholder return.
Slide 32: What Will Future Hold
As we look to the future, we fully anticipate that how we bank, when we bank and where we bank will continue to look and feel differently.
Slide 33: First United’s Future
I can’t tell you exactly what the future of banking will look like, but I can tell you that First United will continue to adapt, will continue its growth efforts and will continue to blend the technology our customers need and want with the personal service that will set us apart from our competitors. We will continue to be engaged and provide support to our communities. We will continue proactively building relationships that leverage our unique team sales approach and specialist knowledge, offering a broad range of innovative services and products that enable our clients to meet or exceed their personal and business-related financial goals.
Slide 34: Thank You for Your Service
As the future brings change in our industry, it also brings change in the lives of our associates. I would like to recognize and thank several individuals for their contributions to the banking industry and to First United Bank & Trust. These individuals have announced their retirements and while it saddens us to lose them from our banking family, we are all happy for them as they move into the next chapter of their lives. Please join me in thanking Robin Murray, Senior Vice President and Director of Retail, who has served First United for 33 years; Patricia Young, Market President for Washington County with 11 years at First United and 48 years of banking experience; Shirley Fitzwater, Vice President, Senior Wealth Advisor and Team Leader, with 45 years at First United; and Scott Rush, Vice President and Senior Trust Investment Officer, who has served First United for over 43 years. Would each of you please stand? Congratulations and thank you for your service. We wish you the best in your retirement.
Slide 35: My Bank is First United
As we conclude our meeting today, I would like to publicly thank your Board of Directors, your management team and every associate at First United Bank & Trust for their commitment to both the Bank and to the communities that we serve. I will conclude again this year by saying that I believe it is the people who make the difference in community banking and at First United Bank & Trust. After all, our passion for helping people achieve their financial goals is why we come to work every day. We want all our customers to say, “My bank is First United!” My helpful, trusted partner for life.
Slide 36: Thank You
Thank you for your attendance today and your confidence in First United Corporation!
First United Corporation Annual Shareholders’ Meeting May 17, 2018
John W. McCullough Director and Chairman of the Shareholders Meeting
Carissa Rodeheaver 3 Chief Executive Officer and Chairman of the Board
4 FORWARD LOOKING STATEMENTS This presentation contains “forward - looking statements” within the meaning of The Private Securities Litigation Reform Act of 1995 relating to, among other things, First United Corporation’s plans, strategies, objectives, expectations, intentions and adequacy of resources. You should be aware of the speculative nature of forward - looking statements. Statements that are not historical in nature, including those that include the words “anticipate”, “estimate”, “will”, “should”, “expect”, “believe”, “intend”, and similar expressions, are based on current expectations, estimates and projections about, among other things, the industry and the markets in which we operate, and they are not guarantees of future performance. Whether actual results will conform to expectations and predictions is subject to known and unknown risks and uncertainties. Actual results could be materially different from management’s expectations. This presentation should be read in conjunction with our Annual Report on Form 10 - K for the year ended December 31, 2017 and our Quarterly Report on Form 10 - Q for the quarter ended March 31, 2018, including the sections of those reports entitled “Risk Factors”, as well as the reports and other documents that we subsequently file with the Securities and Exchange Commission (“SEC”), which are available on the SEC’s website at www.sec.gov or at our website at www.mybank.com . Except as required by law, we do not intend to publish updates or revisions of any forward - looking statements we make to reflect new information, future events or otherwise.

5 JOURNEY TO YOUR FINANCIAL FUTURE
6 INNOVATIVE, MODERN COMMUNITY OFFICES
7 BANKING WITH CONVENIENCE
8 Relevant Personalized Efficient
9 BLENDING PERSONAL SERVICE AND TECHNOLOGY
10 "First United Bank & Trust is more than just a bank. The people there are engaged and caring members of our community. So much so that they make available for volunteer and civic groups a fully equipped conference room in their banking offices that is accessible 24 hours a day, 7 days a week. This level of service and trust in our community is extraordinary and unique. Moreover, it is illustrative of its commitment to service and why we think of the folks at First United Bank & Trust as trusted advisors and partners." Steve LaCagnin President & CEO Morgantown Area Chamber of Commerce COMMUNITY SUPPORT
11 FIRST UNITED BRANCH & ATM LOCATIONS
Tonya Sturm 12 Senior Vice President and Chief Financial Officer
13 Trend in Total Assets $200 $400 $600 $800 $1,000 $1,200 $1,400 2013 2014 2015 2016 2017 Q1 18 Millions 6% 18% 67% 9% Cash and cash equivalents Investment securities and FHLB stock Loans Other assets Asset Mix – December 2017 BALANCE SHEET TRENDS Q1 18 Unaudited
14 $300 $400 $500 $600 $700 $800 $900 $1,000 2013 2014 2015 2016 2017 Q1 18 Loans in Millions Total Loans 53% 47% CRE / A&D / C&I Consumer mortgage / installment Composition at December 2017 BALANCE SHEET TRENDS Q1 18 Unaudited
15 $0 $200 $400 $600 $800 $1,000 $1,200 2013 2014 2015 2016 2017 Q1 18 Millions Core Retail CDs Brokered Total Deposits 24% 17% 37% 22% NIB Demand NOW Money market / savings CDs Composition at December 2017 Money market includes ICS deposits held for Wealth Management customers; CDs include reciprocal CDARs held for customers BALANCE SHEET TRENDS Q1 18 Unaudited
16 103.80% 60.91% 34.76% 29.81% 20.67% 17.35% 0% 20% 40% 60% 80% 100% 120% $0 $20 $40 $60 $80 $100 $120 $140 $160 $180 2012 2014 2015 2016 2017 Q1 18 Adversely Classified Assets (millions) Adv Classified Loans Other Real Estate Owned Adv Classified CDOs Corp Coverage Ratio Trends in Adversely Classified Assets ASSET QUALITY TRENDS Q1 18 Unaudited
17 45% 15% 13% (18)% 9% Tier 1: Common Equity, before AOCI Tier 1: Qualifying TRUPs Tier 1: Series A Preferred Stock Tier 1 Reductions: Goodwill, Disallowed DTA, AOCI (2014) Tier 2: Qualifying ALL, excess TRUPs December 2014 71% 16% (8)% 5% December 2017 COMPONENTS OF CAPITAL
18 4.23% 3.90% 3.83% 3.88% 3.99% 4.28% 1.13% 1.07% 0.97% 0.84% 0.78% 0.76% 3.25% 3.00% 3.04% 3.19% 3.37% 3.68% 0.00% 0.50% 1.00% 1.50% 2.00% 2.50% 3.00% 3.50% 4.00% 4.50% 5.00% 5.50% 2013 2014 2015 2016 2017 Q1 18 Yield on Earning Assets Cost of Interest-bearing Liabilities Net Interest Margin NET INTEREST MARGIN Q1 18 Unaudited
19 $8 $10 $12 $14 2013 2014 2015 2016 2017 Millions * Excluding gains/(losses), securities impairment, arbitration recovery Other Operating Income* $8 $18 $28 $38 $48 2013 2014 2015 2016 2017 Millions Operating Expense OTHER OPERATING INCOME AND EXPENSE
20 $0 $200 $400 $600 $800 $1,000 2013 2014 2015 2016 2017 Q1 2018 Millions Trust Assets Investment Assets Assets Under Management $0.0 $2.0 $4.0 $6.0 $8.0 2013 2014 2015 2016 2017 Millions Revenue WEALTH MANAGEMENT
NET INCOME AVAILABLE TO COMMON SHAREHOLDERS 21 $4.7 $3.0 $10.3 $5.3 $4.1 $3.2 $0 $2 $4 $6 $8 $10 $12 2013 2014 2015 2016 2017 Millions Impact of one - time arbitration award, securities activity $ 4.9 $5.4 $ 7.3 Impact of one - time deferred tax asset revaluation
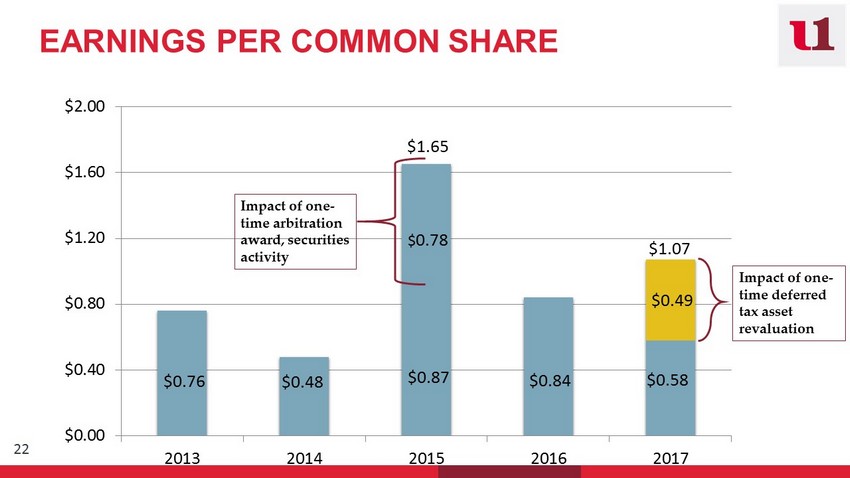
EARNINGS PER COMMON SHARE 22 $0.76 $0.48 $1.65 $0.84 $0.58 $0.49 $0.00 $0.40 $0.80 $1.20 $1.60 $2.00 2013 2014 2015 2016 2017 $ 1.07 Impact of one - time arbitration award, securities activity Impact of one - time deferred tax asset revaluation $ 0.78 $0.87
Carissa Rodeheaver 23 Chief Executive Officer and Chairman of the Board
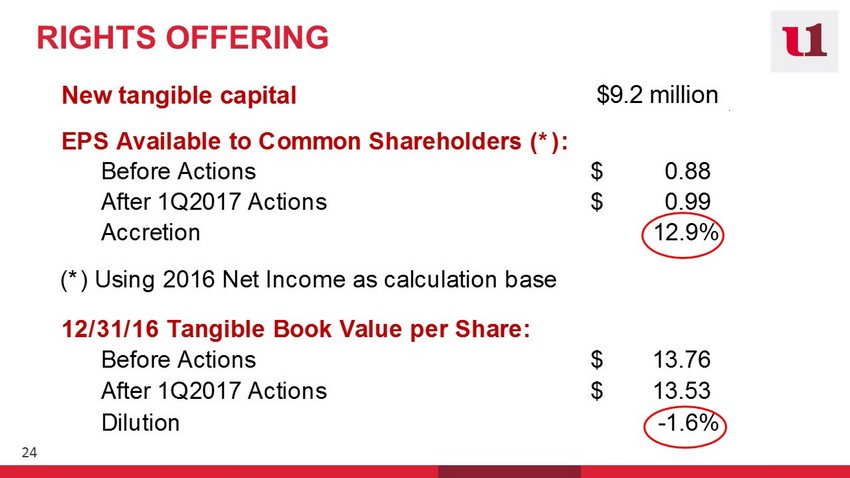
RIGHTS OFFERING 24 New tangible capital $9.2 million 12/31/16 Tangible Book Value per Share: Before Actions 13.76$ After 1Q2017 Actions 13.53$ Dilution -1.6% EPS Available to Common Shareholders (*): Before Actions 0.88$ After 1Q2017 Actions 0.99$ Accretion 12.9% (*) Using 2016 Net Income as calculation base
25 COMMON STOCK DIVIDEND $.09 per share
26 TOTAL RETURN % CHANGE: FUNC VS. SNL BANK & THRIFT INDEX
27 FIRST UNITED CORPORATION (FUNC) STOCK PRICE December 31, 2015 $11.70 December 29, 2017 $17.40 April 30, 2018 $19.25 May 14, 2018 $20.40 49% 62%
28 0% 2% 4% 6% 8% 10% 12% 14% 16% 18% 2013 2014 2015 2016 2017 CET1 Leverage Tier 1 Total Regulatory Well - Capitalized Regulatory Minimum plus fully phased - in Capital Conservation Buffer CET1 7.0% Tier 1 RB 8.5% Leverage 5.0% Total 10.5% CAPITAL RATIO TRENDS AT CORPORATION
2018 HIGH LEVEL STRATEGIES 29 1. Increase core earnings through regionalized plans 2. Provide a seamless, frictionless customer experience – people and process

30 Slide:
2018 HIGH LEVEL STRATEGIES 31 1. Increase core earnings through regionalized plans 2. Provide a seamless, frictionless customer experience – people and process 3. Plan for future growth and expansion (capital) 4. Continue our branch transformation, branding initiatives and technology penetration

32 WHAT DOES THE FUTURE HOLD?
33 FIRST UNITED’S FUTURE Relationship Building Technology Personal Service Community Engagement Fr Franchise Growth Fr Innovative Products & Services
THANK YOU FOR YOUR SERVICE! 34 • Robin Murray , SVP and Director of Retail Banking • Patricia Young , Market President of Washington County • Shirley Fitzwater , VP and Senior Wealth Advisor and Team Leader • Scott Rush , VP and Senior Trust Investment Officer
“My bank is First United!” 35
Thank You! 36