Attached files
| file | filename |
|---|---|
| 8-K - 8-K - LAKE SHORE BANCORP, INC. | lsbk-20180516x8k.htm |
 Annual Shareholders’ Meeting Annual Shareholders’ Meeting May 16, 2018May 16, 2018
 .Call to Order -Gary W. Winger, Chairman .Introduction of Officers, Directors and Director Nominees. Secretary’s Report. Presentation of Proposals. Executive Management Report to Shareholders. Vote Report.AdjournmentAgenda 2
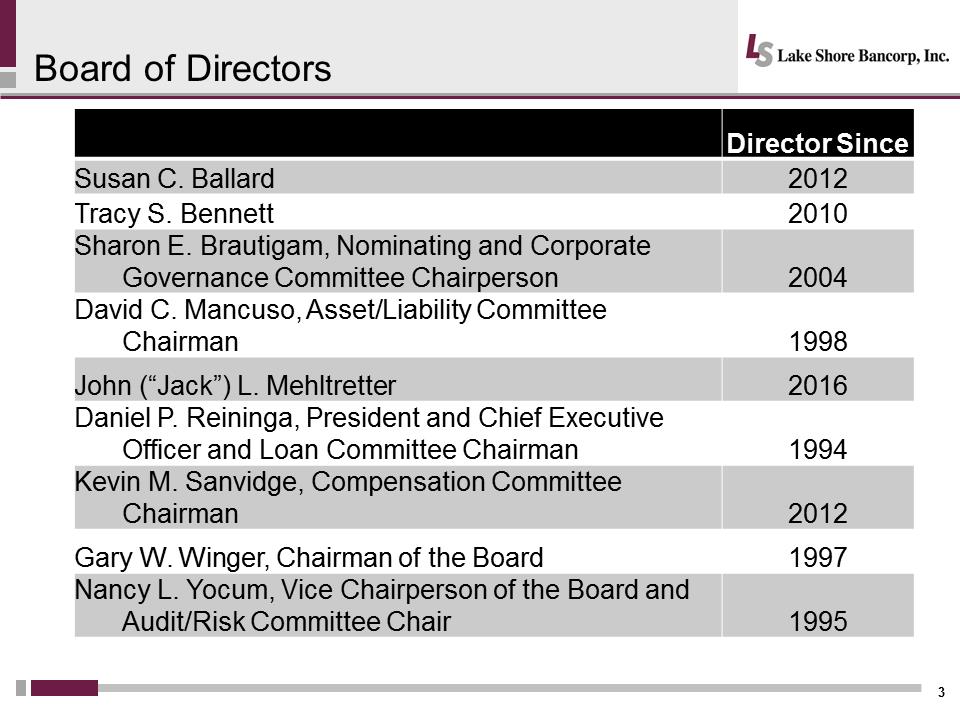 Director Since Susan C. Ballard2012Tracy S. Bennett2010Sharon E. Brautigam, Nominating and Corporate Governance Committee Chairperson2004David C. Mancuso, Asset/Liability Committee Chairman1998John (“Jack”) L. Mehltretter2016Daniel P. Reininga, President and Chief Executive Officer and Loan Committee Chairman1994Kevin M. Sanvidge, Compensation Committee Chairman2012Gary W. Winger, Chairman of the Board1997Nancy L. Yocum, Vice Chairperson of the Board and Audit/Risk Committee Chair1995 3Board of Directors
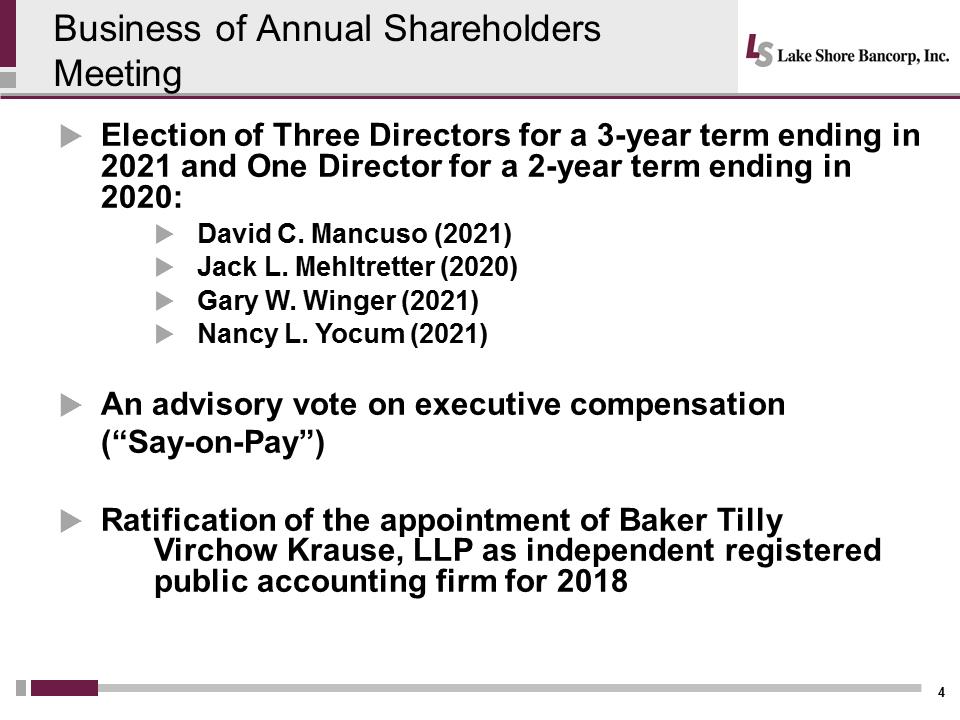 Business of Annual Shareholders Meeting. Election of Three Directors for a 3-year term ending in 2021 and One Director for a 2-year term ending in 2020:.David C. Mancuso (2021).Jack L. Mehltretter (2020).Gary W. Winger (2021).Nancy L. Yocum (2021).An advisory vote on executive compensation (“Say-on-Pay”).Ratification of the appointment of Baker Tilly Virchow Krause, LLP as independent registered 4public accounting firm for 2018
 Executive Management Presentation Daniel P. Reininga President and Chief Executive Officer RIGHT PLACE RIGHT TIME RIGHT BANK 5
 6RIGHT PLACE RIGHT TIME RIGHT BANK Safe Harbor Statement This presentation includes “forward looking statements” within the meaning of the Private Securities Litigation Reform Act of 1995. We intend such forward-looking statements to be covered by the Safe Harbor Provision and are including this statement for the purpose of such Safe Harbor Provision of the Private Securities Litigation Reform Act of 1995.Such forward-looking statements include, but are not limited to, statements concerning future business, revenue and earnings. They often include words such as “believe,” “expect,” “anticipate,” “estimate,” and “intend” or future or conditional verbs, such as “will,” “would,” “should,” “could,” or “may”. These statements are not historical facts or guarantees of future performance, events or results. There are risks, uncertainties and other factors that could cause the actual results of the Company to differ materially from the results expressed or implied by such forward-looking statements. Information on factors that could affect the Company’s business and results is discussed in the Company’s periodic reports filed with the Securities and Exchange Commission. Forward looking statements speak only as of the date they are made. The Company undertakes no obligation to publicly update or revise forward looking information, whether as a result of new, updated information, future events or otherwise.
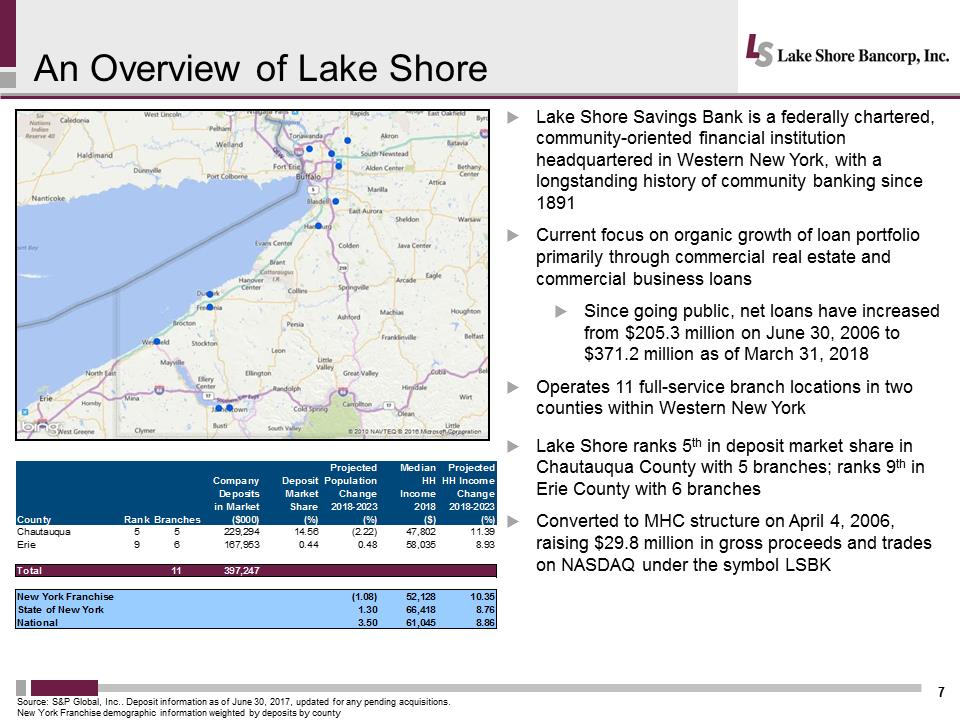 An Overview of Lake Shore7.Lake Shore Savings Bank is a federally chartered, community-oriented financial institution headquartered in Western New York, with a longstanding history of community banking since 1891.Current focus on organic growth of loan portfolio primarily through commercial real estate and commercial business loans. Since going public, net loans have increased from $205.3 million on June 30, 2006 to $371.2 million as of March 31, 2018.Operates 11 full-service branch locations in two counties within Western New York. Lake Shore ranks 5thin deposit market share in Chautauqua County with 5 branches; ranks 9thin Erie County with 6 branches. Converted to MHC structure on April 4, 2006, raising $29.8 million in gross proceeds and trades on NASDAQ under the symbol LSBKSource: S&P Global, Inc... Deposit information as of June 30, 2017, updated for any pending acquisitions. New York Franchise demographic information weighted by deposits by countyhttp://www.oritani.com/images/map_locations.gifhttp://www.oritani.com/images/map_locations.gifhttps://maps.snl.com/arcgisoutput/Utilities/PrintingTools_GPServer/_ags_5648a30321784a39a89ed894a10948f2.jpgCountyRankBranchesCompanyDepositsin Market($000)DepositMarketShare(%)ProjectedPopulationChange2018-2023(%)MedianHHIncome2018($)ProjectedHH IncomeChange2018-2023(%)Chautauqua55229,29414.56(2.22)47,80211.39Erie96167,9530.440.4858,0358.93Total11397,247New York Franchise(1.08)52,12810.35State of New York1.3066,4188.76National3.5061,0458.86
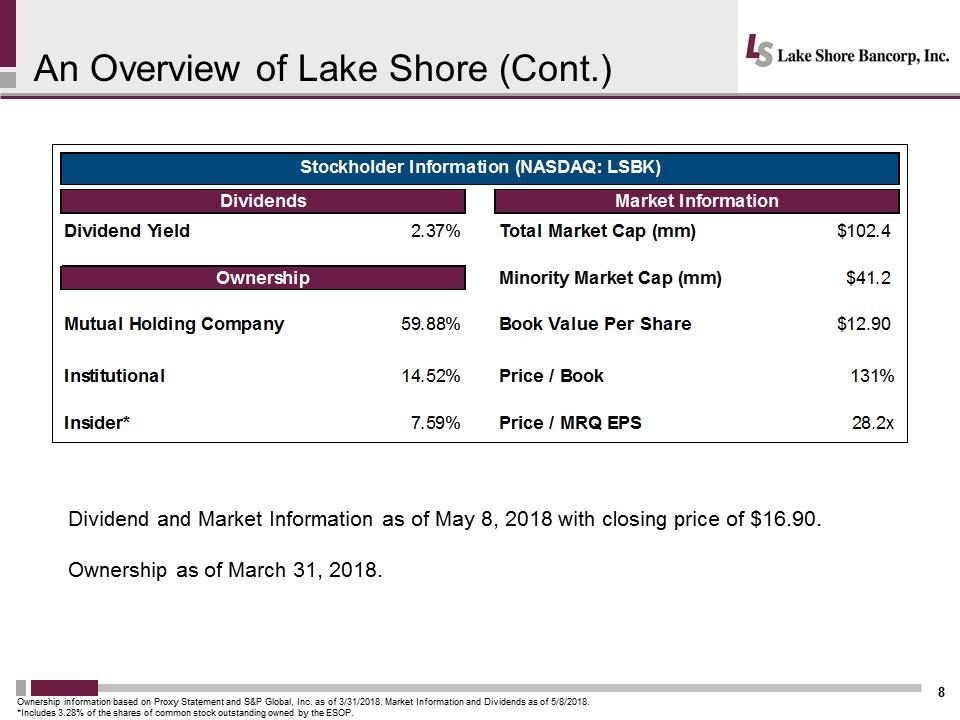 An Overview of Lake Shore (Cont.)8Ownership information based on Proxy Statement and S&P Global, Inc. as of 3/31/2018. Market Information and Dividends as of 5/8/2018.*Includes 3.28% of the shares of common stock outstanding owned by the ESOP. Dividends Market Information Dividend Yield2.37%Total Market Cap (mm) $102.4 Ownership Minority Market Cap (mm)$41.2Mutual Holding Company59.88%Book Value Per Share$12.90Institutional14.52%Price / Book131%Insider*7.59%Price / MRQ EPS28.2xStockholder Information (NASDAQ: LSBK)Dividend and Market Information as of May 8, 2018 with closing price of $16.90.Ownership as of March 31, 2018.
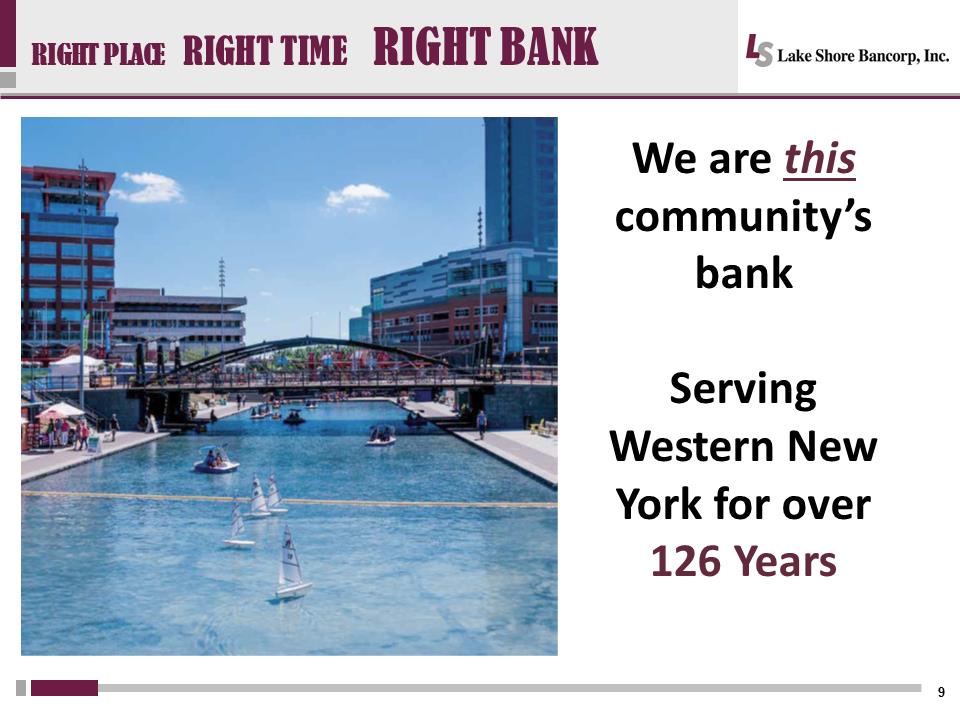 We are this community’s bank Serving Western New York for over 126 Years RIGHT PLACE RIGHT TIME RIGHT BANK 9
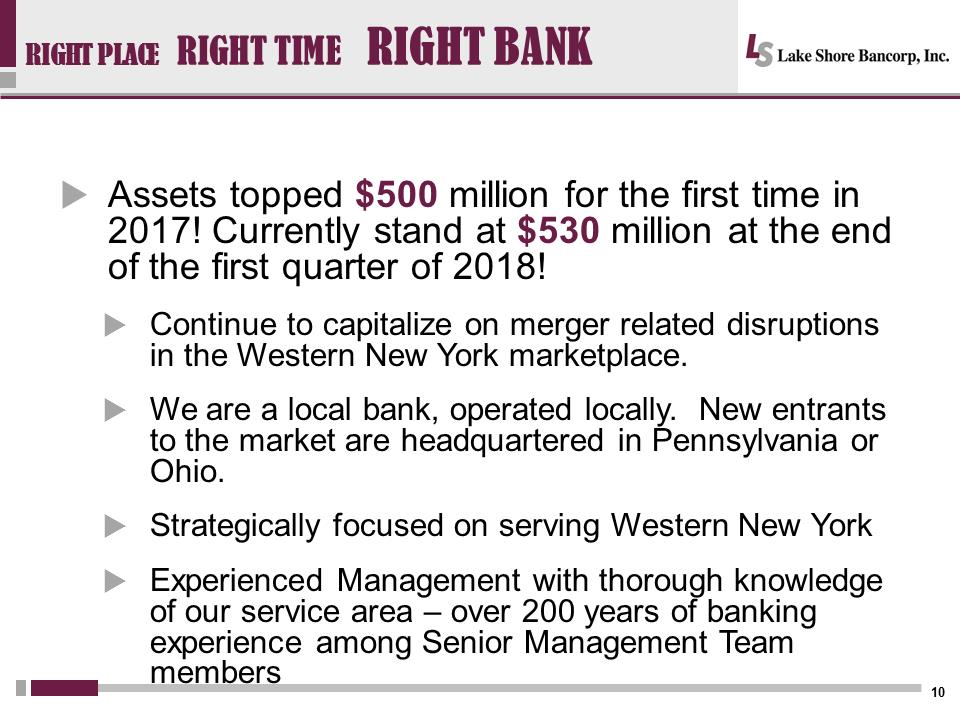 RIGHT PLACE RIGHT TIME RIGHT BANK. Assets topped $500 million for the first time in 2017! Currently stand at $530 million at the end of the first quarter of 2018! Continue to capitalize on merger related disruptions in the Western New York marketplace. We are a local bank, operated locally. New entrants to the market are headquartered in Pennsylvania or Ohio. Strategically focused on serving Western New York. Experienced Management with thorough knowledge of our service area –over 200 years of banking experience among Senior Management Team members 10
 RIGHT PLACE RIGHT TIME RIGHT BANK With continued opportunity for growth Western New York is clearly the RIGHT PLACE for a locally headquartered, service oriented financial institution like Lake Shore Savings Bank 11
 Executing On Our Strategy for Growth. Continued focus on sustainable profitable growth. Commercial loan portfolio growth. Strategically focused on gathering core, low cost deposits. Manage (Mitigate) Enterprise Risk and Interest Rate Risk. Effective Enterprise Risk Management process. Shorter duration loans favorably impact interest rate risk. Commitment to an efficient operating profile 12RIGHT PLACE RIGHT TIME RIGHT BANK
 We have been here for Western New York’s businesses and families through it all –in challenging economic times and in times of growth and prosperity. As always, we’re here at the RIGHT TIME to help our customers and community members benefit from the region’s current economic upswing. RIGHT PLACE RIGHT TIME RIGHT BANK 13
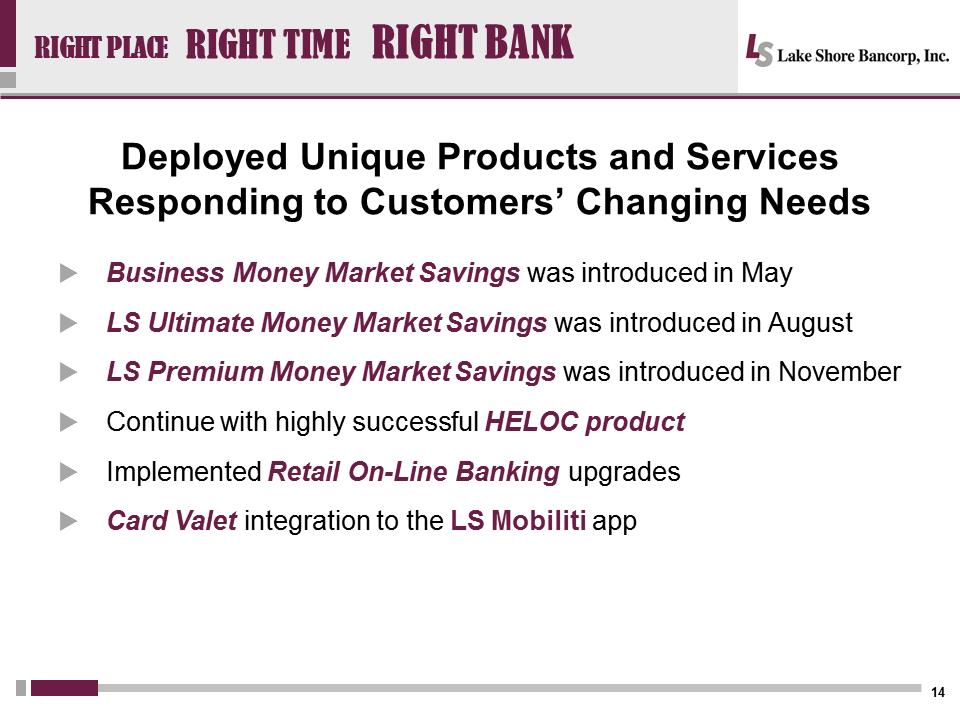 Deployed Unique Products and Services Responding to Customers’ Changing Needs. Business Money Market Savings was introduced in May.LS Ultimate Money Market Savings was introduced in August.LS Premium Money Market Savings was introduced in November .Continue with highly successful HELOC product. Implemented Retail On-Line Banking upgrades. Card Valet integration to the LS Mobility upright PLACE RIGHT TIME RIGHT BANK 14
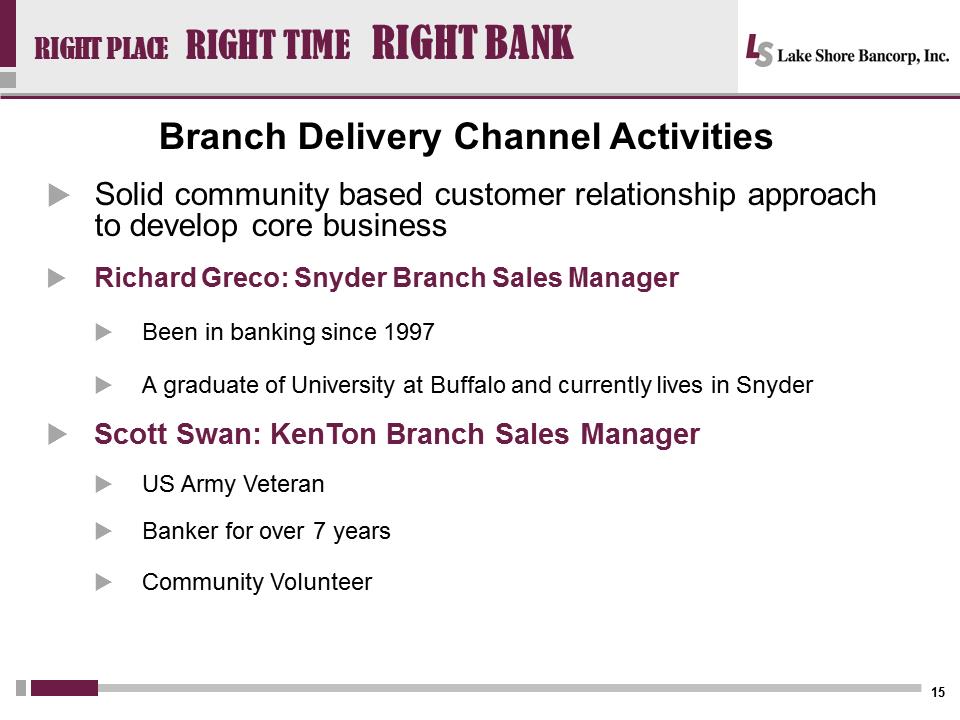 Branch Delivery Channel Activities. Solid community based customer relationship approach to develop core business. Richard Greco: Snyder Branch Sales Manager. Been in banking since 1997.A graduate of University at Buffalo and currently lives in Snyder. Scott Swan: Kenton Branch Sales Manager.US Army Veteran. Banker for over 7 years. Community Volunteer RIGHT PLACE RIGHT TIME RIGHT BANK 15
 Branch Delivery Channel Activities (cont.).Universal Banker Concierge Approach. Committed to providing financial solutions tailored to each customer’s needs. There is no one size fits all, there is no incentivized pressure sale of the day. WHAT IS BEST FOR THE CUSTOMER IS BEST FOR LAKE SHORE SAVINGS BANK.RIGHT PLACE RIGHT TIME RIGHT BANK 16
 Secure and Up to Date Technology. Online banking enhancements support branch business development efforts and meet customers’ technology needs, while maintaining superior customer service. Security Upgrades. Completed conversion to EMV chip cards for debit cards. Password Upgrades for online banking. Identified Replacement Loan Origination System .Business Mobility and Business Mobile Capture 17 RIGHT PLACE RIGHT TIME RIGHT BANK
 Customer solutions and one-to-one interactions are a defining factor of a true community bank such as Lake Shore Savings Bank. By “Putting People First” in all we do, we become the RIGHT BANK for Western New York businesses and consumers. RIGHT PLACE RIGHT TIME RIGHT BANK 18
 Governance and Diversity. Board of Directors have strong governance controls and complete internal self-assessments. Diverse board with 30% female representation. First female director appointed 13 years ago in 1995.Board member backgrounds are diverse –have directors with Information Security, Legal, Banking, Real Estate, Business and Accounting expertise. Active Millennial Advisory Board RIGHT PLACE RIGHT TIME RIGHT BANK 19
 summary We are well positioned to achieve continued success: .Ample Business Opportunities in Western New York. Strong loan pipelines. Talented, service-oriented team this is the RIGHT PLACE and the RIGHT TIME. And Lake Shore Savings Banks the RIGHT BANK.RIGHT PLACE RIGHT TIME RIGHT BANK 20
 Financial Highlights Rachel A. Foley Chief Financial Officer and Treasurer RIGHT PLACE RIGHT TIME RIGHT BANK 21
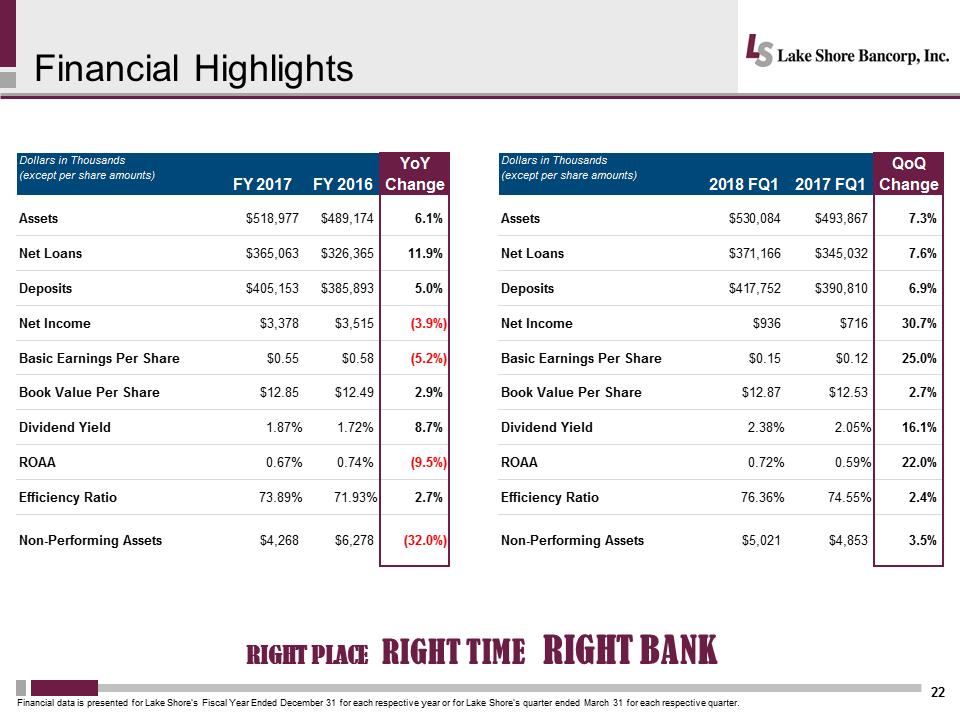 Financial Highlights22Financial data is presented for Lake Shore’s Fiscal Year Ended December 31 for each respective year or for Lake Shore’s quarter ended March 31 for each respective quarter. Dollars in Thousands(except per share amounts)FY 2017FY 2016YoY ChangeAssets$518,977$489,1746.1%Net Loans$365,063$326,36511.9%Deposits$405,153$385,8935.0%Net Income$3,378$3,515(3.9%)Basic Earnings Per Share $0.55$0.58(5.2%)Book Value Per Share$12.85$12.492.9%Dividend Yield1.87%1.72%8.7%ROAA0.67%0.74%(9.5%)Efficiency Ratio73.89%71.93%2.7%Non-Performing Assets$4,268$6,278(32.0%)Dollars in Thousands(except per share amounts)2018 FQ12017 FQ1QoQ ChangeAssets$530,084$493,8677.3%Net Loans$371,166$345,0327.6%Deposits$417,752$390,8106.9%Net Income$936$71630.7%Basic Earnings Per Share $0.15$0.1225.0%Book Value Per Share$12.87$12.532.7%Dividend Yield2.38%2.05%16.1%ROAA0.72%0.59%22.0%Efficiency Ratio76.36%74.55%2.4%Non-Performing Assets$5,021$4,8533.5%RIGHT PLACE RIGHT TIME RIGHT BANK
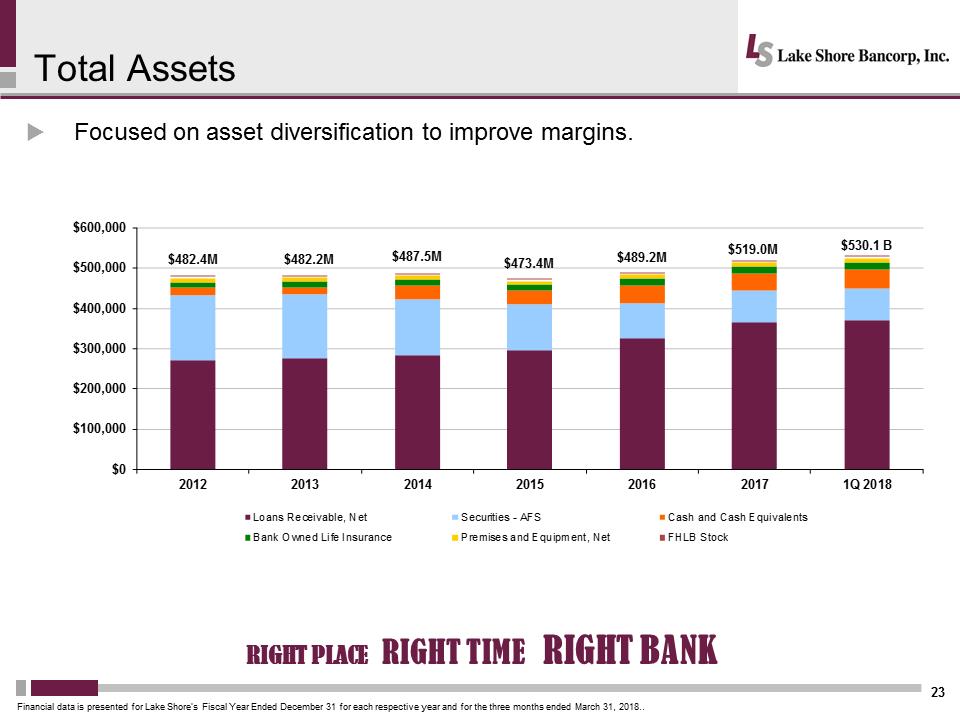 Total Assets23.Focused on asset diversification to improve margins. Financial data is presented for Lake Shore’s Fiscal Year Ended December 31 for each respective year and for the three months ended March 31, 2018..$482.4M$482.2M$487.5M$473.4M$489.2M$519.0M$530.1 B$0$100,000$200,000$300,000$400,000$500,000$600,0002012201320142015201620171Q 2018Loans Receivable, Net Securities - Fasces and Cash Equivalents Bank Owned Life Insurance Premises and Equipment, NetFHLB Stock RIGHT PLACE RIGHT TIME RIGHT BANK
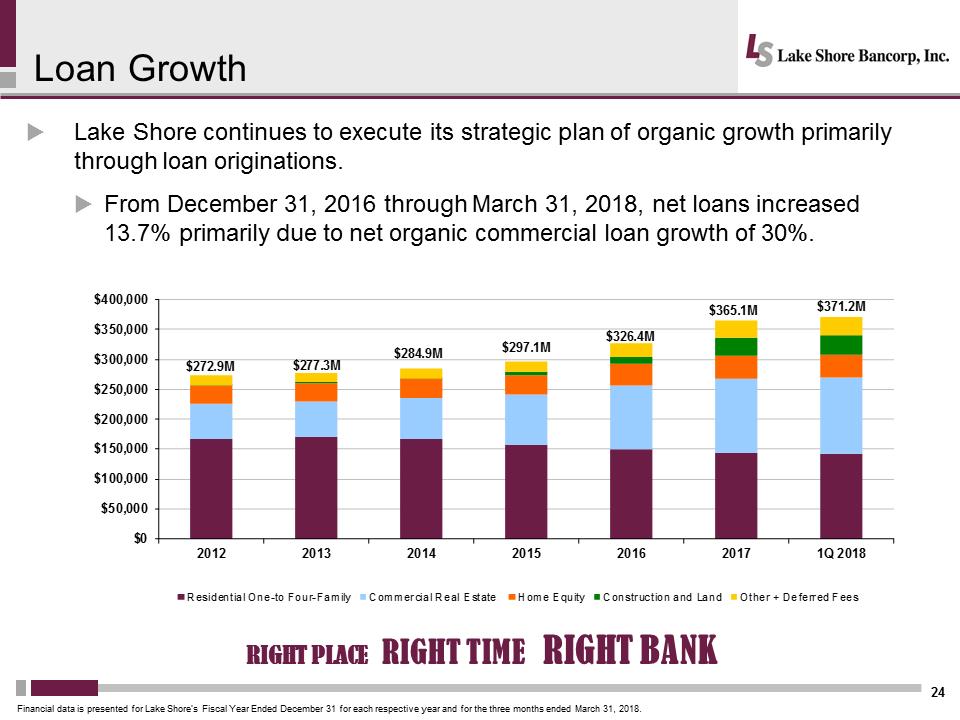 Loan Growth24.Lake Shore continues to execute its strategic plan of organic growth primarily through loan originations. .From December 31, 2016 through March 31, 2018, net loans increased 13.7% primarily due to net organic commercial loan growth of 30%.Financial data is presented for Lake Shore’s Fiscal Year Ended December 31 for each respective year and for the three months ended March 31, 2018.$272.9M$277.3M$284.9M$297.1M$326.4M$365.1M$371.2M$0$50,000$100,000$150,000$200,000$250,000$300,000$350,000$400,0002012201320142015201620171Q 2018Residential One-to Four-Family Commercial Real Estate Home Equity Construction and Land Other + Deferred Fees RIGHT PLACE RIGHT TIME RIGHT BANK
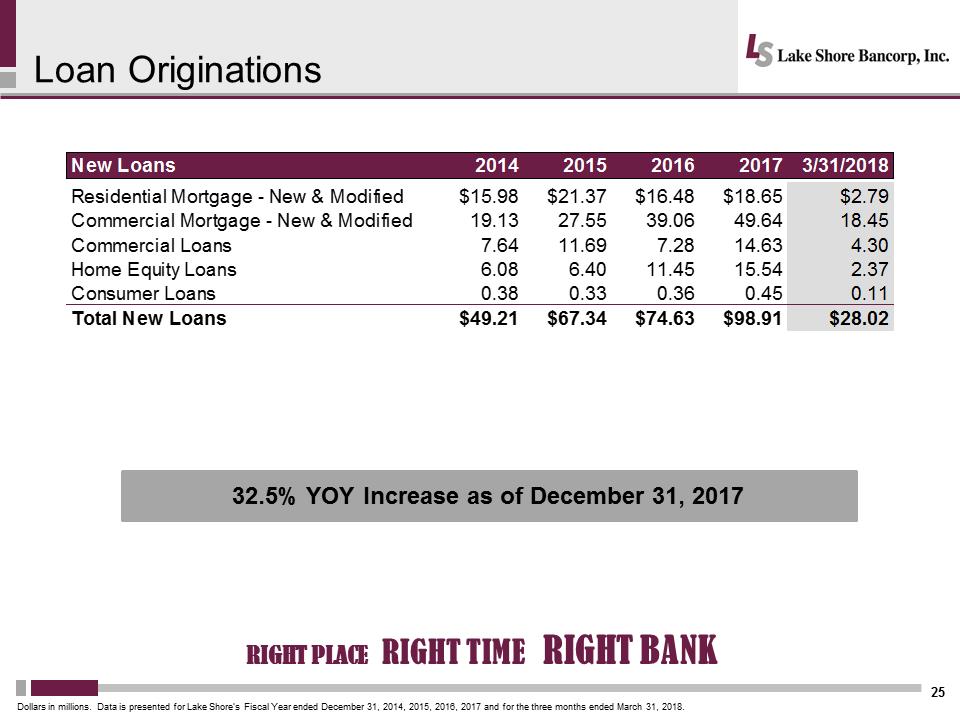 Loan Originations2532.5% YOY Increase as of December 31, 2017Dollars in millions. Data is presented for Lake Shore’s Fiscal Year ended December 31, 2014, 2015, 2016, 2017 and for the three months ended March 31, 2018.New Loans20142015201620173/31/2018Residential Mortgage - New & Modified$15.98$21.37$16.48$18.65$2.79Commercial Mortgage - New & Modified19.1327.5539.0649.6418.45Commercial Loans7.6411.697.2814.634.30Home Equity Loans6.086.4011.4515.542.37Consumer Loans0.380.330.360.450.11Total New Loans$49.21$67.34$74.63$98.91$28.02RIGHT PLACE RIGHT TIME RIGHT BANK
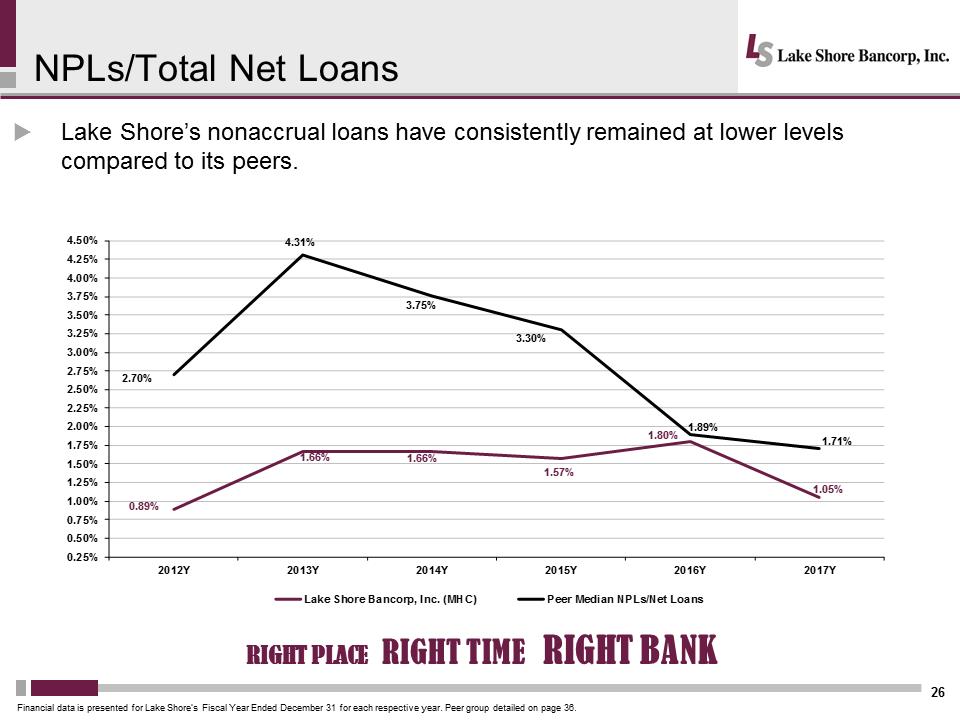 NPLs/Total Net Loans26.Lake Shore’s nonaccrual loans have consistently remained at lower levels compared to its peers. Financial data is presented for Lake Shore’s Fiscal Year Ended December 31 for each respective year. Peer group detailed on page36.0.89%1.66%1.66%1.57%1.80%1.05%2.70%4.31%3.75%3.30%1.89%1.71%0.25%0.50%0.75%1.00%1.25%1.50%1.75%2.00%2.25%2.50%2.75%3.00%3.25%3.50%3.75%4.00%4.25%4.50%2012Y2013Y2014Y2015Y2016Y2017YLake Shore Bancorp, Inc. (MHC)Peer Median NPLs/Net Loans RIGHT PLACE RIGHT TIME RIGHT BANK
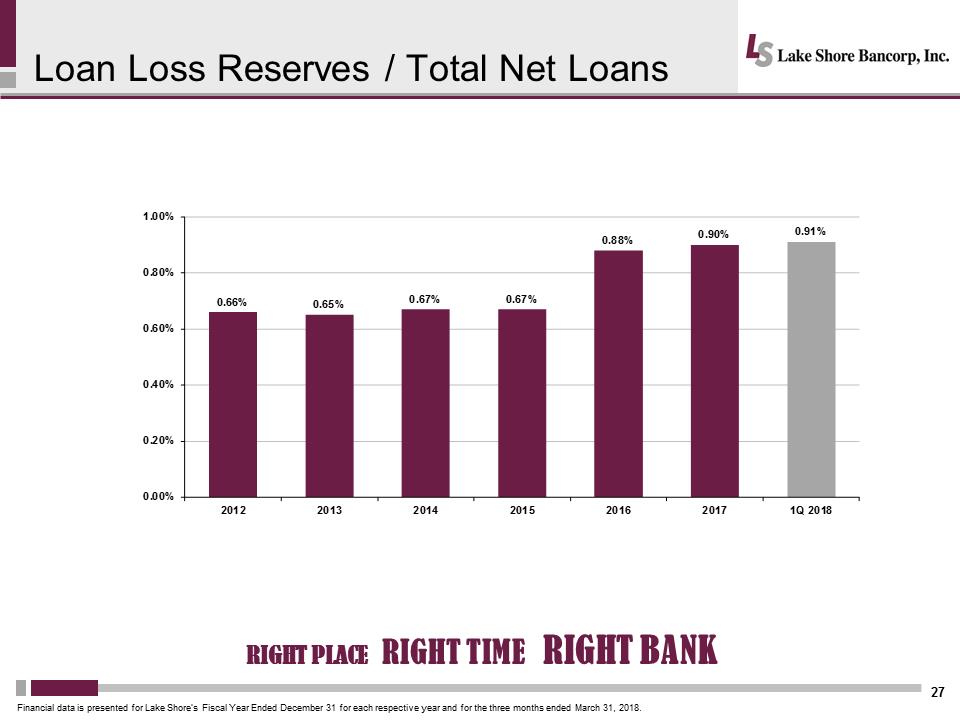 Loan Loss Reserves / Total Net Loans27Financial data is presented for Lake Shore’s Fiscal Year Ended December 31 for each respective year and for the three months ended March 31, 2018.0.66%0.65%0.67%0.67%0.88%0.90%0.91%0.00%0.20%0.40%0.60%0.80%1.00%2012201320142015201620171Q 2018RIGHT PLACE RIGHT TIME RIGHT BANK
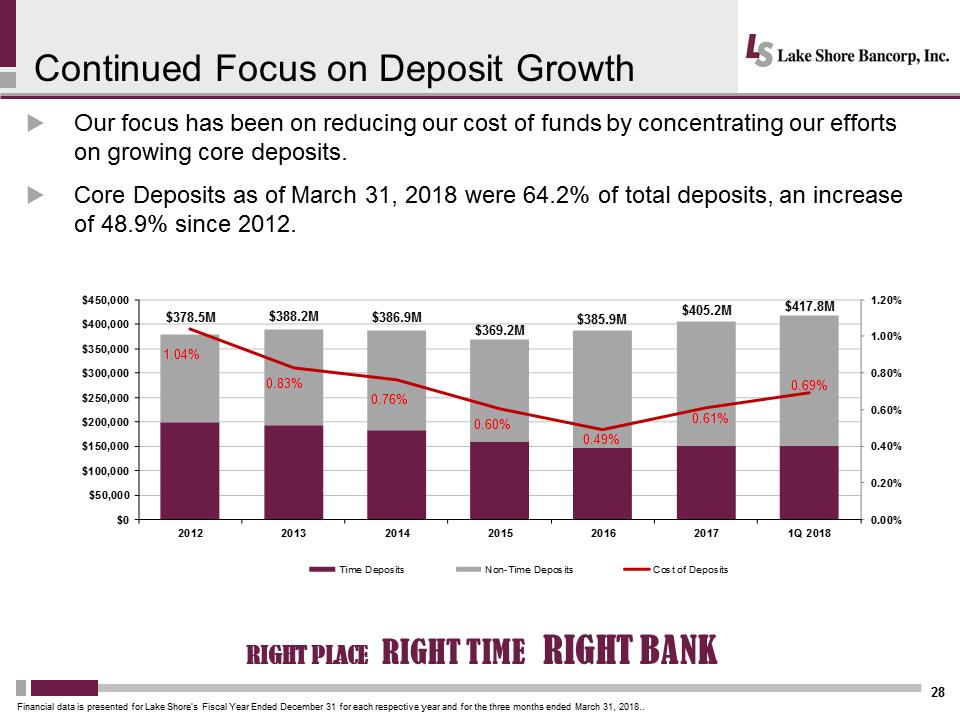 Continued Focus on Deposit Growth28.Our focus has been on reducing our cost of funds by concentrating our efforts on growing core deposits. Core Deposits as of March 31, 2018 were 64.2% of total deposits, an increase of 48.9% since 2012.Financial data is presented for Lake Shore’s Fiscal Year Ended December 31 for each respective year and for the three months ended March 31, 2018..$378.5M$388.2M$386.9M$369.2M$385.9M$405.2M$417.8M1.04%0.83%0.76%0.60%0.49%0.61%0.69%0.00%0.20%0.40%0.60%0.80%1.00%1.20%$0$50,000$100,000$150,000$200,000$250,000$300,000$350,000$400,000$450,0002012201320142015201620171Q 2018Time Deposits on-Time Deposits Cost of Deposits RIGHT PLACE RIGHT TIME RIGHT BANK
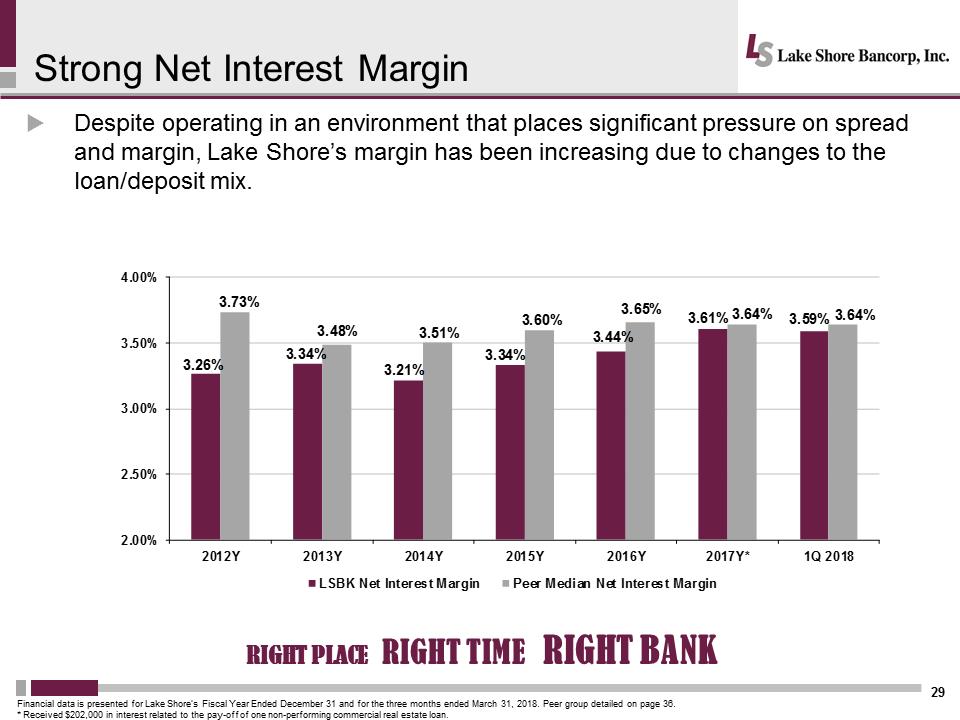 Strong Net Interest Margin29.Despite operating in an environment that places significant pressure on spread and margin, Lake Shore’s margin has been increasing due to changes to the loan/deposit mix. Financial data is presented for Lake Shore’s Fiscal Year Ended December 31 and for the three months ended March 31, 2018. Peer group detailed on page 36.* Received $202,000 in interest related to the pay-off of one non-performing commercial real estate loan.3.26%3.34%3.21%3.34%3.44%3.61%3.59%3.73%3.48%3.51%3.60%3.65%3.64%3.64%2.00%2.50%3.00%3.50%4.00%2012Y2013Y2014Y2015Y2016Y2017Y*1Q 2018LSBK Net Interest Margin Peer Median Net Interest Margin RIGHT PLACE RIGHT TIME RIGHT BANK
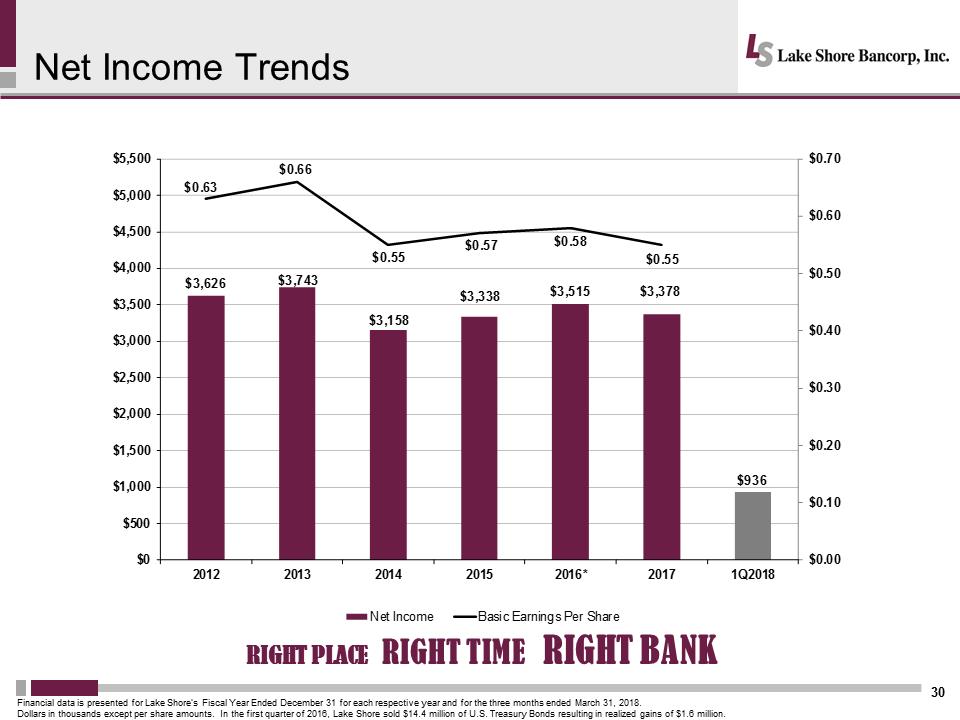 Net Income Trends30Financial data is presented for Lake Shore’s Fiscal Year Ended December 31 for each respective year and for the three months ended March 31, 2018.Dollars in thousands except per share amounts. In the first quarter of 2016, Lake Shore sold $14.4 million of U.S. Treasury Bonds resulting in realized gains of $1.6 million.$3,626$3,743$3,158$3,338$3,515$3,378$936$0.63$0.66$0.55$0.57$0.58$0.55$0.00$0.10$0.20$0.30$0.40$0.50$0.60$0.70$0$500$1,000$1,500$2,000$2,500$3,000$3,500$4,000$4,500$5,000$5,50020122013201420152016*20171Q2018Net Income Basic Earnings Per Share RIGHT PLACE RIGHT TIME RIGHT BANK
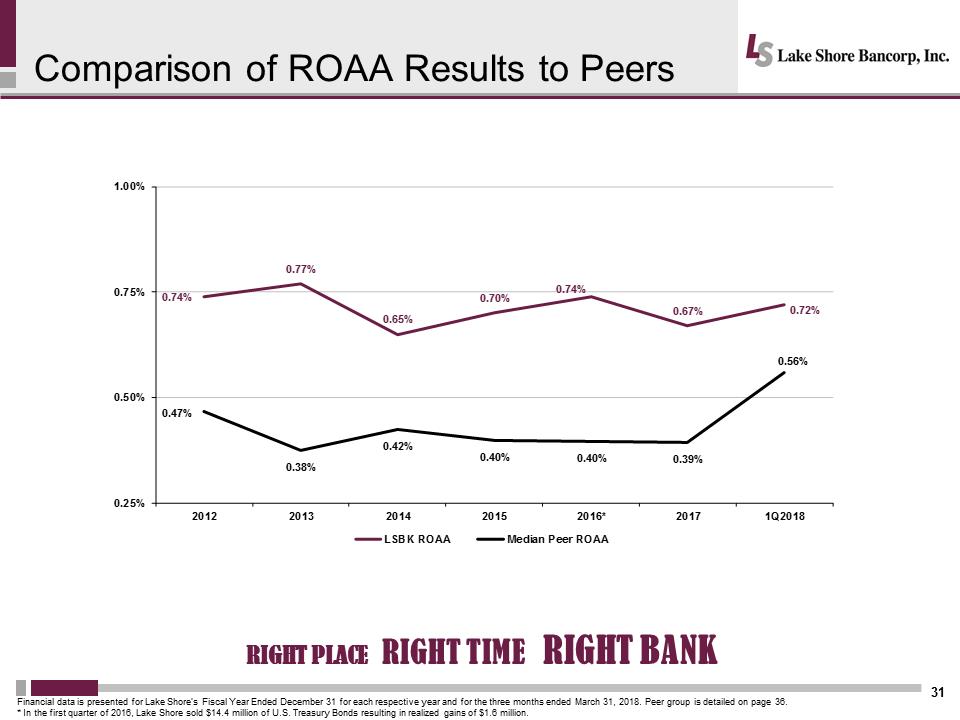 Comparison of ROAA Results to Peers31Financial data is presented for Lake Shore’s Fiscal Year Ended December 31 for each respective year and for the three months ended March 31, 2018. Peer group is detailed on page 36.* In the first quarter of 2016, Lake Shore sold $14.4 million of U.S. Treasury Bonds resulting in realized gains of $1.6 million.0.74%0.77%0.65%0.70%0.74%0.67%0.72%0.47%0.38%0.42%0.40%0.40%0.39%0.56%0.25%0.50%0.75%1.00%20122013201420152016*20171Q2018LSBK ROAAMedian Peer ROAARIGHT PLACE RIGHT TIME RIGHT BANK
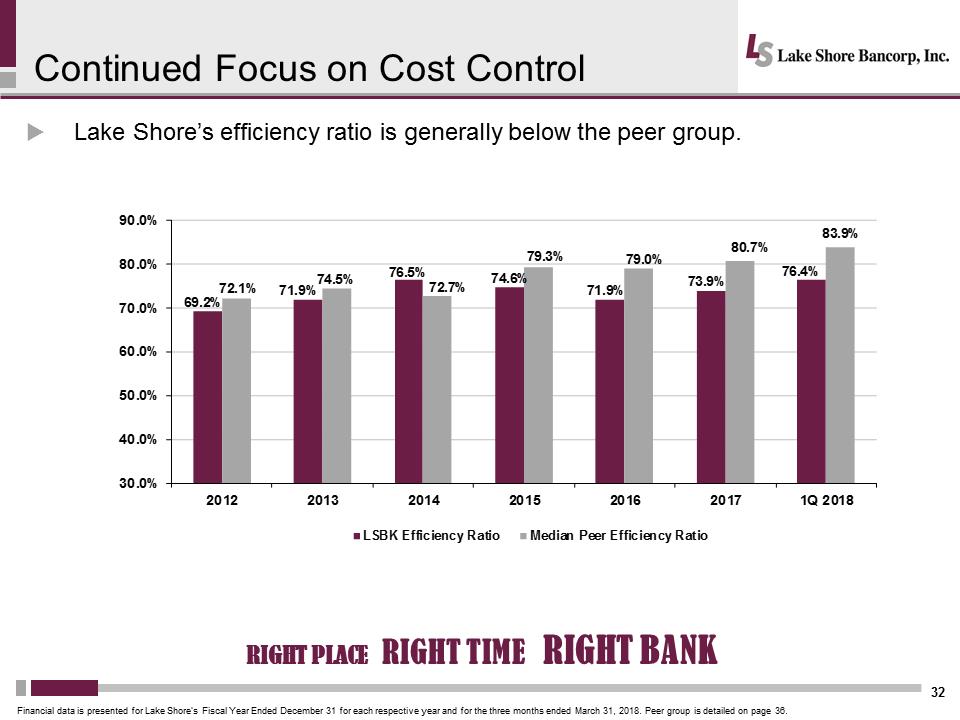 Continued Focus on Cost Control32.Lake Shore’s efficiency ratio is generally below the peer group. Financial data is presented for Lake Shore’s Fiscal Year Ended December 31 for each respective year and for the three months ended March 31, 2018. Peer group is detailed on page 36.69.2%71.9%76.5%74.6%71.9%73.9%76.4%72.1%74.5%72.7%79.3%79.0%80.7%83.9%30.0%40.0%50.0%60.0%70.0%80.0%90.0%2012201320142015201620171Q 2018LSBK Efficiency Ratio Median Peer Efficiency Ratio RIGHT PLACE RIGHT TIME RIGHT BANK
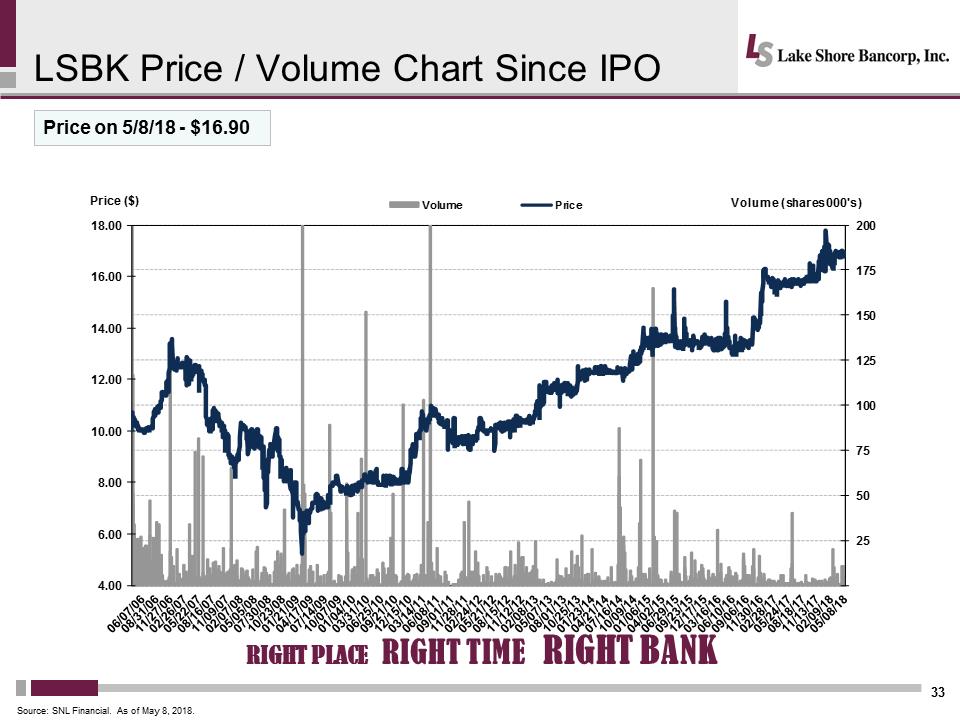 LSBK Price / Volume Chart Since IPO33Price on 5/8/18 -$16.90Source: SNL Financial. As of May 8, 2018.4.006.008.0010.0012.0014.0016.0018.00255075100125150175200Price ($) Volume (shares 000's) Volume Price RIGHT PLACE RIGHT TIME RIGHT BANK
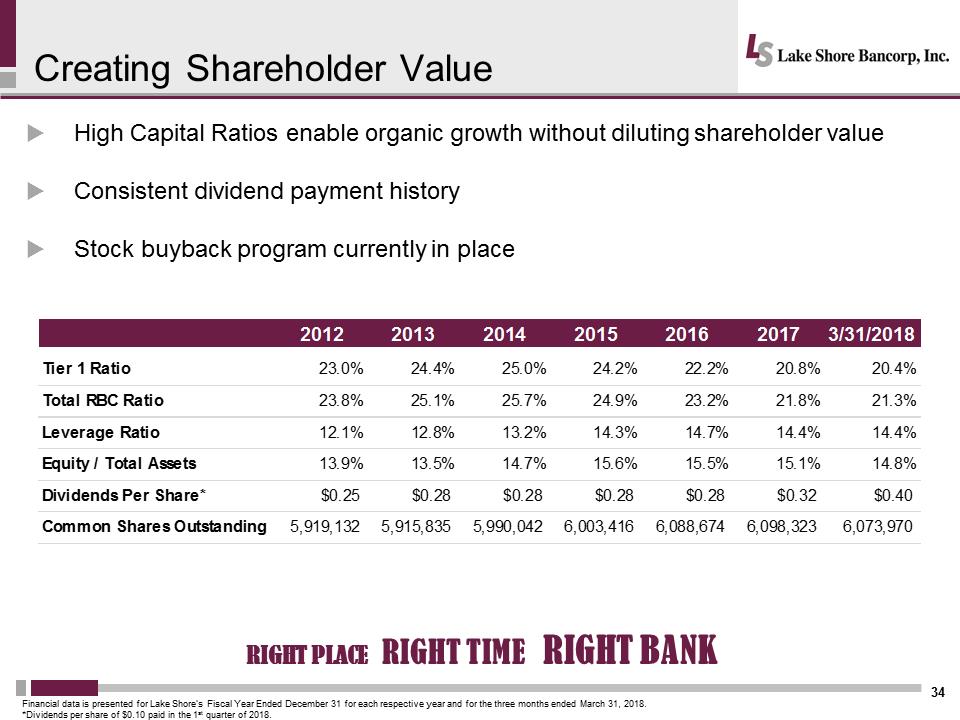 Creating Shareholder Value34.High Capital Ratios enable organic growth without diluting shareholder value. Consistent dividend payment history. Stock buyback program currently in place Financial data is presented for Lake Shore’s Fiscal Year Ended December 31 for each respective year and for the three months ended March 31, 2018.*Dividends per share of $0.10 paid in the 1stquarter of 2018.2012201320142015201620173/31/2018Tier 1 Ratio23.0%24.4%25.0%24.2%22.2%20.8%20.4%Total RBC Ratio23.8%25.1%25.7%24.9%23.2%21.8%21.3%Leverage Ratio12.1%12.8%13.2%14.3%14.7%14.4%14.4%Equity / Total Assets13.9%13.5%14.7%15.6%15.5%15.1%14.8%Dividends Per Share*$0.25$0.28$0.28$0.28$0.28$0.32$0.40Common Shares Outstanding5,919,1325,915,8355,990,0426,003,4166,088,6746,098,3236,073,970RIGHT PLACE RIGHT TIME RIGHT BANK
 QUESTIONS & ANSWERS
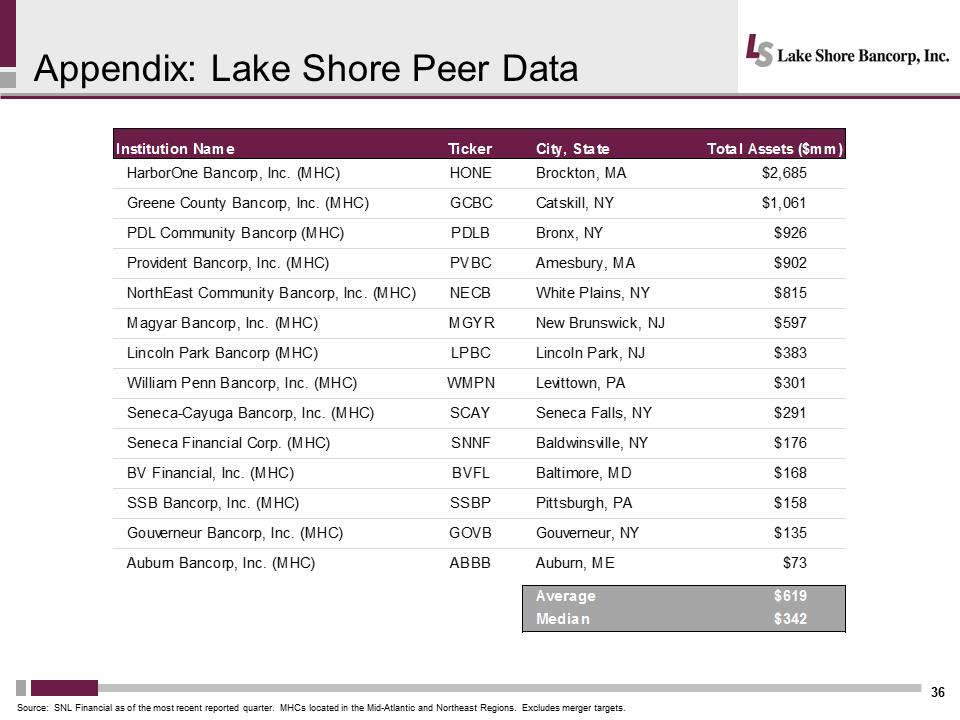 Appendix: Lake Shore Peer Data36Source: SNL Financial as of the most recent reported quarter. MHCs located in the Mid-Atlantic and Northeast Regions. Excludes merger targets. Institution Name Ticker City, State Total Assets ($mm)Harbor One Bancorp, Inc. (MHC)HONE Brockton, MA$2,685 Greene County Bancorp, Inc. (MHC)GCBC Catskill, NY$1,061PDL Community Bancorp (MHC)PDLB Bronx, NY$92 6Provident Bancorp, Inc. (MHC)PVBC Amesbury, MA$902NorthEast Community Bancorp, Inc. (MHC)NECB White Plains, NY$815 Magyar Bancorp, Inc. (MHC)MGYR New Brunswick, NJ$597Lincoln Park Bancorp (MHC)LPBC Lincoln Park, NJ$383 William Penn Bancorp, Inc. (MHC)WMPNL Levittown, PA$301Seneca-Cayuga Bancorp, Inc. (MHC)SCAY Seneca Falls, NY$291 Seneca Financial Corp. (MHC)SNNF Baldwinsville, NY$176BV Financial, Inc. (MHC)BVFL Baltimore, MD$168SSB Bancorp, Inc. (MHC)SSBP Pittsburgh, PA$158 Gouverneur Bancorp, Inc. (MHC)GOVB Gouverneur, NY$135 Auburn Bancorp, Inc. (MHC)ABBBA auburn, ME$73 Average$619Median$342
 .Call to Order. Introduction of Proposal to Elect Directors. Tabulation of Votes.AdjournmentLake Shore, MHC Annual Meeting of Members 37