Attached files
| file | filename |
|---|---|
| 8-K - 8-K - ASHFORD HOSPITALITY TRUST INC | ahtinvestorpresentation8-k.htm |

Annual Shareholder Meeting CEO Overview May 15, 2018

Forward Looking Statements and Non-GAAP Measures In keeping with the SEC's "Safe Harbor" guidelines, certain statements made during this presentation could be considered forward-looking and subject to certain risks and uncertainties that could cause results to differ materially from those projected. When we use the words "will likely result," "may," "anticipate," "estimate," "should," "expect," "believe," "intend," or similar expressions, we intend to identify forward-looking statements. Such forward-looking statements include, but are not limited to, our business and investment strategy, our understanding of our competition, current market trends and opportunities, projected operating results, and projected capital expenditures. These forward-looking statements are subject to known and unknown risks and uncertainties, which could cause actual results to differ materially from those anticipated including, without limitation: general volatility of the capital markets and the market price of our common stock; changes in our business or investment strategy; availability, terms and deployment of capital; availability of qualified personnel; changes in our industry and the market in which we operate, interest rates or the general economy, and the degree and nature of our competition. These and other risk factors are more fully discussed in the company's filings with the Securities and Exchange Commission. EBITDA is defined as net income before interest, taxes, depreciation and amortization. EBITDA yield is defined as trailing twelve month EBITDA divided by the purchase price or debt amount. A capitalization rate is determined by dividing the property's net operating income by the purchase price. Net operating income is the property's funds from operations minus a capital expense reserve of either 4% or 5% of gross revenues. Hotel EBITDA flow-through is the change in Hotel EBITDA divided by the change in total revenues. EBITDA, FFO, AFFO, CAD and other terms are non-GAAP measures, reconciliations of which have been provided in prior earnings releases and filings with the SEC or in the appendix to this presentation. This overview is for informational purposes only and is not an offer to sell, or a solicitation of an offer to buy or sell, any securities of Ashford Hospitality Trust, Inc. or any of its respective affiliates, and may not be relied upon in connection with the purchase or sale of any such security. 2

Portfolio Overview TOP TEN METRO AREAS(2),(3) TTM Q1 2018 % of 119 24,922 EBITDA Total Washington DC $43,566 9.4% San Fran/Oakland, CA $35,149 7.6% Hotels(1) Rooms(1) Los Angeles, CA $33,899 7.3% New York/New Jersey $31,304 6.7% DFW, TX $26,542 5.7% Boston, MA $25,753 5.5% Atlanta, GA $25,550 5.5% 31 $5.7B $124 Nashville, TN $23,876 5.1% Minn./St. Paul, MN $15,623 3.4% Miami, FL $13,031 (1) (1) (1),(2) 2.8% States Gross Assets RevPAR Other Areas $190,722 41.0% Total $465,015 100.0% PORTFOLIO BY HOTEL EBITDA(1) Brand Property Manager MSA Chain Scale IHG Independent Interstate Upper Independent Hyatt 2% 6% <1% Luxury Midscale 6% 4% 5% 3% Other 10% Marriott 31% Top 50 Upscale 16% 32% Hilton 30% Marriott Remington Top 25 58% 60% 74% Upper Upscale 54% Hilton 6% Hyatt 3% (1) As of March 31, 2018, net rooms, excludes Worldquest (2) TTM as of March 31, 2018 3 (3) Hotel EBITDA in thousands Note: the company recently sold SpringHill Suites Centreville, and Residence Inn Tampa

Portfolio Overview W Atlanta Downtown Marriott Beverly Hills Crowne Plaza La Concha Le Pavillon Atlanta, GA Beverly Hills, CA Key West, FL New Orleans, LA One Ocean Le Meridien Minneapolis W Minneapolis The Silversmith Jacksonville, FL Minneapolis, MN Minneapolis, MN Chicago, IL The Churchill Renaissance Nashville Hyatt Savannah Washington, D.C. Nashville, TN Savannah, GA Hyatt Coral Gables Coral Gables, FL 4

Financially Calibrated Sales Ashford Trust Hotel Sales 2015 - 2018 PROPERTIES SOLD SALES OF MAINLY SELECT-SERVICE PROPERTIES Hampton Inn Terre Haute Sales Proceeds Courtyard Marriott Village LBV $375 million SpringHill Suites Marriott Village LBV Fairfield Inn Marriott Village LBV REMOVAL OF LOWER REVPAR HOTELS Residence Inn Atlanta Buckhead TTM Avg. RevPAR Courtyard Edison $80 Hampton Inn & Suites Gainesville SpringHill Suites Gaithersburg TRANSACTIONS AT FAVORABLE CAP RATES Residence Inn Palm Desert TTM Avg. Cap Rate Courtyard Palm Desert 8.1% Renaissance Portsmouth All-in Basis Cap Rate(1) 6.9% Embassy Suites Syracuse Crowne Plaza Atlanta Ravinia SpringHill Suites Richmond Glen Allen SpringHill Suites Centreville Residence Inn Tampa (1) Based on expected capex to be invested by the buyer 5

Disciplined Capital Management Capitalize upon cyclical changes and advantageous pricing situations COMMON SHARE BUYBACKS $1,400 73.6M 50% $3.28 Of Outstanding Average Financial Crisis Shares $1,200 Shares Buyback $200 RECENT PREFERRED EQUITY ACTIVITY $1,000 2016 2017 $800 $400 9.0% 7.4% 8.5% 7.5% Old Coupon New Coupon Old Coupon New Coupon $600 $18 (In millions $) millions (In $400 $116 $218 $574 $73 $200 $65 $305 $10 $11 $76 $112 $52 $275 $218 $230 $170 $45 $147 $68 $97 $81 $72 $90 $89 $112 $0 $17 2003 2004 2005 2006 2007 2008 2009 2010 2011 2012 2013 2014 2015 2016 2017 Common Raises Common Buybacks Preferred Raises Preferred Buybacks / Redemptions 6

Value Enhancement through Refinancing BOSTON BACK BAY –OCT 2017 17-PACK –OCT 2017 8-HOTEL PORTFOLIO –JAN 2018 4.38% L+2.00% 5.52% L+3.00% L+5.52% L+2.92% Old Interest Rate New Interest Rate Old Interest Rate New Interest Rate Old Interest Rate New Interest Rate ~$2.8 million in annual debt service ~$9.8 million in annual debt service ~$6.8 million in annual debt service savings over prior loan terms savings over prior loan terms savings over prior loan terms 22-PACK –APR 2018 W Atlanta Downtown Atlanta, GA L+4.39% L+3.20% Old Interest Rate New Interest Rate ~$11.0 million in annual debt service savings over prior loan terms STRATEGIC RATIONALE Extend maturity Greater flexibility Interest expense savings 7

Cash Position FINANCIAL CRISIS CURRENT CYCLE Positioned to buy back approximately 50% of Ample flexibility to execute opportunistic growth outstanding common shares for about $240 and maintain hedge against an economic millions leading to outsized total shareholder downturn returns FINANCIAL CRISIS CURRENT CYCLE $1,400 80% 75% $1,200 70% 60% $1,000 47% 50% 37% $800 40% 40% 28% $600 (In millions $) millions (In 28% 28% 30% 25% 25% 25% 22% $400 20% 9% 10% 9% $200 10% $0 0% 2005 2006 2007 2008 2009 2010 2011 2012 2013 2014 2015 2016 2017 2018 Q1 (2) Avg Cash(1) Avg Equity Market Cap Cash / Equity Market Cap (1) Based on public filings; adjusted for unconsolidated Highland JV from 2011 - 2014 (2) Source: Bloomberg 8

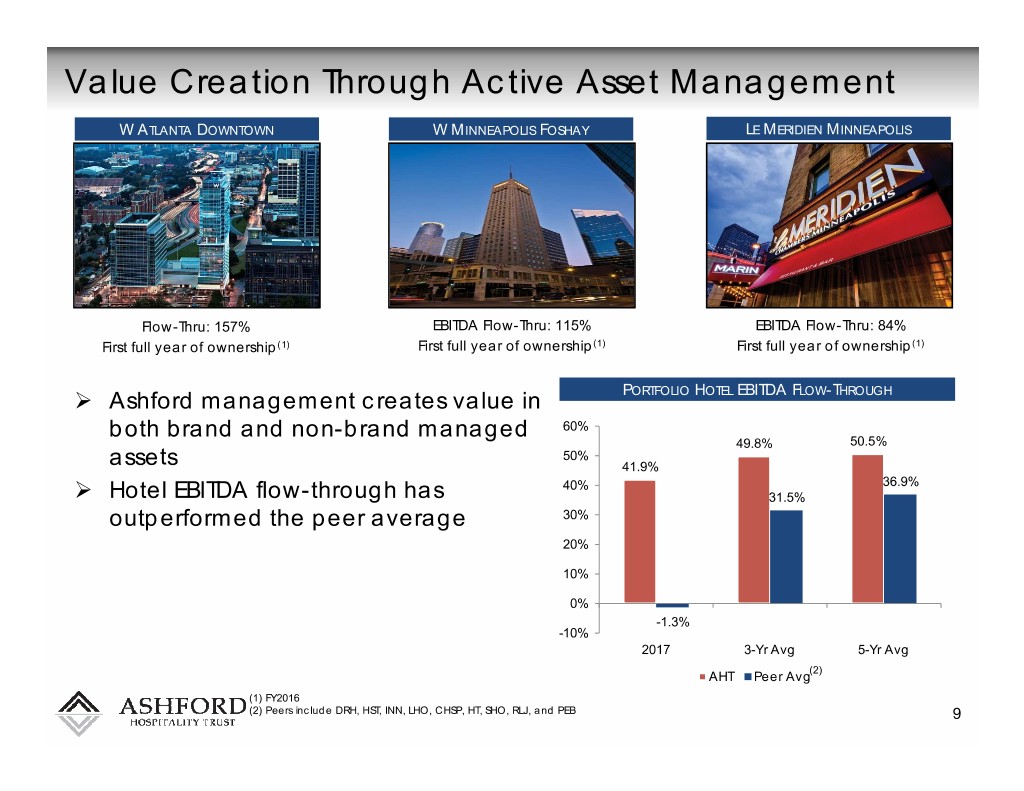
Value Creation Through Active Asset Management W ATLANTA DOWNTOWN W MINNEAPOLIS FOSHAY LE MERIDIEN MINNEAPOLIS Flow-Thru: 157% EBITDA Flow-Thru: 115% EBITDA Flow-Thru: 84% First full year of ownership(1) First full year of ownership(1) First full year of ownership(1) Ashford management creates value in PORTFOLIO HOTEL EBITDA FLOW-THROUGH both brand and non-brand managed 60% 49.8% 50.5% 50% assets 41.9% 40% 36.9% Hotel EBITDA flow-through has 31.5% outperformed the peer average 30% 20% 10% 0% -1.3% -10% 2017 3-Yr Avg 5-Yr Avg (2) AHT Peer Avg (1) FY2016 (2) Peers include DRH, HST, INN, LHO, CHSP, HT, SHO, RLJ, and PEB 9

Capital Expenditures Approximately $222 million of CAPEX spent in 2017 Improve portfolio quality Improve competitive position Gain market share 10

Attractive Dividend Yield Highest dividend yield in the industry(1) 8.5% 7.5% 7.0% 6.9% 6.7% 6.5% 6.4% 6.2% 6.1% 6.0% 6.0% 5.6% 5.4% 5.5% 5.3% 5.0% 5.0% 4.5% 4.5% 4.3% 4.1% 3.5% AHT CLDT APLE RLJ BHR LHO PK(2) HT REIT(3) CHSP XHR SHO INN(2) DRH PEB HST Avg Source: Company filings and market data (1) As of April 30, 2018 11 (2) Annualized based on most recent dividend announcement (3) Includes: BHR, APLE, CLDT, PK, LHO, CHSP, HT, RLJ, XHR, DRH, PEB, HST, INN, SHO

Stock Performance Total Shareholder Return 2017 YTD 2018 TTM MAY 2018 30.0% 10.0% 10.0% 24.6% 8.1% 25.0% 5.0% 3.8% 20.0% 5.6% 16.4% 15.0% 0.0% 5.0% 10.0% -5.0% 5.0% -6.7% 0.0% -10.0% 0.0% 1 Year as of 5/11/18 2017 YTD as of 5/11/18 *Peers include: CHSP, CLDT, DRH, HST, HT, INN, LHO, RLJ, & SHO 12

Annual Shareholder Meeting CEO Overview May 15, 2018
