Attached files
| file | filename |
|---|---|
| 8-K - 8-K INVESTOR RELATIONS SLIDE PRESENTATION - ZIONS BANCORPORATION, NATIONAL ASSOCIATION /UT/ | a8-kcoverpage.htm |

Second Quarter 2018 Financial Update May 2018

Forward-Looking Statements; Use of Non-GAAP Financial Measures Forward Looking Information This presentation includes forward-looking statements within the meaning of Section 21E of the Securities Exchange Act of 1934, as amended, or the Exchange Act. Statements in this presentation that are based on other than historical information or that express Zions Bancorporation’s expectations regarding future events or determinations are forward-looking within the meaning of the Private Securities Litigation Reform Act of 1995. Forward-looking statements reflect, among other things, our current expectations, all of which are subject to known and unknown risks, uncertainties and other factors that may cause our actual results, performance or achievements, market trends, industry results or regulatory outcomes to differ materially from those expressed or implied by such forward-looking statements. Without limiting the foregoing, the words “anticipates,” “believes,” “can,” “continue,” “could,” “estimates,” “expects,” “intends,” “may,” “might,” “plans,” “projects,” “should,” “would,” “targets,” “will” and the negative thereof and similar words and expressions are intended to identify forward-looking statements. Forward-looking statements by their nature address matters that are, to different degrees, uncertain, such as statements about future financial and operating results, the potential timing or consummation of the proposed transaction described in the presentation and receipt of regulatory approvals or determinations, or the anticipated benefits thereof, including, without limitation, future financial and operating results. Actual results and outcomes may differ materially from those presented, either expressed or implied, in the presentation. Important risk factors that may cause such material differences include, but are not limited to, the rate of change of interest sensitive assets and liabilities relative to changes in benchmark interest rates; growth rates of revenue or expense; risks and uncertainties related to the ability to obtain shareholder and regulatory approvals or determinations for various matters, including the proposed merger of the holding company with and into the operating bank, or the possibility that such approvals or determinations may be delayed; the imposition by regulators of conditions or requirements that are not favorable to Zions; the ability of Zions Bancorporation to achieve anticipated benefits from the consolidation and regulatory determinations; and legislative, regulatory and economic developments that may diminish or eliminate the anticipated benefits of the consolidation. These risks, as well as other factors, are discussed in Zions Bancorporation’s most recent Annual Report on Form 10-K and Quarterly Report on Form 10-Q, filed with the Securities and Exchange Commission (SEC) and available at the SEC’s Internet site (http://www.sec.gov), and other risks associated with the proposed transaction will be more fully discussed in the proxy statement that will be filed with the Securities and Exchange Commission in connection with the proposed transaction. Use of Non-GAAP Financial Measures: This document contains several references to non-GAAP measures, including pre-provision net revenue and the “efficiency ratio,” which are common industry terms used by investors and financial services analysts. Certain of these non-GAAP measures are key inputs into Zions’ management compensation and are used in Zions’ strategic goals that have been and may continue to be articulated to investors. Therefore, the use of such non-GAAP measures are believed by management to be of substantial interest to the consumers of these financial disclosures and are used prominently throughout the disclosures. A full reconciliation of the difference between such measures and GAAP financials is provided within the document, and users of this document are encouraged to carefully review this reconciliation. 2

Agenda Company Introduction Capital and Liquidity Profile Risk Management & Credit Quality: A Decade of Enhancements Technology Initiatives “Simple, Easy, Fast” Initiative (announced June 2015) 2018-2019 Objectives Review of Recent Financial Results (1Q18) Financial Outlook 3

The Big Picture: Zions Is A Collection of Community Banks Local decision-making and top-notch service separates Zions from peers Strategic local “ownership” of Avg Bank Headquarters Deposits % of Total market opportunities and Zions Bank Salt Lake City $16B 31% challenges Amegy Houston $11B 22% CB&T San Diego $11B 22% Superior local customer access to NB│AZ Phoenix $5B 9% bank decision makers relative to big NSB Las Vegas $4B 8% national banks Vectra Denver $3B 5% Commerce Seattle $1B 2% Footprint (by deposit market share) Zions Bancorporation Salt Lake City $52B 100% Nominal GDP Footprint Growth Comparison is located in high growth markets weighted based on deposits 5% 4% 3% 2% 1% 0% RF STI KEY FRC ASB BBT CFG SNV FHN FITB MTB CMA ZION PBCT CBSH BOKF HBAN EWBC Source: SNL Financial/S&P Global, BEA.gov, Zions’ calculations, using simple average of trailing 10 years (2007- 4 2016) of annual GDP growth by state multiplied by the percent of deposits in each state. Dollars of deposits do not sum due to rounding.

Zions Receives National and Local Recognition for Excellence Bank Brand, Trust, Management • Only three other banks have consistently received as many Greenwich Excellence Awards as Zions since 2009 • 16 Greenwich Excellence Awards (2017) for middle-market and small business banking • Averaged 16 Excellence Awards annually for the past nine years (since inception) • Recognized with middle market awards in Overall Client Satisfaction and Cash Management Overall Satisfaction every year since 2009 • Received distinction in virtually every Cash Management category (9 of 11) • Top team of women bankers (2015, 2016, 2017) – American Banker 1 • California Bank & Trust consistently voted Best Bank in San Diego and Orange Counties 2 • National Bank of Arizona consistently voted #1 Bank in Arizona 3 • Nevada State Bank voted #1 Bank in Nevada 4 5 1 americanbanker.com/news/women-in-banking-top-teams-2017-zions-Bancorp; 2 The San Diego Union-Tribune (annually 5 1. One of five winning teams, 2015, Zions Bank; 2. exim.gov, April 24, 2014; 3.Readers of the San Diego Union-Tribune, #1 from 2011-2017) and Orange County Register (annually #1 from 2014-2017); 3 Fifteen annual occurrences, Ranking August 2015, for 5 years; Orange County Register, for two years in a row; 4.Ranking Arizona, 2015 Arizona Magazine; 4 Las Vegas Review-Journal, Reno Magazine, Elko Daily Free Press

Loan Profile: Zions is a Leader in Small Business Lending Zions punches above its weight Commercial Loans sized $100k - $1M Commercial Loans sized $100k - $1M ($ billion) as a percent of total commercial loans $30 20% 18% $25 16% 14% $20 12% $15 10% 8% $10 6% 4% $5 2% $0 0% C C RF RF UB UB STI STI KEY KEY BBT BBT USB USB BAC BAC PNC JPM JPM PNC FITB FITB MTB WFC MTB WFC CMA CMA ZION ZION HBAN HBAN Note: Call report data via SNL Financial/S&P Global, as of 4Q17; peer group shown different than typical peer 6 group in order to show the position of the largest U.S. banks

Capital Profile: Operating From a Position of Strength Capital ratios are strong relative to peers Common Equity Tier 1 Capital Ratio Tier 1 Risk-Based Capital Ratio Peer Median 10.5% (-16 bps from 1Q17) 14% 14% 13% 13% 12% 12% 11% 11% 10% 10% 9% 9% 8% 8% RF RF STI STI KEY KEY FRC FRC BBT ASB ASB BBT CFG CFG SNV SNV FITB FITB MTB WBS MTB WBS CMA CMA ZION ZION PBCT PBCT CBSH CBSH BOKF BOKF WTFC WTFC HBAN HBAN EWBC EWBC Note: Regulatory capital ratios are Basel III. 7 Source: SNL Financial/S&P Global, data as of 1Q18, except CBSH last reported as of 4Q17.

Liquidity and Deposit Profile: “Some of our greatest assets are our very small liabilities” Solid liquidity profile as measured by healthy loan-to-deposit ratio and above peer noninterest bearing deposits as a percentage of total deposits Noninterest-Bearing Deposits / Loans/Deposits Total Deposits 100% 50% 95% 45% 90% 40% 85% 35% 80% 30% 25% 75% 20% 70% 15% 65% 10% 60% 5% 55% 0% 50% RF 2007 2008 2009 2010 2011 2012 2013 2014 2015 2016 2017 STI KEY FRC ASB BBT CFG SNV FHN FITB MTB WBS CMA ZION PBCT CBSH BOKF WTFC HBAN EWBC ZION Peer Top Quartile Peer Bottom Quartile Note: Regulatory capital ratios are Basel III. 8 Source: SNL Financial/S&P Global, ZION data as of 1Q18; peers as of 4Q17.

Decade-Long Risk Profile Improvement Since the recession, Zions has addressed the following: Concern Mitigation Negative/Low Improved ROA to levels approximately in line with peers Profitability Improved Efficiency Ratio to 62.3% (2017), consistent with commitment to “low 60s” for 2017 Energy Losses and Improved visibility via stability in NPAs, criticized and NCOs Cloudy Credit Outlook Improved position via stronger commodity prices and a very strong reserve More Recent More “Seasoning” of New Chief Risk Officer and Chief Credit Officer in place for several years Risk Management Risk Management best practices have permeated the culture for several years Infrastructure Regulatory CCAR No qualitative fails in the CCAR process, ever Pass/Fail Compliance Received non-objection to request to increase common payout to ~100% Improved liquidity (shed CDOs and construction loans) On-Balance Reduced loan to deposit ratio from more than 100% (pro forma for the Lockhart off-balance sheet Sheet Liquidity vehicle) to the mid-80s percent range Reduced risk through simplified business model and structure, charter consolidation Improved mortgage, retail loan and business banking loan processes Simplify Processes Strengthened management information capabilities with enhanced management information systems (e.g. dashboards); Core Transformation ~1/3 complete Board Five new board members since 2014 Engagement Robust banking and risk management experience Low Capital Doubled CET1 ratio Reduced credit losses by more than 90% High Loan Losses Individual loan underwriting not the issue: enhanced concentration risk management High Concentration Reduced total concentration in CRE to 1.8x CET1 from 4.5x in 2007 Older in CRE, C&D & CDOs Constr. & Land Dev. reduced to just 0.3x CET1 from 2.7x in 2007; Eliminated CDO exposure. 9

Strong Risk Management Infrastructure Substantial improvement in practices and policies that should lead to superior through-the- cycle performance Risk Matrix: dollar limits on different industries for lending and investments Strong concentration risk management Strong oversight of areas that are growing faster than expected levels, or of “hot spots” resulting in detailed white papers and reporting to the risk committee of the Board Prevented fast growth in energy loans in 2013-2014 Prevented strong CRE growth in Houston and California Prevented strong leverage lending growth Supply/demand outlook for CRE, by major MSA Strong subject matter experts in CRE / Consumer / C&I Reputable third party consultant engaged semi-annually Leveraged enhancement to stress testing loan loss models Active data governance program Training program for lenders and credit officers 10

Portfolio Probability of Default (PD) Grades The weighted average PD grade on loans has come down significantly since 2012 Weighted Average PD Grade (Portfolio Balances) Rating Scale 9 PD Grade S&P Equivalent 1 AAA / AA / AA- 8 2 A+ / A- 3 BBB+ 4 BBB 7 5 BBB- 6 BB+ C&I CRE 7 BB 6 8 BB- 9 B+ 10 B 5 11 B- 12 CCC+ / CCC / CCC- / CC 13 C 14 D 4 1Q12 2Q12 3Q12 4Q12 1Q13 2Q13 3Q13 4Q13 1Q14 2Q14 3Q14 4Q14 1Q15 2Q15 3Q15 4Q15 1Q16 2Q16 3Q16 4Q16 1Q17 2Q17 3Q17 4Q17 Note: PD grades weighted by loan balances. 11

Risk Identification & Escalation Zions established comprehensive risk identification Like other SIFIs, Zions developed and implemented a Risk Identification process. This process assists Zions in prioritizing risks into Level 1 and Level 2 categories Examples of Level 1 risks include Credit, Liquidity, Interest Rate Zions has identified and actively monitors more than 60 key risks Cyber risk elevated to Level 1 risk Establishing a governance office to Oversee sales practice Improve consistency of testing and reporting Have established a sound regulatory interactions approach 12

Credit Quality Through-the cycle losses better than most peers; current ratios reflect oil and gas exposure Last 4 Quarter Average Last 12 Months (NPAs + 90DPD) / (Loans + OREO) NCOs / Avg Loans 2.00% 2.00% Note: approximately 2/5 of LTM average NPAs are from energy loans 1.50% 1.50% Note: approximately one Non-energy third of Zions’ LTM NCOs Energy have been from energy loans 1.00% 1.00% 0.50% 0.50% 0.00% 0.00% RF RF STI STI KEY KEY FRC FRC ASB BBT ASB BBT CFG CFG SNV SNV FHN FHN FITB FITB MTB MTB WBS WBS CMA CMA ZION ZION PBCT PBCT CBSH CBSH BOKF BOKF WTFC WTFC HBAN HBAN EWBC EWBC 2.00% Average Annual NCOs / Loans 1990 - 2017 1.50% 1.00% 0.50% 0.00% FRC PBCT BOKF MTB WTFC CBSH EWBC ASB ZION WBS CMA BBT CFG STI RF HBAN FITB KEY FHN SNV Source: SNL Financial/S&P Global, data as of 1Q18. 13 Note: Survivorship bias: some banks that may have been included in Zions’ peer group have been excluded due to their failed or merged status.
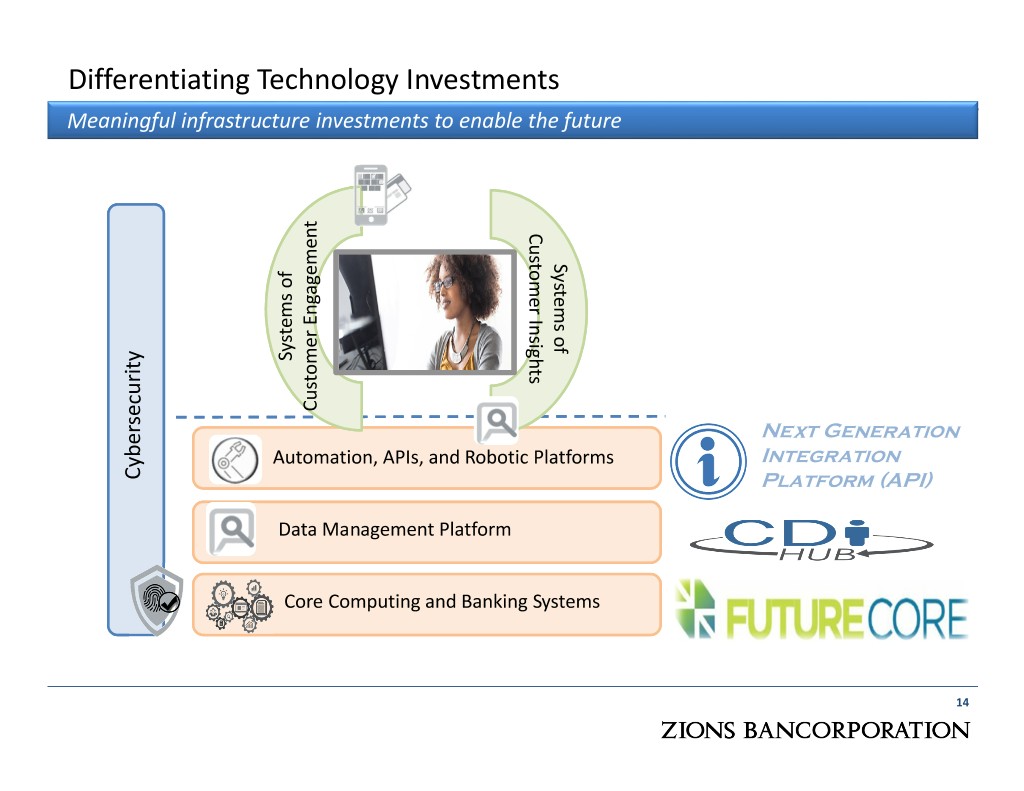
Differentiating Technology Investments Meaningful infrastructure investments to enable the future CustomerInsights Systems of Systems of Systems Customer Engagement Customer Next Generation Automation, APIs, and Robotic Platforms Integration Cybersecurity Platform (API) Data Management Platform Core Computing andCore Banking Computing Systems 14
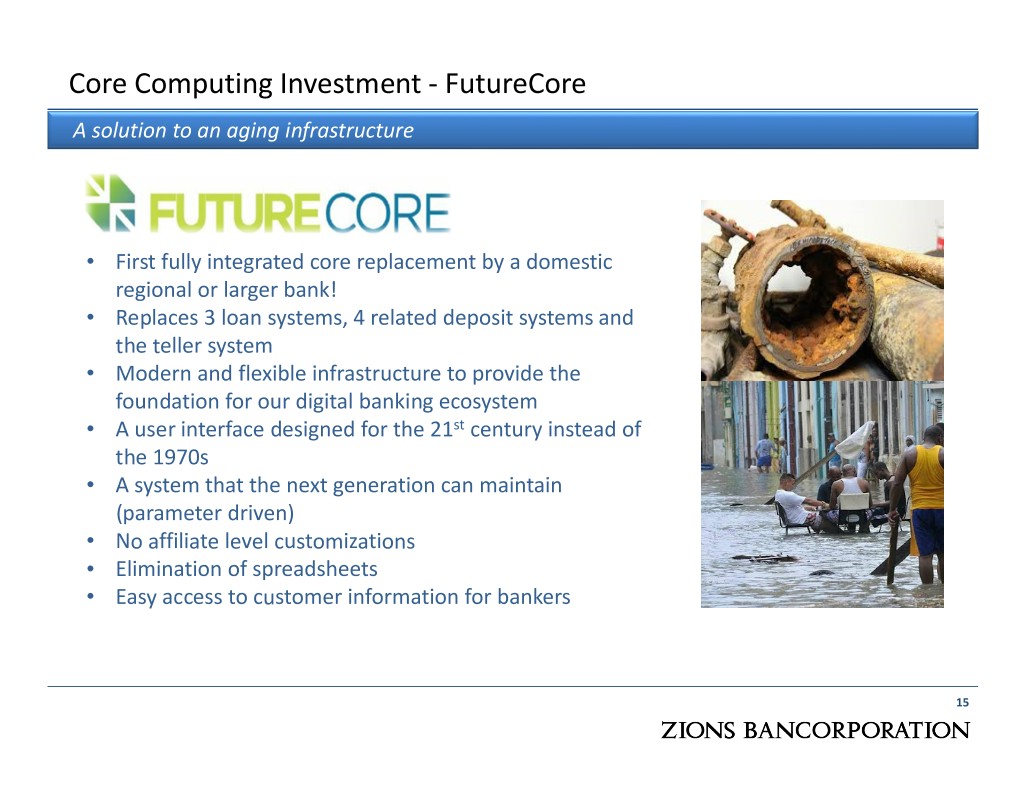
Core Computing Investment - FutureCore A solution to an aging infrastructure • First fully integrated core replacement by a domestic regional or larger bank! • Replaces 3 loan systems, 4 related deposit systems and the teller system • Modern and flexible infrastructure to provide the foundation for our digital banking ecosystem • A user interface designed for the 21 st century instead of the 1970s • A system that the next generation can maintain (parameter driven) • No affiliate level customizations • Elimination of spreadsheets • Easy access to customer information for bankers 15

Differentiating Technology Investments While addressing the foundation, we also are investing in the customer experience 2016-2017 Delivery 2018+ Delivery Customer Upgraded Retail Centric Website Online and Mobile Refresh Banking Platform End to End Third Party Account Payable Connections (API Automation Platform) Fast! Online Deposit Digital Experience Account Opening Platform eDocs for Deposit Product Life of Improved P2P Online Credit Simplification Account through Zelle Card Prequal and App Flexible Merchant Upgraded Treasury PopMoney Mobile Processing Positive Pay Internet Banking Platform 16

Deliver a “Simple, Easy, Fast" Experience for Customers and Employees Simplify, Strengthen, Improve Simplify the business Strengthen management model and structure information capabilities and Proposed holding company usage elimination Data governance Charter consolidation Business intelligence Enterprise retail banking, General ledger project mortgage, international, FutureCore foreign exchange, wealth management Credit LEAD Greater visibility for our 17 Simple, Easy, Fast Enterprise loan operations and product groups middle office Town Hall Meetings and Listening Sessions: CEO and President Improve the banking experience “SWAT” Sessions Credit process simplification Direct employee feedback Employee ambassador banking benefits Employee Survey Mortgage Retail Loan Center Business Banking Loan Center Deposit product simplification Customer Care Center 17
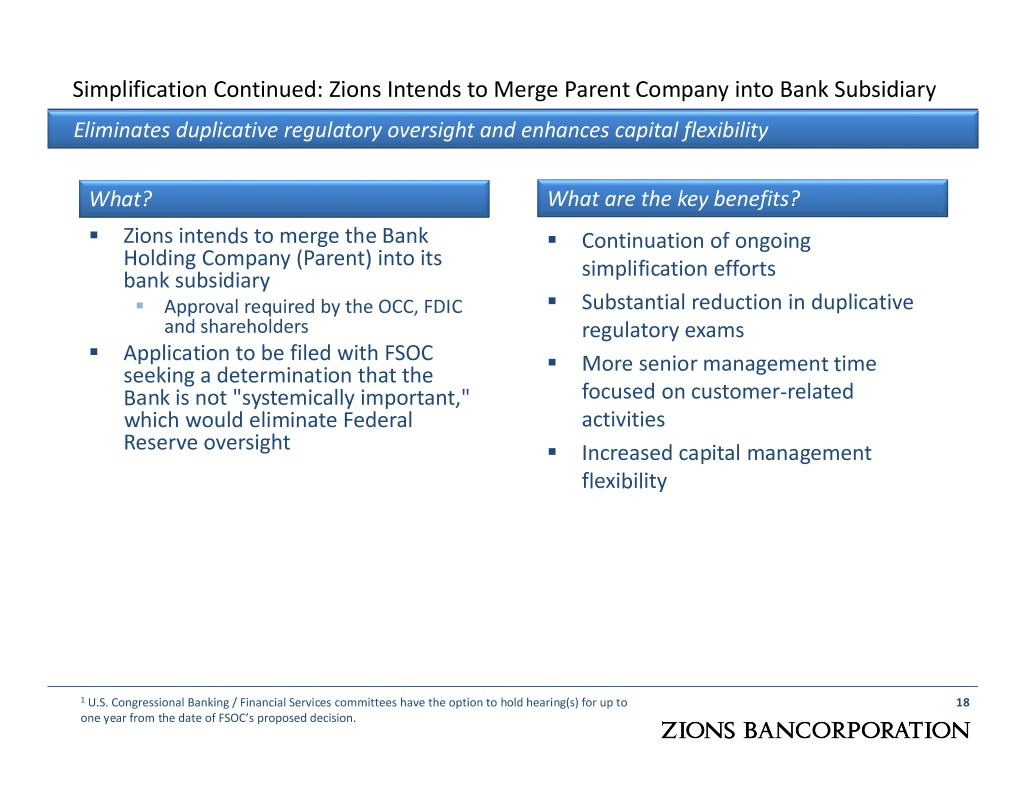
Simplification Continued: Zions Intends to Merge Parent Company into Bank Subsidiary Eliminates duplicative regulatory oversight and enhances capital flexibility What? What are the key benefits? Zions intends to merge the Bank Continuation of ongoing Holding Company (Parent) into its simplification efforts bank subsidiary Approval required by the OCC, FDIC Substantial reduction in duplicative and shareholders regulatory exams Application to be filed with FSOC More senior management time seeking a determination that the Bank is not "systemically important," focused on customer-related which would eliminate Federal activities Reserve oversight Increased capital management flexibility 1 U.S. Congressional Banking / Financial Services committees have the option to hold hearing(s) for up to 18 one year from the date of FSOC’s proposed decision.

Results of Simple, Easy, Fast: Revenue and Noninterest Expense Zions’ revenue growth improved from a trend slower than that of peers to in line with peer growth, while noninterest expense growth has been well below peers Indexed Net Revenue Indexed Noninterest Expense 140 140 130 130 120 120 110 110 100 100 90 90 4Q14 1Q15 2Q15 3Q15 4Q15 1Q16 2Q16 3Q16 4Q16 1Q17 2Q17 3Q17 4Q17 1Q18 4Q14 1Q15 2Q15 3Q15 4Q15 1Q16 2Q16 3Q16 4Q16 1Q17 2Q17 3Q17 4Q17 1Q18 ZION Peer bottom quartile Peer best quartile ZION Peer bottom quartile Peer best quartile Source: SNL Financial/S&P Global. Data adjusted to account for major acquisitions. Zions results adjusted in 1Q18 and 2Q17 to exclude 19 $11 million and $16 million, respectively, of interest income from loan recoveries on four loans and in 4Q17 for a charitable foundation contribution of $12 million. Results also adjusted for items such as severance, provision for unfunded lending commitments, securities gains and losses and debt extinguishment costs.

Results of Simple, Easy, Fast: Pre-Provision Net Revenue Zions’ PPNR growth has been above the best quartile of its peer group Indexed Adjusted Pre-Provision Net Revenue 210 180 150 120 90 4Q14 1Q15 2Q15 3Q15 4Q15 1Q16 2Q16 3Q16 4Q16 1Q17 2Q17 3Q17 4Q17 1Q18 ZION Peer bottom quartile Peer best quartile Source: SNL Financial/S&P Global. Data adjusted to account for major acquisitions. Zions results adjusted in 1Q18 and 2Q17 to exclude 20 $11 million and $16 million, respectively, of interest income from loan recoveries on four discrete loans, and in 4Q17 for a charitable foundation contribution of $12 million. Results also adjusted for items such as severance, provision for unfunded lending commitments, securities gains and losses and debt extinguishment costs.

Results of Simple, Easy, Fast: Efficiency Ratio Zions improved from an adverse outlier to within the peer group Efficiency Ratio 75 70 65 60 55 50 4Q14 1Q15 2Q15 3Q15 4Q15 1Q16 2Q16 3Q16 4Q16 1Q17 2Q17 3Q17 4Q17 1Q18 ZION Peer best quartile Peer bottom quartile Source: SNL Financial/S&P Global. Data adjusted to account for major acquisitions. Zions results adjusted in 1Q18 and 2Q17 to exclude $11 21 million and $16 million, respectively, of interest income from loan recoveries on four loans, and in 4Q17 for a charitable foundation contribution of $12 million. Results also adjusted for items such as severance, provision for unfunded lending commitments, securities gains and losses and debt extinguishment costs.
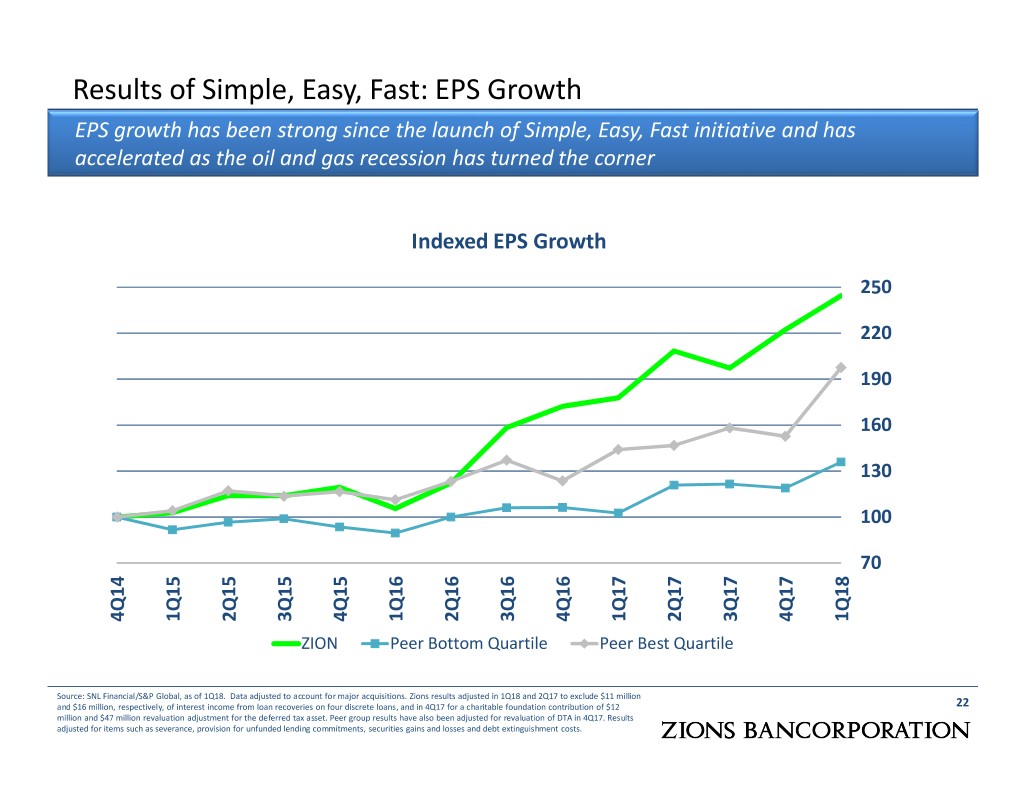
Results of Simple, Easy, Fast: EPS Growth EPS growth has been strong since the launch of Simple, Easy, Fast initiative and has accelerated as the oil and gas recession has turned the corner Indexed EPS Growth 250 220 190 160 130 100 70 4Q14 1Q15 2Q15 3Q15 4Q15 1Q16 2Q16 3Q16 4Q16 1Q17 2Q17 3Q17 4Q17 1Q18 ZION Peer Bottom Quartile Peer Best Quartile Source: SNL Financial/S&P Global, as of 1Q18. Data adjusted to account for major acquisitions. Zions results adjusted in 1Q18 and 2Q17 to exclude $11 million and $16 million, respectively, of interest income from loan recoveries on four discrete loans, and in 4Q17 for a charitable foundation contribution of $12 22 million and $47 million revaluation adjustment for the deferred tax asset. Peer group results have also been adjusted for revaluation of DTA in 4Q17. Results adjusted for items such as severance, provision for unfunded lending commitments, securities gains and losses and debt extinguishment costs.

2018-2019 Objectives: Growth through simplification and focus Demonstrate positive operating leverage: Broad based loan growth with major loan portfolio concentrations within acceptable limits Momentum from noninterest income growth initiatives Slightly increasing noninterest expense growth, primarily driven by revenue growth and digital delivery Greater sales volumes and revenue growth through enhanced use of data Target high single digit annual percentage growth rate for pre-provision net revenue (1) Demonstrate reduced volatility in financial performance than previously experienced Implement technology upgrade and digital strategies, automation and simplification of front, middle and back office processes Increase the Return on and of Capital Maintain top quartile credit risk profile and superior risk management posture leading to increasing returns of capital Execute on our Community Bank Model – doing business on a “Local” basis (1) Excludes the $12 million charitable contribution from 4Q17 23

Next 12-Month Financial Outlook (1Q19E, vs. 1Q18A) Outlook Comments Loan Balances Moderately Increasing • Moderately Excludes the effects of future interest rate hikes. Contemplates Net Interest Income continued increases in loans, a moderate increase in funding costs Increasing and considers the effect of $11M of interest recoveries in 1Q18 Loan Loss Provision Modest • Expect quarterly loan loss provisions to be modest Customer-Related Slightly • Remains a key focus for the Company Fees Increasing • Customer-related fees excludes securities gains, dividends Adjusted Noninterest Slightly • FY18 adjusted NIE expected to increase slightly (low single digit rate Expense Increasing of growth) relative to FY17 • (1) Stable Excluding stock-based compensation , the effective tax rate for FY18 Tax Rate is expected to be between 24% and 25% Preferred Dividends • Expect preferred dividend to be $34 million in FY18 • Diluted shares may experience some volatility due to the effect of & Diluted Shares outstanding warrants and the average price of ZION shares (1) ASU 2016-09 went into effect January 1, 2017 and now requires the difference between income tax 24 accounting and U.S. GAAP accounting for stock compensation to be recognized in the income statement instead of a direct adjustment to equity.

Appendix Company Abbreviation Key Risk Management Enhancements: Hold-Limit Grid and Concentration Risk Examples Commercial Loan and Deposit Profile 1Q18 Financial Results Key Performance Indicators and Results Credit Quality Net Interest Income: Net Interest Margin Components and Interest Rate Sensitivity Noninterest Expense Efficiency Ratio Improvement Retail Loan Summary GAAP to Non-GAAP Reconciliation 25

Company Abbreviation (Ticker Symbol) Key ASB: Associated Banc-Corp JPM: JPMorgan Chase & Co. BAC: Bank of America KEY: KeyCorp BBT: BB&T Corporation MTB: M&T Bank Corporation BOKF: BOK Financial Corporation PBCT: People’s United Financial, Inc. C: Citigroup, Inc. PNC: PNC Financial Services Group CBSH: Commerce Bancshares, Inc. RF: Regions Financial Corporation CFG: Citizens Financial Group, Inc. SNV: Synovus Financial Corp. CMA: Comerica Incorporated STI: SunTrust Banks, Inc. EWBC: East West Bancorp, Inc. UB: Union Bank FHN: First Horizon National Corporation USB: US Bank FITB: Fifth Third Bancorp WBS: Webster Financial FRC: First Republic Bank WFC: Wells Fargo & Co. HBAN: Huntington Bancshares Incorporated WTFC: Wintrust Financial Corp. ZION: Zions Bancorporation GREEN TEXT: Included in Zions’ 2018 peer group as listed in BLUE TEXT: Not included in Zions’ 2018 peer group as listed in the annual proxy statement; this group is used by Zions’ the annual proxy statement, but may be particularly relevant board in determining management compensation to the topic discussed within these slides 26

Risk Management Emphasis / Accomplishments Development of risk management infrastructure includes the following: Further refinements in: Risk Appetite Framework 1st Line of Defense Accountability for risk management with executive management committee performance Implementation of “White Paper” process: Leverage lending Oil & Gas Main CRE asset classes completed Risk ratings used to inform portfolio risk limits/obligor hold limits, to aid portfolio concentration analysis and to influence underwriting criteria MULTI PROJECT/PSOR HOLD LIMITS CRE - SINGLE PROJECT HOLD LIMITS C&I - SINGLE PSOR HOLD LIMITS PD Asset Class Risk Rating Asset Class Risk Rating Asset Class Risk Rating Grade I II III IV I II III IV I II III IV 1 ### ### ### ### ### ### ### ### ### 2 ### ### ### ### ### ### ### ### ### 3 ### ### ### ### ### ### ### ### ### 4 ### ### ### ### ### ### ### ### ### 5 ### ### ###*Use ### ### ###*Use ### ### ### *Use 6 ### ### ###Caution ### ### ###Caution ### ### ### Caution 7 ### ### ### ### ### ### ### ### ### 8 ### ### ### ### ### ### ### ### ### 9 ### ### ### ### ### ### ### ### ### 10 ### ### ### ### ### ### ### ### ### 27

Concentration Risk Management Altered Composition of Loan Portfolio Reduced risk stemming from high volatility CRE (Land A&D) and Oil and Gas Total Commitments as % of Risk-based Capital Changes in portfolio composition from 4Q07 1200% to 4Q17: 1000% Land A&D commitments decreased from 72% 800% to 4% RBC Construction decreased from 145% to 52% 600% % of RBC of % RBC 400% Mortgage increased from 67% to 86% RBC 200% Municipal increased from 4% to 19% RBC 0% Oil & gas down from 2013 peak of 61% to 16% of total RBC Construction Land A&D Term Oil & Gas Municipal General C&I Owner Occupied Mortgage Other C&I Commitments as % of Risk-based Capital CRE Commitments as % of Risk-based Capital 600% 350% 500% 300% 400% 250% 300% 200% % of RBC of % 150% 200% RBC of % 100% 100% 50% 0% 0% Oil & Gas Municipal General C&I Owner Occupied Construction Land A&D Term Oil & Gas uses NAICS “Mining & Oil & Gas Extraction” 28
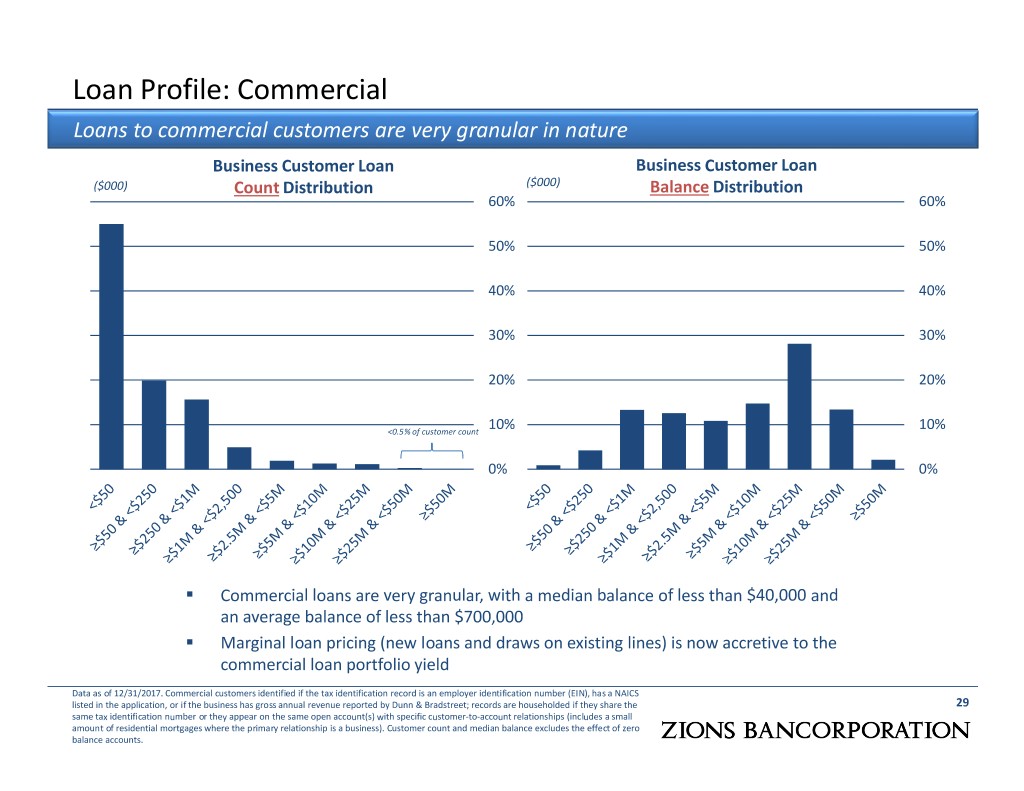
Loan Profile: Commercial Loans to commercial customers are very granular in nature Business Customer Loan Business Customer Loan ($000) Count Distribution ($000) Balance Distribution 60% 60% 50% 50% 40% 40% 30% 30% 20% 20% <0.5% of customer count 10% 10% 0% 0% Commercial loans are very granular, with a median balance of less than $40,000 and an average balance of less than $700,000 Marginal loan pricing (new loans and draws on existing lines) is now accretive to the commercial loan portfolio yield Data as of 12/31/2017. Commercial customers identified if the tax identification record is an employer identification number (EIN), has a NAICS listed in the application, or if the business has gross annual revenue reported by Dunn & Bradstreet; records are householded if they share the 29 same tax identification number or they appear on the same open account(s) with specific customer-to-account relationships (includes a small amount of residential mortgages where the primary relationship is a business). Customer count and median balance excludes the effect of zero balance accounts.

Deposit Profile: Commercial Deposits of commercial customers are granular and have a median balance of less than $20,000 and an average balance of less than $200,000 Commercial Customer Deposit Commercial Customer Deposit Count Distribution Balance Distribution ($000) ($000) 60% 60% 50% 50% 40% 40% 30% 30% 20% 20% 10% 10% <0.5% of customer count 0% 0% Data as of 12/31/2017. Commercial customers identified if the tax identification record is an employer identification number (EIN), has a NAICS listed in the application, or if the business has gross annual revenue reported by Dunn & Bradstreet; records are householded if they 30 share the same tax identification number or they appear on the same open account(s) with specific customer-to-account relationships. Customer count and median balance excludes the effect of zero balance accounts; trusts and/or estates excluded.
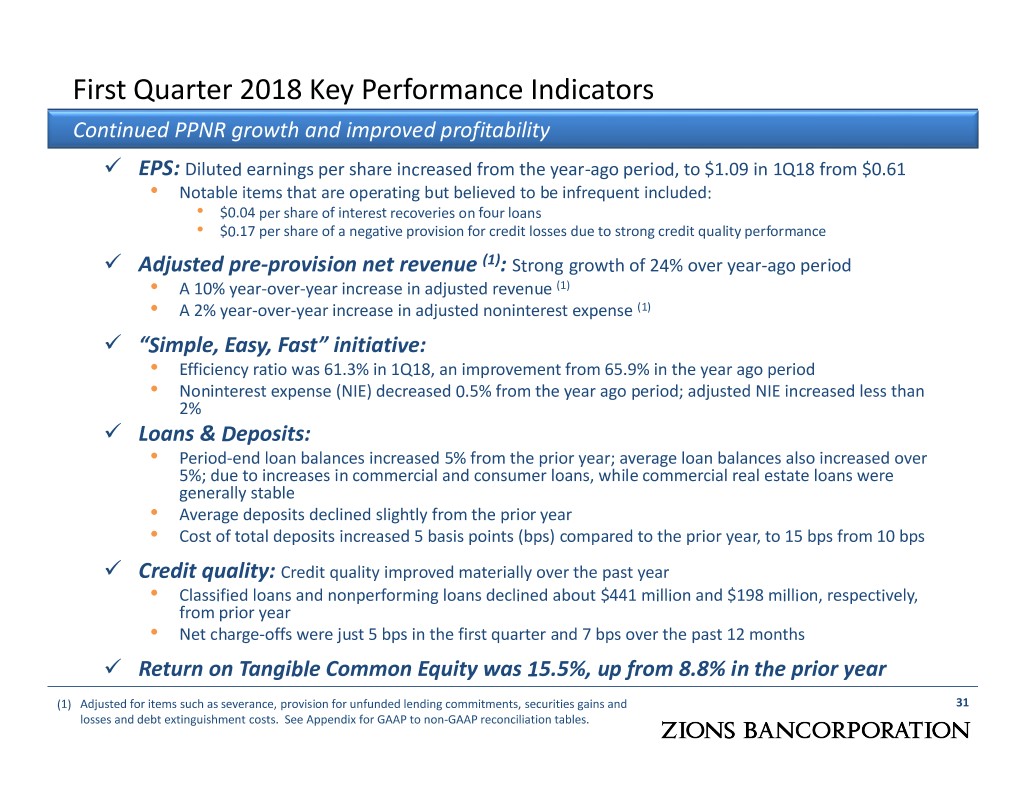
First Quarter 2018 Key Performance Indicators Continued PPNR growth and improved profitability EPS: Diluted earnings per share increased from the year-ago period, to $1.09 in 1Q18 from $0.61 • Notable items that are operating but believed to be infrequent included: • $0.04 per share of interest recoveries on four loans • $0.17 per share of a negative provision for credit losses due to strong credit quality performance Adjusted pre-provision net revenue (1) : Strong growth of 24% over year-ago period • A 10% year-over-year increase in adjusted revenue (1) • A 2% year-over-year increase in adjusted noninterest expense (1) “Simple, Easy, Fast” initiative: • Efficiency ratio was 61.3% in 1Q18, an improvement from 65.9% in the year ago period • Noninterest expense (NIE) decreased 0.5% from the year ago period; adjusted NIE increased less than 2% Loans & Deposits: • Period-end loan balances increased 5% from the prior year; average loan balances also increased over 5%; due to increases in commercial and consumer loans, while commercial real estate loans were generally stable • Average deposits declined slightly from the prior year • Cost of total deposits increased 5 basis points (bps) compared to the prior year, to 15 bps from 10 bps Credit quality: Credit quality improved materially over the past year • Classified loans and nonperforming loans declined about $441 million and $198 million, respectively, from prior year • Net charge-offs were just 5 bps in the first quarter and 7 bps over the past 12 months Return on Tangible Common Equity was 15.5%, up from 8.8% in the prior year (1) Adjusted for items such as severance, provision for unfunded lending commitments, securities gains and 31 losses and debt extinguishment costs. See Appendix for GAAP to non-GAAP reconciliation tables.

Credit Quality Healthy and improving credit quality metrics Key Credit Metrics: Credit Quality Ratios Classified loans were about 2% of loans 4.0% Down 10% from prior quarter Down 30% from the prior year 3.5% NPAs were 0.9% of loans 3.0% Down 6% from prior quarter Down 33% from the prior year 2.5% Annualized NCOs were 0.05% of average loans for the quarter 2.0% Allowance for credit losses remains 1.5% strong at 116 basis points of total loans 1.0% and leases 1.3x coverage of NPAs up from 1.0x 0.5% coverage a year ago 0.5x of classified loans compared to 0.0% 4Q14 4Q15 4Q16 1Q17 2Q17 3Q17 4Q17 1Q18 0.4x a year ago Strong coverage of annualized NCOs NCOs / Loans (ann.) Classified / Loans NPAs / Loans Note: Net Charge-offs/Loans ratio is annualized for all periods shown 32

Net Interest Income Growth due primarily to loan growth, securities growth and wider net interest margin Net interest income increased 11% Net Interest Income ($mm) over the year-ago period, to $542 million, up 8.6% over the prior year $550 (1) period when excluding the interest (1) recoveries on four loans $525 Majority of the increase attributable to $500 increases in: Interest and fees on loans due to loan $475 growth in commercial and consumer loans Short-term benchmark interest rates $450 Interest on securities from an increase in the average investment $425 securities portfolio Interest revenue increases were $400 1Q17 2Q17 3Q17 4Q17 1Q18 partially offset by higher interest expense on borrowed funds and deposits (1) 1Q18 and 2Q17 results included $11 million and $16 million, respectively, of interest recovery income 33 related to four discrete loans in each period

Net Interest Income Drivers: Yields and Costs Growth of net interest income reflects a benefit on assets from higher short-term interest rates with only a moderate increase in funding costs Net Interest Margin (NIM) 5.0% Relative to the prior quarter, the Loan Yield 4.5% NIM increased 11 bps to 3.56% 3.52% 4.0% Interest recoveries on loans in 1Q18 were 3.38% 3.45% 3.45% 3.56% $11 million, or approximately seven basis 3.5% Net Interest Margin points of NIM 3.0% Securities Yield Yield on loans increased 21 bps to 4.51% 2.5% Interest recoveries on loans in 1Q18 were 2.0% $11 million, or approximately 9 basis points of loan yield 1.5% Cash Yield 1.0% Yield on securities increased 11 bps to 2.25%, largely due to reduced prepay Cost of Funds 0.5% speeds 0.0% 1Q17 2Q17 3Q17 4Q17 1Q18 Cost of deposits increased two bps to 15 bps Average Earning Asset Mix Cost of funds (the cost of total deposits Cash 2% and borrowed funds) increased eight bps Earning asset mix relatively Securities similar to the year ago period 26% Loans 72% 34

Interest Rate Sensitivity and Historical Deposit Beta Zions has partially reduced asset sensitivity in exchange for current income Net Interest Income Sensitivity 2004-2006 and 2015-2017 Rate Cycles Modeled Annual Change in a 6.0 +200bps Interest Rate Environment (1) ZION Cost of Total Deposits ∆ in NII 6% Peer Median Cost of Total Deposits 5.0 FF Target Rate Assumed Beta of 36% Total Deposits 4.0 Percent Short Term Resets Percent Hedges Net 3.0 or Maturities of (swaps, Percentage of (loans only) Loans floors) Portfolio (2) 2.0 Prime and 1M 47% -3% 44% Libor 2-3M Libor 4% -- 4% 2004-2006 1.0 4-12M Libor 4% -- 4% 2015-2017 0.0 Other Lns <12 10% 1% 11% months 0 QTR 1 QTR 2 QTR 3 QTR 4 QTR 5 QTR 6 QTR 7 QTR 8 QTR 9 QTR QTR 10 QTR 11 QTR 12 QTR Longer-term Resets • Zions and the peer median experienced a cumulative 44% and 46% deposit or Maturities beta during 2004-5 rising interest rate period, respectively, although for the 1-5 years 25% -- 25% first 200 bps the beta for Zions and Peers was 19% and 24%, respectively • Cumulative rate hike cycle beta includes one full year for deposit costs to catch 5+ years 10% -- 10% up to the changes in the benchmark rates. Chart begins one quarter preceding the first increase in Fed Funds rate for each cycle. Source: Company filings and SNL Financial. (1) This 12-month simulated impact using a static-sized balance sheet and a parallel shift in the yield curve, does not contemplate changes in fee income that is amortized in interest income (e.g. premiums, discounts, origination points and costs) and is based on statistical analysis relating pricing and deposit migration to benchmark rates (e.g. LIBOR, U.S. Treasuries). 35 (2) Net percentage column sums to less than 100% due primarily to 2% of total loans that have interest rate floors which are in the money (floor rate > index+spread rate); these $722 million of loan balances with floors have a weighted average “in the money” amount of 44 basis points. After giving effect to potential future rate hikes, loans with floors would no longer be subject to the floors and would begin to reset with the relevant indices and therefore the 98% total at March 31, 2018 would increase to/towards 100%. Because the dates at which the floors would no longer be in effect are not certain (subject to future Federal Reserve monetary policy decisions), the timing of such cannot be reflected in the chart.
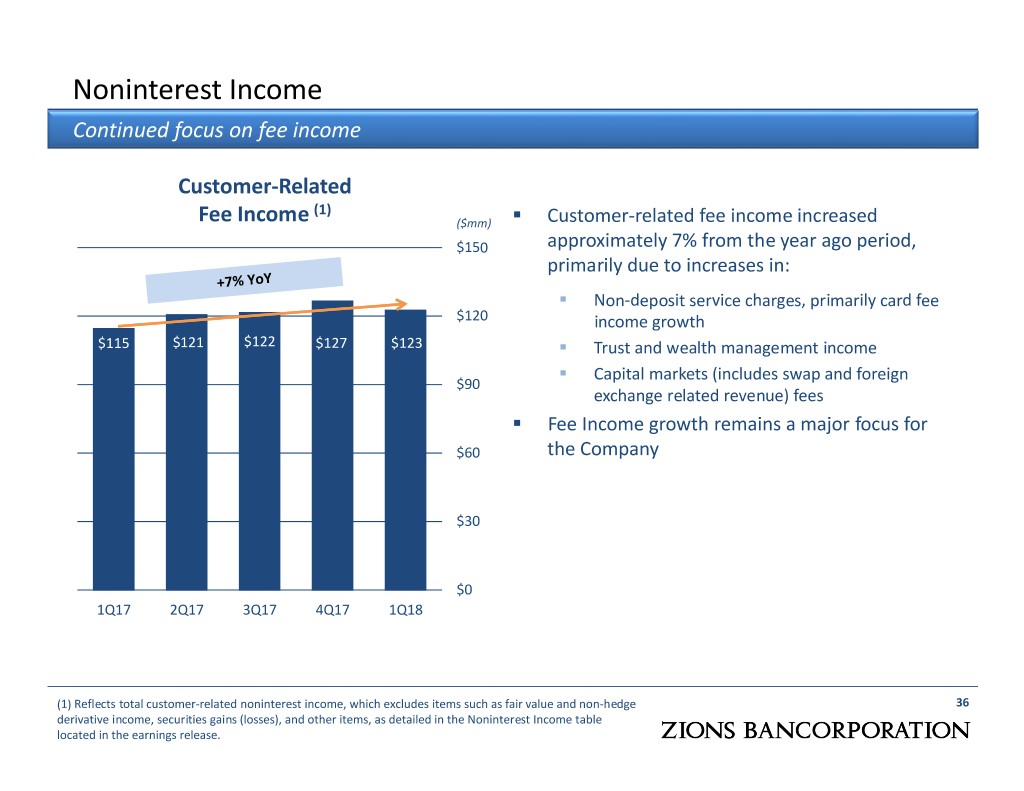
Noninterest Income Continued focus on fee income Customer-Related (1) Fee Income ($mm) Customer-related fee income increased $150 approximately 7% from the year ago period, primarily due to increases in: Non-deposit service charges, primarily card fee $120 income growth $115 $121 $122 $127 $123 Trust and wealth management income Capital markets (includes swap and foreign $90 exchange related revenue) fees Fee Income growth remains a major focus for $60 the Company $30 $0 1Q17 2Q17 3Q17 4Q17 1Q18 (1) Reflects total customer-related noninterest income, which excludes items such as fair value and non-hedge 36 derivative income, securities gains (losses), and other items, as detailed in the Noninterest Income table located in the earnings release.

Noninterest Expense Zions’ noninterest expense growth has been well below peers Indexed Noninterest Expense 140 130 120 110 100 90 4Q14 1Q15 2Q15 3Q15 4Q15 1Q16 2Q16 3Q16 4Q16 1Q17 2Q17 3Q17 4Q17 1Q18 ZION Peer bottom quartile Peer best quartile Source: SNL Financial/S&P Global. Data adjusted to account for major acquisitions. Zions results adjusted to exclude a charitable 37 foundation contribution of $12 million in 4Q17. Results also adjusted for items such as severance, provision for unfunded lending commitments, securities gains and losses and debt extinguishment costs.

Efficiency Ratio Substantial improvement driven by both revenue growth and expense control Efficiency Ratio (1) 75% The efficiency ratio in the 1Q18 was 61.3%, declining 4.6 percentage points 74.1% from 65.9% in the year-ago period and 12.8 percentage points from 4Q14 70% Adjusting for the interest income 69.6% recoveries on four large loans in 1Q18, the efficiency ratio was 62.2% Committed to continuous improvement 65.9% 65% to the efficiency ratio, moderating from 64.5% the trailing three year pace 62.3% 61.6% 61.3% 60% 59.8% 55% 4Q14 4Q15 4Q16 1Q17 2Q17 3Q17 4Q17 1Q18 (1) Defined as noninterest expenses as a percentage of net revenue, adjusted for items such as severance, 38 provision for unfunded lending commitments, securities gains and losses and debt extinguishment costs. See Appendix for GAAP to non-GAAP reconciliation table.

Retail C&I Summary The portfolio is stable, with limited exposure to national brick and mortar retailers C&I Retail Loan by Segment Retail C&I loans (defined by NAICS codes) total $2.3B and represent exposure to the overall retail industry; More insulated (84%) includes auto dealers, gas stations, grocery stores, building material suppliers, and similar companies Less insulated (16%) includes those providing products widely available both on-line and through traditional brick and mortal channels Limited exposure to national, legacy brick and mortar retailers Majority of borrowers defined as less insulated are ($ millions) Retail C&I History smaller, niche companies, with on-line and other non-brick-and-mortar distribution channels Over the past year, total exposure increased 5%; More Insulated loans accounted for 88% of the increase Less Insulated loans accounted for 12% of the increase After generally improving then remaining stable, credit quality deteriorated slightly largely due to a single credit with non-systemic issues Note: Data as of 4Q17 39
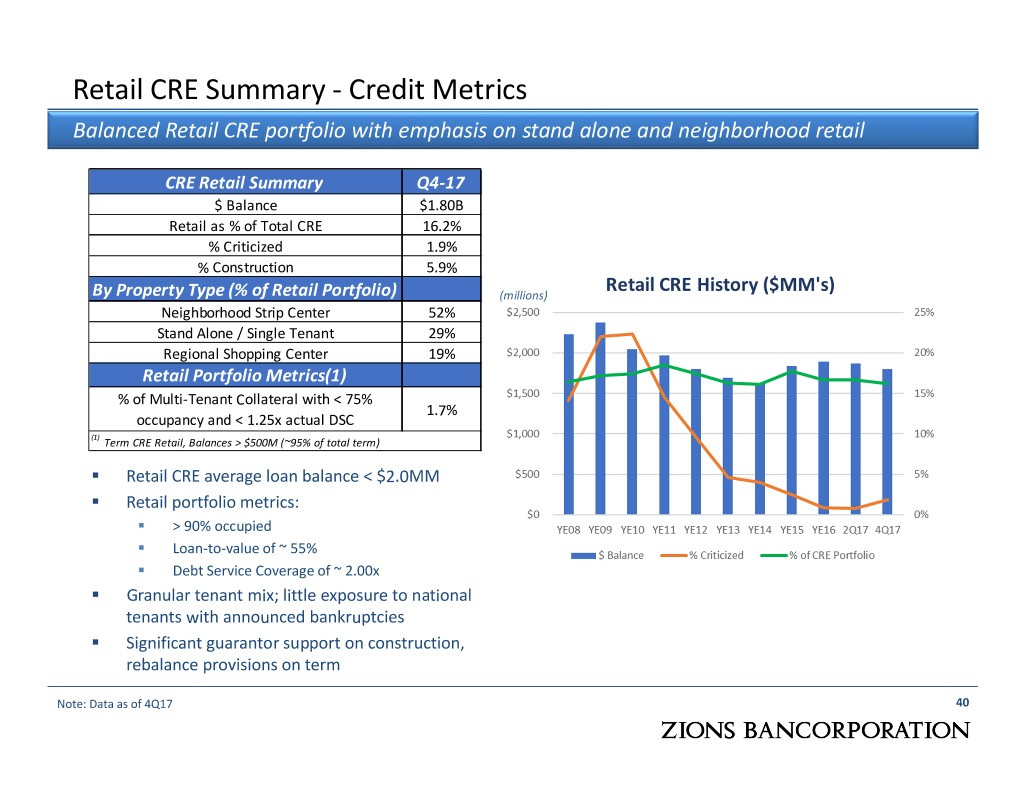
Retail CRE Summary - Credit Metrics Balanced Retail CRE portfolio with emphasis on stand alone and neighborhood retail CRE Retail Summary Q4-17 $ Balance $1.80B Retail as % of Total CRE 16.2% % Criticized 1.9% % Construction 5.9% By Property Type (% of Retail Portfolio) (millions) Neighborhood Strip Center 52% Stand Alone / Single Tenant 29% Regional Shopping Center 19% Retail Portfolio Metrics(1) % of Multi-Tenant Collateral with < 75% 1.7% occupancy and < 1.25x actual DSC (1) Term CRE Retail, Balances > $500M (~95% of total term) Retail CRE average loan balance < $2.0MM Retail portfolio metrics: > 90% occupied Loan-to-value of ~ 55% Debt Service Coverage of ~ 2.00x Granular tenant mix; little exposure to national tenants with announced bankruptcies Significant guarantor support on construction, rebalance provisions on term Note: Data as of 4Q17 40
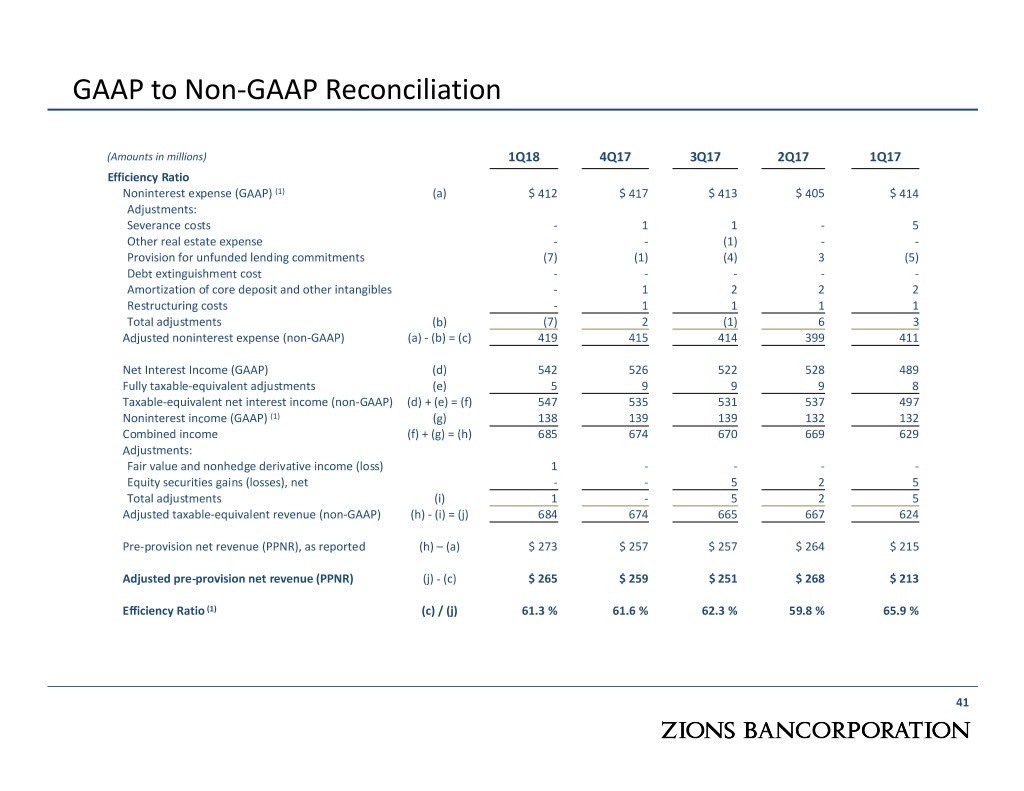
GAAP to Non-GAAP Reconciliation (Amounts in millions) 1Q18 4Q17 3Q17 2Q17 1Q17 Efficiency Ratio Noninterest expense (GAAP) (1) (a) $ 412 $ 417 $ 413 $ 405 $ 414 Adjustments: Severance costs - 1 1 - 5 Other real estate expense - - (1) - - Provision for unfunded lending commitments (7) (1) (4) 3 (5) Debt extinguishment cost - - - - - Amortization of core deposit and other intangibles - 1 2 2 2 Restructuring costs - 1 1 1 1 Total adjustments (b) (7) 2 (1) 6 3 Adjusted noninterest expense (non-GAAP) (a) - (b) = (c) 419 415 414 399 411 Net Interest Income (GAAP) (d) 542 526 522 528 489 Fully taxable-equivalent adjustments (e) 5 9 9 9 8 Taxable-equivalent net interest income (non-GAAP) (d) + (e) = (f) 547 535 531 537 497 Noninterest income (GAAP) (1) (g) 138 139 139 132 132 Combined income (f) + (g) = (h) 685 674 670 669 629 Adjustments: Fair value and nonhedge derivative income (loss) 1 - - - - Equity securities gains (losses), net - - 5 2 5 Total adjustments (i) 1 - 5 2 5 Adjusted taxable-equivalent revenue (non-GAAP) (h) - (i) = (j) 684 674 665 667 624 Pre-provision net revenue (PPNR), as reported (h) – (a) $ 273 $ 257 $ 257 $ 264 $ 215 Adjusted pre-provision net revenue (PPNR) (j) - (c) $ 265 $ 259 $ 251 $ 268 $ 213 Efficiency Ratio (1) (c) / (j) 61.3 % 61.6 % 62.3 % 59.8 % 65.9 % 41
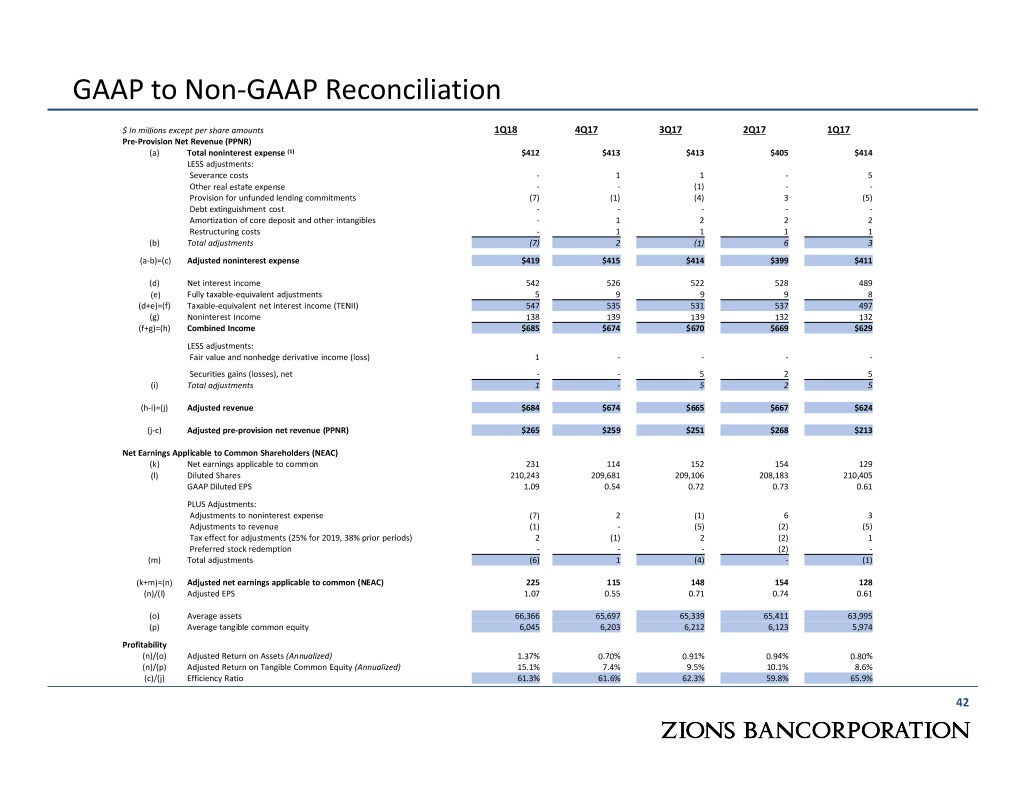
GAAP to Non-GAAP Reconciliation $ In millions except per share amounts 1Q18 4Q17 3Q17 2Q17 1Q17 Pre-Provision Net Revenue (PPNR) (a) Total noninterest expense (1) $412 $413 $413 $405 $414 LESS adjustments: Severance costs - 1 1 - 5 Other real estate expense - - (1) - - Provision for unfunded lending commitments (7) (1) (4) 3 (5) Debt extinguishment cost - - - - - Amortization of core deposit and other intangibles - 1 2 2 2 Restructuring costs - 1 1 1 1 (b) Total adjustments (7) 2 (1) 6 3 (a-b)=(c) Adjusted noninterest expense $419 $415 $414 $399 $411 (d) Net interest income 542 526 522 528 489 (e) Fully taxable-equivalent adjustments 5 9 9 9 8 (d+e)=(f) Taxable-equivalent net interest income (TENII) 547 535 531 537 497 (g) Noninterest Income 138 139 139 132 132 (f+g)=(h) Combined Income $685 $674 $670 $669 $629 LESS adjustments: Fair value and nonhedge derivative income (loss) 1 - - - - Securities gains (losses), net - - 5 2 5 (i) Total adjustments 1 - 5 2 5 (h-i)=(j) Adjusted revenue $684 $674 $665 $667 $624 (j-c) Adjusted pre-provision net revenue (PPNR) $265 $259 $251 $268 $213 Net Earnings Applicable to Common Shareholders (NEAC) (k) Net earnings applicable to common 231 114 152 154 129 (l) Diluted Shares 210,243 209,681 209,106 208,183 210,405 GAAP Diluted EPS 1.09 0.54 0.72 0.73 0.61 PLUS Adjustments: Adjustments to noninterest expense (7) 2 (1) 6 3 Adjustments to revenue (1) - (5) (2) (5) Tax effect for adjustments (25% for 2019, 38% prior periods) 2 (1) 2 (2) 1 Preferred stock redemption - - - (2) - (m) Total adjustments (6) 1 (4) - (1) (k+m)=(n) Adjusted net earnings applicable to common (NEAC) 225 115 148 154 128 (n)/(l) Adjusted EPS 1.07 0.55 0.71 0.74 0.61 (o) Average assets 66,366 65,697 65,339 65,411 63,995 (p) Average tangible common equity 6,045 6,203 6,212 6,123 5,974 Profitability (n)/(o) Adjusted Return on Assets (Annualized) 1.37% 0.70% 0.91% 0.94% 0.80% (n)/(p) Adjusted Return on Tangible Common Equity (Annualized) 15.1% 7.4% 9.5% 10.1% 8.6% (c)/(j) Efficiency Ratio 61.3% 61.6% 62.3% 59.8% 65.9% 42
