Attached files
| file | filename |
|---|---|
| EX-99.1 - EXHIBIT 99.1 - Prestige Consumer Healthcare Inc. | exhibit991fy18-q4earningsr.htm |
| 8-K - 8-K - Prestige Consumer Healthcare Inc. | a8-kpressreleaseq42018.htm |

Exhibit 99.2

This presentation contains certain “forward-looking” statements within the meaning of the Private Securities Litigation Reform Act of 1995, such as statements regarding the Company’s expected financial performance, including revenue growth, adjusted EPS, and adjusted free cash flow; the Company’s expected leverage and ability to de-lever; the market position, expected growth and consumption trends for the Company’s brands; the impact of brand-building and product innovation and the related impact on the Company’s revenues; the Company’s planned pursuit of M&A opportunities; the ability to create long-term shareholder value; the impact of retailer destocking; and the Company’s expectations regarding improved warehousing and freight costs. Words such as “trend,” “continue,” “will,” “expect,” “project,” “anticipate,” “likely,” “estimate,” “may,” “should,” “could,” “would,” and similar expressions identify forward-looking statements. Such forward-looking statements represent the Company’s expectations and beliefs and involve a number of known and unknown risks, uncertainties and other factors that may cause actual results to differ materially from those expressed or implied by such forward-looking statements. These factors include, among others, general economic and business conditions, regulatory matters, competitive pressures, supplier issues, disruptions to distribution, unexpected costs or liabilities, and other risks set forth in Part I, Item 1A. Risk Factors in the Company’s Annual Report on Form 10-K for the year ended March 31, 2017 and in Part II, Item 1A Risk Factors in the Company’s Quarter Report on Form 10-Q for the quarter ended December 31, 2017. You are cautioned not to place undue reliance on these forward-looking statements, which speak only as of the date this presentation. Except to the extent required by applicable law, the Company undertakes no obligation to update any forward-looking statement contained in this presentation, whether as a result of new information, future events, or otherwise. All adjusted GAAP numbers presented are footnoted and reconciled to their closest GAAP measurement in the attached reconciliation schedule or in our May 10, 2018 earnings release in the “About Non-GAAP Financial Measures” section.

Q4 Revenue of $256.0 million, up 6.4% versus PY Q4 Revenue increase of 2.4%(1) pro forma for the Fleet acquisition Solid international performance at Care Pharma Adjusted Gross Margin of 55.2%(3), up +0.6% pts. versus Q3 FY 18 — Beginning to realize improvement in freight and warehouse costs Adjusted EPS of $0.62(3), up 14.8% versus PY Q4 Continued solid Adjusted Free Cash Flow of $52.0 million(3), resulting in leverage of 5.2x(4) Re-financed approximately $250 million of Term Loan with Senior Notes to mitigate the impact of rising interest rates Board of Directors authorized stock buyback program of up to $50 million through May of 2019 Continued strategy of de-leveraging


L-52 Weeks Consumption(2) L-52 Weeks Consumption(2)* +1.3% +1.0% 3.4% 2.1% 2.1% 1.1% Category Core Brands Category * IRI MULO Data as of March 25, 2018; Core Categories include those pertaining to PBH’s core brands (SE, Monistat, BC / Goody’s, Clear Eyes, DenTek, Dramamine, Beano, Fleet, Boudreaux’s, Little Remedies, The Doctor’s, Efferdent, Chloraseptic, Luden’s, Debrox, Compound W, Nix)
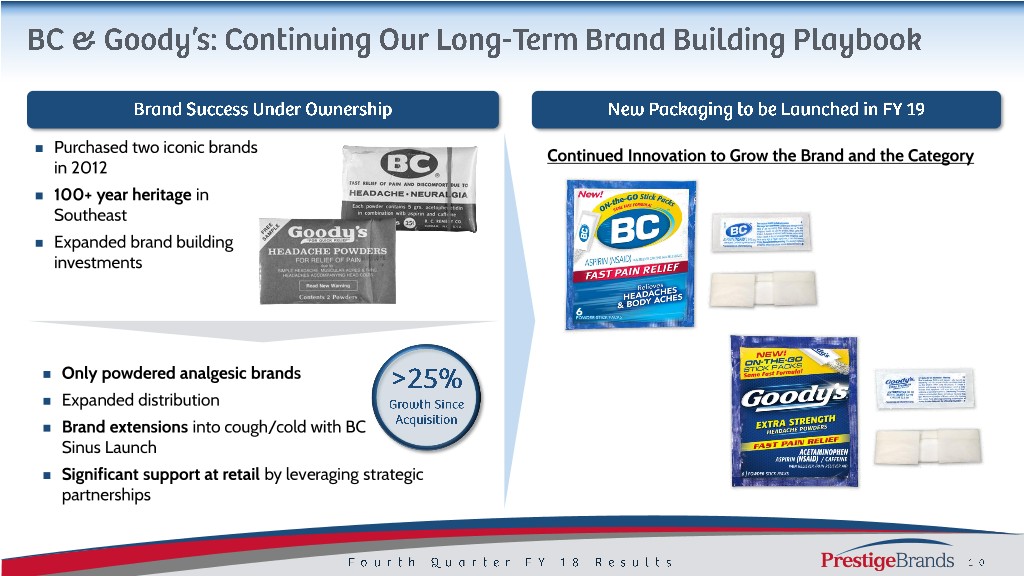
Purchased two iconic brands Continued Innovation to Grow the Brand and the Category in 2012 100+ year heritage in Southeast Expanded brand building investments Only powdered analgesic brands Expanded distribution Brand extensions into cough/cold with BC Sinus Launch Significant support at retail by leveraging strategic partnerships

L-52 Weeks Consumption(2) +1.7x 6.1% 3.6% Feminine Hygiene Category

+1.2% #1 share brands represent ~60% of sales 2.9% Need-based products sought by consumers 1.7% Aligned with macro-Health & Wellness trend with innovation driven by consumer insights New products that enhance efficacy and consumer (2) experience Consumption Revenue

Transitioned away from high-cost temporary work force April 1 Timing of customer deliveries led to a meaningful increase in average in-transit times in September Expanded carrier capacity and negotiated carrier rates in FY 18 18 FY Q2 Incremental warehouse and freight costs have moderated and Expanded carrier capacity through the use of high- will continue to improve as we work through FY 19 cost brokers due to constrained carrier capacity High turnover led to increases in labor cost with use Q3 FY 18 FY Q3 of skilled temporary labor force Focus on continued progress against freight and warehouse costs FY 19 FY

$197 $208 $215 + $165 $185 $127 $131 $67 FY 12 FY 13 FY 14 FY 15 FY 16 FY 17 FY 18 FY19 ~5.2x ~5.7x ~5.2x ~5.0x ~4.3x ~4.3x ~5.0x ~4.7x FY 12 FY 13 FY 14 FY 15* FY 16 FY 17 FY 18 FY19 Dollar values in millions. * Peak leverage of 5.75x at close of the Insight Acquisition in September 2014

15.5% CAGR 17.6% CAGR $1,041 $355 $806 $289 $597 $204 $438 $134 FY 12 FY 14 FY 16 FY 18 FY 12 FY 14 FY 16 FY 18 20.8% CAGR 17.3% CAGR $2.58 $185 $208 $2.17 $131 $1.53 $67 $0.99 FY 12 FY 14 FY 16 FY 18 FY 12 FY 14 FY 16 FY 18 Dollar values in millions, except Adjusted EPS.

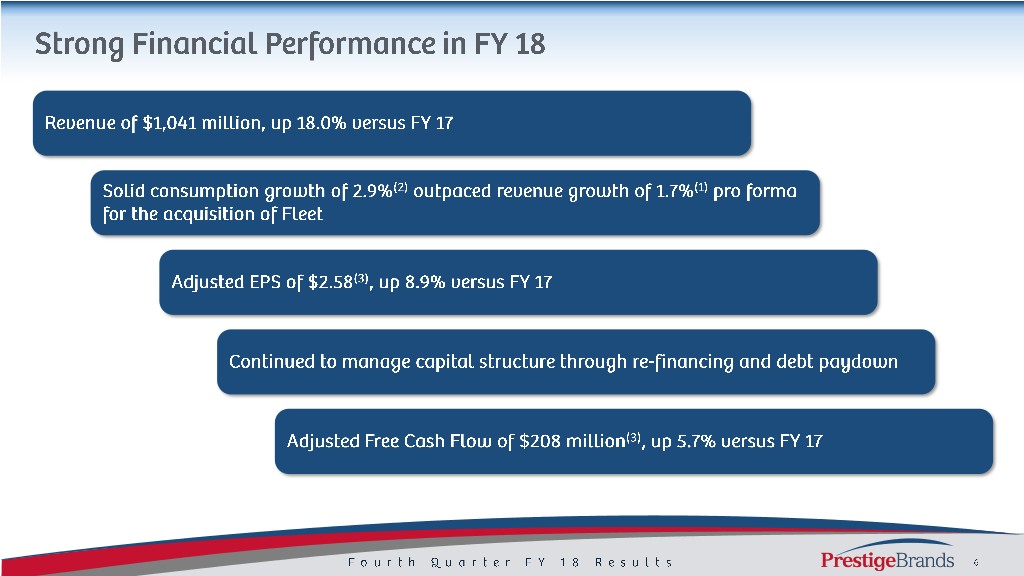
Solid overall financial performance in Q4 and FY 18 − Q4 Revenue of $256.0 million, an increase of 6.4% − FY 18 Adjusted EBITDA(3) of $355.4 million − Q4 Adjusted EPS of $0.62(3), up 14.8% vs prior year, and FY 18 Adjusted EPS of $2.58(3), up 8.9% vs prior year Q4 FY 18 Q4 FY 17 FY 18 FY 17 6.4% 18.0% $256.0 $240.7 $1,041.2 $882.1 13.9% 16.7% 14.8% 8.9% $85.3 $74.9 $0.62 $0.54 $355.4 $304.5 $2.58 $2.37 Total Revenue Adjusted EBITDA(3) Adjusted EPS (3) Total Revenue Adjusted EBITDA(3) Adjusted EPS(3) Dollar values in millions, except per share data.

Q4 FY 18 Q4 FY 17 % Chg FY18 FY17 % Chg Revenue growth of +18.0% Total Revenue $ 256.0 $ 240.7 6.4% $ 1,041.2 $ 882.1 18.0% (1) *(3) – Revenue growth of 1.7% pro forma for Adjusted Gross Margin 141.3 133.2 6.0% 580.2 503.3 15.3% the Fleet acquisition % Margin 55.2% 55.4% 55.7% 57.1% (3) (3) Adjusted A&P 35.3 39.2 (9.9%) 147.5 126.1 16.9% Adjusted Gross Margin of 55.7% % Total Revenue 13.8% 16.3% 14.2% 14.3% Adjusted A&P 14.2%(3) of Revenue, or $147.5 (3) Adjusted G&A 21.8 19.6 11.2% 82.3 73.1 12.5% million % Total Revenue 8.5% 8.1% 7.9% 8.3% – Q4 FY 17 A&P impacted by prior year D&A (ex. COGS D&A) 6.9 6.7 4.4% 28.4 25.4 12.1% Fleet transition % Total Revenue 2.7% 2.8% 2.7% 2.9% (3) (3) Adjusted Operating Income +15.5% versus Adjusted Operating Income $ 77.2 $ 67.8 13.9% $ 322.0 $ 278.7 15.5% FY 17 % Margin 30.2% 28.2% 30.9% 31.6% Adjusted EPS(3) +8.9% versus FY 17 Adjusted Earnings Per Share(3) $ 0.62 $ 0.54 14.8% $ 2.58 $ 2.37 8.9% (3) Adjusted EBITDA $ 85.3 $ 74.9 13.9% $ 355.4 $ 304.5 16.7% % Margin 33.3% 31.1% 34.1% 34.5% Dollar values in millions, except per share data. * Includes depreciation as a component of Adjusted Gross Profit

Net Debt in March of $1,980 million; leverage ratio (4) Q4 FY 18 Q4 FY 17 of 5.2x at end of FY 18 5.7% Total debt reduction of $64 million in Q4 and $209 $208.1 million in FY 18 $196.9 – Includes repatriation of cash from Australia in Q4 10.7% Re-financed portion of Term Loan with Senior Notes to mitigate impact of rising interest rates $52.0 $46.9 – Fixed rate portion of debt now roughly equivalent to floating rate portion of debt Adjusted Free Cash Flow (3) Adjusted Free Cash Flow (3) Dollar values in millions.

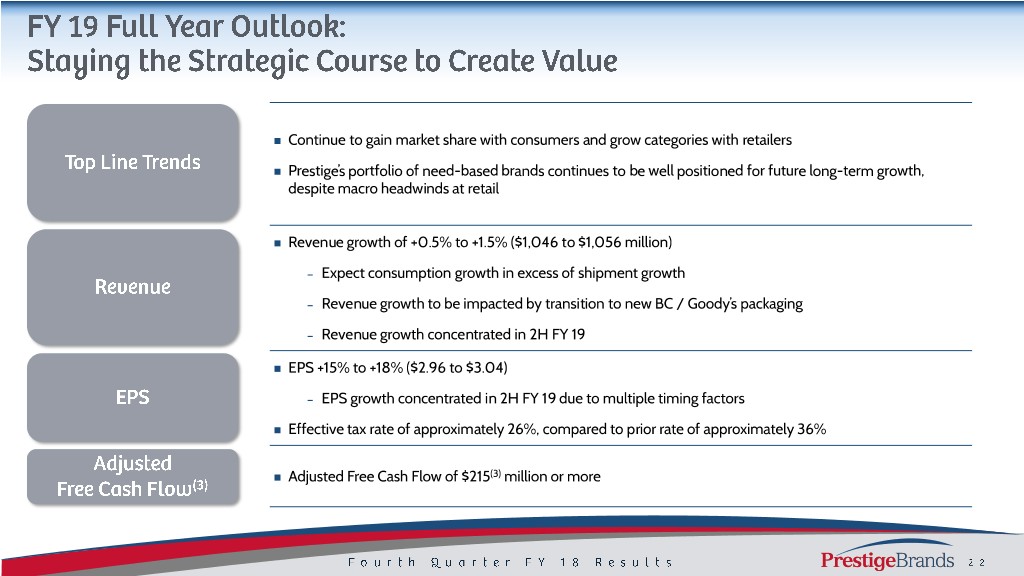
Continue to gain market share with consumers and grow categories with retailers Prestige’s portfolio of need-based brands continues to be well positioned for future long-term growth, despite macro headwinds at retail Revenue growth of +0.5% to +1.5% ($1,046 to $1,056 million) – Expect consumption growth in excess of shipment growth – Revenue growth to be impacted by transition to new BC / Goody’s packaging – Revenue growth concentrated in 2H FY 19 EPS +15% to +18% ($2.96 to $3.04) – EPS growth concentrated in 2H FY 19 due to multiple timing factors Effective tax rate of approximately 26%, compared to prior rate of approximately 36% Adjusted Free Cash Flow of $215(3) million or more


(1) Organic Revenue Growth and Proforma Revenue Growth are Non-GAAP financial measures and are reconciled to the most closely related GAAP financial measure in the attached Reconciliation Schedules and / or our earnings release in the “About Non-GAAP Financial Measures” section. (2) Total company consumption is based on domestic IRI multi-outlet + C-Store retail dollar sales for the twelve month period ending 3-25-18 and net revenues as a proxy for consumption for certain untracked channels, and international consumption which includes Canadian consumption for leading retailers, Australia consumption for leading brands, and other international net revenues as a proxy for consumption. (3) Adjusted Gross Margin, Adjusted A&P, Adjusted G&A, Adjusted EBITDA, Adjusted Operating Income, Adjusted Net Income, Adjusted EPS and Adjusted Free Cash Flow are Non-GAAP financial measures and are reconciled to their most closely related GAAP financial measures in the attached Reconciliation Schedules and / or in our earnings release in the “About Non-GAAP Financial Measures” section. (4) Leverage ratio reflects net debt / covenant defined EBITDA. (5) Adjusted Free Cash Flow for FY 19 is a projected Non-GAAP financial measure, is reconciled to projected GAAP Net Cash Provided by Operating Activities in the attached Reconciliation Schedules and / or in our earnings release in the “About Non- GAAP Financial Measures” section and is calculated based on projected Net Cash Provided by Operating Activities less projected capital expenditures plus payments associated with acquisitions less tax effect of payments associated with acquisitions.
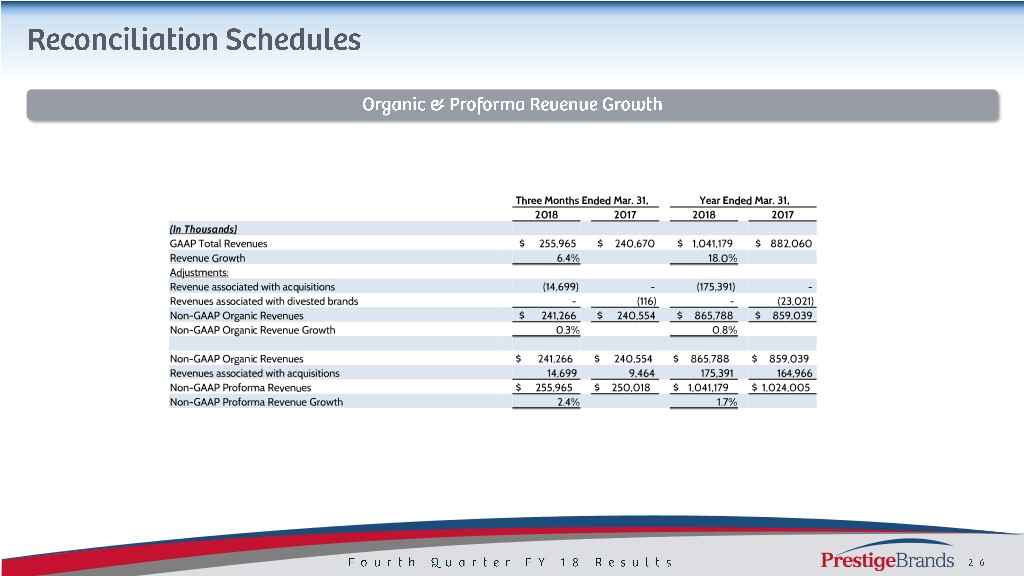
Three Months Ended Mar. 31, Year Ended Mar. 31, 2018 2017 2018 2017 (In Thousands) GAAP Total Revenues $ 255,965 $ 240,670 $ 1,041,179 $ 882,060 Revenue Growth 6.4% 18.0% Adjustments: Revenue associated with acquisitions (14,699) - (175,391) - Revenues associated with divested brands - (116) - (23,021) Non-GAAP Organic Revenues $ 241,266 $ 240,554 $ 865,788 $ 859,039 Non-GAAP Organic Revenue Growth 0.3% 0.8% Non-GAAP Organic Revenues $ 241,266 $ 240,554 $ 865,788 $ 859,039 Revenues associated with acquisitions 14,699 9,464 175,391 164,966 Non-GAAP Proforma Revenues $ 255,965 $ 250,018 $ 1,041,179 $ 1,024,005 Non-GAAP Proforma Revenue Growth 2.4% 1.7%
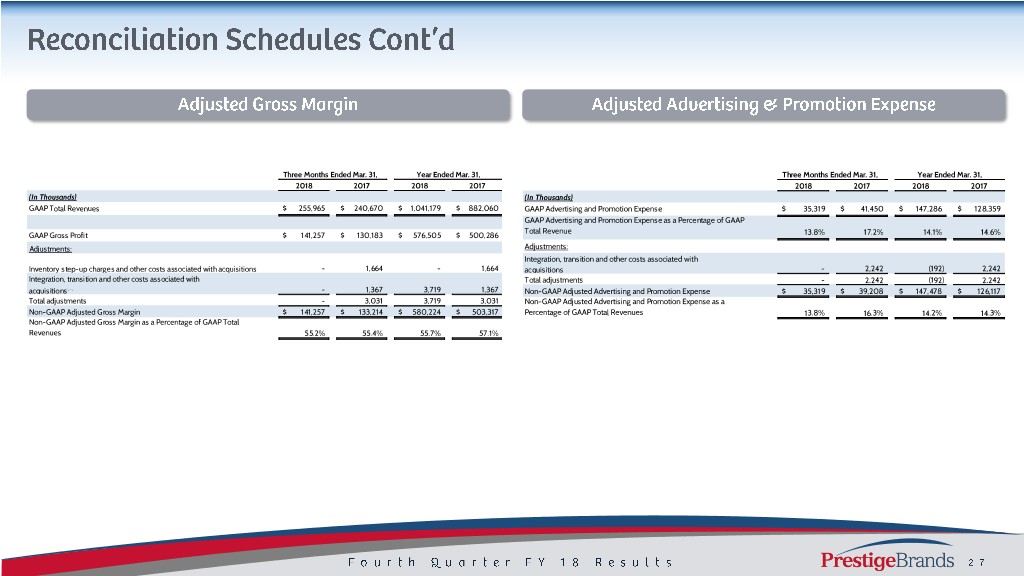
Three Months Ended Mar. 31, Year Ended Mar. 31, Three Months Ended Mar. 31, Year Ended Mar. 31, 2018 2017 2018 2017 2018 2017 2018 2017 (In Thousands) (In Thousands) GAAP Total Revenues $ 255,965 $ 240,670 $ 1,041,179 $ 882,060 GAAP Advertising and Promotion Expense $ 35,319 $ 41,450 $ 147,286 $ 128,359 GAAP Advertising and Promotion Expense as a Percentage of GAAP Total Revenue GAAP Gross Profit $ 141,257 $ 130,183 $ 576,505 $ 500,286 13.8% 17.2% 14.1% 14.6% Adjustments: Adjustments: Integration, transition and other costs associated with Inventory step-up charges and other costs associated with acquisitions - 1,664 - 1,664 acquisitions - 2,242 (192) 2,242 Integration, transition and other costs associated with Total adjustments - 2,242 (192) 2,242 acquisitions(2) - 1,367 3,719 1,367 Non-GAAP Adjusted Advertising and Promotion Expense $ 35,319 $ 39,208 $ 147,478 $ 126,117 Total adjustments - 3,031 3,719 3,031 Non-GAAP Adjusted Advertising and Promotion Expense as a Non-GAAP Adjusted Gross Margin $ 141,257 $ 133,214 $ 580,224 $ 503,317 Percentage of GAAP Total Revenues 13.8% 16.3% 14.2% 14.3% Non-GAAP Adjusted Gross Margin as a Percentage of GAAP Total Revenues 55.2% 55.4% 55.7% 57.1%
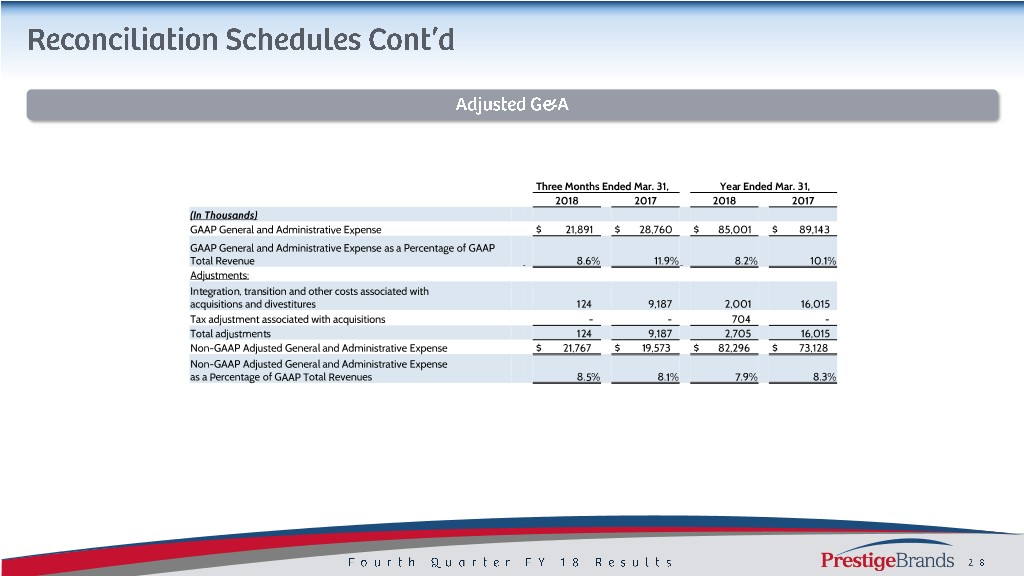
Three Months Ended Mar. 31, Year Ended Mar. 31, 2018 2017 2018 2017 (In Thousands) GAAP General and Administrative Expense $ 21,891 $ 28,760 $ 85,001 $ 89,143 GAAP General and Administrative Expense as a Percentage of GAAP Total Revenue 8.6% 11.9% 8.2% 10.1% Adjustments: Integration, transition and other costs associated with acquisitions and divestitures 124 9,187 2,001 16,015 Tax adjustment associated with acquisitions - - 704 - Total adjustments 124 9,187 2,705 16,015 Non-GAAP Adjusted General and Administrative Expense $ 21,767 $ 19,573 $ 82,296 $ 73,128 Non-GAAP Adjusted General and Administrative Expense as a Percentage of GAAP Total Revenues 8.5% 8.1% 7.9% 8.3%

Three Months Ended Mar. 31, Year Ended Mar. 31, 2018 2017 2018 2017 (In Thousands) GAAP Net Income (Loss) $ (39,687) $ 11,090 $ 339,570 $ 69,395 Interest expense, net 26,838 32,832 105,879 93,343 Provision (benefit) for income taxes (12,875) 7,712 (232,484) 41,455 Depreciation and amortization 8,045 7,092 33,426 25,792 Non-GAAP EBITDA (17,679) 58,726 246,391 229,985 Non-GAAP EBITDA Margin (6.9%) 24.4% 23.7% 26.1% Adjustments: Inventory step-up charges and other costs associated with acquisitions (1) - 1,664 - 1,664 Integration, transition and other costs associated with acquisitions and divestitures in Cost of Goods Sold(2) - 1,367 3,719 1,367 Integration, transition and other costs associated with acquisitions and divestitures in Advertising and Promotion Expense(2) - 2,242 (192) 2,242 Integration, transition and other costs associated with acquisitions and divestitures in General and Administrative Expense(2) 124 9,187 2,001 16,015 Tradename impairment 99,924 - 99,924 - Tax adjustment associated with acquisitions - - 704 - Loss on extinguishment of debt 2,901 1,420 2,901 1,420 Loss on divestitures - 268 - 51,820 Total adjustments 102,949 16,148 109,057 74,528 Non-GAAP Adjusted EBITDA $ 85,270 $ 74,874 $ 355,448 $ 304,513 Non-GAAP Adjusted EBITDA Margin 33.3% 31.1% 34.1% 34.5%

2012 2013 2014 2015 2016 2017 2018 GAAP Net Income (Loss) $ 37,212 $ 65,505 $ 72,615 $ 78,260 $ 99,907 $ 69,395 $ 339,570 Interest Expense, net 41,320 84,407 68,582 81,234 85,160 93,343 105,879 Provision (benefit) for income taxes 23,945 40,529 29,133 49,198 57,278 41,455 (232,484) Depreciation and amortization 10,734 13,235 13,486 17,740 23,676 25,792 33,426 Non-GAAP EBITDA 113,211 203,676 183,816 226,432 266,021 229,985 246,391 Sales costs related to acquisitions - 411 - - - - - Inventory step up 1,795 23 577 2,225 1,387 1,664 - Inventory related acquisition costs - 220 407 - - - - Add'l supplier costs - 5,426 - - - - - Costs associated with CEO transition - - - - 1,406 Integration, transition, and other Acquisition/Divestiture costs 17,395 5,909 1,111 21,507 2,401 19,624 5,528 Stamp Duty - - - 2,940 - - - Unsolicited porposal costs 1,737 534 - - - - - Loss on extinguishment of debt 5,409 1,443 18,286 - 17,970 1,420 2,901 Tradename impairment - - - - - - 99,924 Gain on settlement (5,063) - - - - - - (Gain) Loss on divestitures - - - (1,133) - 51,820 - Tax adjustment associated with acquisitions - - - - - - 704 Adjustments to EBITDA 21,273 13,966 20,381 25,539 23,164 74,528 109,057 Non-GAAP Adjusted EBITDA $ 134,484 $ 217,642 $ 204,197 $ 251,971 $ 289,185 $ 304,513 $ 355,448 Dollar values in thousands.

Three Months Ended Mar. 31, Year Ended Mar. 31, 2018 2017 2018 2017 Net Net Net Income EPS Income EPS Net Income EPS Income EPS (In Thousands, except per share data) GAAP Net Income (Loss) $ (39,687) $ (0.74) $ 11,090 $ 0.21 $ 339,570 $ 6.34 $ 69,395 $ 1.30 Adjustments: Inventory step-up charges and other costs associated with acquisitions - - 1,664 0.03 - - 1,664 0.03 Integration, transition and other costs associated with acquisitions and divestitures in Cost of Goods Sold - - 1,367 0.03 3,719 0.07 1,367 0.03 Integration, transition and other costs associated with acquisitions and divestitures in Advertising and Promotion Expense - - 2,242 0.04 (192) - 2,242 0.04 Integration, transition and other costs associated with acquisitions and divestitures in General and Administrative Expense 124 - 9,187 0.17 2,001 0.04 16,015 0.30 Tax adjustment associated with acquisition in General and Administrative Expense - - - - 704 0.01 - - Accelerated amortization of debt origination costs 392 0.01 575 0.01 392 0.01 1,706 0.03 Additional expense as a result of Term Loan debt refinancing 270 - 9,184 0.17 270 - 9,184 0.17 Tradename impairment 99,924 1.87 - - 99,924 1.87 - - Loss on extinguishment of debt 2,901 0.05 1,420 0.03 2,901 0.05 1,420 0.03 Loss on divestitures - - 268 0.01 - - 51,820 0.97 Tax impact of adjustments (36,574) (0.68) (9,438) (0.18) (38,804) (0.72) (28,024) (0.53) Normalized tax rate adjustment 5,679 0.11 1,278 0.02 (272,201) (5.09) (199) - Total Adjustments 72,716 1.36 17,747 0.33 (201,286) (3.76) 57,195 1.07 Non-GAAP Adjusted Net Income and Adjusted EPS $ 33,029 $ 0.62 $ 28,837 $ 0.54 $ 138,284 $ 2.58 $ 126,590 $ 2.37 Note: Reported GAAP is calculated using diluted shares outstanding. Diluted shares outstanding for the three months ended March 31, 2018 are 53,512

2012 2013 2014 2015 2016 2017 2018 Net Net Net Net Net Net Net Income EPS Income EPS Income EPS Income EPS Income EPS Income EPS Income EPS GAAP Net Income $ 37,212 $0.73 $ 65,505 $ 1.27 $ 72,615 $ 1.39 $ 78,260 $ 1.49 $ 99,907 $ 1.88 $ 69,395 $ 1.30 $ 339,570 $ 6.34 Adjustments Additional expense as a result of Term Loan debt refinancing - - - - - - - - - - 9,184 0.17 270 - Sales costs related to acquisitions - - 411 0.01 - - - - - - - - - - Inventory step up 1,795 0.04 23 - 577 0.01 2,225 0.04 1,387 0.03 1,664 0.03 - - Inventory related acquisition costs - - 220 - 407 0.01 - - - - - - - - Add'l supplier costs - - 5,426 0.11 - - - - - - - - - - Costs associated with CEO transition - - - - - - - - 1,406 0.02 - - - - Integration, Transition, and other Acquisition/Divestiture costs 17,395 0.34 5,909 0.11 1,111 0.02 21,507 0.41 2,401 0.05 19,624 0.37 5,528 0.11 Stamp Duty - - - - - - 2,940 0.05 - - - - - - Unsolicited proposal costs 1,737 0.03 534 0.01 - - - - - - - - - - Loss on extinguishment of debt 5,409 0.11 1,443 0.03 18,286 0.35 - - 17,970 0.34 1,420 0.03 2,901 0.05 Gain on settlement (5,063) (0.10) - - - - - - - - - - - - (Gain) loss on divestitures - - - - - - (1,133) (0.02) - - 51,820 0.97 - - Accelerated amortization of debt discounts and debt issue costs - - 7,746 0.15 5,477 0.10 218 - - - 1,706 0.03 392 0.01 Tradename impairment - - - - - - - - - - - - 99,924 1.87 Tax adj. associated with acquisition in G&A expense - - - - - - - - - - - - 704 0.01 Tax impact on adjustments (8,091) (0.16) (8,329) (0.16) (9,100) (0.17) (5,968) (0.11) (7,608) (0.15) (28,024) (0.52) (38,804) (0.72) Normalized tax rate adjustment (237) - (1,741) (0.03) (9,465) (0.18) - - - - (199) - (272,201) (5.09) Total adjustments 12,945 0.26 11,642 0.23 7,293 0.14 19,789 0.37 15,556 0.29 57,195 1.07 (201,286) (3.76) Non-GAAP Adjusted Net Income and Non-GAAP Adjusted EPS $ 50,157 $0.99 $ 77,147 $ 1.50 $ 79,908 $ 1.53 $ 98,049 $ 1.86 $115,463 $ 2.17 $126,590 $ 2.37 $138,284 $ 2.58 Dollar values in thousands, except per share data Note: Reported GAAP is calculated using diluted shares outstanding. Diluted shares outstanding for the three months ended March 31, 2018 are 53,512

Three Months Ended Mar. 31, Year Ended Mar. 31, 2018 2017 2018 2017 (In Thousands) GAAP Net Income (Loss) $ (39,687) $ 11,090 $ 339,570 $ 69,395 Adjustments: Adjustments to reconcile net income (loss) to net cash provided by operating activities as shown in the Statement of Cash Flows 103,215 21,447 (113,698) 92,613 Changes in operating assets and liabilities, net of effects from acquisitions as shown in the (9,090) (25,013) (15,762) (13,336) Statement of Cash Flows Total Adjustments 94,125 (3,566) (129,460) 79,277 GAAP Net cash provided by operating activities 54,438 7,524 210,110 148,672 Purchase of property and equipment (2,876) (1,042) (12,532) (2,977) Non-GAAP Free Cash Flow 51,562 6,482 197,578 145,695 Integration, transition and other payments associated with acquisitions and divestitures 221 8,304 10,358 10,448 Additional expense as a result of Term Loan debt refinancing 182 9,184 182 9,184 Pension contribution - 6,000 - 6,000 Additional income tax payments associated with divestitures - 16,956 - 25,545 Non-GAAP Adjusted Free Cash Flow $ 51,965 $ 46,926 $ 208,118 $ 196,872

2012 2013 2014 2015 2016 2017 2018 GAAP Net Income $ 37,212 $ 65,505 $ 72,615 $ 78,260 $ 99,907 $ 69,395 $ 339,570 Adjustments Adjustments to reconcile net income to net cash provided by operating activities as shown in the statement of cash flows 35,674 59,497 52,562 65,998 98,181 92,613 (113,698) Changes in operating assets and liabilities, net of effects from acquisitions as shown in the statement of cash flows (5,434) 12,603 (11,945) 13,327 (21,778) (13,336) (15,762) Total adjustments 30,240 72,100 40,617 79,325 76,403 79,277 (129,460) GAAP Net cash provided by operating activities 67,452 137,605 113,232 157,585 176,310 148,672 210,110 Purchases of property and equipment (606) (10,268) (2,764) (6,101) (3,568) (2,977) (12,532) Non-GAAP Free Cash Flow 66,846 127,337 110,468 151,484 172,742 145,695 197,578 Premium payment on 2010 Senior Notes - - 15,527 - - - - Premium payment on extinguishment of 2012 Senior Notes - - - - 10,158 - - Accelerated payments due to debt refinancing - - 4,675 - - 9,184 182 Integration, transition and other payments associated with acquisitions - - 512 13,563 2,461 10,448 10,358 Pension contribution - - - - - 6,000 - Additional income tax payments associated with divestitures - - - - - 25,545 - Total adjustments - - 20,714 13,563 12,619 51,177 10,540 Non-GAAP Adjusted Free Cash Flow $ 66,846 $ 127,337 $ 131,182 $ 165,047 $ 185,361 $ 196,872 $ 208,118 Dollar values in thousands
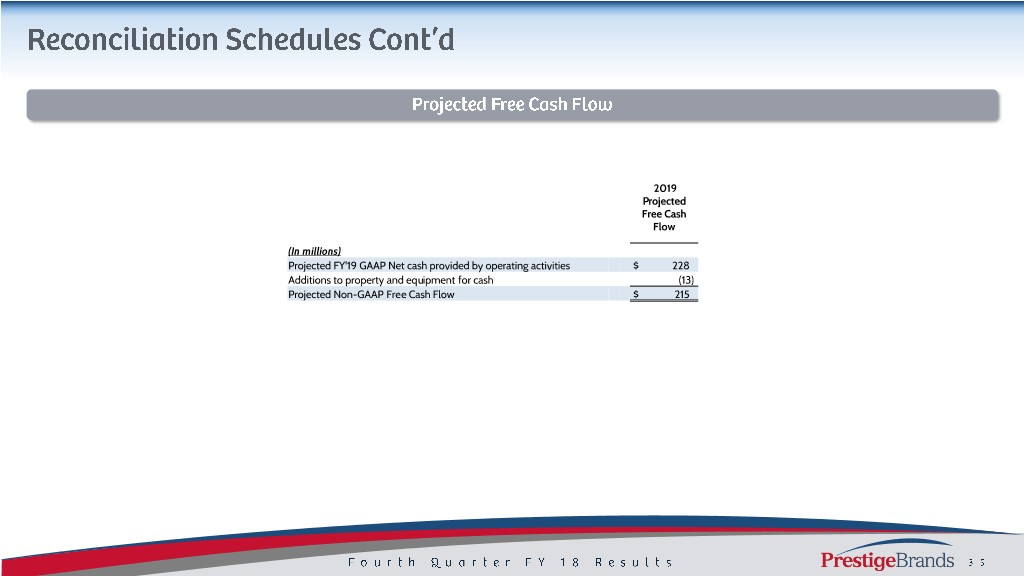
2019 Projected Free Cash Flow (In millions) Projected FY'19 GAAP Net cash provided by operating activities $ 228 Additions to property and equipment for cash (13) Projected Non-GAAP Free Cash Flow $ 215
