Attached files
| file | filename |
|---|---|
| 8-K - 8-K - BLUEGREEN VACATIONS CORP | bxg-20180510x8k.htm |

BLUEGREEN VACATIONS INVESTOR PRESENTATION MAY 2018 The Fountains ORLANDO, FLORIDA bluegreenvacations
Forward-Looking Statements This presentation contains forward-looking statements based largely on current expectations of Bluegreen Vacations (“Bluegreen” or “The Company”), that involve a number of risks and uncertainties. All opinions, forecasts, projections, future plans or other statements, other than statements of historical fact, are forward-looking statements and can be identified by the use of words or phrases such as "plans," "believes," "will," "expects," "anticipates," "intends," "estimates," "our view," "we see," "would" and words and phrases of similar meaning. The forward-looking statements in presentation are also forward-looking statements within the meaning of Section 27A of the Securities Act of 1933, as amended, and Section 21E of the Securities Exchange Act of 1934, as amended, and involve substantial risks and uncertainties that are subject to change based on factors which are, in many instances, beyond our control. We can give no assurance that such expectations will prove to have been correct. Actual results, performance, or achievements could differ materially from those contemplated, expressed, or implied by the forward-looking statements contained herein. This presentation also contains information regarding the past performance of the Bluegreen Vacations, and you should note that prior or current performance is not a guarantee or indication of future performance. Some factors which may affect the accuracy of the forward-looking statements apply generally to the resort development and vacation ownership industries in which Bluegreen operates. Risks and uncertainties include, without limitation, risks associated with the ability to successfully implement currently anticipated plans and generate earnings, long term growth, and increased shareholder value; risks inherent in the vacation ownership industry, including the risk that Bluegreen's marketing expenses will increase; the risk that the competitive advantages identified are not realized as anticipated or at all; and the risk that Bluegreen’s capital-light business activities or other operations may not be successful because of changes in economic conditions or otherwise; the risk that Bluegreen may not achieve EBITDA growth or increased margins; the risk that revenue streams will not be recurring; risks relating to the economic conditions generally or in the vacations ownership, rental, and travel industries; risks of adverse changes in relationships with strategic partners and other third parties and risks associated with entry into Cabela’s stores; risks of decreased demand from purchasers or the ability to maintain an optimal inventory of VOI’s for sale; risks of changes in senior management; the risk that dividends on our common stock will not be declared at current levels or at all; the risk that acquisitions will not be successful, and the risk that the Bluegreen's strategy to grow profitability and increase long-term value may not be realized as anticipated, if at all. Additional risks and uncertainties are described in Bluegreen’s filings with the Securities and Exchange Commission available to view on the SEC's website, www.sec.gov, and on Bluegreen Vacation's website, ir.bluegreenvacations.com/. You should not place undue reliance on any forward-looking statement, which speaks only as of the date made. Bluegreen Vacations cautions that the foregoing factors are not exclusive, and we do not undertake, and specifically disclaim any obligation, to update or supplement any forward-looking statements whether as a result of changes in circumstances, new information, subsequent events or otherwise. bluegreenvacations 1

Dynamic and Experienced Executive Team Shawn B. Pearson President and Chief Executive Officer Joined Bluegreen in 2017 Previously served as Chairman and Chief Executive Officer of Renin Anthony M. Puleo, CPA Executive Vice President, Chief Financial Officer and Treasurer Joined Bluegreen in 1997 Previously was Bluegreen’s Chief Accounting Officer and was a Senior Manager at Ernst & Young David L. Pontius Executive Vice President and Chief Operating Officer Joined Bluegreen in 2007 Previously held various roles at Bluegreen including Chief Strategy Officer and was EVP at Wyndham Vacation Ownership bluegreenvacations 2
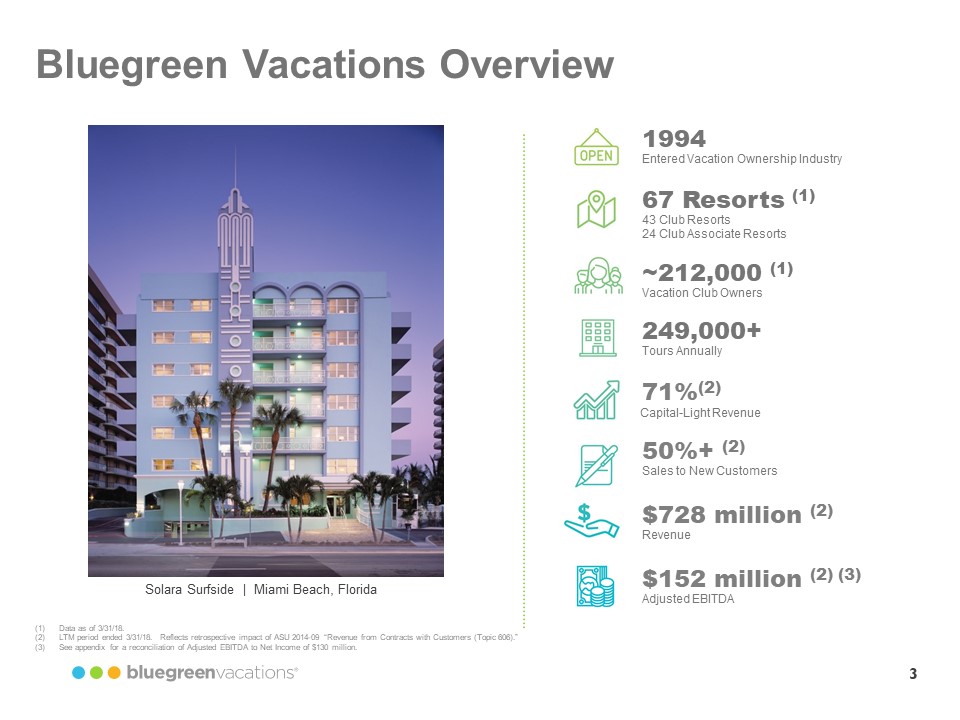
Bluegreen Vacations Overview 1994 Entered Vacation Ownership Industry 67 Resorts (1) 43 Club Resorts 24 Club Associate Resorts ~212,000 (1) Vacation Club Owners 249,000+ Tours Annually 71%(2) Capital-Light Revenue 50%+ (2) Sales to New Customers $728 million (2) Revenue $152 million (2) (3) Adjusted EBITDA (1)Data as of 3/31/18. (2) LTM period ended 3/31/18. Reflects retrospective impact of ASU 2014-09 “Revenue from Contracts with Customers (Topic 606).” (3)See appendix for a reconciliation of Adjusted EBITDA to Net Income of $130 million. Solara Surfside | Miami Beach, Florida bluegreenvacations 3
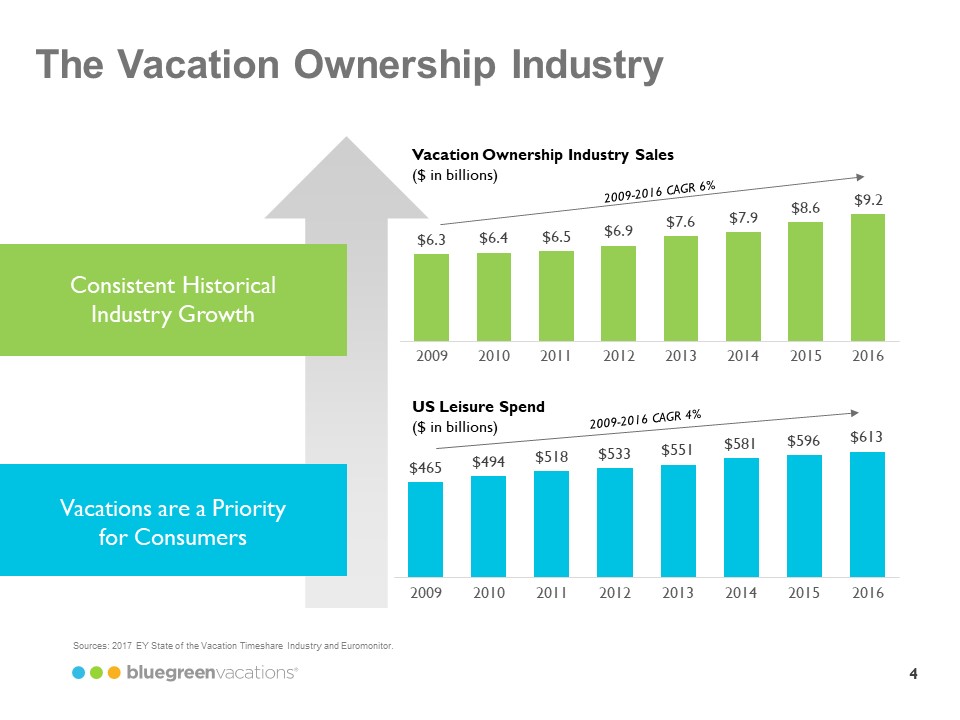
The Vacation Ownership Industry Consistent Historical Industry Growth Vacation Ownership Industry Sales ($ in billions) 2009-2016 CAGR 6% $6.3 $6.4 $6.5 $6.9 $7.6 $7.9 $8.6 $9.2 2009 2010 2011 2012 2013 2014 2015 2016 Vacations are a Priority for Consumers US Leisure Spend ($ in billions) 2009-2016 CAGR 4% $465 $494 $518 $533 $551 %581 $596 $613 2009 2010 2011 2012 2013 2014 2015 2016 Sources: 2017 EY State of the Vacation Timeshare Industry and Euromonitor. bluegreenvacations 4
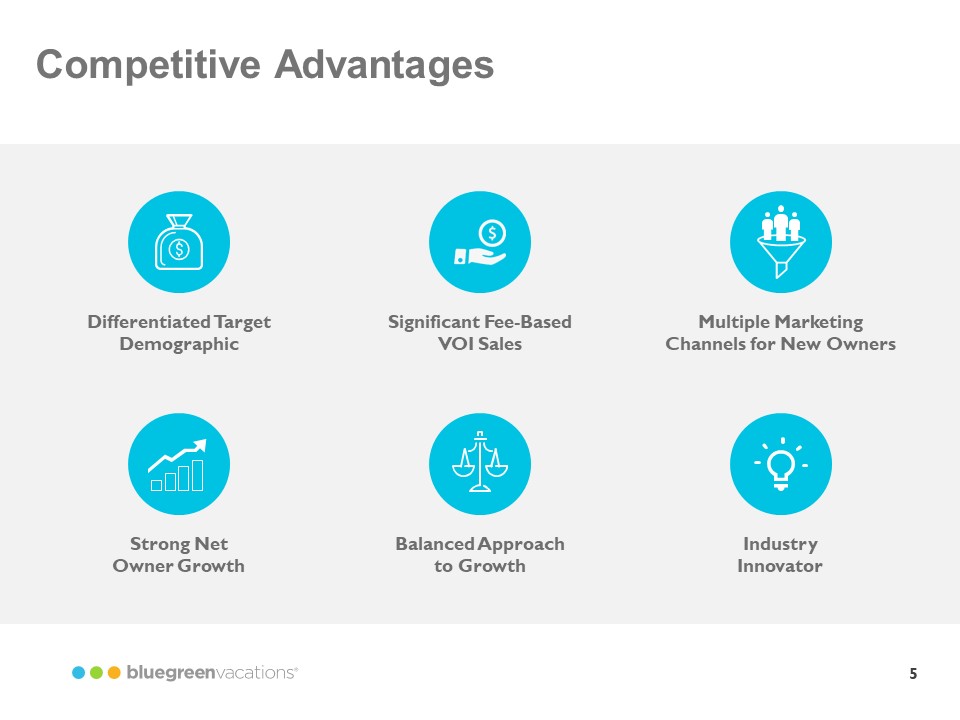
Competitive Advantages Differentiated Target Demographic Significant Fee-Based VOI Sales Multiple Marketing Channels for New Owners Strong Net Owner Growth Balanced Approach to Growth Industry Innovator bluegreenvacations 5
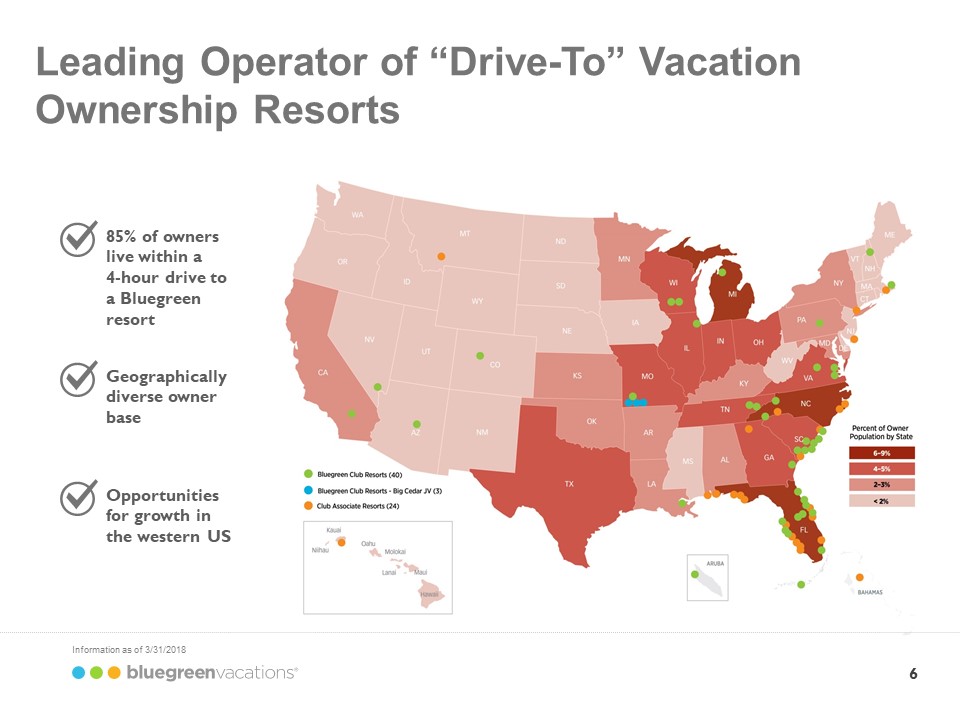
Leading Operator of “Drive-To” Vacation Ownership Resorts 85% of owners live within a 4-hour drive to a Bluegreen resort Geographically diverse owner base Opportunities for growth in the western US Bluegreen Club Resorts (40) Bluegreen Club Resorts- Big Cedar JV (3) Club Associate Resorts (24) Percent of Owner Population by State 6-9% 4-5% 2-3% <2% Information as of 3/31/2018 bluegreenvacations 6
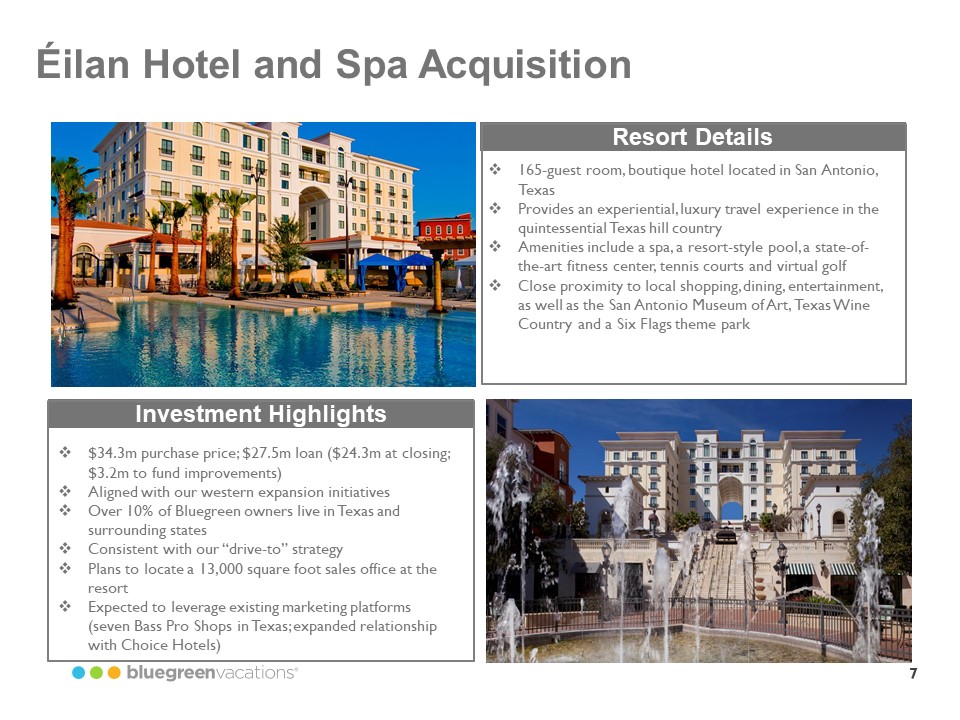
Éilan Hotel and Spa Acquisition Resort Details. 165-guest room, boutique hotel located in San Antonio, Texas .Provides an experiential, luxury travel experience in the quintessential Texas hill country .Amenities include a spa, a resort-style pool, a state-of- the-art fitness center, tennis courts and virtual golf .Close proximity to local shopping, dining, entertainment, as well as the San Antonio Museum of Art, Texas Wine Country and a Six Flags theme park Investment Highlights.$34.3m purchase price; $27.5m loan ($24.3m at closing; $3.2m to fund improvements) .Aligned with our western expansion initiatives .Over 10% of Bluegreen owners live in Texas and surrounding states .Consistent with our “drive-to” strategy .Plans to locate a 13,000 square foot sales office at the resort .Expected to leverage existing marketing platforms (seven Bass Pro Shops in Texas; expanded relationship with Choice Hotels) bluegreenvacations 7
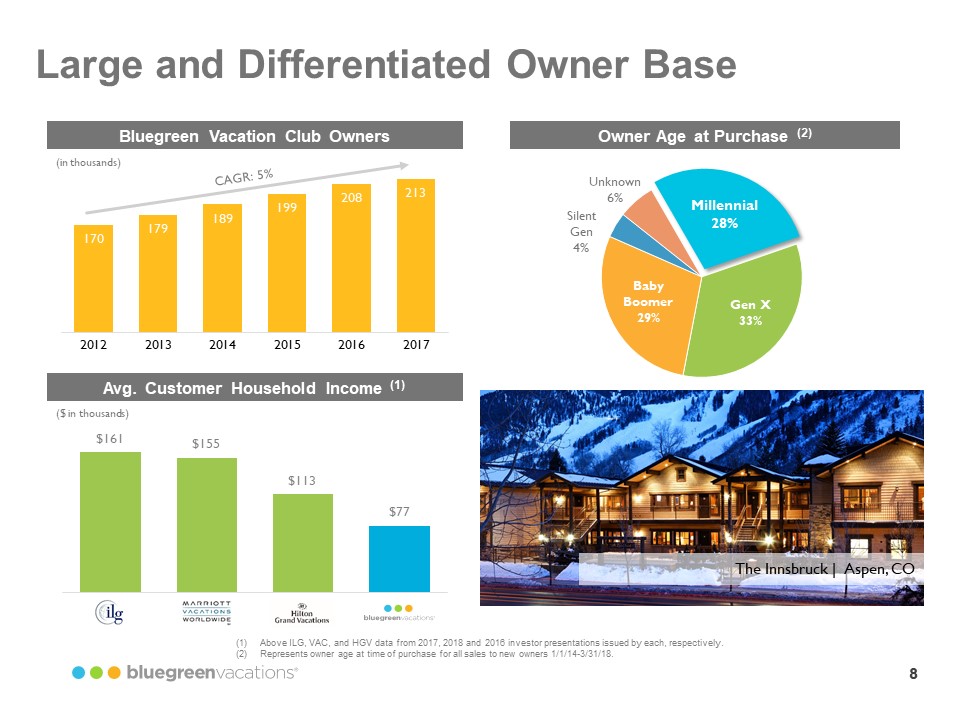
Large and Differentiated Owner Base Bluegreen Vacation Club Owners (in thousands) CAGR: 5% 170 179 189 199 208 213 2012 2013 2014 2015 2016 2017 Owner Age at Purchase (2) Millennial 28% Gen X 33% Baby Boomer 29% Silent Gen 4% Unknown 6% Avg. Customer Household Income(1) ($ in thousands) $161 ILG $155 VAC $113 HGV $77 bluegreen vacations (1)Above ILG, VAC, and HGV data from 2017, 2018 and 2016 investor presentations issued by each, respectively. (2) Represents owner age at time of purchase for all sales to new owners 1/1/14-3/31/18.) The Innsbruck | Aspen, CO bluegreenvacations 8
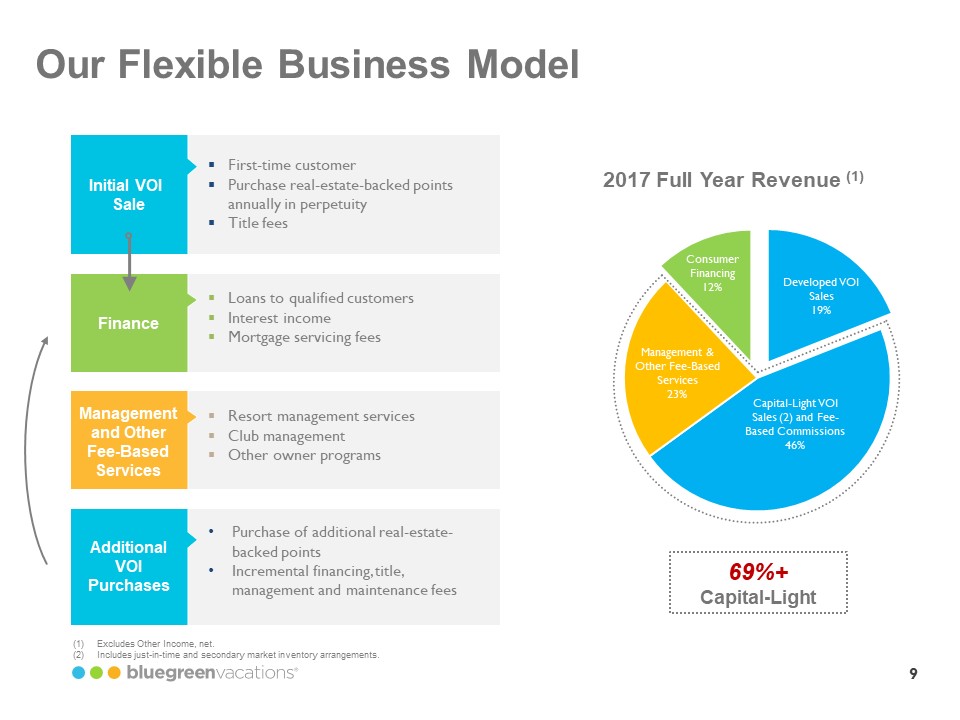
Our Flexible Business Model Initial VOI Sale .First-time customer .Purchase real-estate-backed points annually in perpetuity .Title fees Finance Loans to qualified customers .Interest income .Mortgage servicing fees Management & Other Fee-Based Services Resort management services .Club management Other owner programs Additional VOI Purchases Purchase of additional real-estate- backed points Incremental financing, title, management and maintenance fees 2017 Full Year Revenue (1) Developed VOI Sales 19% Capital-Light VOI Sales (2) and Fee- Based Commissions 46% Management & Other Fee-Based Services 23% Consumer Financing 12% 69%+ Capital-Light (1) Excludes Other Income, net. (2)Includes just-in-time and secondary market inventory arrangements. bluegreenvacations 9
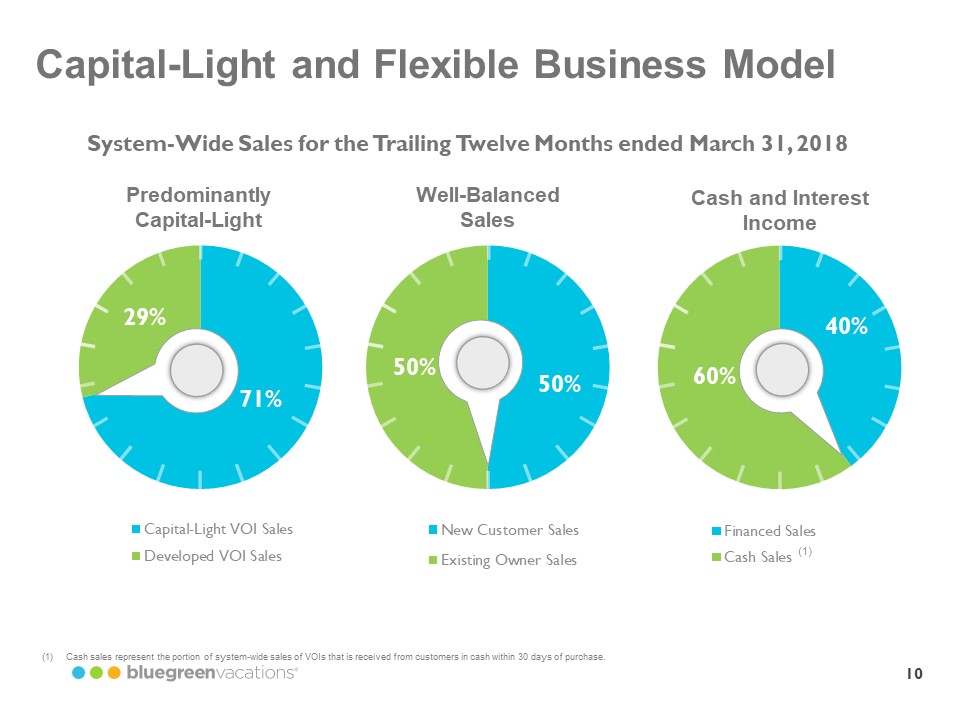
Capital-Light and Flexible Business Model System-Wide Sales for the Trailing Twelve Months ended March 31, 2018 Predominantly Capital-Light 71% 29% Capital-Light VOI Sales Developed VOI Sales Well-Balanced Sales 50% 50% New Customer Sales Existing Owner Sales Cash and Interest Income 40% 60% Financed Sales Cash Sales (1) (1)Cash sales represent the portion of system-wide sales of VOIs that is received from customers in cash within 30 days of purchase. bluegreenvacations 10
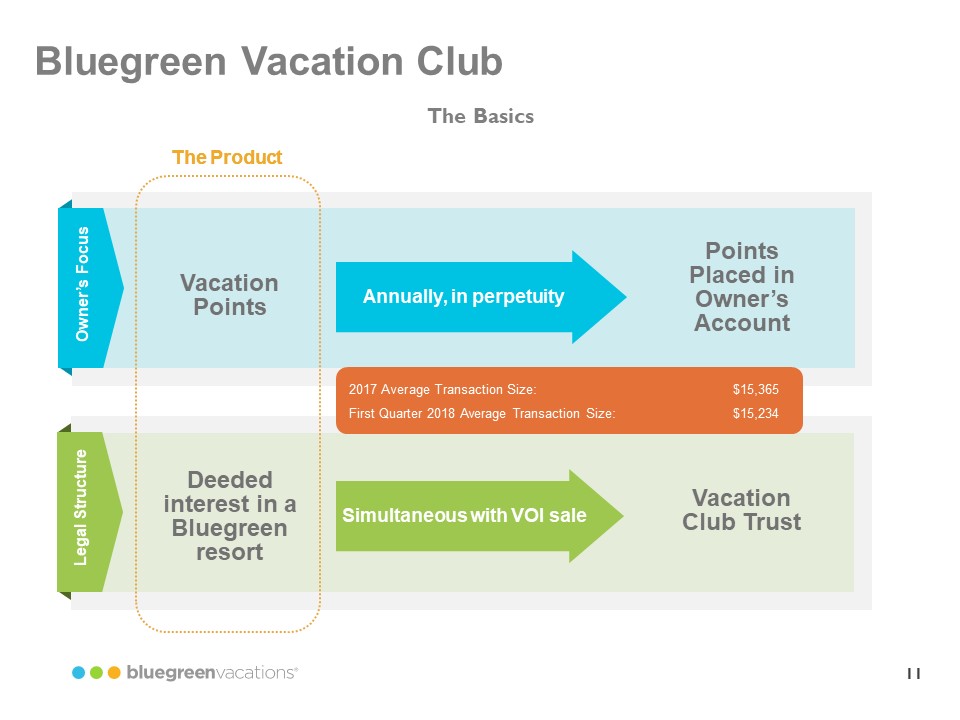
Bluegreen Vacation Club The Basics Owner’s Focus The Product Vacation Points Annually, in perpetuity Points Placed in Owner’s Account Legal Structure The Product Deeded interest in a Bluegreen resort Simultaneous with VOI sale Vacation Club Trust 2017 Average Transaction Size: $15,365 First Quarter 2018 Average Transaction Size: $15,234 bluegreenvacations 11
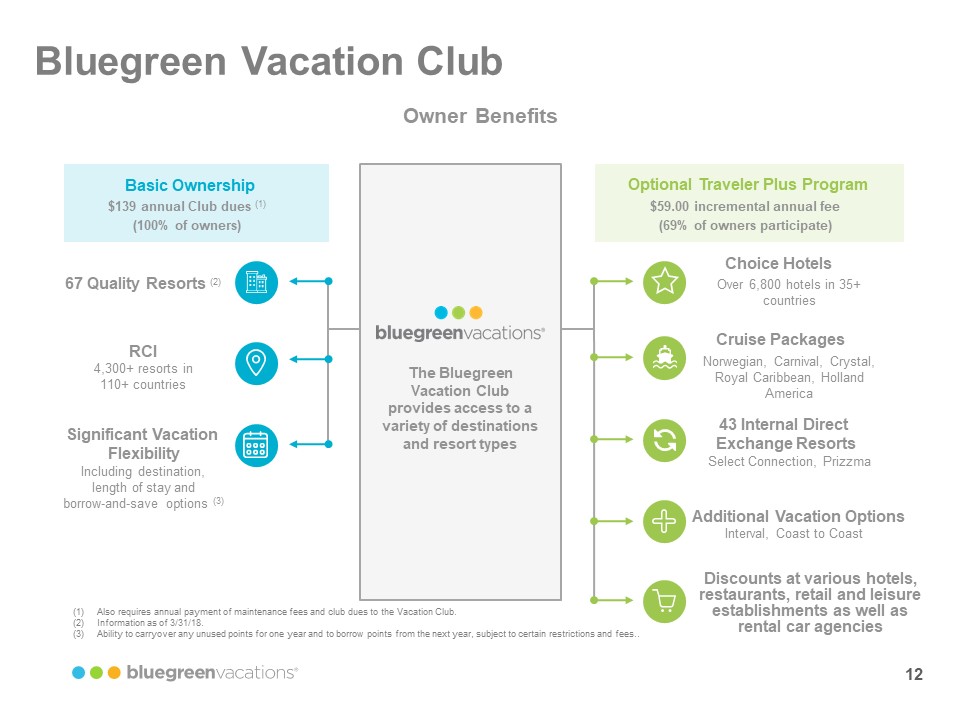
Bluegreen Vacation Club Owner Benefits Basic Ownership $139 annual Club dues (1) (100% of owners) 67 Quality Resorts (2) RCI 4,300+ resorts in 110+ countries Significant Vacation Flexibility Including destination, length of stay and borrow-and-save options (3) bluegreenvacations The Bluegreen Vacation club provides access to a variety of destinations and resort types Optional Traveler Plus Program $59.00 incremental annual fee (69% of owners participate) Choice Hotels Over 6,800 hotels in 35+ countries Cruise Packages Norwegian, Carnival, Crystal, Royal Caribbean, Holland America 43 Internal Direct Exchange Resorts Select Connection, Prizzma Additional Vacation Options Interval, Coast to Coast Discounts at various hotels, restaurants, retail and leisure establishments as well as rental car agencies (1) Also requires annual payment of maintenance fees and club dues to the Vacation Club. (2) Information as of 3/31/18. (3) Ability to carryover any unused points for one year and to borrow points from the next year, subject to certain restrictions and fees.. bluegreenvacations 12
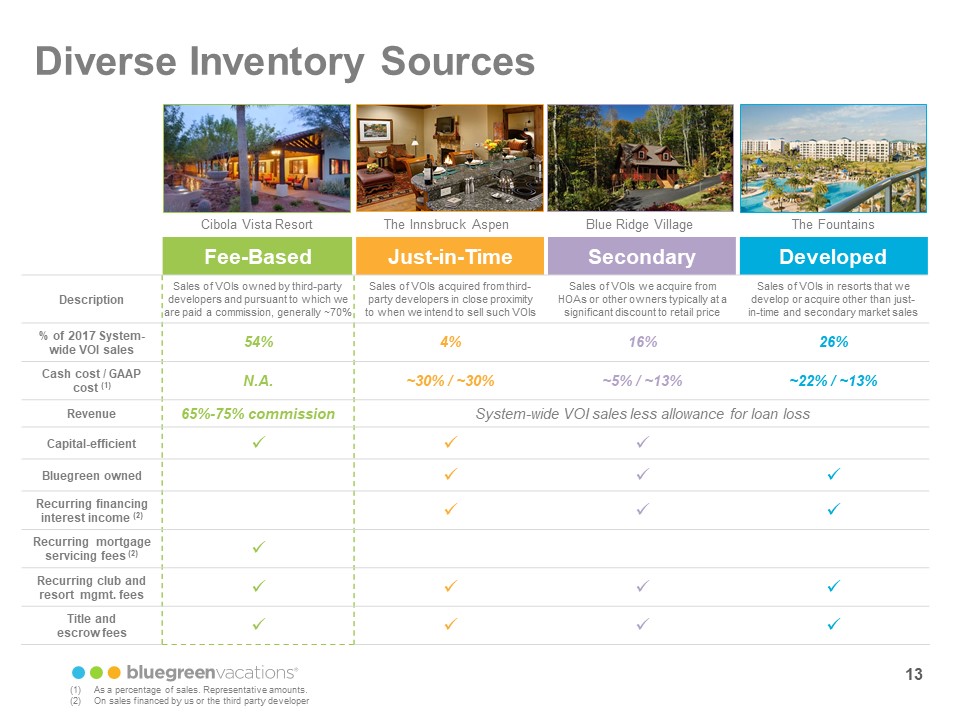
Diverse Inventory Sources Cibola Vista Resort The Innsbruck Aspen Blue Ridge Village The Fountains Fee-Based Just-in-Time Secondary Developed Description Sales of VOIs owned by third-party developers and pursuant to which we are paid a commission, generally ~70% Just-in-Time Sales of VOIs acquired from third-party developers in close proximity to when we intend to sell such VOIs Secondary Sales of VOIs are acquire from HOAs or other owners typically at a significant discount to retail price Developed Sales of VOIs in resorts that we develop or acquire other than just-in-time and secondary market sales % of 2017 System-wide VOI sales 54% 4% 16% 26% Cash cost / GAAP cost (1) N.A. ~30% / ~30% ~5% / ~13% ~22% / ~13% Revenue 65%-75% commission System-wide VOI sales less allowance for loan loss Capital-efficient Bluegreen owned Recurring financing interest income (2) Recurring mortgage servicing fees (2) Recurring club and resort mgmt. fees Title and escrow fees (1) As a percentage of sales Representative amounts. (2) On sales financed by us or the third party developer bluegreenvacations 13
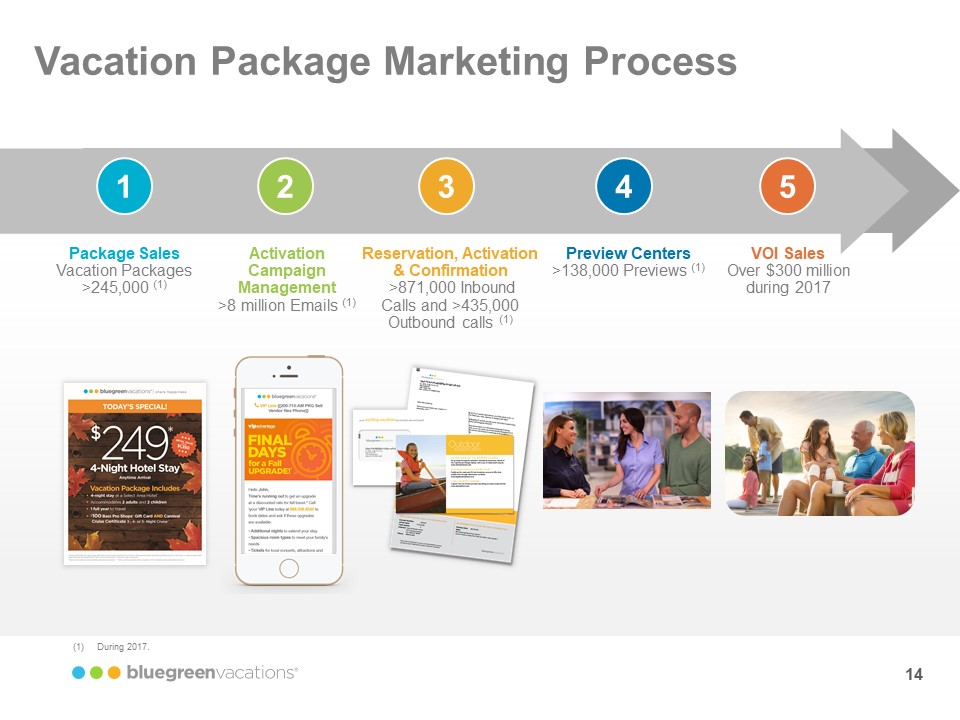
Vacation Package Marketing Process 1 Package Sales Vacation Packages >245,000 (1) 2 Activation Campaign Management >8 million Emails (1) 3 Reservation, Activation & Confirmation >871,11 Inbound Calls and >435,000 Outbound calls (1) 4 Preview Centers >138,000 Previews (1) 5 VOI Sales Over $300 million during 2017 (1) During 2017. bluegreenvacations 14
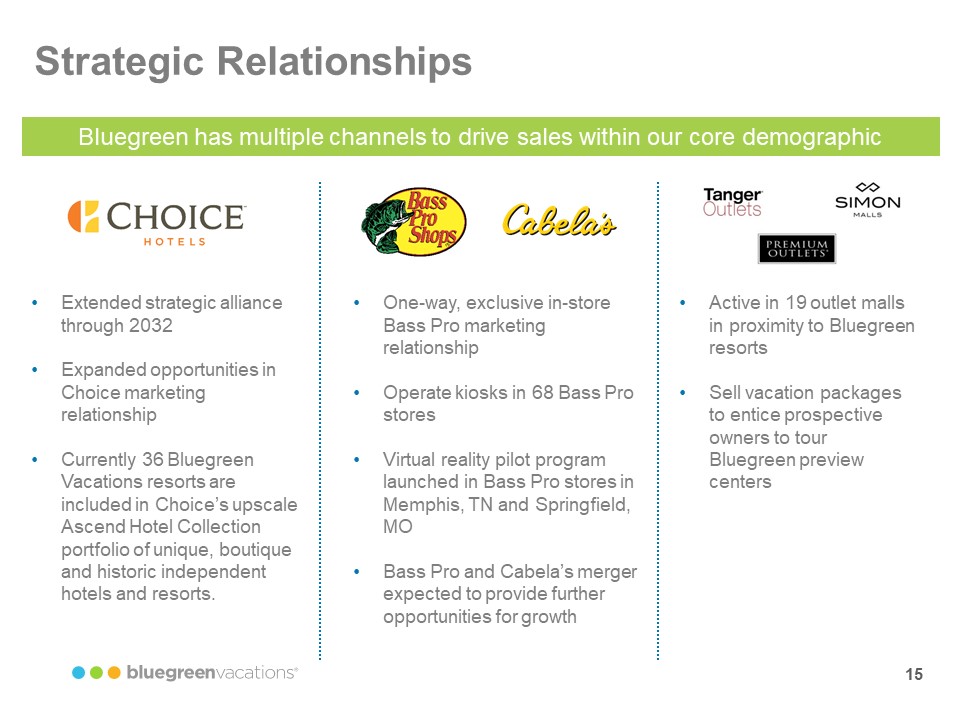
Strategic Relationships Bluegreen has multiple channels to drive sales within our core demographic Choice Hotels• Extended strategic alliance through 2032 •Expanded opportunities in Choice marketing relationship •Currently 36 Bluegreen Vacations resorts are included in Choice’s upscale Ascend Hotel Collection portfolio of unique, boutique and historic independent hotels and resorts. Bass Pro Shops Cabela’s One-way, exclusive in-store Bass Pro marketing relationship •Operate kiosks in 68 Bass Pro stores •Virtual reality pilot program launched in Bass Pro stores in Memphis, TN and Springfield, MO •Bass Pro and Cabela’s merger expected to provide further opportunities for growth Tanger Outlets Premium Outlets Simon Malls Active in 19 outlet malls in proximity to Bluegreen resorts •Sell vacation packages to entice prospective owners to tour Bluegreen preview centers bluegreenvacations 15
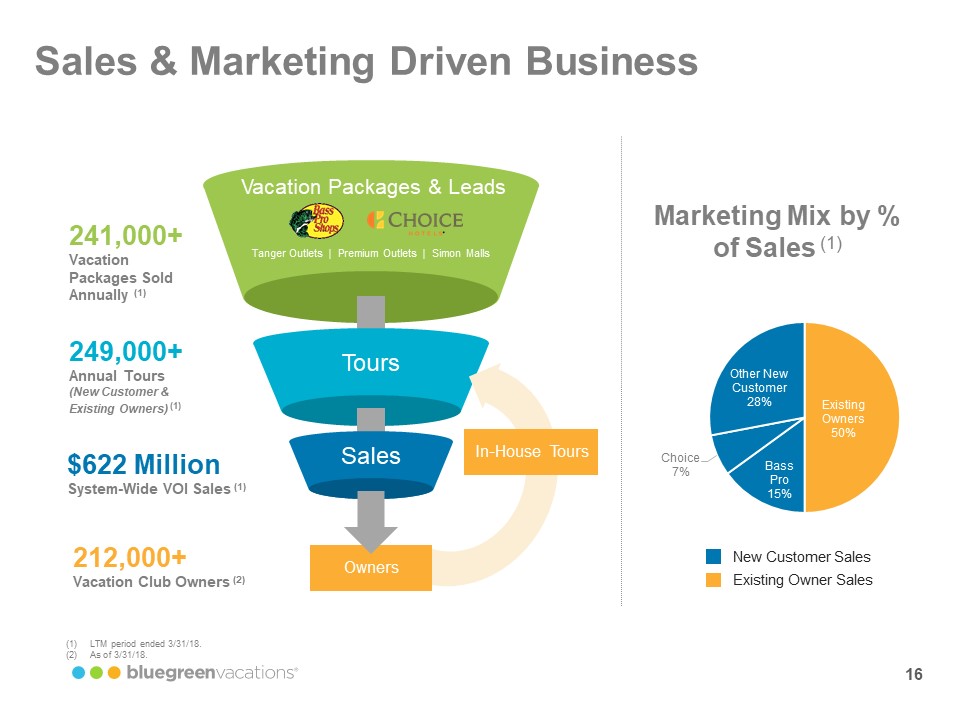
Sales & Marketing Driven Business 241,000+ Vacation Packages Sold Annually (1) Vacation Packages & Leads Bass Pro Shops Choice Hotels Tanger Outlets Premium Outlets Simon Malls 249,000+ Annual Tours (New Customer & Existing Owners) (1) Tours $622 Millions System-Wide VOI Sales (1) Sales In-House Tours 212,000+ Vacation Club Owners (2) Owners Marketing Mix by % of Sales (1) Existing Owners 50% Bass Pro 15% Choice 7% Other New Customer 28% New Customer Sales Existing Owner Sales (1) LTM period ended 3/31/18. (2) As of 3/31/18. bluegreenvacations 16
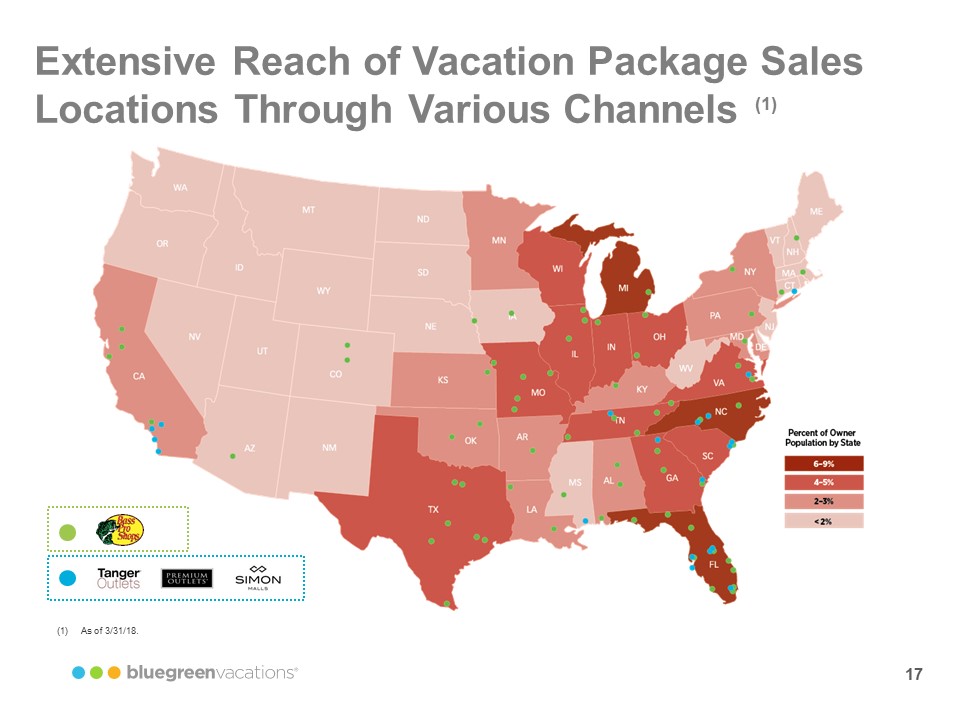
Extensive Reach of Vacation Package Sales Locations Through Various Channels (1) Percent of Owner Population by State 6-9% 4-5% 2-3% <2% (1)As of 3/31/18. bluegreenvacations 17
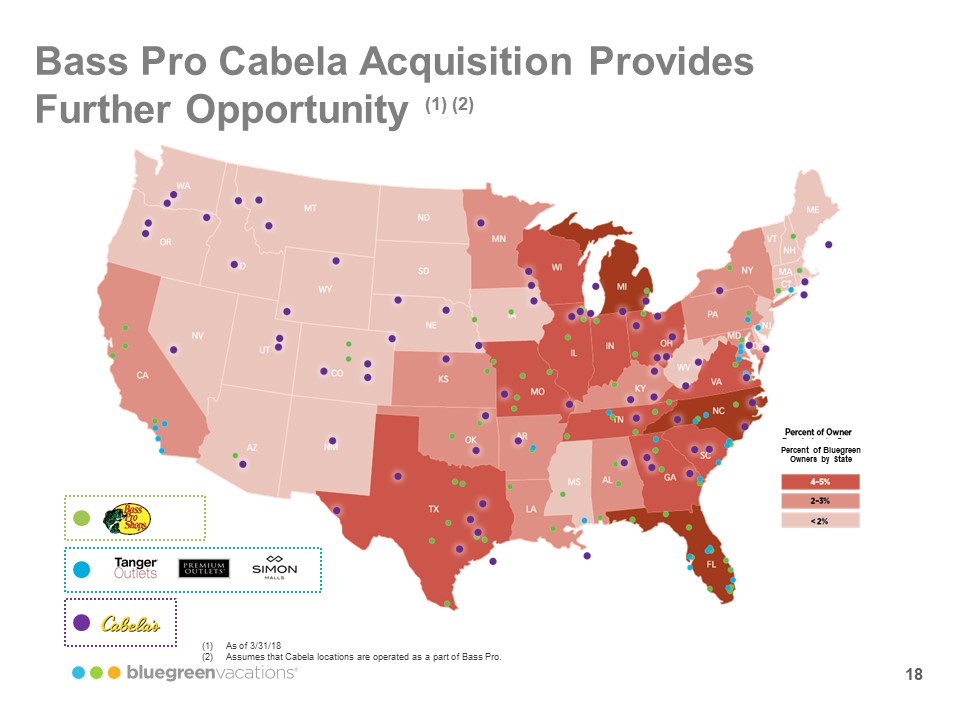
Bass Pro Cabela Acquisition Provides Further Opportunity (1) (2) Percent of Owner Percent of Bluegreen Owners by State 4-5% 2-3% <2% Bass Pro shops Tanger Outlets Premium Outlets Simon Malls Cabela’s (1) As of 3/31/18 (2) Assumes that Cabela locations are operated as a part of Bass Pro. bluegreenvacations 18
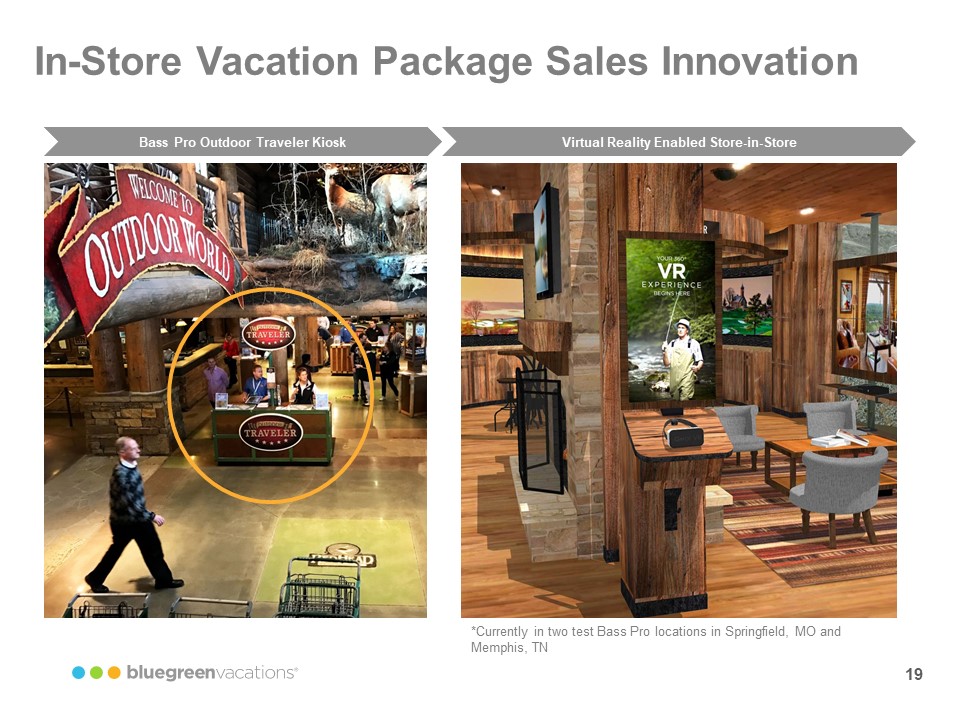
In-Store Vacation Package Sales Innovation Bass Pro Outdoor Traveler Kiosk Virtual Reality Enabled Store-in-Store *Currently in two test Bass Pro locations in Springfield, MO and Memphis, TN bluegreenvacations 19
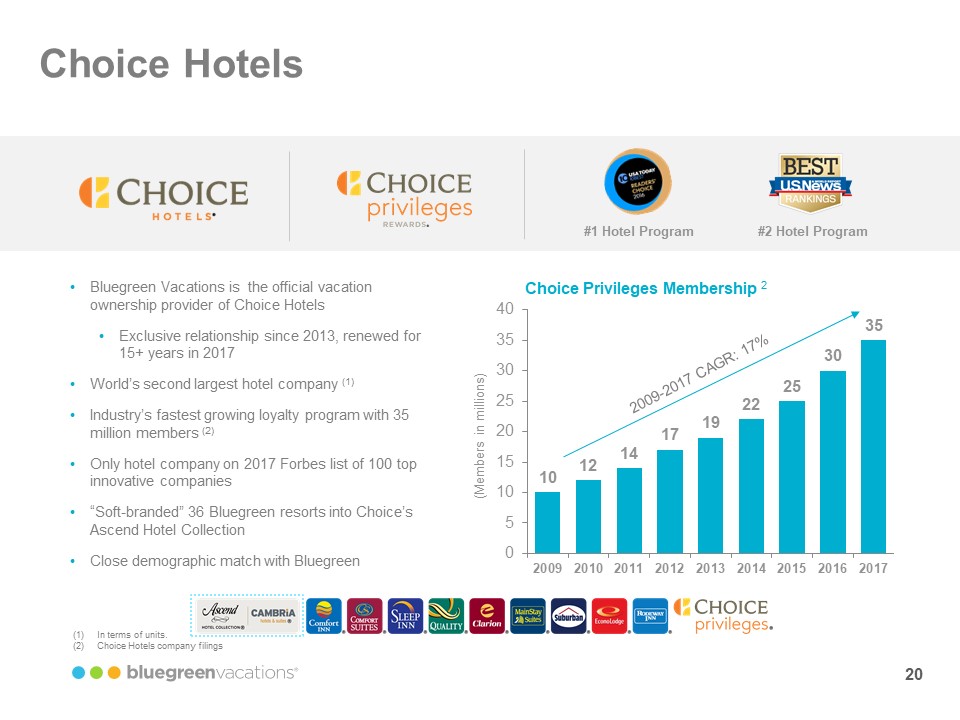
Choice Hotels Choice Hotels Choice privileges Rewards #1 Hotel Program Best US News Rankings #2 Hotel Program •Bluegreen Vacations is the official vacation ownership provider of Choice Hotels •Exclusive relationship since 2013, renewed for 15+ years in 2017 •World’s second largest hotel company (1) •Industry’s fastest growing loyalty program with 35 million members (2) •Only hotel company on 2017 Forbes list of 100 top innovative companies •“Soft-branded” 36 Bluegreen resorts into Choice’s Ascend Hotel Collection •Close demographic match with Bluegreen Choice Privileges Membership 2 2009-2017 CAGR: 17$ 10 12 14 17 19 22 25 30 35 0 5 10 15 20 25 30 35 40 2009 2010 2011 2012 2013 2014 2015 2016 2017 (Members in millions) (1) In terms of units. (2) Choice Hotels company filings bluegreenvacations 20
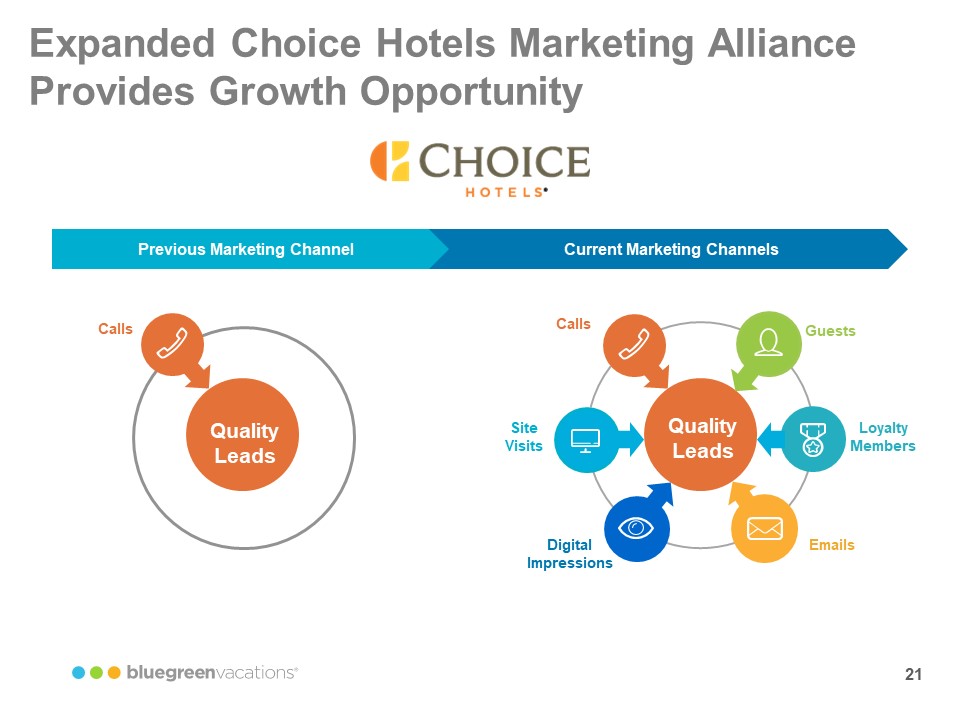
Expanded Choice Hotels Marketing Alliance Provides Growth Opportunity Choice Hotels Previous Marketing Channel Current Marketing Channels Quality Leads Calls Quality Leads Guests Loyalty Members Emails Digital Impressions Site Visits Calls bluegreenvacations 21
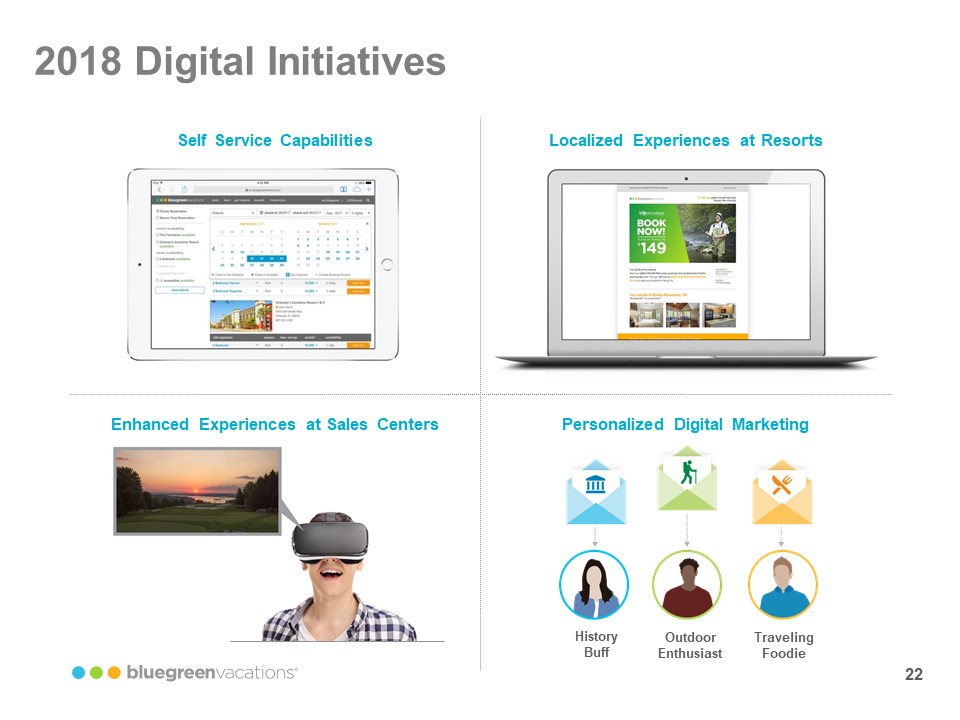
2018 Digital Initiatives Self Service Capabilities Localized Experiences at Resorts Enhanced Experiences at Sales Centers Personalized Digital Marketing History Buff Outdoor Enthusiast Traveling Foodie bluegreenvacations 22
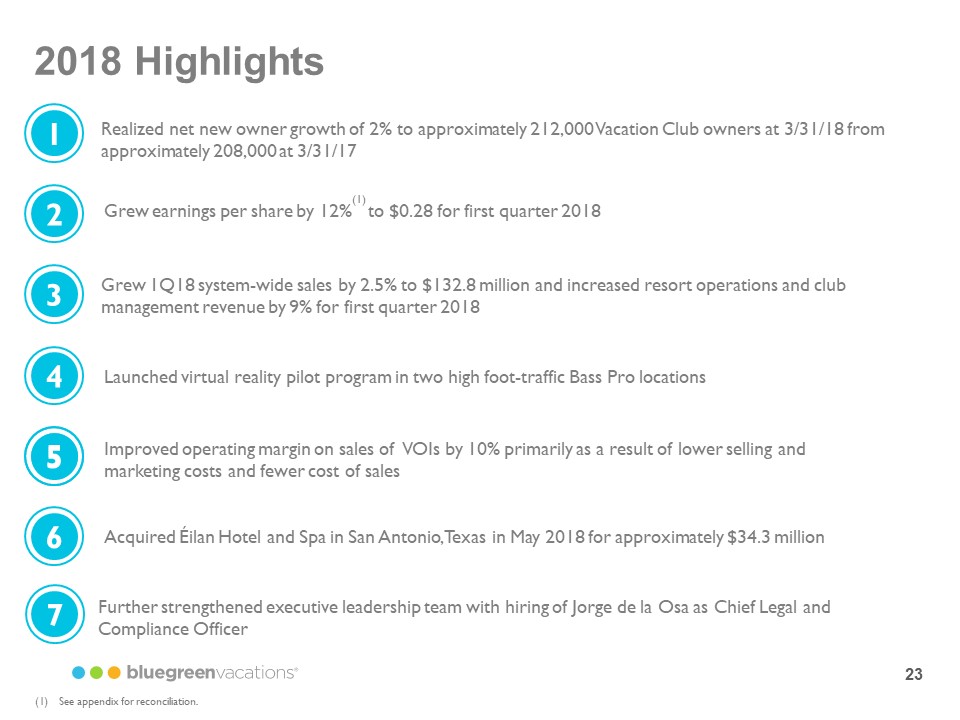
2018 Highlights 1 Realized net new owner growth of 2% to approximately 212,000 Vacation Club owners at 3/31/18 from approximately 208,000 at 3/31/17 2 Grew earnings per share by 12% (1) to $0.28 for first quarter 2018 3 Grew 1Q18 system-wide sales by 2.5% to $132.8 million and increased resort operations and club management revenue by 9% for first quarter 2018 4 Launched virtual reality pilot program in two high foot-traffic Bass Pro locations 5 Improved operating margin on sales of VOIs by 10% primarily as a result of lower selling and marketing costs and fewer cost of sales 6 Acquired Éilan Hotel and Spa in San Antonio, Texas in May 2018 for approximately $34.3 million 7 Further strengthened executive leadership team with hiring of Jorge de la Osa as Chief Legal and Compliance Officer (1)See appendix for reconciliation. bluegreenvacations 23
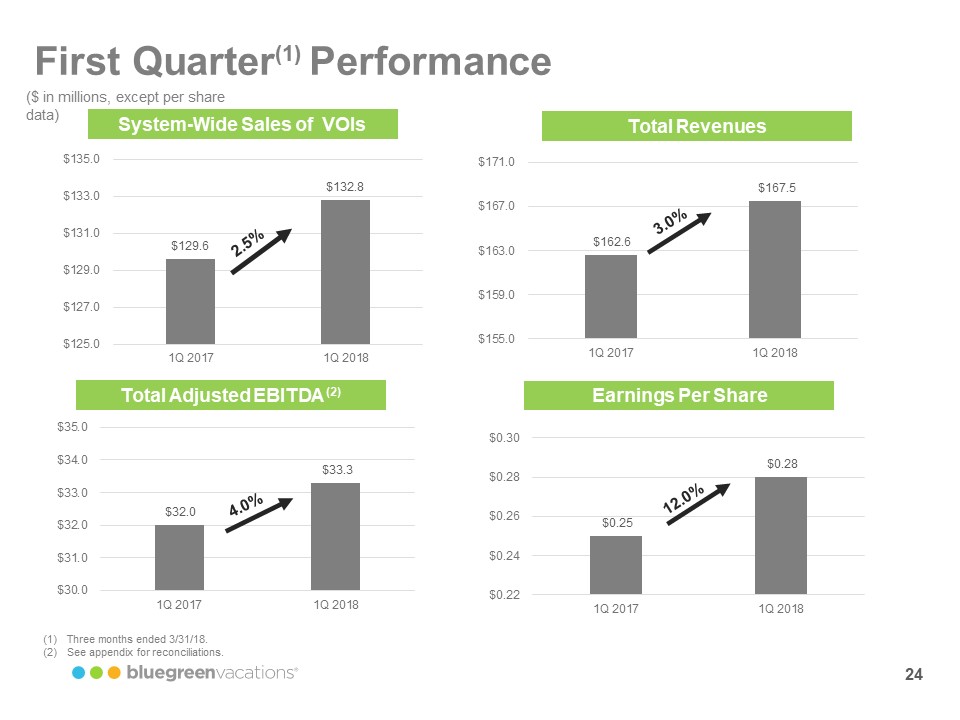
First Quarter(1) Performance ($ in millions, except per share data ) System-Wide Sales of VOIs ( $129.6 1Q 2017 2.5% $132.8 1Q 2018 $125.0 $127.0 $129.0 $131.0 $133.0 $135.0 Total Revenues $162.6 1Q 2017 3.0% $167.5 1Q 2018 $155.0 $159.0 $163.0 $167.0 $171.0 Total Adjusted EBITDA (2) $32.0 1Q 2017 4.0% $33.3 1Q 2018 $30.0 $31.0 $32.0 $33.0 $34.0 $35.0 Earnings Per Share $0.25 1Q 2017 12.0% $0.28 1Q 2018 $0.22 $0.24 $0.26 $0.28 $0.30 1Q 2017 1Q 2018 1) Three months ended 3/31/18. (2) See appendix for reconciliations. bluegreenvacations 24
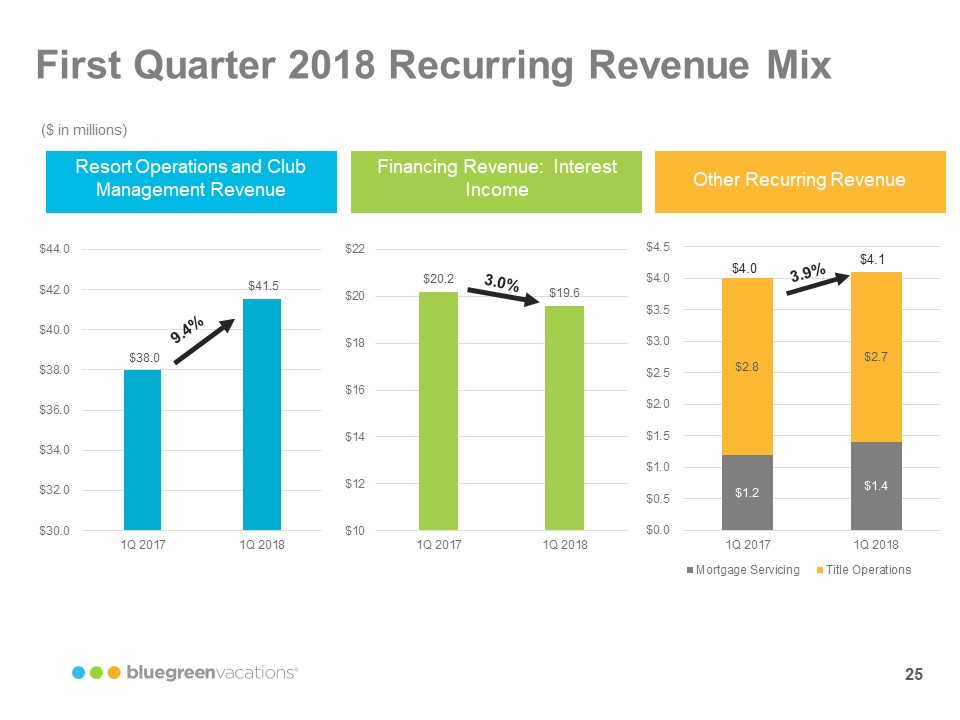
First Quarter 2018 Recurring Revenue Mix($ in millions) Resort Operations and Club Management Revenue $38.0 1Q 2017 9.4% $41.5 1Q 2018 $30.0 $32.0 $34.0 $36.0 $38.0 $40.0 $42.0 $44.0 Financing Revenue: Interest Income $20.2 1Q 2017 3.0% $19.6 1Q 2018 $10 $12 $14 $16 $18 $20 $22 Other Recurring Revenue $4.0 $2.8 $1.2 1Q 2017 3.9% $4.1 $2.7 $1.4 1Q 2018 $0.0 $0.5 $1.0 $1.5 $2.0 $2.5 $3.0 $3.5 $4.0 $4.5 Mortgage Servicing Title Operations bluegreenvacations 25
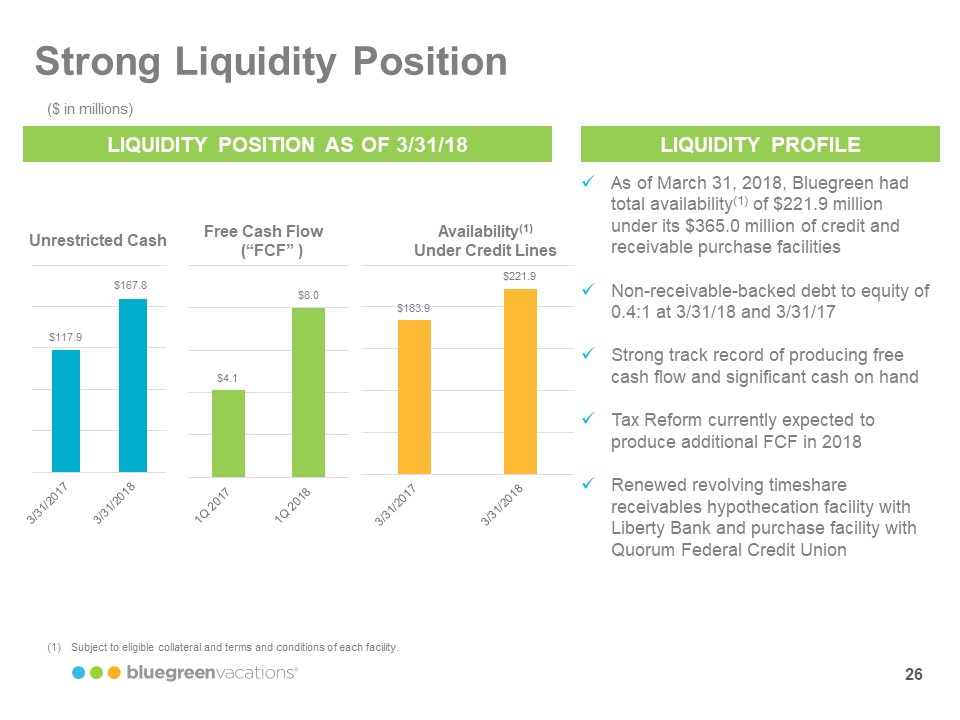
Strong Liquidity Position ($ in millions). LIQUIDITY POSITION AS OF 3/31/18 Unrestricted Cash $117.9 3/31/2017 $167.8 3/31/2018 Free Cash Flow (“FCF”) $4.1 1Q 2017 $8.0 1Q 2018 Availability (1) Under Credit Lines $183.9 3/31/2017 $221.9 3/31/2018 LIQUIDITY PROFILE As of March 31, 2018, Bluegreen had total availability(1)of $221.9 million under its $365.0 million of credit and receivable purchase facilities .Non-receivable-backed debt to equity of 0.4:1 at 3/31/18 and 3/31/17 .Strong track record of producing free cash flow and significant cash on hand .Tax Reform currently expected to produce additional FCF in 2018 .Renewed revolving timeshare receivables hypothecation facility with Liberty Bank and purchase facility with Quorum Federal Credit Union (1)Subject to eligible collateral and terms and conditions of each facility bluegreenvacations 26
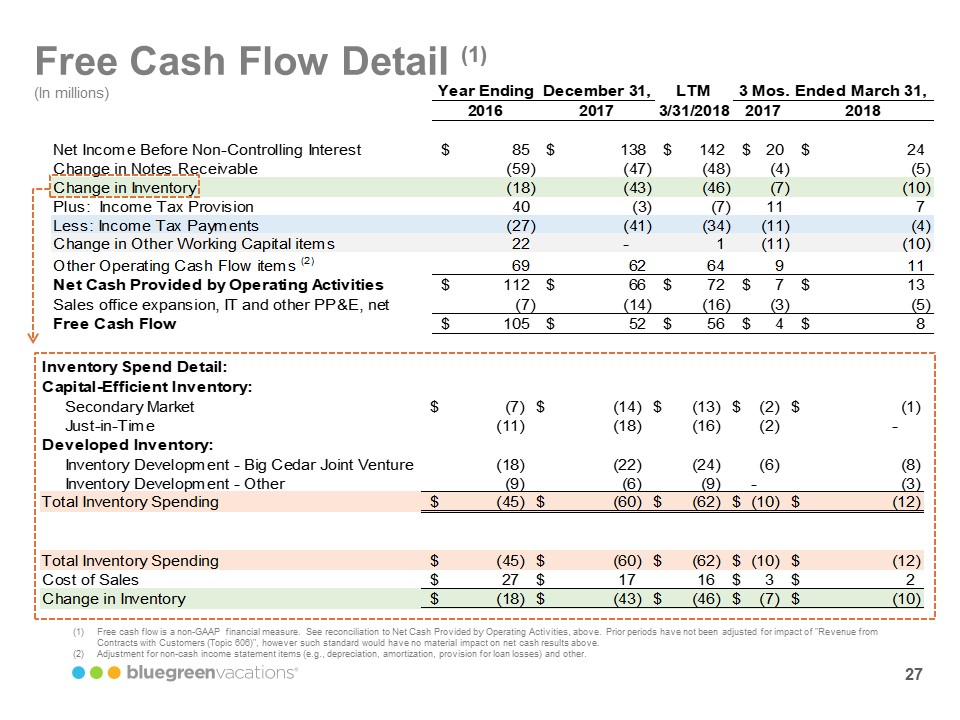
Free Cash Flow Detail (1) (In millions) Year Ending 2016 December 31, 2017 LTM 3/31.2018 3 Mos. 2017 Ended March 31,2018 Net Income Before Non-Controlling Interest 85$ 138$ 142$ 20$ 24$ Change in Notes Receivable (59) (47) (48) (4) (5) Change in Inventory (18) (43) (46) (7) (10) Plus: Income Tax Provision 40 (3) (7) 11 7 Less: Income Tax Payments (27) (41) (34) (11) (4) Change in Other Working Capital items 22 - 1 (11) (10) Other Operating Cash Flow items (2) 69 62 64 9 11 Net Cash Provided by Operating Activities $112 $66 $72 $7 $13 Sales office expansion, IT and other PP&E, net (7) (14) (16) (3) (5) Free Cash Flow $105 $52 $56 $4 $8 (In millions) Inventory Spend Detail: Capital-Efficient Inventory: Secondary Market ($7) ($14) ($13) ($2) ($1) Just-in-Time (11) (18) (16) (2) - Developed Inventory: Inventory Development - Big Cedar Joint Venture (18) (22) (24) (6) (8) Inventory Development – Other (9) (6) (9) - (3) Total Inventory Spending ($45) ($60) ($62) ($10) ($12) Total Inventory Spending ($45) ($60) ($62) ($10) ($12) Cost of Sales $27 $17 $16 $3 $2 Change in Inventory ($18) ($43) ($46) ($7) ($10) (1) Free cash flow is a non-GAAP financial measure. See reconciliation to Net Cash Provided by Operating Activities, above. Prior periods have not been adjusted for impact of "Revenue from Contracts with Customers (Topic 606)", however such standard would have no material impact on net cash results above. (2)Adjustment for non-cash income statement items (e.g., depreciation, amortization, provision for loan losses) and other. bluegreenvacations 27
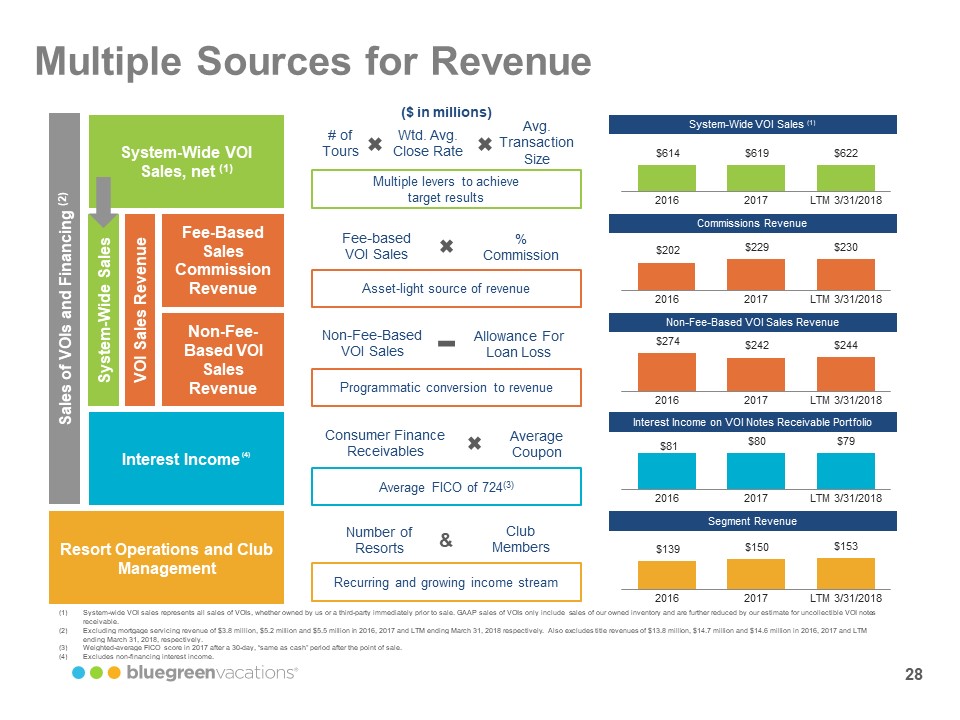
Multiple Sources for Revenue Sales of VOIs and Financing (2) System-Wide VOI Sales, net (1) System-Wide Sales VOI Sales Revenue Fee-Based Sales Commission Revenue Non-Fee-Based VOI Sales Revenue Interest Income (4) Resort Operations and Club Management ($ in millions) # of Tours X Wtd. Avg. Close Rate X Avg. Transaction Size Multiple levers to achieve target results Fee-based VOI Sales X % Commission Asset-light source of revenue Non-Fee-Based VOI Sales – Allowance For Loan Loss Programmatic conversion of revenue Consumer Finance Receivables X Average Coupon Average FICO of 724 (3) Number of Resorts & Club Members Recurring and growing income stream System-Wide VOI Sales (1) $614 2016 $619 2017 $622 LTM 3/31/2018 Commissions Revenue $202 2016 $229 2017 $230 LTM 3/31/2018 Non-Fee-Based VOI Sales Revenue $274 2016 $242 2017 $244 LTM 3/31/2018 Interest Income on VOI Notes Receivable Portfolio $81 2016 $80 2017 $79 LTM 3/31/2018 Segment Revenue $139 2016 $150 2017 $153 LTM 3/31/2018 (1) System-wide VOI sales represents all sales of VOIs, whether owned by us or a third-party immediately prior to sale. GAAP sales of VOIs only include sales of our owned inventory and are further reduced by our estimate for uncollectible VOI notes receivable. (2) Excluding mortgage servicing revenue of $3.8 million, $5.2 million and $5.5 million in 2016, 2017 and LTM ending March 31, 2018 respectively. Also excludes title revenues of $13.8 million, $14.7 million and $14.6 million in 2016, 2017 and LTM ending March 31, 2018, respectively. (3) Weighted-average FICO score in 2017 after a 30-day, “same as cash” period after the point of sale. (4) Excludes non-financing interest income. bluegreenvacations 28
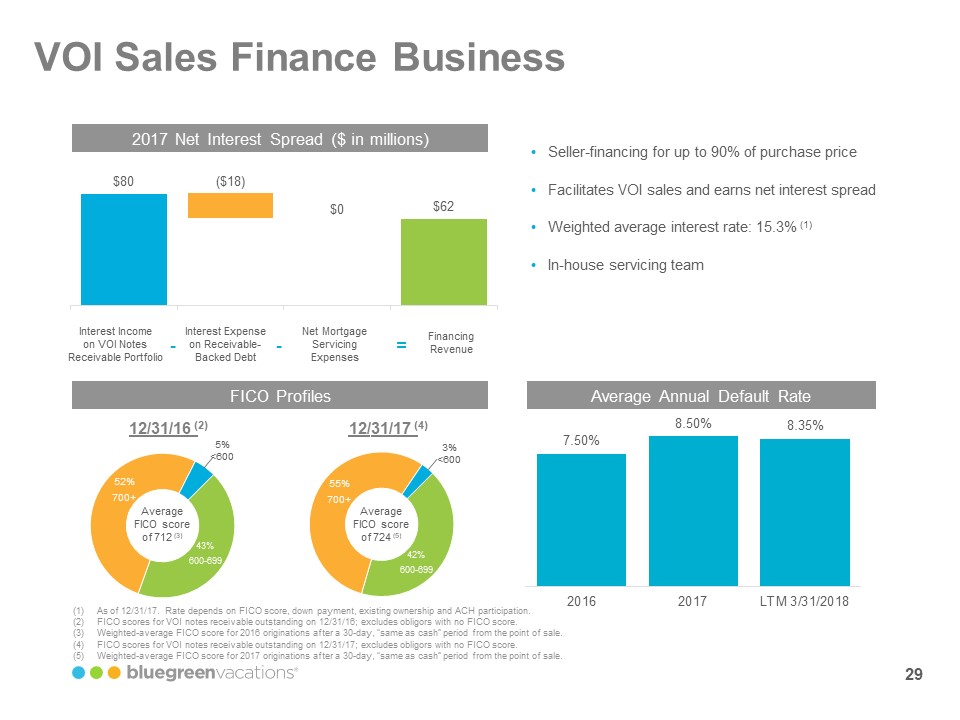
VOI Sales Finance Business 2017 Net Interest Spread ($ in millions) $80 Interest Income on VOI Notes Receivable Portfolio ($18) Interest Expense on Receivable- Backed Debt $0 Net Mortgage Servicing Expenses $62 Financing Revenue •Seller-financing for up to 90% of purchase price •Facilitates VOI sales and earns net interest spread •Weighted average interest rate: 15.3%(1) •In-house servicing team FICO Profiles 12/31/16 (2) Average FICO score of 712 (3) 5% <600 43% 600-699 52% 700+ 12/31/17 (4) 3% <600 42% 600-99 55% 700+ Average FICO score of 724 (5) Average Annual Default Rate 7.50% 2016 8.50% 2017 8.35% LTM 3/31/2018 (1) As of 12/31/17. Rate depends on FICO score, down payment, existing ownership and ACH participation. (2) FICO scores for VOI notes receivable outstanding on 12/31/16; excludes obligors with no FICO score. (3) Weighted-average FICO score for 2016 originations after a 30-day, “same as cash” period from the point of sale. (4) FICO scores for VOI notes receivable outstanding on 12/31/17; excludes obligors with no FICO score. (5) Weighted-average FICO score for 2017 originations after a 30-day, “same as cash” period from the point of sale bluegreenvacations 29
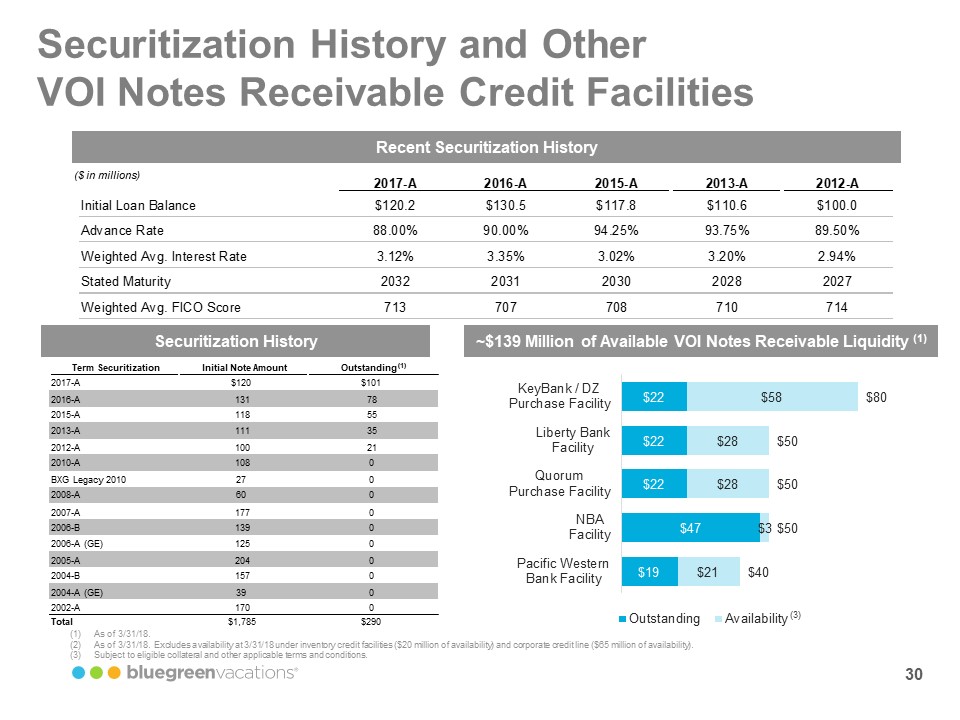
Securitization History and Other VOI Notes Receivable Credit Facilities Recent Securitization History ($ in millions) 2017-A 2016-A 2015-A 2013-A 2012-A Initial Loan Balance $120.2 $130.5 $117.8 $110.6 $100.0 Advance Rate 88.00% 90.00% 94.25% 93.75% 89.50% Weighted Avg. Interest Rate 3.12% 3.35% 3.02% 3.20% 2.94% Stated Maturity 2032 2031 2030 2028 2027 Weighted Avg. FICO Score 713 707 708 710 714 Securitization History Term Securitization Initial Note Amount Outstanding (1) 2017-A $120 $101 2016-A 131 78 2015-A 118 55 2013-A 111 35 2012-A 100 21 2010-A 108 0 BXG Legacy 2010 27 0 2008-A 60 0 2007-A 177 0 2006-B 139 0 2006-A (GE) 125 0 2005-A 204 0 2004-B 157 0 2004-A (GE) 39 0 2002-A 170 0 Total $1,785 $290 ~$139 Million of Available VOI Notes Receivable Liquidity (1) KeyBank/ DZ Purchase Facility $22 $58 $80 Liberty Bank Facility $22 $28 $50 Quorum Purchase Facility $22 $28 $50 NBA Facility $47 $3 $50 Pacific Western Bank Facility $19 $21 $40 Outstanding Availability (1)As of 3/31/18. (2)As of 3/31/18. Excludes availability at 3/31/18 under inventory credit facilities ($20 million of availability) and corporate credit line ($65 million of availability). (3)Subject to eligible collateral and other applicable terms and conditions. Bluegreen vacations 30
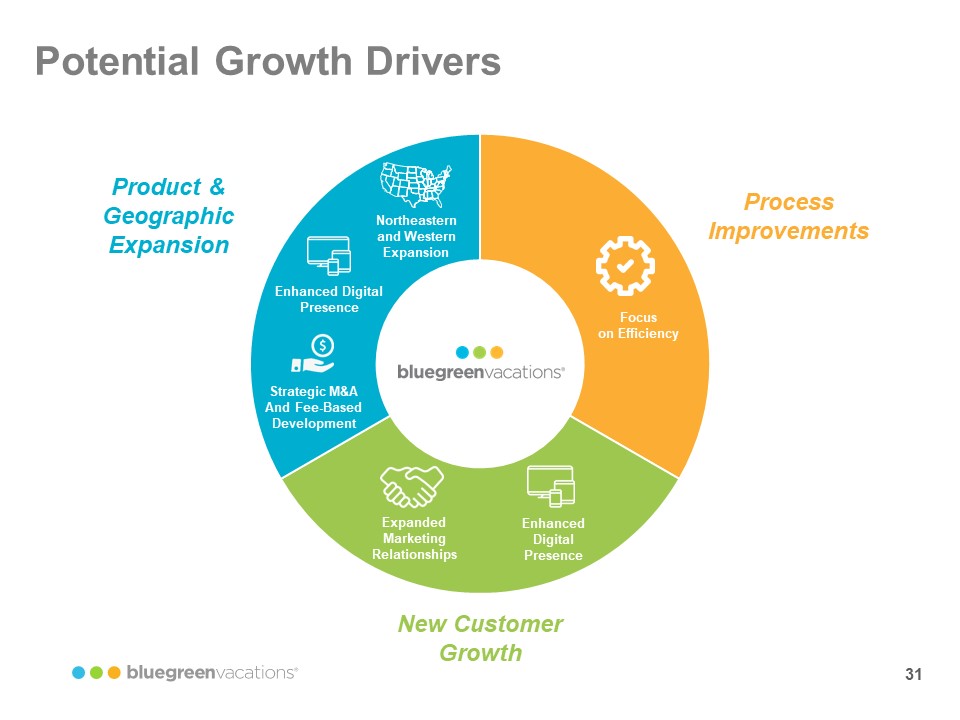
Potential Growth Drivers Product & Geographic Expansion Northeastern and Western Expansion Enhanced Digital Presence Strategic M&A And Fee-Based Development New Customer Growth Expanded Marketing Relationship Enhanced Digital Presence Process Improvements Focus on Efficiency bluegreenvacations 31
APPENDIX The Club at Big Bear Village Big Bear Lake, California 32
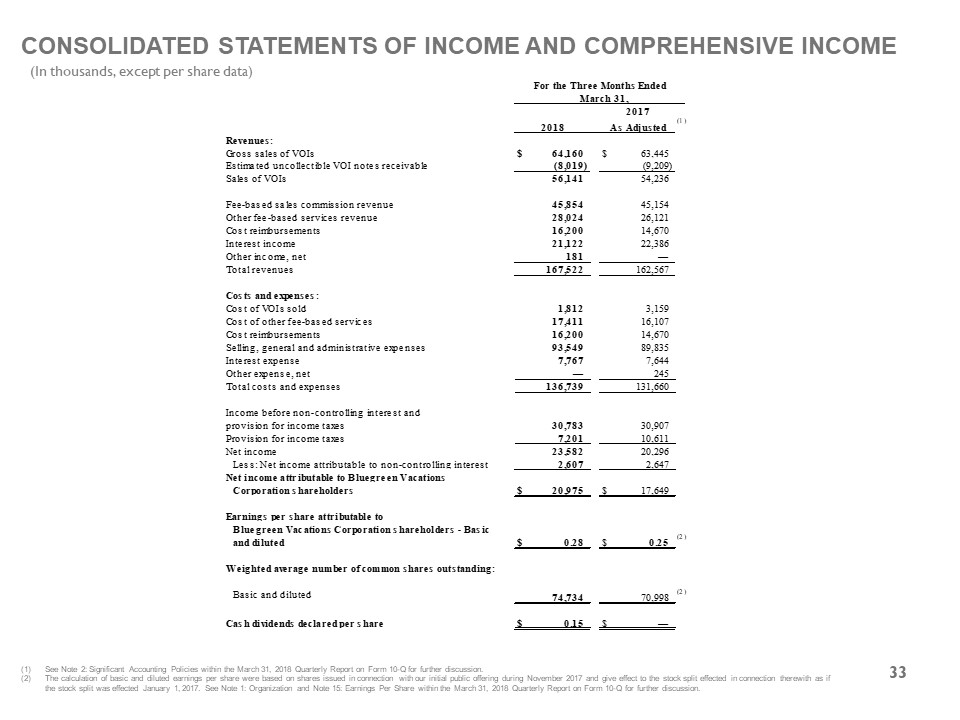
CONSOLIDATED STATEMENTS OF INCOME AND COMPREHENSIVE INCOME (In thousands, except per share data) For the Three Months Ended March 31, 2017 2018 As Adjusted Revenues: Gross sales of VOIs $64,160 $63,445 Estimated uncollectible VOI notes receivable (8,019) (9,209) Sales of VOIs 56,141 54,236 Fee-based sales commission revenue 45,854 45,154 Other fee-based services revenue 28,024 26,121 Cost reimbursements 16,200 14,670 Interest income 21,122 22,386 Other income, net 181 — Total revenues 167,522 162,567 Costs and expenses: Cost of VOIs sold 1,812 3,159 Cost of other fee-based services 17,411 16,107 Cost reimbursements 16,200 14,670 Selling, general and administrative expenses 93,549 89,835 Interest expense 7,767 7,644 Other expense, net— 245 Total costs and expenses 136,739 131,660 Income before non-controlling interest and provision for income taxes 30,783 30,907 Provision for income taxes 7,201 10,611 Net income 23,582 20,296 Less: Net income attributable to non-controlling interest 2,607 2,647 Net income attributable to Bluegreen Vacations Corporation shareholders $20,975 $17,649 Earnings per share attributable to Bluegreen Vacations Corporation shareholders - Basic and diluted $0.28 $0.25 (2) Weighted average number of common shares outstanding: Basic and diluted 74,734 70,998 (2) Cash dividends declared per share $0.15 $— (1) See Note 2: Significant Accounting Policies within the March 31, 2018 Quarterly Report on Form 10-Q for further discussion. (2) The calculation of basic and diluted earnings per share were based on shares issued in connection with our initial public offering during November 2017 and give effect to the stock split effected in connection therewith as if the stock split was effected January 1, 2017. See Note 1: Organization and Note 15: Earnings Per Share within the March 31, 2018 Quarterly Report on Form 10-Q for further discussion. bluegreenvacations 33
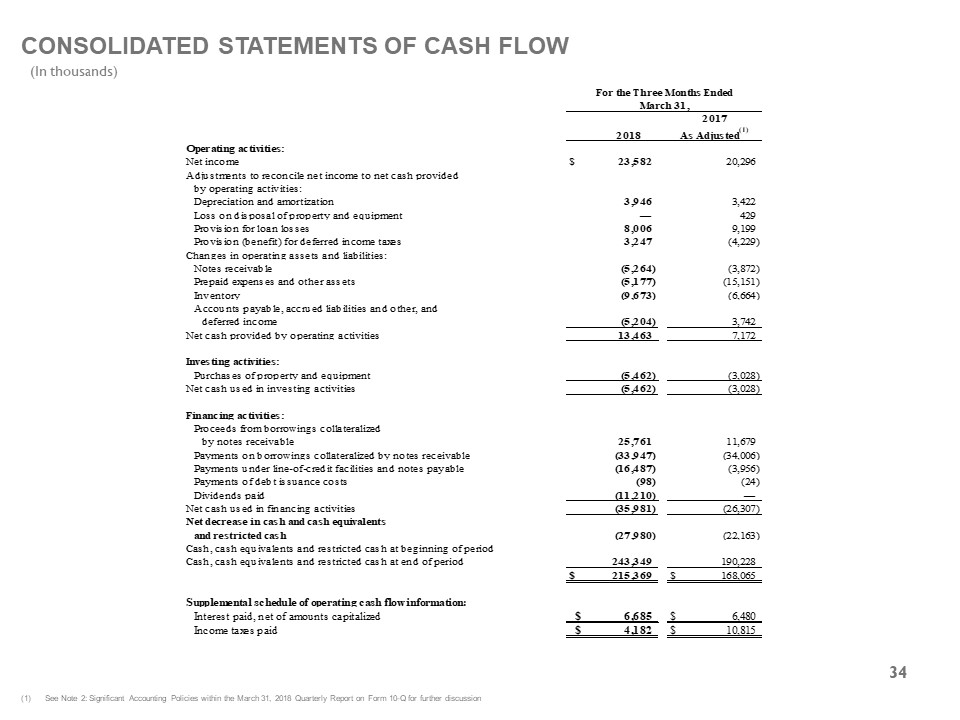
CONSOLIDATED STATEMENTS OF CASH FLOW (In thousands) For the Three Months Ended March 31, 2017 2018 As Adjusted (1) Operating activities: Net income $23,582 20,296 Adjustments to reconcile net income to net cash provided by operating activities: Depreciation and amortization 3,946 3,422 Loss on disposal of property and equipment — 429 Provision for loan losses 8,006 9,199 Provision (benefit) for deferred income taxes 3,247 (4,229) Changes in operating assets and liabilities: Notes receivable (5,264) (3,872) Prepaid expenses and other assets (5,177) (15,151) Inventory (9,673) (6,664) Accounts payable, accrued liabilities and other, and deferred income (5,204) 3,742 Net cash provided by operating activities 13,463 7,172 Investing activities: Purchases of property and equipment (5,462) (3,028) Net cash used in investing activities (5,462) (3,028) Financing activities: Proceeds from borrowings collateralized by notes receivable 25,761 11,679 Payments on borrowings collateralized by notes receivable (33,947) (34,006) Payments under line-of-credit facilities and notes payable(16,487) (3,956) Payments of debt issuance costs (98) (24) Dividends paid(11,210) — Net cash used in financing activities (35,981) (26,307) Net decrease in cash and cash equivalents and restricted cash(27,980) (22,163) Cash, cash equivalents and restricted cash at beginning of period Cash, cash equivalents and restricted cash at end of period 243,349 190,228 $215,369 $168,065 Supplemental schedule of operating cash flow information: Interest paid, net of amounts capitalized $6,685 $6,480 Income taxes paid $4,182 $10,815 (1)See Note 2: Significant Accounting Policies within the March 31, 2018 Quarterly Report on Form 10-Q for further discussion 34
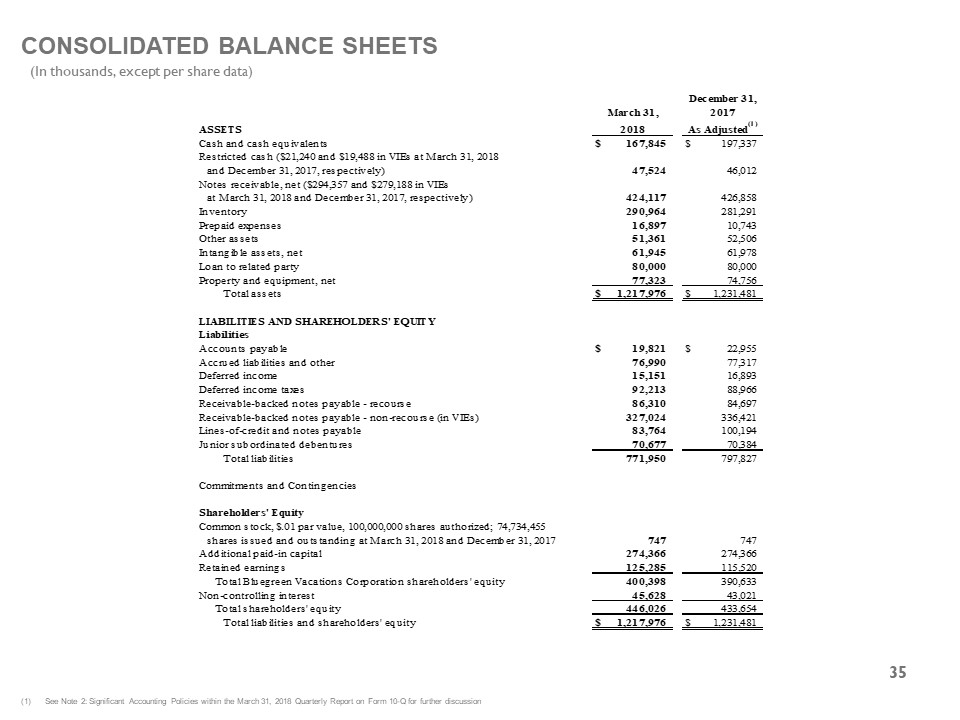
CONSOLIDATED BALANCE SHEETS (In thousands, except per share data) March 31, 2018 December 31, 2017 As Adjusted (1) ASSETS Cash and cash equivalents $167,845 $197,337 Restricted cash ($21,240 and $19,488 in VIEs at March 31, 2018 and December 31, 2017, respectively) 47,524 46,012 Notes receivable, net ($294,357 and $279,188 in VIEs at March 31, 2018 and December 31, 2017, respectively) 424,117 426,858 Inventory 290,964 281,291 Prepaid expenses 16,897 10,743 Other assets 51,361 52,506 Intangible assets, net 61,945 61,978 Loan to related party 80,000 80,000 Property and equipment, net 77,323 74,756 Total assets $1,217,976 $1,231,481 LIABILITIES AND SHAREHOLDERS' EQUITY Liabilities Accounts payable $19,821 $22,955 Accrued liabilities and other 76,990 77,317 Deferred income 15,151 16,893 Deferred income taxes 92,213 88,966 Receivable-backed notes payable - recourse 86,310 84,697 Receivable-backed notes payable - non-recourse (in VIEs) 327,024 336,421 Lines-of-credit and notes payable 83,764 100,194 Junior subordinated debentures 70,677 70,384 Total liabilities 771,950 797,827 Commitments and Contingencies Shareholders' Equity Common stock, $.01 par value, 100,000,000 shares authorized; 74,734,455 shares issued and outstanding at March 31, 2018 and December 31, 2017747 747 Additional paid-in capital 274,366 274,366 Retained earnings 125,285 115,520 Total Bluegreen Vacations Corporation shareholders' equity 400,398 390,633 Non-controlling interest 45,628 43,021 Total shareholders' equity 446,026 433,654 Total liabilities and shareholders' equity $1,217,976 $1,231,481 (1)See Note 2: Significant Accounting Policies within the March 31, 2018 Quarterly Report on Form 10-Q for further discussion bluegreenvacations 35
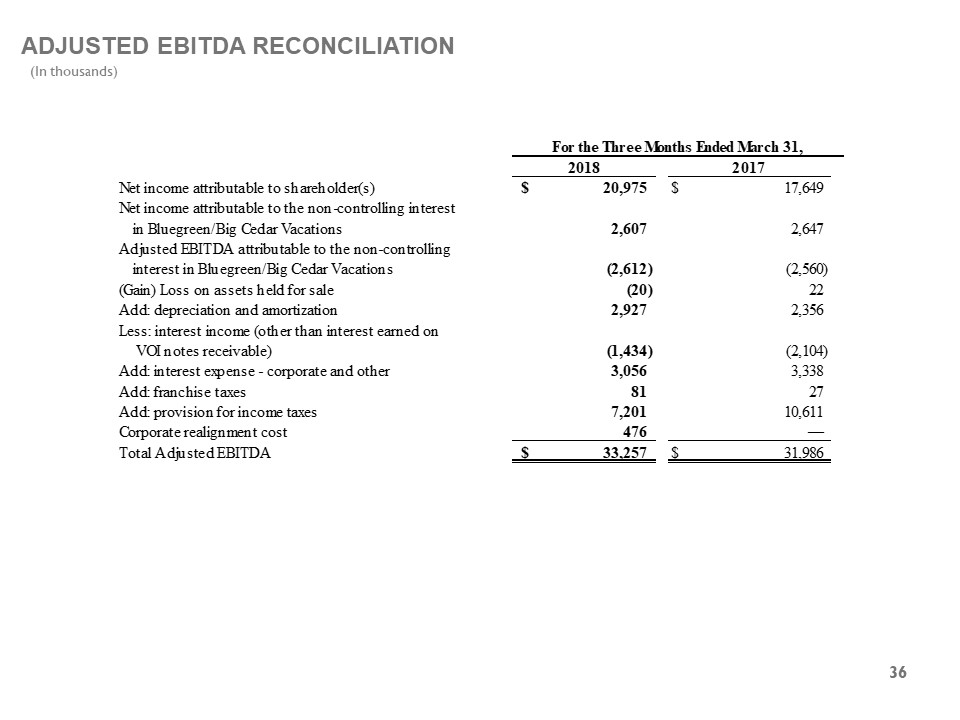
ADJUSTED EBITDA RECONCILIATION (In thousands) For the Three Months Ended March 31, 2018 2017 Net income attributable to shareholder(s) 20,975$ $17,649 Net income attributable to the non-controlling interest in Bluegreen/Big Cedar Vacations 2,607 2,647 Adjusted EBITDA attributable to the non-controlling interest in Bluegreen/Big Cedar Vacations (2,612) (2,560) (Gain) Loss on assets held for sale(20) 22 Add: depreciation and amortization 2,927 2,356 Less: interest income (other than interest earned on VOI notes receivable)(1,434) (2,104) Add: interest expense - corporate and other 3,056 3,338 Add: franchise taxes 81 27 Add: provision for income taxes 7,201 10,611 Corporate realignment cost 476 — Total Adjusted EBITDA 33,257$ $31,986 36
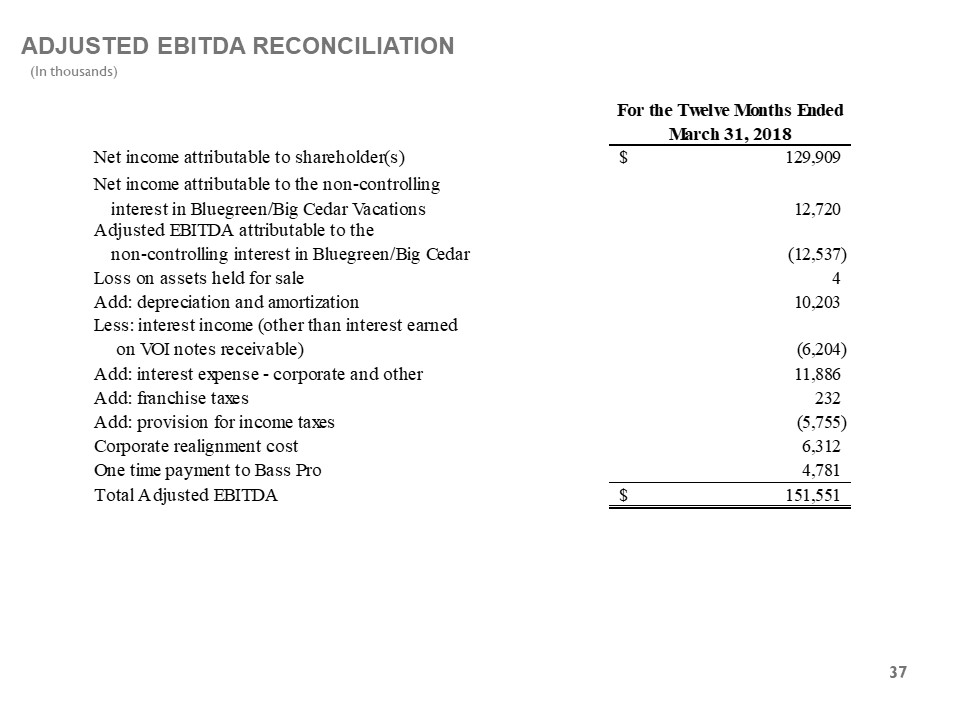
ADJUSTED EBITDA RECONCILIATION (In thousands) For the Twelve Months Ended March 31, 2018 Net income attributable to shareholder(s)129,909$ Net income attributable to the non-controlling interest in Bluegreen/Big Cedar Vacations 12,720 Adjusted EBITDA attributable to the non-controlling interest in Bluegreen/Big Cedar (12,537) Loss on assets held for sale 4 Add: depreciation and amortization 10,203 Less: interest income (other than interest earned on VOI notes receivable)(6,204) Add: interest expense - corporate and other 11,886 Add: franchise taxes 232 Add: provision for income taxes(5,755) Corporate realignment cost 6,312 One time payment to Bass Pro 4,781 Total Adjusted EBITDA 151,551 37
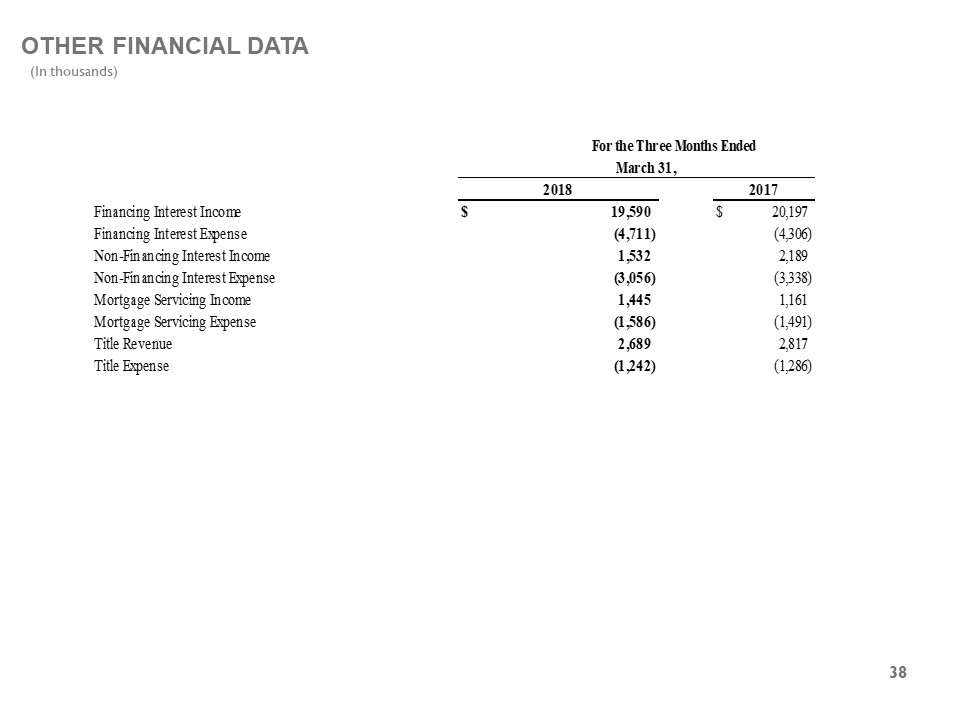
OTHER FINANCIAL DATA (In thousands) For the Three Months Ended March 31, 2018 2017 Financing Interest Income $19,590 $20,197 Financing Interest Expense (4,711) (4,306) Non-Financing Interest Income 1,532 2,189 Non-Financing Interest Expense(3,056) (3,338) Mortgage Servicing Income 1,445 1,161 Mortgage Servicing Expense(1,586) (1,491) Title Revenue 2,689 2,817 Title Expense(1,242) (1,286) 38