Attached files
| file | filename |
|---|---|
| EX-99.2 - EXHIBIT 99.2 - Avaya Holdings Corp. | ex992avayaq2fy18cfocomme.htm |
| EX-99.1 - EXHIBIT 99.1 - Avaya Holdings Corp. | ex991avayaq2fy18errevfin.htm |
| 8-K - 8-K - Avaya Holdings Corp. | form8-k_may102018xq2fy2018.htm |
TEXT 0 – 0 – 0 204-0-0 127-127-127 17-114-210 80-200-74 86-183-242 247-150-70 Q2 FISCAL YEAR 2018 FINANCIAL RESULTS MAY 10, 2018 © 2018 Avaya Inc. All rights reserved 1
TEXT 0 – 0 – 0 204-0-0 127-127-127 17-114-210 80-200-74 86-183-242 247-150-70 FORWARD LOOKING STATEMENTS Cautionary Note Regarding Forward-Looking Statements This document contains certain “forward-looking statements.” All statements other than statements of historical fact are “forward- looking” statements for purposes of the U.S. federal and state securities laws. These statements may be identified by the use of forward looking terminology such as "anticipate," "believe," "continue," "could," "estimate," "expect," "intend," "may," "might," “our vision,” "plan," "potential," "preliminary," "predict," "should," "will," or “would” or the negative thereof or other variations thereof or comparable terminology and include, but are not limited to, the outlook for the third quarter and fiscal year 2018. The company has based these forward-looking statements on its current expectations, assumptions, estimates and projections. While the company believes these expectations, assumptions, estimates and projections are reasonable, such forward-looking statements are only predictions and involve known and unknown risks and uncertainties, many of which are beyond its control. These factors are discussed in Amendment No. 3 to the company’s Registration Statement on Form 10 filed with the Securities and Exchange Commission (the “SEC”), and may cause its actual results, performance or achievements to differ materially from any future results, performance or achievements expressed or implied by these forward-looking statements. For a further list and description of such risks and uncertainties, please refer to the company’s filings with the SEC that are available at www.sec.gov. The company cautions you that the list of important factors included in the company’s SEC filings may not contain all of the material factors that are important to you. In addition, in light of these risks and uncertainties, the matters referred to in the forward-looking statements contained in this report may not in fact occur. The company undertakes no obligation to publicly update or revise any forward-looking statement as a result of new information, future events or otherwise, except as otherwise required by law. This presentation should be read in conjunction with our second quarter fiscal 2018 earnings press release posted on May 10, 2018. Within this presentation, we refer to certain non‐GAAP financial measures that involve adjustments to GAAP measures. Reconciliations between our non-GAAP financial measures and GAAP financial measures are included on the last three slides of this presentation. These slides, as well as current and historical financial data are available on our web site at investors.avaya.com None of the information included on the website is incorporated by reference in this presentation. © 2018 Avaya Inc. All rights reserved 2
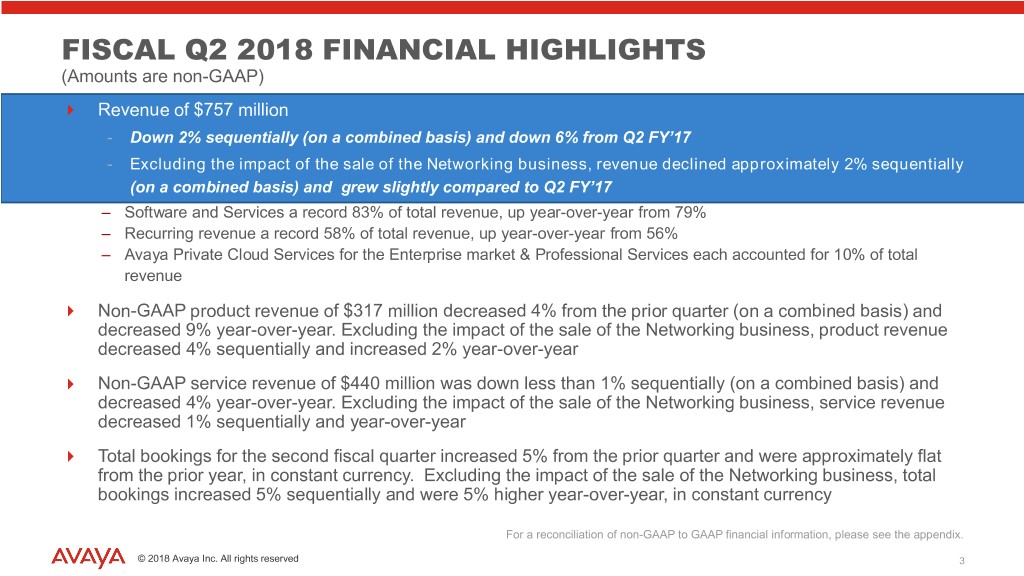
TEXT 0 – 0 – 0 204-0-0 127-127-127 17-114-210 80-200-74 86-183-242 247-150-70 FISCAL Q2 2018 FINANCIAL HIGHLIGHTS (Amounts are non-GAAP) Revenue of $757 million - Down 2% sequentially (on a combined basis) and down 6% from Q2 FY’17 - Excluding the impact of the sale of the Networking business, revenue declined approximately 2% sequentially (on a combined basis) and grew slightly compared to Q2 FY’17 – Software and Services a record 83% of total revenue, up year-over-year from 79% – Recurring revenue a record 58% of total revenue, up year-over-year from 56% – Avaya Private Cloud Services for the Enterprise market & Professional Services each accounted for 10% of total revenue Non-GAAP product revenue of $317 million decreased 4% from the prior quarter (on a combined basis) and decreased 9% year-over-year. Excluding the impact of the sale of the Networking business, product revenue decreased 4% sequentially and increased 2% year-over-year Non-GAAP service revenue of $440 million was down less than 1% sequentially (on a combined basis) and decreased 4% year-over-year. Excluding the impact of the sale of the Networking business, service revenue decreased 1% sequentially and year-over-year Total bookings for the second fiscal quarter increased 5% from the prior quarter and were approximately flat from the prior year, in constant currency. Excluding the impact of the sale of the Networking business, total bookings increased 5% sequentially and were 5% higher year-over-year, in constant currency For a reconciliation of non-GAAP to GAAP financial information, please see the appendix. © 2018 Avaya Inc. All rights reserved 3
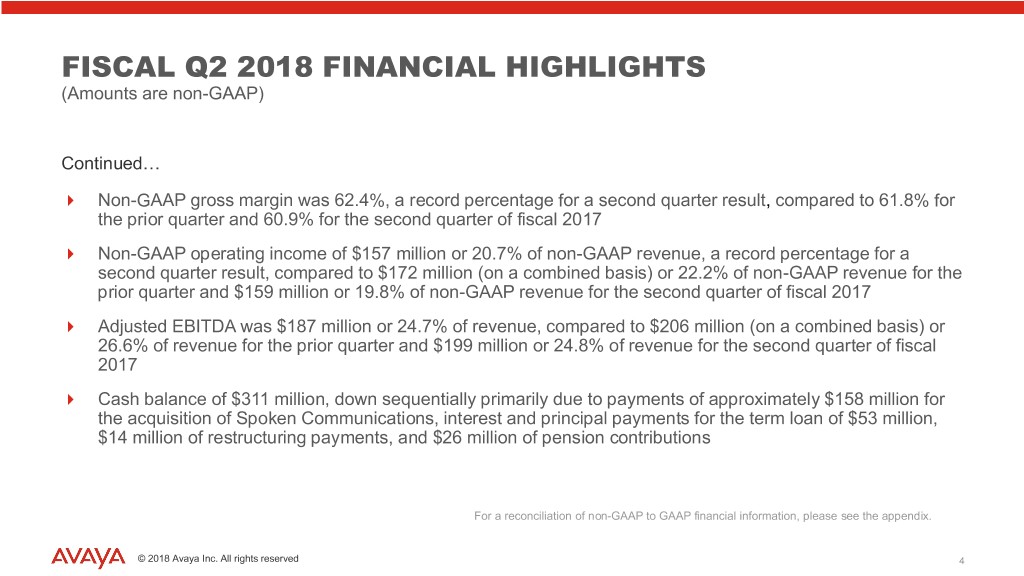
TEXT 0 – 0 – 0 204-0-0 127-127-127 17-114-210 80-200-74 86-183-242 247-150-70 FISCAL Q2 2018 FINANCIAL HIGHLIGHTS (Amounts are non-GAAP) Continued…XXXXXXXXXXXXXXXXXXXXXXXXXXXXXXXXXXXXXXXXXXXXXXXXXXXXXX Non-GAAP gross margin was 62.4%, a record percentage for a second quarter result, compared to 61.8% for the prior quarter and 60.9% for the second quarter of fiscal 2017 Non-GAAP operating income of $157 million or 20.7% of non-GAAP revenue, a record percentage for a second quarter result, compared to $172 million (on a combined basis) or 22.2% of non-GAAP revenue for the prior quarter and $159 million or 19.8% of non-GAAP revenue for the second quarter of fiscal 2017 Adjusted EBITDA was $187 million or 24.7% of revenue, compared to $206 million (on a combined basis) or 26.6% of revenue for the prior quarter and $199 million or 24.8% of revenue for the second quarter of fiscal 2017 Cash balance of $311 million, down sequentially primarily due to payments of approximately $158 million for the acquisition of Spoken Communications, interest and principal payments for the term loan of $53 million, $14 million of restructuring payments, and $26 million of pension contributions For a reconciliation of non-GAAP to GAAP financial information, please see the appendix. © 2018 Avaya Inc. All rights reserved 4
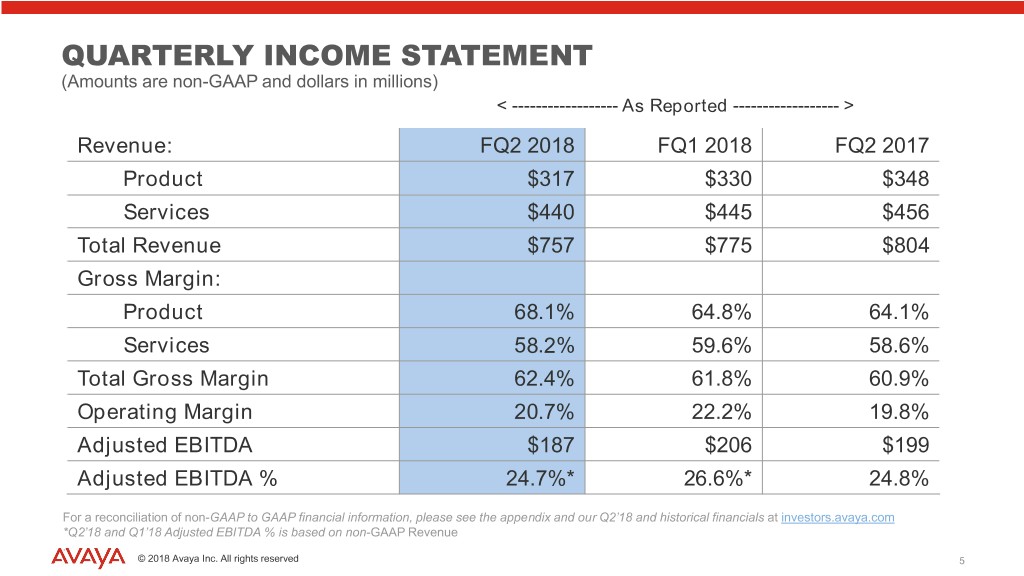
TEXT 0 – 0 – 0 204-0-0 127-127-127 17-114-210 80-200-74 86-183-242 247-150-70 QUARTERLY INCOME STATEMENT (Amounts are non-GAAP and dollars in millions) < ------------------ As Reported ------------------ > Revenue: FQ2 2018 FQ1 2018 FQ2 2017 Product $317 $330 $348 Services $440 $445 $456 Total Revenue $757 $775 $804 Gross Margin: Product 68.1% 64.8% 64.1% Services 58.2% 59.6% 58.6% Total Gross Margin 62.4% 61.8% 60.9% Operating Margin 20.7% 22.2% 19.8% Adjusted EBITDA $187 $206 $199 Adjusted EBITDA % 24.7%* 26.6%* 24.8% For a reconciliation of non-GAAP to GAAP financial information, please see the appendix and our Q2’18 and historical financials at investors.avaya.com *Q2’18 and Q1’18 Adjusted EBITDA % is based on non-GAAP Revenue . © 2018 Avaya Inc. All rights reserved 5
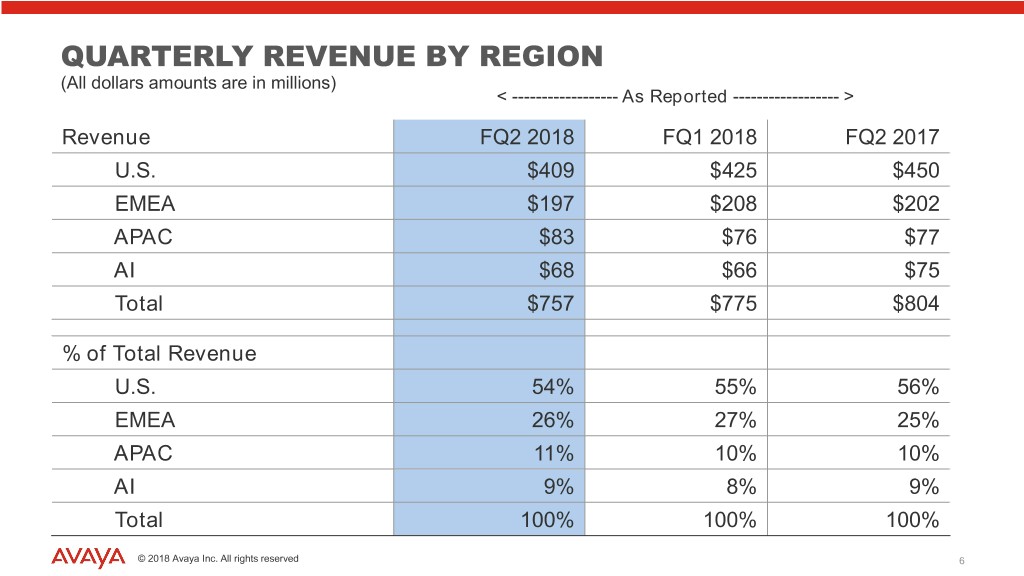
TEXT 0 – 0 – 0 204-0-0 127-127-127 17-114-210 80-200-74 86-183-242 247-150-70 QUARTERLY REVENUE BY REGION (All dollars amounts are in millions) < ------------------ As Reported ------------------ > Revenue FQ2 2018 FQ1 2018 FQ2 2017 U.S. $409 $425 $450 EMEA $197 $208 $202 APAC $83 $76 $77 AI $68 $66 $75 Total $757 $775 $804 % of Total Revenue U.S. 54% 55% 56% EMEA 26% 27% 25% APAC 11% 10% 10% AI 9% 8% 9% Total 100% 100% 100% © 2018 Avaya Inc. All rights reserved 6
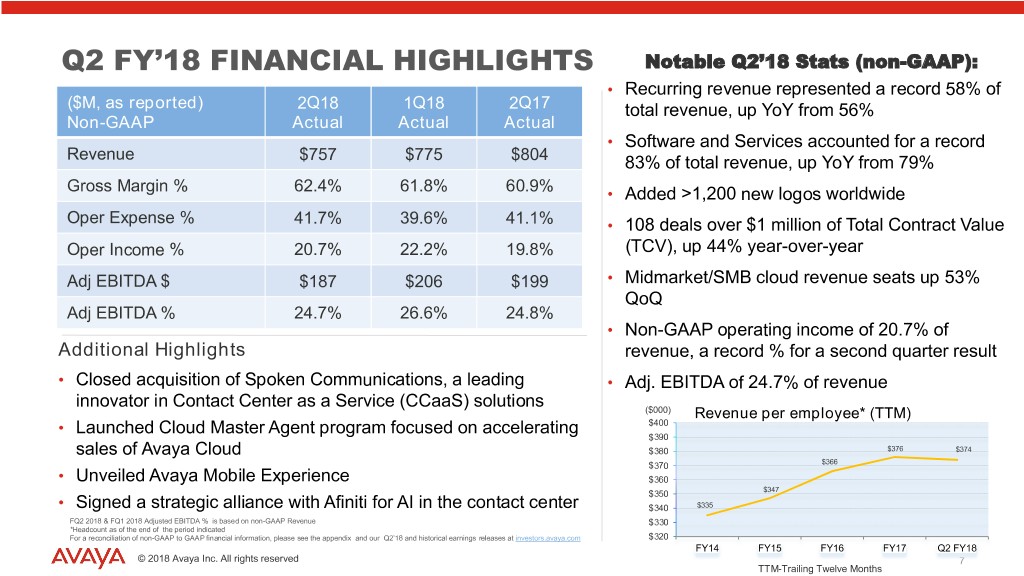
TEXT 0 – 0 – 0 204-0-0 127-127-127 17-114-210 80-200-74 86-183-242 247-150-70 Q2 FY’18 FINANCIAL HIGHLIGHTS Notable Q2’18 Stats (non-GAAP): • Recurring revenue represented a record 58% of ($M, as reported) 2Q18 1Q18 2Q17 total revenue, up YoY from 56% Non-GAAP Actual Actual Actual • Software and Services accounted for a record Revenue $757 $775 $804 83% of total revenue, up YoY from 79% Gross Margin % 62.4% 61.8% 60.9% • Added >1,200 new logos worldwide Oper Expense % 41.7% 39.6% 41.1% • 108 deals over $1 million of Total Contract Value Oper Income % 20.7% 22.2% 19.8% (TCV), up 44% year-over-year Adj EBITDA $ $187 $206 $199 • Midmarket/SMB cloud revenue seats up 53% QoQ Adj EBITDA % 24.7% 26.6% 24.8% • Non-GAAP operating income of 20.7% of Additional Highlights revenue, a record % for a second quarter result • Closed acquisition of Spoken Communications, a leading • Adj. EBITDA of 24.7% of revenue innovator in Contact Center as a Service (CCaaS) solutions ($000) Revenue per employee* (TTM) • Launched Cloud Master Agent program focused on accelerating $400 $390 sales of Avaya Cloud $380 $376 $374 $370 $366 • Unveiled Avaya Mobile Experience $360 $350 $347 • Signed a strategic alliance with Afiniti for AI in the contact center $340 $335 FQ2 2018 & FQ1 2018 Adjusted EBITDA % is based on non-GAAP Revenue $330 *Headcount as of the end of the period indicated For a reconciliation of non-GAAP to GAAP financial information, please see the appendix and our Q2’18 and historical earnings releases at investors.avaya.com $320 FY14 FY15 FY16 FY17 Q2 FY18 © 2018 Avaya Inc. All rights reserved 7 TTM-Trailing Twelve Months
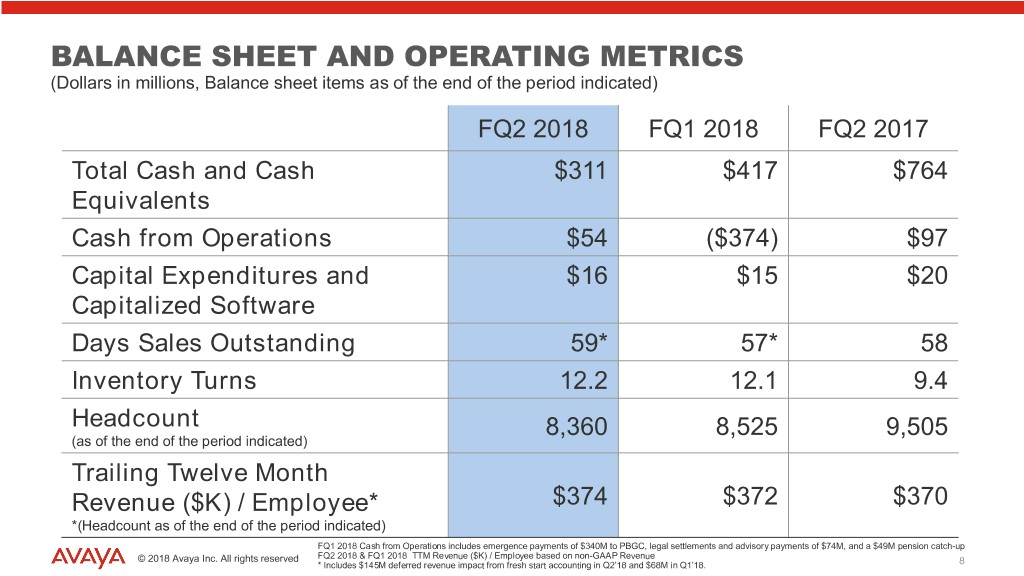
TEXT 0 – 0 – 0 204-0-0 127-127-127 17-114-210 80-200-74 86-183-242 247-150-70 BALANCE SHEET AND OPERATING METRICS (Dollars in millions, Balance sheet items as of the end of the period indicated) FQ2 2018 FQ1 2018 FQ2 2017 Total Cash and Cash $311 $417 $764 Equivalents Cash from Operations $54 ($374) $97 Capital Expenditures and $16 $15 $20 Capitalized Software Days Sales Outstanding 59* 57* 58 Inventory Turns 12.2 12.1 9.4 Headcount 8,360 8,525 9,505 (as of the end of the period indicated) Trailing Twelve Month Revenue ($K) / Employee* $374 $372 $370 *(Headcount as of the end of the period indicated) FQ1 2018 Cash from Operations includes emergence payments of $340M to PBGC, legal settlements and advisory payments of $74M, and a $49M pension catch-up © 2018 Avaya Inc. All rights reserved FQ2 2018 & FQ1 2018 TTM Revenue ($K) / Employee based on non-GAAP Revenue * Includes $145M deferred revenue impact from fresh start accounting in Q2’18 and $68M in Q1’18. 8
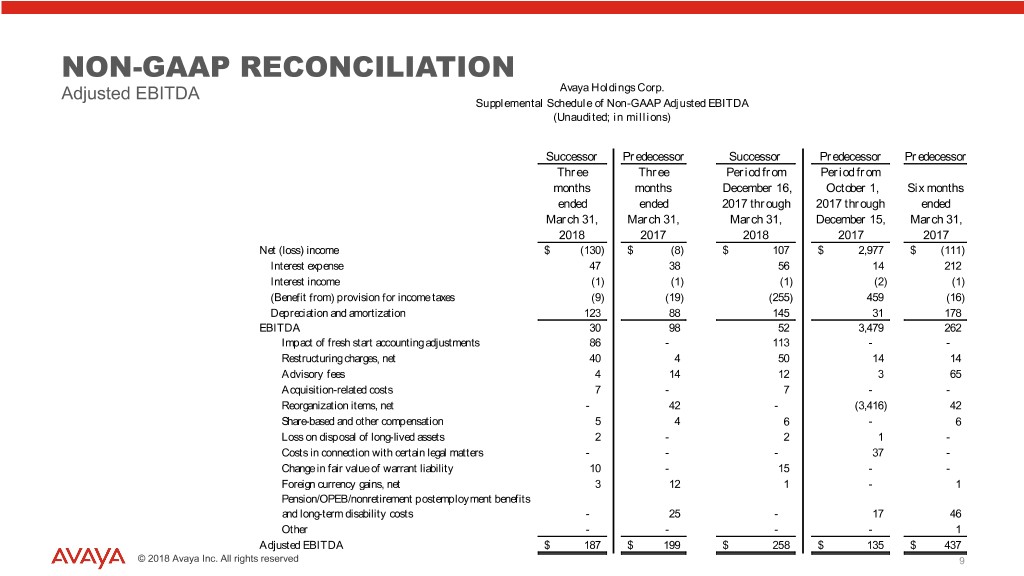
TEXT 0 – 0 – 0 204-0-0 127-127-127 17-114-210 80-200-74 86-183-242 247-150-70 NON-GAAP RECONCILIATION Adjusted EBITDA Avaya Holdings Corp. Supplemental Schedule of Non-GAAP Adjusted EBITDA (Unaudited; in millions) Successor Predecessor Successor Predecessor Predecessor Three Three Period from Period from months months December 16, October 1, Six months ended ended 2017 through 2017 through ended March 31, March 31, March 31, December 15, March 31, 2018 2017 2018 2017 2017 Net (loss) income $ (130) $ (8) $ 107 $ 2,977 $ (111) Interest expense 47 38 56 14 212 Interest income (1) (1) (1) (2) (1) (Benefit from) provision for income taxes (9) (19) (255) 459 (16) Depreciation and amortization 123 88 145 31 178 EBITDA 30 98 52 3,479 262 Impact of fresh start accounting adjustments 86 - 113 - - Restructuring charges, net 40 4 50 14 14 Advisory fees 4 14 12 3 65 Acquisition-related costs 7 - 7 - - Reorganization items, net - 42 - (3,416) 42 Share-based and other compensation 5 4 6 - 6 Loss on disposal of long-lived assets 2 - 2 1 - Costs in connection with certain legal matters - - - 37 - Change in fair value of warrant liability 10 - 15 - - Foreign currency gains, net 3 12 1 - 1 Pension/OPEB/nonretirement postemployment benefits and long-term disability costs - 25 - 17 46 Other - - - - 1 Adjusted EBITDA $ 187 $ 199 $ 258 $ 135 $ 437 © 2018 Avaya Inc. All rights reserved 9
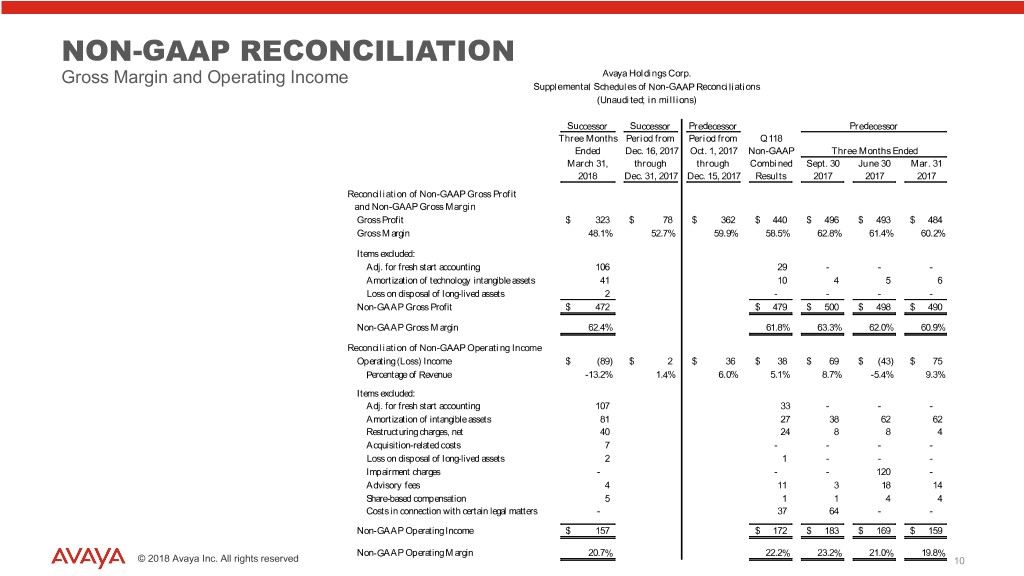
TEXT 0 – 0 – 0 204-0-0 127-127-127 17-114-210 80-200-74 86-183-242 247-150-70 NON-GAAP RECONCILIATION Gross Margin and Operating Income Avaya Holdings Corp. Supplemental Schedules of Non-GAAP Reconciliations (Unaudited; in millions) Successor Successor Predecessor Predecessor Three Months Period from Period from Q118 Ended Dec. 16, 2017 Oct. 1, 2017 Non-GAAP Three Months Ended March 31, through through Combined Sept. 30 June 30 Mar. 31 2018 Dec. 31, 2017 Dec. 15, 2017 Results 2017 2017 2017 Reconciliation of Non-GAAP Gross Profit and Non-GAAP Gross Margin Gross Profit $ 323 $ 78 $ 362 $ 440 $ 496 $ 493 $ 484 Gross Margin 48.1% 52.7% 59.9% 58.5% 62.8% 61.4% 60.2% Items excluded: Adj. for fresh start accounting 106 29 - - - Amortization of technology intangible assets 41 10 4 5 6 Loss on disposal of long-lived assets 2 - - - - Non-GAAP Gross Profit $ 472 $ 479 $ 500 $ 498 $ 490 Non-GAAP Gross Margin 62.4% 61.8% 63.3% 62.0% 60.9% Reconciliation of Non-GAAP Operating Income Operating (Loss) Income $ (89) $ 2 $ 36 $ 38 $ 69 $ (43) $ 75 Percentage of Revenue -13.2% 1.4% 6.0% 5.1% 8.7% -5.4% 9.3% Items excluded: Adj. for fresh start accounting 107 33 - - - Amortization of intangible assets 81 27 38 62 62 Restructuring charges, net 40 24 8 8 4 Acquisition-related costs 7 - - - - Loss on disposal of long-lived assets 2 1 - - - Impairment charges - - - 120 - Advisory fees 4 11 3 18 14 Share-based compensation 5 1 1 4 4 Costs in connection with certain legal matters - 37 64 - - Non-GAAP Operating Income $ 157 $ 172 $ 183 $ 169 $ 159 Non-GAAP Operating Margin 20.7% 22.2% 23.2% 21.0% 19.8% © 2018 Avaya Inc. All rights reserved 10
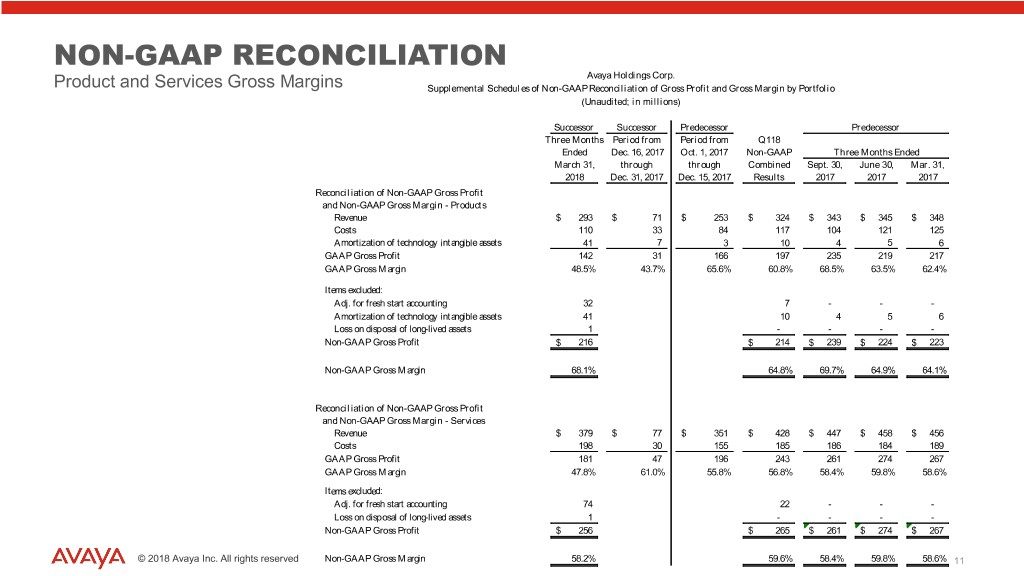
TEXT 0 – 0 – 0 204-0-0 127-127-127 17-114-210 80-200-74 86-183-242 247-150-70 NON-GAAP RECONCILIATION Avaya Holdings Corp. Product and Services Gross Margins Supplemental Schedules of Non-GAAP Reconciliation of Gross Profit and Gross Margin by Portfolio (Unaudited; in millions) Successor Successor Predecessor Predecessor Three Months Period from Period from Q118 Ended Dec. 16, 2017 Oct. 1, 2017 Non-GAAP Three Months Ended March 31, through through Combined Sept. 30, June 30, Mar. 31, 2018 Dec. 31, 2017 Dec. 15, 2017 Results 2017 2017 2017 Reconciliation of Non-GAAP Gross Profit and Non-GAAP Gross Margin - Products Revenue $ 293 $ 71 $ 253 $ 324 $ 343 $ 345 $ 348 Costs (exclusive of amortization of technology intangible assets) 110 33 84 117 104 121 125 Amortization of of technology technology intangible intangible assets assets 41 7 3 10 4 5 6 GAAP Gross Profit 142 31 166 197 235 219 217 GAAP Gross Margin 48.5% 43.7% 65.6% 60.8% 68.5% 63.5% 62.4% Items excluded: Adj. for fresh start accounting 32 7 - - - Amortization of technology intangible assets 41 10 4 5 6 Loss on disposal of long-lived assets 1 - - - - Non-GAAP Gross Profit $ 216 $ 214 $ 239 $ 224 $ 223 Non-GAAP Gross Margin 68.1% 64.8% 69.7% 64.9% 64.1% Reconciliation of Non-GAAP Gross Profit and Non-GAAP Gross Margin - Services Revenue $ 379 $ 77 $ 351 $ 428 $ 447 $ 458 $ 456 Costs 198 30 155 185 186 184 189 GAAP Gross Profit 181 47 196 243 261 274 267 GAAP Gross Margin 47.8% 61.0% 55.8% 56.8% 58.4% 59.8% 58.6% Items excluded: Adj. for fresh start accounting 74 22 - - - Loss on disposal of long-lived assets 1 - - - - Non-GAAP Gross Profit $ 256 $ 265 $ 261 $ 274 $ 267 © 2018 Avaya Inc. All rights reserved Non-GAAP Gross Margin 58.2% 59.6% 58.4% 59.8% 58.6% 11
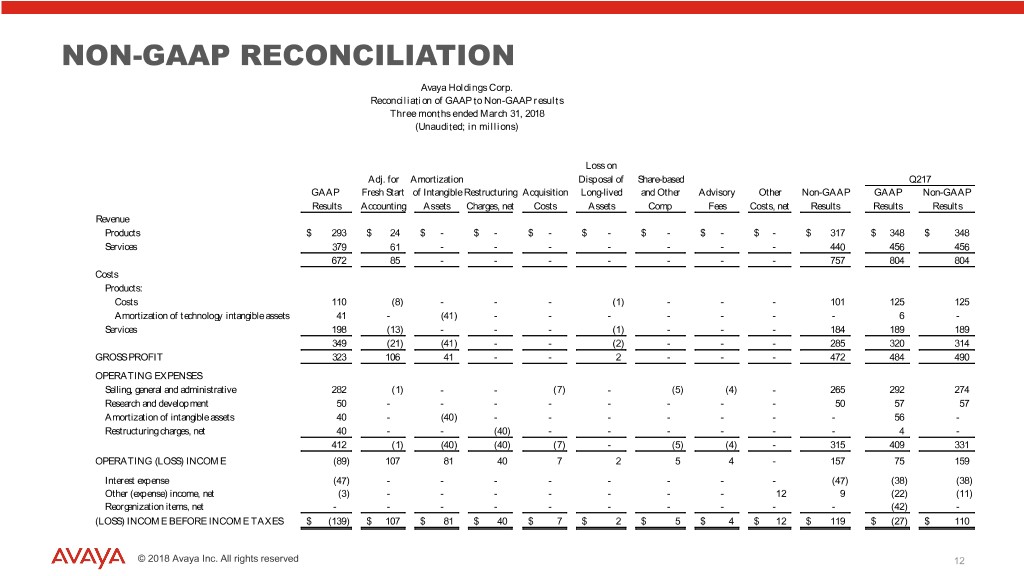
TEXT 0 – 0 – 0 204-0-0 127-127-127 17-114-210 80-200-74 86-183-242 247-150-70 NON-GAAP RECONCILIATION Avaya Holdings Corp. Reconciliation of GAAP to Non-GAAP results Three months ended March 31, 2018 (Unaudited; in millions) Loss on Adj. for Amortization Disposal of Share-based Q217 GAAP Fresh Start of Intangible Restructuring Acquisition Long-lived and Other Advisory Other Non-GAAP GAAP Non-GAAP Results Accounting Assets Charges, net Costs Assets Comp Fees Costs, net Results Results Results Revenue Products $ 293 $ 24 $ - $ - $ - $ - $ - $ - $ - $ 317 $ 348 $ 348 Services 379 61 - - - - - - - 440 456 456 672 85 - - - - - - - 757 804 804 Costs Products: Costs 110 (8) - - - (1) - - - 101 125 125 Amortization of technology intangible assets 41 - (41) - - - - - - - 6 - Services 198 (13) - - - (1) - - - 184 189 189 349 (21) (41) - - (2) - - - 285 320 314 GROSS PROFIT 323 106 41 - - 2 - - - 472 484 490 OPERATING EXPENSES Selling, general and administrative 282 (1) - - (7) - (5) (4) - 265 292 274 Research and development 50 - - - - - - - - 50 57 57 Amortization of intangible assets 40 - (40) - - - - - - - 56 - Restructuring charges, net 40 - - (40) - - - - - - 4 - 412 (1) (40) (40) (7) - (5) (4) - 315 409 331 OPERATING (LOSS) INCOME (89) 107 81 40 7 2 5 4 - 157 75 159 Interest expense (47) - - - - - - - - (47) (38) (38) Other (expense) income, net (3) - - - - - - - 12 9 (22) (11) Reorganization items, net - - - - - - - - - - (42) - (LOSS) INCOME BEFORE INCOME TAXES $ (139) $ 107 $ 81 $ 40 $ 7 $ 2 $ 5 $ 4 $ 12 $ 119 $ (27) $ 110 © 2018 Avaya Inc. All rights reserved 12
