Attached files
| file | filename |
|---|---|
| EX-99.1 - EXHIBIT 99.1 - Nuance Communications, Inc. | ex991pressreleasemarch3120.htm |
| 8-K - 8-K - Nuance Communications, Inc. | nuan8-kpressrelease3312018.htm |
Exhibit 99.2
1 | 2018 second quarter results |
Prepared remarks | |
May 9, 2018 | |
Prepared Remarks
Nuance Second Quarter Fiscal Year 2018
Nuance is providing these prepared remarks, in combination with its press release and live, webcast conference call, to provide shareholders and analysts additional time and detail for analyzing our results in advance of our quarterly conference call. These prepared remarks will not be read on the call.
The conference call will begin at 5:00 p.m. ET today and will include opening comments followed by questions and answers. To access the live broadcast, please visit the Investor Relations section of Nuance’s website at http://investors.nuance.com. The call can also be heard by dialing 800-230-1074 or 612-234-9960 at least five minutes prior to the call and referencing code 448075. A replay will be available within 24 hours of the announcement by dialing 800-475-6701 or 320-365-3844 and using the access code 448075.
These remarks and Nuance’s quarterly conference call remarks include certain forward-looking statements and non-GAAP financial measures. Please see the section, “Safe Harbor and Forward-Looking Statements” in this document for important caveats with respect to forward-looking information. Please also see the section, “Discussion of Non-GAAP Financial Measures” and the related Supplemental Financial Information in this document for more details on our non-GAAP financial measures.
Q2 18 Results Highlights
Our strategy of investing in our growth businesses is producing measurable results, driving organic revenue growth for the second sequential quarter and the first half of fiscal year 2018. We delivered non-GAAP revenue and EPS in line with our guidance and strong cash flow from operations.
GAAP loss per share of $(0.56) in Q2 18 includes the effects of $137.9 million, or $(0.47) per share, in goodwill impairments related to our Subscriber Revenue Subscription (SRS) and Devices businesses. These businesses have been reported in the Other segment beginning this quarter and combined, represent 5% of total non-GAAP revenue in Q2 18.
• | $102.8 million of the impairment relates to our SRS business in which we provide value-added services to mobile operators in emerging markets, primarily India and Brazil. These markets have experienced recent and dramatic disruption as a result of accelerated change in competition and business models for our SRS carrier customers. Specifically, the rapid shift away from a model where voice, data and text are offered separately toward unlimited bundled services at considerably lower costs has significantly reduced mobile operators’ demand for our services. This reduced demand materially impacts our future expectations for SRS revenues, resulting in an adjustment to the goodwill value in this reporting unit. |
• | $35.1 million of the impairment relates to our Devices business, which is comprised primarily of our legacy handset solutions. While the business continues to perform in line with our expectations, with the disaggregation of our former Mobile segment, the Devices business and its related net assets were evaluated for impairment on a standalone basis. The business was found to have a carrying value that exceeded its estimated fair value thus resulting in the impairment charge. |
Over the last several years, we’ve persistently pursued significant changes to our business model and have made considerable progress including driving a revenue shift toward our growth businesses in Healthcare, Enterprise and Automotive. Our second quarter results demonstrate our continued progress.
Performance highlights for the quarter include:
• | Q2 18 GAAP revenue of $514.2 million, up 3% over the prior year. |
• | Non-GAAP revenue of $518.3 million, up 1% year over year. |
 | © 2018 Nuance Communications, Inc. All rights reserved | |
2 | 2018 second quarter results |
Prepared remarks | |
May 9, 2018 | |
• | Organic revenue growth of 1% in the quarter, and 1% for the first half of fiscal year 2018, driven by 8% growth in Healthcare and 12% growth in Automotive in Q2 18, partially offset by declines in Other, Enterprise and Imaging. |
• | Total non-GAAP recurring revenue represented 71% of non-GAAP revenue in the quarter compared to 75% a year ago, due to continuing decline in HIM-related transcription revenue coupled with growth in our professional services revenue, which is non-recurring. |
• | GAAP loss per share of $(0.56) in Q2 18 was affected by $137.9 million in goodwill impairments related to our SRS and Devices businesses. |
• | Non-GAAP diluted EPS of $0.27, compared to $0.32 in Q2 17, as a result of gross and operating margin declines. |
• | Strong cash flow from operations of $109.3 million, or 138%, of non-GAAP net income. |
• | Net new bookings declined 8% in Q2 18. Through the first half of 2018, net new bookings grew 1% compared to the first half of 2017. As we’ve discussed previously, we experience bookings variability quarter to quarter, often driven by the timing of large, multi-year agreements. The strength of our second-half 2018 pipeline provides the confidence to maintain our expectations of 5% to 7% net new bookings growth for the fiscal year. |
During the quarter, Nuance’s strategy of prioritizing investment and innovation in conversational AI was evident in the Company’s advancement of business-specialized solutions for key vertical industries, including:
– | At HIMMSS 2018, one of the world’s largest healthcare IT shows, Nuance announced its new healthcare virtual assistant technology, a first step in the new generation of innovation that will empower care teams to work more naturally through automated clinical documentation. |
– | Nuance’s Dragon Drive platform is powering both Mercedes’s new MBUX infotainment system and the automotive assistant in Toyota’s user experience concept vehicle, Toyota Concept-I, with intelligent voice controls, natural language understanding and artificial intelligence (AI) to allow up to eight different passengers to command everything from the car’s navigation system to in-car infotainment. |
New Reporting Segments
Effective with Q2 18 we are reporting our results in five segments: Healthcare, Enterprise, Automotive, Imaging and Other.
During the quarter, as part of ongoing actions to simplify and streamline our business and to more efficiently address our best market opportunities, we eliminated our Mobile segment and shifted the lines of business that had been in Mobile as follows:
• | Established Automotive as a separate reporting segment; |
• | Moved our Dragon TV product line into our Enterprise segment; |
• | Our SRS business, which provides value-added services to mobile operators, and our Devices business, which consists largely of our legacy handset solutions are included in our Other segment. |
Segment information has been recast to reflect the new segment reporting structure. Please see the Supplemental Financial Information that accompanies this document for additional segment disclosures.
| © 2018 Nuance Communications, Inc. All rights reserved | |
3 | 2018 second quarter results |
Prepared remarks | |
May 9, 2018 | |
Q2 18 Summary of GAAP & Non-GAAP Financial Results
(for reconciliation of GAAP to non-GAAP measures, please see the tables included in this document)
($ in millions except earnings per share) | Q2 2017 | Q2 2018 | Change* | |
Net New Bookings % Growth | $410.4 | $376.6 | $(33.8) (8)% | |
GAAP Revenue % Recurring Revenue | $499.6 74% | $514.2 71% | $14.6 (310) bps | |
Non-GAAP Revenue % Recurring Revenue | $511.1 75% | $518.3 71% | $7.2 (350) bps | |
Organic Revenue % Growth | $515.0 | $518.3 | $3.3 1% | |
GAAP Gross Profit Gross Margin % | $286.2 57.3% | $285.2 55.5% | $(0.9) (180) bps | |
Non-GAAP Gross Profit Gross Margin % | $324.1 63.4% | $311.5 60.1% | $(12.6) (330) bps | |
GAAP Operating Income (Loss) GAAP Operating Margin | $31.5 6.3% | $(129.3) (25.1)% | $(160.8) (3,150) bps | |
Non-GAAP Operating Income Non-GAAP Operating Margin | $156.5 30.6% | $126.4 24.4% | $(30.1) (620) bps | |
GAAP Net Loss | $(33.8) | $(164.1) | $(130.3) | |
Non-GAAP Net Income | $92.8 | $79.1 | $(13.7) | |
GAAP EPS | $(0.12) | $(0.56) | $(0.44) | |
Non-GAAP Diluted EPS | $0.32 | $0.27 | $(0.05) | |
Cash Flow from Operations % non-GAAP Net Income | $125.4 135% | $109.3 138% | $(16.2) | |
* Change in dollars, percentage and basis points calculated using actual results.
May not add due to rounding for table presentation purposes.
Q2 18 Detailed Financial Results
Net New Bookings
($ in millions) | Q1 2017 | Q2 2017 | Q3 2017 | Q4 2017 | FY 2017 | Q1 2018 | Q2 2018 | 1H 2018 |
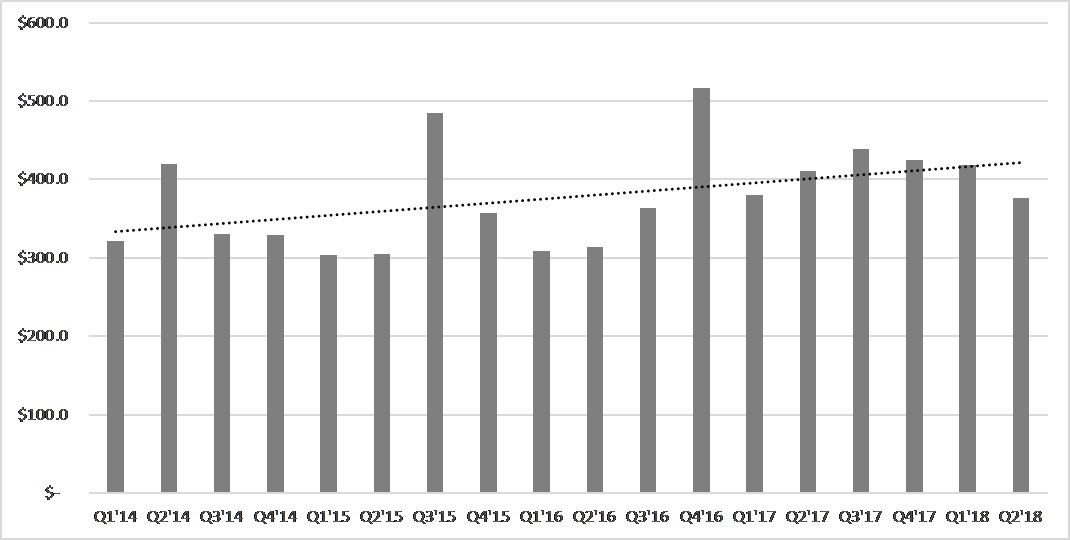
Net New Bookings | $380.3 | $410.4 | $438.5 | $424.4 | $1,653.6 | $418.4 | $376.6 | $795.0 |
Yr/yr Growth | 23% | 31% | 21% | (18)% | 10% | 10% | (8)% | 1% |
• | We delivered net new bookings in Q2 18 of $376.6 million, down 8% year over year. |
• | Through the first half of 2018, net new bookings grew 1% compared to the first half of 2017 and the strength of our second-half 2018 pipeline provides the confidence to maintain our expectations of 5% to 7% net new bookings growth for the fiscal year. |
• | As we’ve discussed previously, we experience bookings variability quarter to quarter, often driven by the timing of large, multi-year agreements. The graph below illustrates this quarterly variability as well as the overall trend of net new bookings increasing over time. We continue to encourage investors to view our net new bookings progress on an annual basis. |
| © 2018 Nuance Communications, Inc. All rights reserved | |
4 | 2018 second quarter results |
Prepared remarks | |
May 9, 2018 | |
Net New Bookings Trend
($ in millions)
Revenue
• | In Q2 18, we delivered GAAP revenue of $514.2 million, up 3% as reported from a year ago. |
• | Q2 18 non-GAAP revenue was $518.3 million, up $7.2 million, or 1%, on an as-reported basis from a year ago, our second-highest quarter ever. |
• | We delivered positive organic revenue growth for the second sequential quarter, with 1% organic growth compared to Q2 17 primarily due to growth in Healthcare professional services, Dragon Medical cloud and Automotive. This growth was partially offset primarily by declines in HIM, Enterprise and SRS. |
• | For the first half of 2018, we also delivered 1% organic growth. |
| © 2018 Nuance Communications, Inc. All rights reserved | |
5 | 2018 second quarter results |
Prepared remarks | |
May 9, 2018 | |
Non-GAAP Revenue by Type and as % of Total Non-GAAP Revenue*
Q1 2017 | Q2 2017 | Q3 2017 | Q4 2017 | FY 2017 | Q1 2018 | Q2 2018 | |
Hosting | $195.6 | $204.8 | $192.5 | $150.9 | $743.9 | $186.3 | $195.4 |
% of Revenue | 39% | 40% | 39% | 32% | 38% | 37% | 38% |
Maintenance and Support | $82.7 | $82.0 | $80.7 | $82.7 | $328.1 | $80.9 | $78.5 |
% of Revenue | 17% | 16% | 16% | 17% | 17% | 16% | 15% |
Perpetual Product and Licensing | $79.3 | $77.0 | $74.4 | $77.7 | $308.4 | $76.9 | $73.3 |
% of Revenue | 16% | 15% | 15% | 16% | 16% | 15% | 14% |
Recurring Product and Licensing | $78.2 | $90.6 | $85.8 | $98.9 | $353.5 | $90.7 | $90.9 |
% of Revenue | 16% | 18% | 17% | 21% | 18% | 18% | 18% |
Professional Services | $60.3 | $56.7 | $62.2 | $64.4 | $243.6 | $74.0 | $80.2 |
% of Revenue | 12% | 11% | 13% | 14% | 12% | 15% | 15% |
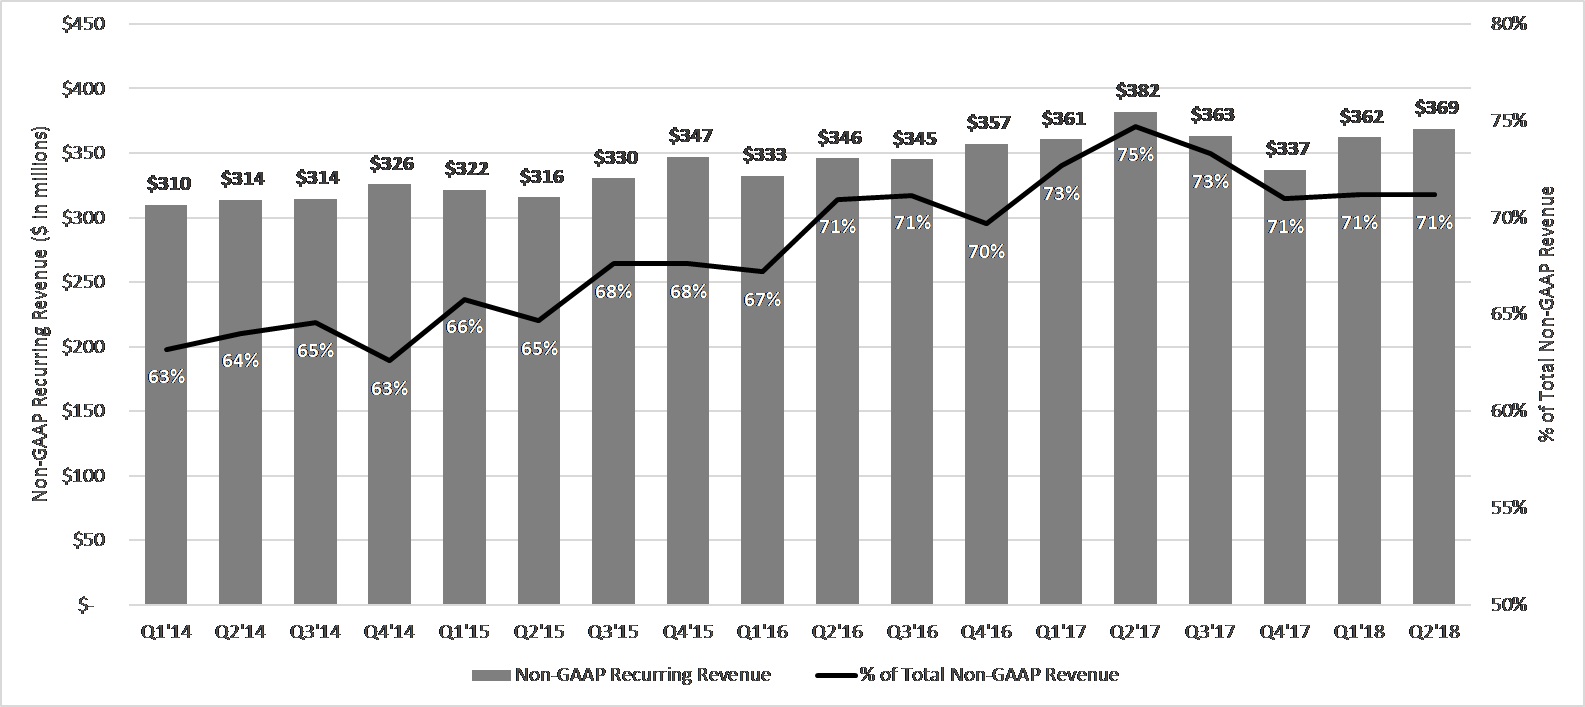
Total Non-GAAP Revenue | $496.0 | $511.1 | $495.6 | $474.7 | $1,977.4 | $508.8 | $518.3 |
Total Recurring Revenue* | $360.5 | $381.7 | $363.2 | $336.8 | $1,442.3 | $362.2 | $368.9 |
Recurring % of Total Non-GAAP Revenue | 73% | 75% | 73% | 71% | 73% | 71% | 71% |
* Total non-GAAP recurring revenue is the sum of hosting, maintenance and support, recurring product and licensing, as well as the portion of non-GAAP professional services revenue delivered under ongoing subscription contracts. Non-GAAP recurring product and licensing revenue comprises term-based and ratable licenses as well as revenue from royalty arrangements.
Recurring Revenue
• | In Q2 18, GAAP recurring revenue was $365.0 million, or 71% of total revenue, compared to $370.2 million, or 74% of total revenue a year ago. |
• | Non-GAAP recurring revenue in Q2 18 was $368.9 million, or 71% of total revenue, compared to $381.7 million, or 75% of total revenue a year ago. |
• | Lower GAAP and non-GAAP recurring revenue as a percentage of total revenue was the result of higher professional services revenue, as well as continuing decline in our HIM-related transcription revenue, partially offset by continued growth in Dragon Medical cloud revenue. |
| © 2018 Nuance Communications, Inc. All rights reserved | |
6 | 2018 second quarter results |
Prepared remarks | |
May 9, 2018 | |
Recurring Revenue Trend
Estimated On-Demand Contract Values
• | At the end of the second quarter, the estimated three-year value of total on-demand contracts was $2,335.9 million, down from $2,568.3 million a year ago. The decrease was due primarily to the effect of the 2017 malware incident and the continuing decline in our HIM-related transcription business, as well as declines in our SRS business, partially offset by growth in our Dragon Medical cloud and Automotive connected services businesses. |
(in millions) | Q1 2017 | Q2 2017 | Q3 2017 | Q4 2017 | Q1 2018 | Q2 2018 |
Estimated 3-Year Value of Total On-Demand Contracts | $2,499.4 | $2,568.3 | $2,359.5 | $2,307.3 | $2,351.2 | $2,335.9 |
Gross Margin
• | GAAP gross margin in Q2 18 was 55.5%, a decrease of 180-basis points year over year. |
• | Non-GAAP gross margin in Q2 18 was 60.1%, a decrease of 330-basis points year over year. |
• | The decline in gross margin is primarily due to a higher contribution from Healthcare professional services revenue in the current-year period. |
Operating Expenses and Operating Margin
• | GAAP operating expenses in Q2 18 were $414.5 million, compared to $254.6 million a year ago, while GAAP operating margin in Q2 18 was (25.1)%. GAAP operating expenses include the $137.9 million goodwill impairment, as well as approximately $28 million in professional services costs associated with considering strategic alternatives for certain businesses and establishing our Automotive business as an independent reporting segment. |
• | Non-GAAP operating expenses in Q2 18 were $185.0 million, compared to $167.5 million a year ago due to planned higher investments in security, conversational AI research and development, as well as higher litigation expenses related to enforcing our intellectual property rights. |
• | Non-GAAP operating margin in Q2 18 was 24.4%, a decrease of 620-basis points year over year, due to the effects of lower gross margins and 330-basis points related to increased investments and operating costs which were generally in line with our expectations. |
| © 2018 Nuance Communications, Inc. All rights reserved | |
7 | 2018 second quarter results |
Prepared remarks | |
May 9, 2018 | |
Interest Expense
• | GAAP net interest expense was $31.6 million in Q2 18, down $4.9 million year over year. |
• | Non-GAAP net interest expense was $19.8 million in Q2 18, down $3.1 million year over year. |
• | The decrease in GAAP and non-GAAP net interest expense in Q2 18 is due to the payment of |
• | $331.2 million of the 2.75% convertible debt in November 2017 together with higher interest income on investments. |
Provision for Income Taxes
• | Q2 18 GAAP provision for income taxes was $2.5 million, compared to $9.1 million a year ago. |
• | Q2 18 non-GAAP provision for income taxes was $26.9 million, compared to $39.9 million a year ago. The non-GAAP effective tax rate was 25% in Q2 18, compared to 30% a year ago. The decreases in tax provision and rate primarily were due to lower U.S. Federal tax rates. |
• | Q2 18 cash tax was a benefit of $5.7 million compared to an expense of $7.2 million in Q2 17. For the first half of fiscal year 2018, cash taxes were an expense of $14.0 million. The Q2 18 cash tax benefit includes a $12 million tax expense reduction based on recent IRS guidance regarding the mandatory one-time repatriation tax established under the Tax Cuts and Jobs Act, thereby reducing the original $14 million tax expense recorded during Q1 18. |
Earnings Performance
• | GAAP loss per share in Q2 18 was $(0.56), compared to a loss of $(0.12) per share a year ago. Our GAAP net loss of $(164.1) million included the goodwill impairment in the quarter, as well as the professional services costs associated with considering strategic alternatives for certain businesses and establishing our Automotive business as a separate reporting segment. |
• | Non-GAAP EPS in Q2 18 was $0.27 per diluted share, compared to $0.32 a year ago, primarily due to lower gross margin and increased investments. |
• | During Q2 18, we did not repurchase any shares of our common stock. As of March 31, 2018, we had approximately $193.4 million remaining under the Board’s current repurchase program authorization. |
Cash Flow from Operations (CFFO)
• | CFFO in Q2 18 was strong at $109.3 million, representing a decrease of 13% year over year. |
• | CFFO as a percent of non-GAAP net income was 138% in Q2 18 compared to 135% in |
Q2 17.
(in millions) | Q1 2017 | Q2 2017 | Q3 2017 | Q4 2017 | FY 2017 | Q1 2018 | Q2 2018 |
Cash Flow from Operations | $124.9 | $125.4 | $132.0 | $(3.5) | $378.9 | $86.1 | $109.3 |
Cash flow as % of non-GAAP net income | 162% | 135% | 167% | (6)% | 123% | 107% | 138% |
• | As of March 31, 2018, our balance of cash, cash equivalents and marketable securities was |
$648.7 million.
| © 2018 Nuance Communications, Inc. All rights reserved | |
8 | 2018 second quarter results |
Prepared remarks | |
May 9, 2018 | |
Days Sales Outstanding (DSO)
• | In Q2 18, our DSO was 72 days, up 3 days compared to a year ago due to delayed collections on certain receivables in our Healthcare segment because of the 2017 malware incident. |
• | On a sequential basis, DSO improved by 6 days from Q1 18 as a result of finalizing customer credits related to the 2017 malware incident and collecting the majority of outstanding receivables from affected customers. |
• | In future periods, we expect DSO between the high 60s and low 70s. |
Q1 2017 | Q2 2017 | Q3 2017 | Q4 2017 | Q1 2018 | Q2 2018 | |
Days Sales Outstanding | 71 | 69 | 66 | 76 | 78 | 72 |
Deferred Revenue
• | We ended Q2 18 with deferred revenue of $882.7 million, up 10% from a year ago, and driven primarily by the growth in Automotive connected services and up-front payments related to our bundled clinical documentation offerings in Healthcare. |
(in millions) | Q1 2017 | Q2 2017 | Q3 2017 | Q4 2017 | Q1 2018 | Q2 2018 |
Total Deferred Revenue | $802.5 | $802.4 | $798.7 | $790.0 | $880.6 | $882.7 |
| © 2018 Nuance Communications, Inc. All rights reserved | |
9 | 2018 second quarter results |
Prepared remarks | |
May 9, 2018 | |
Segment and Business Driver Discussions
Non-GAAP Segment Revenue*
($ in millions) | Q1 2017 | Q2 2017 | Q3 2017 | Q4 2017 | FY 2017 | Q1 2018 | Q2 2018 | |||||
Healthcare | $239.2 | $238.5 | $232.6 | $189.0 | $899.3 | $245.5 | $261.2 | |||||
Yr/yr Organic Growth | (6)% | (5)% | (4)% | (22)% | (9)% | 1% | 8% | |||||
% of Total Revenue | 48% | 47% | 47% | 40% | 45% | 48% | 50% | |||||
Enterprise | $115.4 | $122.1 | $114.1 | $122.7 | $474.3 | $120.6 | $112.7 | |||||
Yr/yr Organic Growth | 16% | 15% | 6% | 4% | 10% | 5% | (8)% | |||||
% of Total Revenue | 23% | 24% | 23% | 26% | 24% | 24% | 22% | |||||
Automotive | $58.9 | $61.7 | $63.1 | $68.5 | $252.2 | $61.5 | $69.0 | |||||
Yr/yr Organic Growth | 28% | 16% | 7% | 22% | 18% | 4% | 12% | |||||
% of Total Revenue | 12% | 12% | 13% | 14% | 13% | 12% | 13% | |||||
Imaging | $52.1 | $53.0 | $49.4 | $63.2 | $217.7 | $55.6 | $48.9 | |||||
Yr/yr Organic Growth | (15)% | (7)% | (13)% | (5)% | (10)% | 7% | (8)% | |||||
% of Total Revenue | 11% | 10% | 10% | 13% | 11% | 11% | 9% | |||||
Other | $30.5 | $35.7 | $36.4 | $31.2 | $133.8 | $25.6 | $26.5 | |||||
Yr/yr Organic Growth | (36)% | (6)% | 6% | (18 | )% | (16)% | (23)% | (28)% | ||||
% of Total Revenue | 6% | 7% | 7% | 7% | 7% | 5% | 5% | |||||
Total Non-GAAP Revenue | $496.0 | $511.1 | $495.6 | $474.7 | $1,977.4 | $508.8 | $518.3 | |||||
Yr/yr Organic Growth | (3)% | 1% | (1)% | (9)% | (3)% | 1% | 1% | |||||
Yr/yr Constant Currency Organic Growth | (1)% | |||||||||||
*Segment information has been recast to reflect the new segment reporting structure. Please see the Supplemental Financial Information that accompanies this document for additional segment disclosures.
| © 2018 Nuance Communications, Inc. All rights reserved | |
10 | 2018 second quarter results |
Prepared remarks | |
May 9, 2018 | |
Non-GAAP Segment Profit Margin*
($ in millions) | Q1 2017 | Q2 2017 | Q3 2017 | Q4 2017 | FY 2017 | Q1 2018 | Q2 2018 |
Healthcare | |||||||
Non-GAAP Segment Profit | $78.6 | $83.3 | $70.5 | $29.8 | $262.1 | $77.4 | $87.4 |
Segment Profit Margin % | 33% | 35% | 30% | 16% | 29% | 32% | 33% |
Enterprise | |||||||
Non-GAAP Segment Profit | $29.9 | $40.3 | $32.4 | $33.0 | $135.6 | $37.7 | $25.7 |
Segment Profit Margin % | 26% | 33% | 28% | 27% | 29% | 31% | 23% |
Automotive | |||||||
Non-GAAP Segment Profit | $27.6 | $29.3 | $30.7 | $31.2 | $118.9 | $23.2 | $28.9 |
Segment Profit Margin % | 47% | 47% | 49% | 46% | 47% | 38% | 42% |
Imaging | |||||||
Non-GAAP Segment Profit | $17.6 | $18.5 | $16.9 | $26.5 | $79.5 | $15.6 | $12.3 |
Segment Profit Margin % | 34% | 35% | 34% | 42% | 37% | 28% | 25% |
Other | |||||||
Non-GAAP Segment Profit | $7.9 | $12.5 | $12.7 | $8.5 | $41.6 | $3.4 | $6.1 |
Segment Profit Margin % | 26% | 35% | 35% | 27% | 31% | 13% | 23% |
Total Non-GAAP Segment Profit | $161.6 | $184.0 | $163.2 | $128.9 | $637.7 | $157.4 | $160.3 |
Total Segment Profit Margin % | 33% | 36% | 33% | 27% | 32% | 31% | 31% |
*Segment information has been recast to reflect the new segment reporting structure. Please see the Supplemental Financial Information that accompanies this document for additional segment disclosures.
Healthcare
Healthcare segment non-GAAP revenue was $261.2 million in Q2 18, up 10% on an as-reported basis. On an organic basis, our Healthcare segment revenue grew 8% year over year and Q2 18 was the second sequential quarter of organic growth for the segment.
Segment revenue benefited from strong professional services. In Q2 18, the professional services growth was driven by our EHR-implementation and optimization service offerings. Our hosting revenues continued to experience decline from our HIM-related transcription revenue, offset in part by our growing Dragon Medical cloud revenues. In Q2 18, our HIM-related transcription business contributed $73.4 million in revenue, compared to $97.9 million in Q2 17.
Healthcare segment profit margin was 33%, down 150-basis points from the same period last year due to lower gross margin, primarily due to a higher mix of professional services revenue in the current year quarter. Net new bookings saw continued strength from Dragon Medical cloud.
Highlights for the Healthcare segment included:
• | In March, Dragon Medical One achieved HITRUST CSF Certification placing Nuance in an elite group of organizations worldwide that have earned this certification. HITRUST CSF Certified status confirms our Dragon Medical One cloud platform has met key industry-defined privacy, security and compliance requirements. |
• | At HIMMSS 2018, one of the world’s largest health IT shows, we announced our new healthcare virtual assistant technology and innovations that will empower care teams to work more naturally through |
| © 2018 Nuance Communications, Inc. All rights reserved | |
11 | 2018 second quarter results |
Prepared remarks | |
May 9, 2018 | |
automated clinical documentation. Related to this, we also announced that Nuance and Epic expect to have Nuance’s new AI-powered virtual assistant platform integrated into Epic’s 2018 EHR.
• | Nuance and Partners HealthCare announced an agreement to develop AI applications for radiologists. Nuance intends to make new algorithms available through the Nuance AI Marketplace for Diagnostic Imaging, an open platform for developers, data scientists and radiologists to accelerate the development, deployment, and adoption of AI for medical imaging. |
• | Nuance’s Quality Management and Coding solutions, within our Clintegrity line of business, have been named vendor category leader in two categories by the independent research company, KLAS. For the fourth consecutive year, Nuance’s Quality Management solution were ranked the #1 Quality Management Category Leader. In addition, Nuance’s Coding solution has been ranked the #1 Medical Records Coding 2018 Category Leader. |
Annualized HIM Line Run Rate
Q1 2017 | Q2 2017 | Q3 2017 | Q4 2017 | Q1 2018 | Q2 2018 | |
Annualized line run-rate in healthcare on-demand business (in billions) | 4.651 | 4.743 | 4.345 | 2.936* | 3.340 | 3.176 |
The annualized HIM line run rate is calculated using the actual billed HIM line count in the current quarter
multiplied by 4.
*In Q4 17, we had a non-recurring line count loss due to malware incident related downtime. The non-recurring
loss is multiplied by 4 in the annualized calculation above, thereby creating an anomalous annualized line count.
Enterprise
Our Q2 18 Enterprise results include the addition of our Dragon TV solutions, previously reported as part of our Mobile segment. Segment information has been recast to reflect the new segment reporting structure.
Non-GAAP revenue for our Enterprise segment was $112.7 million in Q2 18, down 8% year over year on both an as-reported and an organic basis, due to a challenging revenue comparison to Q2 17 and lower revenues across the business. Segment profit margin was 23% for the quarter, a decrease of 1,020-basis points from a year ago due to the lower revenue.
Highlights for the Enterprise segment include:
• | We secured key customers and design wins in the quarter including AT&T, Cisco, ComDesign, Jetstar, Royal Bank of Scotland, and Wells Fargo. |
• | Nuance debuted Apple Business Chat beta on the Nuance Digital Engagement platform, adding a new channel to Nuance Customer Service Messaging, and enabling consumers to engage with businesses when and how it’s most convenient for them. |
• | During the quarter, we deployed voice biometrics solutions for a major global financial institution. In addition, we introduced significant enhancements to our leading biometric security solution for fraud prevention and authentication, leveraging third generation deep neural networks and intelligent detectors including behavior analysis and geography. |
• | Nuance announced new core engine capabilities that utilize significant advances in automatic, AI-powered speech recognition and text-to-speech technologies to enable human-like dialog and enhanced customer experiences. The updates provide better self-service and automation, setting new benchmarks for conversational, intelligent, customer engagement across voice and digital channels. |
| © 2018 Nuance Communications, Inc. All rights reserved | |
12 | 2018 second quarter results |
Prepared remarks | |
May 9, 2018 | |
Automotive
In its first quarter as a separate reporting segment, our Automotive business delivered non-GAAP revenue of $69.0 million, its strongest quarter to date, up 12% from Q2 17 on both an as-reported and an organic basis, with robust license and hosting revenue. Q2 18 was the eighth straight quarter of organic growth for our Automotive business.
Automotive segment profit margin was 42%, a decrease of 560-basis points from a year ago primarily as a result of increased R&D investments to support continued growth.
Highlights for the Automotive segment include:
• | Stefan Ortmanns was named EVP of the Automotive segment. Stefan has served as the SVP of Engineering and professional services for our former Mobile segment for the last 14 years, building strong customer relationships and navigating complex engagements and deployments. |
• | We secured key design wins with Ford, Daimler, BMW, Denso/Toyota, Roadtrack, Geely and ForYouGE |
• | At the 2018 Consumer Electronics Show (CES), we announced that our Dragon Drive connected car platform powers the automotive assistant in Toyota’s user experience concept vehicle, Toyota Concept-I, showcasing important innovations that include voice-controlled restaurant and point of interest search, navigation, Q&A, sports information, and content provider data. |
• | Also at CES 2018, Mercedes debuted its new MBUX infotainment system with intelligent voice controls powered by our Dragon Drive platform. With Nuance, MBUX is revolutionizing the in-car experience with natural language understanding and AI to allow up to eight different passengers to command everything from the car’s navigation system to in-car infotainment. |
Imaging
Our Imaging segment delivered non-GAAP revenue of $48.9 million, a decline of 8% year over year on both an as-reported and an organic basis. Imaging segment profit margin was 25% in the quarter, down 980-basis points from the second quarter of last year due to lower revenue and higher operating expenses related to sales and R&D investments.
Highlights for the Imaging segment include:
• | Al Monserrat, EVP and General Manager, joined Nuance in January 2018. He is focused on a business assessment and initial actions to drive long-term performance improvements including making key new hires, aligning product and R&D functions, and organizing sales resources into geographic units. In his short time with Nuance, he has identified a number of additional initiatives to improve performance and drive growth including simplifying the solutions portfolio, better defining long-term product strategy and increasing OEM productivity. |
• | During the quarter, Imaging launched a new OmniPage Server 2.0 with enhanced functionality including an improved user experience with flexible configuration options, API-enabled document classification and cloud deployment options through Amazon Web Services and Microsoft Azure. |
| © 2018 Nuance Communications, Inc. All rights reserved | |
13 | 2018 second quarter results |
Prepared remarks | |
May 9, 2018 | |
Other
Q2 18 is the first quarter where we have reported results for our Other segment, which includes our SRS and Devices businesses. These businesses were previously reported in our Mobile segment.
Segment information has been recast to reflect the new segment reporting structure.
The Other segment delivered non-GAAP revenue of $26.5 million in Q2 18, a decline of 26% year over year on an as-reported basis, and a decline of 28% on an organic basis. Devices revenues were in line with recent trends and expectations while SRS underperformed due to the accelerated change in the competitive environment and business models discussed previously in this document. Segment profit margin was 23% in the quarter, down 1,220-basis points from the prior year.
On a GAAP-basis, as previously noted, we recorded a $137.9 million goodwill impairment charge on the businesses in this segment during Q2 18.
Guidance and Outlook
Fiscal Year 2018 Guidance
In the second half of fiscal year 2018, we plan to build upon and strengthen the core business trends of the first half of fiscal year 2018, with Healthcare and Automotive expected to be the primary revenue growth drivers and with Enterprise expected to resume organic growth. We expect the growth and performance of these businesses will be offset by the significant changes we’ve seen in our SRS business.
Segment Trends in 2018
• | In Healthcare, we expect strong revenue performance from our Dragon Medical cloud, Diagnostics, and Clintegrity offerings, partially offset by continued revenue erosion in HIM-related transcription. We estimate HIM-related transcription revenues to be approximately $260 million in 2018 and continue to expect erosion at an annual rate of approximately 10%. |
• | In Enterprise, we expect demand for our contact center solutions to lead a return to organic revenue growth for the segment in the second half of fiscal year 2018. |
• | In Automotive, we expect our business to continue to perform well based on the strength of our customer relationships and visibility to recurring revenue streams. We are now tracking to mid-to-high single-digit growth for this business, owing to slightly reduced expectations for professional services revenues and the effect of a small acquisition in April 2018 which is dilutive to growth and $0.01 dilutive to EPS in fiscal year 2018. |
• | In Imaging, while we expect improvement over time, we expect that the current challenges in the business will result in ending 2018 with revenue approximately flat with fiscal year 2017. |
• | In Other, we expect continued declines in our legacy handset solutions and now expect our SRS business to decline in 2018 compared to 2017. |
We currently expect:
• | Net new bookings growth in a range of 5% to 7%, consistent with our previous guidance and based on the strength of Automotive, Enterprise and Dragon Medical. |
• | GAAP revenue in a range of $2,018.0 to $2,058.0 million, down from $2,038.0 to $2,078.0 previously. |
• | Non-GAAP revenue in a range of $2,035.0 to $2,075.0 million, compared to $2,055.0 to $2,095.0 million previously, primarily due to the change in our SRS business. |
• | Organic revenue growth in a range of 2% to 4%, down from a previous range of 3% to 5%, due primarily to lower than expected SRS revenues. |
• | Non-GAAP recurring revenue guidance in a range of 72% to 73%, consistent with our previous guidance. |
| © 2018 Nuance Communications, Inc. All rights reserved | |
14 | 2018 second quarter results |
Prepared remarks | |
May 9, 2018 | |
• | Non-GAAP gross margin in a range of 62.0% to 62.5%, down from 62.5% to 63.0% previously, primarily as a result of lower high-margin SRS revenues. |
• | Non-GAAP operating margin in a range of 25.5% to 26.0%, down from 26.0% to 26.5% previously, primarily as a result of lower SRS revenues and related profits. |
• | Non-GAAP tax rates in a range of 24.0% to 25.0%. |
• | GAAP EPS in a range of $(0.43) to $(0.34) per diluted share from $0.14 to $0.22 per share primarily due to the Q2 18 goodwill impairment. |
• | Non-GAAP diluted EPS in a range of $1.09 to $1.15 per share, from $1.14 to $1.20 per share previously, primarily due to lower SRS revenues and profits, as well as $0.01 dilution from a Q3 18 Automotive acquisition. |
• | Cash flow from operations between $410 to $430 million, down from the prior range of $430 to $450 million in concert with our lower revenue and profit expectations. |
• | Deferred revenue is now expected to grow between 8% and 10% during fiscal year 2018, driven primarily by continued growth in Automotive connected services and up-front payments related to our bundled clinical documentation offerings in Healthcare. |
Fiscal Year 2018 Guidance Summary Table (as of May 9, 2018)
($ in millions except earnings per share) | MAY 9, 2018 OUTLOOK | FEBRUARY 8, 2018 OUTLOOK |
Net New Bookings Growth | 5% to 7% | 5% to 7% |
GAAP Revenue | $2,018.0 to $2,058.0 | $2,038.0 to $2,078.0 |
Non-GAAP Revenue % Recurring Revenue | $2,035.0 to $2,075.0 72% to 73% | $2,055.0 to $2,095.0 72% to 73% |
Organic Non-GAAP Revenue Growth | 2% to 4% | 3% to 5% |
Non-GAAP Gross Margin | 62.0% to 62.5% | 62.5% to 63.0% |
Non-GAAP Operating Margin | 25.5% to 26.0% | 26.0% to 26.5% |
GAAP Diluted EPS | $(0.43) to $(0.34) | $0.14 to $0.22 |
Non-GAAP Diluted EPS | $1.09 to $1.15 | $1.14 to $1.20 |
Cash Flow from Operations (CFFO) % of non-GAAP revenue | $410 to $430 123% to 125% | $430 to $450 123% to 127% |
Capital expenditures | ~ $50 | ~ $50 |
Net cash interest and other expense | $80 to $85 | $80 to $85 |
Non-GAAP tax rate | 24.0% to 25.0% | 24.0% to 25.0% |
Net cash taxes | $30 | $44 |
Diluted share count | ~301 | ~ 301 |
Q3 18 Guidance
We also are providing the following guidance for our third quarter of fiscal year 2018:
• | We expect GAAP revenue in a range of $487.0 to $501.0 million, and non-GAAP revenue in a range of $490.0 to $504.0 million. |
• | We expect GAAP EPS in a range of ($0.06) to ($0.02) per share, and non-GAAP EPS in a range of $0.25 to $0.28 per diluted share. |
| © 2018 Nuance Communications, Inc. All rights reserved | |
15 | 2018 second quarter results |
Prepared remarks | |
May 9, 2018 | |
Q3 18 Guidance Summary Table (as of May 9, 2018)
($ in millions except earnings per share data)
Q3 2018 | Low | High | |
GAAP revenue | $487.0 | $501.0 | |
Non-GAAP revenue | $490.0 | $504.0 | |
GAAP EPS | $(0.06) | $(0.02) | |
Non-GAAP diluted EPS | $0.25 | $0.28 | |
Fiscal Year 2019 Guidance
While we expect our fiscal year 2018 net new bookings growth will drive organic revenue growth in fiscal year 2019, based on the recent developments in our business, particularly our SRS business, and based on our new CEO’s desire to conduct a strategic review of our entire product portfolio and cost structure, we are withdrawing the fiscal year 2019 guidance we previously provided. We will provide updated guidance for fiscal year 2019 when we report our fourth quarter and full fiscal year 2018 results.
This ends the prepared conference call remarks.
About Nuance Communications, Inc.
Nuance Communications, Inc. (NASDAQ: NUAN) is the pioneer and leader in conversational and cognitive AI innovations that bring intelligence to everyday work and life. The Company delivers solutions that can understand, analyze and respond to human language to increase productivity and amplify human intelligence. With decades of domain and artificial intelligence expertise, Nuance works with thousands of organizations - in global industries that include healthcare, telecommunications, automotive, financial services, and retail - to create stronger relationships and better experiences for their customers and workforce. For more information, please visit www.nuance.com.
Trademark reference: Nuance and the Nuance logo are registered trademarks or trademarks of Nuance Communications, Inc. or its affiliates in the United States and/or other countries. All other trademarks referenced herein are the property of their respective owners.
Safe Harbor and Forward-Looking Statements
Statements in this document regarding future performance and our management’s future expectations, beliefs, goals, plans or prospects constitute forward-looking statements within the meaning of the Private Securities Litigation Reform Act of 1995. Any statements that are not statements of historical fact (including statements containing the words “believes,” “plans,” “anticipates,” “expects,” or “estimates” or similar expressions) should also be considered to be forward-looking statements. There are a number of important factors that could cause actual results or events to differ materially from those indicated by such forward-looking statements, including but not limited to: fluctuations in demand for our existing and future products; further unanticipated costs resulting from the FY17 malware incident including potential costs associated with litigation or governmental investigations that may result from the incident; our ability to control and successfully manage our expenses and cash position; our ability to develop and execute in a timely manner our productivity and cost initiatives; the effects of competition, including pricing pressure, and changing business models in the markets and industries we serve; changes to economic conditions in the United States and internationally; uncertainties associated with the transition of our chief executive officer; the imposition of tariffs or other trade measures particularly between the United States and China; potential future impairment charges related to our newly reorganized business reporting units; fluctuating currency rates; possible quality issues in our products and technologies; our ability to successfully integrate operations and employees of acquired businesses; the conversion rate of bookings into revenue; the ability to realize anticipated synergies from acquired businesses; and the other factors described in our Form 10-Q for the
| © 2018 Nuance Communications, Inc. All rights reserved | |
16 | 2018 second quarter results |
Prepared remarks | |
May 9, 2018 | |
period ended December 31, 2017. We disclaim any obligation to update any forward-looking statements as a result of developments occurring after the date of this document.
Definitions
Certain supplemental data provided in the prepared call remarks above are based upon internal Nuance definitions that are important for the reader to understand.
Non-GAAP Organic Revenue Growth. Organic revenue growth is calculated by comparing current period non-GAAP revenue to non-GAAP revenue from the corresponding prior-year period. For purposes of this calculation, prior period non-GAAP revenue is adjusted to include revenue from companies acquired by Nuance as if we had owned the acquired businesses in all periods presented. Non-GAAP organic revenue growth on a constant currency basis is calculated using current period non-GAAP revenue for entities reporting in currencies other than United States dollars, excluding United States dollar-denominated transactions recorded in those entities, converted into United States dollars using the average exchange rates from the prior-year period rather than the actual exchange rates in effect during the current period.
Bookings. Bookings represent the estimated gross revenue value of transactions at the time of contract execution, except for maintenance and support offerings. For fixed price contracts, the bookings value represents the gross total contract value. For contracts where revenue is based on transaction volume, the bookings value represents the contract price multiplied by the estimated future transaction volume during the contract term, whether or not such transaction volumes are guaranteed under a minimum commitment clause. Actual results could be different than our initial estimates. The maintenance and support bookings value represents the amounts billed in the period the customer is invoiced. Because of the inherent estimates required to determine bookings and the fact that the actual resultant revenue may differ from our initial bookings estimates, we consider bookings one indicator of potential future revenue and not as an arithmetic measure of backlog.
Net new bookings. Net new bookings represent the estimated revenue value at the time of contract execution from new contractual arrangements or the estimated revenue value incremental to the portion of value that will be renewed under pre-existing arrangements. Constant currency for net new bookings is calculated using current period net new bookings denominated in currencies other than United States dollars converted into United States dollars using the average exchange rate for those currencies from the prior-year period rather than the actual exchange rate in effect during the current period.
Annualized line run-rate in Nuance’s healthcare on-demand business. We determine this run rate using billed equivalent line counts in a given quarter, multiplied by four.
Estimated 3-year value of total on-demand contracts. We determine this value as of the end of the period reported, by using our best estimate of three years of anticipated future revenue streams under signed on-demand contracts then in place, whether or not they are guaranteed through a minimum commitment clause. Our best estimate is based on assumptions used in evaluating the contracts and determining sales compensation, adjusted for changes in estimated launch dates, actual volumes achieved, and other factors deemed relevant. For contracts with an expiration date beyond three years, we include only the value expected within three years. For other contracts, we assume renewal consistent with historic renewal rates unless there is a known cancellation. Investors should be aware that most of these contracts are priced by volume of usage and typically have no or low minimum commitments. Actual revenue could vary from our estimates due to factors such as cancellations, non-renewals or volume fluctuations.
Segment profit. Segment profit reflects the direct controllable costs of each segment together with an allocation of sales and corporate marketing expenses, and certain research and development project costs that benefit multiple product offerings. Segment profit represents income from operations excluding stock-based
| © 2018 Nuance Communications, Inc. All rights reserved | |
17 | 2018 second quarter results |
Prepared remarks | |
May 9, 2018 | |
compensation, amortization of intangible assets, acquisition-related costs, net, restructuring and other charges, net, costs associated with intellectual property collaboration agreements, other income (expense), net and certain unallocated corporate expenses.
Discussion of non-GAAP Financial Measures
We believe that providing the non-GAAP information to investors, in addition to the GAAP presentation, allows investors to view the financial results in the way management views the operating results. We further believe that providing this information allows investors to not only better understand our financial performance, but more importantly, to evaluate the efficacy of the methodology and information used by management to evaluate and measure such performance. The non-GAAP information included in this press release should not be considered superior to, or a substitute for, financial statements prepared in accordance with GAAP.
We utilize a number of different financial measures, both Generally Accepted Accounting Principles (“GAAP”) and non-GAAP, in analyzing and assessing the overall performance of the business, for making operating decisions and for forecasting and planning for future periods. Our annual financial plan is prepared both on a GAAP and non-GAAP basis, and the non-GAAP annual financial plan is approved by our board of directors. Continuous budgeting and forecasting for revenue and expenses are conducted on a consistent non-GAAP basis (in addition to GAAP) and actual results on a non-GAAP basis are assessed against the non-GAAP annual financial plan. The board of directors and management utilize these non-GAAP measures and results (in addition to the GAAP results) to determine our allocation of resources. In addition, and as a consequence of the importance of these measures in managing the business, we use non-GAAP measures and results in the evaluation process to establish management’s compensation. For example, our annual bonus program payments are based upon the achievement of consolidated non-GAAP revenue and consolidated non-GAAP earnings per share financial targets. We consider the use of non-GAAP revenue helpful in understanding the performance of our business, as it excludes the purchase accounting impact on acquired deferred revenue and other acquisition-related adjustments to revenue. We also consider the use of non-GAAP earnings per share helpful in assessing the organic performance of the continuing operations of our business. By organic performance we mean performance as if we had owned an acquired business in the same period a year ago. By constant currency organic performance, we mean performance excluding the effect of current foreign currency rate fluctuations. By continuing operations, we mean the ongoing results of the business excluding certain unplanned costs. While our management uses these non-GAAP financial measures as a tool to enhance their understanding of certain aspects of our financial performance, our management does not consider these measures to be a substitute for, or superior to, the information provided by GAAP financial statements. Consistent with this approach, we believe that disclosing non-GAAP financial measures to the readers of our financial statements provides such readers with useful supplemental data that, while not a substitute for GAAP financial statements, allows for greater transparency in the review of our financial and operational performance. In assessing the overall health of the business during the three and six months ended March 31, 2018 and 2017, our management has either included or excluded items in seven general categories, each of which is described below.
Acquisition-related revenue and cost of revenue.
We provide supplementary non-GAAP financial measures of revenue that include revenue that we would have recognized but for the purchase accounting treatment of acquisition transactions. Non-GAAP revenue also includes revenue that we would have recognized had we not acquired intellectual property and other assets from the same customer. Because GAAP accounting requires the elimination of this revenue, GAAP results alone do not fully capture all of our economic activities. These non-GAAP adjustments are intended to reflect the full amount of such revenue. We include non-GAAP revenue and cost of revenue to allow for more complete comparisons to the financial results of historical operations, forward-looking guidance and the financial results of peer companies. We believe these adjustments are useful to management and investors as a measure of the ongoing performance of the business because, although we cannot be certain that customers will renew their contracts, we have
| © 2018 Nuance Communications, Inc. All rights reserved | |
18 | 2018 second quarter results |
Prepared remarks | |
May 9, 2018 | |
historically experienced high renewal rates on maintenance and support agreements and other customer contracts. Additionally, although acquisition-related revenue adjustments are non-recurring with respect to past acquisitions, we generally will incur these adjustments in connection with any future acquisitions.
Acquisition-related costs, net.
In recent years, we have completed a number of acquisitions, which result in operating expenses, which would not otherwise have been incurred. We provide supplementary non-GAAP financial measures, which exclude certain transition, integration and other acquisition-related expense items resulting from acquisitions, to allow more accurate comparisons of the financial results to historical operations, forward looking guidance and the financial results of less acquisitive peer companies. We consider these types of costs and adjustments, to a great extent, to be unpredictable and dependent on a significant number of factors that are outside of our control. Furthermore, we do not consider these acquisition-related costs and adjustments to be related to the organic continuing operations of the acquired businesses and are generally not relevant to assessing or estimating the long-term performance of the acquired assets. In addition, the size, complexity and/or volume of past acquisitions, which often drives the magnitude of acquisition related costs, may not be indicative of the size, complexity and/or volume of future acquisitions. By excluding acquisition-related costs and adjustments from our non-GAAP measures, management is better able to evaluate our ability to utilize our existing assets and estimate the long-term value that acquired assets will generate for us. We believe that providing a supplemental non-GAAP measure, which excludes these items allows management and investors to consider the ongoing operations of the business both with, and without, such expenses.
These acquisition-related costs fall into the following categories: (i) transition and integration costs; (ii) professional service fees and expenses; and (iii) acquisition-related adjustments. Although these expenses are not recurring with respect to past acquisitions, we generally will incur these expenses in connection with any future acquisitions. These categories are further discussed as follows:
(i) Transition and integration costs. Transition and integration costs include retention payments, transitional employee costs, and earn-out payments treated as compensation expense, as well as the costs of integration-related activities, including services provided by third-parties.
(ii) Professional service fees and expenses. Professional service fees and expenses include financial advisory, legal, accounting and other outside services incurred in connection with acquisition activities, and disputes and regulatory matters related to acquired entities.
(iii) Acquisition-related adjustments. Acquisition-related adjustments include adjustments to acquisition-related items that are required to be marked to fair value each reporting period, such as contingent consideration, and other items related to acquisitions for which the measurement period has ended, such as gains or losses on settlements of pre-acquisition contingencies.
Amortization of acquired intangible assets.
We exclude the amortization of acquired intangible assets from non-GAAP expense and income measures. These amounts are inconsistent in amount and frequency and are significantly impacted by the timing and size of acquisitions. Providing a supplemental measure which excludes these charges allows management and investors to evaluate results “as-if” the acquired intangible assets had been developed internally rather than acquired and, therefore, provides a supplemental measure of performance in which our acquired intellectual property is treated in a comparable manner to our internally developed intellectual property. Although we exclude amortization of acquired intangible assets from our non-GAAP expenses, we believe that it is important for investors to understand that such intangible assets contribute to revenue generation. Amortization of intangible assets that relate to past acquisitions will recur in future periods until such intangible assets have been fully amortized. Future acquisitions may result in the amortization of additional intangible assets.
| © 2018 Nuance Communications, Inc. All rights reserved | |
19 | 2018 second quarter results |
Prepared remarks | |
May 9, 2018 | |
Non-cash expenses.
We provide non-GAAP information relative to the following non-cash expenses: (i) stock-based compensation; and (ii) non-cash interest. These items are further discussed as follows:
(i) Stock-based compensation. Because of varying valuation methodologies, subjective assumptions and the variety of award types, we believe that excluding stock-based compensation allows for more accurate comparisons of operating results to peer companies, as well as to times in our history when stock-based compensation was more or less significant as a portion of overall compensation than in the current period. We evaluate performance both with and without these measures because compensation expense related to stock-based compensation is typically non-cash and the options and restricted awards granted are influenced by the Company’s stock price and other factors such as volatility that are beyond our control. The expense related to stock-based awards is generally not controllable in the short-term and can vary significantly based on the timing, size and nature of awards granted. As such, we do not include such charges in operating plans. Stock-based compensation will continue in future periods.
(ii) Non-cash interest. We exclude non-cash interest because we believe that excluding this expense provides senior management, as well as other users of the financial statements, with a valuable perspective on the cash-based performance and health of the business, including the current near-term projected liquidity. Non-cash interest expense will continue in future periods.
Other expenses.
We exclude certain other expenses that result from unplanned events, outside the ordinary course of continuing operations, in order to measure operating performance and current and future liquidity both with and without these expenses. By providing this information, we believe management and the users of the financial statements are better able to understand the financial results of what we consider to be our organic, continuing operations. Included in these expenses are items such as restructuring charges, asset impairments and other charges (credits), net. We also exclude other items such as losses from extinguishing our convertible debt, consulting and professional services fees related to assessing strategic alternatives and our transformation program, implementation of the new revenue recognition standard (ASC 606), and expenses associated with the malware incident and remediation thereof.
Non-GAAP income tax provision.
Effective Q2 2017, we changed our method of calculating our non-GAAP income tax provision. Under the prior method, we calculated our non-GAAP tax provision using a cash tax method to reflect the estimated amount we expected to pay or receive in taxes related to the period, which is equivalent to our GAAP current tax provision. Under the new method, our non-GAAP income tax provision is determined based on our non-GAAP pre-tax income. The tax effect of each non-GAAP adjustment, if applicable, is computed based on the statutory tax rate of the jurisdiction to which the adjustment relates. Additionally, as our non-GAAP profitability is higher based on the non-GAAP adjustments, we adjust the GAAP tax provision to remove valuation allowances and related effects based on the higher level of reported non-GAAP profitability. We also exclude from our non-GAAP tax provision certain discrete tax items as they occur, which in fiscal year 2018 also includes certain impacts from the Tax Cuts and Jobs Act of 2017.
Financial Tables Follow
| © 2018 Nuance Communications, Inc. All rights reserved | |
20 | 2018 second quarter results |
Prepared remarks | |
May 9, 2018 | |
Nuance Communications, Inc.
Condensed Consolidated Statements of Operations
(in thousands, except per share amounts)
Unaudited
Three months ended March 31, | Six months ended March 31, | |||||||||||||||
2018 | 2017 | 2018 | 2017 | |||||||||||||
Revenues: | ||||||||||||||||
Professional services and hosting | $ | 274,574 | $ | 258,690 | $ | 533,601 | $ | 512,107 | ||||||||
Product and licensing | 161,284 | 159,258 | 323,094 | 311,010 | ||||||||||||
Maintenance and support | 78,366 | 81,625 | 159,174 | 164,114 | ||||||||||||
Total revenues | 514,224 | 499,573 | 1,015,869 | 987,231 | ||||||||||||
Cost of revenues: | ||||||||||||||||
Professional services and hosting | 181,051 | 164,170 | 353,579 | 329,062 | ||||||||||||
Product and licensing | 18,966 | 18,790 | 38,035 | 37,168 | ||||||||||||
Maintenance and support | 14,191 | 13,240 | 28,432 | 26,838 | ||||||||||||
Amortization of intangible assets | 14,780 | 17,218 | 30,136 | 32,760 | ||||||||||||
Total cost of revenues | 228,988 | 213,418 | 450,182 | 425,828 | ||||||||||||
Gross profit | 285,236 | 286,155 | 565,687 | 561,403 | ||||||||||||
Operating expenses: | ||||||||||||||||
Research and development | 74,185 | 66,232 | 147,551 | 132,554 | ||||||||||||
Sales and marketing | 94,187 | 93,674 | 196,147 | 195,190 | ||||||||||||
General and administrative | 74,288 | 41,518 | 127,180 | 81,308 | ||||||||||||
Amortization of intangible assets | 22,670 | 27,912 | 45,734 | 55,771 | ||||||||||||
Acquisition-related costs, net | 2,360 | 5,379 | 7,921 | 14,405 | ||||||||||||
Restructuring and other charges, net | 8,948 | 19,911 | 23,749 | 26,614 | ||||||||||||
Impairment of goodwill | 137,907 | — | 137,907 | — | ||||||||||||
Total operating expenses | 414,545 | 254,626 | 686,189 | 505,842 | ||||||||||||
(Loss) income from operations | (129,309 | ) | 31,529 | (120,502 | ) | 55,561 | ||||||||||
Other expenses, net | (32,200 | ) | (56,196 | ) | (66,300 | ) | (93,803 | ) | ||||||||
Loss before income taxes | (161,509 | ) | (24,667 | ) | (186,802 | ) | (38,242 | ) | ||||||||
Provision (benefit) for income taxes | 2,544 | 9,141 | (75,977 | ) | 19,494 | |||||||||||
Net loss | $ | (164,053 | ) | $ | (33,808 | ) | $ | (110,825 | ) | $ | (57,736 | ) | ||||
Net loss per share: | ||||||||||||||||
Basic | $ | (0.56 | ) | $ | (0.12 | ) | $ | (0.38 | ) | $ | (0.20 | ) | ||||
Diluted | $ | (0.56 | ) | $ | (0.12 | ) | $ | (0.38 | ) | $ | (0.20 | ) | ||||
Weighted average common shares outstanding: | ||||||||||||||||
Basic | 294,103 | 291,021 | 292,720 | 289,976 | ||||||||||||
Diluted | 294,103 | 291,021 | 292,720 | 289,976 | ||||||||||||
| © 2018 Nuance Communications, Inc. All rights reserved | |
21 | 2018 second quarter results |
Prepared remarks | |
May 9, 2018 | |
Nuance Communications, Inc.
Condensed Consolidated Balance Sheets
(in thousands)
Unaudited
March 31, 2018 | September 30, 2017 | ||||||||
ASSETS | |||||||||
Current assets: | |||||||||
Cash and cash equivalents | $ | 468,642 | $ | 592,299 | |||||
Marketable securities | 153,008 | 251,981 | |||||||
Accounts receivable, net | 411,648 | 395,392 | |||||||
Prepaid expenses and other current assets | 107,929 | 88,269 | |||||||
Total current assets | 1,141,227 | 1,327,941 | |||||||
Marketable securities | 27,087 | 29,844 | |||||||
Land, building and equipment, net | 172,521 | 176,548 | |||||||
Goodwill | 3,472,849 | 3,590,608 | |||||||
Intangible assets, net | 596,060 | 664,474 | |||||||
Other assets | 147,016 | 142,508 | |||||||
Total assets | $ | 5,556,760 | $ | 5,931,923 | |||||
LIABILITIES AND STOCKHOLDERS' EQUITY | |||||||||
Current liabilities: | |||||||||
Current portion of long-term debt | $ | — | $ | 376,121 | |||||
Contingent and deferred acquisition payments | 20,926 | 28,860 | |||||||
Accounts payable, accrued expenses and other current liabilities | 307,447 | 340,505 | |||||||
Deferred revenue | 413,126 | 366,042 | |||||||
Total current liabilities | 741,499 | 1,111,528 | |||||||
Long-term debt | 2,311,484 | 2,241,283 | |||||||
Deferred revenue, net of current portion | 469,575 | 423,929 | |||||||
Other liabilities | 140,520 | 223,801 | |||||||
Total liabilities | 3,663,078 | 4,000,541 | |||||||
Stockholders' equity | 1,893,682 | 1,931,382 | |||||||
Total liabilities and stockholders' equity | $ | 5,556,760 | $ | 5,931,923 | |||||
| © 2018 Nuance Communications, Inc. All rights reserved | |
22 | 2018 second quarter results |
Prepared remarks | |
May 9, 2018 | |
Nuance Communications, Inc.
Consolidated Statements of Cash Flows
(in thousands)
Unaudited
Three months ended March 31, | Six months ended March 31, | |||||||||||||||
2018 | 2017 | 2018 | 2017 | |||||||||||||
Cash flows from operating activities: | ||||||||||||||||
Net loss | $ | (164,053 | ) | $ | (33,808 | ) | $ | (110,825 | ) | $ | (57,736 | ) | ||||
Adjustments to reconcile net loss to net cash provided by operating activities: | ||||||||||||||||
Depreciation and amortization | 52,740 | 58,638 | 107,055 | 116,644 | ||||||||||||
Stock-based compensation | 33,749 | 40,348 | 71,735 | 79,478 | ||||||||||||
Non-cash interest expense | 11,854 | 13,732 | 25,195 | 26,771 | ||||||||||||
Deferred tax provision (benefit) | 6,895 | 3,637 | (90,331 | ) | 5,643 | |||||||||||
Loss on extinguishment of debt | — | 18,565 | — | 18,565 | ||||||||||||
Impairment of goodwill | 137,907 | — | 137,907 | — | ||||||||||||
Impairment of fixed asset | 434 | 10,944 | 1,780 | 10,944 | ||||||||||||
Other | 1,294 | 487 | 579 | 2,342 | ||||||||||||
Changes in operating assets and liabilities, excluding effects of acquisitions: | ||||||||||||||||
Accounts receivable | 23,925 | 8,282 | (12,415 | ) | (1,431 | ) | ||||||||||
Prepaid expenses and other assets | (3,087 | ) | 3,704 | (22,059 | ) | (12,295 | ) | |||||||||
Accounts payable | 8,083 | 20,244 | (3,773 | ) | (1,000 | ) | ||||||||||
Accrued expenses and other liabilities | 2,131 | (16,420 | ) | 5,230 | (10,579 | ) | ||||||||||
Deferred revenue | (2,612 | ) | (2,919 | ) | 85,287 | 72,988 | ||||||||||
Net cash provided by operating activities | 109,260 | 125,434 | 195,365 | 250,334 | ||||||||||||
Cash flows from investing activities: | ||||||||||||||||
Capital expenditures | (12,783 | ) | (7,388 | ) | (25,326 | ) | (18,787 | ) | ||||||||
Payments for business and asset acquisitions, net of cash acquired | (4,120 | ) | (50,041 | ) | (12,768 | ) | (72,990 | ) | ||||||||
Purchases of marketable securities and other investments | (60,547 | ) | (81,054 | ) | (92,994 | ) | (153,851 | ) | ||||||||
Proceeds from sales and maturities of marketable securities and other investments | 35,468 | 59,553 | 195,273 | 69,658 | ||||||||||||
Net cash (used in) provided by investing activities | (41,982 | ) | (78,930 | ) | 64,185 | (175,970 | ) | |||||||||
Cash flows from financing activities: | ||||||||||||||||
Repayment and redemption of debt | — | (634,055 | ) | (331,172 | ) | (634,055 | ) | |||||||||
Proceeds from issuance of long-term debt, net of issuance costs | — | 343,959 | — | 838,959 | ||||||||||||
Payments for repurchase of common stock | — | (99,077 | ) | — | (99,077 | ) | ||||||||||
Acquisition payments with extended payment terms | (47 | ) | — | (16,927 | ) | — | ||||||||||
Proceeds from issuance of common stock from employee stock plans | 9,354 | 8,553 | 9,360 | 8,598 | ||||||||||||
Payments for taxes related to net share settlement of equity awards | (5,389 | ) | (2,993 | ) | (44,006 | ) | (43,353 | ) | ||||||||
Other financing activities | (582 | ) | (119 | ) | (647 | ) | (206 | ) | ||||||||
Net cash provided by (used in) financing activities | 3,336 | (383,732 | ) | (383,392 | ) | 70,866 | ||||||||||
Effects of exchange rate changes on cash and cash equivalents | (433 | ) | 1,261 | 185 | (1,210 | ) | ||||||||||
Net increase (decrease) in cash and cash equivalents | 70,181 | (335,967 | ) | (123,657 | ) | 144,020 | ||||||||||
Cash and cash equivalents at beginning of period | 398,461 | 961,607 | 592,299 | 481,620 | ||||||||||||
Cash and cash equivalents at end of period | $ | 468,642 | $ | 625,640 | $ | 468,642 | $ | 625,640 | ||||||||
| © 2018 Nuance Communications, Inc. All rights reserved | |
23 | 2018 second quarter results |
Prepared remarks | |
May 9, 2018 | |
Nuance Communications, Inc.
Supplemental Financial Information - GAAP to Non-GAAP Reconciliations
(in thousands)
Unaudited
Three months ended | Six months ended | |||||||||||||||
March 31, | March 31, | |||||||||||||||
2018 | 2017 | 2018 | 2017 | |||||||||||||
GAAP revenues | $ | 514,224 | $ | 499,573 | $ | 1,015,869 | $ | 987,231 | ||||||||
Acquisition-related revenue adjustments: professional services and hosting | 1,020 | 2,817 | 2,295 | 5,250 | ||||||||||||
Acquisition-related revenue adjustments: product and licensing | 2,934 | 8,313 | 8,781 | 14,029 | ||||||||||||
Acquisition-related revenue adjustments: maintenance and support | 136 | 394 | 194 | 605 | ||||||||||||
Non-GAAP revenues | $ | 518,314 | $ | 511,097 | $ | 1,027,139 | $ | 1,007,115 | ||||||||
GAAP cost of revenues | $ | 228,988 | $ | 213,418 | $ | 450,182 | $ | 425,828 | ||||||||
Cost of revenues from amortization of intangible assets | (14,780 | ) | (17,218 | ) | (30,136 | ) | (32,760 | ) | ||||||||
Cost of revenues adjustments: professional services and hosting (1) | (6,322 | ) | (8,080 | ) | (13,729 | ) | (16,490 | ) | ||||||||
Cost of revenues adjustments: product and licensing (1) | (112 | ) | (102 | ) | (378 | ) | (194 | ) | ||||||||
Cost of revenues adjustments: maintenance and support (1) | (885 | ) | (1,010 | ) | (2,089 | ) | (1,987 | ) | ||||||||
Non-GAAP cost of revenues | $ | 206,889 | $ | 187,008 | $ | 403,850 | $ | 374,397 | ||||||||
GAAP gross profit | $ | 285,236 | $ | 286,155 | $ | 565,687 | $ | 561,403 | ||||||||
Gross profit adjustments | 26,189 | 37,934 | 57,602 | 71,315 | ||||||||||||
Non-GAAP gross profit | $ | 311,425 | $ | 324,089 | $ | 623,289 | $ | 632,718 | ||||||||
GAAP (loss) income from operations | $ | (129,309 | ) | $ | 31,529 | $ | (120,502 | ) | $ | 55,561 | ||||||
Gross profit adjustments | 26,189 | 37,934 | 57,602 | 71,315 | ||||||||||||
Research and development (1) | 8,396 | 8,398 | 18,092 | 16,888 | ||||||||||||
Sales and marketing (1) | 8,366 | 11,018 | 19,042 | 22,987 | ||||||||||||
General and administrative (1) | 9,668 | 11,740 | 18,405 | 20,932 | ||||||||||||
Acquisition-related costs, net | 2,360 | 5,379 | 7,921 | 14,405 | ||||||||||||
Amortization of intangible assets | 22,670 | 27,912 | 45,734 | 55,771 | ||||||||||||
Restructuring and other charges, net | 8,948 | 19,911 | 23,749 | 26,614 | ||||||||||||
Impairment of goodwill | 137,907 | — | 137,907 | — | ||||||||||||
Other (4) | 31,212 | 2,721 | 43,176 | 5,711 | ||||||||||||
Non-GAAP income from operations | $ | 126,407 | $ | 156,542 | $ | 251,126 | $ | 290,184 | ||||||||
GAAP loss before income taxes | $ | (161,509 | ) | $ | (24,667 | ) | $ | (186,802 | ) | $ | (38,242 | ) | ||||
Gross profit adjustments | 26,189 | 37,934 | 57,602 | 71,315 | ||||||||||||
Research and development (1) | 8,396 | 8,398 | 18,092 | 16,888 | ||||||||||||
Sales and marketing (1) | 8,366 | 11,018 | 19,042 | 22,987 | ||||||||||||
General and administrative (1) | 9,668 | 11,740 | 18,405 | 20,932 | ||||||||||||
Acquisition-related costs, net | 2,360 | 5,379 | 7,921 | 14,405 | ||||||||||||
Amortization of intangible assets | 22,670 | 27,912 | 45,734 | 55,771 | ||||||||||||
Restructuring and other charges, net | 8,948 | 19,911 | 23,749 | 26,614 | ||||||||||||
Impairment of goodwill | 137,907 | — | 137,907 | — | ||||||||||||
Non-cash interest expense | 11,854 | 13,732 | 25,195 | 26,771 | ||||||||||||
Loss on extinguishment of debt | — | 18,565 | — | 18,565 | ||||||||||||
Other (4) | 31,212 | 2,721 | 43,176 | 5,711 | ||||||||||||
Non-GAAP income before income taxes | $ | 106,061 | $ | 132,643 | $ | 210,021 | $ | 241,717 | ||||||||
(4) Includes approximately $28 million and $38 million in professional services costs associated with considering strategic alternatives for certain businesses and establishing our Automotive business as an independent reporting segment, for the three and six months ended March 31, 2018, respectively. | ||||||||||||||||
| © 2018 Nuance Communications, Inc. All rights reserved | |
24 | 2018 second quarter results |
Prepared remarks | |
May 9, 2018 | |
Nuance Communications, Inc.
Supplemental Financial Information - GAAP to Non-GAAP Reconciliations, continued
(in thousands, except per share amounts)
Unaudited
Three months ended | Six months ended | |||||||||||||||
March 31, | March 31, | |||||||||||||||
2018 | 2017 | 2018 | 2017 | |||||||||||||
GAAP provision (benefit) for income taxes | $ | 2,544 | $ | 9,141 | $ | (75,977 | ) | $ | 19,494 | |||||||
Income tax effect of Non-GAAP adjustments | 37,069 | 50,658 | 69,230 | 93,289 | ||||||||||||
Removal of valuation allowance and other items | (20,540 | ) | (18,254 | ) | (34,083 | ) | (39,001 | ) | ||||||||
Removal of discrete items (3) | 7,874 | (1,675 | ) | 91,069 | (1,732 | ) | ||||||||||
Non-GAAP provision for income taxes | $ | 26,947 | $ | 39,870 | $ | 50,239 | $ | 72,050 | ||||||||
GAAP net loss | $ | (164,053 | ) | $ | (33,808 | ) | $ | (110,825 | ) | $ | (57,736 | ) | ||||
Acquisition-related adjustment - revenues (2) | 4,090 | 11,524 | 11,270 | 19,884 | ||||||||||||
Acquisition-related costs, net | 2,360 | 5,379 | 7,921 | 14,405 | ||||||||||||
Cost of revenue from amortization of intangible assets | 14,780 | 17,218 | 30,136 | 32,760 | ||||||||||||
Amortization of intangible assets | 22,670 | 27,912 | 45,734 | 55,771 | ||||||||||||
Restructuring and other charges, net | 8,948 | 19,911 | 23,749 | 26,614 | ||||||||||||
Loss on extinguishment of debt | — | 18,565 | — | 18,565 | ||||||||||||
Impairment of goodwill | 137,907 | — | 137,907 | — | ||||||||||||
Stock-based compensation (1) | 33,749 | 40,348 | 71,735 | 79,478 | ||||||||||||
Non-cash interest expense | 11,854 | 13,732 | 25,195 | 26,771 | ||||||||||||
Adjustment to income tax expense | (24,403 | ) | (30,729 | ) | (126,216 | ) | (52,556 | ) | ||||||||
Other (4) | 31,212 | 2,721 | 43,176 | 5,711 | ||||||||||||
Non-GAAP net income | $ | 79,114 | $ | 92,773 | $ | 159,782 | $ | 169,667 | ||||||||
Non-GAAP diluted net income per share | $ | 0.27 | $ | 0.32 | $ | 0.53 | $ | 0.58 | ||||||||
Diluted weighted average common shares outstanding | 296,449 | 293,072 | 299,822 | 293,331 | ||||||||||||
(3) As a result of the Tax Cuts and Jobs Act of 2017 (‘TCJA’), for the six months ended March 31, 2018, we record a tax benefit of approximately $87.0 million related to remeasuring certain deferred tax assets and liabilities at the lower rates, offset in part by a $2.0 million provision for the deemed repatriation of foreign cash and earnings. For the three months ended March 31, 2018, we recorded a tax expense of approximately $10.0 million, as we revised our estimates of the deferred tax benefit, offset by a cash tax benefit of $12.0 million based on recent IRS guidance regarding the mandatory one-time repatriation tax, reducing the original $14.0 million tax expense recorded in the first quarter of 2018. Also for the three and six months ended March 31, 2018, we recorded a tax benefit of $8.5 million related to the impairment of deductible goodwill in Brazil. | ||||||||||||||||
(4) Includes approximately $28 million and $38 million in professional services costs associated with considering strategic alternatives for certain businesses and establishing our Automotive business as an independent reporting segment, for the three and six months ended March 31, 2018, respectively. | ||||||||||||||||
| © 2018 Nuance Communications, Inc. All rights reserved | |
25 | 2018 second quarter results |
Prepared remarks | |
May 9, 2018 | |
Nuance Communications, Inc.
Supplemental Financial Information - GAAP to Non-GAAP Reconciliations, continued
(in thousands)
Unaudited
Three months ended March 31, | Six months ended March 31, | |||||||||||||||
2018 | 2017 | 2018 | 2017 | |||||||||||||
GAAP operating expenses | $ | 414,545 | $ | 254,626 | $ | 686,189 | $ | 505,842 | ||||||||
Research and development (1) | (8,396 | ) | (8,398 | ) | (18,092 | ) | (16,888 | ) | ||||||||
Sales and marketing (1) | (8,366 | ) | (11,018 | ) | (19,042 | ) | (22,987 | ) | ||||||||
General and administrative (1) | (9,668 | ) | (11,740 | ) | (18,405 | ) | (20,932 | ) | ||||||||
Acquisition-related costs, net | (2,360 | ) | (5,379 | ) | (7,921 | ) | (14,405 | ) | ||||||||
Amortization of intangible assets | (22,670 | ) | (27,912 | ) | (45,734 | ) | (55,771 | ) | ||||||||
Restructuring and other charges, net | (8,948 | ) | (19,911 | ) | (23,749 | ) | (26,614 | ) | ||||||||
Impairment of Goodwill | (137,907 | ) | — | (137,907 | ) | — | ||||||||||
Other | (31,212 | ) | (2,721 | ) | (43,176 | ) | (5,711 | ) | ||||||||
Non-GAAP operating expenses | $ | 185,018 | $ | 167,547 | $ | 372,163 | $ | 342,534 | ||||||||
GAAP research and development expense | $ | 74,185 | $ | 66,232 | $ | 147,551 | $ | 132,554 | ||||||||
Stock-based compensation (1) | (8,396 | ) | (8,398 | ) | (18,092 | ) | (16,888 | ) | ||||||||
Non-GAAP research and development expense | $ | 65,789 | $ | 57,834 | $ | 129,459 | $ | 115,666 | ||||||||
GAAP sales and marketing expense | $ | 94,187 | $ | 93,674 | $ | 196,147 | $ | 195,190 | ||||||||
Stock-based compensation (1) | (8,366 | ) | (11,018 | ) | (19,042 | ) | (22,987 | ) | ||||||||
Non-GAAP sales and marketing expense | $ | 85,821 | $ | 82,656 | $ | 177,105 | $ | 172,203 | ||||||||
GAAP general and administrative expense | $ | 74,288 | $ | 41,518 | $ | 127,180 | $ | 81,308 | ||||||||
Stock-based compensation (1) | (9,668 | ) | (11,740 | ) | (18,405 | ) | (20,932 | ) | ||||||||
Other | (31,212 | ) | (2,721 | ) | (43,176 | ) | (5,711 | ) | ||||||||
Non-GAAP general and administrative expense | $ | 33,408 | $ | 27,057 | $ | 65,599 | $ | 54,665 | ||||||||
| © 2018 Nuance Communications, Inc. All rights reserved | |
26 | 2018 second quarter results |
Prepared remarks | |
May 9, 2018 | |
Nuance Communications, Inc.
Supplemental Financial Information - GAAP to Non-GAAP Reconciliations, continued
(in thousands)
Unaudited
Three months ended March 31, | Six months ended March 31, | ||||||||||||||
2018 | 2017 | 2018 | 2017 | ||||||||||||
(1) Stock-based compensation | |||||||||||||||
Cost of professional services and hosting | $ | 6,322 | $ | 8,080 | $ | 13,729 | $ | 16,490 | |||||||
Cost of product and licensing | 112 | 102 | 378 | 194 | |||||||||||
Cost of maintenance and support | 885 | 1,010 | 2,089 | 1,987 | |||||||||||
Research and development | 8,396 | 8,398 | 18,092 | 16,888 | |||||||||||
Sales and marketing | 8,366 | 11,018 | 19,042 | 22,987 | |||||||||||
General and administrative | 9,668 | 11,740 | 18,405 | 20,932 | |||||||||||
Total | $ | 33,749 | $ | 40,348 | $ | 71,735 | $ | 79,478 | |||||||
(2) Acquisition-related revenue and cost of revenue | |||||||||||||||
Revenues | $ | 4,090 | $ | 11,524 | $ | 11,270 | $ | 19,884 | |||||||
Total | $ | 4,090 | $ | 11,524 | $ | 11,270 | $ | 19,884 | |||||||
| © 2018 Nuance Communications, Inc. All rights reserved | |
27 | 2018 second quarter results |
Prepared remarks | |
May 9, 2018 | |
Nuance Communications, Inc.
Supplemental Financial Information – GAAP to Non-GAAP Reconciliations, continued
(in millions)
Unaudited
Hosting Revenues | Q1 | Q2 | Q3 | Q4 | FY | Q1 | Q2 | |||||||||||||||||||||
2017 | 2017 | 2017 | 2017 | 2017 | 2018 | 2018 | ||||||||||||||||||||||
GAAP Revenues | $ | 193.3 | $ | 202.2 | $ | 189.4 | $ | 149.0 | $ | 733.8 | $ | 185.1 | $ | 194.4 | ||||||||||||||
Adjustment | 2.3 | 2.7 | 3.1 | 2.0 | 10.1 | 1.2 | 1.0 | |||||||||||||||||||||
Non-GAAP Revenues | $ | 195.6 | $ | 204.8 | $ | 192.5 | $ | 150.9 | $ | 743.9 | $ | 186.3 | $ | 195.4 | ||||||||||||||
Maintenance and Support Revenues | Q1 | Q2 | Q3 | Q4 | FY | Q1 | Q2 | |||||||||||||||||||||
2017 | 2017 | 2017 | 2017 | 2017 | 2018 | 2018 | ||||||||||||||||||||||
GAAP Revenues | $ | 82.5 | $ | 81.6 | $ | 80.5 | $ | 82.5 | $ | 327.1 | $ | 80.8 | $ | 78.4 | ||||||||||||||
Adjustment | 0.2 | 0.4 | 0.2 | 0.2 | 1.0 | 0.1 | 0.1 | |||||||||||||||||||||
Non-GAAP Revenues | $ | 82.7 | $ | 82.0 | $ | 80.7 | $ | 82.7 | $ | 328.1 | $ | 80.9 | $ | 78.5 | ||||||||||||||
Perpetual Product and Licensing Revenues | Q1 | Q2 | Q3 | Q4 | FY | Q1 | Q2 | |||||||||||||||||||||
2017 | 2017 | 2017 | 2017 | 2017 | 2018 | 2018 | ||||||||||||||||||||||
GAAP Revenues | $ | 78.7 | $ | 76.5 | $ | 73.5 | $ | 77.3 | $ | 306.0 | $ | 76.6 | $ | 73.0 | ||||||||||||||
Adjustment | 0.7 | 0.5 | 0.9 | 0.4 | 2.4 | 0.4 | 0.3 | |||||||||||||||||||||
Non-GAAP Revenues | $ | 79.3 | $ | 77.0 | $ | 74.4 | $ | 77.7 | $ | 308.4 | $ | 76.9 | $ | 73.3 | ||||||||||||||
Recurring Product and Licensing Revenues | Q1 | Q2 | Q3 | Q4 | FY | Q1 | Q2 | |||||||||||||||||||||
2017 | 2017 | 2017 | 2017 | 2017 | 2018 | 2018 | ||||||||||||||||||||||
GAAP Revenues | $ | 73.1 | $ | 82.8 | $ | 80.8 | $ | 92.8 | $ | 329.4 | $ | 85.2 | $ | 88.3 | ||||||||||||||
Adjustment | 5.1 | 7.8 | 5.0 | 6.1 | 24.1 | 5.4 | 2.7 | |||||||||||||||||||||
Non-GAAP Revenues | $ | 78.2 | $ | 90.6 | $ | 85.8 | $ | 98.9 | $ | 353.5 | $ | 90.7 | $ | 90.9 | ||||||||||||||
Professional Services Revenues | Q1 | Q2 | Q3 | Q4 | FY | Q1 | Q2 | |||||||||||||||||||||
2017 | 2017 | 2017 | 2017 | 2017 | 2018 | 2018 | ||||||||||||||||||||||
GAAP Revenues | $ | 60.1 | $ | 56.5 | $ | 62.1 | $ | 64.3 | $ | 243.1 | $ | 73.9 | $ | 80.2 | ||||||||||||||
Adjustment | 0.2 | 0.1 | 0.1 | 0.1 | 0.5 | 0.1 | — | |||||||||||||||||||||
Non-GAAP Revenues | $ | 60.3 | $ | 56.7 | $ | 62.2 | $ | 64.4 | $ | 243.6 | $ | 74.0 | $ | 80.2 | ||||||||||||||
Total Recurring Revenues | Q1 | Q2 | Q3 | Q4 | FY | Q1 | Q2 | |||||||||||||||||||||
2017 | 2017 | 2017 | 2017 | 2017 | 2018 | 2018 | ||||||||||||||||||||||
GAAP Revenues | $ | 353.0 | $ | 370.2 | $ | 354.5 | $ | 328.6 | $ | 1,406.4 | $ | 355.3 | $ | 365.0 | ||||||||||||||
Adjustment | 7.5 | 11.4 | 8.7 | 8.2 | 35.9 | 6.9 | 3.9 | |||||||||||||||||||||
Non-GAAP Revenues | $ | 360.5 | $ | 381.7 | $ | 363.2 | $ | 336.8 | $ | 1,442.3 | $ | 362.2 | $ | 368.9 | ||||||||||||||
Schedules may not add due to rounding.
| © 2018 Nuance Communications, Inc. All rights reserved | |
28 | 2018 second quarter results |
Prepared remarks | |
May 9, 2018 | |
Nuance Communications, Inc.
Supplemental Financial Information – GAAP to Non-GAAP Reconciliations, continued
(in millions)
Unaudited
Total Revenues | Q1 | Q2 | Q3 | Q4 | FY | Q1 | Q2 | |||||||||||||||||||||
2017 | 2017 | 2017 | 2017 | 2017 | 2018 | 2018 | ||||||||||||||||||||||
GAAP Revenues | $ | 487.7 | $ | 499.6 | $ | 486.2 | $ | 465.9 | $ | 1,939.4 | $ | 501.6 | $ | 514.2 | ||||||||||||||
Adjustment | 8.4 | 11.5 | 9.4 | 8.7 | 38.0 | 7.2 | 4.1 | |||||||||||||||||||||
Non-GAAP Revenues | $ | 496.0 | $ | 511.1 | $ | 495.6 | $ | 474.7 | $ | 1,977.4 | $ | 508.8 | $ | 518.3 | ||||||||||||||
Healthcare | Q1 | Q2 | Q3 | Q4 | FY | Q1 | Q2 | |||||||||||||||||||||
2017 | 2017 | 2017 | 2017 | 2017 | 2018 | 2018 | ||||||||||||||||||||||
GAAP Revenues | $ | 237.7 | $ | 237.3 | $ | 231.2 | $ | 186.7 | $ | 893.0 | $ | 244.0 | $ | 260.1 | ||||||||||||||
Adjustment | 1.5 | 1.2 | 1.4 | 2.3 | 6.3 | 1.5 | 1.1 | |||||||||||||||||||||
Non-GAAP Revenues | $ | 239.2 | $ | 238.5 | $ | 232.6 | $ | 189.0 | $ | 899.3 | $ | 245.5 | $ | 261.2 | ||||||||||||||
Enterprise | Q1 | Q2 | Q3 | Q4 | FY | Q1 | Q2 | |||||||||||||||||||||
2017 | 2017 | 2017 | 2017 | 2017 | 2018 | 2018 | ||||||||||||||||||||||
GAAP Revenues | $ | 111.7 | $ | 115.3 | $ | 110.2 | $ | 119.0 | $ | 456.2 | $ | 117.4 | $ | 111.4 | ||||||||||||||
Adjustment | 3.7 | 6.8 | 3.9 | 3.7 | 18.1 | 3.2 | 1.3 | |||||||||||||||||||||
Non-GAAP Revenues | $ | 115.4 | $ | 122.1 | $ | 114.1 | $ | 122.7 | $ | 474.3 | $ | 120.6 | $ | 112.7 | ||||||||||||||
Automotive | Q1 | Q2 | Q3 | Q4 | FY | Q1 | Q2 | |||||||||||||||||||||
2017 | 2017 | 2017 | 2017 | 2017 | 2018 | 2018 | ||||||||||||||||||||||
GAAP Revenues | $ | 57.9 | $ | 60.8 | $ | 62.2 | $ | 67.6 | $ | 248.4 | $ | 60.6 | $ | 68.1 | ||||||||||||||
Adjustment | 1.0 | 0.9 | 0.9 | 0.9 | 3.8 | 0.9 | 0.9 | |||||||||||||||||||||
Non-GAAP Revenues | $ | 58.9 | $ | 61.7 | $ | 63.1 | $ | 68.5 | $ | 252.2 | $ | 61.5 | $ | 69.0 | ||||||||||||||
Imaging | Q1 | Q2 | Q3 | Q4 | FY | Q1 | Q2 | |||||||||||||||||||||
2017 | 2017 | 2017 | 2017 | 2017 | 2018 | 2018 | ||||||||||||||||||||||
GAAP Revenues | $ | 50.1 | $ | 51.3 | $ | 47.9 | $ | 61.9 | $ | 211.2 | $ | 54.4 | $ | 48.0 | ||||||||||||||
Adjustment | 1.9 | 1.8 | 1.5 | 1.3 | 6.5 | 1.2 | 0.9 | |||||||||||||||||||||
Non-GAAP Revenues | $ | 52.1 | $ | 53.0 | $ | 49.4 | $ | 63.2 | $ | 217.7 | $ | 55.6 | $ | 48.9 | ||||||||||||||
Other | Q1 | Q2 | Q3 | Q4 | FY | Q1 | Q2 | |||||||||||||||||||||
2017 | 2017 | 2017 | 2017 | 2017 | 2018 | 2018 | ||||||||||||||||||||||
GAAP Revenues | $ | 30.1 | $ | 35.0 | $ | 34.8 | $ | 30.7 | $ | 130.6 | $ | 25.5 | $ | 26.5 | ||||||||||||||
Adjustment | 0.4 | 0.7 | 1.6 | 0.5 | 3.2 | 0.1 | — | |||||||||||||||||||||
Non-GAAP Revenues | $ | 30.5 | $ | 35.7 | $ | 36.4 | $ | 31.2 | $ | 133.8 | $ | 25.6 | $ | 26.5 | ||||||||||||||
Schedules may not add due to rounding.
| © 2018 Nuance Communications, Inc. All rights reserved | |
29 | 2018 second quarter results |
Prepared remarks | |
May 9, 2018 | |
Nuance Communications, Inc.
Supplemental Financial Information – GAAP to Non-GAAP Reconciliations, continued
(in millions)
Unaudited
Table: Non-GAAP Revenue Reclassification | Q1 | Q2 | Q3 | Q4 | FY | Q1 | Q2 | ||||||||||||||
2017 | 2017 | 2017 | 2017 | 2017 | 2018 | 2018 | |||||||||||||||
Enterprise, as previously reported | $ | 112.9 | $ | 119.4 | $ | 112.1 | $ | 117.9 | $ | 462.3 | $ | 117.8 | $ | 109.2 | |||||||
TV Reclassification | 2.4 | 2.8 | 2.0 | 4.8 | 12.0 | 2.8 | 3.4 | ||||||||||||||
Enterprise, as adjusted | $ | 115.4 | $ | 122.1 | $ | 114.1 | $ | 122.7 | $ | 474.3 | $ | 120.6 | $ | 112.7 | |||||||
Table: Segment Profits Reclassification | Q1 | Q2 | Q3 | Q4 | FY | Q1 | Q2 | ||||||||||||||
2017 | 2017 | 2017 | 2017 | 2017 | 2018 | 2018 | |||||||||||||||
Enterprise, as previously reported | $ | 32.0 | $ | 41.8 | $ | 34.4 | $ | 33.0 | $ | 141.2 | $ | 38.9 | $ | 27.1 | |||||||
TV Reclassification | (2.0 | ) | (1.4 | ) | (2.0 | ) | (0.1 | ) | (5.6 | ) | (1.2 | ) | (1.4 | ) | |||||||
Enterprise, as adjusted | $ | 29.9 | $ | 40.3 | $ | 32.4 | $ | 33.0 | $ | 135.6 | $ | 37.7 | $ | 25.7 | |||||||
Enterprise segment profit, as previously reported | 28 | % | 35 | % | 31 | % | 28 | % | 31 | % | 33 | % | 25 | % | |||||||
Enterprise segment profit, as adjusted | 26 | % | 33 | % | 28 | % | 27 | % | 29 | % | 31 | % | 23 | % | |||||||
Table: Non-GAAP Revenue Reclassification | Q1 | Q2 | Q3 | Q4 | FY | Q1 | Q2 | ||||||||||||||
2017 | 2017 | 2017 | 2017 | 2017 | 2018 | 2018 | |||||||||||||||
Mobile, as previously reported | $ | 91.8 | $ | 100.2 | $ | 101.5 | $ | 104.5 | $ | 398.0 | $ | 89.8 | $ | 98.9 | |||||||
Automotive Reclassification | (58.9 | ) | (61.7 | ) | (63.1 | ) | (68.5 | ) | (252.2 | ) | (61.5 | ) | (69.0 | ) | |||||||
TV Reclassification | (2.4 | ) | (2.8 | ) | (2.0 | ) | (4.8 | ) | (12.0 | ) | (2.8 | ) | (3.4 | ) | |||||||
Other, as adjusted | $ | 30.5 | $ | 35.7 | $ | 36.4 | $ | 31.2 | $ | 133.8 | $ | 25.6 | $ | 26.5 | |||||||
Table: Segment Profits Reclassification | Q1 | Q2 | Q3 | Q4 | FY | Q1 | Q2 | ||||||||||||||
2017 | 2017 | 2017 | 2017 | 2017 | 2018 | 2018 | |||||||||||||||
Mobile, as previously reported | $ | 33.5 | $ | 40.4 | $ | 41.4 | $ | 39.5 | $ | 154.9 | $ | 25.4 | $ | 33.6 | |||||||
Automotive Reclassification | (27.6 | ) | (29.3 | ) | (30.7 | ) | (31.2 | ) | (118.9 | ) | (23.2 | ) | (28.9 | ) | |||||||
TV Reclassification | 2.0 | 1.4 | 2.0 | 0.1 | 5.6 | 1.2 | 1.4 | ||||||||||||||
Other, as adjusted | $ | 7.9 | $ | 12.5 | $ | 12.7 | $ | 8.5 | $ | 41.6 | $ | 3.4 | $ | 6.1 | |||||||
Mobile segment profit, as previously reported | 36 | % | 40 | % | 41 | % | 38 | % | 39 | % | 28 | % | 34 | % | |||||||
Other segment profit, as adjusted | 26 | % | 35 | % | 35 | % | 27 | % | 31 | % | 13 | % | 23 | % | |||||||
Schedules may not add due to rounding.
| © 2018 Nuance Communications, Inc. All rights reserved | |
30 | 2018 second quarter results |
Prepared remarks | |
May 9, 2018 | |
Nuance Communications, Inc.
Supplemental Financial Information - GAAP to Non-GAAP Reconciliations, continued
(in millions)
Unaudited
Q1 | Q2 | Q3 | Q4 | FY | Q1 | Q2 | ||||||||||||||||||||||
2017 | 2017 | 2017 | 2017 | 2017 | 2018 | 2018 | ||||||||||||||||||||||
Total segment revenues | $ | 496.0 | $ | 511.1 | $ | 495.6 | $ | 474.7 | $ | 1,977.4 | $ | 508.8 | $ | 518.3 | ||||||||||||||
Acquisition-related revenue adjustments | (8.4 | ) | (11.5 | ) | (9.4 | ) | (8.7 | ) | (38.0 | ) | (7.2 | ) | (4.1 | ) | ||||||||||||||
Total consolidated revenues | $ | 487.7 | $ | 499.6 | $ | 486.2 | $ | 466.0 | $ | 1,939.4 | $ | 501.6 | $ | 514.2 | ||||||||||||||
Total segment profit | $ | 161.6 | $ | 184.0 | $ | 163.2 | $ | 128.9 | $ | 637.7 | $ | 157.4 | $ | 160.3 | ||||||||||||||
Corporate expenses and other, net | (31.0 | ) | (30.2 | ) | (31.7 | ) | (33.1 | ) | (125.9 | ) | (44.7 | ) | (65.1 | ) | ||||||||||||||
Acquisition-related revenues and costs of revenues adjustment | (8.4 | ) | (11.5 | ) | (9.4 | ) | (8.7 | ) | (38.0 | ) | (7.2 | ) | (4.1 | ) | ||||||||||||||
Stock-based compensation | (39.1 | ) | (40.3 | ) | (42.3 | ) | (32.5 | ) | (154.3 | ) | (38.0 | ) | (33.7 | ) | ||||||||||||||
Amortization of intangible assets | (43.4 | ) | (45.1 | ) | (44.9 | ) | (45.3 | ) | (178.7 | ) | (38.4 | ) | (37.5 | ) | ||||||||||||||
Acquisition-related costs, net | (9.0 | ) | (5.4 | ) | (7.6 | ) | (5.7 | ) | (27.7 | ) | (5.6 | ) | (2.4 | ) | ||||||||||||||
Restructuring and other charges, net | (6.7 | ) | (19.9 | ) | (13.0 | ) | (21.4 | ) | (61.1 | ) | (14.8 | ) | (8.9 | ) | ||||||||||||||
Impairment of goodwill | — | — | — | — | — | — | (137.9 | ) | ||||||||||||||||||||
Other expenses, net | (37.6 | ) | (56.2 | ) | (39.5 | ) | (37.7 | ) | (171.0 | ) | (34.1 | ) | (32.2 | ) | ||||||||||||||
Loss before income taxes | $ | (13.6 | ) | $ | (24.7 | ) | $ | (25.2 | ) | $ | (55.5 | ) | $ | (119.0 | ) | $ | (25.3 | ) | $ | (161.5 | ) | |||||||
Schedules may not add due to rounding.
| © 2018 Nuance Communications, Inc. All rights reserved | |
31 | 2018 second quarter results |
Prepared remarks | |
May 9, 2018 | |
Nuance Communications, Inc.
Reconciliation of Supplemental Financial Information
GAAP and non-GAAP Revenue and Net Income per Share Guidance
(in thousands, except per share amounts)
Unaudited
Three months ended June 30, 2018 | |||||||
Low | High | ||||||
GAAP revenue | $ | 487,000 | $ | 501,000 | |||
Acquisition-related adjustment - revenue | 3,000 | 3,000 | |||||
Non-GAAP revenue | $ | 490,000 | $ | 504,000 | |||
GAAP net income per share | $ | (0.06 | ) | $ | (0.02 | ) | |
Acquisition-related adjustment - revenue | 0.01 | 0.01 | |||||
Acquisition-related costs, net | 0.02 | 0.02 | |||||
Cost of revenue from amortization of intangible assets | 0.05 | 0.05 | |||||
Amortization of intangible assets | 0.08 | 0.08 | |||||
Non-cash stock-based compensation | 0.15 | 0.15 | |||||
Non-cash interest expense | 0.04 | 0.04 | |||||
Adjustment to income tax expense | (0.07) | (0.08) | |||||
Restructuring and other charges, net | 0.00 | 0.00 | |||||
Other | 0.03 | 0.03 | |||||
Non-GAAP net income per share | $ | 0.25 | $ | 0.28 | |||
Shares used in computing GAAP and non-GAAP net income per share: | |||||||
Weighted average common shares: basic | 295,000 | 295,000 | |||||
Weighted average common shares: diluted | 297,000 | 297,000 | |||||
| © 2018 Nuance Communications, Inc. All rights reserved | |
32 | 2018 second quarter results |
Prepared remarks | |
May 9, 2018 | |
Nuance Communications, Inc.
Reconciliation of Supplemental Financial Information
GAAP and non-GAAP Revenue and Net Income per Share Guidance
(in thousands, except per share amounts)
Unaudited
Twelve months ended September 30, 2018 | |||||||
Low | High | ||||||
GAAP revenue | $ | 2,018,000 | $ | 2,058,000 | |||
Acquisition-related adjustment - revenue | 17,000 | 17,000 | |||||
Non-GAAP revenue | $ | 2,035,000 | $ | 2,075,000 | |||
GAAP net income per share | $ | (0.43 | ) | $ | (0.34 | ) | |
Acquisition-related adjustment - revenue | 0.06 | 0.06 | |||||
Acquisition-related costs, net | 0.07 | 0.07 | |||||
Cost of revenue from amortization of intangible assets | 0.19 | 0.19 | |||||
Amortization of intangible assets | 0.31 | 0.31 | |||||
Non-cash stock-based compensation | 0.54 | 0.54 | |||||
Non-cash interest expense | 0.17 | 0.17 | |||||
Adjustment to income tax expense | (0.55) | (0.58) | |||||
Restructuring and other charges, net | 0.54 | 0.54 | |||||
Other | 0.19 | 0.19 | |||||
Non-GAAP net income per share | $ | 1.09 | $ | 1.15 | |||
Shares used in computing GAAP and non-GAAP net income per share: | |||||||
Weighted average common shares: basic | 294,000 | 294,000 | |||||
Weighted average common shares: diluted | 301,000 | 301,000 | |||||
| © 2018 Nuance Communications, Inc. All rights reserved | |