Attached files
| file | filename |
|---|---|
| 8-K - FORM 8-K - Lumber Liquidators Holdings, Inc. | tv493382_8-k.htm |
Exhibit 99.1
Lumber Liquidators Investor Presentation May 2018

The following information includes statements of our expectations, intentions, plans and beliefs that constitute “forward - lookin g statements” within the meanings of the Private Securities Litigation Reform Act of 1995. These statements, which may be identified by words such as “may,” “will,” “should,” “e xpects,” “intends,” “plans,” “anticipates,” “believes,” “thinks,” “estimates,” “seeks,” “predicts,” “could,” “projects,” “potential” and other similar terms and phrases, are based o n t he beliefs of our management, as well as assumptions made by, and information currently available to, our management as of the date of such statements. These statements are subje ct to risks and uncertainties, all of which are difficult to predict and many of which are beyond our control. Forward - looking statements may include, without limitation, statements regarding: government investigations and related legal proceedings; other current and former legal proceedings; obligations under various settlement agreements and other compliance matters; impact of liquidity in the settlement of legal proceedings; new laws and regulations; impact of the Tax Act; the inability to open new stores; capital expenditures; managing growth; increased transportation costs; damage to our assets; operating stores in Canada and an office in China; managing third - party installers; renewing leases; having sufficient suppliers; our , and our suppliers’, compliance with complex and evolving rules, regulations, and laws at the federal, state, and local level; product liability claims; obtaining products from abroad, including effects of antidumping and countervailing duties, as well as other governmental measures aimed at balancing trade; availability of suitable hardwood; changes in economic conditions, both domestic and abroad; sufficient insurance coverage; access to capital; handling of confidential customer information; management information systems disruptions; alternative e - commerce offerings; our advertising strategy; anticipating consumer trends; competition; internal controls; impact of changes in accounting guidance; stock price volatility; and anti - takeover provisions. We specifically disclaim any obligation to update these statements, which speak only as of the dates on which such statements are made, except as may be required under the federal securities laws . Information regarding these and other additional risks and uncertainties is contained in our other reports filed with the Securities and Exchange Commission, including the Item 1 A, “Risk Factors,” section of the Form 10 - K for the year ended December 31 , 2017 . Please also refer to the financial statements and notes and management discussion included in our annual report on Form 10 - K and our quarterly reports on Form 10 - Q for definitions of key terms including comparable store net sales, average sale, comparable store traffic and SG&A expenses . Safe Harbor 2

To supplement the financial measures prepared in accordance with GAAP, we use the following non - GAAP financial measures: ( i) Adjusted Gross Profit; (ii) Adjusted SG&A; (iii) Adjusted Gross Margin as a percentage of sales; (iv) Adjusted SG&A as a percentage of sales; and (v) Adjusted Operating Profit. The non - GAAP financial measures should be viewed in addition to, and not in lieu of, financial measures calculated in accordance with GAAP. These supplemental measures may vary fro m, and may not be comparable to, similarly titled measures by other companies. The non - GAAP financial measures are presented because management uses these non - GAAP financial measures to evaluate our operating pe rformance and to determine incentive compensation. Therefore, we believe that the presentation of non - GAAP financial measures provides useful supplementary informati on to, and facilitates additional analysis by, investors. The presented non - GAAP financial measures exclude items that management does not believe reflect our core operating p erformance, which include regulatory and legal settlements and associated legal and operating costs, and changes in antidumping and countervailing duties, as such items are ou tside of our control or due to their inherent unusual, non - operating, unpredictable, non - recurring, or non - cash nature. Non - GAAP Financial Measures 3

Leading North American multi - channel specialty retailer providing a complete purchasing solution and broad product selection to the hard surface flooring market • Founded in 1994; IPO in 2007 • NYSE: LL; recent market cap: $600M • Over 400 stores in 46 states and Canada • Extensive assortment: solid and engineered hardwoods , laminates, vinyl, bamboo, cork, wood - look tile • Enhanced customer e xperience enabled by smaller store format and 1:1 engagement with knowledgeable and trained store associates • Bicoastal distribution centers total over 1.5M square feet • Headquartered in Toano, Virginia Lumber Liquidators 4

Investment highlights 5 Favorable Industry Dynamics Growing demand for hard surface flooring driving significant opportunity across price points and materials Differentiated Business Model Quality products, wide selection, attractive prices, national market coverage with brick and mortar locations, and limited online competition Improving Financials Improving gross margin profile, scalable cost structure, and sufficient liquidity, combined with disciplined capital allocation to drive shareholder value Strong Management Team Strategic team with balance of brick and mortar retail, home improvement, and multi - channel expertise

Large and growing store network 6 Store Network Characteristics • Small stores that can become profitable quickly • Expedited new store openings • Opened 400 th store in Q2 2018 • Store opening strategy of 20 to 25 new stores per year • Targeting 500+ stores by 2022 100 200 300 400 2010 2011 2012 2013 2014 2015 2016 2017 Total Store Count – 398 at 3/31/2018 Far Reaching National Store Network

2010 2011 2012 2013 2014 2015 2016 Soft-Surface Flooring $ Sales Hard-Surface Flooring $ Sales $33.3 $34.1 Floor Covering Product Sales Retail Sales Dollar Estimate $ billions Source: Floor Covering Weekly Statistical Report, 2014, 2015, 2016 Report *MSRP $ is based on an estimate using the MSP $ data Growth in hard - surface outpacing soft - surface 7 $36.3 $39.3 $42.8 $44.6 $46.6 CAGR: 5.8% Soft - Surface Mix 53.8% Soft - Surface Mix 53.1% Soft Surface Mix 52.7% Soft Surface Mix 50.8% Soft Surface Mix 50.0% Soft Surface Mix 49.3% Soft Surface Mix 47.1% CAGR: 3.5% Hard - Surface Mix 46.2% Hard - Surface Mix 46.9% Hard - Surface Mix 47.3% Hard - Surface Mix 49.2% Hard - Surface Mix 50.0% Hard - Surface Mix 50.7% Hard - Surface Mix 52.9% CAGR: 8.2% • Long - term declines in soft flooring have been driven by hygiene, pets and potential trip hazards

Market remains fragmented with significant opportunity 8 Source: Floor Covering Weekly 2016 Statistical Report, July 24, 2017 Big Box includes Home Depot, Lowe’s and Menards stores Other includes other specialty, home décor, furniture, department, discount stores • Almost half of the industry consists of local one - store flooring retailers and small regional chains that may specialize in one or two flooring categories Floor Covering Stores 47.8% Big Box 14.9% LL 1.4% FND 1.0% TTS 0.5% Other 9.3% Internet Contractor 21.9% Flooring Sales by Seller Our Unique Business Model • National scale, advertising and sourcing leverage • Small stores, showing wide selection in convenient, accessible format • Personnel with specific flooring expertise that customers value • Installation services offered nationally, creating seamless project management capability • Developing Pro business leveraging local relationships, service offerings, tailored products and prices • Pricing advantages through volume sales and promotional opportunities
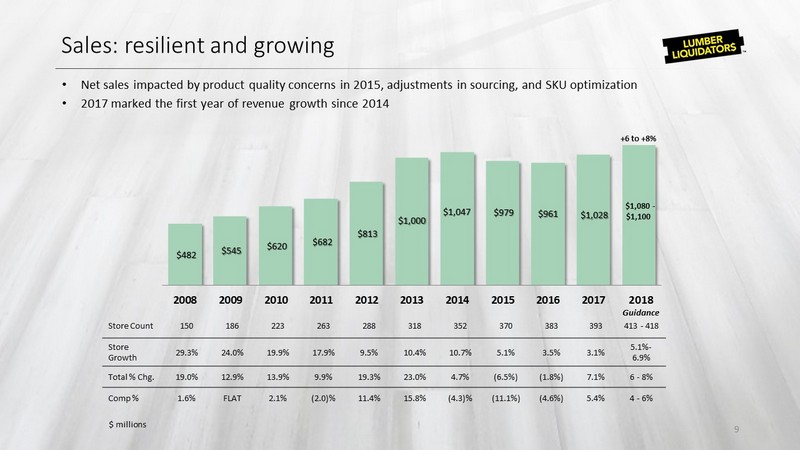
Sales: resilient and growing 9 $482 $545 $620 $682 $813 $1,000 $1,047 $979 $961 $1,028 2008 2009 2010 2011 2012 2013 2014 2015 2016 2017 $1,080 - $1,100 $ millions Store Count 150 186 223 263 288 318 352 370 383 393 413 - 418 Store Growth 29.3% 24.0% 19.9% 17.9% 9.5% 10.4% 10.7% 5.1% 3.5% 3.1% 5.1% - 6.9% Total % Chg. 19.0% 12.9% 13.9% 9.9% 19.3% 23.0% 4.7% (6.5%) (1.8%) 7.1% 6 - 8% Comp % 1.6% FLAT 2.1% (2.0)% 11.4% 15.8% (4.3)% (11.1%) (4.6%) 5.4% 4 - 6% 2018 Guidance +6 to +8% • Net sales impacted by product quality concerns in 2015, adjustments in sourcing, and SKU optimization • 2017 marked the first year of revenue growth since 2014

Product diversification enhances competitive position 10 42% 30% 19% 9% Solid & Engineered Hardwood, Bamboo and Cork Manufactured Products* Moldings & Accessories Installation and Delivery Services 2017 53% 24% 20% 3% • Supplemented our core hardwood business with strong bamboo and vinyl plank businesses • Opportunity to grow our wood - look tile • Installation now offered nationally as part of strategy to expand customer base among do - it - for - me shoppers and provide seamless experience 2014 *Manufactured Products includes laminate, vinyl, engineered vinyl plank and wood - look ceramic tile.

Quarterly sales trends 11 $150 $170 $190 $210 $230 $250 $270 Millions Quarterly Net Sales $400 $500 $600 $700 $800 Thousands Quarterly Net Sales per Store • Sequential sales improvement since Q1 2016 driven by our unique store experience, expanded Installation and Pro businesses, and broader product assortment • Significant opportunity remains to increase sales per store and leverage investments made in store personnel and training

Sales trends continue to improve 12 • Since the downturn in 2015, comparable store sales have grown during the last seven consecutive quarters and was fueled in part by Installation Services
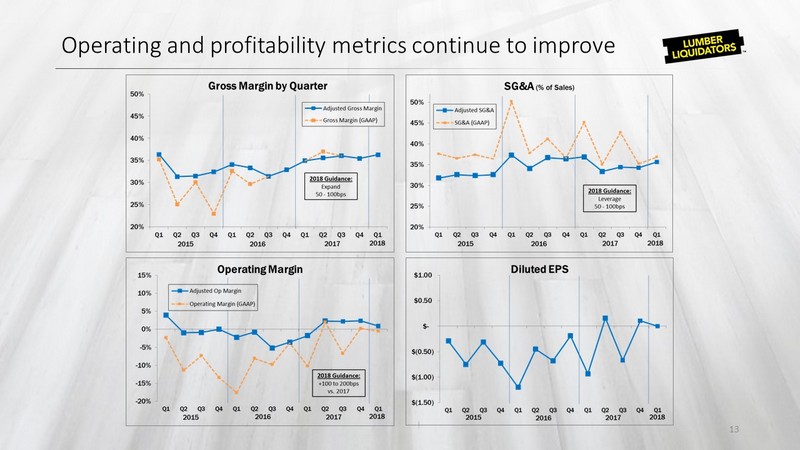
Operating and profitability metrics continue to improve 13

Strong Balance Sheet provides stable platform 14 • Improved operating cash flow and lower inventory drive better liquidity • Balance Sheet supports increased capital investment in strategic initiatives and increased new store openings • Inventory peaked in 4Q16 – 1Q17; fewer product transitions should improve turns and allow lower seasonal fluctuation in 2018
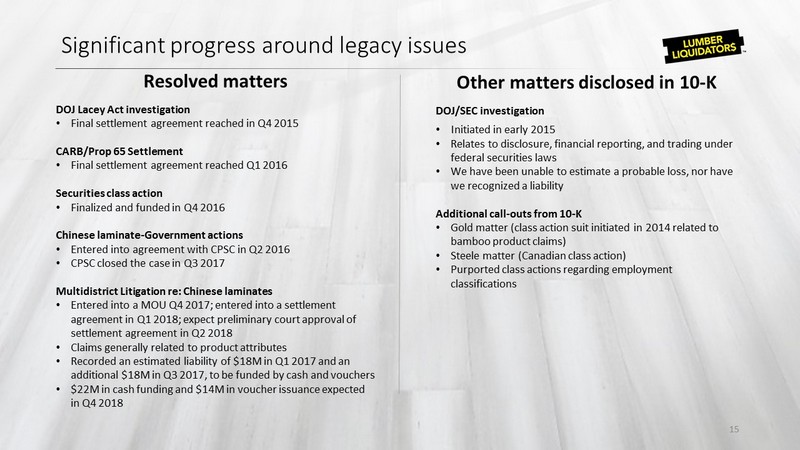
Significant progress around legacy issues Resolved matters DOJ Lacey Act investigation • Final settlement agreement reached in Q4 2015 CARB/Prop 65 Settlement • Final settlement agreement reached Q1 2016 Securities class action • Finalized and funded in Q4 2016 Chinese laminate - Government actions • Entered into agreement with CPSC in Q2 2016 • CPSC closed the case in Q3 2017 Multidistrict Litigation re: Chinese laminates • Entered into a MOU Q4 2017; entered into a settlement agreement in Q1 2018; expect preliminary court approval of settlement agreement in Q2 2018 • Claims generally related to product attributes • Recorded an estimated liability of $18M in Q1 2017 and an additional $18M in Q3 2017, to be funded by cash and vouchers • $22M in cash funding and $14M in voucher issuance expected in Q4 2018 Other matters disclosed in 10 - K DOJ/SEC investigation • Initiated in early 2015 • Relates to disclosure, financial reporting, and trading under federal securities laws • We have been unable to estimate a probable loss, nor have we recognized a liability Additional call - outs from 10 - K • Gold matter (class action suit initiated in 2014 related to bamboo product claims) • Steele matter (Canadian class action) • Purported class actions regarding employment classifications 15
Strategic Priorities
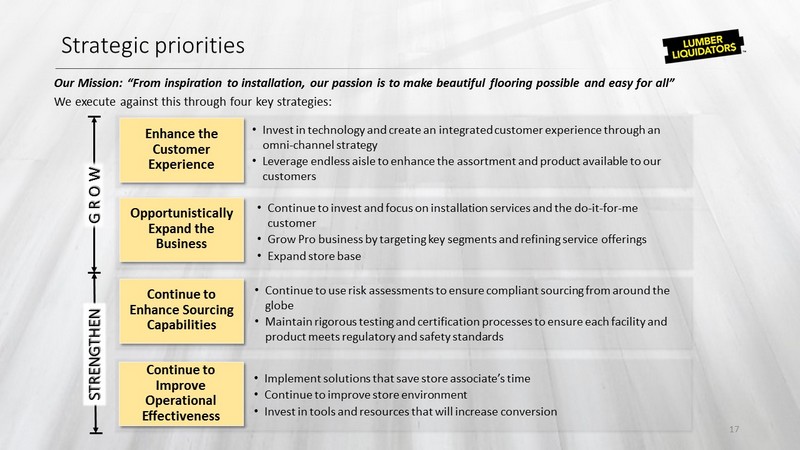
Our Mission: “From inspiration to installation, our passion is to make beautiful flooring possible and easy for all” We execute against this through four key strategies: Strategic priorities 17 Enhance the Customer Experience Opportunistically Expand the Business Continue to Enhance Sourcing Capabilities Continue to Improve Operational Effectiveness STRENGTHEN • Invest in technology and create an integrated customer experience through an omni - channel strategy • Leverage endless aisle to enhance the assortment and product available to our customers • Continue to invest and focus on installation services and the do - it - for - me customer • Grow Pro business by targeting key segments and refining service offerings • Expand store base • Continue to use risk assessments to ensure compliant sourcing from around the globe • Maintain rigorous testing and certification processes to ensure each facility and product meets regulatory and safety standards • Implement solutions that save store associate’s time • Continue to improve store environment • Invest in tools and resources that will increase conversion G R O W

• Investments in omni - channel initiatives and store will lead to a enhanced customer experience, both in - store and on digital Endless aisle Improved in - store experience Omni - channel strategy • Digitally support customer inspiration and project mgmt. • Simplify sales and installation process (measures, scheduling) • Enhance inventory visibility and order readiness We continue to invest in the purchase and installation process to make it easier, quicker and seamless regardless of the channel Enhance the customer experience 18 • Extend existing product lines • Pursue complementary products • Integrate endless aisle into e - com shopping experience • Continue training and Saturday team huddles to grow new associates into flooring experts • Refine product feature selling, financing, solutions, and accessories availability

• We look for opportunities to align our offering and sales approach to meet the dynamic needs of the home improvement customer Do - it - for - me Pro/ commercial Store expansion • We opened 11 new stores in 2017, including 6 in Q4 • We are targeting 20 - 25 new stores in 2018, and expect to reach 500 stores by 2022 • A larger and growing segment of customers seek installation support and a one - stop floor solution • We have installation available nationally, and began national advertising in 2018 • We are building out a suite of services and products most desired by the Pro • We have a range of products well suited to commercial applications Opportunistically expand the business 19

Enhance responsible, compliant sourcing and quality a ssurance 20 • In 2015, Lumber Liquidators began to systematically enhance compliance and sustainability practices everywhere we do business through a multi - tiered approach • We maintain a rigorous quality assurance program to ensure our products meet our demanding quality and safety requirements Risk - based assessments • We utilize a combination of internal and external certification, testing and auditing teams to ensure our facilities and products meet regulatory and safety standards Vendor validation & evaluation • We conduct in - person facility audits, process reviews and document assessments for new and existing flooring vendor partners Purchase order review • We use purchase order review to ensure compliance and sustainability in the supply chain Quality Assurance • We perform quality assurance testing at the site of manufacture and continuous monitoring of in - bound products for both quality and safety elements in our Sandston, VA distribution center Auditing & monitoring • We perform ongoing monitoring, field, and desk audits to ensure consistent compliance and address corrective actions
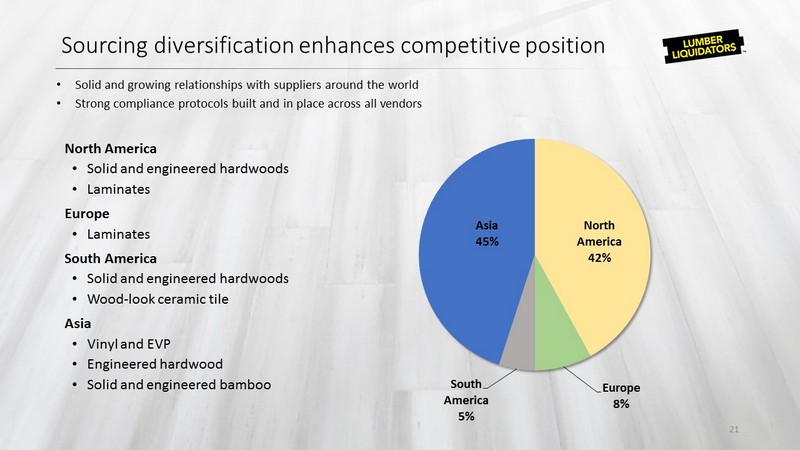
Sourcing diversification enhances competitive position 21 North America • Solid and engineered hardwoods • Laminates Europe • Laminates South America • Solid and engineered hardwoods • Wood - look ceramic tile Asia • Vinyl and EVP • Engineered hardwood • Solid and engineered bamboo North America 42% Europe 8% South America 5% Asia 45% • Solid and growing relationships with suppliers around the world • Strong compliance protocols built and in place across all vendors

Experienced and motivated leadership team 22 Dennis Knowles Chief Executive Officer Marty Agard Chief Financial Officer Lee Reeves Chief Legal Officer & Corporate Secretary Carl Daniels Chief Supply Chain Officer Mark Gronemeyer Senior Vice President, Store Operations Chris Thomsen Senior Vice President, Chief Information Officer Jennifer Bohaty Senior Vice President, Chief Ethics & Compliance Officer • We have assembled a senior management team with strong leadership and compelling experience within the home improvement and retail sectors

Investment highlights 23 Favorable Industry Dynamics Growing demand for hard surface flooring driving significant opportunity across price points and materials Differentiated Business Model Quality products, wide selection, attractive prices, strategic brick and mortar placement, and limited online competition Improving Financials Improving gross margin profile, scalable cost structure, and sufficient liquidity, combined with disciplined capital allocation to drive shareholder value Strong Management Team Strategic team with balance of brick and mortar retail, home improvement, and multi - channel expertise
Appendix
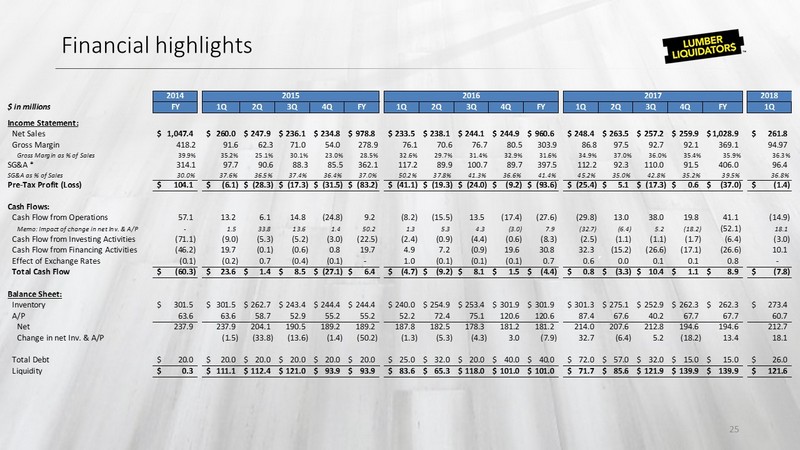
Financial highlights 25 2014$ in millions FY 1Q 2Q 3Q 4Q FY 1Q 2Q 3Q 4Q FY 1Q 2Q 3Q 4Q FY 1Q Income Statement: Net Sales 1,047.4$ 260.0$ 247.9$ 236.1$ 234.8$ 978.8$ 233.5$ 238.1$ 244.1$ 244.9$ 960.6$ 248.4$ 263.5$ 257.2$ 259.9$ 1,028.9$ 261.8$ Gross Margin 418.2 91.6 62.3 71.0 54.0 278.9 76.1 70.6 76.7 80.5 303.9 86.8 97.5 92.7 92.1 369.1 94.97 Gross Margin as % of Sales 39.9% 35.2% 25.1% 30.1% 23.0% 28.5% 32.6% 29.7% 31.4% 32.9% 31.6% 34.9% 37.0% 36.0% 35.4% 35.9% 36.3% SG&A * 314.1 97.7 90.6 88.3 85.5 362.1 117.2 89.9 100.7 89.7 397.5 112.2 92.3 110.0 91.5 406.0 96.4 SG&A as % of Sales 30.0% 37.6% 36.5% 37.4% 36.4% 37.0% 50.2% 37.8% 41.3% 36.6% 41.4% 45.2% 35.0% 42.8% 35.2% 39.5% 36.8% Pre-Tax Profit (Loss) 104.1$ (6.1)$ (28.3)$ (17.3)$ (31.5)$ (83.2)$ (41.1)$ (19.3)$ (24.0)$ (9.2)$ (93.6)$ (25.4)$ 5.1$ (17.3)$ 0.6$ (37.0)$ (1.4)$ Cash Flows: Cash Flow from Operations 57.1 13.2 6.1 14.8 (24.8) 9.2 (8.2) (15.5) 13.5 (17.4) (27.6) (29.8) 13.0 38.0 19.8 41.1 (14.9) Memo: Impact of change in net Inv. & A/P - 1.5 33.8 13.6 1.4 50.2 1.3 5.3 4.3 (3.0) 7.9 (32.7) (6.4) 5.2 (18.2) (52.1) 18.1 Cash Flow from Investing Activities (71.1) (9.0) (5.3) (5.2) (3.0) (22.5) (2.4) (0.9) (4.4) (0.6) (8.3) (2.5) (1.1) (1.1) (1.7) (6.4) (3.0) Cash Flow from Financing Activities (46.2) 19.7 (0.1) (0.6) 0.8 19.7 4.9 7.2 (0.9) 19.6 30.8 32.3 (15.2) (26.6) (17.1) (26.6) 10.1 Effect of Exchange Rates (0.1) (0.2) 0.7 (0.4) (0.1) - 1.0 (0.1) (0.1) (0.1) 0.7 0.6 0.0 0.1 0.1 0.8 - Total Cash Flow (60.3)$ 23.6$ 1.4$ 8.5$ (27.1)$ 6.4$ (4.7)$ (9.2)$ 8.1$ 1.5$ (4.4)$ 0.8$ (3.3)$ 10.4$ 1.1$ 8.9$ (7.8)$ Balance Sheet: Inventory 301.5$ 301.5$ 262.7$ 243.4$ 244.4$ 244.4$ 240.0$ 254.9$ 253.4$ 301.9$ 301.9$ 301.3$ 275.1$ 252.9$ 262.3$ 262.3$ 273.4$ A/P 63.6 63.6 58.7 52.9 55.2 55.2 52.2 72.4 75.1 120.6 120.6 87.4 67.6 40.2 67.7 67.7 60.7 Net 237.9 237.9 204.1 190.5 189.2 189.2 187.8 182.5 178.3 181.2 181.2 214.0 207.6 212.8 194.6 194.6 212.7 Change in net Inv. & A/P (1.5) (33.8) (13.6) (1.4) (50.2) (1.3) (5.3) (4.3) 3.0 (7.9) 32.7 (6.4) 5.2 (18.2) 13.4 18.1 Total Debt 20.0$ 20.0$ 20.0$ 20.0$ 20.0$ 20.0$ 25.0$ 32.0$ 20.0$ 40.0$ 40.0$ 72.0$ 57.0$ 32.0$ 15.0$ 15.0$ 26.0$ Liquidity 0.3$ 111.1$ 112.4$ 121.0$ 93.9$ 93.9$ 83.6$ 65.3$ 118.0$ 101.0$ 101.0$ 71.7$ 85.6$ 121.9$ 139.9$ 139.9$ 121.6$ 2015 2016 2017 2018

Non - GAAP reconciliation – Gross Margin 26 000's 1Q15 2Q15 3Q15 4Q15 1Q16 2Q16 3Q16 4Q16 1Q17 2Q17 3Q17 4Q17 1Q18 Gross Profit, GAAP 91,612$ 62,284$ 70,996$ 53,966$ 76,110$ 70,584$ 76,689$ 80,487$ 86,799$ 97,455$ 92,687$ 92,120$ 94,972$ Less: Anti-Dumping Adjustments (1) - 4,921 - - - 5,450 - - - (2,797) - - - Indoor Air Quality Testing Program (2) 2,313 4,918 2,412 (198) 2,895 3,292 - - - (993) - - - Inventory Impairments (3) 1,604 6,269 691 20,487 - - - - - - - - - Adjusted Gross Profit 95,529$ 78,393$ 74,099$ 74,255$ 79,004$ 79,326$ 76,689$ 80,487$ 86,799$ 93,665$ 92,687$ 92,120$ 94,972$ (1) We recognized adjustments to countervailing and antidumping duties of a favorable $2.8 million and an unfavorable $5.5 million associated with applicable shipments of engineered hardwood from China related to prior periods for the years ended December 31, 2017 and 2016, respectively. (2) Prior to June 30, 2016, $3.1 million of costs related to our indoor air quality testing program agreed to with the CPSC were expensed as incurred. During the second quarter 2016, we recorded an accrual of $3 million, which represented our best estima��������������������������������������������������������������������������������������������������������������������������������������������������������������������������������������������������������������������te of costs to be incurred in the future periods related to this program and in included in the total for 2016. In the second quarter 2017, we reduced our reserve for estimated costs to be incurred related to the testing program by approximately $1M. This reserve is recorded in other current liabilities in the consolidated balance sheet. (3) In 2015, we recorded a write-off related to our suspension of the sale of Chinese laminate products totaling $22.5 million and incurred costs of $6.6 million related to the simplification of our business.

Non - GAAP reconciliation – SG&A and Operating Profit 27 000's 1Q15 2Q15 3Q15 4Q15 1Q16 2Q16 3Q16 4Q16 1Q17 2Q17 3Q17 4Q17 1Q18 Operating Profit, GAAP (6,068)$ (28,267)$ (17,337)$ (31,521)$ (41,127)$ (19,316)$ (23,972)$ (9,220)$ (25,415)$ 5,120$ (17,275)$ 605$ (1,446)$ Gross Margin Total (1) 3,917 16,108 3,103 20,289 2,895 8,742 - - - (3,790) - - - SG&A Total (2) 14,907 9,658 11,822 8,916 30,209 8,639 11,151 475 20,408 3,526 22,399 5,087 3,317 Adjusted Operating Profit 12,756$ (2,501)$ (2,412)$ (2,316)$ (8,023)$ (1,934)$ (12,821)$ (8,745)$ (5,007)$ 4,856$ 5,124$ 5,692$ 1,871$ (1) See the Gross Margin slide for detailed explanations of the items used for the Gross Margin Total. (2) See the SG&A section above for detailed explanations of the items used for the SG&A Total. 000's 1Q15 2Q15 3Q15 4Q15 1Q16 2Q16 3Q16 4Q16 1Q17 2Q17 3Q17 4Q17 1Q18 SG&A, GAAP 97,680$ 90,551$ 88,333$ 85,487$ 117,236$ 89,900$ 100,661$ 89,707$ 112,214$ 92,335$ 109,962$ 91,515$ 96,418$ Less: Multi-District Litigation (1) - - - - - - - - (18,000) - (18,000) (960) (250) Legal & Professional Fees (2) (4,467) (6,328) (6,135) (4,129) (10,414) (8,294) (6,321) (3,385) (2,408) (3,526) (2,940) (2,440) (3,067) Securities & Derivatives Class Action (3) - - - - (18,520) 600 (4,250) 2,910 - - - - - Lacy / DOJ Settlement (4) (10,000) (3,155) - - - - - - - - - - - All Other (5) (440) (175) (5,687) (4,787) (1,275) (945) (580) - - - (1,459) (1,687) - Adjusted SG&A 82,773$ 80,893$ 76,511$ 76,571$ 87,027$ 81,261$ 89,510$ 89,232$ 91,806$ 88,809$ 87,563$ 86,428$ 93,101$ (1) The amounts in 2017 represents the charge to earnings related to the MOU in connection with the MDL and Related Other Matters, which is described more fully in the Legal Proceedings section in Part I, Item 3 of our Annual report. The amount in 2018 represents charges for certain cases related to the MDL in 2018, which is more fully described in Note 6 in the quarterly report on Form 10-Q for the three months ended March 31, 2018. (2) Represents charges to earnings related to our defense of certain significant legal actions during the period. This does not include all legal costs incurred by the Company. (3) This amount represents the net charge to earnings related to the stock-based element of our settlement in the securities class action lawsuit in addition to $2.5 million related to our derivatives class action lawsuit. (4) Represents settlement accruals related to the completed DOJ - Lacey Act investigation in 2016. (5) All Other in 2017 represents costs to dispose of certain Chinese laminate products whose sales were discontinued in 2015, and an impairment of certain assets related to a vertical integration initiative we have discontinued. All Other in 2016 relates primarily to a retention initiative and the net impact of the CARB and Prop 65 settlements.
Lumber Liquidators Investor contacts Steve Calk & Jackie Marcus ir@lumberliquidators.com