Attached files
| file | filename |
|---|---|
| EX-32.1 - EXHIBIT 32.1 - CHARTER FINANCIAL CORP | chfn0331201810qex321.htm |
| EX-31.2 - EXHIBIT 31.2 - CHARTER FINANCIAL CORP | chfn0331201810qex312.htm |
| EX-31.1 - EXHIBIT 31.1 - CHARTER FINANCIAL CORP | chfn0331201810qex311.htm |
| EX-2.3 - EXHIBIT 2.3 - CHARTER FINANCIAL CORP | chfn0331201810qex23.htm |
UNITED STATES
SECURITIES AND EXCHANGE COMMISSION
Washington, D.C. 20549
_____________________________________
FORM 10-Q
_____________________________________
x | QUARTERLY REPORT PURSUANT TO SECTION 13 OR 15(d) OF THE SECURITIES EXCHANGE ACT OF 1934 |
For the quarterly period ended March 31, 2018
OR
o | TRANSITION REPORT PURSUANT TO SECTION 13 OR 15(d) OF THE SECURITIES EXCHANGE ACT OF 1934 |
For the transition period from to
Commission File No. 001-35870
_____________________________________
CHARTER FINANCIAL CORPORATION
(Exact name of registrant as specified in its charter)
_____________________________________
Maryland | 90-0947148 |
(State or other jurisdiction of incorporation or organization) | (I.R.S. Employer Identification Number) |
1233 O.G. Skinner Drive, West Point, Georgia | 31833 |
(Address of Principal Executive Offices) | (Zip Code) |
(706) 645-1391
(Registrant’s telephone number)
N/A
(Former name or former address, if changed since last report)
_____________________________________
Indicate by check mark whether the registrant (1) has filed all reports required to be filed by Section 13 or 15(d) of the Securities Exchange Act of 1934 during the preceding 12 months (or for such shorter period that the registrant was required to file such reports), and (2) has been subject to such requirements for the past 90 days. YES x NO o.
Indicate by check mark whether the registrant has submitted electronically and posted on its corporate Web site, if any, every Interactive Data File required to be submitted and posted pursuant to Rule 405 of Regulation S-T during the preceding 12 months (or for such shorter period that the registrant was required to submit and post such files). YES x NO o.
Indicate by check mark whether the registrant is a large accelerated filer, an accelerated filer, a non-accelerated filer, smaller reporting company, or an emerging growth company. See the definitions of “large accelerated filer,” “accelerated filer,” “smaller reporting company,” and "emerging growth company" in Rule 12b-2 of the Exchange Act. (Check one)
Large accelerated filer | o | Accelerated filer | x |
Non-accelerated filer | o (Do not check if smaller reporting company) | Smaller reporting company | o |
Emerging growth company | o | ||
If an emerging growth company, indicate by check mark if the registrant has elected not to use the extended transition period for complying with any new or revised financial accounting standards provided pursuant to Section 13(a) of the Exchange Act. o | |||
Indicate by check mark whether the registrant is a shell company (as defined in Rule 12b-2 of the Exchange Act). YES o NO x
The number of shares of the registrant’s common stock outstanding as of May 7, 2018 was 15,137,631.
CHARTER FINANCIAL CORPORATION
TABLE OF CONTENTS
Page No. | ||
PART I. FINANCIAL INFORMATION
Item 1. Financial Statements
CHARTER FINANCIAL CORPORATION AND SUBSIDIARY
CONDENSED CONSOLIDATED STATEMENTS OF FINANCIAL CONDITION (UNAUDITED)
March 31, 2018 | September 30, 2017 (1) | ||||||
Assets | |||||||
Cash and amounts due from depository institutions | $ | 22,854,837 | $ | 25,455,465 | |||
Interest-earning deposits in other financial institutions | 156,546,379 | 126,882,924 | |||||
Cash and cash equivalents | 179,401,216 | 152,338,389 | |||||
Loans held for sale, fair value of $2,934,511 and $1,998,988 | 2,895,620 | 1,961,185 | |||||
Certificates of deposit held at other financial institutions | 5,027,920 | 7,514,630 | |||||
Investment securities available for sale | 174,536,308 | 183,789,821 | |||||
Federal Home Loan Bank stock | 4,075,200 | 4,054,400 | |||||
Restricted securities, at cost | 279,000 | 279,000 | |||||
Loans receivable | 1,163,964,177 | 1,161,519,752 | |||||
Unamortized loan origination fees, net | (967,809 | ) | (1,165,148 | ) | |||
Allowance for loan losses | (11,110,903 | ) | (11,078,422 | ) | |||
Loans receivable, net | 1,151,885,465 | 1,149,276,182 | |||||
Other real estate owned | 302,736 | 1,437,345 | |||||
Accrued interest and dividends receivable | 4,321,617 | 4,197,708 | |||||
Premises and equipment, net | 29,125,704 | 29,578,513 | |||||
Goodwill | 39,347,378 | 39,347,378 | |||||
Other intangible assets, net of amortization | 3,233,331 | 3,614,833 | |||||
Cash surrender value of life insurance | 54,207,205 | 53,516,317 | |||||
Deferred income taxes | 3,771,457 | 5,970,282 | |||||
Other assets | 1,505,525 | 3,282,577 | |||||
Total assets | $ | 1,653,915,682 | $ | 1,640,158,560 | |||
Liabilities and Stockholders’ Equity | |||||||
Liabilities: | |||||||
Deposits | $ | 1,349,260,830 | $ | 1,339,143,287 | |||
Short-term borrowings | 3,007,550 | — | |||||
Long-term borrowings | 57,007,550 | 60,023,100 | |||||
Floating rate junior subordinated debt | 6,793,195 | 6,724,646 | |||||
Advance payments by borrowers for taxes and insurance | 1,904,707 | 2,956,441 | |||||
Other liabilities | 14,354,882 | 17,112,581 | |||||
Total liabilities | 1,432,328,714 | 1,425,960,055 | |||||
Stockholders’ equity: | |||||||
Common stock, $0.01 par value; 15,137,631 shares issued and outstanding at March 31, 2018 and 15,115,883 shares issued and outstanding at September 30, 2017 | 151,376 | 151,159 | |||||
Preferred stock, $0.01 par value; 50,000,000 shares authorized at March 31, 2018 and September 30, 2017 | — | — | |||||
Additional paid-in capital | 86,807,092 | 85,651,391 | |||||
Unearned compensation – ESOP | (4,192,308 | ) | (4,673,761 | ) | |||
Retained earnings | 141,832,263 | 134,207,368 | |||||
Accumulated other comprehensive loss | (3,011,455 | ) | (1,137,652 | ) | |||
Total stockholders’ equity | 221,586,968 | 214,198,505 | |||||
Total liabilities and stockholders’ equity | $ | 1,653,915,682 | $ | 1,640,158,560 | |||
__________________________________
(1) | Financial information at September 30, 2017 has been derived from audited financial statements. |
See accompanying notes to unaudited condensed consolidated financial statements.
1
CHARTER FINANCIAL CORPORATION AND SUBSIDIARY
CONDENSED CONSOLIDATED STATEMENTS OF INCOME (UNAUDITED)
Three Months Ended March 31, | Six Months Ended March 31, | ||||||||||||||
2018 | 2017 | 2018 | 2017 | ||||||||||||
Interest income: | |||||||||||||||
Loans receivable | $ | 15,102,749 | $ | 11,903,416 | $ | 29,874,576 | $ | 24,473,319 | |||||||
Taxable investment securities | 995,891 | 1,103,740 | 2,059,974 | 2,199,640 | |||||||||||
Nontaxable investment securities | 3,274 | 4,571 | 6,548 | 9,143 | |||||||||||
Federal Home Loan Bank stock | 52,732 | 40,309 | 103,930 | 79,519 | |||||||||||
Interest-earning deposits in other financial institutions | 485,917 | 213,310 | 847,193 | 324,127 | |||||||||||
Certificates of deposit held at other financial institutions | 20,529 | 38,775 | 45,635 | 81,404 | |||||||||||
Restricted securities | 3,231 | 2,679 | 6,298 | 5,252 | |||||||||||
Total interest income | 16,664,323 | 13,306,800 | 32,944,154 | 27,172,404 | |||||||||||
Interest expense: | |||||||||||||||
Deposits | 1,474,290 | 1,165,459 | 2,937,587 | 2,323,776 | |||||||||||
Borrowings | 363,464 | 362,880 | 735,040 | 749,855 | |||||||||||
Floating rate junior subordinated debt | 140,387 | 123,631 | 277,867 | 244,422 | |||||||||||
Total interest expense | 1,978,141 | 1,651,970 | 3,950,494 | 3,318,053 | |||||||||||
Net interest income | 14,686,182 | 11,654,830 | 28,993,660 | 23,854,351 | |||||||||||
Provision for loan losses | (350,000 | ) | (150,000 | ) | (350,000 | ) | (900,000 | ) | |||||||
Net interest income after provision for loan losses | 15,036,182 | 11,804,830 | 29,343,660 | 24,754,351 | |||||||||||
Noninterest income: | |||||||||||||||
Service charges on deposit accounts | 1,982,838 | 1,700,713 | 4,096,369 | 3,588,524 | |||||||||||
Bankcard fees | 1,542,258 | 1,366,686 | 3,001,732 | 2,649,045 | |||||||||||
Gain on investment securities available for sale | — | 247,780 | 1,074 | 247,780 | |||||||||||
Gain (loss) on sale of other assets held for sale | — | — | 265,806 | (38,528 | ) | ||||||||||
Bank owned life insurance | 368,803 | 246,915 | 690,888 | 579,266 | |||||||||||
Gain on sale of loans | 457,314 | 542,824 | 1,076,523 | 1,274,086 | |||||||||||
Brokerage commissions | 163,160 | 224,567 | 335,537 | 390,563 | |||||||||||
Recoveries on acquired loans previously covered under FDIC-assisted acquisitions | — | — | — | 250,000 | |||||||||||
Other | 448,710 | 216,671 | 886,612 | 588,265 | |||||||||||
Total noninterest income | 4,963,083 | 4,546,156 | 10,354,541 | 9,529,001 | |||||||||||
Noninterest expenses: | |||||||||||||||
Salaries and employee benefits | 7,022,241 | 6,078,575 | 14,031,032 | 12,212,248 | |||||||||||
Occupancy | 1,605,185 | 1,219,866 | 3,083,003 | 2,543,189 | |||||||||||
Data processing | 1,425,378 | 1,003,974 | 2,578,106 | 1,912,929 | |||||||||||
Legal and professional | 218,830 | 387,590 | 485,224 | 671,745 | |||||||||||
Marketing | 477,395 | 411,943 | 806,532 | 768,467 | |||||||||||
Federal insurance premiums and other regulatory fees | 307,643 | 197,261 | 495,956 | 362,756 | |||||||||||
Net cost (benefit) of operations of real estate owned | 628 | 13,827 | (48,974 | ) | (345,443 | ) | |||||||||
Furniture and equipment | 305,920 | 228,383 | 545,904 | 402,437 | |||||||||||
Postage, office supplies and printing | 224,797 | 223,317 | 456,516 | 493,702 | |||||||||||
Core deposit intangible amortization expense | 190,751 | 149,435 | 381,502 | 303,097 | |||||||||||
Other | 957,074 | 835,540 | 1,792,383 | 1,714,092 | |||||||||||
Total noninterest expenses | 12,735,842 | 10,749,711 | 24,607,184 | 21,039,219 | |||||||||||
Income before income taxes | 7,263,423 | 5,601,275 | 15,091,017 | 13,244,133 | |||||||||||
Income tax expense | 2,013,914 | 2,284,480 | 5,444,505 | 4,881,671 | |||||||||||
Net income | $ | 5,249,509 | $ | 3,316,795 | $ | 9,646,512 | $ | 8,362,462 | |||||||
Basic net income per share | $ | 0.36 | $ | 0.23 | $ | 0.67 | $ | 0.59 | |||||||
Diluted net income per share | $ | 0.34 | $ | 0.22 | $ | 0.63 | $ | 0.55 | |||||||
Weighted average number of common shares outstanding | 14,521,387 | 14,322,290 | 14,464,281 | 14,264,248 | |||||||||||
Weighted average number of common and potential common shares outstanding | 15,371,827 | 15,340,320 | 15,292,964 | 15,282,278 | |||||||||||
See accompanying notes to unaudited condensed consolidated financial statements.
2
CHARTER FINANCIAL CORPORATION AND SUBSIDIARY
CONDENSED CONSOLIDATED STATEMENTS OF COMPREHENSIVE INCOME (UNAUDITED)
Three Months Ended March 31, | Six Months Ended March 31, | |||||||||||||||
2018 | 2017 | 2018 | 2017 | |||||||||||||
Net income | $ | 5,249,509 | $ | 3,316,795 | $ | 9,646,512 | $ | 8,362,462 | ||||||||
Reclassification adjustment for net gains realized in net income, net of taxes of $0, $95,643, $312 and $95,643, respectively | — | (152,137 | ) | (762 | ) | (152,137 | ) | |||||||||
Net unrealized holding (losses) gains on investment and mortgage securities available for sale arising during the period, net of taxes of $(543,839), $113,295, $(776,160) and $(1,695,882), respectively | (1,329,530 | ) | 180,215 | (1,873,040 | ) | (2,697,594 | ) | |||||||||
Comprehensive income | $ | 3,919,979 | $ | 3,344,873 | $ | 7,772,710 | $ | 5,512,731 | ||||||||
See accompanying notes to unaudited condensed consolidated financial statements.
3
CHARTER FINANCIAL CORPORATION AND SUBSIDIARY
CONDENSED CONSOLIDATED STATEMENT OF STOCKHOLDERS’ EQUITY (UNAUDITED)
Common stock | Additional paid-in capital | Unearned compensation ESOP | Retained earnings | Accumulated other comprehensive loss | Total stockholders' equity | |||||||||||||||||||||
Number of shares | Amount | |||||||||||||||||||||||||
Balance at September 30, 2017 (1) | 15,115,883 | $ | 151,159 | $ | 85,651,391 | $ | (4,673,761 | ) | $ | 134,207,368 | $ | (1,137,652 | ) | $ | 214,198,505 | |||||||||||
Net income | — | — | — | — | 9,646,512 | — | 9,646,512 | |||||||||||||||||||
Dividends paid, $0.155 per share | — | — | — | — | (2,240,706 | ) | — | (2,240,706 | ) | |||||||||||||||||
Change in other comprehensive loss | — | — | — | — | — | (1,654,714 | ) | (1,654,714 | ) | |||||||||||||||||
Reclassification of tax effects in AOCI resulting from the new federal corporate income tax rate | — | — | — | — | 219,089 | (219,089 | ) | — | ||||||||||||||||||
Allocation of ESOP common stock | — | — | 540,210 | 481,453 | — | — | 1,021,663 | |||||||||||||||||||
Effect of restricted stock awards | — | — | 412,314 | — | — | — | 412,314 | |||||||||||||||||||
Stock option expense | — | — | 161,013 | — | — | — | 161,013 | |||||||||||||||||||
Issuance of common stock, stock option exercises | 28,612 | 286 | 305,100 | — | — | — | 305,386 | |||||||||||||||||||
Issuance of common stock, restricted stock | 22,500 | 225 | (225 | ) | — | — | — | — | ||||||||||||||||||
Cancellation of restricted stock | (15,000 | ) | (150 | ) | 150 | — | — | — | — | |||||||||||||||||
Repurchase of shares | (14,364 | ) | (144 | ) | (262,861 | ) | — | — | — | (263,005 | ) | |||||||||||||||
Balance at March 31, 2018 | 15,137,631 | $ | 151,376 | $ | 86,807,092 | $ | (4,192,308 | ) | $ | 141,832,263 | $ | (3,011,455 | ) | $ | 221,586,968 | |||||||||||
__________________________________
(1) | Financial information at September 30, 2017 has been derived from audited financial statements. |
See accompanying notes to unaudited condensed consolidated financial statements.
4
CHARTER FINANCIAL CORPORATION AND SUBSIDIARY
CONDENSED CONSOLIDATED STATEMENTS OF CASH FLOWS (UNAUDITED)
Six Months Ended March 31, | |||||||
2018 | 2017 | ||||||
Cash flows from operating activities: | |||||||
Net income | $ | 9,646,512 | $ | 8,362,462 | |||
Adjustments to reconcile net income to net cash provided by operating activities: | |||||||
Provision for loan losses | (350,000 | ) | (900,000 | ) | |||
Depreciation and amortization | 1,068,596 | 884,887 | |||||
Deferred income tax expense | 2,875,680 | — | |||||
Accretion and amortization of premiums and discounts, net | 388,996 | 511,284 | |||||
Accretion of fair value discounts related to acquired loans | (1,133,875 | ) | (1,082,140 | ) | |||
Gain on sale of loans | (1,076,523 | ) | (1,274,086 | ) | |||
Proceeds from sale of loans | 32,204,274 | 50,081,954 | |||||
Originations and purchases of loans held for sale | (32,218,134 | ) | (48,531,190 | ) | |||
Gain on sale of mortgage-backed securities, collateralized mortgage obligations and other investments | (1,074 | ) | (247,780 | ) | |||
Write down of real estate owned | 84,154 | 11,304 | |||||
Gain on sale of real estate owned | (191,583 | ) | (482,090 | ) | |||
(Gain) loss on sale of fixed assets | (265,806 | ) | 51,738 | ||||
Restricted stock award expense | 412,314 | 394,097 | |||||
Stock option expense | 161,013 | 167,640 | |||||
Increase in cash surrender value of bank owned life insurance | (690,888 | ) | (579,266 | ) | |||
Changes in assets and liabilities: | |||||||
Increase in accrued interest and dividends receivable | (123,909 | ) | (60,046 | ) | |||
Decrease (increase) in other assets | 1,293,000 | (2,340,356 | ) | ||||
(Decrease) increase in other liabilities | (1,736,036 | ) | 2,360,580 | ||||
Net cash provided by operating activities | 10,346,711 | 7,328,992 | |||||
Cash flows from investing activities: | |||||||
Proceeds from sales of investment securities available for sale | 13,336 | 2,078,436 | |||||
Principal collections on investment securities available for sale | 9,018,513 | 9,320,461 | |||||
Purchase of investment securities available for sale | (14,874,249 | ) | (12,738,982 | ) | |||
Proceeds from maturities or calls of investment securities available for sale | 12,290,000 | 11,657,491 | |||||
Purchase of Federal Home Loan Bank stock | (20,800 | ) | (122,800 | ) | |||
Net decrease in certificates of deposit held at other financial institutions | 2,477,000 | 3,979,000 | |||||
Net increase in loans receivable | (1,362,849 | ) | (12,204,993 | ) | |||
Proceeds from sale of real estate owned | 1,447,698 | 1,754,670 | |||||
Proceeds from sale of premises and equipment | 905,806 | 211,283 | |||||
Purchases of premises and equipment, net of dispositions | (234,285 | ) | (914,268 | ) | |||
Net cash provided by investing activities | 9,660,170 | 3,020,298 | |||||
Cash flows from financing activities: | |||||||
Repurchase of shares | (263,005 | ) | (1,881 | ) | |||
Issuance of common stock | 305,386 | 146,296 | |||||
Dividends paid | (2,240,706 | ) | (1,639,435 | ) | |||
Net increase in deposits | 10,306,005 | 40,070,743 | |||||
Proceeds from Federal Home Loan Bank advances | 1,000,000 | 26,000,000 | |||||
Principal payments on Federal Home Loan Bank advances | (1,000,000 | ) | (26,000,000 | ) | |||
Net decrease in advance payments by borrowers for taxes and insurance | (1,051,734 | ) | (489,475 | ) | |||
See accompanying notes to unaudited condensed consolidated financial statements.
5
CHARTER FINANCIAL CORPORATION AND SUBSIDIARY CONDENSED CONSOLIDATED STATEMENTS OF CASH FLOWS (UNAUDITED) continued | |||||||
Six Months Ended March 31, | |||||||
2018 | 2017 | ||||||
Net cash provided by financing activities | 7,055,946 | 38,086,248 | |||||
Net increase in cash and cash equivalents | 27,062,827 | 48,435,538 | |||||
Cash and cash equivalents at beginning of period | 152,338,389 | 91,849,499 | |||||
Cash and cash equivalents at end of period | $ | 179,401,216 | $ | 140,285,037 | |||
Supplemental disclosures of cash flow information: | |||||||
Interest paid | $ | 4,166,755 | $ | 3,599,873 | |||
Income taxes paid | 1,585,000 | 2,183,170 | |||||
Supplemental disclosure of noncash activities: | |||||||
Real estate acquired through foreclosure of collateral on loans receivable | $ | 205,660 | $ | 534,617 | |||
Issuance of common stock under stock benefit plan | 1,021,663 | 684,018 | |||||
Unrealized loss on investment securities available for sale, net | (1,654,714 | ) | (2,849,731 | ) | |||
See accompanying notes to unaudited condensed consolidated financial statements.
6
CHARTER FINANCIAL CORPORATION AND SUBSIDIARY
NOTES TO CONDENSED CONSOLIDATED FINANCIAL STATEMENTS (UNAUDITED)
Note 1: Nature of Operations
Charter Financial Corporation (“Charter Financial” or the “Company”) is a savings and loan holding company that was incorporated under the laws of the State of Maryland in April 2013 to serve as the holding company for CharterBank ("CharterBank" or "the Bank”). The Bank is a federally-chartered savings bank that was originally founded in 1954 as a federally-chartered mutual savings and loan association.
On April 8, 2013, the Company completed its conversion and reorganization pursuant to which it converted from the mutual holding company form of organization to the stock holding company form of organization. The Company sold 14.3 million shares of common stock for gross offering proceeds of $142.9 million in the offering. Following the conversion and reorganization, the Bank became 100% owned by Charter Financial and Charter Financial became 100% owned by public shareholders.
As of March 31, 2018, the Company operates 22 branch offices in the metropolitan Atlanta area ("Metro Atlanta" or "the MSA"), the I-85 corridor south to Auburn, Alabama, and the Florida Gulf Coast, including one cashless branch office in Norcross, Georgia.
Note 2: Basis of Presentation
The accompanying unaudited interim consolidated financial statements of Charter Financial and the Bank include the accounts of the Company and the Bank as of March 31, 2018 and September 30, 2017 (derived from audited financial statements), and for the three and six-month periods ended March 31, 2018 and 2017. All intercompany accounts and transactions have been eliminated in consolidation. The unaudited interim consolidated financial statements have been prepared in accordance with generally accepted accounting principles for interim financial information and with the rules and regulations of the Securities and Exchange Commission. Accordingly, they do not include all of the information and footnotes required by generally accepted accounting principles for complete financial statements. In the opinion of management, the unaudited interim condensed consolidated financial statements include all necessary adjustments, consisting of normal recurring accruals, necessary for a fair presentation for the periods presented. The results of operations for the three and six-month period ended March 31, 2018, are not necessarily indicative of the results that may be expected for the entire year or any other interim period.
The preparation of financial statements in conformity with accounting principles generally accepted in the United States of America requires management to make estimates and assumptions that affect the reported amounts of assets and liabilities and disclosures of contingent assets and liabilities at the date of the financial statements and the reported amounts of revenues and expenses during the reporting period. Actual results could differ from those estimates. Material estimates that are particularly susceptible to significant change in the near term relate to the determination of the allowance for loan losses, the valuation of real estate acquired in connection with foreclosures or in satisfaction of loans, the estimates used for fair value acquisition accounting, the estimate of expected cash flows on purchased impaired and other acquired loans, and the assessment for other-than-temporary impairment of investment securities, mortgage-backed securities, collateralized mortgage-backed securities and collateralized mortgage obligations. Certain reclassifications of prior fiscal year balances have been made to conform to classifications used in the current fiscal year. These reclassifications did not change net income or stockholders' equity.
Note 3: Recent Accounting Pronouncements
In March 2018, the Financial Accounting Standards Board ("FASB") issued Accounting Standards Update ("ASU") No. 2018-05, Income Taxes (Topic 740): Amendments to SEC Paragraphs Pursuant to SEC Staff Accounting Bulletin No. 118 ("ASU 2018-05"). The amendments in this update address certain accounting items for current and deferred income taxes related to the Tax Cuts and Jobs Act ("the Tax Act"). Under these amendments, a Company is expected to record any income tax effects that can be reasonably estimated from the Tax Act in its financial statements, while allowing for those items which cannot be reasonably estimated to remain unrecorded. The amendments are effective immediately. The Company recorded additions to income tax expense in its consolidated statements of income that could reasonably be estimated in the amount of $49,000 and $1.5 million during the three and six months ended March 31, 2018, respectively.
In February 2018, the FASB issued ASU 2018-02, Income Statement - Reporting Comprehensive Income (Topic 220): Reclassification of Certain Tax Effects from Accumulated Other Comprehensive Income. The amendments in this update allow for a reclassification of stranded tax effects resulting from the Tax Act from accumulated other comprehensive income to retained earnings. The amendments in this update are effective for fiscal years beginning after December 15, 2018, and interim periods within those fiscal years. Early adoption is permitted and the Company elected to early adopt this guidance effective March 31, 2018. The adoption resulted in a reclassification of stranded tax effects of $219,000 from accumulated other comprehensive loss to retained earnings in the Company's consolidated statements of financial condition and stockholders' equity at March 31, 2018.
7
In August 2017, the FASB issued ASU 2017-12, Derivatives and Hedging (Topic 815): Targeted Improvements to Accounting for Hedging Activities, which is intended to better align hedge accounting with an organization's risk management activities in the financial statements. The ASU also simplifies the application of hedge accounting guidance in areas where practice issues exist. The amendments in this ASU are intended to address financial statement user concerns over hedge accounting through changes to the guidance that will accomplish the following: (1) expand hedge accounting for nonfinancial and financial risk components and amend measurement methodologies to more closely align hedge accounting with a company's risk management activities; (2) decrease the complexity of preparing and understanding hedge results through eliminating the separate measurement and reporting of hedge ineffectiveness; (3) enhance transparency, comparability, and understandability of hedge results through enhanced disclosures and changing the presentation of hedge results to align the effects of the hedging instrument and the hedged item; and (4) reduce the cost and complexity of applying hedge accounting by simplifying the manner in which assessments of hedge effectiveness may be performed. The standard applies broadly to any company that elects to apply hedge accounting in accordance with current accounting principles generally accepted in the United States of America ("GAAP"), and will be effective for fiscal years beginning after December 15, 2018, and interim periods within those fiscal years. The Company does not currently apply hedge accounting but may do so in the future, and is in the process of determining the impact this standard would have on its consolidated financial statements.
In June 2016, the FASB issued ASU 2016-13, Financial Instruments - Credit Losses (Topic 326): Measurement of Credit Losses on Financial Instruments, which sets forth a "current expected credit loss" ("CECL") model requiring the Company to measure all expected credit losses for financial instruments held at the reporting date based on historical experience, current conditions and reasonable supportable forecasts. This replaces the existing incurred loss model and is applicable to the measurement of credit losses on financial assets measured at amortized cost and applies to some off-balance sheet credit exposures. For public business entities that are U.S. Securities and Exchange Commission filers, the amendments in this update are effective for fiscal years beginning after December 15, 2019, including interim periods within those fiscal years. The Company has assembled a transition team to assess the adoption of this ASU, which is in the process of developing a project plan regarding implementation. The team is currently evaluating data and software requirements for implementation, and plans to run parallel models for a year prior to implementation. The Company is currently in the process of determining the impact of adopting this standard.
In February 2016, the FASB issued ASU 2016-02, Leases (Topic 842). The FASB issued this ASU to increase transparency and comparability among organizations by recognizing lease assets and lease liabilities on the balance sheet by lessees for those leases classified as operating leases under current U.S. GAAP and disclosing key information about leasing arrangements. The amendments in this ASU are effective for public business entities for annual periods, and interim periods within those annual periods, beginning after December 15, 2018. Early application of this ASU is permitted for all entities. The Company is in the process of evaluating its current inventory of leases to determine the impact of adoption of this standard.
In January 2016, the FASB issued ASU 2016-01, Financial Instruments-Recognition and Measurement of Financial Assets and Liabilities, which is intended to improve the recognition and measurement of financial instruments by requiring: equity investments (other than equity method or consolidation) to be measured at fair value with changes in fair value recognized in net income; public business entities to use the exit price notion when measuring the fair value of financial instruments for disclosure purposes; separate presentation of financial assets and financial liabilities by measurement category and form of financial asset (i.e., securities or loans and receivables) on the balance sheet or the accompanying notes to the financial statements; eliminating the requirement to disclose the fair value of financial instruments measured at amortized cost for organizations that are not public business entities; eliminating the requirement for public business entities to disclose the method(s) and significant assumptions used to estimate the fair value that is required to be disclosed for financial instruments measured at amortized cost on the balance sheet; and requiring a reporting organization to present separately in other comprehensive income the portion of the total change in the fair value of a liability resulting from a change in the instrument-specific credit risk (also referred to as “own credit”) when the organization has elected to measure the liability at fair value in accordance with the fair value option for financial instruments. This ASU is effective for public companies for fiscal years beginning after December 15, 2017, including interim periods within those fiscal years. This ASU permits early adoption of the instrument-specific credit risk provision. The adoption of ASU 2016-01 is not expected to have a material impact on the Company's consolidated financial position, results of operations or cash flows.
In May 2014, the FASB issued ASU 2014-09, Revenue From Contracts With Customers. This standard outlines a single comprehensive model for entities to use in accounting for revenue arising from contracts with customers and supersedes most current revenue recognition guidance, including industry specific guidance. The core principle of the revenue model is that an entity recognizes revenue to depict the transfer of promised goods or services to customers in an amount that reflects the consideration to which the entity expects to be entitled in exchange for those goods or services. The standard was to be effective for annual reporting periods beginning after December 15, 2016. In August 2015, the FASB issued ASU 2015-14, deferring the effective date for the standard to reporting periods beginning after December 15, 2017. As a financial institution, the Company's revenue is more significantly weighted towards net interest income on its financial assets and liabilities, which is explicitly excluded from the scope of the new standard. The Company continues to assess its revenue streams and review its contracts with customers that are potentially affected by the new guidance, such as fees on deposits, gains and losses on the sale of other real estate owned,
8
bankcard fees and brokerage commissions, to determine the potential impact the new guidance is expected to have on the Company's consolidated financial statements. The Company's revenue recognition pattern for these revenue streams, however, is not expected to change materially from current practice. The Company also continues to follow implementation issues specific to financial institutions which are still under discussion by the FASB's Transition Resource Group. The Company plans to adopt the ASU on October 1, 2018, most likely under the modified retrospective approach.
Note 4: Business Combinations
Acquisition of Resurgens Bancorp
On September 1, 2017, the Company completed its acquisition of Resurgens Bancorp ("Resurgens") and its wholly-owned subsidiary, Resurgens Bank, for cash consideration of $25.8 million. Upon completion of the acquisition, Resurgens merged into Charter Financial, and Resurgens Bank merged into CharterBank. The acquisition expanded the bank's presence in the Atlanta market with two branches in DeKalb County.
The following table provides a summary of the assets acquired and liabilities assumed of Resurgens as recorded by the Company. As provided for under GAAP, management has up to one year following the date of acquisition to finalize the fair values of the acquired assets and assumed liabilities. The fair values shown in the following table have been determined by management to be the Day 1 Fair Values.
Purchase Price: | |||||||
Cash paid to Resurgens shareholders | $ | 25,775,313 | |||||
Fair value of assets acquired: | |||||||
Cash and cash equivalents | $ | 31,196,692 | |||||
Loans receivable, net | 128,756,348 | ||||||
Federal Home Loan Bank stock | 569,800 | ||||||
Premises and equipment | 1,507,309 | ||||||
Accrued interest and dividends receivable | 468,900 | ||||||
Core deposit intangible | 1,536,000 | ||||||
Bank owned life insurance | 3,051,900 | ||||||
Deferred tax assets | 393,195 | ||||||
Other assets | 476,458 | ||||||
Total assets acquired | 167,956,602 | ||||||
Fair value of liabilities assumed: | |||||||
Deposits | 138,031,166 | ||||||
Federal Home Loan Bank advances | 10,024,100 | ||||||
Other borrowings | 3,250,000 | ||||||
Advance payments by borrowers for taxes and insurance | 47,592 | ||||||
Other liabilities | 382,053 | ||||||
Total liabilities assumed | $ | 151,734,911 | |||||
Fair value of net assets acquired | 16,221,691 | ||||||
Goodwill recognized for Resurgens | $ | 9,553,622 | |||||
Goodwill of $9.6 million, which is the excess of merger consideration over the estimated fair value of net assets acquired, was recorded and is the result of expected operational synergies and other factors. This goodwill is not expected to be deductible for tax purposes.
No loans were recognized as credit impaired in the acquisition.
The Company recorded $618,000 and $927,000 of merger expenses related to the Resurgens acquisition during the three and six months ended March 31, 2018, respectively, and $1.9 million of such expenses during the year ended September 30, 2017. Full conversion of the acquisition was completed in mid-February of 2018, and no further costs related to the Resurgens acquisition
9
are expected. The Company also assumed a $3.3 million borrowing that was paid off immediately following closing of the acquisition.
Acquisition of CBS Financial Corporation
On April 15, 2016, the Company completed its acquisition of CBS Financial Corporation ("CBS") and its wholly-owned subsidiary, Community Bank of the South, for cash consideration of $55.9 million. In addition to the cash paid by Charter Financial, CBS paid approximately $2.9 million in Stock Appreciation Rights and Stock Options payouts to its holders for a total transaction value of $58.8 million. Upon completion of the acquisition, CBS merged into Charter Financial, and Community Bank of the South merged into CharterBank. The acquisition expanded the bank's presence in the Atlanta market with four branches in Cobb County.
The Company acquired $300.8 million of net loans receivable, and assumed $333.7 million of deposits. Goodwill of $25.5 million, which is the excess of the merger consideration over the estimated fair value of net assets acquired, was recorded in the CBS acquisition and is the result of expected operational synergies and other factors. A portion of this goodwill is expected to be deductible for tax purposes.
No loans were recognized as credit impaired in the acquisition.
Note 5: Investment Securities
Investment securities available for sale are summarized as follows:
March 31, 2018 | |||||||||||||||
Amortized Cost | Gross Unrealized Gains | Gross Unrealized Losses | Estimated Fair Value | ||||||||||||
Other investment securities: | |||||||||||||||
State and municipal securities | $ | 1,577,639 | $ | — | $ | (11,259 | ) | $ | 1,566,380 | ||||||
Collateralized loan obligations | 43,845,902 | 68,145 | (80,055 | ) | 43,833,992 | ||||||||||
Mortgage-backed securities: | |||||||||||||||
FHLMC certificates | 19,269,394 | 23,325 | (376,464 | ) | 18,916,255 | ||||||||||
FNMA certificates | 109,819,574 | 45,684 | (3,583,982 | ) | 106,281,276 | ||||||||||
GNMA certificates | 1,031,668 | — | (31,338 | ) | 1,000,330 | ||||||||||
Private-label mortgage securities: (1) | |||||||||||||||
Investment grade | 856,146 | 606 | (20,528 | ) | 836,224 | ||||||||||
Split rating (2) | 1,574,036 | — | (76,784 | ) | 1,497,252 | ||||||||||
Non-investment grade | 617,234 | — | (12,635 | ) | 604,599 | ||||||||||
Total | $ | 178,591,593 | $ | 137,760 | $ | (4,193,045 | ) | $ | 174,536,308 | ||||||
________________________________
(1) | Credit ratings are current as of March 31, 2018. |
(2) | Bonds with split ratings represent securities with both investment and non-investment grades. |
10
September 30, 2017 | |||||||||||||||
Amortized Cost | Gross Unrealized Gains | Gross Unrealized Losses | Estimated Fair Value | ||||||||||||
Other investment securities: | |||||||||||||||
State and municipal securities | $ | 2,238,758 | $ | 13,177 | $ | (120 | ) | $ | 2,251,815 | ||||||
Collateralized loan obligations | 40,629,368 | 92,000 | (43,692 | ) | 40,677,676 | ||||||||||
Mortgage-backed securities: | |||||||||||||||
FHLMC certificates | 21,657,987 | 220,228 | (123,093 | ) | 21,755,122 | ||||||||||
FNMA certificates | 114,740,214 | 177,495 | (1,926,890 | ) | 112,990,819 | ||||||||||
GNMA certificates | 2,504,334 | 2,645 | (916 | ) | 2,506,063 | ||||||||||
Private-label mortgage securities: | |||||||||||||||
Investment grade | 614,679 | — | (23,236 | ) | 591,443 | ||||||||||
Split rating (1) | 2,337,239 | — | (87,569 | ) | 2,249,670 | ||||||||||
Non-investment grade | 790,956 | — | (23,743 | ) | 767,213 | ||||||||||
Total | $ | 185,513,535 | $ | 505,545 | $ | (2,229,259 | ) | $ | 183,789,821 | ||||||
______________________________
(1) | Bonds with split ratings represent securities with both investment and non-investment grades. |
The amortized cost and estimated fair value of investment securities available for sale as of March 31, 2018, by contractual maturity, are shown below. Expected maturities may differ from contractual maturities because borrowers may have the right to call or prepay obligations with or without call or prepayment penalties.
Amortized Cost | Estimated Fair Value | ||||||
Due within one year | $ | 503,002 | $ | 502,235 | |||
Due from one year to five years | 1,074,637 | 1,064,145 | |||||
Due after five years | 43,845,902 | 43,833,992 | |||||
Mortgage-backed securities | 133,168,052 | 129,135,936 | |||||
Total | $ | 178,591,593 | $ | 174,536,308 | |||
During the six months ended March 31, 2018 and March 31, 2017, $12.3 million and $11.7 million in investment securities available for sale were called or matured, respectively. Proceeds from sales of investment securities available for sale were $13,336 and $2.1 million during the six months ended March 31, 2018 and 2017. Gross realized gains on the sale of these securities were $1,074 for the six months ended March 31, 2018, and $247,780 for the same period in 2017. No gross realized losses were recognized for the six months ended March 31, 2018 or March 31, 2017.
Investment securities available for sale with an aggregate carrying value of $51.2 million and $89.6 million at March 31, 2018 and September 30, 2017, respectively, were available to be pledged to secure Federal Home Loan Bank (“FHLB”) advances. However, no securities were pledged at either period end to secure FHLB advances.
Investment securities available for sale that had been in a continuous unrealized loss position for less than 12 months at March 31, 2018 and September 30, 2017 are as follows:
11
March 31, 2018 | |||||||||||
Amortized Cost | Gross Unrealized Losses | Estimated Fair Value | |||||||||
Other investment securities: | |||||||||||
State and municipal securities | $ | 1,577,639 | $ | (11,259 | ) | $ | 1,566,380 | ||||
Collateralized loan obligations | 21,153,205 | (80,055 | ) | 21,073,150 | |||||||
Mortgage-backed securities: | |||||||||||
FHLMC certificates | 3,143,579 | (38,947 | ) | 3,104,632 | |||||||
FNMA certificates | 33,805,110 | (645,084 | ) | 33,160,026 | |||||||
GNMA certificates | 1,031,668 | (31,338 | ) | 1,000,330 | |||||||
Total | $ | 60,711,201 | $ | (806,683 | ) | $ | 59,904,518 | ||||
September 30, 2017 | |||||||||||
Amortized Cost | Gross Unrealized Losses | Estimated Fair Value | |||||||||
Other investment securities: | |||||||||||
State and municipal securities | $ | 556,675 | $ | (120 | ) | $ | 556,555 | ||||
Collateralized loan obligations | 9,173,224 | (43,692 | ) | 9,129,532 | |||||||
Mortgage-backed securities: | |||||||||||
FHLMC certificates | 10,721,484 | (123,093 | ) | 10,598,391 | |||||||
FNMA certificates | 46,902,868 | (270,060 | ) | 46,632,808 | |||||||
GNMA certificates | 1,042,769 | (916 | ) | 1,041,853 | |||||||
Private-label mortgage securities | 107,879 | (211 | ) | 107,668 | |||||||
Total | $ | 68,504,899 | $ | (438,092 | ) | $ | 68,066,807 | ||||
Investment securities available for sale that had been in a continuous unrealized loss position for greater than 12 months at March 31, 2018 and September 30, 2017 are as follows:
March 31, 2018 | |||||||||||
Amortized Cost | Gross Unrealized Losses | Estimated Fair Value | |||||||||
Mortgage-backed securities: | |||||||||||
FHLMC certificates | $ | 9,572,065 | $ | (337,516 | ) | $ | 9,234,549 | ||||
FNMA certificates | 71,691,032 | (2,938,899 | ) | 68,752,133 | |||||||
Private-label mortgage securities | 2,647,132 | (109,947 | ) | 2,537,185 | |||||||
Total | $ | 83,910,229 | $ | (3,386,362 | ) | $ | 80,523,867 | ||||
September 30, 2017 | |||||||||||
Amortized Cost | Gross Unrealized Losses | Estimated Fair Value | |||||||||
Mortgage-backed securities: | |||||||||||
FNMA certificates | $ | 59,666,482 | $ | (1,656,829 | ) | $ | 58,009,653 | ||||
Private-label mortgage securities | 3,634,997 | (134,338 | ) | 3,500,659 | |||||||
Total | $ | 63,301,479 | $ | (1,791,167 | ) | $ | 61,510,312 | ||||
At March 31, 2018 the Company had approximately $110,000 of gross unrealized losses on private-label mortgage securities with aggregate amortized cost of approximately $2.6 million. As of March 31, 2018, the Company has no other-than-temporary impairment losses in its portfolio of investment securities available for sale.
12
Regularly, the Company performs an assessment to determine whether there have been any events or economic circumstances to indicate that a security on which there is an unrealized loss is impaired other-than-temporarily. The assessment considers many factors including the severity and duration of the impairment, the Company’s intent and ability to hold the security for a period of time sufficient for recovery in value, recent events specific to the industry, and current characteristics of each security such as delinquency and foreclosure levels, credit enhancements, and projected losses and loss coverage ratios. It is possible that the underlying collateral of these securities will perform worse than current expectations, which may lead to adverse changes in cash flows on these securities and potential future other-than-temporary impairment losses. Events that may trigger material declines in fair values for these securities in the future include but are not limited to, deterioration of credit metrics, significantly higher levels of default and severity of loss on the underlying collateral, deteriorating credit enhancement and loss coverage ratios, or further illiquidity. All of these securities were evaluated for other-than-temporary impairment based on an analysis of the factors and characteristics of each security as previously enumerated. The Company considers these unrealized losses to be temporary impairment losses primarily because of continued sufficient levels of credit enhancements and credit coverage levels of less senior tranches to tranches held by the Company.
Note 6: Loans Receivable
Loans outstanding, by portfolio segment, are summarized in the following table:
March 31, 2018 | September 30, 2017 | ||||||
1-4 family residential real estate | $ | 246,513,415 | $ | 232,040,341 | |||
Commercial real estate | 682,151,257 | 697,070,779 | |||||
Commercial | 106,098,785 | 103,673,447 | |||||
Real estate construction | 91,739,392 | 88,791,799 | |||||
Consumer and other | 37,461,328 | 39,943,386 | |||||
Total loans, net of acquisition fair value adjustments | 1,163,964,177 | 1,161,519,752 | |||||
Unamortized loan origination fees, net | (967,809 | ) | (1,165,148 | ) | |||
Allowance for loan losses | (11,110,903 | ) | (11,078,422 | ) | |||
Total loans, net | $ | 1,151,885,465 | $ | 1,149,276,182 | |||
Loan Origination and Risk Management. The Company has certain lending policies and procedures in place that are designed to maximize loan income within an acceptable level of risk. Management reviews and approves these policies and procedures on a regular basis. A reporting system supplements the review process by providing management with frequent reports related to loan production, loan quality, concentrations of credit, loan delinquencies and nonperforming and potential problem loans. Diversification in the loan portfolio is a means of managing risk associated with fluctuations in economic conditions.
Commercial real estate loans are generally made by the Company to entities in Georgia, Alabama, Florida and adjoining states and are secured by properties in these states. Commercial real estate lending involves different risks compared to one- to four-family residential lending. Repayment of commercial real estate loans often depends on the successful operations and income stream of the borrowers, and commercial real estate loans typically involve larger loan balances to single borrowers or groups of related borrowers compared to residential real estate loans. The Company’s underwriting criteria for commercial real estate loans include maximum loan-to-value ratios, debt coverage ratios, secondary sources of repayment, guarantor requirements, net worth requirements and quality of cash flow. As part of the loan approval and underwriting of commercial real estate loans, management undertakes a cash flow analysis, and generally requires a debt-service coverage ratio of at least 1.15 times. In addition, management tracks the level of owner-occupied commercial real estate loans versus non-owner occupied loans. At March 31, 2018, approximately 31.7% of the outstanding principal balance of the Company’s commercial real estate loans was secured by owner-occupied properties.
The Company makes construction and land development loans primarily for the construction of one- to four-family residences but also for multi-family and nonresidential real estate projects on a select basis. The Company offers construction loans to builders including both speculative (unsold) and pre-sold loans to pre-approved local builders. The number of speculative loans that management will extend to a builder at one time depends upon the financial strength and credit history of the builder. The Company’s construction loan program is expected to remain a modest portion of the loan volume, and management generally limits the number of outstanding loans on unsold homes under construction within a specific area.
The Company also originates first and second mortgage loans and home equity lines of credit secured by one- to four-family residential properties within Georgia, Alabama and the Florida panhandle. Management currently originates mortgages at all branch locations, but utilizes a centralized underwriting location to reduce risk. The Company originates both fixed rate and
13
adjustable rate one- to four-family residential mortgage loans. Fixed rate 30-year conforming loans are generally originated for sale into the primary or secondary markets and loans that are non-conforming due to property exceptions and that have adjustable rates are generally retained in the Company’s portfolio. The non-conforming loans originated are not considered to be subprime loans and the amount of subprime and low documentation loans held by the Company is not material. The Company also offers home equity lines of credit as a complement to one- to four-family residential mortgage lending. The underwriting standards applicable to home equity credit lines are similar to those for one- to four-family residential mortgage loans, except for slightly more stringent credit-to-income and credit score requirements. Home equity loans are generally limited to 90% of the value of the underlying property unless the loan is covered by private mortgage insurance. At March 31, 2018, the Company had $44.8 million of home equity lines of credit and second mortgage loans.
The Company originates consumer loans that consist of loans on deposits, auto loans, purchased mobile home loans, and various other installment loans. The Company primarily offers consumer loans as an accommodation to customers. Consumer loans tend to have a higher credit risk than residential mortgage loans because they may be secured by rapidly depreciable assets, or may be unsecured. The Company’s consumer lending generally follows accepted industry standards for non-subprime lending, including credit scores and debt to income ratios.
The Company’s commercial business loans are generally limited to terms of ten years or less. While management typically collateralizes these loans with a lien on commercial real estate or, much less frequently, with a lien on business assets and equipment, the primary underwriting consideration is the business cash flow. Management also generally requires the personal guarantee of the business owner. Interest rates on commercial business loans are generally higher than interest rates on residential or commercial real estate loans due to the risk inherent in this type of loan. Commercial business loans are generally considered to have more risk than residential mortgage loans or commercial real estate loans because the collateral may be in the form of intangible assets and/or readily depreciable inventory. Commercial business loans may also involve relatively large loan balances to single borrowers or groups of related borrowers, with the repayment of such loans typically dependent on the successful operation and income stream of the borrower. Such risks can be significantly affected by economic conditions. In addition, commercial business lending generally requires substantially greater supervision efforts by management compared to residential mortgage or commercial real estate lending.
The Company also has a portfolio of Small Business Administration ("SBA") loans, which are generally related to commercial lending. Each loan has either a portion guaranteed by the SBA or other credit enhancements provided by the government.
The Company maintains an internal loan review function that reviews and validates the credit risk program on a periodic basis. Results of these reviews are presented to management. The loan review process complements and reinforces the risk identification and assessment decisions made by lenders and credit personnel, as well as the Company’s policies and procedures.
14
Nonaccrual and Past Due Loans. An aging analysis of past due loans, segregated by portfolio segment, at March 31, 2018 and September 30, 2017 was as follows:
March 31, 2018 | September 30, 2017 | ||||||
Current | $ | 1,156,964,332 | $ | 1,155,094,965 | |||
Accruing past due loans: | |||||||
30-89 days past due | |||||||
1-4 family residential real estate | 932,131 | 1,567,688 | |||||
Commercial real estate | 2,288,589 | 1,490,424 | |||||
Commercial | 392,941 | 1,000,840 | |||||
Real estate construction | 1,473,067 | — | |||||
Consumer and other | 489,789 | 659,174 | |||||
Total 30-89 days past due | 5,576,517 | 4,718,126 | |||||
90 days or greater past due (1) | |||||||
1-4 family residential real estate | 119,192 | 46,223 | |||||
Commercial real estate | — | — | |||||
Commercial | — | — | |||||
Real estate construction | — | — | |||||
Consumer and other | — | — | |||||
Total 90 days or greater past due | 119,192 | 46,223 | |||||
Total accruing past due loans | 5,695,709 | 4,764,349 | |||||
Nonaccruing loans: (2) | |||||||
1-4 family residential real estate | 316,666 | 293,224 | |||||
Commercial real estate | 896,676 | 1,327,037 | |||||
Commercial | 90,794 | 40,177 | |||||
Real estate construction | — | — | |||||
Consumer and other | — | — | |||||
Nonaccruing loans | 1,304,136 | 1,660,438 | |||||
Total loans | $ | 1,163,964,177 | $ | 1,161,519,752 | |||
(1) | No acquired loans are regarded as accruing loans and included in this section at March 31, 2018 or September 30, 2017. These loans which are accounted for under ASC 310-30 are reported as accruing loans because of the ongoing recognition of accretion income established at the time of acquisition. |
(2) | Acquired loans in the amount of $0 and $888,000 at March 31, 2018 and September 30, 2017, respectively, are regarded as accruing loans and excluded from the nonaccrual section due to the ongoing recognition of accretion income established at the time of acquisition. |
Impaired Loans. The Company evaluates “impaired” loans, which include nonperforming loans and accruing troubled debt restructured loans having risk characteristics that are unique to an individual borrower, on a loan-by-loan basis with balances above a specified level. For smaller loans, the allowance is calculated based on the credit grade utilizing historical loss experience and other qualitative factors.
15
Impaired loans for the periods ended March 31, 2018 and September 30, 2017, segregated by portfolio segment, are presented below. There were $732,890 and $48,733 of recorded allowances for loan losses on impaired loans at March 31, 2018 and September 30, 2017, respectively.
Three Months Ended March 31, 2018 | Six Months Ended March 31, 2018 | ||||||||||||||||||||||||||
Recorded Investment | Unpaid Principal Balance | Related Allowance | Average Investment in Impaired Loans | Interest Income Recognized | Average Investment in Impaired Loans | Interest Income Recognized | |||||||||||||||||||||
1-4 family residential real estate (1) | $ | 1,071,029 | $ | 1,219,249 | $ | 62,092 | $ | 1,132,046 | $ | 24,421 | $ | 1,143,406 | $ | 19,678 | |||||||||||||
Commercial real estate (2) | 8,851,099 | 10,067,396 | 649,353 | 9,065,168 | 99,499 | 9,167,858 | 201,067 | ||||||||||||||||||||
Commercial | 90,794 | 301,715 | — | 159,518 | — | 185,481 | — | ||||||||||||||||||||
Real estate construction | — | — | — | — | — | — | — | ||||||||||||||||||||
Consumer and other (3) | 27,383 | 28,702 | 21,445 | 27,741 | 451 | 28,096 | 913 | ||||||||||||||||||||
Total impaired loans | $ | 10,040,305 | $ | 11,617,062 | $ | 732,890 | $ | 10,384,473 | $ | 124,371 | $ | 10,524,841 | $ | 221,658 | |||||||||||||
________________________________
(1) | 1-4 family residential real estate loans with related allowances totaling $62,092 had a recorded investment of $91,344 and unpaid principal balance of $96,197 at March 31, 2018. During the three and six months ended March 31, 2018, the Company had an average investment in such loans of $92,174 and $92,961, respectively, and recorded $535 and $1,078 of interest income, respectively, on the loans. |
(2) | Commercial real estate loans with related allowances totaling $649,353 had a recorded investment of $4,529,052 and unpaid principal balance of $4,849,624 at March 31, 2018. During the three and six months ended March 31, 2018, the Company had an average investment in such loans of $4,710,617 and $4,784,971, respectively, and recorded $52,994 and $107,662 of interest income, respectively, on the loans. |
(3) | Consumer and other loans with related allowances totaling $21,445 had a recorded investment of $27,383 and unpaid principal balance of $28,702 at March 31, 2018. During the three and six months ended March 31, 2018, the Company had an average investment in such loans of $27,741 and $28,096, respectively, and recorded $451 and $913 of interest income, respectively, on the loans. |
The recorded investment in accruing troubled debt restructured loans (“TDRs”) at March 31, 2018 totaled $4.1 million and is included in the impaired loan table above.
Year Ended September 30, 2017 | |||||||||||||||||||
Recorded Investment | Unpaid Principal Balance | Related Allowance | Average Investment in Impaired Loans | Interest Income Recognized | |||||||||||||||
1-4 family residential real estate (1) | $ | 955,522 | $ | 1,143,831 | $ | 24,434 | $ | 975,317 | $ | 33,166 | |||||||||
Commercial real estate (2) | 5,960,208 | 6,970,943 | 24,299 | 6,131,422 | 259,651 | ||||||||||||||
Commercial | 140,012 | 363,382 | — | 161,068 | — | ||||||||||||||
Real estate construction | — | — | — | — | — | ||||||||||||||
Consumer and Other | 28,806 | 30,125 | — | 30,394 | 1,976 | ||||||||||||||
Total impaired loans | $ | 7,084,548 | $ | 8,508,281 | $ | 48,733 | $ | 7,298,201 | $ | 294,793 | |||||||||
________________________________
(1) | 1-4 family residential real estate loans with related allowances totaling $24,434 had a recorded investment of $24,434 and unpaid principal balance of $25,131 at September 30, 2017. During the year ended September 30, 2017, the Company had an average investment in such loans of $24,858 and recorded $90 of interest income on the loans. |
(2) | Commercial real estate loans with related allowances totaling $24,299 had a recorded investment of $686,520 and unpaid principal balance of $695,762 at September 30, 2017. During the year ended September 30, 2017, the Company had an average investment in such loans of $717,892 and recorded $39,825 of interest income on the loans. |
The recorded investment in accruing TDRs at September 30, 2017 totaled $5.0 million and is included in the impaired loan table above.
Loans are classified as restructured by the Company when certain modifications are made to the loan terms and concessions are granted to the borrowers due to financial difficulty experienced by those borrowers. The Company only restructures loans for borrowers in financial difficulty that have presented a viable business plan to fully pay off all obligations, including outstanding
16
debt, interest, and fees, either by generating additional income from the business or through liquidation of assets. Generally, these loans are restructured to provide the borrower additional time to execute upon their plans. The concessions granted on TDRs generally include terms to reduce the interest rate or extend the term of the debt obligation.
Loans on nonaccrual status at the date of modification are initially classified as nonaccrual TDRs. Loans on accruing status at the date of concession are initially classified as accruing TDRs if the loan is reasonably assured of repayment and performance is expected in accordance with its modified terms. Such loans may be designated as nonaccrual loans subsequent to the concession date if reasonable doubt exists as to the collection of interest or principal under the restructuring agreement. TDRs are returned to accruing status when there is economic substance to the restructuring, there is documented credit evaluation of the borrower’s financial condition, the remaining balance is reasonably assured of repayment in accordance with its modified terms, and the borrower has demonstrated sustained repayment performance in accordance with the modified terms for a reasonable period of time (generally a minimum of six months).
For the six month periods ended March 31, 2018 and 2017, the following table presents a breakdown of the types of concessions determined to be TDRs during the period by loan class.
Accruing Loans | Nonaccrual Loans | ||||||||||||||||||
Six Months Ended March 31, 2018 | Six Months Ended March 31, 2018 | ||||||||||||||||||
Number of Loans | Pre-Modification Outstanding Recorded Investment | Post-Modification Outstanding Recorded Investment | Number of Loans | Pre-Modification Outstanding Recorded Investment | Post-Modification Outstanding Recorded Investment | ||||||||||||||
Payment structure modification: | |||||||||||||||||||
1-4 family residential real estate | 4 | $ | 195,854 | $ | 195,854 | — | $ | — | $ | — | |||||||||
Commercial real estate | 1 | 94,337 | 94,337 | 1 | 86,788 | 86,788 | |||||||||||||
Total | 5 | $ | 290,191 | $ | 290,191 | 1 | $ | 86,788 | $ | 86,788 | |||||||||
Accruing Loans | Nonaccrual Loans | ||||||||||||||||||
Six Months Ended March 31, 2017 | Six Months Ended March 31, 2017 | ||||||||||||||||||
Number of Loans | Pre-Modification Outstanding Recorded Investment | Post-Modification Outstanding Recorded Investment | Number of Loans | Pre-Modification Outstanding Recorded Investment | Post-Modification Outstanding Recorded Investment | ||||||||||||||
Payment structure modification: | |||||||||||||||||||
1-4 family residential real estate | 5 | $ | 335,006 | $ | 335,006 | — | $ | — | $ | — | |||||||||
Commercial real estate | 2 | 515,639 | 515,639 | — | — | — | |||||||||||||
Consumer and other | — | — | — | 1 | 32,138 | 32,138 | |||||||||||||
Total | 7 | $ | 850,645 | $ | 850,645 | 1 | $ | 32,138 | $ | 32,138 | |||||||||
At March 31, 2018, restructured loans with a modified balance of $4.1 million were accruing and $174,941 were nonaccruing, while restructured loans with a modified balance of $5.1 million were accruing and $136,831 were nonaccruing at March 31, 2017. There were no loans that were restructured within the past twelve months and subsequently defaulted at March 31, 2018, while there was one loan in the amount of $271,107 that defaulted within twelve months of its restructure at March 31, 2017.
Acquired Impaired Loans. The following table documents changes in the accretable discount on acquired credit impaired loans during the six months ended March 31, 2018 and 2017:
Six Months Ended March 31, 2018 | Six Months Ended March 31, 2017 | ||||||
Balance, beginning of period | $ | — | $ | 462,071 | |||
Loan accretion | — | (322,657 | ) | ||||
Balance, end of period | $ | — | $ | 139,414 | |||
17
The following table presents the outstanding balances and related carrying amounts for all purchase credit impaired loans at the periods ended March 31, 2018 and September 30, 2017:
March 31, 2018 | September 30, 2017 | ||||||
Unpaid principal balance | $ | 17,459,470 | $ | 18,327,905 | |||
Carrying amount | 16,168,261 | 16,974,607 | |||||
Acquired Performing Loans. Included within total loans are acquired performing loans shown net of fair value discounts in the amount of $283.6 million and $333.5 million at March 31, 2018 and September 30, 2017, respectively. These fair value discounts are being amortized over the remaining lives of the respective loans and totaled $2.9 million and $4.1 million at March 31, 2018 and September 30, 2017, respectively.
Credit Quality Indicators. As part of the ongoing monitoring of the credit quality of the Company’s loan portfolio, management tracks certain credit quality indicators including the level of classified loans, net charge-offs, nonperforming loans (see details above) and the general economic conditions in its market areas.
The Company utilizes a risk rating system to assign a risk grade to each of its loans. Loans are graded on a scale of 1 to 8. The risk grade for each individual loan is determined by the loan officer and other approving officers at the time of loan origination and is adjusted from time to time to reflect an ongoing assessment of loan risk. Risk grades are reviewed quarterly for all substandard, nonaccrual and TDR loans, and annually as part of the Company's internal loan review process. In addition, individual loan risk grades are reviewed in connection with all renewals, extensions and modifications.
The following table presents the risk grades of the loan portfolio, segregated by class of loans:
March 31, 2018
1-4 family residential real estate | Commercial real estate | Commercial | Real estate construction | Consumer and other | Total | ||||||||||||||||||
Pass (1-4) | $ | 244,308,574 | $ | 651,634,436 | $ | 102,527,459 | $ | 91,739,392 | $ | 37,433,945 | $ | 1,127,643,806 | |||||||||||
Special Mention (5) | — | 11,327,990 | 3,210,513 | — | — | 14,538,503 | |||||||||||||||||
Substandard (6) | 2,204,841 | 19,188,831 | 360,813 | — | 27,383 | 21,781,868 | |||||||||||||||||
Doubtful (7) | — | — | — | — | — | — | |||||||||||||||||
Loss (8) | — | — | — | — | — | — | |||||||||||||||||
Total loans | $ | 246,513,415 | $ | 682,151,257 | $ | 106,098,785 | $ | 91,739,392 | $ | 37,461,328 | $ | 1,163,964,177 | |||||||||||
September 30, 2017
1-4 family residential real estate | Commercial real estate | Commercial | Real estate construction | Consumer and other | Total | ||||||||||||||||||
Pass (1-4) | $ | 230,417,503 | $ | 654,217,207 | $ | 102,690,306 | $ | 88,551,410 | $ | 39,914,580 | $ | 1,115,791,006 | |||||||||||
Special Mention (5) | — | 14,318,249 | 494,241 | 240,389 | — | 15,052,879 | |||||||||||||||||
Substandard (6) | 1,622,838 | 28,535,323 | 488,900 | — | 28,806 | 30,675,867 | |||||||||||||||||
Doubtful (7) | — | — | — | — | — | — | |||||||||||||||||
Loss (8) | — | — | — | — | — | — | |||||||||||||||||
Total loans | $ | 232,040,341 | $ | 697,070,779 | $ | 103,673,447 | $ | 88,791,799 | $ | 39,943,386 | $ | 1,161,519,752 | |||||||||||
Allowance for Loan Losses. The allowance for loan losses is established through a provision for loan losses charged to expense and is an amount that management believes will be adequate to absorb losses on existing loans that become uncollectible, based on evaluations of the collectability of loans. The evaluations take into consideration such factors as changes in the nature and volume of the loan portfolio, historical loss rates, overall portfolio quality, review of specific problem loans, and current economic conditions and trends that may affect a borrower’s ability to repay. Loans are charged against the allowance for loan losses when management believes that the collectability of the principal is unlikely. Subsequent recoveries are added to the allowance.
Management’s allowance for loan losses methodology is a loan classification-based system. Management bases the required reserve on a percentage of the loan balance for each type of loan and classification level. Loans may be classified manually and are automatically classified if they are not previously classified when they reach certain levels of delinquency. Unclassified loans are
18
reserved at different percentages based on the loan loss history of the last seven years. Reserve percentages are also adjusted based upon our estimate of the effect that the current economic environment will have on each type of loan.
Management segments its allowance for loan losses into the following four major categories: (1) specific reserves; (2) general allowances for Classified/Watch loans; (3) general allowances for loans with satisfactory ratings; and (4) an unallocated amount. Risk ratings are initially assigned in accordance with CharterBank’s loan and collection policy. An organizationally independent department reviews risk grade assignments on an ongoing basis. Management reviews current information and events regarding a borrowers’ financial condition and strengths, cash flows available for debt repayment, the related collateral supporting the loan and the effects of known and expected economic conditions. When the evaluation reflects a greater than normal risk associated with the individual loan, management classifies the loan accordingly. If the loan is determined to be impaired, management allocates a portion of the allowance for loan losses for that loan based on the fair value of the collateral, if the loan is considered collateral-dependent, as the measure for the amount of the impairment. Impaired and Classified/Watch loans are aggressively monitored.
The allowances for loans by credit grade are further subdivided by loan type. Charter Financial has developed specific quantitative allowance factors to apply to each loan which considers loan charge-off experience over the most recent seven years by loan type. In addition, loss estimates are applied for certain qualitative allowance factors that are subjective in nature and require considerable judgment on the part of management. Such qualitative factors include economic and business conditions, the volume of past due loans, changes in the value of collateral of collateral-dependent loans, and other economic uncertainties. An unallocated component of the allowance is also established for potential losses that exist in the remainder of the portfolio, but have yet to be identified.
The Company incorporates certain refinements and improvements to its allowance for loan losses methodology from time to time. During the current quarter and the prior fiscal year, the Company made minor refinements to the qualitative risk factors but no significant changes to its allowance methodology. The adjustments in the Company's methodology were not material to the overall allowance or provision for the three and six months ended March 31, 2018 or for the fiscal year ended September 30, 2017.
An unallocated allowance is generally maintained in a range of 4% to 12% of the total allowance in recognition of the imprecision of the estimates and other factors. In times of greater economic downturn and uncertainty, the higher end of this range is provided.
The Company recorded net recoveries of $382,481 during the six months ended March 31, 2018. With asset quality remaining strong, and the continued trend of net recoveries, the Company recorded a $350,000 negative provision for loan losses during the three and six months ended March 31, 2018. A negative provision of $900,000 was recorded during the fiscal year ended September 30, 2017, while negative provisions of $150,000 and $900,000 were recorded during the three and six months ended March 31, 2017, respectively.
The following tables present an analysis of the allowance for loan losses by portfolio segment and changes in the allowance for loan losses for the three and six months ended March 31, 2018 and 2017. The total allowance for loan losses is disaggregated into those amounts associated with loans individually evaluated and those associated with loans collectively evaluated, as well as loans acquired with deteriorated credit quality.
Three Months Ended March 31, 2018 | |||||||||||||||||||||||||||
1-4 family real estate | Commercial real estate | Commercial | Real estate construction | Consumer and other | Unallocated | Total | |||||||||||||||||||||
Allowance for loan losses: | |||||||||||||||||||||||||||
Beginning balance | $ | 677,558 | $ | 7,762,781 | $ | 836,660 | $ | 536,106 | $ | 196,081 | $ | 1,104,759 | $ | 11,113,945 | |||||||||||||
Charge-offs | (99,979 | ) | — | (128,926 | ) | — | (4,491 | ) | — | (233,396 | ) | ||||||||||||||||
Recoveries | 68,352 | 357,977 | 139,539 | — | 14,486 | — | 580,354 | ||||||||||||||||||||
Provision | 131,353 | (508,699 | ) | 17,073 | 13,243 | (18,750 | ) | 15,780 | (350,000 | ) | |||||||||||||||||
Ending balance | $ | 777,284 | $ | 7,612,059 | $ | 864,346 | $ | 549,349 | $ | 187,326 | $ | 1,120,539 | $ | 11,110,903 | |||||||||||||
19
Three Months Ended March 31, 2017 | |||||||||||||||||||||||||||
1-4 family real estate | Commercial real estate | Commercial | Real estate construction | Consumer and other | Unallocated | Total | |||||||||||||||||||||
Allowance for loan losses: | |||||||||||||||||||||||||||
Beginning balance | $ | 773,060 | $ | 7,099,906 | $ | 769,665 | $ | 670,504 | $ | 158,477 | $ | 1,027,616 | $ | 10,499,228 | |||||||||||||
Charge-offs | (92,136 | ) | — | — | — | (10,858 | ) | — | (102,994 | ) | |||||||||||||||||
Recoveries | 25,506 | 85,342 | 140,374 | — | 7,082 | — | 258,304 | ||||||||||||||||||||
Provision | 83,343 | 109,007 | (194,379 | ) | (267,324 | ) | 39,560 | 79,793 | (150,000 | ) | |||||||||||||||||
Ending balance | $ | 789,773 | $ | 7,294,255 | $ | 715,660 | $ | 403,180 | $ | 194,261 | $ | 1,107,409 | $ | 10,504,538 | |||||||||||||
Six Months Ended March 31, 2018 | |||||||||||||||||||||||||||
1-4 family real estate | Commercial real estate | Commercial | Real estate construction | Consumer and other | Unallocated | Total | |||||||||||||||||||||
Allowance for loan losses: | |||||||||||||||||||||||||||
Beginning balance | $ | 663,061 | $ | 7,820,078 | $ | 776,551 | $ | 482,665 | $ | 196,037 | $ | 1,140,030 | $ | 11,078,422 | |||||||||||||
Charge-offs | (169,370 | ) | (194,204 | ) | (128,926 | ) | — | (7,620 | ) | — | (500,120 | ) | |||||||||||||||
Recoveries | 129,643 | 450,637 | 282,591 | — | 19,730 | — | 882,601 | ||||||||||||||||||||
Provision | 153,950 | (464,452 | ) | (65,870 | ) | 66,684 | (20,821 | ) | (19,491 | ) | (350,000 | ) | |||||||||||||||
Ending balance | $ | 777,284 | $ | 7,612,059 | $ | 864,346 | $ | 549,349 | $ | 187,326 | $ | 1,120,539 | $ | 11,110,903 | |||||||||||||
Six Months Ended March 31, 2017 | |||||||||||||||||||||||||||
1-4 family real estate | Commercial real estate | Commercial | Real estate construction | Consumer and other | Unallocated | Total | |||||||||||||||||||||
Allowance for loan losses: | |||||||||||||||||||||||||||
Beginning balance | $ | 779,288 | $ | 7,346,130 | $ | 600,258 | $ | 516,556 | $ | 79,140 | $ | 1,050,044 | $ | 10,371,416 | |||||||||||||
Charge-offs | (92,136 | ) | (49,097 | ) | — | — | (11,804 | ) | — | (153,037 | ) | ||||||||||||||||
Recoveries | 137,420 | 754,425 | 271,169 | — | 23,145 | — | 1,186,159 | ||||||||||||||||||||
Provision | (34,799 | ) | (757,203 | ) | (155,767 | ) | (113,376 | ) | 103,780 | 57,365 | (900,000 | ) | |||||||||||||||
Ending balance | $ | 789,773 | $ | 7,294,255 | $ | 715,660 | $ | 403,180 | $ | 194,261 | $ | 1,107,409 | $ | 10,504,538 | |||||||||||||
20
Balance at March 31, 2018 | |||||||||||||||||||||||||||
1-4 family real estate | Commercial real estate | Commercial | Real estate construction | Consumer and other | Unallocated | Total | |||||||||||||||||||||
Allowance for loan losses: | |||||||||||||||||||||||||||
Individually evaluated for impairment | $ | 62,092 | $ | 649,353 | $ | — | $ | — | $ | 21,445 | $ | — | $ | 732,890 | |||||||||||||
Other loans not individually evaluated | 715,192 | 6,962,706 | 864,346 | 549,349 | 165,881 | 1,120,539 | 10,378,013 | ||||||||||||||||||||
Ending balance | $ | 777,284 | $ | 7,612,059 | $ | 864,346 | $ | 549,349 | $ | 187,326 | $ | 1,120,539 | $ | 11,110,903 | |||||||||||||
Loans: | |||||||||||||||||||||||||||
Amounts collectively evaluated for impairment | $ | 243,752,840 | $ | 662,105,021 | $ | 102,724,413 | $ | 91,739,392 | $ | 37,433,945 | $ | 1,137,755,611 | |||||||||||||||
Amounts individually evaluated for impairment | 1,071,029 | 8,851,099 | 90,794 | — | 27,383 | 10,040,305 | |||||||||||||||||||||
Amounts related to loans acquired with deteriorated credit quality | 1,689,546 | 11,195,137 | 3,283,578 | — | — | 16,168,261 | |||||||||||||||||||||
Ending balance | $ | 246,513,415 | $ | 682,151,257 | $ | 106,098,785 | $ | 91,739,392 | $ | 37,461,328 | $ | 1,163,964,177 | |||||||||||||||
Balance at September 30, 2017 | |||||||||||||||||||||||||||
1-4 family real estate | Commercial real estate | Commercial | Real estate construction | Consumer and other | Unallocated | Total | |||||||||||||||||||||
Allowance for loan losses: | |||||||||||||||||||||||||||
Individually evaluated for impairment | $ | 24,434 | $ | 24,299 | $ | — | $ | — | $ | — | $ | — | $ | 48,733 | |||||||||||||
Other loans not individually evaluated | 638,627 | 7,795,779 | 776,551 | 482,665 | 196,037 | 1,140,030 | 11,029,689 | ||||||||||||||||||||
Ending balance | $ | 663,061 | $ | 7,820,078 | $ | 776,551 | $ | 482,665 | $ | 196,037 | $ | 1,140,030 | $ | 11,078,422 | |||||||||||||
Loans: | |||||||||||||||||||||||||||
Amounts collectively evaluated for impairment | $ | 229,359,838 | $ | 679,367,829 | $ | 100,026,551 | $ | 88,791,799 | $ | 39,914,580 | $ | 1,137,460,597 | |||||||||||||||
Amounts individually evaluated for impairment | 955,522 | 5,960,208 | 140,012 | — | 28,806 | 7,084,548 | |||||||||||||||||||||
Amounts related to loans acquired with deteriorated credit quality | 1,724,981 | 11,742,742 | 3,506,884 | — | — | 16,974,607 | |||||||||||||||||||||
Ending balance | $ | 232,040,341 | $ | 697,070,779 | $ | 103,673,447 | $ | 88,791,799 | $ | 39,943,386 | $ | 1,161,519,752 | |||||||||||||||
Included within the above loan amounts are acquired loans, both performing and purchased credit impaired, which are shown net of fair value discounts. The total acquired net loan amounts reflected in the above tables were $299.7 million and $350.5 million at March 31, 2018 and September 30, 2017, respectively. The total remaining fair value discounts related to the acquired loans totaled $2.9 million and $4.1 million at March 31, 2018 and September 30, 2017, respectively.
Note 7: Income Per Share
Basic net income per share for the three and six months ended March 31, 2018 and 2017 was computed by dividing net income to common shareholders by the weighted average number of shares of common stock outstanding, which consists of issued shares less unallocated employee stock ownership plan (“ESOP”) shares and unvested restricted shares.
Diluted net income per share for the three and six months ended March 31, 2018 and 2017 was computed by dividing net income by weighted average shares outstanding plus potential common shares resulting from dilutive stock options and unvested restricted shares, determined using the treasury stock method.
21
Three Months Ended March 31, | Six Months Ended March 31, | ||||||||||||||
2018 | 2017 | 2018 | 2017 | ||||||||||||
Numerator: | |||||||||||||||
Net income | $ | 5,249,509 | $ | 3,316,795 | $ | 9,646,512 | $ | 8,362,462 | |||||||
Denominator: | |||||||||||||||
Weighted average common shares outstanding | 14,521,387 | 14,322,290 | 14,464,281 | 14,264,248 | |||||||||||
Common stock equivalents | 850,440 | 1,018,030 | 828,683 | 1,018,030 | |||||||||||
Diluted shares | 15,371,827 | 15,340,320 | 15,292,964 | 15,282,278 | |||||||||||
Net income per share: | |||||||||||||||
Basic | $ | 0.36 | $ | 0.23 | $ | 0.67 | $ | 0.59 | |||||||
Diluted | $ | 0.34 | $ | 0.22 | $ | 0.63 | $ | 0.55 | |||||||
For the three and six months ended March 31, 2018 there were 733,441 and 713,017 shares, respectively, of dilutive stock options, while there were 802,653 dilutive stock options during the same periods in 2017. Additionally, for the three and six months ended March 31, 2018, there were 116,999 and 115,666 shares, respectively, of dilutive unvested restricted stock, while there were 215,377 shares of dilutive unvested restricted stock for the same periods in 2017. There were no shares which were subject to options issued with exercise prices in excess of the average market value per share during the period ended March 31, 2018 or 2017.
Note 8: Employee Benefits
The Company has a 2002 stock option plan which allows for stock option awards of the Company’s common stock to eligible directors and key employees of the Company. The option price is determined by a committee of the board of directors at the time of the grant and may not be less than 100% of the market value of the common stock on the date of the grant. For options granted under the 2002 stock option plan, when granted, the options vest over periods of up to four or five years from grant date or upon death, disability, or qualified retirement. All options must be exercised within a 10-year period from grant date. The Company may grant either incentive stock options, which qualify for special federal income tax treatment, or non-qualified stock options, which do not receive such tax treatment. The Company’s stockholders have authorized 882,876 shares for the plan, of which 195,273 have been issued or retired upon the exercise of the option granted under the plan, 520,700 are granted and outstanding and no shares are available to be granted at March 31, 2018 within this plan. All share and share amounts related to employee benefits have been updated to reflect the completion of the second-step conversion on April 8, 2013 at a conversion ratio of 1.2471. As of March 31, 2018, 618,783 shares have vested under this plan. During the six months ended March 31, 2018, no options from this plan vested.
In addition to the plan above, on December 19, 2013, the Company's stockholders approved the 2013 Equity Incentive Plan, which allows for stock option awards of the Company’s common stock to eligible directors and key employees of the Company. The option price is determined by a committee of the board of directors at the time of the grant and may not be less than 100% of the market value of the common stock on the date of the grant. When granted, the options vest from one year to five years from grant date or upon death or disability. All options must be exercised within a 10-year period from the grant date. The Company may grant either incentive stock options, which qualify for special federal income tax treatment, or non-qualified stock options, which do not receive such tax treatment. The Company’s stockholders have authorized 1,428,943 shares for the plan, of which 19,182 were issued or retired upon the exercise of the option granted under the plan and 1,016,498 were granted and outstanding as of March 31, 2018, with the remaining 393,263 shares available to be granted at March 31, 2018. During the six months ended March 31, 2018, 194,335 options from this plan vested. As of March 31, 2018, 789,940 shares have vested under this plan.
The fair value of the 20,000 options granted during the six months ended March 31, 2018 was estimated on the date of grant using the Black-Scholes-Merton model with the following assumptions:
20,000 Options | ||||
Risk-free interest rate | 1.90 | % | ||
Dividend yield | 1.76 | % | ||
Expected life at date of grant (months) | 96 months | |||
Volatility | 18.87 | % | ||
Weighted average grant-date fair value | $ | 2.38 | ||
22
The following table summarizes activity for shares under option and weighted average exercise price per share:
Shares | Weighted average exercise price/share | Weighted average remaining life (years) | ||||||
Options outstanding – September 30, 2017 | 1,565,810 | $ | 10.14 | 5 | ||||
Options exercised | (28,612 | ) | 10.67 | 6 | ||||
Options forfeited | (20,000 | ) | 17.02 | 10 | ||||
Options granted | 20,000 | 17.02 | 10 | |||||
Options outstanding – March 31, 2018 | 1,537,198 | $ | 10.13 | 4 | ||||
Options exercisable – March 31, 2018 | 1,267,610 | $ | 9.94 | 4 | ||||
The stock price at March 31, 2018 was greater than the exercise prices on 1,537,198 options outstanding and therefore had an intrinsic value of $15,774,686. The total intrinsic value of all 1,267,610 shares exercisable at March 31, 2018 was $13,250,287.
Stock option expense was $161,013 and $167,640 for the six months ended March 31, 2018 and 2017, respectively. The following table summarizes information about the options outstanding at March 31, 2018:
Number of options outstanding at March 31, 2018 | Remaining contractual life in years | Exercise price per share | |||||||||||||
293,809 | 1 | $ | 8.82 | ||||||||||||
162,372 | 2 | $ | 8.18 | ||||||||||||
56,596 | 3 | $ | 7.22 | ||||||||||||
2,935 | 4 | $ | 7.34 | ||||||||||||
4,988 | 4 | $ | 7.79 | ||||||||||||
962,498 | 6 | $ | 10.89 | ||||||||||||
30,000 | 8 | $ | 12.66 | ||||||||||||
3,000 | 8 | $ | 13.16 | ||||||||||||
18,000 | 8 | $ | 13.31 | ||||||||||||
3,000 | 9 | $ | 13.30 | ||||||||||||
1,537,198 | |||||||||||||||
In addition to the above, the Company implemented the Charter Financial Corporation 2013 Equity Incentive Plan as described above, which has 571,577 shares authorized, and the Company has granted 374,092 shares of restricted stock to key employees and directors, including 22,500 during the current year. During the six months ended March 31, 2018, 73,315 shares vested and 15,000 shares were canceled. The remaining 197,485 shares are available to be granted at March 31, 2018.
Shares | Weighted average grant date fair value per award | |||||
Unvested restricted stock awards - September 30, 2017 | 150,547 | $ | 11.20 | |||
Granted | 22,500 | 17.48 | ||||
Vested | 73,315 | 11.02 | ||||
Canceled or expired | 15,000 | 17.02 | ||||
Unvested restricted stock awards – March 31, 2018 | 84,732 | $ | 11.99 | |||
Note 9: Commitments and Contingent Liabilities
In the normal course of business, the Company makes various commitments and incurs certain contingent liabilities, which are not reflected in the accompanying financial statements. The commitments and contingent liabilities include guarantees, commitments to extend credit, and standby letters of credit. At March 31, 2018, commitments to extend credit and standby letters of credit totaled $252.8 million. The Company does not anticipate any material losses as a result of these transactions.
23
In the normal course of business, the Company is party (both as plaintiff and defendant) to certain matters of litigation. In the opinion of management, none of these matters should have a material adverse effect on the Company’s financial position or results of operation.
Note 10: Fair Value of Financial Instruments and Fair Value Measurement
Accounting standards define fair value as the exchange price that would be received for an asset or paid to transfer a liability in the principal or most advantageous market for the asset or liability in an orderly transaction between market participants on the measurement date. Accounting standards also establish a fair value hierarchy which requires an entity to maximize the use of observable inputs and minimize the use of unobservable inputs when measuring fair value. The applicable standard describes three levels of inputs that may be used to measure fair value: Level 1- Quoted prices (unadjusted) for identical assets or liabilities in active markets that the entity has the ability to access as of the measurement date; Level 2- Significant other observable inputs other than Level 1 prices, such as quoted prices for similar assets or liabilities, quoted prices in markets that are not active, and other inputs that are observable or can be corroborated by observable market data; Level 3- Significant unobservable inputs that reflect a company’s own assumptions about the assumptions that market participants would use in pricing an asset or liability. The Company evaluates fair value measurement inputs on an ongoing basis in order to determine if there is a change of sufficient significance to warrant a transfer between levels. For example, changes in market activity or the addition of new unobservable inputs could, in the Company’s judgment, cause a transfer to either a higher or lower level. For the three and six months ended March 31, 2018, there were no transfers between levels.
All of the Company’s available for sale securities fall into Level 2 of the fair value hierarchy. These securities are priced via independent service providers. In obtaining such valuation information, the Company has evaluated the valuation methodologies used to develop the fair values.
At March 31, 2018, the Company holds, as part of its investment portfolio, available for sale securities reported at fair value consisting of state and municipal securities, collateralized loan obligations (“CLO”), mortgage-backed securities and collateralized mortgage obligations. The fair value of the majority of these securities is determined using widely accepted valuation techniques including matrix pricing and broker-quote based applications. Inputs include benchmark yields, reported trades, issuer spreads, prepayment speeds and other relevant items. These are inputs used by a third-party pricing service used by the Company. To validate the appropriateness of the valuations provided by the third party, the Company regularly updates its understanding of the inputs used and compares valuations to an additional third party source.
The Company also holds assets available for sale reported at fair value and included in other assets on the Company's balance sheet, consisting of one former branch and a parcel of land adjacent to a current branch. These assets are included in other assets on the Company's condensed consolidated statements of financial condition. The fair value of these assets is determined using current appraisals adjusted at management’s discretion to reflect any decline in the fair value of the properties since the time the appraisal was performed. Appraisal values are reviewed and monitored internally and fair value is reassessed at least quarterly or more frequently when circumstances occur that indicate a change in fair value. All of the Company’s assets held for sale fall into level 3 of the fair value hierarchy.
24
Assets and Liabilities Measured on a Recurring Basis:
Assets and liabilities measured at fair value on a recurring basis are summarized below.
March 31, 2018 | |||||||||||||||
Estimated Fair Value | Quoted Prices in Active Markets (Level 1) | Significant Other Observable Inputs (Level 2) | Significant Unobservable Inputs (Level 3) | ||||||||||||
Assets: | |||||||||||||||
Investment securities available for sale: | |||||||||||||||
State and municipal securities | $ | 1,566,380 | $ | — | $ | 1,566,380 | $ | — | |||||||
Collateralized loan obligations | 43,833,992 | — | 43,833,992 | — | |||||||||||
Mortgage-backed securities: | |||||||||||||||
FHLMC certificates | 18,916,255 | — | 18,916,255 | — | |||||||||||
FNMA certificates | 106,281,276 | — | 106,281,276 | — | |||||||||||
GNMA certificates | 1,000,330 | — | 1,000,330 | — | |||||||||||
Private-label mortgage securities: | |||||||||||||||
Investment grade | 836,224 | — | 836,224 | — | |||||||||||
Split rating (1) | 1,497,252 | — | 1,497,252 | — | |||||||||||
Non-investment grade | 604,599 | — | 604,599 | — | |||||||||||
Total investment securities available for sale | 174,536,308 | — | 174,536,308 | — | |||||||||||
Mortgage servicing rights | 1,475,676 | — | 1,475,676 | — | |||||||||||
Assets held for sale | 112,300 | — | — | 112,300 | |||||||||||
Total recurring assets at fair value | $ | 176,124,284 | $ | — | $ | 176,011,984 | $ | 112,300 | |||||||
__________________________________
(1) | Bonds with split ratings represent securities with both investment and non-investment grades. |
September 30, 2017 | |||||||||||||||
Estimated Fair Value | Quoted Prices in Active Markets (Level 1) | Significant Other Observable Inputs (Level 2) | Significant Unobservable Inputs (Level 3) | ||||||||||||
Assets: | |||||||||||||||
Investment securities available for sale: | |||||||||||||||
State and municipal securities | $ | 2,251,815 | $ | — | $ | 2,251,815 | $ | — | |||||||
Collateralized loan obligations | 40,677,676 | — | 40,677,676 | — | |||||||||||
Mortgage–backed securities: | |||||||||||||||
FHLMC certificates | 21,755,122 | — | 21,755,122 | — | |||||||||||
FNMA certificates | 112,990,819 | — | 112,990,819 | — | |||||||||||
GNMA certificates | 2,506,063 | — | 2,506,063 | — | |||||||||||
Private-label mortgage securities: | |||||||||||||||
Investment grade | 591,443 | — | 591,443 | — | |||||||||||
Split rating (1) | 2,249,670 | — | 2,249,670 | — | |||||||||||
Non-investment grade | 767,213 | — | 767,213 | — | |||||||||||
Total investment securities available for sale | 183,789,821 | — | 183,789,821 | — | |||||||||||
Mortgage servicing rights | 1,319,725 | — | 1,319,725 | — | |||||||||||
Assets held for sale | 752,300 | — | — | 752,300 | |||||||||||
Total recurring assets at fair value | $ | 185,861,846 | $ | — | $ | 185,109,546 | $ | 752,300 | |||||||
__________________________________
(1) | Bonds with split ratings represent securities with both investment and non-investment grades. |
25
When a determination is made to classify a financial instrument within Level 3 of the valuation hierarchy, the determination is based upon the significance of the unobservable factors to the overall fair value measurement. However, since Level 3 financial instruments typically include, in addition to the unobservable or Level 3 components, observable components (that is, components that are actively quoted and can be validated to external sources), the losses below include changes in fair value due in part to observable factors that are part of the valuation methodology.
A reconciliation of the beginning and ending balances of Level 3 assets and liabilities recorded at fair value on a recurring basis is as follows:
Six Months Ended March 31, 2018 | Six Months Ended March 31, 2017 | ||||||
Fair value, beginning balance | $ | 752,300 | $ | 975,300 | |||
Sales | (640,000 | ) | (263,000 | ) | |||
Valuation loss recognized in noninterest expense | — | — | |||||
Fair value, ending balance | $ | 112,300 | $ | 712,300 | |||
Assets and Liabilities Measured on a Nonrecurring Basis:
Assets and liabilities measured at fair value on a nonrecurring basis are summarized below.
Fair Value Measurements Using: | |||||||||||||||
Estimated Fair Value | Quoted Prices in Active Markets (Level 1) | Significant Other Observable Inputs (Level 2) | Significant Unobservable Inputs (Level 3) | ||||||||||||
March 31, 2018 | |||||||||||||||
Impaired loans | $ | 1,652,887 | $ | — | $ | — | $ | 1,652,887 | |||||||
Other real estate owned | 302,736 | — | — | 302,736 | |||||||||||
September 30, 2017 | |||||||||||||||
Impaired loans | $ | 2,326,132 | $ | — | $ | — | $ | 2,326,132 | |||||||
Other real estate owned | 1,437,345 | — | — | 1,437,345 | |||||||||||
Loans considered impaired are loans for which, based on current information and events, it is probable that the creditor will be unable to collect all amounts due according to the contractual terms of the loan agreement. Impaired loans are subject to nonrecurring fair value adjustments to reflect write-downs that are based on the market price or current appraised value of the collateral, adjusted to reflect local market conditions or other economic factors. After evaluating the underlying collateral, the fair value of the impaired loans is determined by allocating specific reserves from the allowance for loan and lease losses to the loans. Thus, the fair value reflects the loan balance as adjusted by partial chargedowns less the specifically allocated reserve. Certain collateral-dependent impaired loans are reported at the fair value of the underlying collateral. Impairment is measured based on the fair value of the collateral, which is typically derived from appraisals that take into consideration prices in observed transactions involving similar assets and similar locations. Each appraisal is updated on an annual basis, either through a new appraisal or through the Company’s comprehensive internal review process. Appraised values are reviewed and monitored internally and fair value is re-assessed at least quarterly or more frequently when circumstances occur that indicate a change in fair value. The fair value of impaired loans that are not collateral dependent is measured using a discounted cash flow analysis considered to be a Level 3 input.
OREO is initially accounted for at fair value, less estimated costs to dispose of the property. Any excess of the recorded investment over fair value, less costs to dispose, is charged to the allowance for loan and lease losses at the time of foreclosure. A provision is charged to earnings for subsequent losses on OREO when market conditions indicate such losses have occurred. The ability of the Company to recover the carrying value of OREO is based upon future sales of the real estate. The ability to effect such sales is subject to market conditions and other factors beyond the Company's control, and future declines in the value of the real estate would result in a charge to earnings. The recognition of sales and gain on sales is dependent upon whether the nature and terms of the sales, including possible future involvement of the Company, if any, meet certain defined requirements. If those requirements are not met, sale and gain recognition is deferred. OREO represents real property taken by the Company either through foreclosure or through a deed in lieu thereof from the borrower. The fair value of OREO is based on property appraisals adjusted at management’s discretion to reflect a further decline in the fair value of properties since the time the appraisal analysis was performed. It has been the Company’s experience that appraisals may become outdated due to the volatile real-estate environment. Appraised values are reviewed and monitored internally and fair value is re-assessed at least quarterly or more frequently when circumstances occur that indicate a change in fair value. Therefore, the inputs used to determine the fair value of OREO and repossessed assets fall
26
within Level 3. The Company may include within OREO other repossessed assets received as partial satisfaction of a loan. These assets are not material and do not typically have readily determinable market values and are considered Level 3 inputs.
The following table provides information describing the valuation processes used to determine recurring and nonrecurring fair value measurements categorized within Level 3 of the fair value hierarchy at March 31, 2018:
Quantitative Information about Level 3 Fair Value Measurements | |||||||||||||||
Fair Value | Valuation Technique | Unobservable Input | General Range (Discount) | Weighted Average Discount | |||||||||||
Impaired Loans | $ | 1,652,887 | Property appraisals | Management discount for property type and recent market volatility | 20% | — | 80% | 38% | |||||||
OREO | $ | 302,736 | Property appraisals | Management discount for property type and recent market volatility | 9% | — | 29% | 14% | |||||||
Assets Held for Sale | $ | 112,300 | Valuation analysis | Management discount for property type and recent market volatility | 0% | — | 53% | 30% | |||||||
Included in the Company's portfolio of other real estate owned is approximately $303,000 and $224,000 of foreclosed residential real estate property at March 31, 2018 and September 30, 2017, respectively. The Company had no consumer mortgage loans collateralized by residential real estate in the process of foreclosure at March 31, 2018, while $195,000 in consumer mortgage loans collateralized by residential real estate were in the process of foreclosure at September 30, 2017.
Accounting standards require disclosures of fair value information about financial instruments, whether or not recognized in the Statement of Condition, for which it is practicable to estimate that value. In cases where quoted market prices are not available, fair value is based on estimates using present value or other valuation techniques. Those techniques are significantly affected by the assumptions used, including the discount rate and estimates of future cash flows. In that regard, the derived fair value estimates cannot be substantiated by comparison to independent markets and, in many cases, could not be realized in immediate settlement of the instrument. The use of different market assumptions and/or estimation methodologies may have a material effect on the estimated fair value amounts. Also, the fair value estimates presented herein are based on pertinent information available to management as of March 31, 2018 and September 30, 2017.
The following methods and assumptions were used by the Company in estimating its fair value disclosures for financial instruments:
CASH AND CASH EQUIVALENTS – The carrying amount approximates fair value because of the short maturity of these instruments.
CERTIFICATES OF DEPOSIT HELD AT OTHER FINANCIAL INSTITUTIONS – The fair value of certificates of deposit held at other financial institutions is based on the discounted value of contractual cash flows. The discount rate is estimated using the rates currently offered for deposits of similar remaining maturities.
INVESTMENTS AVAILABLE FOR SALE, FHLB STOCK, AND RESTRICTED SECURITIES – The fair value of investment and mortgage-backed securities and collateralized mortgage obligations available for sale is estimated based on bid quotations received from securities dealers. The FHLB stock and restricted securities are considered restricted stock and are carried at cost which approximates their fair value.
LOANS RECEIVABLE – Fair values are estimated for portfolios of loans with similar financial characteristics. Loans are segregated by type. The fair value of performing loans is calculated by discounting scheduled cash flows through the estimated maturity using estimated market discount rates that reflect the credit risk inherent in the loan. The estimate of maturity is based on the Company’s historical experience with repayments for each loan classification, modified, as required, by an estimate of the effect of the current economic and lending conditions.
Fair value for significant nonperforming loans is based on recent external appraisals. If appraisals are not available, estimated cash flows are discounted using a rate commensurate with the risk associated with the estimated cash flows. Assumptions regarding credit risk, cash flows, and discount rates are determined using available market information and specific borrower information.
LOANS HELD FOR SALE – Loans held for sale are carried at the lower of cost or market value. The fair values of loans held for sale are based on commitments on hand from investors within the secondary market for loans with similar characteristics.
MORTGAGE SERVICING RIGHTS – The Company has the rights to service a portfolio of Fannie Mae ("FNMA") and other government guaranteed loans sold on a servicing retained basis. Servicing rights are measured at fair value when the loan is sold
27
and subsequently measured at fair value on a recurring basis utilizing Level 2 inputs. Management uses a model operated and maintained by a third party to calculate the present value of future cash flows using the third party's market-based assumptions. The future cash flows for each asset are based on the asset's unique characteristics and the third party's market-based assumptions for prepayment speeds, default and voluntary prepayments. Adjustments to fair value are recorded as a component of "Gain on sale of loans" in the consolidated statements of income.
ASSETS HELD FOR SALE – The fair value of assets held for sale by the Company is generally based on the most recent appraisals of the asset or other market information as it becomes available to management.
DEPOSITS – The fair value of deposits with no stated maturity, such as noninterest-bearing demand deposits, savings, money market and checking accounts, is equal to the amount payable on demand. The fair value of time deposits is based on the discounted value of contractual cash flows. The discount rate is estimated using the rates currently offered for deposits of similar remaining maturities.
BORROWINGS – The fair value of the Company’s FHLB advances is estimated based on the discounted value of contractual cash flows. The fair value of securities sold under agreements to repurchase approximates the carrying amount because of the short maturity of these borrowings. The discount rate is estimated using rates quoted for the same or similar issues or the current rates offered to the Company for debt of the same remaining maturities.
FLOATING RATE JUNIOR SUBORDINATED DEBT - The fair value of the Company's floating rate junior subordinated debt is based primarily upon discounted cash flows using rates for securities with similar terms and remaining maturities.
ACCRUED INTEREST AND DIVIDENDS RECEIVABLE AND PAYABLE – The carrying amount of accrued interest and dividends receivable on loans and investments and payable on borrowings and deposits approximate their fair values.
COMMITMENTS TO EXTEND CREDIT AND STANDBY LETTERS OF CREDIT – The value of these unrecognized financial instruments is estimated based on the fee income associated with the commitments which, in the absence of credit exposure, is considered to approximate their settlement value. Since no significant credit exposure existed, and because such fee income is not material to the Company's financial statements at March 31, 2018 and at September 30, 2017, the fair value of these commitments is not presented.
Many of the Company's assets and liabilities are short-term financial instruments whose carrying amounts reported in the Statement of Condition approximate fair value. These items include cash and due from banks, interest-bearing bank balances, federal funds sold, other short-term borrowings and accrued interest receivable and payable balances. The estimated fair value of the Company’s remaining on-balance sheet financial instruments as of March 31, 2018 and September 30, 2017 is summarized below:
28
March 31, 2018 | |||||||||||||||||||
Estimated Fair Value | |||||||||||||||||||
Carrying Value | Total Estimated Fair Value | Quoted Prices in Active Markets (Level 1) | Significant Other Observable Inputs (Level 2) | Significant Unobservable Inputs (Level 3) | |||||||||||||||
Financial assets: | |||||||||||||||||||
Cash and cash equivalents | $ | 179,401,216 | $ | 179,401,216 | $ | 179,401,216 | $ | — | $ | — | |||||||||
Certificates of deposit held at other financial institutions | 5,027,920 | 5,027,920 | — | 5,027,920 | — | ||||||||||||||
Investments available for sale | 174,536,308 | 174,536,308 | — | 174,536,308 | — | ||||||||||||||
FHLB stock | 4,075,200 | 4,075,200 | — | 4,075,200 | — | ||||||||||||||
Restricted securities, at cost | 279,000 | 279,000 | — | 279,000 | — | ||||||||||||||
Loans receivable, net | 1,151,885,465 | 1,141,319,923 | — | — | 1,141,319,923 | ||||||||||||||
Loans held for sale | 2,895,620 | 2,934,511 | — | 2,934,511 | — | ||||||||||||||
Mortgage servicing rights | 1,475,676 | 1,475,676 | — | 1,475,676 | — | ||||||||||||||
Assets held for sale | 112,300 | 112,300 | — | — | 112,300 | ||||||||||||||
Accrued interest and dividends receivable | 4,321,617 | 4,321,617 | — | 635,971 | 3,685,646 | ||||||||||||||
Financial liabilities: | |||||||||||||||||||
Deposits | $ | 1,349,260,830 | $ | 1,351,726,939 | $ | — | $ | 1,351,726,939 | $ | — | |||||||||
FHLB advances | 60,015,100 | 59,508,749 | — | 59,508,749 | — | ||||||||||||||
Floating rate junior subordinated debt | 6,793,195 | 6,793,195 | — | 6,793,195 | — | ||||||||||||||
Accrued interest payable | 488,369 | 488,369 | — | 488,369 | — | ||||||||||||||
29
September 30, 2017 | |||||||||||||||||||
Estimated Fair Value | |||||||||||||||||||
Carrying Value | Total Estimated Fair Value | Quoted Prices in Active Markets (Level 1) | Significant Other Observable Inputs (Level 2) | Significant Unobservable Inputs (Level 3) | |||||||||||||||
Financial assets: | |||||||||||||||||||
Cash and cash equivalents | $ | 152,338,389 | $ | 152,338,389 | $ | 152,338,389 | $ | — | $ | — | |||||||||
Certificates of deposit held at other financial institutions | 7,514,630 | 7,514,630 | — | 7,514,630 | — | ||||||||||||||
Investments available for sale | 183,789,821 | 183,789,821 | — | 183,789,821 | — | ||||||||||||||
FHLB stock | 4,054,400 | 4,054,400 | — | 4,054,400 | — | ||||||||||||||
Restricted securities, at cost | 279,000 | 279,000 | — | 279,000 | — | ||||||||||||||
Loans receivable, net | 1,149,276,182 | 1,146,902,727 | — | — | 1,146,902,727 | ||||||||||||||
Loans held for sale | 1,961,185 | 1,998,988 | — | 1,998,988 | — | ||||||||||||||
Mortgage servicing rights | 1,319,725 | 1,319,725 | — | 1,319,725 | — | ||||||||||||||
Assets held for sale | 752,300 | 752,300 | — | — | 752,300 | ||||||||||||||
Accrued interest and dividends receivable | 4,197,708 | 4,197,708 | — | 661,335 | 3,536,373 | ||||||||||||||
Financial liabilities: | |||||||||||||||||||
Deposits | $ | 1,339,143,287 | $ | 1,342,831,689 | $ | — | $ | 1,342,831,689 | $ | — | |||||||||
FHLB advances | 60,023,100 | 61,073,866 | — | 61,073,866 | — | ||||||||||||||
Floating rate junior subordinated debt | 6,724,646 | 6,724,646 | — | 6,724,646 | — | ||||||||||||||
Accrued interest payable | 704,630 | 704,630 | — | 704,630 | — | ||||||||||||||
Note 11: Income Taxes
On December 22, 2017, the United States Government enacted the Tax Act. The Tax Act amends the Internal Revenue Code of 1986 to reduce tax rates and modify policies, credits, and deductions for individuals and businesses. For businesses, the Tax Act reduces the corporate federal tax rate from a maximum of 35% to a flat 21% rate. The corporate tax rate reduction was effective January 1, 2018. Because the Company operates with a fiscal year end of September 30, the reduced tax rate will result in the application of a blended federal statutory tax rate of 24.5% for its fiscal year 2018 and then a flat 21% thereafter.
Under GAAP, the Company uses the asset and liability method of accounting for income taxes. Under this method, deferred tax assets and liabilities are recognized for the future tax consequences attributable to differences between the financial statement carrying amounts of existing assets and liabilities and their respective tax bases. Deferred tax assets and liabilities are measured using enacted tax rates expected to apply to taxable income in the years in which those temporary differences are expected to be recovered or settled. At September 30, 2017, the Company's deferred tax assets and liabilities, which netted to a total $6.0 million deferred tax asset, were determined based on the then-current enacted federal tax rate of 35%. As a result of the reduction in the corporate income tax rate under the Tax Act, the Company revalued its deferred tax assets and liabilities at March 31, 2018. Deferred tax assets and liabilities expected to be realized in fiscal year 2018 were re-measured using the aforementioned blended rate. All remaining deferred tax assets and liabilities were remeasured using the new statutory federal rate of 21%. These re-measurements collectively resulted in a discrete tax expense of $49,000 and $1.5 million that was recognized during the three and six months ended March 31, 2018, respectively. The Company's revaluation of its deferred tax assets and liabilities is subject to further clarification of the Tax Act and refinement of its estimates. As a result, the actual impact on the deferred tax assets and liabilities and income tax expense due to the Tax Act may vary from the amounts currently estimated.
During the six months ended March 31, 2018, the Company also reclassified $1.4 million of its former deferred tax asset to its current tax receivable, reported as part of Other assets in the Company's balance sheet, due to a change in recognition method.
30
The Company's estimated deferred tax assets and liabilities at March 31, 2018 and actual deferred tax assets and liabilities at September 30, 2017 are presented below:
March 31, 2018 | September 30, 2017 | |||||||
Gross deferred tax assets | $ | 6,647,578 | $ | 9,709,150 | ||||
Gross deferred tax liabilities | 2,876,121 | 3,738,868 | ||||||
Net deferred tax assets | $ | 3,771,457 | $ | 5,970,282 | ||||
The Company's effective tax rate was 27.73% and 36.08% for the three and six months ended March 31, 2018, respectively, and is estimated to be 31.47% for the full fiscal year 2018.
Taxes on income and the related impact on the Company's effective income tax rate for the six months ended March 31, 2018 are shown below:
Amount | Percentage of Income Before Taxes | ||||||
Tax expense before one-time charges | $ | 3,979,550 | 26.37 | % | |||
Revaluation of net deferred tax asset | 1,464,955 | 9.71 | |||||
Total | $ | 5,444,505 | 36.08 | % | |||
Note 12: Subsequent Events
On April 24, 2018, the Company and CenterState Bank Corporation, a Florida corporation ("CenterState"), entered into an Agreement and Plan of Merger (the "Merger Agreement") whereby the Company will be merged with and into CenterState (the "Merger"). Pursuant to and simultaneously with entering into the Merger Agreement, CharterBank and CenterState's wholly owned subsidiary bank, CenterState Bank, N.A. ("CenterState Bank"), entered into a Plan of Merger and Merger Agreement whereby CharterBank will be merged with and into CenterState Bank immediately following the Merger (the "Bank Merger").
Pursuant to the Merger Agreement, each outstanding share of Charter common stock issued and outstanding immediately prior to the effective time of the Merger will be entitled to receive 0.738 shares of CenterState common stock and a cash amount equal to $2.30, provided that cash in lieu of any fractional shares of CenterState common stock will be paid. Each outstanding share of CenterState stock shall remain outstanding and unaffected by the Merger. Each option to purchase shares of Charter common stock will be converted into the right to receive a cash payment equal to the product (i) of the number of shares of Charter common stock underlying such option and (ii) $23.00 minus the exercise price per share under such option. Immediately prior to the effective time of the Merger, all shares of Charter restricted stock shall vest in full and shall be treated like all other issued and outstanding shares of Charter common stock. As of the announcement date on April 24, 2018, based on CenterState's closing stock price of $27.72, the total merger consideration amounted to $360.1 million, or approximately $22.76 per share.
The Merger Agreement has been unanimously approved by the boards of directors of the Company and CenterState, and is expected to close in the fourth quarter of 2018 subject to customary conditions, including receipt of all applicable regulatory approvals and the approval of the stockholders of the Company.
Item 2. Management’s Discussion and Analysis of Financial Condition and Results of Operations
Management’s discussion and analysis of the financial condition and results of operations at and for the three and six months ended March 31, 2018 and 2017 is intended to assist in understanding the financial condition and results of operations of the Company. The information contained in this section should be read in conjunction with the unaudited condensed consolidated financial statements and the notes thereto, appearing in Part I, Item 1 of this quarterly report on Form 10-Q.
Forward-Looking Statements
This report contains forward-looking statements that are based on assumptions and may describe future plans, strategies and expectations of the Company. These forward-looking statements are generally identified by use of the words “believe,” “expect,” “intend,” “anticipate,” “estimate,” “project,” “strategy,” “future,” “opportunity,” “plan,” “may,” “should,” “will,” “would,” “will be,” “will continue,” “will likely result,” “potential, ” “seek,” or similar expressions. The Company’s ability to predict results or the actual effect of future plans or strategies is inherently uncertain. Factors which could have a material adverse effect on the
31
operations of the Company include, but are not limited to, business disruption as a result of the Company's pending merger with CenterState; diversion of management's time on issues relating to the Merger; the failure to complete the Merger with CenterState on a timely basis or at all; fluctuations in CenterState's stock price prior to the completion of the Merger; the reaction of our customers and employees to the Merger; general economic conditions, either nationally or in our market areas, that are worse than expected; competition among depository and other financial institutions; changes in the interest rate environment that reduce our margins or reduce the fair value of financial instruments; adverse changes in the securities markets; changes in laws or government regulations or policies affecting financial institutions, including changes in regulatory fees and capital requirements; our ability to enter new markets successfully and capitalize on growth opportunities, including identifying suitable acquisition opportunities; the adverse effect of a breach of our computer system; our ability to successfully integrate acquired entities; changes in consumer spending, borrowing and savings habits; changes in accounting policies and practices, as may be adopted by the bank regulatory agencies and the Financial Accounting Standards Board; and changes in our organization, compensation and benefit plans. Additional factors are discussed in the Company’s Annual Report on Form 10-K for the year ended September 30, 2017 under Part I Item 1A. “Risk Factors,” and in the Company’s other filings with the Securities and Exchange Commission. These risks and uncertainties should be considered in evaluating forward-looking statements and undue reliance should not be placed on such statements. Except as required by applicable law or regulation, the Company does not undertake, and specifically disclaims any obligation, to release publicly the result of any revisions that may be made to any forward-looking statements to reflect events or circumstances after the date of the statements or to reflect the occurrence of anticipated or unanticipated events.
Overview
Our results of operations depend primarily on our net interest income. Net interest income is the difference between the interest income we earn on our interest-earning assets, consisting primarily of loans, investment securities, mortgage-backed securities, collateralized mortgage obligations and other interest-earning assets (primarily cash and cash equivalents), and the interest we pay on our interest-bearing liabilities, consisting primarily of deposits and FHLB advances.
Our principal business consists of attracting deposits from the general public and investing those funds primarily in loans. We make commercial real estate loans, loans secured by first mortgages on owner-occupied, one- to four-family residences, consumer loans, loans secured by first mortgages on non-owner-occupied one- to four-family residences, construction loans secured by one- to four-family residences, commercial business loans and multi-family real estate loans. While our primary business is the origination of loans funded through retail deposits, we also invest in certain investment securities and mortgage-backed securities, and use FHLB advances and other borrowings as additional funding sources or for contingency funding.
The Company is significantly affected by prevailing general and local economic conditions, particularly market interest rates, and by government policies concerning, among other things, monetary and fiscal affairs and the federal regulation of financial institutions. Following the November 2016 presidential election, small business and investor optimism have risen considerably, though the long term impact of the new administration's policies remains to be determined. Deposit balances are influenced by a number of factors, including interest rates paid on competing personal investment products, the level of personal income, and the personal rate of savings within our market areas. Lending activities are influenced by the demand for housing and other loans, changing loan underwriting guidelines, as well as interest rate pricing competition from other lending institutions. The primary sources of funds for lending activities include deposits, loan repayments, investment income, borrowings, and funds provided from operations.
On a weekly basis, management reviews deposit flows, loan demand, cash levels, and changes in several market rates to assess all pricing strategies. Generally, deposit pricing is based upon a survey of competitors in the Bank’s market areas, and the need to attract funding and retain maturing deposits.
The Company's stockholder value strategy focuses on creating earnings and stockholder value through increasing capital leverage, operating leverage, and expanding into more dynamic markets. In recent years, through acquisitions and strategic de novo branching, the Company has expanded further into Metro Atlanta, as well as into Florida.
32
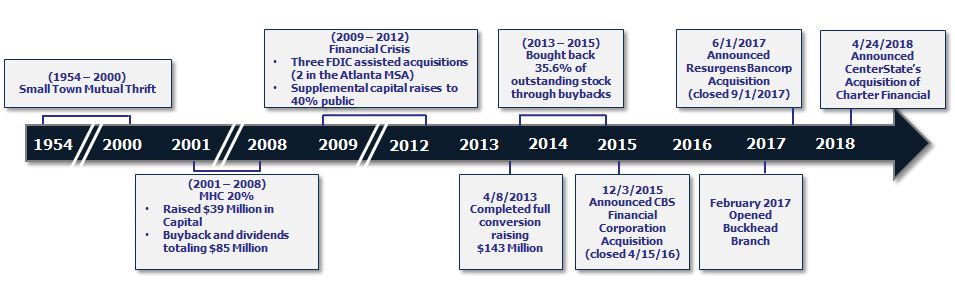
Net income was $5.2 million, or $0.36 and $0.34 per basic and diluted share, respectively, and $9.6 million, or $0.67 and $0.63 per basic and diluted share, for the three and six months ended March 31, 2018, respectively, compared to $3.3 million, or $0.23 and $0.22 per basic and diluted share, and $8.4 million, or $0.59 and $0.55 per basic and diluted share, for the three and six months ended March 31, 2017, respectively.
Proposed Merger with CenterState Bank Corporation
On April 24, 2018, the Company announced it had entered into a Merger Agreement with CenterState, whereby the Company will be merged with and into CenterState, immediately followed by the merger of CharterBank with and into CenterState Bank.
Pursuant to the Merger Agreement, each outstanding share of Charter common stock issued and outstanding immediately prior to the effective time of the Merger will be entitled to receive 0.738 shares of CenterState common stock and a cash amount equal to $2.30, provided that cash in lieu of any fractional shares of CenterState common stock will be paid. Each outstanding share of CenterState stock shall remain outstanding and unaffected by the Merger. Each option to purchase shares of Charter common stock will be converted into the right to receive a cash payment equal to the product of (i) the number of shares of Charter common stock underlying such option and (ii) $23.00 minus the exercise price per share under such option. Immediately prior to the effective time of the Merger, all shares of Charter restricted stock shall vest in full and shall be treated like all other issued and outstanding shares of Charter common stock. As of the announcement date on April 24, 2018, based on CenterState's closing stock price of $27.72, the total merger consideration amounted to $360.1 million, or approximately $22.76 per share.
The Merger Agreement has been unanimously approved by the boards of directors of the Company and CenterState, and is expected to close in the fourth quarter of 2018 subject to customary conditions, including receipt of all applicable regulatory approvals and the approval of the stockholders of the Company.
The foregoing description of the Merger Agreement does not purport to be complete and is qualified in its entirety by reference to the full text of the Merger Agreement, which is attached as Exhibit 2.3 to this quarterly report on Form 10-Q.
Atlanta Metro Expansion
On September 1, 2017, the Company took its next step in its Atlanta Metro expansion strategy by completing its acquisition of Resurgens Bancorp ("Resurgens"), the parent company of Resurgens Bank. Resurgens operated two branches in Tucker and Decatur, Georgia, inside the I-285 loop, a key expansion target for the Company. The acquisition added $177.5 million of total assets, including $128.8 million of net loans, and $151.7 million of liabilities, including $138.0 million of total deposits, to the Company's balance sheet.
The Resurgens transaction complemented the Company's prior moves into the market area, including the 2007 Norcross loan processing office opening, the 2009 and 2010 FDIC-assisted acquisitions of Neighborhood Community Bank ("NCB") and McIntosh Commercial Bank ("MCB"), the April 2016 CBS Financial Corporation ("CBS") acquisition and the January 2017 Buckhead branch opening. The Resurgens acquisition was the seventh we have completed since 1999, and the fifth since 2009. Metro Atlanta now accounts for 57% of our loans and 51% of our deposits. This mix should provide further opportunities for growth and expansion throughout the demographically desirable Metro Atlanta market.
Leveraging its capital and operational structure through strategic acquisitions has been a cornerstone of the Company's growth strategy, especially since its stock conversion completed in April 2013. As shown in the graph below, the flexibility brought on by that capital infusion has allowed the Company to transition from a traditional thrift balance sheet with a stock driven largely by book value to a bank-like balance sheet with a stock driven largely by earnings as the Company has expanded its footprint to several thriving, new markets.
33
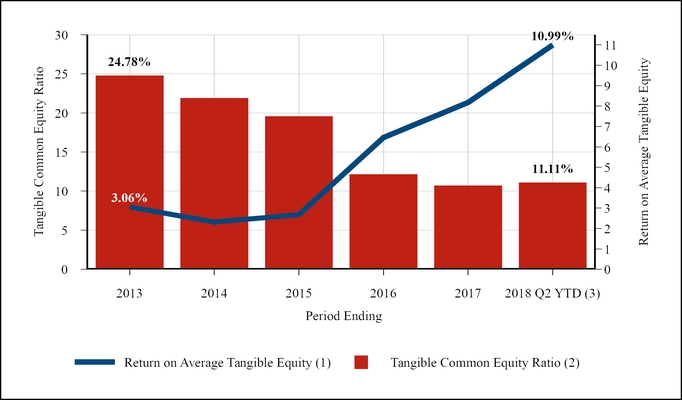
__________________________________
(1) | Non-GAAP financial measure, defined as net income divided by average total equity less the average balance of intangible assets. See Non-GAAP Financial Measures for further information. |
(2) | Non-GAAP financial measure, defined as total assets less intangible assets divided by total equity less intangible assets. See Non-GAAP Financial Measures for further information. |
(3) | Annualized.. |
Tax Cuts and Jobs Act
On December 22, 2017, President Donald Trump signed into law the Tax Act. Under the Tax Act, federal corporate tax rates were cut to 21% from 35%. The Company's net deferred tax assets, which totaled $6.0 million at September 30, 2017, were calculated using the previous statutory rate of 35%. Because of the change, the Company revalued the net deferred tax asset and recorded an estimated expense of $1.5 million, or approximately $0.10 per basic and diluted share, respectively, as an addition to income tax expense during the six months ended March 31, 2018. The Company is utilizing the measurement period approach, including estimating deferral amounts that will be realized during fiscal 2018 at the blended 24.5% statutory rate, to revalue its deferred tax asset, so the amount may change prior to fiscal year end at September 30, 2018.
In spite of the one-time charge, the Company expects to realize significant savings as a result of the tax rate changes from the Tax Act. Management's calculations estimate that the new rate would have reduced the Company's income tax expense $3.0 million during the previous fiscal year under full implementation of the 21% rate. Due to the Company's fiscal year, our income taxes will be calculated at a blended 24.5% federal statutory rate for the current fiscal year and 21% for future fiscal years. The new, blended tax rate is expected to reduce income tax expense by approximately $2.5 million as compared to the prior rate during the current year, with greater reductions in future years when the new rate is fully implemented. The rate change reduced expense $1.5 million, or $0.10 per basic and diluted share, in regular tax accruals during the six months ended March 31, 2018.
Critical Accounting Policies
Critical accounting policies are those that involve significant judgments and assessments by management, and which could potentially result in materially different results under different assumptions and conditions. As discussed in the Company’s Annual Report on Form 10-K for the fiscal year ended September 30, 2017, the Company considers its critical accounting policies to be the allowance for loan losses, business combinations, other-than-temporary impairment of investment securities, real estate owned, goodwill and other intangible assets, deferred income taxes, and estimation of fair value. There have been no material changes in our critical accounting policies during the six months ended March 31, 2018.
34
Comparison of Financial Condition at March 31, 2018 and September 30, 2017
Assets. Total assets increased $13.8 million from September 30, 2017 to $1.7 billion at March 31, 2018. This increase in assets was due primarily to increases in deposits and paydowns on investment securities available for sale and the resulting increase in cash. Net loans increased $2.6 million, or 0.2%, to $1.2 billion at March 31, 2018.
Cash and cash equivalents. Cash and cash equivalents increased $27.1 million to $179.4 million at March 31, 2018, up from $152.3 million at September 30, 2017. This increase was primarily due to a $10.1 million increase in deposits and a combined $21.3 million in principal collections, sales and calls of investment securities available for sale, partially offset by outlays of cash of $14.9 million to purchase investment securities available for sale as well as our increased loan balances.
Loans. At March 31, 2018, net loans were $1.2 billion, or 69.6% of total assets. The increase of $2.6 million, or 0.2%, was attributable to typical seasonal slow growth during the first two quarters of the Company's fiscal year.
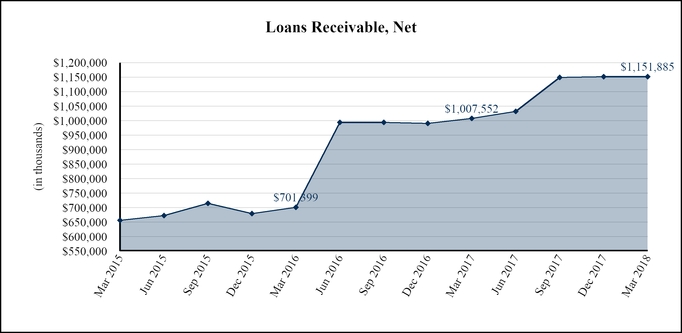
________________________________
Loans are shown net of deferred loan fees, allowance for loan losses, nonaccretable differences and accretable discounts.
Investment Securities Portfolio. At March 31, 2018, our investment securities portfolio totaled $174.5 million, compared to $183.8 million at September 30, 2017. The decrease was attributable to $9.0 million in principal paydowns, $12.3 million in maturities or calls, and a $2.3 million increase in unrealized losses on available for sale securities. These decreases were offset partially by the purchase of $14.9 million in securities during the first six months of fiscal 2018.
As of March 31, 2018, there is no other-than-temporary impairment in the Company's portfolio of investment securities available for sale.
Bank Owned Life Insurance. We invest in bank owned life insurance to provide us with a funding source for our benefit plan obligations. Bank owned life insurance also generally provides us noninterest income that is non-taxable. The total cash surrender values of bank owned life insurance policies at March 31, 2018 and September 30, 2017 were $54.2 million and $53.5 million, respectively.
Deposits. Total deposits increased $10.1 million to $1.3 billion at March 31, 2018. The increase was attributable to a $28.0 million increase in transaction accounts and an $11.2 million increase in money market deposit accounts during the first six months of fiscal 2018, reflecting the success of the Company's marketing efforts for increasing checking and money market accounts. These increases were offset in part by a decrease of $25.9 million in retail certificates of deposit during the six months ended March 31, 2018. At March 31, 2018, $1.3 billion of deposits were considered core deposits, a non-GAAP measure (see Non-GAAP Financial Measures for further information). We currently have $34.1 million of deposits classified as wholesale deposits, most of which are brokered deposits. The following table shows deposit fees earned and deposit balances by category for the quarter end periods indicated:
35
Deposit Balances | |||||||||||||||||||||||||||||||||||
Deposit & Bankcard Fees | Checking | Savings | Money Market | Retail CDs under $250k | Total Core Deposits (1) | Retail CDs $250k & Over | Wholesale CDs | Total Deposits | |||||||||||||||||||||||||||
(dollars in thousands) | |||||||||||||||||||||||||||||||||||
March 31, 2018 | $ | 3,525 | $ | 595,216 | $ | 68,012 | $ | 290,715 | $ | 311,145 | $ | 1,265,088 | $ | 50,061 | $ | 34,111 | $ | 1,349,260 | |||||||||||||||||
December 31, 2017 | 3,573 | 574,682 | 67,582 | 292,613 | 320,096 | 1,254,973 | 52,197 | 36,827 | 1,343,997 | ||||||||||||||||||||||||||
September 30, 2017 | 3,499 | 567,213 | 66,158 | 279,483 | 332,608 | 1,245,462 | 54,480 | 39,201 | 1,339,143 | ||||||||||||||||||||||||||
June 30, 2017 | 3,415 | 510,810 | 65,430 | 236,785 | 303,157 | 1,116,182 | 41,267 | 36,805 | 1,194,254 | ||||||||||||||||||||||||||
March 31, 2017 | 3,067 | 513,294 | 64,868 | 242,375 | 304,798 | 1,125,335 | 39,602 | 36,793 | 1,201,730 | ||||||||||||||||||||||||||
December 31, 2016 | 3,170 | 481,841 | 61,300 | 265,316 | 304,364 | 1,112,821 | 36,744 | 36,782 | 1,186,347 | ||||||||||||||||||||||||||
September 30, 2016 | 3,179 | 478,028 | 63,824 | 242,853 | 303,456 | 1,088,161 | 36,906 | 36,777 | 1,161,844 | ||||||||||||||||||||||||||
June 30, 2016 | 3,110 | 472,123 | 62,810 | 247,165 | 301,675 | 1,083,773 | 34,719 | 36,753 | 1,155,245 | ||||||||||||||||||||||||||
March 31, 2016 | 2,809 | 353,834 | 54,317 | 146,109 | 182,370 | 736,630 | 24,462 | 30,600 | 791,692 | ||||||||||||||||||||||||||
__________________________________
(1) | Non-GAAP financial measure. See Non-GAAP Financial Measures for more information. |
Borrowings. Our borrowings consist of advances from the FHLB of Atlanta as well as floating rate junior subordinated debt assumed in the acquisition of CBS. FHLB borrowings totaled $60.0 million at both March 31, 2018 and September 30, 2017, respectively.
Based upon actual collateral pledged, excluding cash, additional advances of $42.4 million were available. In addition, securities available for sale with lendable collateral value of $49.7 million were also available to be pledged at March 31, 2018.
At March 31, 2018, approximately $79.4 million of credit was available to us at the Federal Reserve Bank of Atlanta based on loan collateral pledged. The line of credit at the Federal Reserve Bank of Atlanta was not used other than during periodic testing to ensure the line was functional.
Floating rate junior subordinated debt assumed in the CBS acquisition totaled $9.3 million, with purchase accounting discounts reducing the book value to $6.8 million and $6.7 million at March 31, 2018 and September 30, 2017, respectively.
Stockholders’ Equity. At March 31, 2018, total stockholders’ equity totaled $221.6 million, a $7.4 million increase from September 30, 2017 due to $9.6 million of net income and a $1.0 million increase from the release of the Company's ESOP shares, as well as $305,000 of stock option exercises. These increases were partially offset by a $1.7 million increase in other comprehensive loss on the Company's portfolio of investment securities available for sale during the six months ended March 31, 2018, as well as $2.2 million of dividends paid. The Company also reclassified $219,000 of stranded tax effects from the revaluation of its deferred tax assets due to the Tax Act from accumulated other comprehensive income to retained earnings as a result of its early adoption of ASU 2018-02. Book value per share increased to $14.64 at March 31, 2018 from $14.17 at September 30, 2017. Tangible book value, a non-GAAP measure (see Non-GAAP Financial Measures for further information), increased to $11.83 per share at March 31, 2018 compared with $11.33 per share at September 30, 2017. Equity was at 13.40% of total assets at March 31, 2018, while the Company's tangible common equity ratio, a non-GAAP measure (see Non-GAAP Financial Measures for further information), was at 11.11%.
Comparison of Operating Results for the Three Months Ended March 31, 2018 and March 31, 2017
General. Net income increased $1.9 million to $5.2 million for the quarter ended March 31, 2018 from $3.3 million for the quarter ended March 31, 2017. The increase was primarily due to $3.2 million of growth in loan interest income. Net interest income increased $3.0 million due to the increase in loans receivable income and a $273,000 increase in interest income on interest-bearing deposits in other financial institutions, partially offset by a $309,000 increase in deposits expense. The Company also recorded a $49,000 discrete tax expense as a result of the revaluation of its deferred tax assets due to the Tax Act. Return on equity was 9.56% for the quarter ended March 31, 2018, compared with 6.40% for the same quarter last year, while return on tangible
36
equity was 11.86%, up from 7.58% for the three months ended March 31, 2017.
Interest Income. Total interest income increased $3.4 million, or 25.2%, to $16.7 million for the quarter ended March 31, 2018. This increase was primarily attributable to the acquisition of Resurgens and associated increased loan balances and loan interest income, along with an increase of $273,000 in interest income on interest-bearing deposits in other financial institutions due to higher cash balances and the Federal Reserve's rate increases. The Company also saw a $441,000 increase in accretion of acquired loan discounts during the current-year period due to additional accretion from Resurgens as well as $380,000 of accretion income from the payoff of one Resurgens loan. The average balance of loans receivable for the three months ended March 31, 2018 increased $153.9 million to $1.2 billion, compared with $1.0 billion in the prior-year period, primarily attributable to the Resurgens acquisition in the fourth quarter of fiscal 2017, which brought in $128.8 million of net loans to the Company's portfolio. Yield on loans increased 47 basis points to 5.21% during the three months ended March 31, 2018, compared to 4.74% during the prior-year period primarily due to the increased yields on the acquired loans from Resurgens.
The table below shows acquired loan discount accretion included in income over the past six years and for the quarters ended March 31, 2018, and December 31, 2017, and the remaining discount to be recognized as of March 31, 2018:
Loan Accretion (Amortization) | ||||||||||||||||||||||||||||||||||||||
2012 | 2013 | 2014 | 2015 | 2016 | 2017 | 1Q 2018 | 2Q 2018 | Remaining | ||||||||||||||||||||||||||||||
(in thousands) | ||||||||||||||||||||||||||||||||||||||
NCB | $ | 751 | $ | 844 | $ | 239 | $ | 68 | $ | — | $ | — | $ | — | $ | — | $ | — | ||||||||||||||||||||
MCB | 3,740 | 3,086 | 3,110 | 2,621 | 751 | — | — | — | — | |||||||||||||||||||||||||||||
FNB | 4,497 | 4,993 | 3,245 | 3,256 | 2,250 | 462 | — | — | — | |||||||||||||||||||||||||||||
CBS | — | — | — | — | 1,370 | 1,206 | 116 | 248 | 960 | |||||||||||||||||||||||||||||
Resurgens | — | — | — | — | — | 73 | 219 | 551 | 1,955 | |||||||||||||||||||||||||||||
Total | 8,988 | 8,923 | 6,594 | 5,945 | 4,371 | 1,741 | 335 | 799 | 2,915 | |||||||||||||||||||||||||||||
Amortization (1) | — | — | (3,507 | ) | (2,387 | ) | — | — | — | — | — | |||||||||||||||||||||||||||
Net | $ | 8,988 | $ | 8,923 | $ | 3,087 | $ | 3,558 | $ | 4,371 | $ | 1,741 | $ | 335 | $ | 799 | $ | 2,915 | ||||||||||||||||||||
__________________________________
(1) | Based on revised estimated cash flows related to previously covered loans, $2.4 million of the FDIC indemnification asset was amortized as an offset to loan interest income in the year ended September 30, 2015 and $3.5 million in the year ended September 30, 2014. Loss share agreements with the FDIC were terminated in the fourth quarter of fiscal 2015. |
Interest on taxable investment securities, which consisted of taxable state and municipal securities, CLOs, mortgage-backed securities and private-label mortgage securities, decreased $108,000 to $996,000 for the quarter ended March 31, 2018. This decrease was primarily attributable to a decrease of $15.9 million in the average balance of taxable securities. Interest on nontaxable investment securities, which consisted of nontaxable state and municipal securities, was $3,000 for the quarter ended March 31, 2018, compared to $5,000 for the prior-year quarter, as the average balance of such securities declined $533,000.
Interest on interest-bearing deposits in other financial institutions increased $273,000 to $486,000 for the quarter ended March 31, 2018, compared to the same period last year due to a $20.2 million increase in the average balance of such deposits combined with the Federal Reserve's continued rate increases. The yield on such deposits increased 73 basis points to 1.54% for the three months ended March 31, 2018 compared to 0.81% for the three months ended March 31, 2017.
Interest on certificates of deposits held at other financial institutions was $21,000 during the quarter ended March 31, 2018, compared to $39,000 during the prior-year quarter due to a drop of $6.2 million in the average balance of such deposits.
Dividends on Federal Home Loan Bank stock increased $12,000 to $53,000 for the quarter ended March 31, 2018 from $40,000 for the quarter ended March 31, 2017 due primarily to a $663,000 increase in the average balance of such securities during the current quarter. Dividends on restricted securities, which are tied to the Company's investment in floating rate junior subordinated debt assumed in the CBS acquisition, was relatively unchanged at $3,000 during the current quarter.
37
The following table shows selected average yield and cost information for the quarter end periods indicated:
Three Months Ended | |||||||||
March 31, 2018 | December 31, 2017 | September 30, 2017 | June 30, 2017 | March 31, 2017 | |||||
Yield on loans | 5.21% | 5.10% | 5.04% | 4.79% | 4.74% | ||||
Yield on securities | 2.21% | 2.33% | 2.27% | 2.20% | 2.25% | ||||
Yield on assets | 4.52% | 4.40% | 4.36% | 4.10% | 4.02% | ||||
Cost of deposits | 0.54% | 0.53% | 0.50% | 0.47% | 0.46% | ||||
Cost of CDs | 0.97% | 0.96% | 0.94% | 0.91% | 0.89% | ||||
Cost of interest bearing checking | 0.17% | 0.18% | 0.18% | 0.16% | 0.15% | ||||
Cost of bank rewarded checking | 0.19% | 0.20% | 0.20% | 0.20% | 0.19% | ||||
Cost of savings | 0.04% | 0.04% | 0.04% | 0.04% | 0.04% | ||||
Cost of MMDA | 0.47% | 0.43% | 0.33% | 0.30% | 0.30% | ||||
Cost of borrowings | 2.43% | 2.48% | 2.58% | 2.62% | 2.90% | ||||
Cost of subordinated debt | 8.29% | 8.16% | 7.83% | 7.74% | 7.45% | ||||
Cost of liabilities | 0.68% | 0.68% | 0.64% | 0.62% | 0.62% | ||||
Loan/deposit spread | 4.67% | 4.57% | 4.54% | 4.32% | 4.28% | ||||
Asset/liability spread | 3.84% | 3.72% | 3.72% | 3.48% | 3.40% | ||||
Interest Expense. Total interest expense increased $326,000 to $2.0 million for the quarter ended March 31, 2018, compared to $1.7 million for the prior year quarter. The increase was largely tied to a $96.2 million increase in the average balance of interest-bearing liabilities during the quarter ended March 31, 2018 to $1.2 billion, compared to $1.1 billion during the three months ended March 31, 2017, primarily as a result of the September 2017 Resurgens acquisition, in which the Company assumed $138.0 million of deposits and $10.0 million of Federal Home Loan Bank advances, as well as a surge in legacy deposits during the first two quarters of fiscal 2017. The cost of liabilities increased six basis points during the three months ended March 31, 2018 due to a combination of higher-costing deposits assumed in the Resurgens acquisition as well as increased legacy deposit rates.
Interest expense on deposits increased $309,000, or 26.5%, to $1.5 million for the quarter ended March 31, 2018, compared to $1.2 million for the quarter ended March 31, 2017. The increase was primarily due to increases of 17 basis points in money market deposit accounts and eight basis points in certificates of deposit, as the Company's overall cost of interest bearing deposits increased eight basis points to 0.54% from 0.46% for the prior-year quarter. There was also an increase of $86.0 million, or 8.5%, in the average balance of interest-bearing deposits. The increased average balances and average costs were both attributable to deposits assumed in the September 2017 Resurgens acquisition as well as a surge in legacy deposits during the first two quarters of the prior year and increased legacy deposit rates. The cost of CDs increased $134,000, or 15.9%, to $978,000 for the quarter ended March 31, 2018, from $844,000 for the quarter ended March 31, 2017, while the cost of money market deposit accounts increased $146,000, or 74.9%, from the prior-year period.
Interest expense on FHLB advances was relatively unchanged at $363,000 for the quarter ended March 31, 2018 despite a $10.0 million increase in the average balance due to the renegotiation of a $25.0 million advance from 4.30% to 3.43% in March of 2017. As a result, the Company's average cost of FHLB advances fell 47 basis points to 2.43% for the three months ended March 31, 2018. Interest expense on the Company's floating rate junior subordinated debt was $140,000 for the quarter ended March 31, 2018, at an average cost of 8.29%, compared to $124,000, or 7.47%, during the prior-year quarter due to increased rates.
Net Interest Income. Net interest income increased $3.0 million, or 26.0%, to $14.7 million for the quarter ended March 31, 2018, from $11.7 million for the quarter ended March 31, 2017. The net increase was due to an increase of $3.2 million in loans receivable income to $15.1 million for the current quarter compared to $11.9 million for the prior year. Additionally, the year over year increase in average loans of $153.9 million, resulting largely from the Resurgens acquisition during the fourth quarter of fiscal 2017, contributed to the increase in net interest income. These increases were partially offset by an increase of $309,000 in deposits expense.
The average balance of interest-bearing liabilities increased $96.2 million, or 9.0%, during the quarter ended March 31, 2018 compared to the prior year period, while total interest expense increased 19.7%. As the table below indicates, our net interest margin increased 46 basis points to 3.98% for the quarter ended March 31, 2018 from 3.52% for the prior year quarter, primarily
38
due to increased loan yields from the Resurgens acquisition and an increase in yield on our interest-bearing deposits in other financial institutions, while our net interest rate spread increased 44 basis points to 3.84% for the second quarter of fiscal 2018 from 3.40% for the second quarter of fiscal 2017. The impact of purchase accounting on net interest margin was 0.23% for the quarter ended March 31, 2018 compared to 0.11% for the quarter ended March 31, 2017. At March 31, 2018, there was $2.9 million of discount remaining to accrete into interest income over the remaining lives of the acquired loans.
For the Three Months Ended March 31, | |||||||||||||||||||||
2018 | 2017 | ||||||||||||||||||||
Average Balance | Interest | Average Yield/Cost (10) | Average Balance | Interest | Average Yield/Cost (10) | ||||||||||||||||
(dollars in thousands) | |||||||||||||||||||||
Assets: | |||||||||||||||||||||
Interest-earning assets: | |||||||||||||||||||||
Interest-earning deposits in other financial institutions | $ | 125,911 | $ | 486 | 1.54 | % | $ | 105,705 | $ | 213 | 0.81 | % | |||||||||
Certificates of deposit held at other financial institutions | 5,729 | 21 | 1.43 | 11,893 | 39 | 1.30 | |||||||||||||||
FHLB common stock and other equity securities | 4,056 | 53 | 5.20 | 3,393 | 40 | 4.75 | |||||||||||||||
Taxable investment securities | 179,824 | 996 | 2.22 | 195,694 | 1,104 | 2.26 | |||||||||||||||
Nontaxable investment securities (1) | 1,055 | 3 | 1.24 | 1,588 | 5 | 1.15 | |||||||||||||||
Restricted securities | 279 | 3 | 4.63 | 279 | 3 | 3.84 | |||||||||||||||
Loans receivable (1)(2)(3)(4) | 1,159,420 | 14,303 | 4.93 | 1,005,473 | 11,545 | 4.59 | |||||||||||||||
Accretion, net, of acquired loan discounts (5) | 799 | 0.27 | 358 | 0.14 | |||||||||||||||||
Total interest-earning assets | 1,476,274 | 16,664 | 4.52 | 1,324,025 | 13,307 | 4.02 | |||||||||||||||
Total noninterest-earning assets | 154,799 | 134,605 | |||||||||||||||||||
Total assets | $ | 1,631,073 | $ | 1,458,630 | |||||||||||||||||
Liabilities and Equity: | |||||||||||||||||||||
Interest-bearing liabilities: | |||||||||||||||||||||
Interest bearing checking | $ | 277,300 | $ | 121 | 0.17 | % | $ | 251,150 | $ | 94 | 0.15 | % | |||||||||
Bank rewarded checking | 56,073 | 27 | 0.19 | 53,653 | 26 | 0.19 | |||||||||||||||
Savings accounts | 66,885 | 7 | 0.04 | 62,718 | 6 | 0.04 | |||||||||||||||
Money market deposit accounts | 290,259 | 341 | 0.47 | 259,470 | 195 | 0.30 | |||||||||||||||
Certificate of deposit accounts | 402,686 | 978 | 0.97 | 380,198 | 844 | 0.89 | |||||||||||||||
Total interest-bearing deposits | 1,093,203 | 1,474 | 0.54 | 1,007,189 | 1,165 | 0.46 | |||||||||||||||
Borrowed funds | 60,029 | 364 | 2.43 | 50,011 | 363 | 2.90 | |||||||||||||||
Floating rate junior subordinated debt | 6,771 | 140 | 8.29 | 6,634 | 124 | 7.47 | |||||||||||||||
Total interest-bearing liabilities | 1,160,003 | 1,978 | 0.68 | 1,063,834 | 1,652 | 0.62 | |||||||||||||||
Noninterest-bearing deposits | 234,673 | 174,904 | |||||||||||||||||||
Other noninterest-bearing liabilities | 16,679 | 15,775 | |||||||||||||||||||
Total noninterest-bearing liabilities | 251,352 | 190,679 | |||||||||||||||||||
Total liabilities | 1,411,355 | 1,254,513 | |||||||||||||||||||
Total stockholders' equity | 219,718 | 205,021 | |||||||||||||||||||
Total liabilities and stockholders' equity | $ | 1,631,073 | $ | 1,459,534 | |||||||||||||||||
Net interest income | $ | 14,686 | $ | 11,655 | |||||||||||||||||
Net interest-earning assets (6) | $ | 316,271 | $ | 260,191 | |||||||||||||||||
Net interest rate spread (7) | 3.84 | % | 3.40 | % | |||||||||||||||||
Net interest margin (8) | 3.98 | % | 3.52 | % | |||||||||||||||||
Impact of purchase accounting on net interest margin (9) | 0.23 | % | 0.11 | % | |||||||||||||||||
Ratio of average interest-earning assets to average interest-bearing liabilities | 127.26 | % | 124.46 | % | |||||||||||||||||
__________________________________
(1) | Tax exempt or tax-advantaged securities and loans are shown at their contractual yields and are not shown at a tax equivalent yield. |
(2) | Includes net loan fees deferred and accreted pursuant to applicable accounting requirements. |
(3) | Interest income on loans is interest income as recorded in the income statement and, therefore, does not include interest income on nonaccrual loans. |
(4) | Interest income on loans excludes discount accretion on acquired loans. |
(5) | Accretion of accretable purchase discount on loans acquired. |
(6) | Net interest-earning assets represent total average interest-earning assets less total average interest-bearing liabilities. |
39
(7) | Net interest rate spread represents the difference between the weighted average yield on interest-earning assets and the weighted average cost of interest-bearing liabilities. |
(8) | Net interest margin represents net interest income as a percentage of average interest-earning assets. |
(9) | Impact on net interest margin when excluding accretion income and average accretable discounts. |
(10) | Annualized. |
Rate/Volume Analysis. The following table presents the effects of changing rates and volumes on our net interest income for the periods indicated. The rate column shows the effects attributable to changes in rates (changes in rate multiplied by prior volume). The volume column shows the effects attributable to changes in volume (changes in volume multiplied by prior rate). The combined column represents the net change in volume between the two periods multiplied by the net change in rate between the two periods. The net column represents the sum of the prior columns.
For the Three Months Ended March 31, 2018 Compared to the Three Months Ended March 31, 2017 | |||||||||||||||
Increase/(Decrease) Due to | |||||||||||||||
Volume | Rate | Combined | Net | ||||||||||||
(dollars in thousands) | |||||||||||||||
Interest Income: | |||||||||||||||
Interest-earning deposits in other financial institutions | $ | 41 | $ | 195 | $ | 37 | $ | 273 | |||||||
Certificates of deposit held at other financial institutions | (20 | ) | 4 | (2 | ) | (18 | ) | ||||||||
FHLB common stock and other equity securities | 8 | 4 | 1 | 13 | |||||||||||
Taxable investment securities | (90 | ) | (20 | ) | 2 | (108 | ) | ||||||||
Nontaxable investment securities | (2 | ) | — | — | (2 | ) | |||||||||
Restricted securities | — | — | — | — | |||||||||||
Loans receivable | 1,822 | 1,194 | 183 | 3,199 | |||||||||||
Total interest-earning assets | $ | 1,759 | $ | 1,377 | $ | 221 | $ | 3,357 | |||||||
Interest Expense: | |||||||||||||||
Checking accounts | $ | 11 | $ | 15 | $ | 2 | $ | 28 | |||||||
Savings accounts | — | — | 1 | 1 | |||||||||||
Money market deposit accounts | 23 | 110 | 13 | 146 | |||||||||||
Certificate of deposit accounts | 50 | 80 | 4 | 134 | |||||||||||
Total interest-bearing deposits | 84 | 205 | 20 | 309 | |||||||||||
Borrowed funds | 73 | (59 | ) | (13 | ) | 1 | |||||||||
Floating rate junior subordinated debt | 3 | 14 | (1 | ) | 16 | ||||||||||
Total interest-bearing liabilities | $ | 160 | $ | 160 | $ | 6 | $ | 326 | |||||||
Net change in net interest income | $ | 1,599 | $ | 1,217 | $ | 215 | $ | 3,031 | |||||||
40
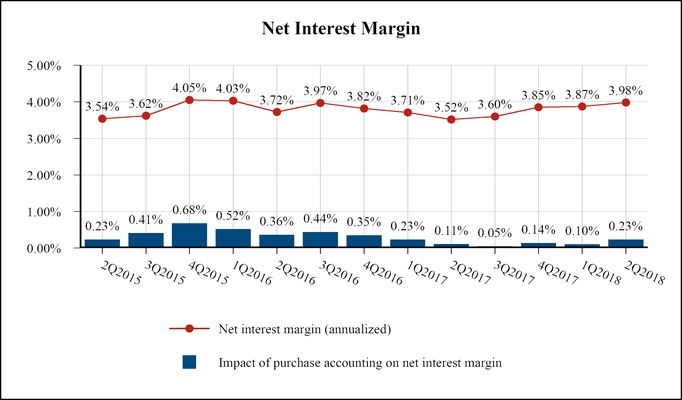
The following table shows components of net interest income for the periods indicated.
For the Three Months Ended | |||||||||||||||||||
Mar 31, 2018 | Dec 31, 2017 | Sep 30, 2017 | Jun 30, 2017 | Mar 31, 2017 | |||||||||||||||
(dollars in thousands) | |||||||||||||||||||
Interest income less purchase discount accretion (1) | $ | 15,865 | $ | 15,945 | $ | 14,576 | $ | 13,454 | $ | 12,949 | |||||||||
Purchase discount accretion | 799 | 335 | 486 | 173 | 358 | ||||||||||||||
Total interest income | 16,664 | 16,280 | 15,062 | 13,627 | 13,307 | ||||||||||||||
Interest Expense | 1,978 | 1,973 | 1,762 | 1,640 | 1,652 | ||||||||||||||
Net interest income | $ | 14,686 | $ | 14,307 | $ | 13,300 | $ | 11,987 | $ | 11,655 | |||||||||
__________________________________
(1) | Non-GAAP financial measure, derived as total interest income less loan purchase discount accretion. See Non-GAAP Measures for more information. |
Provision for Loan Losses. A negative provision for loan losses of $350,000 was recorded in the quarter ended March 31, 2018 due to the continued positive credit quality trends of the loan portfolio, as well as continuing net recoveries of previously charged-off loans. During the prior-year period, a negative provision for loan losses of $150,000 was recorded. Net recoveries for the three months ended March 31, 2018 were $347,000, compared to net recoveries of $156,000 for the three months ended March 31, 2017. The allowance for loan losses was $11.1 million, or 0.96% of total loans receivable, at March 31, 2018. Our nonperforming loans decreased to $1.4 million, or 0.12% of total loans, at March 31, 2018 from $1.6 million at March 31, 2017. As a result, our allowance as a percent of nonperforming loans increased to 780.63% at March 31, 2018. See our discussion on the allowance for further information.
Noninterest Income. Noninterest income increased $417,000, or 9.2%, to $5.0 million for the quarter ended March 31, 2018 compared to $4.5 million the quarter ended March 31, 2017. The increase was largely attributable to an increase of $458,000 in deposit and bankcard fees, reflecting the continued success of the Company's marketing efforts for checking accounts and signature debit card transactions. The Company's $1.5 million bankcard fee total for the current quarter, a 12.8% increase over the prior-year quarter, was the third consecutive all-time quarterly high. Bank owned life insurance income increased $122,000, or 49.4%, as a result of the discontinuation of an annual repricing on a portion of the Company's policies, while other income increased $232,000 due to a $114,000 gain on the receipt of reinsurance cash and a $79,000 quarterly incentive from the Company's bankcard vendor. These increases were offset in part by $248,000 of gains on the sale of investment securities for sale during the prior-year
41
quarter, as no such gains were recorded during the three months ended March 31, 2018, and a decrease of $86,000, or 15.8%, in gain on sale of loans due to reduced sales activity during the current quarter.
The following table shows noninterest income by category for the periods indicated.
For the Three Months Ended | |||||||||||||||||||
Mar 31, 2018 | Dec 31, 2017 | Sep 30, 2017 | Jun 30, 2017 | Mar 31, 2017 | |||||||||||||||
(dollars in thousands) | |||||||||||||||||||
Service charges on deposit accounts | $ | 1,983 | $ | 2,114 | $ | 2,081 | $ | 1,972 | $ | 1,701 | |||||||||
Bankcard fees | 1,542 | 1,459 | 1,418 | 1,443 | 1,367 | ||||||||||||||
Gain on sale of loans | 457 | 619 | 601 | 543 | 543 | ||||||||||||||
Brokerage commissions | 163 | 172 | 150 | 186 | 225 | ||||||||||||||
Bank owned life insurance | 369 | 322 | 310 | 306 | 247 | ||||||||||||||
Gain on investment securities available for sale | — | 1 | — | — | 248 | ||||||||||||||
Gain on sale of other assets held for sale | — | 266 | — | — | — | ||||||||||||||
Recoveries on acquired loans previously covered under FDIC-assisted acquisitions | — | — | 163 | — | — | ||||||||||||||
Other | 449 | 438 | 347 | 189 | 215 | ||||||||||||||
Total noninterest income | $ | 4,963 | $ | 5,391 | $ | 5,070 | $ | 4,639 | $ | 4,546 | |||||||||
Noninterest Expense. Total noninterest expense increased $2.0 million, or 18.5%, to $12.7 million for the quarter ended March 31, 2018, compared to $10.7 million for the quarter ended March 31, 2017. The overall increase was primarily attributable to increased ongoing operational costs as a result of the Resurgens acquisition in September 2017, as the Company saw increases of $944,000, $385,000, and $421,000, or 15.5%, 31.6%, and 42.0%, in salaries and employee benefits, occupancy, and data processing, respectively. The Company also recorded $618,000 of deal costs related to the Resurgens acquisition, largely concentrated in severance costs and data processing. These increases were offset in part by a decline of $169,000 in legal and professional fees, due primarily to a decline in problem assets.
The following table shows noninterest expense by category for the periods indicated:
For the Three Months Ended | |||||||||||||||||||
Mar 31, 2018 | Dec 31, 2017 | Sep 30, 2017 | Jun 30, 2017 | Mar 31, 2017 | |||||||||||||||
(dollars in thousands) | |||||||||||||||||||
Salaries and employee benefits | $ | 7,022 | $ | 7,009 | $ | 7,688 | $ | 6,530 | $ | 6,079 | |||||||||
Occupancy | 1,605 | 1,478 | 1,503 | 1,157 | 1,220 | ||||||||||||||
Data processing | 1,425 | 1,153 | 1,925 | 1,091 | 1,004 | ||||||||||||||
Legal and professional | 219 | 266 | 808 | 384 | 388 | ||||||||||||||
Marketing | 477 | 329 | 479 | 384 | 412 | ||||||||||||||
Furniture and equipment | 306 | 240 | 276 | 202 | 228 | ||||||||||||||
Postage, office supplies, and printing | 225 | 232 | 212 | 224 | 223 | ||||||||||||||
Core deposit intangible amortization expense | 191 | 191 | 140 | 118 | 149 | ||||||||||||||
Federal insurance premiums and other regulatory fees | 308 | 188 | 199 | 198 | 197 | ||||||||||||||
Net cost (benefit) of operations of other real estate owned | 1 | (50 | ) | (40 | ) | 18 | 14 | ||||||||||||
Other | 957 | 835 | 1,197 | 791 | 836 | ||||||||||||||
Total noninterest expense | $ | 12,736 | $ | 11,871 | $ | 14,387 | $ | 11,097 | $ | 10,750 | |||||||||
Income Taxes. Income taxes decreased to $2.0 million for the quarter ended March 31, 2018 from $2.3 million for the quarter ended March 31, 2017. The decrease was due to the Company's reduced tax rate as a result of the Tax Act, as income before income taxes increased $1.7 million. The Company recorded a discrete charge to income tax expense of $49,000 as a result of the revaluation of its deferred tax assets due to the Tax Act. The Company's effective tax rate declined to 27.73% in the quarter ended March 31, 2018 from 40.78% in the quarter ended March 31, 2017. Net of the deferred tax asset revaluation charge, the Company's effective
42
tax rate for the current quarter was 27.05%. Throughout fiscal 2018 the Company has a blended statutory federal income tax rate of 24.5% due to its fiscal year, which declines to 21% for fiscal 2019 and beyond.
Comparison of Operating Results for the Six Months Ended March 31, 2018 and March 31, 2017
General. Net income increased $1.3 million, or 15.4%, to $9.6 million for the six months ended March 31, 2018 from $8.4 million for the six months ended March 31, 2017. The improvement was largely due to an increase of $5.1 million in net interest income due to higher balances as a result of the September 2017 Resurgens acquisition, along with an increase of $861,000, or 13.8%, in deposit and bankcard fees. These increases were offset in part by a $1.5 million discrete charge to income tax expense as a result of the revaluation of the Company's deferred tax assets as a result of the Tax Act and $927,000 of merger-related costs from the Resurgens acquisition. Basic and diluted net income per share for the six months ended March 31, 2018 increased 13.56% and 14.55%, respectively, compared to the prior year period, as a result of higher income.
Interest Income. Total interest income increased to $32.9 million for the six months ended March 31, 2018, from $27.2 million for the six months ended March 31, 2017. This increase was primarily attributable to the acquisition of Resurgens and the resulting increased loan balances and interest income. The average balance of loans receivable increased $154.3 million, or 15.4%, to $1.2 billion for the six months ended March 31, 2018, compared to $1.0 billion for the six months ended March 31, 2017, resulting in a $5.4 million, or 22.1%, increase in loans receivable income. The average yield on interest-earning assets increased 34 basis points during the six months ended March 31, 2018 as compared to the same prior-year period.
The average yield on loans increased to 5.16% for the six months ended March 31, 2018, compared to 4.87% for the six months ended March 31, 2017. The higher average yield on loans for the six months ended March 31, 2018 was attributable to higher-yielding loans acquired in the purchase of Resurgens, as well as a $52,000 increase in accretion of acquired loan discounts due to $380,000 of additional accretion brought in during the current quarter due to a payoff of one Resurgens loan. There is $2.9 million of discount remaining on the CBS and Resurgens loans to accrete into interest income over the remaining life of all acquired loans, with the accretion heavily weighted towards early quarters based on current cash flow projections.
Interest on taxable investment securities decreased $140,000 to $2.1 million for the six months ended March 31, 2018 from $2.2 million for the corresponding prior year period, due primarily to a $14.5 million decrease in the average balance of such securities, offset in part by a 3 basis point increase in yields on such securities. Interest on nontaxable investment securities, which consisted of nontaxable state and municipal obligations, was $7,000 for the six months ended March 31, 2018, compared to $9,000 in the six months ended March 31, 2017 due to a decline of $533,000 in the average balance of such securities.
Interest on interest earning deposits in other financial institutions increased $523,000 to $847,000 for the six months ended March 31, 2018 from $324,000 for the six months ended March 31, 2017 due to an increase of $23.9 million, or 23.35%, in the average balance of such deposits, as well as the Federal Reserve's continued rate increases.
Dividends on Federal Home Loan Bank stock increased $24,000 to $104,000 for the six months ended March 31, 2018, compared to $80,000 for the six months ended March 31, 2017, due to a 20.08% increase in the average balance of such stock and an increase of 42 basis points in yield on the securities.
Interest on certificates of deposit held at other financial institutions, which were inherited from the acquisition of CBS, declined $36,000 to $46,000 for the six months ended March 31, 2018, due to a drop of $6.3 million in the average balance of such securities.
Dividends on restricted securities, which are tied to the Company's investment in floating rate junior subordinated debt, increased $1,000 to $6,000 for the six months ended March 31, 2018, due to an increase of 75 basis points in yield on the securities.
Interest Expense. Total interest expense increased $632,000, or 19.1%, to $4.0 million for the six months ended March 31, 2018, compared to $3.3 million for the six months ended March 31, 2017. Interest expense increased due to a $101.7 million, or 9.6%, increase in the average balance of interest-bearing liabilities to $1.2 billion during the six months ended March 31, 2018, partially offset by a five basis point, or 7.9%, increase in the average cost of such liabilities to 0.68% at March 31, 2018 from 0.63% at March 31, 2017. The Company saw significant growth in demand deposits and money market deposit accounts, both from legacy growth and the acquisition of Resurgens.
Interest expense on deposits increased $614,000, or 26.4%, to $2.9 million for the six months ended March 31, 2018, compared with the six months ended March 31, 2017. The increase was due to a $91.5 million, or 9.1%, increase in the average balance of interest-bearing deposits to $1.1 billion, as well as an eight basis point increase in average cost of deposits to 0.54% for the current six month period compared to 0.46% for the six months ended March 31, 2017, reflecting higher market interest rates as a result of the Federal Reserve's three recent rate increases and higher rates on the deposits the Company assumed in the acquisition of Resurgens.
43
The Company saw the largest increase in average cost of deposits in its money market deposit accounts, which increased 15 basis points as a result of the Resurgens acquisition as well as increases in legacy rates. The average cost of our interest bearing checking accounts increased four basis points to 0.18% for the six months ended March 31, 2018 compared to the same period in fiscal 2017, while the cost of certificates of deposit each increased eight basis points to 0.97%.
Interest expense on FHLB advances decreased $16,000 to $734,000 for the six months ended March 31, 2018 compared to $750,000 for the six months ended March 31, 2017, despite an increase of $10.0 million, or 20.0%, in the average balance of advances, due to the restructuring of a $25.0 million advance costing 4.30% to 3.43% in March 2017. The average cost of advances decreased 55 basis points to 2.45% for the six months ended March 31, 2018, from 3.00% during the six months ended March 31, 2017.
Interest expense on floating rate junior subordinated debt was $278,000 in the six months ended March 31, 2018, compared to $244,000 for the same period in 2017 due to increased rates.
Net Interest Income. Net interest income increased $5.1 million, or 21.5%, to $29.0 million for the six months ended March 31, 2018, from $23.9 million for the six months ended March 31, 2017, due to increased interest income from the acquisition of Resurgens, and a $523,000 increase in income on interest bearing deposits in other financial institutions, offset by a five basis point increase in the cost of interest-bearing liabilities. Total interest income increased $5.8 million, or 21.2%, while total interest expense increased $632,000, or 19.1%, for the six months ended March 31, 2018, compared to the same prior-year period.
As the table indicates below, our net interest margin increased 31 basis points during the six months ended March 31, 2018 as compared to the six months ended March 31, 2017, while our net interest rate spread increased 29 basis points to 3.78% for the first six months of fiscal 2018 from 3.49% for the comparable six months of 2017. The impact of purchase accounting on net interest margin was 0.16% for the six months ended March 31, 2018 compared to 0.17% for the six months ended March 31, 2017.
44
For the Six Months Ended March 31, | |||||||||||||||||||||
2018 | 2017 | ||||||||||||||||||||
Average Balance | Interest | Average Yield/Cost (10) | Average Balance | Interest | Average Yield/Cost (10) | ||||||||||||||||
(dollars in thousands) | |||||||||||||||||||||
Assets: | |||||||||||||||||||||
Interest-earning assets: | |||||||||||||||||||||
Interest-earning deposits in other financial institutions | $ | 126,376 | $ | 847 | 1.34 | % | $ | 102,451 | $ | 324 | 0.63 | % | |||||||||
Certificates of deposit held at other financial institutions | 6,367 | 46 | 1.43 | 12,630 | 81 | 1.29 | |||||||||||||||
FHLB common stock and other equity securities | 4,055 | 104 | 5.13 | 3,377 | 80 | 4.71 | |||||||||||||||
Taxable investment securities | 180,920 | 2,060 | 2.28 | 195,409 | 2,200 | 2.25 | |||||||||||||||
Nontaxable investment securities (1) | 1,060 | 7 | 1.24 | 1,593 | 9 | 1.15 | |||||||||||||||
Restricted securities | 279 | 6 | 4.51 | 279 | 5 | 3.76 | |||||||||||||||
Loans receivable (1)(2)(3)(4) | 1,158,732 | 28,740 | 4.96 | 1,004,386 | 23,391 | 4.66 | |||||||||||||||
Accretion, net, of acquired loan discounts (5) | 1,134 | 0.20 | 1,082 | 0.21 | |||||||||||||||||
Total interest-earning assets | 1,477,789 | 32,944 | 4.46 | 1,320,125 | 27,172 | 4.12 | |||||||||||||||
Total noninterest-earning assets | 155,679 | 135,883 | |||||||||||||||||||
Total assets | $ | 1,633,468 | $ | 1,456,008 | |||||||||||||||||
Liabilities and Equity: | |||||||||||||||||||||
Interest-bearing liabilities: | |||||||||||||||||||||
Interest bearing checking | $ | 277,214 | $ | 248 | 0.18 | % | $ | 251,110 | $ | 180 | 0.14 | % | |||||||||
Bank rewarded checking | 54,614 | 54 | 0.20 | 52,692 | 52 | 0.20 | |||||||||||||||
Savings accounts | 66,527 | 13 | 0.04 | 62,434 | 12 | 0.04 | |||||||||||||||
Money market deposit accounts | 288,447 | 647 | 0.45 | 257,379 | 389 | 0.30 | |||||||||||||||
Certificate of deposit accounts | 408,901 | 1,976 | 0.97 | 380,584 | 1,691 | 0.89 | |||||||||||||||
Total interest-bearing deposits | 1,095,703 | 2,938 | 0.54 | 1,004,199 | 2,324 | 0.46 | |||||||||||||||
Borrowed funds | 60,025 | 734 | 2.45 | 50,006 | 750 | 3.00 | |||||||||||||||
Floating rate junior subordinated debt | 6,753 | 278 | 8.23 | 6,616 | 244 | 7.36 | |||||||||||||||
Total interest-bearing liabilities | 1,162,481 | 3,950 | 0.68 | 1,060,821 | 3,318 | 0.63 | |||||||||||||||
Noninterest-bearing deposits | 235,290 | 173,561 | |||||||||||||||||||
Other noninterest-bearing liabilities | 17,343 | 15,459 | |||||||||||||||||||
Total noninterest-bearing liabilities | 252,633 | 189,020 | |||||||||||||||||||
Total liabilities | 1,415,114 | 1,249,841 | |||||||||||||||||||
Total stockholders' equity | 218,354 | 206,167 | |||||||||||||||||||
Total liabilities and stockholders' equity | $ | 1,633,468 | $ | 1,456,008 | |||||||||||||||||
Net interest income | $ | 28,994 | $ | 23,854 | |||||||||||||||||
Net interest earning assets (6) | $ | 315,308 | $ | 259,304 | |||||||||||||||||
Net interest rate spread (7) | 3.78 | % | 3.49 | % | |||||||||||||||||
Net interest margin (8) | 3.92 | % | 3.61 | % | |||||||||||||||||
Impact of purchase accounting on net interest margin (9) | 0.16 | % | 0.17 | % | |||||||||||||||||
Ratio of average interest-earning assets to average interest-bearing liabilities | 127.12 | % | 124.44 | % | |||||||||||||||||
__________________________________
(1) | Tax exempt or tax-advantaged securities and loans are shown at their contractual yields and are not shown at a tax equivalent yield. |
(2) | Includes net loan fees deferred and accreted pursuant to applicable accounting requirements. |
(3) | Interest income on loans is interest income as recorded in the income statement and, therefore, does not include interest income on nonaccrual loans. |
(4) | Interest income on loans excludes discount accretion and amortization of the indemnification asset. |
(5) | Accretion of accretable purchase discount on loans acquired. |
(6) | Net interest-earning assets represent total average interest-earning assets less total average interest-bearing liabilities. |
(7) | Net interest rate spread represents the difference between the weighted average yield on interest-earning assets and the weighted average cost of interest-bearing liabilities. |
(8) | Net interest margin represents net interest income as a percentage of average interest-earning assets. |
(9) | Impact on net interest margin when excluding accretion income and average accretable discounts. |
(10) | Annualized. |
45
Rate/Volume Analysis. The following table presents the effects of changing rates and volumes on our net interest income for the periods indicated. The rate column shows the effects attributable to changes in rates (changes in rate multiplied by prior volume). The volume column shows the effects attributable to changes in volume (changes in volume multiplied by prior rate). The combined column represents the net change in volume between the two periods multiplied by the net change in rate between the two periods. The net column represents the sum of the prior columns.
For the Six Months Ended March 31, 2018 Compared to the Six Months Ended March 31, 2017 | |||||||||||||||
Increase/(Decrease) Due to | |||||||||||||||
Volume | Rate | Combined | Net | ||||||||||||
(dollars in thousands) | |||||||||||||||
Interest Income: | |||||||||||||||
Interest-earning deposits in other financial institutions | $ | 76 | $ | 363 | $ | 84 | $ | 523 | |||||||
Certificates of deposit held at other financial institutions | (40 | ) | 10 | (5 | ) | (35 | ) | ||||||||
FHLB common stock and other equity securities | 16 | 7 | 1 | 24 | |||||||||||
Taxable investment securities | (163 | ) | 25 | (2 | ) | (140 | ) | ||||||||
Nontaxable investment securities | (3 | ) | 1 | — | (2 | ) | |||||||||
Restricted securities | — | 1 | — | 1 | |||||||||||
Loans receivable | 3,761 | 1,421 | 219 | 5,401 | |||||||||||
Total interest-earning assets | $ | 3,647 | $ | 1,828 | $ | 297 | $ | 5,772 | |||||||
Interest Expense: | |||||||||||||||
Checking accounts | $ | 21 | $ | 44 | $ | 5 | $ | 70 | |||||||
Savings accounts | 1 | — | — | 1 | |||||||||||
Money market deposit accounts | 47 | 188 | 23 | 258 | |||||||||||
Certificate of deposit accounts | 126 | 148 | 11 | 285 | |||||||||||
Total interest-bearing deposits | 195 | 380 | 39 | 614 | |||||||||||
Borrowed funds | 150 | (138 | ) | (28 | ) | (16 | ) | ||||||||
Floating rate junior subordinated debt | 5 | 28 | 1 | 34 | |||||||||||
Total interest-bearing liabilities | $ | 350 | $ | 270 | $ | 12 | $ | 632 | |||||||
Net change in net interest income | $ | 3,297 | $ | 1,558 | $ | 285 | $ | 5,140 | |||||||
Provision for Loan Losses. There was a $350,000 negative provision recorded for loan losses in the six months ended March 31, 2018 compared to a $900,000 negative provision for loan losses recorded in the six months ended March 31, 2017. Net recoveries were $382,000 for the six months ended March 31, 2018, compared with net recoveries of $1.0 million for the six months ended March 31, 2017. The allowance for loan losses was $11.1 million, or 0.96% of total loans receivable at March 31, 2018. Our allowance for loan losses as a percent of legacy loans was 1.15% at March 31, 2018. Our nonperforming loans decreased to $1.4 million at March 31, 2018 from $1.6 million at March 31, 2017. Our allowance as a percent of nonperforming loans was 780.63% at March 31, 2018.
Noninterest Income. Noninterest income increased $826,000, or 8.7%, to $10.4 million for the six months ended March 31, 2018, from $9.5 million for the six months ended March 31, 2017, due primarily to an increase of $861,000, or 13.8%, in deposit and bankcard fee income. Additionally, income on bank owned life insurance increased $112,000, or 19.3%, to $691,000 due to higher balances as a result of the Resurgens acquisition as well as the discontinuation of an annual repricing fee during the current year, and other income increased $298,000 as a result of $294,000 in incentive payments from the Company's bankcard vendor and a $114,000 gain on the receipt of reinsurance cash. The Company also saw an increase of $304,000 in gains on the sale of assets available for sale. These increases during the six months ended March 31, 2018 were offset in part by declines of $250,000 in recoveries on loans formerly covered under FDIC-assisted acquisitions, $247,000 in gains on the sale of investment securities available for sale, and $198,000 in gains on the sale of loans due to reduced activity.
Noninterest Expense. Total noninterest expense increased $3.6 million, or 17.0%, to $24.6 million for the six months ended March 31, 2018 compared to $21.0 million in the same period in the prior fiscal year. The increase was largely the result of increased ongoing operational costs as a result of the Resurgens acquisition. Salaries and employee benefits increased $1.8 million, or 14.9%, occupancy increased $540,000, or 21.2%, and data processing increased $665,000, or 34.8%. The Company also had $927,000 of merger-related costs from the Resurgens acquisition, largely concentrated in severance costs and data processing fees. No acquisition costs were recorded during the six months ended March 31, 2017. There was also a decrease of $296,000 in the net benefit of
46
operations of real estate owned due to reduced sales activity as the balance of other real estate has declined to minimal levels. Offsetting these increases to noninterest expense was a decline of $187,000, or 27.8%, in legal and professional fees, largely due to reduced problem assets.
Income Taxes. Income taxes increased to $5.4 million for the six months ended March 31, 2018 from $4.9 million for the six months ended March 31, 2017. The increase was due to a discrete tax expense of $1.5 million as a result of the revaluation of the Company's deferred tax assets due to the Tax Act during the current-year period, as well as a 13.9% increase in income before income taxes compared to the prior-year period, partially offset by an estimated $1.5 million reduction in regular tax accruals due to the lower rates from the Tax Act. The Company's effective tax rate was 36.08% in the six months ended March 31, 2018, compared to 36.86% in the six months ended March 31, 2017. The Company's effective tax rate for the six months ended March 31, 2018, net of the one-time deferred tax asset revaluation charge, was 26.37%. Due to the timing of the Tax Act and the Company's fiscal year the Company's statutory federal tax rate was 35% for fiscal 2017, 24.5% for fiscal 2018 and 21% for fiscal 2019.
Asset Quality
Delinquent Loans and Foreclosed Assets. Our policies require that management continuously monitor the status of the loan portfolio and report to CharterBank's Loan Committee of the Board of Directors on a monthly basis. These reports include information on delinquent loans and foreclosed real estate, and our actions and plans to cure the delinquent status of the loans and to dispose of the foreclosed property. The Loan Committee is comprised of three outside directors: the chairman, which is a permanent position, and two other Committee members, which alternate between four outside directors. Additionally, two inside directors serve as ex officio members of the committee.
We generally stop accruing interest income when we consider the timely collectability of interest or principal to be doubtful. We generally stop accruing for loans that are 90 days or more past due unless the loan is well secured and we determine that the ultimate collection of all principal and interest is not in doubt. When we designate loans as nonaccrual, we reverse all outstanding unpaid interest that we had previously credited. These loans remain on nonaccrual status until a regular pattern of timely payments is established.
Impaired loans are individually assessed to determine whether the carrying value exceeds the fair value of the collateral or the present value of the expected cash flows to be received. Smaller balance homogeneous loans, such as residential mortgage loans and consumer loans, are collectively evaluated for impairment.
Real estate acquired as a result of foreclosure or by deed in lieu of foreclosure is classified as OREO until it is sold. When real estate is acquired through foreclosure or by deed in lieu of foreclosure, it is recorded at the lower of the related loan balance or its fair value as determined by an appraisal, less estimated costs of disposal. If the value of the property is less than the loan, less any related specific loan loss reserve allocations, the difference is charged against the allowance for loan losses. Any subsequent write-down of OREO or loss at the time of disposition is charged against earnings.
47
Nonperforming Assets. The table below sets forth the amounts and categories of our nonperforming assets at the dates indicated.
March 31, 2018 | September 30, 2017 | ||||||
(dollars in thousands) | |||||||
Nonaccrual loans: (1) (2) | |||||||
1-4 family residential real estate | $ | 316 | $ | 293 | |||
Commercial real estate | 897 | 1,327 | |||||
Commercial | 91 | 40 | |||||
Real estate construction | — | — | |||||
Consumer and other loans | — | — | |||||
Total nonaccrual loans | 1,304 | 1,660 | |||||
Loans delinquent 90 days or greater and still accruing: (3) | |||||||
1-4 family residential real estate | 119 | 46 | |||||
Commercial real estate | — | — | |||||
Commercial | — | — | |||||
Real estate construction | — | — | |||||
Consumer and other loans | — | — | |||||
Total loans delinquent 90 days or greater and still accruing | 119 | 46 | |||||
Total nonperforming loans | 1,423 | 1,706 | |||||
Other real estate owned: | |||||||
1-4 family residential real estate | 303 | 224 | |||||
Commercial real estate | — | 1,213 | |||||
Commercial | — | ||||||
Real estate construction | — | ||||||
Consumer and other loans | — | ||||||
Total real estate owned | 303 | 1,437 | |||||
Total nonperforming assets | $ | 1,726 | $ | 3,143 | |||
Ratios: | |||||||
Nonperforming loans as a percentage of total loans, gross | 0.12 | % | 0.15 | % | |||
Nonperforming assets as a percentage of total assets | 0.10 | % | 0.19 | % | |||
__________________________________
(1) | Included in nonaccrual loans is $175,000 and $92,000 of non-accruing troubled debt restructured loans at March 31, 2018 and September 30, 2017, respectively. |
(2) | Acquired FAS ASC 310-30 loans that were previously covered under loss share agreements with the FDIC, as well as our acquisition of CBS, and have associated accretable discount remaining, in the amount of $0 and $888,000 are excluded from this table as of March 31, 2018 and September 30, 2017, respectively. Due to the recognition of accretion income that was established at the time of acquisition, FAS ASC 310-30 loans that were greater than 90 days delinquent or otherwise considered nonperforming loans are regarded as performing loans for reporting purposes. |
(3) | No acquired loans are excluded from this section at March 31, 2018 and September 30, 2017, respectively. These loans, which are accounted for under ASC 310-30, are reported as performing loans because of the ongoing recognition of accretion income established at the time of acquisition. |
Nonperforming assets decreased $1.4 million during the six months ended March 31, 2018 due to a $1.1 million decrease in other real estate owned and a $356,000 decrease in nonaccrual loans. These decreases were offset in part by a $73,000 increase in loans delinquent 90 days or greater and still accruing. All remaining real estate owned is 1-4 family residential real estate. We have 21 loans that remain nonperforming at March 31, 2018, and the largest nonperforming loan had a balance of $330,000 and was secured by commercial real estate.
For the six and twelve months ended March 31, 2018 and September 30, 2017, interest income recognized on impaired loans, which includes nonperforming loans and accruing troubled debt restructured loans, was approximately $222,000 and $295,000, respectively. Additional gross interest income that would have been recorded had our impaired loans been current in accordance with their original terms was approximately $55,000 and $129,000, respectively, for the six and twelve months ended March 31, 2018 and September 30, 2017.
48
Allowance for Loan Losses on Loans. The allowance for loan losses represents a reserve for probable loan losses in the loan portfolio. The adequacy of the allowance for loan losses is evaluated periodically based on a review of all significant loans with particular emphasis on impaired, nonaccrual, past due and other loans that management believes require special attention. The determination of the allowance for loan losses is considered a critical accounting policy.
Additions to the allowance for loan losses are made periodically to maintain the allowance at an appropriate level based on management’s analysis of loss inherent in the loan portfolio. The amount of the provision for loan losses is determined by an evaluation of the level of loans outstanding, loss risk as determined based on a loan grading system, the level of nonperforming loans, historical loss experience, delinquency trends, the amount of losses charged to the allowance in a given period, and an assessment of economic conditions. Management believes the current allowance for loan losses is adequate based on its analysis of the losses in the portfolio.
The Company recorded $382,000 of net recoveries and a $350,000 negative provision for loan losses in the six months ended March 31, 2018, for a net reserve build of $32,000. The following table sets forth activity in our allowance for loan losses for the period indicated.
Six Months Ended March 31, 2018 | |||||||||||||||||||||||||||
1-4 family real estate | Commercial real estate | Commercial | Real estate construction | Consumer and other | Unallocated | Total | |||||||||||||||||||||
Allowance for loan losses: | |||||||||||||||||||||||||||
Beginning balance | $ | 663,061 | $ | 7,820,078 | $ | 776,551 | $ | 482,665 | $ | 196,037 | $ | 1,140,030 | $ | 11,078,422 | |||||||||||||
Charge-offs | (169,370 | ) | (194,204 | ) | (128,926 | ) | — | (7,620 | ) | — | (500,120 | ) | |||||||||||||||
Recoveries | 129,643 | 450,637 | 282,591 | — | 19,730 | — | 882,601 | ||||||||||||||||||||
Provision | 153,950 | (464,452 | ) | (65,870 | ) | 66,684 | (20,821 | ) | (19,491 | ) | (350,000 | ) | |||||||||||||||
Ending balance | $ | 777,284 | $ | 7,612,059 | $ | 864,346 | $ | 549,349 | $ | 187,326 | $ | 1,120,539 | $ | 11,110,903 | |||||||||||||
Amounts allocated to: | |||||||||||||||||||||||||||
Individually evaluated for impairment | $ | 62,092 | $ | 649,353 | $ | — | $ | — | $ | 21,445 | $ | — | $ | 732,890 | |||||||||||||
Other loans not individually evaluated | 715,192 | 6,962,706 | 864,346 | 549,349 | 165,881 | 1,120,539 | 10,378,013 | ||||||||||||||||||||
Ending balance | $ | 777,284 | $ | 7,612,059 | $ | 864,346 | $ | 549,349 | $ | 187,326 | $ | 1,120,539 | $ | 11,110,903 | |||||||||||||
Loans: | |||||||||||||||||||||||||||
Amounts collectively evaluated for impairment | $ | 243,752,840 | $ | 662,105,021 | $ | 102,724,413 | $ | 91,739,392 | $ | 37,433,945 | $ | 1,137,755,611 | |||||||||||||||
Amounts individually evaluated for impairment | 1,071,029 | 8,851,099 | 90,794 | — | 27,383 | 10,040,305 | |||||||||||||||||||||
Amounts related to loans acquired with deteriorated credit quality | 1,689,546 | 11,195,137 | 3,283,578 | — | — | 16,168,261 | |||||||||||||||||||||
Ending balance | $ | 246,513,415 | $ | 682,151,257 | $ | 106,098,785 | $ | 91,739,392 | $ | 37,461,328 | $ | 1,163,964,177 | |||||||||||||||
Our allowance for loan loss methodology is a loan classification-based system. Our allowance for loan losses is segmented into the following four major categories: (1) specific reserves; (2) general allowances for Classified/Watch loans; (3) general allowances for loans with satisfactory ratings; and (4) an unallocated amount. We base the required reserve on a percentage of the loan balance for each type of loan and classification level. Loans may be classified manually and are automatically classified if they are not previously classified when they reach certain levels of delinquency. Unclassified loans are reserved at different percentages based on our loan loss history for the last two years. Reserve percentages are also adjusted based upon our estimate of the effect that the current economic environment will have on each type of loan.
Potential problem loans are loans as to which management has serious doubts about the ability of the borrowers to comply with present repayment terms. Management classifies potential problem loans as either special mention or substandard. Potential problem loans aggregated $36.3 million and $45.7 million at March 31, 2018 and September 30, 2017, respectively, with $14.5 million and $15.1 million classified special mention and $21.8 million and $30.7 million classified substandard at March 31, 2018 and September 30, 2017, respectively.
49
Our largest substandard loan relationship at March 31, 2018 had a balance of $4.5 million. As of March 31, 2018, all loans in the relationship are current and real estate taxes have been paid. The loan relationship is collateralized by income producing properties in Georgia.
The allowance for loan losses represented 780.63% and 649.13% of nonperforming loans at March 31, 2018 and September 30, 2017, respectively. This increase was due to a $356,000 decrease in nonaccruing loans in the six months ended March 31, 2018. The allowance for loan losses as a percentage of total loans was 0.96% at both March 31, 2018 and September 30, 2017. The allowance for loan losses as a percentage of legacy loans approximated 1.15% at March 31, 2018, compared to 1.22% at September 30, 2017. The allowance as a percent of total loans was largely unchanged due to the Company's net recoveries and negative provision combined with small loan growth in the six months ended March 31, 2018. Due to the continuing trend of net recoveries, management recorded a $350,000 negative provision for loan losses during the current six-month period. Management retained an unallocated allowance to maintain the overall allowance at a level reflective of continued economic uncertainties.
Management reviews the adequacy of the allowance for loan losses on a continuous basis. Management considered the allowance for loan losses adequate at March 31, 2018 to absorb probable losses inherent in the loan portfolio. However, adverse economic circumstances or other events, including additional loan review, future regulatory examination findings or changes in borrowers' financial conditions, could result in increased losses in the loan portfolio or in the need for increases in the allowance for loan losses.
Liquidity Management. Liquidity is defined as the ability to meet current and future short-term financial obligations. Our primary sources of funds consist of deposit inflows, advances from the FHLB, loan payments and prepayments, mortgage-backed securities and collateralized mortgage obligations repayments and maturities and sales of loans and other securities. While maturities and scheduled amortization of loans and securities are predictable sources of funds, deposit flows and mortgage prepayments are greatly influenced by market interest rates, economic conditions and competition. Our Asset/Liability Management Committee is responsible for establishing and monitoring our liquidity targets and strategies in order to ensure that sufficient liquidity exists for meeting the borrowing needs of our customers as well as unanticipated contingencies. At March 31, 2018 and September 30, 2017, we had access to immediately available funds of approximately $301.3 million and $280.6 million, respectively, including overnight funds, FHLB borrowing capacity and a Federal Reserve line of credit. Additionally, securities with lendable collateral value of $49.7 million and $86.9 million were available to be pledged at March 31, 2018 and September 30, 2017, respectively. The Company also had $5.0 million of certificates of deposits held at other financial institutions at March 31, 2018. These certificates, of which $746,000 were maturing within the next 90 days at March 31, 2018, could be utilized over time to supplement the liquidity needs of the Company.
As part of the acquisition of CBS, we also assumed a $318,000 letter of credit from the FHLB of Atlanta. We also inherited, as part of the acquisition of Resurgens, two letters of credit totaling $2.9 million. During the six months ended March 31, 2018, the Company ended all three letter of credit arrangements and has no remaining letters of credit with the FHLB of Atlanta.
We regularly adjust our investments in liquid assets based upon our assessment of expected loan demand, expected deposit flows, yields available on interest-earning deposits and securities, and the objectives of our asset/liability management program. Excess liquid assets are invested generally in interest-earning deposits and short- and intermediate-term securities.
Our most liquid assets are cash and cash equivalents. The levels of these assets are subject to our operating, financing, lending and investing activities during any given period. At March 31, 2018, cash and cash equivalents totaled $179.4 million. Securities classified as available-for-sale, which provide additional sources of liquidity, totaled $174.5 million at March 31, 2018. At March 31, 2018, we had $60.0 million in advances outstanding from the FHLB. However, based on available pledged and unpledged collateral other than cash, $92.1 million in additional advances were available as of March 31, 2018.
Our cash flows are derived from operating activities, investing activities and financing activities as reported in our Consolidated Statements of Cash Flows included in our Consolidated Financial Statements.
At March 31, 2018, we had $68.2 million of new loan commitments outstanding, and $103.4 million of unfunded construction and development loans. In addition to commitments to originate loans, we had $81.1 million of unused lines of credit to borrowers. Certificates of deposit due within one year of March 31, 2018 totaled $224.1 million, or 16.6% of total deposits. If these deposits do not remain with us, we will be required to seek other sources of funds, including other certificates of deposit and FHLB advances. Depending on market conditions, we may be required to pay higher rates on such deposits or other borrowings than we currently pay on the certificates of deposit due on or before March 31, 2019. We believe, however, based on past experience that a significant portion of our certificates of deposit will remain with us. We have the ability to attract and retain deposits by adjusting the interest rates offered.
Our primary investing activities are the origination of loans and the purchase of securities. During the six months ended March 31, 2018, we originated $234.6 million of loans and purchased $14.9 million in securities.
50
Financing activities consist primarily of additions to deposit accounts and FHLB advances. We experienced an increase in total deposits of $10.1 million for the six months ended March 31, 2018, primarily due to an increase in transaction accounts of $28.0 million. Deposit flows are affected by the overall level of interest rates, the interest rates and products offered by us and our local competitors and other factors.
Liquidity management is both a daily and long-term function of business management. If we require funds beyond our ability to generate them internally, borrowing agreements exist with the FHLB which provides an additional source of funds. FHLB advances have been used primarily to fund loan demand and to purchase securities.
Capital Management and Resources. The Bank and the Company are subject to various regulatory capital requirements, including a risk-based capital measure. The risk-based capital guidelines include both a definition of capital and a framework for calculating risk-weighted assets by assigning balance sheet assets and off-balance sheet items to broad risk categories. Our regulatory capital ratios currently reflect the incorporation of Basel III and these changes had a minor impact on our capital ratios. The net result of the acquisition of Resurgens was an upstream of $2.7 million from the Bank to the holding company during the fourth quarter of fiscal 2017, which is reflected in these ratios at March 31, 2018 and September 30, 2017, respectively. At March 31, 2018, the Bank and the Company exceeded all regulatory capital requirements. The Bank and the Company are considered “well capitalized” under regulatory guidelines.
Actual | For Capital Adequacy Purposes | To be Well Capitalized Under Prompt Corrective Action Provisions | |||||||||||||||||||
Amount | Ratio | Amount | Ratio | Amount | Ratio | ||||||||||||||||
(dollars in thousands) | |||||||||||||||||||||
March 31, 2018 | |||||||||||||||||||||
Total risk-based capital (to risk-weighted assets): | |||||||||||||||||||||
Charter Financial Corporation | $ | 199,921 | 16.14 | % | $ | 99,064 | 8.00 | % | $ | 123,830 | 10.00 | % | |||||||||
CharterBank | 185,384 | 14.98 | 98,982 | 8.00 | 123,728 | 10.00 | |||||||||||||||
Tier 1 risk-based capital (to risk-weighted assets): | |||||||||||||||||||||
Charter Financial Corporation | 188,811 | 15.25 | 74,298 | 6.00 | 99,064 | 8.00 | |||||||||||||||
CharterBank | 174,274 | 14.09 | 74,237 | 6.00 | 98,982 | 8.00 | |||||||||||||||
Common equity tier 1 risk-based capital (to risk-weighted assets): | |||||||||||||||||||||
Charter Financial Corporation | 182,018 | 14.70 | 55,724 | 4.50 | 80,490 | 6.50 | |||||||||||||||
CharterBank | 174,274 | 14.09 | 55,677 | 4.50 | 80,423 | 6.50 | |||||||||||||||
Tier 1 leverage (to average assets): | |||||||||||||||||||||
Charter Financial Corporation | 188,811 | 11.83 | 63,823 | 4.00 | 79,779 | 5.00 | |||||||||||||||
CharterBank | 174,274 | 10.94 | 63,700 | 4.00 | 79,625 | 5.00 | |||||||||||||||
September 30, 2017 | |||||||||||||||||||||
Total risk-based capital (to risk-weighted assets): | |||||||||||||||||||||
Charter Financial Corporation | $ | 190,900 | 15.79 | % | $ | 96,711 | 8.00 | % | $ | 120,889 | 10.00 | % | |||||||||
CharterBank | 174,269 | 14.45 | 96,484 | 8.00 | 120,605 | 10.00 | |||||||||||||||
Tier 1 risk-based capital (to risk-weighted assets): | |||||||||||||||||||||
Charter Financial Corporation | 179,822 | 14.87 | 72,534 | 6.00 | 96,711 | 8.00 | |||||||||||||||
CharterBank | 163,191 | 13.53 | 72,363 | 6.00 | 96,484 | 8.00 | |||||||||||||||
Common equity tier 1 risk-based capital (to risk-weighted assets): | |||||||||||||||||||||
Charter Financial Corporation | 173,097 | 14.32 | 54,400 | 4.50 | 78,578 | 6.50 | |||||||||||||||
CharterBank | 163,191 | 13.53 | 54,272 | 4.50 | 78,393 | 6.50 | |||||||||||||||
Tier 1 leverage (to average assets): | |||||||||||||||||||||
Charter Financial Corporation | 179,822 | 12.05 | 59,709 | 4.00 | 74,636 | 5.00 | |||||||||||||||
CharterBank | 163,191 | 10.96 | 59,575 | 4.00 | 74,469 | 5.00 | |||||||||||||||
Effective as of January 1, 2016, the Company and its subsidiary bank must maintain a capital conservation buffer to avoid restrictions on capital distributions or discretionary bonus payments. This buffer must consist solely of Common Equity Tier 1 Capital, but the buffer applies to all three measurements (Common Equity Tier 1, Tier 1 capital and total capital) in addition to
51
the minimum risk-based capital requirements. The capital conservation buffer required for 2018 is common equity equal to 1.875% of risk-weighted assets and will increase by .625% per year until reaching 2.5% beginning January 1, 2019.
Off-Balance Sheet Arrangements. In the normal course of operations, we engage in a variety of financial transactions that, in accordance with generally accepted accounting principles, are not recorded in our consolidated financial statements. These transactions involve, to varying degrees, elements of credit, interest rate and liquidity risk. Such transactions are used primarily to manage customers’ requests for funding and take the form of loan commitments and lines of credit.
For the six months ended March 31, 2018, we did not engage in any off-balance sheet transactions reasonably likely to have a material effect on our financial condition, results of operations or cash flows.
Non-GAAP Financial Measures
The measures entitled total core deposits, tangible book value per share, tangible common equity ratio, return on average tangible equity and interest income less purchase discount accretion are not measures recognized under GAAP and therefore are considered non-GAAP financial measures. The most comparable GAAP measures to these measures are total deposits, book value per share, total equity to total assets, return on average equity and total interest income, respectively.
Management uses these non-GAAP financial measures to assess the performance of the Company's business and the strength of its capital position. The Company believes that these non-GAAP financial measures provide meaningful additional information to assist management, investors and bank regulators in evaluating the Company's operating results, financial strength and capitalization and to permit investors to assess the performance of the Company on the same basis as that used by management. The non-GAAP financial measures should be considered as additional views of the way our financial measures are affected by significant items and other factors. Statements including non-GAAP financial measures should be read along with the accompanying tables which provide a reconciliation of non-GAAP financial measures to GAAP financial measures.
52
For the Quarters Ended | |||||||||||||||||||
3/31/2018 | 12/31/2017 | 9/30/2017 | 6/30/2017 | 3/31/2017 | |||||||||||||||
Total Core Deposits | |||||||||||||||||||
Total deposits | $ | 1,349,260,830 | $ | 1,343,997,345 | $ | 1,339,143,287 | $ | 1,194,253,739 | $ | 1,201,731,475 | |||||||||
Retail certificates of deposit $250,000 and over | 50,060,752 | 52,196,679 | 54,479,571 | 41,267,481 | 39,602,132 | ||||||||||||||
Wholesale certificates of deposit | 34,153,197 | 36,827,040 | 39,201,460 | 36,804,579 | 36,793,666 | ||||||||||||||
Total core deposits (Non-GAAP) | $ | 1,265,046,881 | $ | 1,254,973,626 | $ | 1,245,462,256 | $ | 1,116,181,679 | $ | 1,125,335,677 | |||||||||
Tangible Book Value Per Share | |||||||||||||||||||
Book value per share | $ | 14.64 | $ | 14.42 | $ | 14.17 | $ | 14.03 | $ | 13.84 | |||||||||
Effect to adjust for goodwill and other intangible assets | (2.81 | ) | (2.83 | ) | (2.84 | ) | (2.11 | ) | (2.14 | ) | |||||||||
Tangible book value per share (Non-GAAP) | $ | 11.83 | $ | 11.59 | $ | 11.33 | $ | 11.92 | $ | 11.70 | |||||||||
Tangible Common Equity Ratio | |||||||||||||||||||
Total equity to total assets | 13.40 | % | 13.27 | % | 13.06 | % | 14.33 | % | 14.04 | % | |||||||||
Effect to adjust for goodwill and other intangible assets | (2.29 | ) | (2.31 | ) | (2.34 | ) | (1.90 | ) | (1.90 | ) | |||||||||
Tangible common equity ratio (Non-GAAP) | 11.11 | % | 10.96 | % | 10.72 | % | 12.43 | % | 12.14 | % | |||||||||
Return On Average Tangible Equity | |||||||||||||||||||
Return on average equity | 9.56 | % | 8.10 | % | 4.77 | % | 6.65 | % | 6.40 | % | |||||||||
Effect to adjust for goodwill and other intangible assets | 2.30 | 2.00 | 0.95 | 1.19 | 1.18 | ||||||||||||||
Return on average tangible equity (Non-GAAP) | 11.86 | % | 10.10 | % | 5.72 | % | 7.84 | % | 7.58 | % | |||||||||
Interest Income Less Purchase Discount Accretion | |||||||||||||||||||
Total interest income | $ | 16,664,323 | $ | 16,279,831 | $ | 15,062,071 | $ | 13,626,887 | $ | 13,306,800 | |||||||||
Purchase discount accretion | 798,722 | 335,154 | 486,471 | 173,014 | 358,031 | ||||||||||||||
Interest income less purchase discount accretion (Non-GAAP) | $ | 15,865,601 | $ | 15,944,677 | $ | 14,575,600 | $ | 13,453,873 | $ | 12,948,769 | |||||||||
53
For the Six Months Ended | |||||||
3/31/2018 | 3/31/2017 | ||||||
Total Core Deposits | |||||||
Total deposits | $ | 1,349,260,830 | $ | 1,201,731,475 | |||
Retail certificates of deposit $250,000 and over | 50,060,752 | 39,602,132 | |||||
Wholesale certificates of deposit | 34,153,197 | 36,793,666 | |||||
Total core deposits (Non-GAAP) | $ | 1,265,046,881 | $ | 1,125,335,677 | |||
Tangible Book Value Per Share | |||||||
Book value per share | $ | 14.64 | $ | 13.84 | |||
Effect to adjust for goodwill and other intangible assets | (2.81 | ) | (2.14 | ) | |||
Tangible book value per share (Non-GAAP) | $ | 11.83 | $ | 11.70 | |||
Tangible Common Equity Ratio | |||||||
Total equity to total assets | 13.40 | % | 14.04 | % | |||
Effect to adjust for goodwill and other intangible assets | (2.29 | ) | (1.90 | ) | |||
Tangible common equity ratio (Non-GAAP) | 11.11 | % | 12.14 | % | |||
Return On Average Tangible Equity | |||||||
Return on average equity | 8.84 | % | 8.11 | % | |||
Effect to adjust for goodwill and other intangible assets | 2.15 | 1.51 | |||||
Return on average tangible equity (Non-GAAP) | 10.99 | % | 9.62 | % | |||
Interest Income Less Purchase Discount Accretion | |||||||
Total interest income | $ | 32,944,154 | $ | 27,172,403 | |||
Purchase discount accretion | 1,133,876 | 1,082,140 | |||||
Interest income less purchase discount accretion (Non-GAAP) | $ | 31,810,278 | $ | 26,090,263 | |||
Item 3. Quantitative and Qualitative Disclosures About Market Risk
Qualitative Aspects of Market Risk. The Company’s most significant form of market risk is interest rate risk. We manage the interest rate sensitivity of our interest-bearing liabilities and interest-earning assets in an effort to minimize the adverse effects of changes in the interest rate environment. Deposit accounts typically react more quickly to changes in market interest rates than mortgage loans because of the shorter maturities of deposits. As a result, sharp increases in interest rates may adversely affect our earnings. We employ several strategies to manage the interest rate risk inherent in our mix of assets and liabilities, including:
• | selling fixed rate mortgages that we originate to both the primary and secondary market; |
• | maintaining the diversity of our existing loan portfolio by originating commercial real estate and consumer loans, which typically have adjustable rates and/or shorter terms than residential mortgages; |
• | emphasizing loans with adjustable interest rates; |
• | maintaining fixed rate borrowings from the FHLB of Atlanta; and |
• | increasing retail transaction deposit accounts, which typically have long durations. |
We have an Asset/Liability Management Committee to communicate, coordinate and control all aspects involving asset/liability management. The committee establishes and monitors the volume, maturities, pricing and mix of assets and funding sources with the objective of managing assets and funding sources to provide results that are consistent with liquidity, growth, risk limits and profitability goals.
Quantitative Aspects of Market Risk. We compute the amounts by which the difference between the present value of an institution's assets and liabilities (the institution's net portfolio value or “NPV”) would change in the event of a range of assumed changes in market interest rates. Our simulation model uses a discounted cash flow analysis to measure the interest rate sensitivity of NPV. Depending on current market interest rates we historically have estimated the economic value of these assets and liabilities under the assumption that interest rates experience an instantaneous and sustained increase of 100, 200, or 300 basis points, or a decrease of 100 and 200 basis points. A basis point equals one-hundredth of one percent, and 100 basis points equals one percent. An increase in interest rates from 3% to 4% would mean, for example, a 100 basis point increase in the “Change in Interest Rates”
54
column below. Given the current relatively low level of market interest rates, a NPV calculation for an interest rate decrease of greater than 100 basis points has not been prepared.
The table below sets forth, as of March 31, 2018, our calculation of the estimated changes in the Bank’s net portfolio value that would result from the designated instantaneous parallel shift in the interest rate yield curve.
Change in Interest Rates (bp) (1) | Estimated NPV (2) | Estimated Increase (Decrease) in NPV | Percentage Change in NPV | NPV Ratio as a Percent of Present Value of Assets (3)(4) | Increase (Decrease) in NPV Ratio as a Percent or Present Value of Assets (3)(4) | |||||||||
(dollars in thousands) | ||||||||||||||
300 | $ | 320,510 | $ | 18,556 | 6.1% | 19.5% | 1.1% | |||||||
200 | $ | 315,199 | $ | 13,245 | 4.4% | 19.2% | 0.8% | |||||||
100 | $ | 309,145 | $ | 7,192 | 2.4% | 18.8% | 0.4% | |||||||
— | $ | 301,954 | $ | — | —% | 18.4% | —% | |||||||
(100) | $ | 284,321 | $ | (17,633 | ) | (5.8)% | 17.3% | (1.1)% | ||||||
__________________________________
(1) | Assumes an instantaneous uniform change in interest rates at all maturities. |
(2) | NPV is the difference between the present value of an institution’s assets and liabilities. |
(3) | Present value of assets represents the discounted present value of incoming cash flows on interest-earning assets. |
(4) | NPV Ratio represents NPV divided by the present value of assets. |
The table above indicates that at March 31, 2018, in the event of a 200 basis point increase in interest rates, we would experience a 4.4% increase in net portfolio value. In the event of a 100 basis point decrease in interest rates, we would experience a 5.8% decrease in net portfolio value. Additionally, our internal policy states that our minimum NPV of estimated present value of assets and liabilities shall range from a low of 5.5% for a 300 basis point change in rates to 7.5% for no change in interest rates. As of March 31, 2018, we were in compliance with our Board approved policy limits with an 19.5% NPV in the event of an increase of 300 basis points and 18.4% at current rates.
The effects of interest rates on net portfolio value and net interest income are not predictable. Computations of prospective effects of hypothetical interest rate changes are based on numerous assumptions, including relative levels of market interest rates, prepayments, and deposit run-offs, and should not be relied upon as indicative of actual results. Certain shortcomings are inherent in these computations. Although some assets and liabilities may have similar maturity or periods of repricing, they may react at different times and in different degrees to changes in market interest rates. Rates on other types of assets and liabilities may lag behind changes in market interest rates. Assets, such as adjustable rate mortgages, generally have features that restrict changes in interest rates on a short-term basis and over the life of the asset. After a change in interest rates, prepayments and early withdrawal levels could deviate significantly from those assumed in making the calculations set forth above. Additionally, increased credit risk may result if our borrowers are unable to meet their repayment obligations as interest rates increase.
Item 4. Controls and Procedures
The Company’s management, including the Company’s principal executive officer and principal financial officer, have evaluated the effectiveness of the Company’s “disclosure controls and procedures,” as such term is defined in Rule 13a-15(e) promulgated under the Securities Exchange Act of 1934, as amended (the “Exchange Act”). Based upon their evaluation, the principal executive officer and principal financial officer concluded that, as of the end of the period covered by this report, the Company’s disclosure controls and procedures were effective for the purpose of ensuring that the information required to be disclosed in the reports that the Company files or submits under the Exchange Act with the Securities and Exchange Commission (the “SEC”) (1) is recorded, processed, summarized and reported within the time periods specified in the SEC’s rules and forms, and (2) is accumulated and communicated to the Company’s management, including its principal executive and principal financial officers, as appropriate to allow timely decisions regarding required disclosure. In addition, no change in the Company’s internal control over financial reporting occurred during the quarter ended March 31, 2018, that has materially affected, or is reasonably likely to materially affect, the Company’s internal control over financial reporting.
55
PART II. OTHER INFORMATION
Item 1. Legal Proceedings
From time to time, we may be party to various legal proceedings incident to our business. At March 31, 2018, we were not a party to any pending legal proceedings that we believe would have a material adverse effect on our financial condition, results of operations or cash flows.
Item 1A. Risk Factors
Risk factors that may affect future results were discussed in the Company’s Annual Report on Form 10-K for the fiscal year ended September 30, 2017 and in Charter Financial’s other filings with the Securities and Exchange Commission. The risks described in our Annual Report on Form 10-K and other filings are not the only risks that we face. Additional risks and uncertainties not currently known to us or that we currently deem to be immaterial also may materially adversely affect our business, financial condition and/or operating results. The risk factor in our 2017 Form 10-K entitled "A reduction in future corporate tax rates could have a material impact on the value of our deferred tax assets." is no longer applicable, as the Tax Cuts and Jobs Act was passed by both houses of Congress on December 20, 2017, and signed into law by the President on December 22, 2017. As a result, the Company reduced the value of its net Deferred Tax Asset by $49,000 and $1.5 million, with the revaluation charge taken as an increase to income tax expense for the three and six months ended March 31, 2018, respectively. See Note 11: Income Taxes and Management's Discussion and Analysis of Financial Condition and Results of Operations for further information. Except for the changes described above and below in this Item 1A, we do not believe that there have been any material changes to the risk factors disclosed in Item 1A. of Part I in our Annual Report on Form 10-K for the year ended September 30, 2017.
Because the market price of CenterState common stock will fluctuate, the Company's stockholders cannot be certain of the market value of the merger consideration they will receive.
Upon completion of the Merger, the Company's stockholders will receive 0.738 shares of CenterState common stock and $2.30 for each share of Company common stock. The market value of the merger consideration may vary from the closing price of CenterState common stock on the date the parties announced the merger. Any change in the market price of CenterState common stock prior to the completion of the Merger will affect the market value of the merger consideration that the Company's stockholders will receive upon completion of the Merger. There will be no adjustment to the merger consideration for changes in the market price of either shares of CenterState common stock or shares of the Company's common stock, unless CenterState's average closing price for a 20-day trading period falls by more than 15% below $28.05 and CenterState's average closing price over such period also underperforms the KBW Regional Bank Index by more than 15%, but only if the Company elects to terminate the Merger Agreement and CenterState elects to increase the merger consideration as result to cause the termination not to be effective.
The market price of CenterState common stock after the Merger may be affected by factors different from those affecting shares of the Company or CenterState currently.
Upon completion of the Merger, holders of the Company's common stock will become holders of CenterState common stock. CenterState's business differs in important respects from that of the Company, and, accordingly, the results of operations of the combined company and market price of CenterState common stock after the completion of the Merger may be affected by factors different from those currently affecting the independent results of operations of each of CenterState and the Company.
The Merger Agreement with CenterState Bank Corporation may be terminated in accordance with its terms and the Merger may not be completed, which could negatively impact the Company and its stockholders.
The Merger Agreement is subject to a number of conditions which must be fulfilled in order to complete the Merger. Those conditions include: approval of the Merger Agreement by Company stockholders, receipt of requisite regulatory approvals, absence of orders prohibiting completion of the Merger, the continued accuracy of the representations and warranties by both parties and the performance by both parties of their covenants and agreements. If these and other conditions to the closing of the Merger are not fulfilled, then the Merger may not be completed. In addition, either CenterState or the Company may choose not to proceed with the Merger in certain circumstances, and the parties can mutually decide to terminate the Merger Agreement at any time, before or after stockholder approval.
If the Merger Agreement is terminated, the Company's business may be adversely impacted by the failure to pursue other beneficial opportunities due to the focus of management on the Merger. In addition, if the Merger Agreement is terminated, the market price of Company common stock might decline to the extent that the current market price reflects a market assumption that the Merger will be completed. If the Merger Agreement is terminated and the Company's board of directors seeks another merger or business combination, Company stockholders cannot be certain that the Company will be able to find a party willing to offer equivalent or more attractive consideration than the consideration CenterState has agreed to provide in the Merger. If the
56
Merger Agreement is terminated under certain circumstances, the Company may be required to pay a termination fee of $14.5 million to CenterState.
The Company will be subject to business uncertainties and contractual restrictions while the Merger is pending.
The Company will be subject to certain business uncertainties and contractual restrictions while the Merger is pending. Employee and customer uncertainty about the effects of the transaction may have an adverse effect on the Company and consequently on CenterState. These uncertainties may impair the Company's ability to attract, retain and motivate key personnel until the Merger is completed, and could cause customers and others that deal with the Company to seek to change existing business relationships with the Company. Retention of certain employees may be challenging during the pending period of the Merger. If key employees depart because of the issues relating to the uncertainty and difficulty of integration or a desire not to remain with the combined company, the Company's business could be negatively impacted. In addition, the Merger Agreement restricts the Company from making certain acquisitions and taking other specified actions until the Merger occurs without the consent of CenterState. These restrictions may prevent the Company from pursuing attractive business opportunities that may arise prior to the completion of the Merger.
Legal proceedings in connection with the Merger could delay or prevent the completion of the Merger.
If the Company or CenterState is the subject of litigation that is related to the Merger, it could cause the Company to incur substantial expenditures, generate adverse publicity and could delay or prevent the Merger. Defense of any lawsuit, even if successful, could require substantial time and attention of the Company's management and could require the expenditure of significant amounts for legal fees and other related costs, which could have a material adverse effect on the business, financial condition and results of operations of the Company.
Item 2. Unregistered Sales of Equity Securities and Use of Proceeds
(a) | Not applicable |
(b) | Not applicable |
(c) | During the quarter ended March 31, 2018, the Company did not repurchase any shares as part of its publicly announced share repurchase program. In December 2015, the Company's Board of Directors approved a stock repurchase program, the fifth approved and announced program since December 2013, allowing the repurchase of up to 800,000 shares, or approximately 5% of the Company's outstanding shares. As of March 31, 2018, 192,427 shares remain available to be repurchased under the December 2015 repurchase program. Since fiscal 2014, 8,104,150 shares have been repurchased at a total cost of approximately $91.9 million. |
Item 3. Defaults Upon Senior Securities
None.
Item 4. Mine Safety Disclosures
Not applicable.
Item 5. Other Information
None.
57
Item 6. Exhibits
Exhibit No. | Description | |
Agreement and Plan of Merger, dated as of December 3, 2015, by and among Charter Financial Corporation, CHFN Merger Sub, LLC and CBS Financial Corporation (1) | ||
Agreement and Plan of Merger, dated as of June 1, 2017, by and among Charter Financial Corporation, Charter Merger Sub, LLC and Resurgens Bancorp (2) | ||
Agreement and Plan of Merger, dated as of April 24, 2018, by and among Charter Financial Corporation and CenterState Bank Corporation | ||
Articles of Incorporation of Charter Financial Corporation (3) | ||
Bylaws of Charter Financial Corporation (4) | ||
Specimen Stock Certificate of Charter Financial Corporation (5) | ||
Rule 13a-14(a)/15d-14(c) Certification of Chief Executive Officer | ||
Rule 13a-14(a)/15d-14(c) Certification of Chief Financial Officer | ||
Section 1350 Certifications | ||
101 | Interactive data files pursuant to Rule 405 of Regulation S-T: (i) the Condensed Consolidated Statements of Financial Condition as of March 31, 2018 and September 30, 2017, (ii) the Unaudited Condensed Consolidated Statements of Income for the three and six months ended March 31, 2018 and 2017, (iii) the Unaudited Condensed Consolidated Statement of Changes in Stockholders’ Equity for the six months ended March 31, 2018 (iv) the Unaudited Condensed Consolidated Statements of Comprehensive Income for the three and six months ended March 31, 2018 and 2017, (v) the Unaudited Condensed Consolidated Statements of Cash Flows for the six months ended March 31, 2018 and 2017, and (vi) the Notes to the Unaudited Condensed Consolidated Financial Statements. | |
__________________________________
(1) | Incorporated by reference to Exhibit 2.1 to the Form 10-Q of Charter Financial Corporation, a Maryland corporation, originally filed with the Securities and Exchange Commission on February 8, 2016. |
(2) | Incorporated by reference to Exhibit 2.1 to the Form 8-K of Charter Financial Corporation, a Maryland corporation, originally filed with the Securities and Exchange Commission on June 1, 2017. |
(3) | Incorporated by reference to Exhibit 3.1 to the Registration Statement on Form S-1 (File No. 333-185482) of Charter Financial Corporation, a Maryland corporation, originally filed with the Securities and Exchange Commission on December 14, 2012. |
(4) | Incorporated by reference to Exhibit 3.2 to the Registration Statement on Form S-1 (File No. 333-185482) of Charter Financial Corporation, a Maryland corporation, originally filed with the Securities and Exchange Commission on December 14, 2012. |
(5) | Incorporated by reference to Exhibit 4.0 to the Registration Statement on Form S-1 (File No. 333-185482) of Charter Financial Corporation, a Maryland corporation, originally filed with the Securities and Exchange Commission on December 14, 2012. |
58
Signatures
Pursuant to the requirements of the Securities Exchange Act of 1934, the registrant has duly caused this report to be signed on its behalf by the undersigned thereunto duly authorized.
CHARTER FINANCIAL CORPORATION | ||||
Date: | May 9, 2018 | By: | /s/ Robert L. Johnson | |
Robert L. Johnson | ||||
Chairman and Chief Executive Officer | ||||
Date: | May 9, 2018 | By: | /s/ Curtis R. Kollar | |
Curtis R. Kollar | ||||
Senior Vice President and Chief Financial Officer | ||||
59