Attached files
| file | filename |
|---|---|
| EX-23 - CONSENT OF INDEPENDENT REGISTERED PUBLIC ACCOUNTING FIRM - CA, INC. | ca-ex23_20180331.htm |
| EX-32 - CERTIFICATION PURSUANT TO 906 - CA, INC. | ca-ex32_20180331.htm |
| EX-31.2 - CERTIFICATION OF THE CFO PURSUANT TO 302 - CA, INC. | ca-ex312_20180331.htm |
| EX-31.1 - CERTIFICATION OF THE CEO PURSUANT TO 302 - CA, INC. | ca-ex311_20180331.htm |
| EX-24 - POWER OF ATTORNEY - CA, INC. | ca-ex24_20180331.htm |
| EX-21 - SUBSIDIARIES OF THE REGISTRANT - CA, INC. | ca-ex21_20180331.htm |
| EX-12 - STATEMENT OF RATIOS OF EARNINGS TO FIXED CHARGES - CA, INC. | ca-ex12_20180331.htm |
| EX-10.58 - FORM OF EXECUTIVE RESTRICTED STOCK AGREEMENT UNDER CA, INC. 2011 INCENTIVE PLAN - CA, INC. | ca-ex1058_20180331.htm |
| EX-10.52 - AMENDED AND RESTATED TERM LOAN AGREEMENT - CA, INC. | ca-ex1052_20180331.htm |
| EX-10.49 - SCHEDULES A, B AND C TO CA, INC. CHANGE IN CONTROL SEVERANCE POLICY - CA, INC. | ca-ex1049_20180331.htm |
UNITED STATES
SECURITIES AND EXCHANGE COMMISSION
WASHINGTON, D.C. 20549
FORM 10-K
(Mark One) | |
ü | Annual Report Pursuant To Section 13 or 15(d) of the Securities Exchange Act of 1934 |
For the fiscal year ended March 31, 2018 | |
OR | |
Transition Report Pursuant to Section 13 or 15(d) of the Securities Exchange Act of 1934 | |
Commission file number 1-9247
CA, Inc.
(Exact name of registrant as specified in its charter)
Delaware | 13-2857434 | |
(State or Other Jurisdiction of Incorporation or Organization) | (I.R.S. Employer Identification Number) | |
520 Madison Avenue, New York, New York | 10022 | |
(Address of Principal Executive Offices) | (Zip Code) | |
1-800-225-5224
(Registrant’s telephone number, including area code)
Securities registered pursuant to Section 12(b) of the Act:
(Title of each class) | (Name of each exchange on which registered) | |
Common Stock, par value $0.10 per share Stock Purchase Rights Preferred Stock, Class A | The NASDAQ Stock Market LLC The NASDAQ Stock Market LLC | |
Securities registered pursuant to Section 12(g) of the Act:
None
Indicate by check mark if the registrant is a well-known seasoned issuer, as defined in Rule 405 of the Securities Act. Yes ü No
Indicate by check mark if the registrant is not required to file reports pursuant to Section 13 or Section 15(d) of the Exchange Act. Yes No ü
Indicate by check mark whether the registrant (1) has filed all reports required to be filed by Section 13 or 15(d) of the Securities Exchange Act of 1934 during the preceding 12 months (or for such shorter period that the registrant was required to file such reports), and (2) has been subject to such filing requirements for the past 90 days. Yes ü No
Indicate by check mark whether the registrant has submitted electronically and posted on its corporate Web site, if any, every Interactive Data File required to be submitted and posted pursuant to Rule 405 of Regulation S-T during the preceding 12 months (or for such shorter period that the registrant was required to submit and post such files). Yes ü No
Indicate by check mark if disclosure of delinquent filers pursuant to Item 405 of Regulation S-K is not contained herein, and will not be contained, to the best of registrant’s knowledge, in definitive proxy or information statements incorporated by reference in Part III of this Form 10-K or any amendment to this Form 10-K.
Indicate by check mark whether the registrant is a large accelerated filer, an accelerated filer, a non-accelerated filer, or a smaller reporting company. See the definitions of “large accelerated filer,” “accelerated filer” and “smaller reporting company” in Rule 12b-2 of the Exchange Act.
Large accelerated filer ü Accelerated filer Non-accelerated filer Smaller reporting company
If an emerging growth company, indicate by check mark if the registrant has elected not to use the extended transition period for complying with any new or revised financial accounting standards provided pursuant to Section 13(a) of the Exchange Act.
Indicate by check mark whether the registrant is a shell company (as defined in Rule 12b-2 of the Exchange Act). Yes No ü
The aggregate market value of the common stock held by non-affiliates of the registrant as of September 29, 2017 (the last business day of the registrant’s most recently completed second fiscal quarter) was approximately $10.3 billion based on the closing price of $33.38 on the NASDAQ Stock Market LLC on that date.
The number of shares of each of the registrant’s classes of common stock outstanding at May 2, 2018 was 416,617,226 shares of common stock, par value $0.10 per share.
Documents Incorporated by Reference:
Part III: Portions of the Proxy Statement to be issued in conjunction with the registrant’s 2018 Annual Meeting of Stockholders.
CA, Inc.
Table of Contents
Part I | |
Part II | |
Part III | |
Part IV | |
2
This Annual Report on Form 10-K (“Form 10-K”) contains certain forward-looking information relating to CA, Inc. (which we refer to as the “Company,” “Registrant,” “CA Technologies,” “CA,” “we,” “our,” or “us”) that is based on the beliefs of, and assumptions made by, our management as well as information currently available to management. When used in this Form 10-K, the words “believes,” “plans,” “anticipates,” “expects,” “estimates,” “targets,” and similar expressions relating to the future are intended to identify forward-looking information. Forward-looking information includes, for example, not only the statements relating to the future made under the caption “Management’s Discussion and Analysis of Financial Condition and Results of Operations” under Item 7, but also statements relating to the future that appear in other parts of this Form 10-K. This forward-looking information reflects our current views with respect to future events and is subject to certain risks, uncertainties, and assumptions, some of which are described under the caption “Risk Factors” in Part I, Item 1A and elsewhere in this Form 10-K. Should one or more of these risks or uncertainties occur, or should our assumptions prove incorrect, actual results may vary materially from the forward-looking information described in this Form 10-K as believed, planned, anticipated, expected, estimated, targeted or similarly identified. We do not intend to update these forward-looking statements.
The product and service names mentioned in this Form 10-K are used for identification purposes only and may be protected by trademarks, trade names, service marks and/or other intellectual property rights of the Company and/or other parties in the United States and/or other jurisdictions. The absence of a specific attribution in connection with any such mark does not constitute a waiver of any such right. All other trademarks, trade names, service marks and logos referenced herein belong to their respective companies.
References in this Form 10-K to fiscal 2018, fiscal 2017, fiscal 2016, fiscal 2015, etc. are to our fiscal years ended on March 31, 2018, 2017, 2016, 2015, etc., respectively.
3
Part I
Item 1. Business.
Overview
CA Technologies is a global leader in software solutions that simplify complex enterprise environments. Our solutions enable customers to plan, develop, automate, manage and secure applications across mobile, cloud, distributed and mainframe platforms. Many of the largest companies in the world, including most of the Fortune 500 and many government agencies, rely on CA software to help manage and secure their hybrid cloud environments.
Our mission is to eliminate the barriers between ideas and business outcomes. To achieve this, we have built a portfolio of solutions that enable customers to leverage the benefits of agility, automation, insights and security in managing business processes and technology investments. Customers are transforming their businesses to better manage the market demands for speed, exceptional customer experience and rich analytics. We believe this journey, broadly referred to as digital transformation, is fueled by software.
Operating Segments
In fiscal 2018, our business was organized in three distinct but highly complementary operating segments: Enterprise Solutions, Mainframe Solutions and Services. These also represented the operating segments used by our Chief Executive Officer for evaluating our performance and allocating resources.
• | Our Enterprise Solutions segment includes a broad range of software planning, development, and management tools. More specifically, our solutions help customers with secure application development, infrastructure management, automation, and identity-centric security solutions. These products are designed for mobile, cloud, and distributed computing environments and run on industry standard servers. |
• | Our Mainframe Solutions segment includes solutions for the IBM z Systems® platform, which runs many of our largest customers’ mission critical business applications. Our Mainframe Solutions help customers improve economics by increasing throughput and lowering cost per transaction, increasing business agility through DevOps tooling and processes, increasing reliability and availability of operations through machine intelligence and automation solutions, and protecting enterprise data with security and compliance. |
• | Our Services segment helps customers reach their information technology (“IT”) and business goals primarily by enabling the rapid implementation and adoption of our software solutions. Our Services team consists of experienced professionals who provide a variety of services, such as consulting, implementation, application management services, education and support services, to both commercial and government customers. With approximately 900 certified consultants, architects, project managers and advisors located in 31 countries and an extensive partner ecosystem, CA Services works with customers to navigate complex business and technology challenges. |
Our segments strengthen each other in several ways. Our customers benefit from the ability of CA solutions to span their entire infrastructure stack, across mobile, cloud, distributed, and mainframe. This is critical as customers focus on their end users’ experiences on their apps and the underlying transactions that traverse their heterogeneous environments. CA is one of the few companies positioned to deliver solutions that span mobile, cloud, open systems and mainframe environments. This hybrid cloud capability helps customers remove the barriers between ideas and business outcomes. We are able to bidirectionally leverage our core strengths and development efforts in our products within the Enterprise Solutions segment to bring new innovations to the Mainframe Solutions segment and vice versa. Our strong market position enables our investment in development, innovation and support of the mainframe platform to be among the largest in the industry, which sustains ongoing customer commitment to our Mainframe Solutions. We leverage our core strengths and development efforts across platforms, allowing customers to apply automation that improves quality and efficiency while enabling flexibility to optimize their technology assets. Our solutions help customers bridge their historical investments to the frameworks and architectures they are building for the future. Our Services segment leverages our expertise across our Mainframe Solutions and Enterprise Solutions segments and helps customers deploy and maintain our solutions. Refer to Note 16, “Segment and Geographic Information,” in the Notes to the Consolidated Financial Statements for financial data pertaining to our segment and geographic operations.
Focus of Our Business
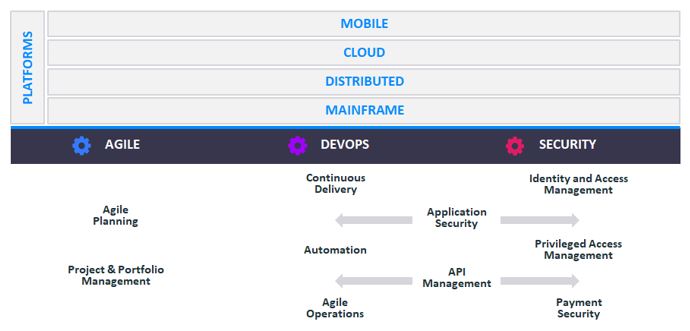
The focus of our business is aligned around three strategic pillars: Agile, DevOps and Security, each of which contain portfolios of solutions spanning the continuum of platforms, from mobile to mainframe.
4
Agile
Our Agile portfolio defines how work is planned, executed and serviced to deliver rapid value to our customers, and enables customers to plan, deliver, manage and optimize application development and project management. Our capabilities within Agile include:
• | Agile Planning helps customers transform their development practices from traditional to modern agile methodologies. Agile development utilizes an iterative work cadence with a feedback loop that decreases time-to-market, increases product quality and, most importantly, maintains a focus on generating rapid business value. CA’s cloud-based solutions in this space help customers to collaboratively plan, prioritize and track agile software development at scale. |
• | Project & Portfolio Management, which is highly complementary to Agile Planning, enables customers to collect, prioritize, plan and deliver products, services and customer experiences. CA’s solutions improve decision making processes and resource optimizations, and decrease project execution risk. |
DevOps
Our DevOps portfolio accelerates software delivery and enables customers to more efficiently deliver and manage applications and infrastructure. The portfolio empowers developers with a rich set of tools that help simplify, automate, and make their processes and applications more robust. They enable better experiences for developers and for the end users of their higher quality applications. Our DevOps portfolio strategy is platform agnostic, providing customers the flexibility to optimize workloads across mobile, cloud, on-premise, and mainframe environments. Our capabilities within DevOps include:
• | Continuous Delivery optimizes the application development processes by automating the deployment of applications across all stages of their lifecycles. Continuous delivery is key to transforming the technical aspects of software delivery. Our solutions enable the development, testing and release teams to work concurrently and continuously to remove the excess overhead and delays that come with traditional software development. |
• | Automation solutions help customers transform business processes. They automate, orchestrate and accelerate the entire application delivery process. Our unified platform provides end-to-end automation capabilities that cover service orchestration, workload automation and release automation capabilities. |
• | Agile Operations helps customers correlate end-user, application and infrastructure data from cloud-hosted containers to mainframes. Our solutions help customers see application dependencies and provide intelligent analytics, comprehensive coverage, and an open, extensible architecture that improves end-user experience. |
• | API (Application Programming Interface) Management facilitates the creation, security and management of APIs through their lifecycle, enabling customers to connect more directly with end-users via mobile apps, cloud platforms and “Internet of Things” devices. |
Security
Our Security portfolio provides customers, employees and partners seamless access to the right data, regardless of the underlying platform. Our Security portfolio is designed to minimize the risk of data breaches and alleviate the increased pressures faced by chief information security officers. Our capabilities within Security include:
• | Application Security offers a holistic and scalable way to manage security risk across an application lifecycle. Through our acquisition of Veracode, we provide a wide range of security testing and threat mitigation techniques. Our solution is hosted on a unified application security testing platform and integrates into existing development toolchains. This enables users to quickly identify and remediate security flaws earlier in the development process and supports the development of high-quality, secure code. |
• | Identity & Access Management provides enterprise-grade identity management and governance capabilities, including broad provisioning support for on-premises and cloud-based applications, extensibility and flexibility to integrate with other IT systems and consumer-grade scale. |
• | Privileged Access Management enables organizations to control and monitor the access and activity of privileged users, or users with elevated access or administrator rights. Our solutions help detect and prevent the threat of internal and external attacks leveraging both network and host-based controls for the enterprise and hybrid cloud. |
• | Payment Security is a software as a service (“SaaS”)-based payment authentication service to help banks protect against fraud and ensure a hassle-free online shopping experience for their customers. |
5
Figure 1 - Portfolio and Platform Overview
Business Strategy
Our goal is to be the world’s leading independent enterprise software provider that helps organizations and enterprises plan, develop, manage, and secure modern software environments, across mainframe, distributed, cloud and mobile platforms. To accomplish this, key elements of our strategy include:
• | Drive organic innovation. Our product development strategy is built around key growth areas, where we are focused on innovating and delivering differentiated products and solutions across both distributed and mainframe platforms. We are focused on developing solutions that are easy to use, easy to implement and have a low total cost of ownership. A key element of our organic innovation approach is the broad adoption of the Agile methodology to govern our software development process, which we believe improves our product development time-to-market, quality and relevance, and supports our customer success initiatives. |
• | Incubate technology for next generation products. We are researching and dedicating resources to the development of emerging technologies that are logical extensions of our core areas of focus. We are working on opportunities in areas such as containers, data analytics, big data, artificial intelligence, machine learning and open source, some of which may enhance or extend our current product portfolio and others of which may evolve into new product categories. |
• | Pursue new business models and expanded routes to market. While our traditional on-premise software delivery remains relevant to many enterprise customers, we see cloud-based and try-and-buy models as attractive to both our existing and potential customers. These models simplify decision-making and accelerate the value customers can derive from new solution investments. New delivery models allow us to extend our market reach, speed adoption of our solutions, improve our efficiencies and compete more effectively for a larger number of customers globally. As such, our new product development is focused on our customers’ need for solutions that are simple and cost-effective to buy, install, deploy, manage and secure. |
• | Expand relationships with our global customer base and address opportunities with new and underserved customers. We are focused on maintaining and expanding the strong relationships with our established customer base, and will proactively target growth with other potential customers that we do not currently serve. In parallel, we seek to broaden our customer base to new buyers in geographic regions we have underserved. The emerging roles of chief information security officers and chief development officers impact who and where IT environment purchasing decisions are made within our customers. This shift aligns with the product portfolio decisions we are making across our solutions set to meet our customers’ accelerating need for speed and agility. We are refining our sales, services, marketing and customer success resources to reach beyond the customers’ chief information officer and IT department to serve these new customer roles and respond to changes in customer buying behaviors. |
6
• | Execute strategic and disciplined technology acquisitions. We intend to supplement our organic innovation efforts with key technology acquisitions that are within or adjacent to our core areas of focus. We conduct a thorough acquisition process, which includes build vs. buy analysis and opportunity identification, detailed business case modeling, rigorous due diligence and extensive integration, to fully realize the value of our acquisitions. We also focus on organically developing nascent technologies from companies we have acquired to provide them with the necessary interoperability, resilience and security to operate at scale in the large, heterogeneous IT environments utilized by our customers. |
Fiscal 2018 Developments and Highlights
The following are significant developments and highlights relating to our business during fiscal 2018:
• | In November 2017, we held our user conference, CA World ‘17. This event showcased the most extensive list of products in recent Company history, with more than 20 new offerings and enhancements designed to help customers leverage agile practices, intelligent automation, data insights and end-to-end security for better and faster business outcomes. |
• | In February 2018, Jean M. Hobby was elected as a member of the Company’s Board of Directors. |
• | In February 2018, Ethisphere Institute named CA Technologies one of the World’s Most Ethical Companies. |
• | In fiscal 2018, CA Technologies was recognized as a leader in 20 industry analyst reports. |
Organizational Update
Effective May 3, 2018, Adam Elster no longer serves as our President, Global Field Operations. Mr. Elster will remain employed through August 17, 2018 in order to be available to assist with an orderly transition. We have inserted interim leadership as an external search for Mr. Elster’s replacement is underway.
Seasonality
Some of our business results are seasonally weighted toward the second half of our fiscal year, including cash flow from operations and total bookings. However, these business results may not always follow this pattern during a fiscal year. Given the varying durations and dollar amounts of the contracts being renewed, year-over-year comparisons of total bookings and collections associated with these bookings, financial results are not always indicative of the overall total bookings trend.
Customers
We currently serve customers across most major industries worldwide, including banks, insurance companies, other financial services providers, government agencies, global IT service providers, telecommunication providers, transportation companies, manufacturers, technology companies, retailers, educational organizations and health care institutions. Our traditional customers generally consist of large enterprises that have computing environments from multiple vendors and are highly complex. As the emergence of cloud computing has democratized the technology landscape, we have increased our focus on addressing a broader customer set.
No single customer accounted for 10% or more of our total revenue for fiscal 2018, 2017 or 2016. Approximately 7% and 6% of our total revenue backlog at March 31, 2018 and 2017, respectively, is associated with multi-year contracts signed with the U.S. federal government and other U.S. state and local government agencies, which are generally subject to annual fiscal funding approval and/or renegotiation or termination at the discretion of the government.
Sales and Marketing
We offer our solutions through our direct and digital sales forces as well as indirectly through our partners. We remain focused on strengthening relationships and increasing penetration within our core customers and partners - approximately our top 2,000 accounts. We refer to this key group of customers as “Enterprise” accounts. We believe maintaining and expanding our relationships within our traditional customer base of large enterprises with multi-year agreements will continue to drive renewals and provide opportunities to increase account penetration to help drive revenue growth. We address our “Commercial” account opportunities through partners and our digital sales efforts. We believe this group of customers and potential customers represents an opportunity for us to leverage a cost-effective distribution network to sell to net new customers and increase our share of wallet at customers where we have lower levels of penetration.
We are working to accelerate the velocity of our sales transactions and are implementing initiatives to drive consistent improvement in sales execution. We are continuing to shift to a more solutions-driven sales approach, using real-time data and intelligence to drive on-going evolution of our go-to-market strategy towards the highest potential and highest-yielding opportunities. We continue to increase investment in our digital sales and marketing organization to drive additional new land and expand opportunities. This enables us to cost effectively scale our reach to a broader set of buyers.
7
Our sales organization operates globally, with groups serving the North America (“NA”), Europe, the Middle East and Africa (“EMEA”), Latin America (“LA”), and Asia Pacific and Japan (“APJ”) geographies. We operate through branches, subsidiaries and partners around the world. Approximately 37% and 36% of our revenue in fiscal 2018 and 2017, respectively, was from operations outside of the United States. At March 31, 2018 and 2017, we had approximately 2,800 and 3,000, respectively, of sales and sales support personnel.
Marketing has played a key role in the ongoing transformation of our Company. It has helped to reshape perceptions of CA and to build capability that enables us to better serve our customers’ digital transformation. The critical role we play in enabling companies to compete and service customers in a software-defined era is now better understood and is driving interest in our offerings. The concept of the “Modern Software Factory” is resonating with customers and helps to reinforce the value proposition of CA’s portfolio of solutions. Operationally, to accelerate the role marketing plays in creating demand, we have sharpened our talent, tools and processes to better reach new customers to drive a higher velocity of opportunity creation for sales via digital marketing. Our marketing and sales organizations utilize common systems and analytics to initiate and respond to market opportunities, optimize resources, maximize efficiency and drive awareness and consideration of our brand and portfolio capabilities across our broad base of customers and prospects.
Partners
Our partners represent a foundational component of our go-to-market strategy. Our objective is to leverage our solutions and our partners’ strengths to deliver exceptional customer experiences, create greater value for our customers, and drive profitable and sustainable growth for both us and our partners. At the core of our global partner strategy, we aim to align our products, routes to market, customer segments and our strategic partners. Our data-driven approach of aligning our global partner strategy with market opportunities, channel trends and dynamic changes in the industry enables us to match our offerings and investments to specific markets.
We jointly build business with our partners in all our geographic regions through five key routes to market:
• | Resellers derive revenue primarily from the resale of third-party products. We work with a number of key strategic national and regional reseller partners to expand our global reach. |
• | Global Service Providers provide a platform for application infrastructure or cloud-based service offerings. We seek to establish long-term partnerships, usually via outsourcing arrangements, to support the development of innovative, differentiated service offerings. |
• | Global System Integrators offer our software within their business practices, leveraging their process design, planning, and vertical expertise to provide holistic solutions and implementation services to our joint customers. |
• | Managed Service Providers leverage our solutions to power their subscription-based IT services. We work together to deliver differentiated, high-value managed services. |
• | Global Technology Partners (including Independent Software Vendors and Infrastructure and Public Cloud Vendors) offer an opportunity for joint solutions, innovative business models, and CA brand awareness. |
Global Customer Success
The Global Customer Success (“GCS”) organization is made up of customer experience designers, customer advocates, technical support engineers, community managers and an advanced customer data analytics team that share a common goal to deliver a superior end-to-end customer experience that creates and sustains satisfaction and loyalty, and serves as a source of competitive advantage for CA.
The Customer Success team within GCS works with customers to understand their unique business challenges to help maximize the value of their investments in our solutions. The Customer Success team aligns with members from education, support, services, partners and development to drive customer adoption, facilitate product expansion and to provide maximum return in minimal time.
CA Support engineers within GCS work with customers during trials and after the sale to assist in migration and upgrades, resolve issues 24/7, create self-help knowledge documentation, and proactively mitigate risks to prevent issues before they occur. CA Support operates in 42 locations worldwide, providing assistance in 16 languages while consistently earning industry-leading customer satisfaction ratings.
Throughout the customer experience, customers are encouraged to join online communities to interact and engage with their peers, partners, and our CA experts. We have more than 61,000 community members in our 50 most active communities who network, ask and answer questions, and share knowledge about our solutions.
Research and Development
We have approximately 5,100 employees globally who design, develop, and support our software. We operate principal research and development centers across the United States, including California, Colorado, Illinois, Massachusetts, New York, Pennsylvania, and Texas. Internationally, we have principal centers in Austria, Canada, Czech Republic, India, and Israel.
8
In fiscal 2018, research and development continued to focus on developing solutions that are easy for customers to buy, install, use and maintain, and improving the quality and stability in our broadly deployed products which allows us to focus investment towards innovation initiatives.
We are advancing our Agile, DevOps and Security solutions while endeavoring to build a common technology stack across several of our product lines. We are making strides towards this shared component approach to make it easier, faster and more efficient for new solutions to be built.
We are also accelerating innovation with our CA Accelerator, which uses an incubator model to apply lean start-up best practices to grow new businesses. We are interested in areas of increasing importance to enterprises, such as big data, analytics, containerization, developer productivity, security and the “Internet of Things”. This model helps ensure we are making appropriate investments and building technology that customers value, using a small-batch, cost-efficient approach. We are also utilizing university partnerships to support and advance development.
Our research and development activities include a number of efforts to support our technical community in its pursuit of creating leading solutions for customers. We continue to use our Office of the Chief Technology Officer Research and Open Source and Open Standards initiatives to strengthen our relationships with research communities by working with academia, professional associations, industry standards bodies, customers and partners to explore novel products and emerging technologies. We also engage with universities to conduct product-focused research to create solutions for emerging opportunities.
We have charged to operations $642 million, $586 million, and $560 million in fiscal 2018, 2017 and 2016, respectively, for product development and enhancements.
Our product offerings and go-to-market strategy continue to evolve to include solutions that may be delivered either on-premise or via SaaS or cloud platforms. We expect our product offerings to continue to become available to customers at more frequent intervals than our historical release cycles. Over the last few years, we have continued to leverage Agile development methodologies, which are characterized by a dynamic development process with more frequent revisions to a product release’s features and functions as the software is being developed. In addition, we have implemented a holistic product strategy and portfolio management process, which has improved transparency and efficiency across the portfolio through a quarterly cadence of business reviews.
Intellectual Property
Our products and technology are generally proprietary. We rely on U.S. and foreign intellectual property laws, including patent, copyright, trademark and trade secret laws, to protect our proprietary rights. However, the extent and duration of protection given to different types of intellectual property rights vary under different countries' legal systems. In some countries, full-scale intellectual property protection for our products and technology may be unavailable, and the laws of other jurisdictions may not protect our proprietary technology rights to the same extent as the laws of the United States. We also maintain contractual restrictions in our agreements with customers, employees and others to protect our intellectual property rights. These restrictions generally bind our customers and employees to confidentiality regarding our intellectual property and limit our customers’ use of our software and prohibit certain disclosures to third parties.
We regularly license software and technology from third parties, including some competitors, and incorporate them into our own software products. We include third-party technology in our products in accordance with contractual relationships that specify our rights.
We believe that our patent portfolio differentiates our products and services from those of our competitors, enhances our ability to access third-party technology and helps protect our investment in research and development. We continue to enhance our internal patent program to increase our ability to capture patents, strengthen their quality and increase the pace at which we are able to move our innovations through the patent process. At March 31, 2018, our patent portfolio included more than 1,500 issued patents and more than 950 pending applications in the United States and abroad. The patents generally expire at various times over the next 20 years. Although the durations and geographic intellectual property protection coverage for our patents may vary, we believe our patent portfolio adequately protects our interests. Although we have a number of patents and pending applications that may be of value to various aspects of our products and technology, we are not aware of any single patent that is essential to us or to any of our reportable segments.
The source code for our products is protected both as trade secrets and as copyrighted works. Our customers do not generally have access to the source code for our products. Rather, on-premise customers typically access only the executable code for our products, and SaaS customers access only the functionality of our SaaS offerings. Under certain contingent circumstances, some of our customers are beneficiaries of a source code escrow arrangement that enables them to obtain a limited right to access our source code.
We continue to be engaged in efforts to more fully employ our intellectual property by strategically licensing and/or assigning selected assets within our portfolio. This effort is intended to better position us in the marketplace and allow us the flexibility to reinvest in improving our overall business.
9
Licensing and Engagements with Customers
For traditional, on-premise licensing, we typically license to customers either perpetually or on a subscription basis for a specified term. Our customers also purchase maintenance and support services that provide technical support and any general product enhancements released during the maintenance period.
Under a perpetual license, the customer has the right to use the licensed program for an indefinite period of time, typically upon payment of a one-time license fee. If the customer wants to receive maintenance, the customer is required to pay an additional annual maintenance fee.
Under a subscription license, the customer has the right to usage and maintenance of the licensed products during the term of the agreement. Under our licensing terms, customers can license our software products under multi-year licenses, with most customers choosing one to five-year terms, although some large customers may negotiate longer terms. Thereafter, the license generally renews for the same period of time on the same terms and conditions.
Within these license categories, our contracts provide customers with the right to use our products under a variety of models including, but not limited to:
• | A typical designated central processing unit (“CPU”) license, under which the customer may use the licensed product on a single, designated CPU. |
• | A license based on millions of instructions per second (“MIPS”), which allows the customer to use the licensed product on one or more CPUs, limited by the aggregate MIPS rating of the CPUs covered by the license. |
• | A user-based license, under which the customer may use the licensed product by or for the agreed number of licensed users. |
• | A designated server license, under which the customer may use a certain distributed product on a single, designated server. The licensed products must be licensed for use with a specific operating system. |
Customers can obtain licenses to our products through individual discrete purchases to meet their immediate needs or through the adoption of enterprise license agreements. Enterprise license agreements are comprehensive licenses that cover multiple products and also provide for maintenance and support.
For our mainframe solutions, the majority of our licenses provide customers with the right to use one or more of our products up to a specific license capacity, generally measured in MIPS. For these products, customers may acquire additional capacity during the term of a license by paying us an additional license fee and maintenance fee. For our enterprise solutions, our licenses may provide customers with the right to use one or more of our products limited to a number of servers, users or copies, among other things. Customers may license these products for additional servers, users or copies, etc., during the term of a license by paying us an additional license fee and maintenance fee.
Our services are typically delivered on a time-and-materials basis, but alternative pay arrangements, such as fixed fee or staff augmentations, could be offered as well.
SaaS is another delivery model we offer for certain products when a customer prefers to use our technology off-premises with little or no infrastructure required. Our SaaS offerings are typically licensed for a designated term using a subscription fee. Some of our SaaS business is transaction or usage-based. Our SaaS products, which are becoming a larger part of our Enterprise Solutions portfolio, typically have a shorter average duration and smaller initial contract values compared to the more traditional on-premise delivery model.
Competition
Our industry is extremely competitive and characterized by: continually changing customer needs, rapid technological change; frequent emergence of new companies and products; evolving industry standards, computing platforms, go-to-market approaches and business models.
Our competition can generally be categorized into the following groups:
• | A broad set of point product vendors in a number of our markets, many of which lack near-term profit expectations; |
• | Larger, vertically integrated technology companies that can bundle software to generate other revenue capture tied to hardware, platform, and services offerings; |
• | Continued expansion of cloud service provider offerings from Amazon Web Services, Microsoft Azure, and Google Cloud Platform embedded with management and security capabilities; and |
• | Increasing adoption of open source solutions that may substitute for commercial spend. |
Among the companies with which we compete are: AppDynamics, Inc. (acquired by Cisco); Atlassian Corporation, Plc; BMC Software Inc.; BeyondTrust; Compuware Corporation; CyberArk Software, Ltd.; International Business Machines Corporation; Micro Focus; Microsoft Corporation; MuleSoft, Inc. (acquired by Salesforce.com, Inc. in May 2018); New Relic, Oracle Corporation; SailPoint, Inc.; ServiceNow, Inc.; SolarWinds, Inc.; Splunk, Inc.; and VMware, Inc.
10
We believe the combination of our breadth of portfolio of enterprise management tools, our platform and hardware independence, and our deep customer relationships set us apart from other established competitors in the market. Further, we believe we are differentiated from emerging point-product providers by our global reach, breadth and synergy of offerings, deep industry experience, and strong balance sheet.
Employees
We believe that innovation and invention are the by-products of an inclusive and diverse workplace. Diversity of perspective, experience and thought are key to driving creativity, innovation, and results. We are committed to providing equitable opportunities and giving employees avenues for success - both personally and professionally. We believe that workforce diversity is an important topic in the technology sector, and we are dedicated to moving the conversation on diversity forward.
We had approximately 11,300 and 11,800 employees at March 31, 2018 and 2017, respectively.
Fiscal 2018 Employee Highlights
• | In May 2017, we were named one of America’s Best Employers by Forbes Magazine. |
• | In May 2017, we were named a Best Company for Multicultural Women by Working Mother Magazine. |
• | In September 2017, we were named one of Working Mother Magazine’s 100 Best Companies. |
• | In November 2017, we received a perfect score of 100 percent on the 2018 Corporate Equality Index, a national benchmarking survey and report on corporate policies and practices related to LGBT workplace equality, administered by the Human Rights Campaign Foundation. |
• | In December 2017, we were named one of Fortune’s Best Workplaces for Diversity by Great Places to Work®. |
• | In January 2018, we were included in Bloomberg’s first Sector-Neutral Gender-Equality Index. |
• | In March 2018, we were named one of NAFE’s Top Companies for Executive Women by the National Association for Female Executives. |
Financial Information About Geographic Areas
Refer to Note 16 “Segment and Geographic Information,” in the Notes to the Consolidated Financial Statements for financial data pertaining to our segment and geographic operations.
Corporate Information
The Company was incorporated in Delaware in 1974, began operations in 1976 and completed an initial public offering of common stock in December 1981. Our common stock is traded on The NASDAQ Global Select Market tier of The NASDAQ Stock Market LLC under the symbol “CA.”
Our corporate website address is www.ca.com. All filings we make with the Securities and Exchange Commission (“SEC”), including our Annual Report on Form 10-K, our Quarterly Reports on Form 10-Q, our Current Reports on Form 8-K, our proxy statements and any amendments thereto filed or furnished pursuant to Section 13(a) or 15(d) of the Securities Exchange Act of 1934, as amended, are available for free in the Investor Relations section of our website (www.ca.com/invest) as soon as reasonably practicable after they are filed with or furnished to the SEC. Our SEC filings are available to be read or copied at the SEC’s Public Reference Room at 100 F Street, N.E., Washington, D.C. 20549. Information about the operation of the Public Reference Room can be obtained by calling the SEC at 1-800-SEC-0330. Our filings can also be obtained for free on the SEC’s website at www.sec.gov. The reference to our website address does not constitute inclusion or incorporation by reference of the information contained on our website in this Form 10-K or other filings with the SEC, and the information contained on our website is not part of this document.
The Investor Relations section of our website (www.ca.com/invest) also contains information about our initiatives in corporate governance, including: our Corporate Governance Principles; information about our Board of Directors (including specific procedures for communicating with them); information concerning our Board of Directors Committees; and our Code of Conduct (which qualifies as a “code of ethics” under applicable SEC regulations and is applicable to all of our employees, including our Chief Executive Officer, Chief Financial Officer and Principal Accounting Officer, and our directors are expected to act consistently with the underlying ethical principles of such code). These documents can also be obtained in print by writing to our Corporate Secretary at CA, Inc., 520 Madison Avenue, New York, New York 10022.
Item 1A. Risk Factors.
Current and potential stockholders should consider carefully the risk factors described below. Any of these risks, some of which are beyond our control, could materially adversely affect our business, financial condition, operating results and cash flow, which could negatively impact our stock price.
11
Failure to execute our growth strategy could materially adversely affect our business, financial condition, operating results and cash flow.
Our business strategy is to create long-term sustainable growth, both organically and through acquisitions, while selling products and services that address customer needs and capitalize on current and next-generation market opportunities. The success of this strategy could be affected by our ability to:
• | Ensure that any new offerings address the needs of a rapidly changing market while not adversely affecting demand for our traditional products; |
• | Execute renewals within our existing customer base at acceptable renewal rates; |
• | Expand relationships with our global customer base and address opportunities with new customers (e.g., in geographic regions where we have underserved, or with chief information security officers and chief development officers, who have not been our traditional customers) at levels sufficient to offset any declines in revenue in our Mainframe Solutions segment, which is subject to an industry-wide decline due to new technologies, and in mature product lines in our Enterprise Solutions segment; |
• | Effectively manage the strategic shift in our business model to increase sales through our digital sales forces and indirectly through our partners, as well as provide additional SaaS offerings, offer try-and-buy models and refocus our professional services and education engagements on those engagements that are connected to new product sales, without affecting our financial performance to an extent greater than anticipated; and |
• | Effectively manage our pricing and other go-to-market strategies, as well as improve the CA Technologies brand, technology and innovation awareness in the marketplace. |
If we are unable to successfully execute our growth strategy, there could be a material adverse effect on our business, financial condition, operating results and cash flow.
We are subject to intense competition in product and service offerings and pricing, and we expect this to continue in the future, which could either diminish demand for, or inhibit growth of, our products and reduce our sales, revenue and market presence.
Our business strategy is based upon our ability to develop and acquire products and services that are accepted by the market better than those of our competitors. There can be no assurance that we will effectively meet these competitive demands. The markets for our products and services are intensely competitive, and we expect product and service offerings and pricing competition to continue. Some of our competitors have longer operating histories, greater name recognition, a larger installed base of customers in any particular market niche, larger technical staffs, established relationships with hardware vendors, or greater financial, technical and marketing resources than us. We also face competition from numerous start-ups and smaller companies that specialize in specific aspects of the highly fragmented software industry, and from open source authors who may provide software and intellectual property for free, competitors who may offer their products through try-and-buy or freemium models, and customers who may develop competing products. Competition from any of these sources could also result in price reductions or displacement of our products, which could materially adversely affect our financial results.
Our competitors also include large vendors of hardware and operating system software and cloud service providers, who continue to both expand their product and service offerings, and consolidate offerings into broad product lines. The widespread inclusion of products that perform the same or similar functions as our products bundled within computer hardware or other companies’ software products, or the provision of services similar to those provided by us, could reduce the perceived need for our products and services, or render our products obsolete and unmarketable. In addition, the software industry is currently undergoing consolidation as software companies seek to offer more extensive suites and broader arrays of software products and services, as well as integrated software and hardware solutions. The increased bundling of products and services and industry consolidation may adversely affect our competitive position, which could materially adversely affect our sales, revenue and market presence. Refer to Part I, Item 1, “Business - Competition,” of this Form 10-K for additional information.
Failure to innovate or adapt to technological changes, or develop and introduce new software products and services in a timely and market-accepted manner, could materially adversely affect our business.
We operate in a highly competitive industry characterized by rapid technological changes, evolving industry standards, changes in customer requirements and new delivery methods. The newer enterprise solutions markets in which we operate - including non-mainframe platforms from physical to virtual and cloud - are far more crowded and competitive than our traditional mainframe systems management markets.
12
Our ability to compete effectively depends upon many factors, including the success of our existing solutions, the timely introduction and success of future software products and services, including those that we acquire or develop, and related delivery methods (e.g., SaaS), as well as our ability to provide successful, timely and adequate customer support. Further, as our existing products mature, they may become obsolete. The emergence of cloud computing means that many of our enterprise solutions customers are themselves undergoing a radical shift in the way they deliver IT services to their businesses. The shift towards delivering infrastructure and SaaS from the cloud may negatively affect our ability to sell IT management solutions to our traditional enterprise solutions customers. Failure to adapt our products, solutions, delivery models and sales approaches to effectively plan for cloud computing may adversely affect our business. If we are not successful in anticipating the rate of market change towards the cloud computing paradigm and evolving with it by delivering solutions for IT management in the cloud computing environment, customers may forgo the use of our products, particularly certain mature product lines in our Enterprise Solutions segment, in favor of those with comparable functionality delivered via the cloud.
We have experienced long development cycles and product delays in the past, particularly with some of our enterprise solutions, and even with the Agile development methodology we may experience delays in the future. In addition, we have incurred and expect to continue to incur significant research and development costs to introduce new products and integrate products into solution sets. If there are delays in new product introduction or solution set integration, or if there is less-than-anticipated market acceptance of these new products or solution sets, we may have invested substantial resources without realizing adequate revenues in return. Furthermore, there can be no assurance that as technologies become outdated or new delivery methods are required, we will be able to adopt or introduce them as quickly as our competitors, or within budgeted costs and time frames, which could adversely affect our business and reputation.
If our products do not remain compatible with ever-changing operating environments, platforms, or third-party products, we could lose customers and the demand for our products and services could decrease, which could materially adversely affect our business, financial condition, operating results and cash flow.
The largest suppliers of systems and computing software are, in most cases, the manufacturers of the computer hardware systems used by most of our customers, particularly in the mainframe space. These companies periodically modify or introduce new operating systems, systems software and computer hardware. In the future, new products from these companies could require substantial modification of our products to maintain compatibility with these companies’ hardware or software. There can be no assurance that we will be able to adapt our products and our business to future changes introduced by hardware manufacturers and system software developers.
Further, our solutions interact with a variety of software and hardware developed by third parties and we may lose access to third-party code and specifications for the development of code, which could materially adversely affect our ability to develop software compatible with third-party software products in the future. Some software providers and hardware manufacturers, including some of the largest vendors, have a policy of restricting the use or availability of their code or technical documentation for some of their operating systems, applications, or hardware. To date, this policy has not had a material effect on us. Some companies, however, may adopt more restrictive policies in the future or impose unfavorable terms and conditions for such access. These restrictions may, in the future, result in higher research and development costs for us in connection with the enhancement and modification of our existing products and the development of new products. Any additional restrictions could materially adversely affect our business, financial condition, operating results and cash flow.
Given the global nature of our business, economic factors or political events beyond our control and other business and legal risks associated with global operations can affect our business in unpredictable ways.
International revenue has historically represented a significant percentage of our total worldwide revenue. Success in selling and developing our products throughout the world depends on a variety of factors, including:
• | Developing and executing an effective go-to-market strategy in various locations; |
• | Foreign exchange rates; |
• | Changes in global, economic and political landscapes; |
• | Acts of terrorism; |
• | Workforce reorganizations in various locations, including global reorganizations of sales, research and development, technical services, finance, human resources and facilities functions; |
• | Effectively staffing key managerial and technical positions; |
• | Successfully localizing software products for a significant number of international markets; |
• | Restrictive employment regulation; and |
• | Trade restrictions such as tariffs, duties, taxes or other controls. |
13
In addition, compliance by us and our partners (including unaffiliated third-party partners) with differing local laws, regulations and interpretations in multiple international jurisdictions, as well as compliance with U.S. laws and regulations where applicable in these international locations increases our cost of doing business. These laws and regulations include restrictive local laws regarding the transfer of funds from, or the conversion of currencies in, certain countries, international intellectual property laws, which may be more restrictive or may offer lower levels of protection than U.S. law, as well as anti-corruption, competition, anti-money laundering, export control and data privacy laws and regulations, including the U.S. Foreign Corrupt Practices Act of 1977, the UK Bribery Act of 2010, the EU-U.S. and Swiss-U.S. Privacy Shield Frameworks, as well as the new EU General Data Protection Regulation, which will become effective on May 25, 2018, the Network and Information Security Directive in the EU, trade controls and sanctions administered by the U.S. Office of Foreign Assets Control, and similar laws and regulations in other jurisdictions.
We have implemented policies, procedures and controls designed to achieve compliance with applicable laws and regulations, but our corporate policies, process and controls may not prevent or detect all potential breaches of law or other governance practices. Any violation of these laws could lead to substantial civil and criminal fines and penalties, litigation, loss of operating licenses or permits and other collateral consequences.
An unfavorable development regarding any of the foregoing factors, many of which are beyond our control, could materially adversely affect our business.
Failure to sell and renew license agreements on a satisfactory basis could materially adversely affect our business, financial condition, operating results and cash flow.
The success of our business depends on attracting new customers to our products and solution sets and retaining or increasing the level of revenues derived from existing customers. We utilize direct sales efforts, as well as third-party partners, to sell our products and solutions sets, and our sales efforts may be unsuccessful. Many of our existing customers have multi-year enterprise license agreements, some of which involve substantial aggregate fee amounts. These customers have no contractual obligation to purchase additional solutions. Customer renewal rates may decline or fluctuate as a result of a number of factors, including the level of customer satisfaction with our solutions or customer support, customer budgets and the pricing of our solutions as compared with the solutions offered by our competitors, any of which may cause our revenue to grow more slowly than expected, if at all. The failure to sell new license agreements and renew transactions in the future, or failure to replace those enterprise license agreements with renewal transactions of similar scope, on terms that are commercially attractive to us, could materially adversely affect our business, financial condition, operating results and cash flow.
Failure to expand partner programs and failure by our partners to leverage their sales channels to drive our revenue growth may result in lost sales opportunities and a weakening of our market position.
In addition to our direct sales efforts, we sell our products and solutions through various partner channels, which include resellers, global service providers, global system integrators, managed service providers and global technology partners. Through our various global partner programs, we provide incentives, training, enablement and marketing investments so our partners have the capability and expertise to sell and deliver these solutions to their customers. We also leverage global systems integrators and global service providers to assist with and influence the sales of solutions to our top customers and we utilize resellers to better penetrate the partner-driven commercial market. The failure to expand partner programs or failure by our partners to leverage their sales channels could result in lost incremental sales opportunities that adversely affect our overall business success, including our market position.
Our business may suffer if we are not able to retain and attract qualified professionals, including key managerial, technical, marketing and sales professionals.
We depend on our ability to identify, recruit, hire, train, develop and retain qualified and effective professionals and to attract and retain talent needed to execute our business strategy, which ability depends on, among other factors, the strength of our brand recognition. We also depend on our ability to perform these tasks with respect to professionals from acquired companies, which ability may be negatively impacted by our efforts to integrate and rationalize the products and lines of business we have acquired. Our ability to do so depends on numerous factors, including factors that we cannot control, such as competition and conditions in the local employment markets in which we operate. Effective succession planning is also important for our long-term success. Failure to ensure effective transfers of knowledge and smooth transitions involving key employees could hinder our strategic planning and execution. As our success depends in a large part on the continued contribution of our senior management and other key employees, a loss of a significant number of skilled managerial, technical or other professionals could have a negative effect on the quality of our products. A loss of a significant number of experienced and effective sales professionals could result in lower sales of our products. Furthermore, many of our key personnel receive a compensation package that includes equity awards. Any new regulations, volatility in the stock market or other factors could diminish our use, and the value, of our equity awards, forcing us to use a higher proportion of cash compensation to incentivize our key personnel, or putting us at a competitive disadvantage.
14
Changes in generally accepted accounting principles may materially adversely affect our reported results of operations or financial position.
From time to time, the Financial Accounting Standards Board (“FASB”) issues new accounting principles. For example, in May 2014, the FASB issued Accounting Standards Update No. 2014-09, Revenue from Contracts with Customers, with amendments in 2015, 2016 and 2017, which creates new Accounting Standards Codification Topic 606 (“Topic 606”) that will replace most existing revenue recognition guidance in U.S. generally accepted accounting principles (“GAAP”) when it becomes effective for us in the first quarter of fiscal 2019. Under Topic 606, more judgment and estimates will be required within the revenue recognition process than are required under existing GAAP. We currently anticipate that this standard will have a material effect on our consolidated financial statements, revenue recognition policies and related disclosures. We also presently anticipate that this standard could create volatility in our reported revenue and operating results, which could negatively impact our stock price. We currently believe the most significant effect relates to the timing of the recognition of our software license revenue. As a result, a significant portion of our revenue backlog (i.e., deferred revenue and future billings on committed contracts) relating to the license component of customer contracts at March 31, 2018 under existing GAAP will not be recognized as revenue in future periods but instead will be included as part of the cumulative effect adjustment within retained earnings upon adoption of Topic 606. Refer to Note 1, “Significant Accounting Policies,” in the Notes to the Consolidated Financial Statements for additional information about Topic 606 and other new accounting pronouncements. Changes to existing rules, or changes to the interpretations of existing rules, could lead to changes in our accounting policies, systems and internal controls over financial reporting. For example, in connection with our adoption of Topic 606, we are developing new policies and processes based on the changes in revenue recognition guidance and implementing a new revenue recognition accounting system. Such changes and any difficulties implementing such changes could materially adversely affect our reported financial results and the effectiveness of our internal controls.
We may encounter difficulties in successfully integrating companies and products that we have acquired or may acquire into our existing business, which could materially adversely affect our business, financial condition, operating results and cash flow.
In the past we have acquired, and in the future we expect to acquire, complementary companies, products, services and technologies through a number of different vehicles, including through mergers, asset acquisitions, joint ventures, partnerships, strategic alliances and equity investments. Additionally, we expect to acquire technology that is consistent with our business strategy. The risks we may encounter with any such acquisition or integration of an acquisition include:
• | We may find that the acquired company or assets do not improve our financial and/or strategic position as planned; |
• | We may have difficulty integrating the operations, facilities, personnel and compensation plans of the acquired business; |
• | We may have difficulty retaining the skills needed to further market, sell or provide services on the acquired products in a manner that will be accepted by the market; |
• | We may have difficulty incorporating the acquired technologies or products into our existing product lines, and in selling such technologies or products to our customers and through our partner programs; |
• | Our ongoing business may be disrupted by transition or integration issues and our management’s attention may be diverted from other business initiatives; |
• | Our relationships with current and new employees, customers and business partners could be impaired; |
• | An acquisition may result in increased litigation risk, including litigation from terminated employees or third parties, as well as product, customer or intellectual property liability; |
• | Our due diligence process may fail to identify significant issues with the acquired company’s product quality, financial disclosures, accounting practices, internal control deficiencies including material weaknesses, product architecture, legal and tax contingencies, compliance with differing, changing and potentially inconsistent local laws, regulations and interpretations in multiple international jurisdictions, as well as compliance with U.S. laws and regulations where applicable in these international locations, and other matters; and |
• | We may not be able to realize the benefits of recognized goodwill and intangible assets and this may result in the potential impairment of these assets. |
These risks can be heightened during periods when we seek to integrate multiple acquisitions at the same time or in a relatively short period of time. Furthermore, to the extent we issue shares of stock or other rights to purchase stock, including options, to pay for acquisitions or to retain employees, existing stockholders’ interests may be diluted and income per share may decrease. The occurrence of any of these risks could have a material adverse effect on our business, results of operations, financial condition and cash flow.
15
Our data center, network and software products, and the IT environments of our business partners and customers are subject to hacking or other cybersecurity threats, which could result in a loss or misuse of proprietary, personally identifiable and confidential information and/or harm to our customer relationships and the market perception of the effectiveness of our products.
Given that some of our products are intended to manage and secure IT infrastructures and environments, we expect to be an ongoing target of cybersecurity attacks. Open source code or other third-party software used in our infrastructure and products could also be targeted, as could our software being utilized by our customers. This risk can be heightened for acquired products, which may not have gone through the same testing and quality control measures as our organically developed products. Additionally, our SaaS business includes the hosting of customer data and uses third-party data centers that may also be subject to hacking incidents. If our SaaS business increases substantially, whether due to organic growth or the acquisition of SaaS businesses, our exposure to hacking incidents could increase due to the increase in the volume of SaaS business activity and the potential increase in the number of SaaS technology platforms we might maintain. Although we continually seek to improve our countermeasures to prevent such incidents, we may be unable to anticipate every scenario and it is possible that certain cyber threats or vulnerabilities will be undetected or unmitigated in time to prevent an attack on us and our customers. Cybersecurity attacks could require significant expenditures of our capital and diversion of our resources. Additionally, efforts by hackers or others could cause interruptions, delays or cessation of our product licensing, or modification of our software, which could cause us to lose existing or potential customers. If these attacks are successful, they could result in the theft of proprietary, personally identifiable, confidential and sensitive information of ours, our employees, our customers and our business partners, and could materially disrupt business for us, our customers and our business partners. A successful cybersecurity attack involving our data center, network or software products could also negatively impact the market perception of the effectiveness of our products or lead to contractual disputes, litigation or government regulatory action against us, any of which could materially adversely affect our business.
If we do not adequately manage, evolve and protect our information systems, infrastructure and processes, our ability to manage and grow our business may be harmed.
We rely on our information systems and those of third parties for managing the financial information of our business. For example, in connection with our adoption of Topic 606, we are implementing a new revenue recognition accounting system. Any disruption in such information systems could have a significant impact on our business. In addition, we continuously work to enhance our information systems and infrastructure and integrate those of acquired companies, which is frequently disruptive to the underlying business. Additionally, delays in adapting our information systems to address new business models, such as SaaS, or the adoption of Topic 606 could limit the success or result in the failure of those initiatives and impair the effectiveness of our internal controls.
Although we have implemented a disaster recovery program, our system redundancy may be ineffective or inadequate and our disaster recovery planning may not be sufficient for all situations, including scenarios associated with acquired companies. Failure to adequately address these issues, as well as to manage and protect our infrastructure, could adversely affect our ability to manage and grow our business, including our SaaS business.
General economic conditions and credit constraints, or unfavorable economic conditions in a particular region, business or industry sector, may lead our customers to delay or forgo technology investments and could have other impacts, any of which could materially adversely affect our business, financial condition, operating results and cash flow.
Our products are designed to improve the productivity and efficiency of our customers’ information processing resources. However, a general slowdown in the global economy or in a particular region, such as Europe, a disruption in a business or an industry sector or tightening of credit markets could cause our current or any new customers to have difficulty accessing credit sources, delay contractual payments, or delay or forgo decisions to (i) license our products (particularly with respect to discretionary spending for software), (ii) upgrade existing environments or (iii) purchase services.
Furthermore, a general slowdown in the global economy may also materially affect the global banking system, including individual institutions as well as a particular business or industry sector, which could cause consolidations or failures in that sector. Approximately one third of our revenue is derived from arrangements with financial institutions (i.e., banking, brokerage and insurance companies). In addition, we derive material portions of our revenue from other industries such as telecommunications and health care that rely on transaction processing. The majority of these arrangements are for the renewal of mainframe solutions capacity and maintenance associated with transactions processed by our customers. While we cannot predict what impact there may be on our business from changes to the financial industry, telecommunications or health care sectors, or the impact on our business from the economy in general, any material change in general economic conditions, or conditions in a particular sector, may lead our customers to delay or forgo technology investments and could have other impacts, any of which could affect the manner in which we are able to conduct business.
16
Our sales to government clients subject us to uncertainties regarding fiscal funding approvals, renegotiations or terminations at the discretion of the government, as well as audits and investigations, which could result in litigation, penalties and sanctions including early termination, suspension and debarment.
Approximately 7% of our total revenue backlog at March 31, 2018 is associated with multi-year contracts signed with the U.S. federal government and other U.S. state and local government agencies. These contracts are generally subject to annual fiscal funding approval and may be renegotiated or terminated at the discretion of the government. Termination, renegotiation or the lack of funding approval for a contract could adversely affect our sales, revenue and reputation. Additionally, our government contracts are generally subject to certain requirements, some of which are generally not present in commercial contracts and/or may be complex, as well as to audits and investigations. Failure to meet contractual requirements could result in various civil and criminal actions and penalties, and administrative sanctions, including termination of contracts, refund of a portion of fees received, forfeiture of profits, suspension of payments, fines and suspensions or debarment from doing business with the government and could materially adversely affect our business, financial condition, operating results and cash flow.
Fluctuations in foreign exchange rates could result in losses.
We operate global businesses and our consolidated financial results are reported in U.S. dollars. Most of the revenue and expenses of our foreign subsidiaries are denominated in local currencies. Given that cash is typically received over an extended period of time for many of our license agreements and given that a substantial portion of our revenue is generated outside of the United States, fluctuations in foreign exchange rates against the U.S. dollar could result in substantial changes in reported revenues and operating results due to the foreign exchange impact of translating these transactions into U.S. dollars.
In the normal course of business, we employ various hedging strategies to partially mitigate these risks, including the use of derivative instruments. These strategies may not be effective in protecting us against the effects of fluctuations from movements in foreign exchange rates. As a result, fluctuations of the foreign exchange rates could result in financial losses.
Discovery of errors or omissions in our software products could materially adversely affect our revenue and earnings.
The software products we offer are inherently complex. Despite testing and quality control, we cannot be certain that errors or omissions will not be found in current versions, new versions, documentation or enhancements of our software products. This risk can be heightened with acquired products which may not have gone through the same testing and quality control measures as our organically developed products. If new or existing customers have difficulty deploying our products or require significant amounts of customer support, our operating margins could be adversely affected. We could also face possible claims and higher development costs if our products contain errors that we have not detected, cause damage to customer or third-party systems, or otherwise fail to meet customer expectations. Significant technical challenges also arise with our products because our customers license and deploy our products across a variety of computer platforms and integrate them with a number of third party software applications and databases. These combinations increase our risk further because, in the event of a system-wide failure, it may be difficult to determine which product is at fault, which could cause us to be harmed by the failure of another supplier’s products. As a result of the foregoing, we could experience:
• | Loss of or delay in revenue and loss of market share; |
• | Loss of customers, including the inability to obtain repeat business with existing key customers; |
• | Damage to our reputation; |
• | Failure to achieve market acceptance; |
• | Diversion of development resources; |
• | Remediation efforts that may be required; |
• | Increased service and warranty costs; |
• | Legal actions by customers or government authorities against us that, whether or not successful, could be costly, distracting and time-consuming; |
• | Increased insurance costs; and |
• | Failure to successfully complete service or customer support engagements for product installations, implementations and integrations. |
Consequently, the discovery of errors in our products after delivery could materially adversely affect our revenue and earnings.
17
Failure to protect our intellectual property rights and source code could weaken our competitive position.
Our success is highly dependent upon our proprietary technology. We protect our rights through a variety of measures, including patents, copyrights, trademarks, trade secret laws, confidentiality procedures and contractual provisions. Notwithstanding our efforts to protect our rights, policing unauthorized use is difficult, and intellectual property litigation can be expensive and disruptive to our business. The laws of other countries may not be as protective as those of the United States. In addition, our patents may be circumvented, challenged, invalidated or designed around by other companies. Furthermore, confidentiality procedures and contractual provisions can be difficult to enforce and, even if successfully enforced, may not be entirely effective. Failure to protect such technology could lead to the loss of valuable assets and our competitive advantage. Refer to Part I, Item 1, “Business - Intellectual Property,” of this Form 10-K for additional information.
Certain software that we use in our products is licensed from third parties and, for that reason, may not be available to us in the future, which has the potential to delay product development and production or cause us to incur additional expense.
Some of our solutions contain software licensed from third parties. Some of these licenses may not be available to us in the future on terms that are acceptable to us or allow our products to remain competitive. The loss of these licenses or the inability to maintain any of them on commercially acceptable terms could delay development of future products or the enhancement of existing products. We may also choose to pay a premium price for such a license in certain circumstances where the benefit of continuity of the licensed product would outweigh the premium cost of the license.
Certain software we use is from open source code sources, which, under certain circumstances, may lead to unintended consequences and, therefore, could materially adversely affect our business, financial condition, operating results and cash flow.
Some of our products contain software from open source code sources. The use of such open source code may subject us to certain conditions, including the obligation to offer our products that use open source code for no cost or to make the proprietary source code of those products publicly available. Further, although some open source vendors provide warranty and support agreements in conjunction with the use of their open source software, it is common for many open source software authors to make their open source software available “as-is” with no warranty, indemnity or support. We monitor our use of such open source code to avoid subjecting our products to conditions we do not intend. However, the use of such open source code may ultimately subject some of our products to unintended conditions, which could require us to take remedial action that may divert resources away from our development efforts and could materially adversely affect our business, financial condition, operating results and cash flow.
Third parties could claim that our products infringe or contribute to the infringement of their intellectual property rights and/or that we owe royalty payments to them, which could result in significant litigation expense or settlement with unfavorable terms.
From time to time, third parties have claimed and may claim that our products, both organically developed and acquired, infringe various forms of their intellectual property and/or that we owe royalty payments to them. Investigation of these claims can be expensive and could affect development, marketing or shipment of our products. As the number of software patents issued increases, it is likely that additional claims will be asserted. Defending against such claims is time consuming and could result in significant litigation expense, adverse judgments or settlement on unfavorable terms, and divert our management’s attention, any of which could materially adversely affect our business.
The number, terms and duration of our license agreements, as well as the timing of orders from our customers and channel partners, may cause fluctuations in some of our financial metrics, which may affect our quarterly financial results.
Historically, a substantial portion of our license agreements are executed in the last month of a quarter and the number of contracts executed during a given quarter can vary substantially. In addition, it is characteristic of our industry when dealing with enterprise customers to experience long sales cycles, which for us is driven in part by the varying terms and conditions of our software contracts. These factors can make it difficult for us to predict sales and cash flow on a quarterly basis. Any failure or delay in executing new or renewed license agreements in a given quarter could cause declines in some of our financial metrics (e.g., revenue or cash flow), and, accordingly, increases the risk of unanticipated variations in our quarterly results.
Potential tax liabilities may materially adversely affect our results.
We are subject to income taxes in the United States and in numerous foreign jurisdictions. Significant judgment is required in determining our worldwide provision for income taxes. In the ordinary course of our business, we engage in many transactions and calculations where the ultimate tax determination is uncertain.
18
The Tax Cuts and Jobs Act enacted on December 22, 2017 (the “Tax Act”) includes significant changes to the U.S. corporate income tax system, including a permanent reduction in the corporate income tax rate, limitations on the deductibility of executive compensation and the transition of U.S. international taxation from a worldwide tax system to a territorial tax system. This new law also includes a provision that imposes a transition tax on foreign earnings whether or not such earnings are repatriated to the U.S. We have provided provisional amounts to estimate the tax impacts of the Tax Act. We will continue to refine the provisional amounts as we review and analyze results from operations needed for calculations under the Tax Act, as well as further review the historic unremitted earnings of our foreign subsidiaries and take into consideration any additional regulatory guidance published by the U.S. tax authorities in respect of the Tax Act. Compliance with the Tax Act may require the collection of information not regularly produced within the Company, the use of estimates in our financial statements, interpretation of further regulatory guidance and the exercise of significant judgment in accounting for our tax provisions. The Company expects to finalize the tax expense as soon as practical, but not later than the third quarter of fiscal 2019, and such updates to our calculations may differ, possibly materially, from the provisional amounts previously recorded.
We are regularly under audit by tax authorities. We believe our tax estimates are reasonable, including the provisional amounts relating to the Tax Act. However, the final determination of tax audits and any related litigation could be materially different from that which is reflected in our income tax provisions and accruals. Additional tax assessments resulting from audit, litigation or changes in tax laws, as well as further guidance to clarify or interpret uncertainties in the tax laws, such as the Tax Act, may result in increased tax provisions or payments or possibly criminal claims, penalties or fines which could materially adversely affect our business, financial condition, operating results and cash flow in the period or periods in which that determination is made. Refer to Note 14, “Income Taxes,” in the Notes to the Consolidated Financial Statements for additional information about our tax matters.
Changes in market conditions or our credit ratings could increase our interest costs and adversely affect the cost of refinancing our debt and our ability to refinance our debt, which could materially adversely affect our business, financial condition, operating results and cash flow.
At March 31, 2018 and 2017, we had $2,783 million and $2,791 million, respectively, of debt outstanding, consisting mostly of unsecured senior note obligations. Refer to Note 7, “Debt,” in the Notes to the Consolidated Financial Statements for the payment schedule of our long-term debt obligations. Our senior unsecured notes are rated by Moody’s Investors Service, Fitch Ratings, and Standard and Poor’s. These agencies or any other credit rating agency could downgrade or take other negative action with respect to our credit ratings in the future. If our credit ratings were downgraded or other negative action is taken, or market conditions change, we could be required to, among other things, pay additional interest on outstanding borrowings under our principal revolving credit agreement and term loan agreement. Any downgrades or changes in market conditions could affect our ability to obtain additional financing in the future and may affect the terms of any such financing.
We expect that existing cash, cash equivalents, short-term investments, cash provided from operations and our bank credit facilities will be sufficient to meet ongoing cash requirements. However, our failure to generate sufficient cash as our debt becomes due, renew credit lines prior to their expiration or refinance our existing debt on satisfactory terms could materially adversely affect our business, financial condition, operating results and cash flow.
We may encounter events or circumstances that would require us to record an impairment charge relating to our goodwill or capitalized software and other intangible assets balances.
Under GAAP, we are required to evaluate our capitalized software and other intangible assets for impairment when events or changes in circumstances indicate the carrying value may not be recoverable. We test goodwill for impairment at least annually, and more frequently if impairment indicators are present. In future periods, we may be subject to factors that may constitute a change in circumstances, indicating that the carrying value of our goodwill exceeds fair value or our capitalized software and other intangible assets may not be recoverable. These changes may consist of, but are not limited to, declines in our stock price and market capitalization, reduced future cash flow estimates, and slower growth rates in our industry. Any of these factors, or others, could require us to record a significant non-cash impairment charge in our financial statements during a period. Acquisitions can result in additional goodwill or capitalized software and other intangible assets balances subject to impairment risk. If we determine that a significant impairment of our goodwill or our capitalized software and other intangible assets has occurred in any of our operating segments, this could materially adversely affect our financial condition and operating results.
Failure by us to effectively execute on our announced restructuring plans could result in total costs that are greater than expected or revenues that are less than anticipated.
In May 2018, we announced a restructuring plan, which includes workforce reductions, global facility exits and consolidations and other cost reduction initiatives, to better align our business priorities. We may have further workforce reductions, global facility exits and consolidations and other cost reduction initiatives in the future, as part of this restructuring plan or subsequent plans. Risks associated with these actions include delays in implementation, changes in plans that increase or decrease the number of employees affected, adverse effects on employee morale and the failure to meet operational targets due to the loss of employees, any of which may impair our ability to achieve anticipated cost reductions or may otherwise harm our business, which could materially adversely affect our financial condition, operating results and cash flow.
19
We have outsourced various functions to third parties that may not be successful or fully secure, which could result in increased costs or an increased chance of a cybersecurity breach.
We have outsourced various functions to third parties, including certain product development and administrative functions, cloud-based services and hosting for our SaaS business. We may outsource additional functions to third parties in the future. These outsourced functions may involve confidential and/or personally identifiable information. We rely on these third parties to provide outsourced services on a timely and effective basis and to adequately address their own cybersecurity threats. Although we periodically monitor the performance of these third parties and maintain contingency plans in case the third parties are unable to perform as agreed, we do not ultimately control the performance of these third parties. The failure of third-party outsourcing partners or vendors to perform as expected could result in significant disruptions and costs to our operations or our customers’ operations, or the potential loss of personally identifiable information of our customers, employees and business partners that could subject us to legal action by government authorities or private parties.
There is no assurance that we will continue to pay dividends or repurchase shares of our common stock in any particular amount or at all.
The payment of a regular quarterly cash dividend and the repurchase of shares of our common stock is subject to, among other things, the best interests of the Company and our stockholders, our financial condition, historical and forecast operating results, and available cash flow, as well as any applicable laws and contractual covenants and any other factors that our Board of Directors may deem relevant. A reduction in or elimination of our dividend payments or stock repurchases could have an adverse effect on the price of our common stock.
Item 1B. Unresolved Staff Comments.
None.
Item 2. Properties.
Our principal real estate properties are located in areas necessary to meet our operating requirements. All of the properties are considered to be both suitable and adequate to meet our current and anticipated operating requirements.
At March 31, 2018, we leased 43 facilities throughout the United States and 57 facilities outside the United States. Our lease obligations expire on various dates with the longest commitment extending to fiscal 2029. We believe that substantially all of our leases will be renewable at market terms at our option as they become due or that suitable alternatives will be available at market terms.
We own four facilities globally, consisting of one facility in Germany totaling approximately 100,000 square feet, one facility comprised of two buildings in Italy totaling approximately 140,000 square feet, one facility comprised of two buildings in India totaling approximately 455,000 square feet and one facility in the United Kingdom totaling approximately 215,000 square feet.
We utilize our leased and owned facilities for sales, technical support, research and development and administrative functions.
Item 3. Legal Proceedings.
Refer to Note 10, “Commitments and Contingencies,” in the Notes to the Consolidated Financial Statements for information regarding certain legal proceedings, the contents of which are herein incorporated by reference.
Item 4. Mine Safety Disclosures.
Not applicable.
* * *
20
Executive Officers of the Registrant.
The name, age, present position and business experience for at least the past five years of each of our executive officers at May 9, 2018 are listed below:
Michael P. Gregoire, 52, has been Chief Executive Officer and a director of the Company since January 2013. Previously, he served as President and Chief Executive Officer of Taleo Corporation (“Taleo”), a provider of on-demand talent management software solutions, from March 2005 until Taleo’s acquisition by Oracle Corporation in April 2012. Mr. Gregoire also served as a director of Taleo from April 2005 until April 2012 and served as Taleo’s Chairman of the Board from May 2008 until April 2012. Mr. Gregoire served as Executive Vice President, Global Services and held various other senior management positions at PeopleSoft, Inc., an enterprise software company, from May 2000 to January 2005. Mr. Gregoire served as Managing Director for global financial markets at Electronic Data Systems, Inc., a global technology services company, from 1996 to April 2000, and in various other roles from 1988 to 1996. Mr. Gregoire currently serves on the executive council of TechNet, a national bipartisan network of technology CEOs that promotes growth of the innovation economy, and as a director of NPower, a non-profit information technology services network.
Lauren P. Flaherty, 60, has been the Company’s Executive Vice President and Chief Marketing Officer since August 2013. She is responsible for all facets of the Company’s marketing efforts. Previously, she was Executive Vice President and Chief Marketing Officer at Juniper Networks, Inc., which develops and markets networking products, where she led the company’s global marketing activities, from February 2009 to July 2013 and Chief Marketing Officer at Nortel Networks Corporation, a telecommunications and data networking equipment manufacturer, from May 2006 to December 2008.
Ava M. Hahn, 45, has been the Company’s Executive Vice President, General Counsel and Corporate Secretary since February 2018, and the Company’s Chief Ethics and Compliance Officer since May 2018. She is responsible for overseeing the Company’s legal organization worldwide. Previously, she was General Counsel at Kleiner Perkins Caufield & Byers LLC, a venture capital firm, from May 2017 to January 2018, General Counsel and Partner at Felicis Ventures, a venture capital firm, from June 2016 to May 2017, General Counsel and Corporate Secretary at Aruba Networks, Inc., a wireless networking company, from April 2013 to May 2016, and General Counsel and Corporate Secretary at ShoreTel, Inc., a telecommunications company, from June 2007 to March 2013.
Jacob Lamm, 53, has been the Company’s Executive Vice President, Strategy and Corporate Development since February 2009. He is responsible for directing the Company’s overall business strategy, as well as the Company’s strategy for acquisitions. Mr. Lamm has held various management positions since joining the Company in 1998, including serving as Executive Vice President, Governance Group from January 2008 to February 2009 and as Executive Vice President and General Manager, Business Service Optimization Business Unit from March 2007 to January 2008.
Kieran J. McGrath, 59, has been the Company’s Executive Vice President and Chief Financial Officer since November 2016. He is responsible for the Company’s corporate and business unit financial functions worldwide. He served as the Company’s Senior Vice President and interim Chief Financial Officer from July 2016 to November 2016, and as Senior Vice President and Corporate Controller from September 2014, when he joined the Company, until July 2016. Prior to joining the Company, Mr. McGrath was Vice President, Finance at International Business Machines Corporation, a cognitive solutions and cloud platform company, where he held a variety of senior executive finance positions across the company, including leading the finance department for IBM's Software Group, from January 2009 until August 2014.
Paul L. Pronsati, 60, has been the Company’s Executive Vice President, Global Operations and Information Technology since November 2014. He is responsible for managing the Company’s business operations worldwide and for overseeing the Company’s information technology. Mr. Pronsati served as the Company’s Senior Vice President, Global Operations and Information Technology from February 2013, when he joined the Company, until November 2014. Previously, he was Senior Vice President, Operations at Taleo from April 2005 to May 2012.
Ayman Sayed, 55, has been the Company’s President, Chief Product Officer since August 2016. He served as the Company’s Executive Vice President and Chief Product Officer from August 2015, when he joined the Company, until August 2016. Mr. Sayed is responsible for the strategy and development of CA’s full portfolio of products and solutions. Previously, he served as Senior Vice President of Engineering, Mobility Virtualization Group at Cisco Systems, Inc., which designs and sells broad lines of products, provides services and delivers integrated solutions to develop and connect networks around the world, from August 2014 to August 2015, where he oversaw the vision and engineering direction for Cisco System’s software strategy. He was previously Senior Vice President of Engineering, Network Operating System Group at Cisco Systems from February 2012 to August 2014 and Vice President of Engineering, Enterprise Switching Group at Cisco Systems from June 2010 to February 2012.
21
Part II
Item 5. Market for Registrant’s Common Equity, Related Stockholder Matters and Issuer Purchases of Equity Securities.
Our common stock is traded on The NASDAQ Global Select Market tier of The NASDAQ Stock Market LLC (“NASDAQ”) under the symbol “CA.” The following table sets forth, for the fiscal quarters indicated, the quarterly high and low closing sales prices on NASDAQ:
Fiscal 2018 | Fiscal 2017 | ||||||||||||||
High | Low | High | Low | ||||||||||||
Fourth Quarter | $ | 37.12 | $ | 32.66 | $ | 33.25 | $ | 30.95 | |||||||
Third Quarter | $ | 34.29 | $ | 32.12 | $ | 33.29 | $ | 30.41 | |||||||
Second Quarter | $ | 35.03 | $ | 30.85 | $ | 34.85 | $ | 31.95 | |||||||
First Quarter | $ | 35.80 | $ | 31.04 | $ | 33.58 | $ | 29.36 | |||||||
At April 30, 2018, we had approximately 4,400 stockholders of record.
We have paid cash dividends each year since July 1990. During each of fiscal 2018 and 2017, we paid annual cash dividends of $1.02 per share. During each of fiscal 2018 and 2017, we paid quarterly cash dividends of $0.255 per share.
Purchases of Equity Securities by the Issuer
The following table sets forth, for the months indicated, our purchases of common stock in the fourth quarter of fiscal 2018:
Issuer Purchases of Equity Securities
Period | Total Number Of Shares Purchased | Average Price Paid Per Share | Total Number Of Shares Purchased As Part Of Publicly Announced Plans Or Programs | Approximate Dollar Value Of Shares That May Yet Be Purchased Under The Plans Or Programs | |||||||||
(in thousands, except average price paid per share) | |||||||||||||
January 1, 2018 — January 31, 2018 | — | $ | — | — | $ | 506,509 | |||||||
February 1, 2018 — February 28, 2018 | — | $ | — | — | $ | 506,509 | |||||||
March 1, 2018 — March 31, 2018 | 575 | $ | 34.74 | 575 | $ | 486,509 | |||||||
Total | 575 | $ | 34.74 | 575 | $ | 486,509 | |||||||
In November 2015, our Board of Directors (the “Board”) approved a stock repurchase program that authorized us to acquire up to $750 million of our common stock. We expect to repurchase shares on the open market, through solicited or unsolicited privately negotiated transactions or otherwise from time to time based on market conditions and other factors.
During fiscal 2018, we repurchased 5.0 million shares of our common stock for $163 million. At March 31, 2018, we remained authorized to purchase $487 million of our common stock under our current stock repurchase program.
During fiscal 2017, we repurchased 3.1 million shares of our common stock for $100 million.
22
Item 6. Selected Financial Data.
The information set forth below should be read in conjunction with the “Results of Operations” section included in Item 7, “Management’s Discussion and Analysis of Financial Condition and Results of Operations.”
Year Ended March 31, | |||||||||||||||||||
Statement Of Operations And Other Data | 2018 | 2017 | 2016 | 2015 | 2014 | ||||||||||||||
(in millions, except per share amounts) | |||||||||||||||||||
Total revenue | $ | 4,235 | $ | 4,036 | $ | 4,025 | $ | 4,262 | $ | 4,412 | |||||||||
Income from continuing operations (1) | $ | 476 | $ | 775 | $ | 769 | $ | 810 | $ | 887 | |||||||||
Net cash provided by operating activities - continuing operations (2) | $ | 1,198 | $ | 1,078 | $ | 1,066 | $ | 1,061 | $ | 1,007 | |||||||||
Basic income per common share from continuing operations | $ | 1.14 | $ | 1.85 | $ | 1.79 | $ | 1.83 | $ | 1.97 | |||||||||
Diluted income per common share from continuing operations | $ | 1.13 | $ | 1.85 | $ | 1.78 | $ | 1.82 | $ | 1.96 | |||||||||
Dividends declared per common share (3) | $ | 1.02 | $ | 1.02 | $ | 1.00 | $ | 1.00 | $ | 1.00 | |||||||||
(1) | In fiscal 2018, we incurred a tax charge of $290 million from reasonable estimates of the impact of changes in tax law in the United States from the Tax Cuts and Jobs Act (“Tax Act”). In fiscal 2014, we incurred after-tax charges of $114 million for costs associated with our fiscal year 2014 rebalancing plan. |
(2) | Net cash provided by operating activities - continuing operations for fiscal 2017, 2016, 2015 and 2014 were adjusted to reflect the adoption of Accounting Standards Update No. 2016-09 (“ASU 2016-09”), Improvements to Employee Share-Based Payment Accounting (Topic 718). Refer to Note 1, “Significant Accounting Policies,” in the Notes to the Consolidated Financial Statements for further details. |
(3) | In fiscal 2018 and 2017, dividends declared per common share were $0.255 per quarter. In fiscal 2016, 2015 and 2014, dividends declared per common share were $0.25 per quarter. |
At March 31, | |||||||||||||||||||
Balance Sheet Data | 2018 | 2017 | 2016 | 2015 | 2014 | ||||||||||||||
(in millions) | |||||||||||||||||||
Working capital surplus (1) | $ | 1,087 | $ | 727 | $ | 667 | $ | 1,048 | $ | 635 | |||||||||
Working capital surplus, excluding current deferred revenue (2) | $ | 3,376 | $ | 2,949 | $ | 2,864 | $ | 3,162 | $ | 3,054 | |||||||||
Total assets | $ | 13,060 | $ | 12,610 | $ | 11,204 | $ | 10,973 | $ | 12,008 | |||||||||
Long-term debt (less current maturities) | $ | 2,514 | $ | 2,773 | $ | 1,947 | $ | 1,247 | $ | 1,244 | |||||||||
Stockholders’ equity | $ | 5,895 | $ | 5,689 | $ | 5,378 | $ | 5,625 | $ | 5,570 | |||||||||
(1) | Working capital surplus is current assets less current liabilities. |
(2) | Deferred revenue includes amounts billed or collected in advance of revenue recognition, including subscription license agreements, maintenance and professional services. It does not include unearned revenue on future installments not yet billed at the respective balance sheet dates. |
Item 7. Management’s Discussion and Analysis of Financial Condition and Results of Operations.
Introduction
This “Management’s Discussion and Analysis of Financial Condition and Results of Operations” (“MD&A”) is intended to provide an understanding of our financial condition, changes in financial condition, cash flow, liquidity and results of operations. This MD&A should be read in conjunction with our consolidated financial statements and the accompanying Notes to Consolidated Financial Statements appearing elsewhere in this Form 10-K and the Risk Factors included in Part I, Item 1A of this Form 10-K, as well as other cautionary statements and risks described elsewhere in this Form 10-K.
Business Overview
CA Technologies is a global leader in software solutions that simplify complex enterprise environments. Our solutions enable customers to plan, develop, automate, manage and secure applications across mobile, cloud, distributed and mainframe platforms. Many of the largest companies in the world, including most of the Fortune 500 and many government agencies, rely on CA software to help manage and secure their hybrid cloud environments.
23
Our mission is to eliminate the barriers between ideas and business outcomes. To achieve this, we have built a portfolio of solutions that enable customers to leverage the benefits of agility, automation, insights and security in managing business processes and technology investments. Customers are transforming their businesses to better manage the market demands for speed, exceptional customer experience and rich analytics. We believe this journey, broadly referred to as digital transformation, is fueled by software.
In fiscal 2018, our business was organized in three distinct but highly complementary operating segments: Enterprise Solutions, Mainframe Solutions and Services. These also represented the operating segments used by our Chief Executive Officer for evaluating our performance and allocating resources.
• | Our Enterprise Solutions segment includes a broad range of software planning, development, and management tools. More specifically, our solutions help customers with secure application development, infrastructure management, automation, and identity-centric security solutions. These products are designed for mobile, cloud, and distributed computing environments and run on industry standard servers. |
• | Our Mainframe Solutions segment includes solutions for the IBM z Systems® platform, which runs many of our largest customers’ mission critical business applications. Our Mainframe Solutions help customers improve economics by increasing throughput and lowering cost per transaction, increasing business agility through DevOps tooling and processes, increasing reliability and availability of operations through machine intelligence and automation solutions, and protecting enterprise data with security and compliance. |
• | Our Services segment helps customers reach their information technology (“IT”) and business goals primarily by enabling the rapid implementation and adoption of our software solutions. Our Services team consists of experienced professionals who provide a variety of services, such as consulting, implementation, application management services, education and support services, to both commercial and government customers. |
Our segments strengthen each other in several ways. Our customers benefit from the ability of CA solutions to span their entire infrastructure stack, across mobile, cloud, distributed, and mainframe. This is critical as customers focus on their end users’ experiences on their apps and the underlying transactions that traverse their heterogeneous environments. CA is one of the few companies positioned to deliver solutions that span mobile, cloud, open systems and mainframe environments. This hybrid cloud capability helps customers remove the barriers between ideas and business outcomes. We are able to bidirectionally leverage our core strengths and development efforts in our products within the Enterprise Solutions segment to bring new innovations to the Mainframe Solutions segment and vice versa. Our strong market position enables our investment in development, innovation and support of the mainframe platform to be among the largest in the industry, which sustains ongoing customer commitment to our Mainframe Solutions. Our Services segment leverages our expertise across our Mainframe Solutions and Enterprise Solutions segments and helps customers deploy and maintain our solutions.
The focus of our business is aligned around three strategic pillars: Agile, DevOps and Security, each of which contain portfolios of solutions spanning the continuum of platforms, from mobile to mainframe.
Agile
Our Agile portfolio defines how work is planned, executed and serviced to deliver rapid value to our customers, and enables customers to plan, deliver, manage and optimize application development and project management. Our capabilities within Agile include:
• | Agile Planning helps customers transform their development practices from traditional to modern agile methodologies. Agile development utilizes an iterative work cadence with a feedback loop that decreases time-to-market, increases product quality and, most importantly, maintains a focus on generating rapid business value. CA’s cloud-based solutions in this space help customers to collaboratively plan, prioritize and track agile software development at scale. |
• | Project & Portfolio Management, which is highly complementary to Agile Planning, enables customers to collect, prioritize, plan and deliver products, services and customer experiences. CA’s solutions improve decision making processes and resource optimizations, and decrease project execution risk. |
DevOps
Our DevOps portfolio accelerates software delivery and enables customers to more efficiently deliver and manage applications and infrastructure. The portfolio empowers developers with a rich set of tools that help simplify, automate, and make their processes and applications more robust. They enable better experiences for developers and for the end users of their higher quality applications. Our DevOps portfolio strategy is platform agnostic, providing customers the flexibility to optimize workloads across mobile, cloud, on-premise, and mainframe environments. Our capabilities within DevOps include:
• | Continuous Delivery optimizes the application development processes by automating the deployment of applications across all stages of their lifecycles. Continuous delivery is key to transforming the technical aspects of software delivery. Our solutions enable the development, testing and release teams to work concurrently and continuously to remove the excess overhead and delays that come with traditional software development. |
24
• | Automation solutions help customers transform business processes. They automate, orchestrate and accelerate the entire application delivery process. Our unified platform provides end-to-end automation capabilities that cover service orchestration, workload automation and release automation capabilities. |
• | Agile Operations helps customers correlate end-user, application and infrastructure data from cloud-hosted containers to mainframes. Our solutions help customers see application dependencies and provide intelligent analytics, comprehensive coverage, and an open, extensible architecture that improves end-user experience. |
• | API (Application Programming Interface) Management facilitates the creation, security and management of APIs through their lifecycle, enabling customers to connect more directly with end-users via mobile apps, cloud platforms and “Internet of Things” devices. |
Security
Our Security portfolio provides customers, employees and partners seamless access to the right data, regardless of the underlying platform. Our Security portfolio is designed to minimize the risk of data breaches and alleviate the increased pressures faced by chief information security officers. Our capabilities within Security include:
• | Application Security offers a holistic and scalable way to manage security risk across an application lifecycle. Through our acquisition of Veracode, we provide a wide range of security testing and threat mitigation techniques. Our solution is hosted on a unified application security testing platform and integrates into existing development toolchains. This enables users to quickly identify and remediate security flaws earlier in the development process and supports the development of high-quality, secure code. |
• | Identity & Access Management provides enterprise-grade identity management and governance capabilities, including broad provisioning support for on-premises and cloud-based applications, extensibility and flexibility to integrate with other IT systems and consumer-grade scale. |
• | Privileged Access Management enables organizations to control and monitor the access and activity of privileged users, or users with elevated access or administrator rights. Our solutions help detect and prevent the threat of internal and external attacks leveraging both network and host-based controls for the enterprise and hybrid cloud. |
• | Payment Security is a software as a service (“SaaS”)-based payment authentication service to help banks protect against fraud and ensure a hassle-free online shopping experience for their customers. |
Our goal is to be the world’s leading independent enterprise software provider that helps organizations and enterprises plan, develop, manage, and secure modern software environments, across mainframe, distributed, cloud and mobile platforms. To accomplish this, key elements of our strategy include:
• | Drive organic innovation. Our product development strategy is built around key growth areas, where we are focused on innovating and delivering differentiated products and solutions across both distributed and mainframe platforms. |
• | Incubate technology for next generation products. We are researching and dedicating resources to the development of emerging technologies that are logical extensions of our core areas of focus. We are working on opportunities in areas such as containers, data analytics, big data, artificial intelligence, machine learning and open source, some of which may enhance or extend our current product portfolio and others of which may evolve into new product categories. |
• | Pursue new business models and expanded routes to market. While our traditional on-premise software delivery remains relevant to many enterprise customers, we see cloud-based and try-and-buy models as attractive to both our existing and potential customers. These models simplify decision-making and accelerate the value customers can derive from new solution investments. |
• | Expand relationships with our global customer base and address opportunities with new and underserved customers. We are focused on maintaining and expanding the strong relationships with our established customer base, and will proactively target growth with other potential customers that we do not currently serve. |
• | Execute strategic and disciplined technology acquisitions. We intend to supplement our organic innovation efforts with key technology acquisitions that are within or adjacent to our core areas of focus. We also focus on organically developing nascent technologies from companies we have acquired to provide them with the necessary interoperability, resilience and security to operate at scale in the large, heterogeneous IT environments utilized by our customers. |
25
CA Technologies Business Model
We generate revenue from the following sources: license fees — licensing our products on a right-to-use basis; maintenance fees — providing customer technical support and product enhancements; service fees — providing professional services such as product implementation, consulting, customer training and customer education; and software as a service (“SaaS”) offerings. SaaS is another delivery model we offer to our customers who prefer to utilize our technology off-premise with little to no infrastructure required. Our SaaS offerings are typically licensed using a subscription fee, most commonly on a monthly or annual basis. The timing and amount of fees recognized as revenue during a reporting period are determined in accordance with generally accepted accounting principles in the United States of America (“GAAP”). Revenue is reported net of applicable sales taxes.
Under our business model, we offer customers a wide range of licensing options. For traditional, on-premise licensing, we typically license to customers either perpetually or on a subscription basis for a specified term. Our customers also purchase maintenance and support services that provide technical support and any general product enhancements released during the maintenance period.
Under a perpetual license, the customer has the right to use the licensed program for an indefinite period of time, typically upon payment of a one-time license fee. If the customer wants to receive maintenance, the customer is required to pay an additional annual maintenance fee.
Under a subscription license, the customer has the right to usage and maintenance of the licensed products during the term of the agreement. Under our licensing terms, customers can license our software products under multi-year licenses, with most customers choosing one to five-year terms, although some large customers may negotiate longer terms. Thereafter, the license generally renews for the same period of time on the same terms and conditions.
For our mainframe solutions, the majority of our licenses provide customers with the right to use one or more of our products up to a specific license capacity, generally measured in millions of instructions per second (“MIPS”). For these products, customers may acquire additional capacity during the term of a license by paying us an additional license fee and maintenance fee. For our enterprise solutions, our licenses may provide customers with the right to use one or more of our products limited to a number of servers, users or copies, among other things. Customers may license these products for additional servers, users or copies, etc., during the term of a license by paying us an additional license fee and maintenance fee.
Our services are typically delivered on a time-and-materials basis, but alternative pay arrangements, such as fixed fee or staff augmentations, could be offered as well.
SaaS is another delivery model we offer for certain products when a customer prefers to use our technology off-premises with little or no infrastructure required. Our SaaS offerings are typically licensed for a designated term using a subscription fee. Some of our SaaS business is transaction or usage-based. Our SaaS products, which are becoming a larger part of our Enterprise Solutions portfolio, typically have a shorter average duration and smaller initial contract values compared to the more traditional on-premise delivery model.
Executive Summary
In general, we treat acquired technologies as organic in the quarter of their one-year anniversary date. Automic Holding GmbH (“Automic”) was acquired during the fourth quarter of fiscal 2017 and, as such, was treated as organic in the fourth quarter of fiscal 2018. Therefore, the first three quarters of fiscal 2018 included inorganic results from our Automic acquisition. Since Veracode, Inc. (“Veracode”) was acquired on the last day of fiscal 2017, it will be treated as organic in the first quarter of fiscal 2019 and, as such, all four quarters of fiscal 2018 included inorganic results from our Veracode acquisition.
A summary of key results for fiscal 2018 compared with fiscal 2017 is as follows:
Revenue
• | Total revenue increased primarily due to an increase in software fees and other revenue and, to a lesser extent, an increase in subscription and maintenance revenue. During fiscal 2018, total revenue included $218 million of inorganic revenue from our Automic and Veracode acquisitions, primarily included in software fees and other revenue. In addition, there was a favorable foreign exchange effect of $51 million for fiscal 2018. |
Bookings
• | Total bookings decreased due to a decline in renewal bookings, which included a large system integrator transaction that occurred in the first quarter of fiscal 2017 with an incremental contract value in excess of $475 million. |
• | Renewal bookings decreased by a percentage in the low-20s primarily due to the aforementioned large system integrator transaction and the timing of our renewal portfolio. |
• | Total new product sales were generally consistent compared with the year-ago period. Excluding a favorable foreign exchange effect, total new product sales decreased by a percentage in the low single digits. |
26
• | Mainframe Solutions new product sales (which includes sales of mainframe products and mainframe capacity) decreased by a percentage in the low single digits primarily due to the aforementioned large system integrator transaction. Excluding the aforementioned large system integrator transaction, Mainframe Solutions new product sales increased by a percentage in the low teens primarily due to higher Mainframe Solutions new product sales attached to renewals compared with the year-ago period. |
• | Enterprise Solutions new product sales increased by a percentage in the low single digits. Excluding the aforementioned large system integrator transaction, Enterprise Solutions new product sales increased by a percentage in the mid-single digits due to our Automic and Veracode acquisitions. Excluding the aforementioned large system integrator transaction and Enterprise Solutions new product sales from our Automic and Veracode acquisitions, Enterprise Solutions new product sales decreased by a percentage in the low teens primarily due to a lower level of renewal bookings, which was attributable to the timing of our renewal portfolio. Typically, renewals provide an increased opportunity to generate new product sales. |
Expenses
• | Operating expenses increased due to $284 million of additional operating expenses associated with our Automic and Veracode acquisitions, which were mainly personnel-related. This increase was partially offset by decreases in non-acquisition-related costs, which included personnel-related costs, legal settlements and commission costs. |
Income taxes
• | Income tax expense for fiscal 2018 and 2017 was $545 million and $298 million, respectively. Our fiscal 2018 and 2017 effective tax rate was 53.4% and 27.8%, respectively. These increases resulted from additional income tax expense of $290 million related to the Tax Cuts and Jobs Act enacted on December 22, 2017 (the “Tax Act”). |
Diluted income per common share
• | Diluted income per common share from continuing operations decreased to $1.13 from $1.85 primarily due to additional income tax expense related to the Tax Act. |
Segment results
• | Mainframe Solutions revenue was generally consistent with the year-ago period. Excluding a favorable foreign exchange effect of $24 million for fiscal 2018, Mainframe Solutions revenue decreased primarily due to insufficient revenue from prior period new sales to offset the decline in revenue contribution from renewals. Mainframe Solutions operating margin increased primarily due to a decrease in corporate overhead costs and the Mainframe Solutions portion of the litigation settlement costs incurred during fiscal 2017. |
• | Enterprise Solutions revenue increased due to $194 million of revenue generated from our Automic and Veracode acquisitions during fiscal 2018, partially offset by a decrease in sales from our more mature Enterprise Solutions products. Enterprise Solutions operating margin decreased primarily due to costs associated with our Automic and Veracode acquisitions, which were mainly personnel-related. |
• | Services revenue increased due to $24 million of professional services revenue generated from our Automic and Veracode acquisitions during fiscal 2018, partially offset by a decline in non-acquisition-related professional services engagements. The decline in non-acquisition-related professional services engagements was a result of several factors, including our products being easier to install and manage and an increase in customers’ use of partners for services engagements. Operating margin for Services increased primarily due to an increase in professional services revenue from our Automic and Veracode acquisitions and a decrease in personnel-related costs resulting from severance actions during fiscal 2017. |
Cash flow from continuing operations
• | Net cash provided by operating activities from continuing operations increased primarily due to an increase in cash collections from billings of $276 million mainly from collections from our Automic and Veracode acquisitions and a decrease in income tax payments, net of $34 million, partially offset by an increase in vendor disbursements and payroll of $204 million mainly from disbursements from our Automic and Veracode acquisitions. |
27
Performance Indicators
Management uses several quantitative and qualitative performance indicators to assess our financial results and condition. Each provides a measurement of the performance of our business and how well we are executing our plan.
Our predominantly subscription-based business model is less common among our competitors in the software industry and it may be difficult to compare the results for many of our performance indicators with those of our competitors. The following is a summary of the performance indicators that management uses to review performance:
Year Ended March 31, | Change | Percent Change | |||||||||||||
2018 | 2017 | ||||||||||||||
(dollars in millions) | |||||||||||||||
Total revenue | $ | 4,235 | $ | 4,036 | $ | 199 | 5 | % | |||||||
Income from continuing operations (1) | $ | 476 | $ | 775 | $ | (299 | ) | (39 | )% | ||||||
Net cash provided by operating activities - continuing operations (2) | $ | 1,198 | $ | 1,078 | $ | 120 | 11 | % | |||||||
Total bookings | $ | 4,074 | $ | 4,763 | $ | (689 | ) | (14 | )% | ||||||
Subscription and maintenance bookings | $ | 3,029 | $ | 3,918 | $ | (889 | ) | (23 | )% | ||||||
Weighted average subscription and maintenance license agreement duration in years | 3.25 | 3.83 | (0.58 | ) | (15 | )% | |||||||||
(1) | In fiscal 2018, income from continuing operations included a tax charge of $290 million from reasonable estimates of the impact of changes in tax law in the United States from the Tax Act. |
(2) | Net cash provided by operating activities - continuing operations for fiscal 2017 was adjusted to reflect the adoption of ASU 2016-09. Refer to Note 1, “Significant Accounting Policies” in the Notes to the Consolidated Financial Statements for further details. |
At March 31, | Change | Percent Change | |||||||||||||
2018 | 2017 | ||||||||||||||
(dollars in millions) | |||||||||||||||
Cash and cash equivalents | $ | 3,405 | $ | 2,771 | $ | 634 | 23 | % | |||||||
Total debt | $ | 2,783 | $ | 2,791 | $ | (8 | ) | — | % | ||||||
Total expected future cash collections from committed contracts (1) | $ | 5,199 | $ | 5,304 | $ | (105 | ) | (2 | )% | ||||||
Total revenue backlog (1) | $ | 7,515 | $ | 7,556 | $ | (41 | ) | (1 | )% | ||||||
Total current revenue backlog (1) | $ | 3,372 | $ | 3,240 | $ | 132 | 4 | % | |||||||
(1) | Refer to the discussion in the “Liquidity and Capital Resources” section of this MD&A for additional information about expected future cash collections from committed contracts and revenue backlog. |
Analyses of our performance indicators shown above and our segment performance can be found in the “Results of Operations” and “Liquidity and Capital Resources” sections of this MD&A.
Total Revenue: Total revenue is the amount of revenue recognized during the reporting period from the sale of license, maintenance, SaaS and professional services agreements. Amounts recognized as subscription and maintenance revenue are recognized ratably over the term of the agreement. Professional services revenue is generally recognized as the services are performed or recognized on a ratable basis over the term of the related software arrangement. Software fees and other revenue generally represents license fee revenue recognized at the inception of a license agreement (i.e., upfront basis) and also includes our SaaS revenue, which is recognized as services are provided.
Price changes do not have a material effect on revenue in the period they become effective as a result of our ratable subscription model.
Subscription and Maintenance Revenue: Subscription and maintenance revenue is the amount of revenue recognized ratably during the reporting period from: (i) subscription license agreements that were in effect during the period, generally including maintenance that is bundled with and not separately identifiable from software usage fees or product sales, (ii) maintenance agreements associated with providing customer technical support and access to software fixes and upgrades that are separately identifiable from software usage fees or product sales, and (iii) license agreements bundled with additional products, maintenance or professional services for which vendor specific objective evidence (“VSOE”) has not been established. These amounts include the sale of products directly by us, as well as by distributors and volume partners, value-added resellers and exclusive representatives to end-users, where the contracts incorporate the right for end-users to receive unspecified future software products, and other contracts entered into in close proximity or contemplation of such agreements. The vast majority of our subscription and maintenance revenue in any particular reporting period comes from contracts signed in prior periods, generally ranging in duration from one to five years.
28
Total Bookings: Total bookings, or sales, includes the incremental value of all subscription, maintenance and professional services contracts and software fees and other contracts entered into during the reporting period and is generally reflective of the amount of products and services during the period that our customers have agreed to purchase from us. License fees for bookings attributed to sales of software products for which revenue is recognized on an upfront basis is reflected in “Software fees and other” in our Consolidated Statements of Operations, while the maintenance portion is reflected in “Subscription and maintenance” in our Consolidated Statements of Operations. Our SaaS bookings are recognized as revenue in “Software fees and other,” generally ratably over the term of the SaaS arrangement, rather than upfront.
Our management looks within total bookings at renewal bookings, which we define as bookings attributable to the renewable value of a prior contract (i.e., the maintenance value and, in the case of non-perpetual licenses, the license value), and at total new product sales, which we define as sales of mainframe and enterprise solutions products and mainframe solutions capacity that are new or in addition to sales of products or mainframe solutions capacity previously contracted for by a customer. Renewal bookings, as we report them, do not include new product or capacity sales or professional services arrangements and are reflected as subscription and maintenance bookings in the period (for which revenue is recognized ratably over the term of the contract). Renewals can close before their scheduled renewal date for a number of reasons, including customer preference, customer needs for additional products or capacity, or at our request. The level of contracts closed prior to scheduled expiration dates and the reasons for such closings can vary from quarter to quarter. Generally, quarters with smaller renewal inventories result in a lower level of bookings, since renewals remain an important opportunity for new product sales.
Mainframe Solutions new product sales and capacity growth can be inconsistent on both a quarterly and annual basis. We believe the period-over-period change in Mainframe Solutions new product sales and capacity combined is an appropriate measure of performance and, therefore, we provide only total Mainframe Solutions new sales information, which includes mainframe solutions capacity. The amount of new product sales for a period, as currently tracked by us, requires estimation by management and is reported by providing only growth rate comparisons. Within a given period, the amount of new product sales may not be material to the change in our total bookings or revenue compared with prior periods. New product sales can be reflected as subscription and maintenance bookings in the period (for which revenue would be recognized ratably over the term of the contract) or in software fees and other bookings (which are recognized as software fees and other revenue in the current period).
Subscription and Maintenance Bookings: Subscription and maintenance bookings is the aggregate incremental amount we expect to collect from our customers over the terms of the underlying subscription and maintenance agreements entered into during a reporting period. These amounts include the sale of products either directly by us or through distributors and volume partners, value-added resellers and exclusive representatives to end-users and may include the right for the customer to receive unspecified future software products and/or additional products, services or other fees for which we have not established VSOE for all undelivered elements. These amounts are recognized ratably as subscription and maintenance revenue over the applicable term of the agreements. Subscription and maintenance bookings excludes the value associated with perpetual licenses for which revenue is recognized on an upfront basis, SaaS offerings and professional services arrangements.
Within bookings, we also consider the yield on our renewals. We define “renewal yield” as the percentage of the renewable value of a prior contract (i.e., the maintenance value and, in the case of non-perpetual licenses, the license value) realized in current period bookings. The renewable value of a prior contract is an estimate affected by various factors including contractual renewal terms, price increases and other conditions. Price increases are not considered as part of the renewable value of the prior period contract. We estimate the aggregate renewal yield for a quarter based on a review of material transactions generally representing a majority of the dollar value of renewals during the current period. There may be no correlation between year-over-year changes in bookings and year-over-year changes in renewal yield, since renewal yield is based on the renewable value of contracts of various durations, most of which are longer than one year.
The license and maintenance agreements that contribute to subscription and maintenance bookings represent binding payment commitments by customers over periods that range generally from one to five years, although in certain cases customer commitments can be for longer periods. These current period bookings are often renewals of prior contracts that also had various durations, usually from one to five years. The amount of new subscription and maintenance bookings recorded in a period is affected by the volume, duration and value of contracts renewed during that period. Subscription and maintenance bookings typically increase in each consecutive quarter during a fiscal year, with the first quarter having the least bookings and the fourth quarter having the most bookings. However, subscription and maintenance bookings may not always follow the pattern of increasing in consecutive quarters during a fiscal year, and the quarter-to-quarter differences in subscription and maintenance bookings may vary. Given the varying durations and dollar amounts of the contracts being renewed, year-over-year comparisons of bookings are not always indicative of the overall bookings trend.
Additionally, period-to-period changes in subscription and maintenance bookings do not necessarily correlate to changes in cash receipts. The contribution to current period revenue from subscription and maintenance bookings from any single license or maintenance agreement is relatively small, since revenue is recognized ratably over the applicable term for these agreements.
29
Weighted Average Subscription and Maintenance License Agreement Duration in Years: The weighted average subscription and maintenance license agreement duration in years reflects the duration of all subscription and maintenance agreements executed during a period, weighted by the total contract value of each individual agreement. Weighted average subscription and maintenance license agreement duration in years can fluctuate from period-to-period depending on the mix of license agreements entered into during a period. Weighted average duration information is disclosed in order to provide additional understanding of the volume of our bookings.
Annualized Subscription and Maintenance Bookings: Annualized subscription and maintenance bookings is an indicator that normalizes the bookings recorded in the current period to account for contract length. It is calculated by dividing the total value of all new subscription and maintenance license agreements entered into during a period by the weighted average subscription and license agreement duration in years for all such subscription and maintenance license agreements recorded during the same period.
Total Revenue Backlog: Total revenue backlog represents the aggregate amount we expect to recognize as revenue in the future as either subscription and maintenance revenue, professional services revenue or software fees and other revenue associated with contractually committed amounts billed or to be billed as of the balance sheet date. Total revenue backlog is composed of amounts recognized as liabilities in our Consolidated Balance Sheets as deferred revenue (billed or collected) as well as unearned amounts yet to be billed under subscription and maintenance and software fees and other agreements. Classification of amounts as current and noncurrent depends on when such amounts are expected to be earned and, therefore, recognized as revenue. Amounts that are expected to be earned and, therefore, recognized as revenue in 12 months or less are classified as current, while amounts expected to be earned in greater than 12 months are classified as noncurrent. The portion of the total revenue backlog that relates to subscription and maintenance agreements is recognized as revenue evenly on a monthly basis over the duration of the underlying agreements and is reported as subscription and maintenance revenue in our Consolidated Statements of Operations. Generally, we believe that an increase or decrease in the current portion of revenue backlog on a year-over-year basis is a favorable or unfavorable indicator of future subscription and maintenance revenue performance, respectively, due to the high percentage of our revenue that is recognized from license agreements that are already committed and being recognized ratably. The value of backlog can fluctuate based upon the timing of contract expirations.
“Deferred revenue (billed or collected)” is composed of: (i) amounts received from customers in advance of revenue recognition and (ii) amounts billed but not collected for which revenue has not yet been earned.
30
Results of Operations
The following table presents revenue and expense line items reported in our Consolidated Statements of Operations for fiscal 2018, 2017 and 2016 and the period-over-period dollar and percentage changes for those line items. These comparisons of past results are not necessarily indicative of future results.
Year Ended March 31, | Dollar Change 2018/2017 | Percent Change 2018/2017 | Dollar Change 2017/2016 | Percent Change 2017/2016 | |||||||||||||||||||||
2018 | 2017 | 2016 | |||||||||||||||||||||||
(dollars in millions) | |||||||||||||||||||||||||
Revenue: | |||||||||||||||||||||||||
Subscription and maintenance | $ | 3,326 | $ | 3,279 | $ | 3,317 | $ | 47 | 1 | % | $ | (38 | ) | (1 | )% | ||||||||||
Professional services | 311 | 301 | 326 | 10 | 3 | (25 | ) | (8 | ) | ||||||||||||||||
Software fees and other | 598 | 456 | 382 | 142 | 31 | 74 | 19 | ||||||||||||||||||
Total revenue | $ | 4,235 | $ | 4,036 | $ | 4,025 | $ | 199 | 5 | % | $ | 11 | — | % | |||||||||||
Expenses: | |||||||||||||||||||||||||
Costs of licensing and maintenance | $ | 302 | $ | 273 | $ | 283 | $ | 29 | 11 | % | $ | (10 | ) | (4 | )% | ||||||||||
Cost of professional services | 298 | 300 | 300 | (2 | ) | (1 | ) | — | — | ||||||||||||||||
Amortization of capitalized software costs | 271 | 243 | 256 | 28 | 12 | (13 | ) | (5 | ) | ||||||||||||||||
Selling and marketing | 1,061 | 1,028 | 1,006 | 33 | 3 | 22 | 2 | ||||||||||||||||||
General and administrative | 406 | 375 | 367 | 31 | 8 | 8 | 2 | ||||||||||||||||||
Product development and enhancements | 642 | 586 | 560 | 56 | 10 | 26 | 5 | ||||||||||||||||||
Depreciation and amortization of other intangible assets | 107 | 77 | 106 | 30 | 39 | (29 | ) | (27 | ) | ||||||||||||||||
Other expenses, net | 29 | 19 | 12 | 10 | 53 | 7 | 58 | ||||||||||||||||||
Total expense before interest and income taxes | $ | 3,116 | $ | 2,901 | $ | 2,890 | $ | 215 | 7 | % | $ | 11 | — | % | |||||||||||
Income from continuing operations before interest and income taxes | $ | 1,119 | $ | 1,135 | $ | 1,135 | $ | (16 | ) | (1 | )% | $ | — | — | % | ||||||||||
Interest expense, net | 98 | 62 | 51 | 36 | 58 | 11 | 22 | ||||||||||||||||||
Income from continuing operations before income taxes | $ | 1,021 | $ | 1,073 | $ | 1,084 | $ | (52 | ) | (5 | )% | $ | (11 | ) | (1 | )% | |||||||||
Income tax expense | 545 | 298 | 315 | 247 | 83 | (17 | ) | (5 | ) | ||||||||||||||||
Income from continuing operations | $ | 476 | $ | 775 | $ | 769 | $ | (299 | ) | (39 | )% | $ | 6 | 1 | % | ||||||||||
31
The following table sets forth, for the fiscal years indicated, the percentage of total revenue presented by the items in the accompanying Consolidated Statements of Operations:
Percentage of Total Revenue for the Year Ended March 31, | |||||||||
2018 | 2017 | 2016 | |||||||
Revenue: | |||||||||
Subscription and maintenance | 79 | % | 81 | % | 82 | % | |||
Professional services | 7 | 8 | 8 | ||||||
Software fees and other | 14 | 11 | 10 | ||||||
Total revenue | 100 | % | 100 | % | 100 | % | |||
Expenses: | |||||||||
Costs of licensing and maintenance | 7 | % | 7 | % | 7 | % | |||
Cost of professional services | 7 | 7 | 7 | ||||||
Amortization of capitalized software costs | 6 | 6 | 6 | ||||||
Selling and marketing | 25 | 25 | 25 | ||||||
General and administrative | 10 | 9 | 9 | ||||||
Product development and enhancements | 15 | 15 | 14 | ||||||
Depreciation and amortization of other intangible assets | 3 | 2 | 3 | ||||||
Other expenses, net | 1 | — | — | ||||||
Total expenses before interest and income taxes | 74 | % | 72 | % | 72 | % | |||
Income from continuing operations before interest and income taxes | 26 | % | 28 | % | 28 | % | |||
Interest expense, net | 2 | 2 | 1 | ||||||
Income from continuing operations before income taxes | 24 | % | 27 | % | 27 | % | |||
Income tax expense | 13 | 7 | 8 | ||||||
Income from continuing operations | 11 | % | 19 | % | 19 | % | |||
Note: Amounts may not add to their respective totals due to rounding.
Revenue
Total Revenue
Total revenue for fiscal 2018 increased compared with fiscal 2017 primarily due to an increase in software fees and other revenue and, to a lesser extent, an increase in subscription and maintenance revenue as described below. During fiscal 2018, total revenue included $218 million of inorganic revenue from our Automic and Veracode acquisitions, primarily included in software fees and other revenue. In addition, there was a favorable foreign exchange effect of $51 million for fiscal 2018.
In general, we treat acquired technologies as organic in the quarter of their one-year anniversary date. Automic was acquired during the fourth quarter of fiscal 2017 and, as such, was treated as organic in the fourth quarter of fiscal 2018. Therefore, the first three quarters of fiscal 2018 included inorganic revenue from our Automic acquisition. Since Veracode was acquired on the last day of fiscal 2017, it will be treated as organic in the first quarter of fiscal 2019 and, as such, all four quarters of fiscal 2018 included inorganic revenue from our Veracode acquisition.
Total revenue for fiscal 2017 increased compared with fiscal 2016 primarily due to an increase in software fees and other revenue, partially offset by decreases in subscription and maintenance revenue and professional services revenue as described below. There was an unfavorable foreign exchange effect of $19 million for fiscal 2017.
Rally Software Development Corp. (“Rally”) and Xceedium, Inc. (“Xceedium”) were acquired during the second quarter of fiscal 2016 and, as such, were treated as organic in the second quarter of fiscal 2017. During the first quarter of fiscal 2017, total revenue included $35 million of inorganic revenue from our Rally and Xceedium acquisitions. During the fourth quarter of fiscal 2017, total revenue included $25 million of inorganic revenue from our Automic acquisition. As noted above, since Veracode was acquired on the last day of fiscal 2017, there was no revenue from Veracode reflected within our Statement of Operations for fiscal 2017.
32
Subscription and Maintenance
Subscription and maintenance revenue for fiscal 2018 increased compared with fiscal 2017 due to $53 million of subscription and maintenance revenue generated from our Automic acquisition during fiscal 2018. This increase was partially offset by a decline in Mainframe Solutions revenue and, to a lesser extent, a decrease in revenue from our more mature Enterprise solutions products (refer to “Performance of Segments” below). There was a favorable foreign exchange effect of $39 million for fiscal 2018.
Subscription and maintenance revenue for fiscal 2017 decreased compared with fiscal 2016 primarily due to a decrease in Mainframe Solutions revenue as well as Enterprise Solutions revenue recognized on a ratable basis. There was an unfavorable foreign exchange effect of $14 million for fiscal 2017.
Professional Services
Professional services revenue primarily includes revenue derived from product implementation, consulting, customer education and customer training services. Professional services revenue for fiscal 2018 increased compared with fiscal 2017 due to $24 million of professional services revenue generated from our Automic and Veracode acquisitions during fiscal 2018, partially offset by a decline in non-acquisition-related professional services engagements. The decline in non-acquisition-related professional services engagements was a result of several factors, including our products being easier to install and manage and an increase in customers’ use of partners for services engagements. For the long term, we expect new versions of our on-premise software to be easier to implement and a higher percentage of our business to shift to a SaaS-based model, which could potentially reduce the demand for our professional services engagements.
Professional services revenue for fiscal 2017 decreased compared with fiscal 2016 primarily due to a decline in non-acquisition-related professional services engagements as discussed above.
Software Fees and Other
Software fees and other revenue consists of revenue that is recognized on an upfront basis and also includes our SaaS revenue. Upfront revenue includes revenue associated with enterprise solutions products recognized on an upfront basis that were sold directly by our sales force and through transactions with distributors and volume partners, value-added resellers and exclusive representatives. Our SaaS revenue is recognized as the services are provided, generally ratably over the term of the SaaS arrangement, rather than upfront.
Software fees and other revenue for fiscal 2018 increased compared with fiscal 2017 primarily due to $141 million of software fees and other revenue generated from our Automic and Veracode acquisitions during fiscal 2018 and, to a lesser extent, an increase in sales from our SaaS solutions.
Software fees and other revenue for fiscal 2017 increased compared with fiscal 2016 primarily due to an increase in SaaS revenue mainly from our CA Agile Central products (acquired from Rally), and, to a lesser extent, an increase in sales of our Enterprise Solutions products recognized on an upfront basis, which included revenue from our Automic acquisition. Software fees and other revenue for fiscal 2017 included $36 million of revenue from acquired technologies.
Total Revenue by Geography
The following table presents the amount of revenue earned from sales to unaffiliated customers in the United States and international regions and corresponding percentage changes for fiscal 2018, 2017 and 2016:
Fiscal 2018 Compared With Fiscal 2017 | Fiscal 2017 Compared With Fiscal 2016 | |||||||||||||||||||||||||||||||||
(dollars in millions) | ||||||||||||||||||||||||||||||||||
2018 | % Of Total | 2017 | % Of Total | % Change | 2017 | % Of Total | 2016 | % Of Total | % Change | |||||||||||||||||||||||||
United States | $ | 2,674 | 63 | % | $ | 2,586 | 64 | % | 3 | % | $ | 2,586 | 64 | % | $ | 2,585 | 64 | % | — | % | ||||||||||||||
International | 1,561 | 37 | 1,450 | 36 | 8 | % | 1,450 | 36 | 1,440 | 36 | 1 | % | ||||||||||||||||||||||
Total | $ | 4,235 | 100 | % | $ | 4,036 | 100 | % | 5 | % | $ | 4,036 | 100 | % | $ | 4,025 | 100 | % | — | % | ||||||||||||||
Revenue in the United States for fiscal 2018 increased compared with fiscal 2017 due to our Automic and Veracode acquisitions. Excluding a favorable foreign exchange effect of $51 million for fiscal 2018, international revenue increased compared with fiscal 2017 due to our Automic acquisition. Excluding the revenue generated from our Automic and Veracode acquisitions, revenue in the United States and international revenue would have decreased.
Revenue in the United States for fiscal 2017 was generally consistent compared with fiscal 2016 primarily due to an increase in software fees and other revenue, offset by decreases in subscription and maintenance revenue and professional services revenue. International revenue increased by $10 million, or 1%, for fiscal 2017 compared with fiscal 2016 primarily due to an increase in software fees and other revenue in the Asia Pacific Japan and Latin America regions. There was an unfavorable foreign exchange effect of $19 million for fiscal 2017.
33
Expenses
Operating Expenses
Operating expenses for fiscal 2018 increased compared with fiscal 2017 due to $284 million of additional operating expenses associated with our Automic and Veracode acquisitions, which were mainly personnel-related. This increase was partially offset by decreases in non-acquisition-related costs, which included personnel-related costs, legal settlements and commission costs.
Based on the timing of our Automic acquisition as discussed above, the first three quarters of fiscal 2018 included inorganic operating expenses from our Automic acquisition. Since Veracode was acquired on the last day of fiscal 2017, all four quarters of fiscal 2018 included inorganic operating expenses from our Veracode acquisition.
We currently expect the costs associated with a restructuring plan (“Fiscal 2019 Plan”) to unfavorably affect operating expenses for fiscal 2019. Refer to Note 18, “Subsequent Events” in the Notes to the Consolidated Financial Statements for additional information.
Operating expenses for fiscal 2017 increased compared with fiscal 2016 primarily due to fiscal 2017 including additional operating expenses associated with our Rally, Xceedium and Automic acquisitions. This increase was partially offset by a favorable foreign exchange effect.
Based on the timing of our Rally, Xceedium and Automic acquisitions as discussed above, fiscal 2017 operating expenses included four quarters of expenses from our Rally and Xceedium acquisitions, while fiscal 2016 only included three quarters of expenses. During the first quarter of fiscal 2017, total operating expenses included $40 million of costs from our Rally and Xceedium acquisitions. In addition, Automic, which was acquired during the fourth quarter of fiscal 2017, contributed $35 million of costs in fiscal 2017, inclusive of one-time transaction costs. Since Veracode was acquired on the last day of fiscal 2017, there were no operating expenses for Veracode reflected within our Statement of Operations for fiscal 2017.
Costs of Licensing and Maintenance
Costs of licensing and maintenance include technical support, royalties, SaaS, and other manufacturing and distribution costs. Costs of licensing and maintenance for fiscal 2018 increased compared with fiscal 2017 due to costs associated with our Automic and Veracode acquisitions during fiscal 2018, which were mainly support and personnel-related.
Costs of licensing and maintenance for fiscal 2017 decreased compared with fiscal 2016 primarily due to a decrease in personnel-related costs as a result of lower headcount and a decrease in external royalties, partially offset by costs associated with our CA Agile Central products (acquired from Rally).
Cost of Professional Services
Cost of professional services consists primarily of our personnel-related costs associated with providing professional services and training to customers. Cost of professional services for fiscal 2018 decreased compared with fiscal 2017 as a result of lower costs primarily due to a decrease in the number of non-acquisition-related professional services engagements and severance actions during fiscal 2017, partially offset by personnel-related costs associated with our Automic and Veracode acquisitions during fiscal 2018. Operating margin for professional services increased to 4% for fiscal 2018 compared with 0% for fiscal 2017 primarily due to an increase in professional services revenue from our Automic and Veracode acquisitions and a decrease in personnel-related costs resulting from severance actions during fiscal 2017.
Cost of professional services for fiscal 2017 was consistent compared with fiscal 2016 due to lower costs attributable to the decline in professional services engagements, offset by an increase in personnel-related costs resulting from severance actions during fiscal 2017. Operating margin for professional services decreased to 0% for fiscal 2017 compared with 8% for fiscal 2016. The decrease in operating margin for professional services was primarily attributable to an overall decline in professional services revenue, an increase in personnel-related costs resulting from severance actions during fiscal 2017 and an increase in costs from our recent acquisitions.
Operating margin for professional services does not include certain additional direct costs that are included within the Services segment (refer to “Performance of Segments” below). Expenses for the Services segment consist of cost of professional services and other direct costs included within selling and marketing and general and administrative expenses.
Amortization of Capitalized Software Costs
Amortization of capitalized software costs consists of the amortization of both purchased software and internally generated capitalized software development costs. Internally generated capitalized software development costs relate to new products and significant enhancements to existing software products that have reached the technological feasibility stage.
We evaluate the useful lives and recoverability of capitalized software and other intangible assets when events or changes in circumstances indicate that an impairment may exist. These evaluations require complex assumptions about key factors such as future customer demand, technology trends and the impact of those factors on the technology we acquire and develop for our products. Impairments or revisions to useful lives could result from the use of alternative assumptions that reflect reasonably possible outcomes related to future customer demand or technology trends for assets within the Enterprise Solutions segment.
34
Amortization of capitalized software costs for fiscal 2018 increased compared with fiscal 2017 primarily due to an increase in amortization expense associated with purchased software products acquired from Automic and Veracode, partially offset by a decrease in amortization of our internally developed software products. With our adoption of the Agile development methodology in fiscal 2014, amortization expense of internally developed software products has decreased as we have not capitalized any internally developed software costs.
Amortization of capitalized software costs for fiscal 2017 decreased compared with fiscal 2016 primarily due to a decrease in amortization of our internally developed software products, partially offset by an increase in amortization of capitalized software costs related to our Rally, Xceedium and Automic acquisitions.
Selling and Marketing
Selling and marketing expenses include the costs relating to our sales force, partners, corporate and business marketing and customer training programs. Selling and marketing expenses for fiscal 2018 increased compared with fiscal 2017. During fiscal 2018, there were $111 million of costs associated with our Automic and Veracode acquisitions, which were mainly personnel-related, and an unfavorable foreign exchange effect of $14 million. These increases were partially offset by a decrease in non-acquisition-related costs of $92 million, which primarily included personnel-related and commission costs.
Selling and marketing expenses for fiscal 2017 increased compared with fiscal 2016 primarily due to $27 million of costs associated with our Rally, Xceedium and Automic acquisitions, which were mainly personnel-related, and, to a lesser extent, an increase in commission expense from our new sales growth during fiscal 2017. These increases were partially offset by a decrease in non-acquisition personnel-related costs of $12 million as a result of a lower headcount.
General and Administrative
General and administrative expenses include the costs of corporate functions, including our executive leadership and administration groups, finance, legal, human resources, corporate communications and other costs such as provisions for doubtful accounts. General and administrative expenses for fiscal 2018 increased compared with fiscal 2017 due to costs associated with our Automic and Veracode acquisitions during fiscal 2018, which were mainly personnel-related.
General and administrative expenses for fiscal 2017 increased compared with fiscal 2016 primarily due to an increase in non-acquisition related costs.
Product Development and Enhancements
For fiscal 2018 and fiscal 2017, product development and enhancements expense represented 15% and 15%, respectively, of total revenue. Product development and enhancements expense for fiscal 2018 increased compared with fiscal 2017. During fiscal 2018, there were $68 million of costs associated with our Automic and Veracode acquisitions, which were mainly personnel-related, and an unfavorable foreign exchange effect. These increases were partially offset by a decrease in non-acquisition-related costs of $21 million, which were mainly personnel-related.
For fiscal 2017 and fiscal 2016, product development and enhancements expense represented 15% and 14%, respectively, of total revenue. The increase in product development and enhancements expense for fiscal 2017 compared with fiscal 2016 was primarily attributable to an increase in personnel-related costs, which included the costs from our Rally, Xceedium and Automic acquisitions.
Depreciation and Amortization of Other Intangible Assets
Depreciation and amortization of other intangible assets consists of both depreciation of property and equipment and amortization of other intangible assets.
Depreciation and amortization of other intangible assets for fiscal 2018 increased compared with fiscal 2017 primarily due to an increase in amortization expense associated with other intangible assets acquired from Automic and Veracode.
Depreciation and amortization of other intangible assets for fiscal 2017 decreased compared with fiscal 2016 primarily due to a decrease in amortization expense associated with other intangible assets that became fully amortized in recent periods and, to a lesser extent, a decrease in property and equipment depreciation expense. These decreases were partially offset by an increase in amortization of other intangible assets from our Rally, Xceedium and Automic acquisitions.
35
Other Expenses, Net
The summary of other expenses, net was as follows:
Year Ended March 31, | ||||||||||||
(in millions) | 2018 | 2017 | 2016 | |||||||||
Legal settlements | $ | 1 | $ | 24 | $ | (13 | ) | |||||
Losses from foreign exchange derivative contracts | 13 | 4 | 6 | |||||||||
Losses (gains) from foreign exchange rate fluctuations | 14 | (6 | ) | 20 | ||||||||
Other miscellaneous items | 1 | (3 | ) | (1 | ) | |||||||
Total | $ | 29 | $ | 19 | $ | 12 | ||||||
For fiscal 2017, other expenses, net included a $32 million legal settlement expense related to a settlement agreement that was then being negotiated with the U.S. government pertaining to our General Services Administration (“GSA”) schedule contract. The settlement agreement was finalized and the settlement amount was paid in full in the fourth quarter of fiscal 2017.
For fiscal 2016, other expenses, net included a foreign currency transaction loss of $11 million relating to the remeasurement of monetary assets and liabilities of our Argentinian subsidiary. As of March 31, 2018, our remaining net monetary assets in Argentina are not considered material to our overall financial statement presentation.
Interest Expense, Net
Interest expense, net for fiscal 2018 increased compared with fiscal 2017 primarily due to interest expense associated with our 3.600% Senior Notes due August 2022 and our 4.700% Senior Notes due March 2027, which were both issued during the fourth quarter of fiscal 2017.
Interest expense, net for fiscal 2017 increased compared with fiscal 2016 primarily due to fiscal 2017 including four quarters of interest expense associated with our 3.600% Senior Notes due August 2020 issued during the second quarter of fiscal 2016 and our term loan agreement entered into during the third quarter of fiscal 2016.
Refer to the “Liquidity and Capital Resources” section of this MD&A and Note 7, “Debt,” in the Notes to the Consolidated Financial Statements for additional information.
Income Taxes
Income tax expense for fiscal 2018, 2017 and 2016 was $545 million, $298 million and $315 million, respectively. Our effective tax rate was 53.4%, 27.8% and 29.1% for fiscal 2018, 2017 and 2016, respectively.
The increase in the effective tax rate for fiscal 2018 compared with fiscal 2017 resulted from additional income tax expense related to the Tax Act. The decrease in the effective tax rate for fiscal 2017 compared with fiscal 2016 resulted primarily from reductions in valuation allowances for certain jurisdictions due to changes in our judgment of estimated future taxable income.
Income tax expense for fiscal 2018 includes $290 million resulting from reasonable estimates of the impact of changes in tax law in the United States from the Tax Act. The amounts recorded for the impacts of the Tax Act are provisional amounts of $194 million related to the taxation of unremitted earnings of our foreign subsidiaries, which is payable over eight years, and $96 million related to the remeasurement of deferred tax assets and liabilities for the change in income tax rates. The provisional amounts were reduced by $28 million from our prior estimate due to results from the full fiscal 2018 operations needed for calculations under the Tax Act and analysis of the historic unremitted earnings of our foreign subsidiaries. We will continue to refine the provisional amounts as we review and analyze the historic unremitted earnings of our foreign subsidiaries and take into consideration any additional regulatory guidance published by the U.S. tax authorities in respect of the Tax Act. We expect to finalize the tax expense as soon as practical, but not later than the third quarter of fiscal 2019.
Previously, we did not recognize a deferred tax liability related to undistributed foreign earnings of our subsidiaries because such earnings were considered to be indefinitely reinvested in our foreign operations. Under the Tax Act, all foreign earnings are subject to U.S. taxation and we have recorded a provisional estimate of $194 million for the deemed repatriation tax on these earnings. Except to the extent of the U.S. income tax recognized under the Tax Act, we have not recognized other income taxes (e.g., state and foreign) and withholding taxes that would be incurred upon remittance of $2,274 million and $3,202 million at March 31, 2018 and 2017, respectively, of unremitted earnings of our foreign subsidiaries since we plan to permanently reinvest all such earnings outside the United States. Due to complexities in the laws of the foreign jurisdictions and the assumptions that would have to be made, it is not practicable to estimate the amount of tax associated with such unremitted earnings.
36
In November 2013, we received a tax assessment from the Brazilian tax authority relating to fiscal 2008 - 2013. The assessment included a report of findings in connection with the examination. We disagree with the proposed adjustments in the assessment and intend to vigorously dispute these matters through applicable judicial procedures, as appropriate. As the result of decisions at the administrative courts, the total potential liability from the tax assessment at March 31, 2018 was 228 million Brazilian reais (which translated to $69 million at March 31, 2018), including interest and penalties accumulated through March 31, 2018 and further regulatory assessments associated with appealing to the judicial courts. While we believe that we will ultimately prevail, if the assessment is not resolved in our favor, it would have an impact on our consolidated financial position, cash flows and results of operations.
We do not believe it is reasonably possible that the amount of unrecognized tax benefits will significantly increase or decrease within the next 12 months.
Refer to Note 14, “Income Taxes,” in the Notes to the Consolidated Financial Statements for additional information.
Discontinued Operations
In the fourth quarter of fiscal 2016, we sold CA ERwin Data Modeling solution assets (“ERwin”) for $50 million and recognized a gain on disposal of $4 million, including tax expense of $24 million. The effective tax rate on the disposal was unfavorably affected by non-deductible goodwill of $36 million.
The divestiture of ERwin resulted from an effort to rationalize our product portfolio within the Enterprise Solutions segment. The results of this business were presented in income from discontinued operations for fiscal 2016.
Refer to Note 3, “Divestitures,” in the Notes to the Consolidated Financial Statements for additional information.
Performance of Segments
In accordance with Financial Accounting Standards Board (“FASB”) Accounting Standards Codification (“ASC”) Topic 280, Segment Reporting, we disaggregate our operations into Mainframe Solutions, Enterprise Solutions and Services segments, which are utilized by our Chief Operating Decision Maker, who is our Chief Executive Officer, for evaluating segment performance and allocating resources.
Our Mainframe Solutions and Enterprise Solutions segments are comprised of our software business organized by the nature of our software offerings and the platforms on which our products operate. Our Mainframe Solutions segment products help customers and partners transform mainframe management, gain more value from existing technology and extend mainframe capabilities. Our Enterprise Solutions segment includes products that are designed for mobile, cloud, and distributed computing environments and run on industry standard servers. Our Services segment is comprised of product implementation, consulting, customer education and customer training services, including those directly related to our Mainframe Solutions and Enterprise Solutions software that we sell to our customers.
We regularly enter into a single arrangement with a customer that includes mainframe solutions, enterprise solutions and services. The amount of contract revenue assigned to operating segments is generally based on the manner in which the proposal is made to the customer. The software product revenue assigned to our Mainframe Solutions and Enterprise Solutions segments is based on either: (1) a list price allocation method (which allocates a discount in the total contract price to the individual products in proportion to the list price of the products); (2) allocations included within internal contract approval documents; or (3) the value for individual software products as stated in the customer contract. The price for the implementation, consulting, education and training services is separately stated in the contract and these amounts of contract revenue are assigned to our Services segment. The contract value assigned to each operating segment is then recognized in a manner consistent with the revenue recognition policies we apply to the customer contract for purposes of preparing our consolidated financial statements.
Segment expenses include costs that are controllable by segment managers (i.e., direct costs) and, in the case of our Mainframe Solutions and Enterprise Solutions segments, an allocation of shared and indirect costs (i.e., allocated costs). Segment-specific direct costs include a portion of selling and marketing costs, licensing and maintenance costs, product development costs and general and administrative costs. Allocated segment costs primarily include indirect and non-segment-specific direct selling and marketing costs and general and administrative costs that are not directly attributable to a specific segment. The basis for allocating shared and indirect costs between our Mainframe Solutions and Enterprise Solutions segments is dependent on the nature of the cost being allocated and is generally either in proportion to segment revenues or in proportion to the related direct cost category. Expenses for our Services segment consist of cost of professional services and other direct costs included within selling and marketing and general and administrative expenses. There are no allocated or indirect costs for our Services segment.
Segment expenses do not include amortization of purchased software, amortization of other intangible assets, amortization of internally developed software products, share-based compensation expense, severance and facility actions approved by the Board and other miscellaneous costs. A measure of segment assets is not currently provided to our Chief Executive Officer and has therefore not been disclosed.
37
Segment financial information for fiscal 2018, 2017 and 2016 is as follows:
Mainframe Solutions | Fiscal 2018 | Fiscal 2017 | Fiscal 2016 | |||||||||
Revenue | $ | 2,176 | $ | 2,182 | $ | 2,215 | ||||||
Expenses | 785 | 851 | 854 | |||||||||
Segment profit | $ | 1,391 | $ | 1,331 | $ | 1,361 | ||||||
Segment operating margin | 64 | % | 61 | % | 61 | % | ||||||
Mainframe Solutions revenue for fiscal 2018 was generally consistent with fiscal 2017. Excluding a favorable foreign exchange effect of $24 million for fiscal 2018, Mainframe Solutions revenue decreased primarily due to insufficient revenue from prior period new sales to offset the decline in revenue contribution from renewals. Mainframe Solutions operating margin for fiscal 2018 increased compared with fiscal 2017 primarily due to a decrease in corporate overhead costs and the Mainframe Solutions portion of the litigation settlement costs incurred during fiscal 2017.
Mainframe Solutions revenue for fiscal 2017 decreased compared with fiscal 2016 primarily due to insufficient revenue from new sales to offset the decline in revenue contribution from renewals. Mainframe Solutions operating margin for fiscal 2017 was consistent compared with the year-ago period.
Enterprise Solutions | Fiscal 2018 | Fiscal 2017 | Fiscal 2016 | |||||||||
Revenue | $ | 1,748 | $ | 1,553 | $ | 1,484 | ||||||
Expenses | 1,597 | 1,378 | 1,337 | |||||||||
Segment profit | $ | 151 | $ | 175 | $ | 147 | ||||||
Segment operating margin | 9 | % | 11 | % | 10 | % | ||||||
Enterprise Solutions revenue for fiscal 2018 increased compared with fiscal 2017 due to $194 million of revenue generated from our Automic and Veracode acquisitions during fiscal 2018, partially offset by a decrease in sales from our more mature Enterprise Solutions products. Enterprise Solutions operating margin for fiscal 2018 decreased compared with fiscal 2017 primarily due to costs associated with our Automic and Veracode acquisitions, which were mainly personnel-related.
Enterprise Solutions revenue for fiscal 2017 increased compared with fiscal 2016 primarily due to an increase in software fees and other revenue as a result of an increase in SaaS revenue and, to a lesser extent, an increase in sales of our enterprise solutions products recognized on an upfront basis, which included revenue from our fourth quarter acquisition of Automic. Enterprise Solutions operating margin for fiscal 2017 increased compared with fiscal 2016 primarily due to an increase in revenue and, to a lesser extent, a decrease in one-time acquisition-related transaction costs compared with the year-ago period.
Services | Fiscal 2018 | Fiscal 2017 | Fiscal 2016 | |||||||||
Revenue | $ | 311 | $ | 301 | $ | 326 | ||||||
Expenses | 302 | 302 | 303 | |||||||||
Segment profit (loss) | $ | 9 | $ | (1 | ) | $ | 23 | |||||
Segment operating margin | 3 | % | — | % | 7 | % | ||||||
Services segment expenses consist of cost of professional services and other direct costs included within selling and marketing and general and administrative expenses that are not included within the “Cost of professional services” line item of our Consolidated Statements of Operations.
Services revenue for fiscal 2018 increased compared with fiscal 2017 due to $24 million of professional services revenue generated from our Automic and Veracode acquisitions during fiscal 2018, partially offset by a decline in non-acquisition-related professional services engagements. The decline in non-acquisition-related professional services engagements was a result of several factors, including our products being easier to install and manage and an increase in customers’ use of partners for services engagements. For the long term, we expect new versions of our on-premise software to be easier to implement and a higher percentage of our business to shift to a SaaS-based model, which could potentially reduce the demand for our professional services engagements. Operating margin for Services increased to 3% for fiscal 2018 compared with 0% for fiscal 2017 primarily due to an increase in professional services revenue from our Automic and Veracode acquisitions and a decrease in personnel-related costs resulting from severance actions during fiscal 2017.
Services revenue for fiscal 2017 decreased compared with fiscal 2016 primarily due to a decline in professional services engagements from prior periods as discussed above. Operating margin for Services decreased to 0% for fiscal 2017 compared with 7% for fiscal 2016 primarily due to an overall decline in professional services revenue and an increase in personnel-related costs resulting from severance actions during fiscal 2017.
38
Refer to Note 16, “Segment and Geographic Information,” in the Notes to the Consolidated Financial Statements for additional information.
Bookings - Fiscal 2018 Compared with Fiscal 2017
Total Bookings: For fiscal 2018 and fiscal 2017, total bookings were $4,074 million and $4,763 million, respectively. This decrease in total bookings was due to a decline in renewal bookings, which included a large system integrator transaction that occurred in the first quarter of fiscal 2017 with an incremental contract value in excess of $475 million.
Based on the timing of our Automic acquisition as discussed above, the first three quarters of fiscal 2018 included inorganic bookings from our Automic acquisition. Since Veracode was acquired on the last day of fiscal 2017, all four quarters of fiscal 2018 included inorganic bookings from our Veracode acquisition.
Subscription and Maintenance Bookings: For fiscal 2018 and fiscal 2017, subscription and maintenance bookings were $3,029 million and $3,918 million, respectively. This decrease in subscription and maintenance bookings was primarily attributable to a decline in renewal bookings, which included the aforementioned large system integrator transaction that occurred in the first quarter of fiscal 2017.
Renewal Bookings: For fiscal 2018, renewal bookings decreased by a percentage in the low-20s compared with fiscal 2017 primarily due to the aforementioned large system integrator transaction that occurred in the first quarter of fiscal 2017 and the timing of our renewal portfolio. For the fourth quarter of fiscal 2018, our renewal yield percentage was above 90%. The average of the renewal yield percentage for the four quarters of fiscal 2018 was above 90%.
• | License Agreements over $10 million: During fiscal 2018, we executed a total of 49 license agreements with incremental contract values in excess of $10 million each, for an aggregate contract value of $1,518 million. During fiscal 2017, we executed a total of 72 license agreements with incremental contract values in excess of $10 million each, for an aggregate contract value of $2,450 million. The decrease during fiscal 2018 compared with fiscal 2017 was primarily attributable to a decline in renewal bookings, which included the aforementioned large system integrator transaction. In addition, as a result of the timing of our renewal portfolio, there was an overall lower number of license agreements with incremental contract values in excess of $10 million each. |
• | Annualized Subscription and Maintenance Bookings and Weighted Average Subscription and Maintenance License Agreement Duration in Years: Annualized subscription and maintenance bookings decreased from $1,023 million in fiscal 2017 to $932 million in fiscal 2018. The weighted average subscription and maintenance license agreement duration in years decreased from 3.83 in fiscal 2017 to 3.25 in fiscal 2018. These decreases were primarily due to the aforementioned large system integrator transaction. Although each contract is subject to terms negotiated by the respective parties, we do not expect the weighted average subscription and maintenance agreement duration in years to change materially from historical levels for end-user contracts. |
Total New Product Sales: Within total bookings, total new product sales for fiscal 2018 were generally consistent compared with fiscal 2017. Excluding a favorable foreign exchange effect, total new product sales for fiscal 2018 decreased by a percentage in the low single digits compared with fiscal 2017.
• | Mainframe Solutions New Product Sales: For fiscal 2018, Mainframe Solutions new product sales (which includes sales of mainframe products and mainframe capacity) decreased by a percentage in the low single digits compared with fiscal 2017 primarily due to the aforementioned large system integrator transaction that occurred in the first quarter of fiscal 2017. Excluding the aforementioned large system integrator transaction, Mainframe Solutions new product sales increased by a percentage in the low teens primarily due to higher Mainframe Solutions new product sales attached to renewals compared with the year-ago period. Overall, we expect our mainframe revenue growth to decline in a low single digit range over the medium term, which we believe is in line with the mainframe market. |
• | Enterprise Solutions New Product Sales: For fiscal 2018, Enterprise Solutions new product sales increased by a percentage in the low single digits compared with fiscal 2017. Excluding the aforementioned large system integrator transaction, Enterprise Solutions new product sales increased by a percentage in the mid-single digits due to our Automic and Veracode acquisitions. Excluding the aforementioned large system integrator transaction and Enterprise Solutions new product sales from our Automic and Veracode acquisitions, Enterprise Solutions new product sales decreased by a percentage in the low teens primarily due to a lower level of renewal bookings, which was attributable to the timing of our renewal portfolio. Typically, renewals provide an increased opportunity to generate new product sales. |
Total Bookings by Geography: Total bookings for fiscal 2018 decreased in all regions except for the Latin America region compared with fiscal 2017 primarily due to a decrease in our renewal portfolio. The decrease in the United States was primarily due to the aforementioned large system integrator transaction that occurred in the first quarter of fiscal 2017. The increase in total bookings in the Latin America region was primarily due to an increase in new product sales and renewals.
39
New Product Sales by Geography: Total new product sales for fiscal 2018 decreased in the United States compared with fiscal 2017 primarily due to a decrease in our renewal portfolio, which included the aforementioned large system integrator transaction that occurred in the first quarter of fiscal 2017, partially offset by an increase from our Automic and Veracode acquisitions. Total new product sales for fiscal 2018 increased in all other regions compared with fiscal 2017. Total new product sales in the Europe, Middle East and Africa region increased primarily due to our Automic acquisition.
Bookings - Fiscal 2017 Compared with Fiscal 2016
Total Bookings: For fiscal 2017 and fiscal 2016, total bookings were $4,763 million and $4,247 million, respectively. The increase in total bookings was primarily due to an increase in renewals and an increase in new product sales.
Total bookings for fiscal 2017 included the replacement and extension of a large system integrator transaction that was scheduled to expire in fiscal 2018 that occurred during the first quarter of fiscal 2017. The large system integrator transaction provided an incremental contract value in excess of $475 million and extended the term of the replaced agreement for an additional five years. Total bookings for fiscal 2016 included a renewal with a large system integrator in excess of $500 million for a term greater than five years that occurred during the second quarter of fiscal 2016.
Subscription and Maintenance Bookings: For fiscal 2017 and fiscal 2016, subscription and maintenance bookings were $3,918 million and $3,489 million, respectively. The increase in subscription and maintenance bookings was primarily attributable to an increase in Mainframe Solutions renewals.
Renewal Bookings: For fiscal 2017, renewal bookings increased by a percentage in the mid-teens compared with fiscal 2016 primarily due to an increase in Mainframe Solutions renewals and, to a lesser extent, an increase in Enterprise Solutions renewals. The increase in Mainframe Solutions renewals was primarily due to an increase in the renewal portfolio for Mainframe Solutions products in fiscal 2017 and, to a lesser extent, the aforementioned renewal with a large system integrator in excess of $475 million that occurred during the first quarter of fiscal 2017, which included a large amount of Mainframe Solutions products. The increase in Enterprise Solutions renewals was primarily attributable to renewals from our Rally, Xceedium and Automic acquisitions. For the fourth quarter of fiscal 2017, our renewal yield percentage was in the low 90% range. The average of the renewal yield percentage for the four quarters of fiscal 2017 was above 90%.
• | License Agreements over $10 million: During fiscal 2017, we executed a total of 72 license agreements with incremental contract values in excess of $10 million each, for an aggregate contract value of $2,450 million. During fiscal 2016, we executed a total of 48 license agreements with incremental contract values in excess of $10 million each, for an aggregate contract value of $1,965 million. |
• | Annualized Subscription and Maintenance Bookings and Weighted Average Subscription and Maintenance License Agreement Duration in Years: Annualized subscription and maintenance bookings increased from $940 million in fiscal 2016 to $1,023 million in fiscal 2017 primarily due to the increase in subscription and maintenance bookings during fiscal 2017 compared with fiscal 2016. The weighted average subscription and maintenance license agreement duration in years increased from 3.71 in fiscal 2016 to 3.83 in fiscal 2017. |
Total New Product Sales: Within total bookings, total new product sales increased by approximately 10% for fiscal 2017 compared with fiscal 2016 primarily due to an increase in Enterprise Solutions new product sales and, to a lesser extent, an increase in Mainframe Solutions new product sales. Excluding acquisitions, total new product sales increased by a percentage in the mid-single digits for fiscal 2017 compared with fiscal 2016.
• | Mainframe Solutions New Product Sales: For fiscal 2017, Mainframe Solutions new product sales (which includes sales of mainframe products and mainframe capacity) increased by a percentage in the mid-teens compared with fiscal 2016 primarily due to an increase in sales of mainframe products, partially offset by a decrease in sales of mainframe capacity. |
• | Enterprise Solutions New Product Sales: For fiscal 2017, Enterprise Solutions new product sales increased by a percentage in the high single digits compared with fiscal 2016 primarily due to new product sales from our Rally, Xceedium and Automic acquisitions. Excluding acquisitions, Enterprise Solutions new product sales decreased by a percentage in the low single digits compared with fiscal 2016. Excluding acquisitions and an unfavorable foreign exchange effect, Enterprise Solutions new product sales were consistent compared with fiscal 2016. Enterprise Solutions new product sales performance was negatively affected by certain products that are more mature and not growing, but which generate positive segment operating margin and cash flows from operations. |
Total Bookings by Geography: Total bookings in fiscal 2017 increased in the United States and all international regions compared with fiscal 2016 primarily due to an increase in renewals.
New Product Sales by Geography: Total new product sales in fiscal 2017 increased primarily in the United States and, to a lesser extent, an increase in the Europe, Middle East and Africa and Asia Pacific Japan regions compared with fiscal 2016. These increases were partially offset by a decrease in the Latin America region compared with fiscal 2016. Total new product sales increased in the United States primarily due to a higher level of new sales attached to our renewal portfolio. Total new product sales decreased in the Latin America region primarily due to continued macro-economic challenges in the region.
40
Selected Quarterly Information
Fiscal 2018 Quarter Ended | Total | |||||||||||||||||||
June 30 | September 30 | December 31 | March 31 | |||||||||||||||||
(dollars in millions, except per share amounts) | ||||||||||||||||||||
Revenue | $ | 1,025 | $ | 1,034 | $ | 1,093 | $ | 1,083 | $ | 4,235 | ||||||||||
Percentage of annual revenue | 24 | % | 24 | % | 26 | % | 26 | % | 100 | % | ||||||||||
Costs of licensing and maintenance | $ | 71 | $ | 73 | $ | 79 | $ | 79 | $ | 302 | ||||||||||
Cost of professional services | $ | 73 | $ | 74 | $ | 76 | $ | 75 | $ | 298 | ||||||||||
Amortization of capitalized software costs | $ | 70 | $ | 67 | $ | 68 | $ | 66 | $ | 271 | ||||||||||
Income (loss) from continuing operations | $ | 178 | $ | 184 | $ | (93 | ) | $ | 207 | $ | 476 | |||||||||
Basic income (loss) per common share from continuing operations | $ | 0.42 | $ | 0.44 | $ | (0.23 | ) | $ | 0.50 | $ | 1.14 | |||||||||
Diluted income (loss) per common share from continuing operations | $ | 0.42 | $ | 0.44 | $ | (0.23 | ) | $ | 0.49 | $ | 1.13 | |||||||||
Fiscal 2017 Quarter Ended | Total | |||||||||||||||||||
June 30 | September 30 | December 31 | March 31 | |||||||||||||||||
(dollars in millions, except per share amounts) | ||||||||||||||||||||
Revenue | $ | 999 | $ | 1,018 | $ | 1,007 | $ | 1,012 | $ | 4,036 | ||||||||||
Percentage of annual revenue | 25 | % | 25 | % | 25 | % | 25 | % | 100 | % | ||||||||||
Costs of licensing and maintenance | $ | 68 | $ | 66 | $ | 68 | $ | 71 | $ | 273 | ||||||||||
Cost of professional services | $ | 75 | $ | 73 | $ | 74 | $ | 78 | $ | 300 | ||||||||||
Amortization of capitalized software costs | $ | 66 | $ | 59 | $ | 57 | $ | 61 | $ | 243 | ||||||||||
Income from continuing operations | $ | 198 | $ | 212 | $ | 208 | $ | 157 | $ | 775 | ||||||||||
Basic income per common share from continuing operations | $ | 0.47 | $ | 0.50 | $ | 0.50 | $ | 0.38 | $ | 1.85 | ||||||||||
Diluted income per common share from continuing operations | $ | 0.47 | $ | 0.50 | $ | 0.50 | $ | 0.38 | $ | 1.85 | ||||||||||
Liquidity and Capital Resources
Our cash and cash equivalent balances are held in numerous locations throughout the world, with 53% held in our subsidiaries outside the United States at March 31, 2018. Cash and cash equivalents totaled $3,405 million at March 31, 2018, representing an increase of $634 million from the March 31, 2017 balance of $2,771 million. During fiscal 2018, there was a $182 million favorable translation effect from foreign exchange rates on cash held outside the United States in currencies other than the U.S. dollar.
On December 22, 2017, the Tax Act was enacted into law. This new law includes significant changes to the U.S. corporate income tax system, including a permanent reduction in the corporate income tax rate, limitations on the deductibility of executive compensation and the transition of U.S. international taxation from a worldwide tax system to a territorial tax system. This new law includes a provision that imposes a transition tax on foreign earnings whether or not such earnings are repatriated to the U.S. and resulted in our recognition of income tax expense of $194 million for fiscal 2018. Refer to Note 14, “Income Taxes” in the Notes to the Consolidated Financial Statements for additional information.
We continue to expect domestic cash, cash equivalents, cash flows from operations and borrowings to be sufficient to fund our domestic operating activities and our investing and financing activities, including, among other things, the payment of regular quarterly dividends, compliance with our debt repayment schedules, repurchases of our common stock and the funding for capital expenditures, for at least the next 12 months and for the foreseeable future thereafter. In addition, we continue to expect foreign cash, cash equivalents and cash flows from foreign operations to be sufficient to fund our foreign operating activities and investing activities, including, among other things, the funding of capital expenditures, acquisitions and research and development, for at least the next 12 months and for the foreseeable future thereafter.
41
Sources and Uses of Cash
Under our subscription and maintenance agreements, customers generally make installment payments over the term of the agreement, often with at least one payment due at contract execution, for the right to use our software products and receive product support, software fixes and new products when available. The timing and actual amounts of cash received from committed customer installment payments under any specific agreement can be affected by several factors, including the time value of money and the customer’s credit rating. Often, the amount received is the result of direct negotiations with the customer when establishing pricing and payment terms. In certain instances, the customer negotiates a price for a single upfront installment payment and seeks its own internal or external financing sources. In other instances, we may assist the customer by arranging financing on the customer's behalf through a third-party financial institution.
Amounts billed or collected as a result of a single installment for the entire contract value, or a substantial portion of the contract value, rather than being invoiced and collected over the life of the license agreement, are reflected in the liability section of our Consolidated Balance Sheets as “Deferred revenue (billed or collected).” Amounts received from either a customer or a third-party financial institution that are attributable to later years of a license agreement have a positive impact on billings and cash provided by operating activities in the current period. Accordingly, to the extent these collections are attributable to the later years of a license agreement, billings and cash provided by operating activities during the license’s later years will be lower than if the payments were received over the license term. We are unable to predict with certainty the amount of cash to be collected from single installments for the entire contract value, or a substantial portion of the contract value, under new or renewed license agreements to be executed in future periods.
For fiscal 2018, gross receipts related to single installments for the entire contract value, or a substantial portion of the contract value, were $486 million compared with $489 million in fiscal 2017.
In any quarter, we may receive payments in advance of the contractually committed date on which the payments were otherwise due. In limited circumstances, we may offer discounts to customers to ensure payment in the current period of invoices that have been billed, but might not otherwise be paid until a subsequent period because of payment terms. Historically, any such discounts have not been material.
Amounts due from customers from our subscription licenses are offset by deferred revenue related to these license agreements, leaving no or minimal net carrying value on our Consolidated Balance Sheets for those amounts. The fair value of these amounts may exceed or be less than this carrying value, but cannot be practically assessed, since there is no existing market for a pool of customer receivables with contractual commitments similar to those owned by us. The actual fair value may not be known until these amounts are sold, securitized or collected. Although these customer license agreements commit the customer to payment under a fixed schedule, to the extent amounts are not yet due and payable by the customer, the agreements are considered executory in nature due to our ongoing commitment to provide maintenance and unspecified future software products as part of the agreement terms.
We can estimate the total amounts to be billed from committed contracts, referred to as our “billings backlog,” and the total amount to be recognized as revenue from committed contracts, referred to as our “revenue backlog.” The aggregate amounts of our billings backlog and trade receivables already reflected in our Consolidated Balance Sheets represent the amounts we expect to collect in the future from committed contracts.
March 31, 2018 | March 31, 2017 | |||||||
(in millions) | ||||||||
Billings backlog: | ||||||||
Amounts to be billed — current | $ | 1,994 | $ | 1,941 | ||||
Amounts to be billed — noncurrent | 2,412 | 2,599 | ||||||
Total billings backlog | $ | 4,406 | $ | 4,540 | ||||
Revenue backlog: | ||||||||
Revenue to be recognized within the next 12 months — current | $ | 3,372 | $ | 3,240 | ||||
Revenue to be recognized beyond the next 12 months — noncurrent | 4,143 | 4,316 | ||||||
Total revenue backlog | $ | 7,515 | $ | 7,556 | ||||
Deferred revenue (billed or collected) | $ | 3,109 | $ | 3,016 | ||||
Total billings backlog | 4,406 | 4,540 | ||||||
Total revenue backlog | $ | 7,515 | $ | 7,556 | ||||
Note: Revenue backlog includes deferred subscription and maintenance, professional services and software fees and other revenue.
42
The 3% decrease in total billings backlog at March 31, 2018 compared with March 31, 2017 was primarily due to a lower level of bookings during fiscal 2018. Excluding a favorable foreign exchange effect, total billings backlog decreased 5% at March 31, 2018 compared with March 31, 2017.
The 1% decrease in total revenue backlog at March 31, 2018 compared with March 31, 2017 was primarily due to a lower level of bookings during fiscal 2018. Excluding a favorable foreign exchange effect, total revenue backlog decreased 3% at March 31, 2018 compared with March 31, 2017.
Current revenue backlog, which is our revenue to be recognized within the next 12 months, increased 4% at March 31, 2018 compared with March 31, 2017 primarily due to an increase from our Automic and Veracode acquisitions. Excluding a favorable foreign exchange effect, current revenue backlog increased 1% at March 31, 2018 compared with March 31, 2017. Current revenue backlog declines as contracts move closer to their renewal dates. We expect revenue backlog will fluctuate throughout the year.
Generally, we believe that a change in current revenue backlog on a year-over-year basis is an indicator of future subscription and maintenance revenue performance due to the high percentage of our revenue that is recognized from license agreements that are already committed and being recognized ratably. We also believe that if we do not demonstrate multiple quarters of total new product and capacity sales growth while maintaining a renewal yield in the low 90% range, our current revenue backlog would be unlikely to increase.
We can also estimate the total cash to be collected in the future from committed contracts, referred to as our “Expected future cash collections,” by adding the total billings backlog to the trade accounts receivable, which represent amounts already billed but not collected, from our Consolidated Balance Sheets.
March 31, 2018 | March 31, 2017 | |||||||
(in millions) | ||||||||
Expected future cash collections: | ||||||||
Total billings backlog | $ | 4,406 | $ | 4,540 | ||||
Trade accounts receivable, net | 793 | 764 | ||||||
Total expected future cash collections | $ | 5,199 | $ | 5,304 | ||||
The decrease in total expected future cash collections at March 31, 2018 compared with March 31, 2017 was primarily driven by a decrease in billings backlog as described above.
Unbilled amounts relating to subscription and maintenance licenses are mostly collectible over a period of one-to-five years and at March 31, 2018, on a cumulative basis, 45%, 74%, 89%, 96% and 100% come due within fiscal 2019 through 2023, respectively.
Net Cash Provided by Operating Activities
Year Ended March 31, | $ Change | ||||||||||||||||||
2018 | 2017 | 2016 | 2018 / 2017 | 2017 / 2016 | |||||||||||||||
(in millions) | |||||||||||||||||||
Cash collections from billings (1) | $ | 4,529 | $ | 4,253 | $ | 4,229 | $ | 276 | $ | 24 | |||||||||
Vendor disbursements and payroll (1) | (2,892 | ) | (2,688 | ) | (2,745 | ) | (204 | ) | 57 | ||||||||||
Income tax payments, net | (350 | ) | (384 | ) | (365 | ) | 34 | (19 | ) | ||||||||||
Other disbursements, net (2) | (89 | ) | (103 | ) | (53 | ) | 14 | (50 | ) | ||||||||||
Net cash provided by operating activities from continuing operations (3) | $ | 1,198 | $ | 1,078 | $ | 1,066 | $ | 120 | $ | 12 | |||||||||
(1) | Amounts include value added taxes and sales taxes. |
(2) | For fiscal 2018, amount includes payments associated with interest, prior period restructuring plans and miscellaneous receipts and disbursements. For fiscal 2017, amount includes $49 million of payments associated with the litigation settlement agreement with the U.S. government pertaining to our GSA schedule contract, and payments associated with interest, prior period restructuring plans and miscellaneous receipts and disbursements. For fiscal 2016, amount includes payments associated with interest, prior period restructuring plans and miscellaneous receipts and disbursements. |
(3) | Net cash provided by operating activities from continuing operations for fiscal 2017 and 2016 was adjusted to reflect the adoption of ASU 2016-09. Refer to Note 1, “Significant Accounting Policies” in the Notes to the Consolidated Financial Statements for further details. |
43
Fiscal 2018 Compared with Fiscal 2017
Operating Activities
Net cash provided by operating activities from continuing operations for fiscal 2018 was $1,198 million, representing an increase of $120 million compared with fiscal 2017. The increase in net cash provided by operating activities was primarily due to an increase in cash collections from billings of $276 million mainly from collections from our Automic and Veracode acquisitions and a decrease in income tax payments, net of $34 million, partially offset by an increase in vendor disbursements and payroll of $204 million mainly from disbursements from our Automic and Veracode acquisitions.
For fiscal 2019, we currently expect payments associated with the Fiscal 2019 Plan to unfavorably affect net cash provided by operating activities from continuing operations. In addition, we currently expect an increase in incremental income tax payments resulting from the Topic 606 adoption and enactment of the Tax Act. Refer to Note 18, “Subsequent Events,” and Note 1, “Significant Accounting Policies,” in the Notes to the Consolidated Financial Statements for additional information.
Investing Activities
Net cash used in investing activities from continuing operations for fiscal 2018 was $65 million compared with $1,337 million for fiscal 2017. The decrease in net cash used in investing activities was primarily due to a decrease in cash paid for acquisitions of businesses and purchased software of $1,273 million, mainly from the acquisitions of Automic and Veracode, compared with the year-ago period.
Financing Activities
Net cash used in financing activities from continuing operations for fiscal 2018 was $680 million compared with net cash provided by financing activities from continuing operations of $321 million for fiscal 2017. The change in net financing activities was primarily due to a decrease in debt borrowings of $850 million associated with our 3.600% Senior Notes due August 2022 and our 4.700% Senior Notes due March 2027, which were both issued during the fourth quarter of fiscal 2017. In addition, there was an increase in net debt repayments from our notional pooling arrangement of $67 million, an increase in common stock repurchases of $63 million, and an increase in debt repayments of $13 million compared with fiscal 2017.
Refer to the “Debt Arrangements” table below for additional information about our debt balances at March 31, 2018.
Fiscal 2017 Compared with Fiscal 2016
Operating Activities
Net cash provided by operating activities from continuing operations for fiscal 2017 was $1,078 million, representing an increase of $12 million compared with fiscal 2016. The increase in net cash provided by operating activities was due to a decrease in vendor disbursements and payroll of $57 million and an increase in cash collections from billings of $24 million from higher single installment collections. These favorable effects were offset by an increase in other disbursements, net of $50 million, primarily due to $49 million of payments associated with the litigation settlement agreement with the U.S. government pertaining to our GSA schedule contract, and an increase in income tax payments, net of $19 million.
Investing Activities
Net cash used in investing activities from continuing operations for fiscal 2017 was $1,337 million compared with $645 million for fiscal 2016. The increase in net cash used in investing activities was primarily due to an increase in net cash paid for acquisitions and purchased software of $644 million and a decrease in proceeds from the sale of short-term investments of $48 million, which were received from the acquisition of Rally during the second quarter of fiscal 2016, compared with the year-ago period.
Financing Activities
Net cash provided by financing activities from continuing operations for fiscal 2017 was $321 million compared with net cash used in financing activities from continuing operations of $475 million for fiscal 2016. The change in net financing activities was primarily due to a decrease in common shares repurchased of $607 million, which was primarily due to our share repurchase arrangement with Careal in fiscal 2016, and a decrease in debt repayments of $403 million, which was primarily due to the repayment of our $400 million borrowing under our revolving credit facility in fiscal 2016. These amounts were partially offset by a decrease in debt borrowings of $250 million compared with fiscal 2016.
Refer to the “Debt Arrangements” table below for additional information about our debt balances at March 31, 2017.
44
Debt Arrangements
Our debt arrangements consisted of the following:
At March 31, | ||||||||
2018 | 2017 | |||||||
(in millions) | ||||||||
Revolving credit facility | $ | — | $ | — | ||||
2.875% Senior Notes due August 2018 | 250 | 250 | ||||||
5.375% Senior Notes due December 2019 | 750 | 750 | ||||||
3.600% Senior Notes due August 2020 | 400 | 400 | ||||||
3.600% Senior Notes due August 2022 | 500 | 500 | ||||||
4.500% Senior Notes due August 2023 | 250 | 250 | ||||||
4.700% Senior Notes due March 2027 | 350 | 350 | ||||||
Term Loan due April 2023 | 285 | 300 | ||||||
Other indebtedness, primarily capital leases | 10 | 8 | ||||||
Unamortized debt issuance costs | (11 | ) | (14 | ) | ||||
Unamortized discount for Senior Notes | (1 | ) | (3 | ) | ||||
Total debt outstanding | $ | 2,783 | $ | 2,791 | ||||
Less the current portion | (269 | ) | (18 | ) | ||||
Total long-term debt portion | $ | 2,514 | $ | 2,773 | ||||
At March 31, 2018, our senior unsecured notes were rated Baa2 (stable) by Moody’s Investor Services, BBB+ (stable) by Standard and Poor’s and BBB+ (stable) by Fitch Ratings.
Significant changes to our debt obligations during fiscal 2018 consisted of the following:
Term Loan: In April 2018, we amended our term loan agreement with Bank of America, N.A. to extend the maturity date from April 2022 to April 2023.
Revolving Credit Facility: In June 2017, we amended our revolving credit facility to extend the termination date from June 2019 to June 2022. Our revolving credit facility provides a maximum committed amount available of $1 billion. The facility also provides us with an option to increase the available credit by an amount up to $500 million. This option is subject to certain conditions and the agreement of the facility lenders. At March 31, 2018 and 2017, there were no outstanding borrowings under our revolving credit facility.
Other Indebtedness: We had $114 million of unsecured and uncommitted multi-currency lines of credit at both March 31, 2018 and 2017 available to meet short-term working capital needs for our subsidiaries. We use guarantees and letters of credit issued by financial institutions to guarantee performance on certain contracts and other items. At March 31, 2018 and 2017, $60 million and $51 million, respectively, of these lines of credit were pledged in support of bank guarantees and other local credit lines. At March 31, 2018 and 2017, none of these arrangements were drawn down by third parties.
From time to time, we examine our debt balances in light of market conditions and other factors and thus, the levels of our debt balances may change. For further information, refer to Note 7, “Debt,” in the Notes to the Consolidated Financial Statements.
Stock Repurchases
In November 2015, the Board approved a stock repurchase program that authorized us to acquire up to $750 million of our common stock. We expect to repurchase shares on the open market, through solicited or unsolicited privately negotiated transactions or otherwise from time to time based on market conditions and other factors.
During fiscal 2018, we repurchased 5.0 million shares of our common stock for $163 million. At March 31, 2018, we remained authorized to purchase $487 million of our common stock under our current stock repurchase program.
During fiscal 2017, we repurchased 3.1 million shares of our common stock for $100 million.
45
In November 2015, we entered into and closed on an arrangement with Careal to repurchase 22 million shares of our common stock in a private transaction. The transaction was valued with an effective share repurchase price of $26.81 per share, which represented a 3% discount to the 10-trading day volume weighted average price of our common stock using a reference date of November 5, 2015. Our payment to Careal upon closing was reduced by $0.25 per share to account for our dividend that was paid on December 8, 2015 to stockholders of record on November 19, 2015. As a result of the share repurchase and dividend payment, in total we paid Careal $590 million during the third quarter of fiscal 2016 in connection with the 22 million shares repurchased. The transaction was funded with U.S. cash on hand and effectively concluded our prior $1 billion stock repurchase program approved by the Board in May 2014.
Including the November 2015 share repurchase arrangement with Careal, we repurchased 26 million shares of our common stock for $707 million during fiscal 2016.
Dividends
We have paid cash dividends each year since July 1990. During fiscal 2018, 2017 and 2016, we paid annual cash dividends of $1.02, $1.02 and $1.00 per share, respectively. During fiscal 2018, 2017 and 2016, we paid quarterly cash dividends of $0.255, $0.255 and $0.25 per share, respectively.
Effect of Foreign Exchange Rate Changes
There was a $182 million favorable translation effect on our cash balances in fiscal 2018 predominantly due to the weakening of the U.S. dollar against the euro (16%), the British pound sterling (12%), the Israeli shekel (3%) and the Danish krone (15%).
There was a $103 million unfavorable translation effect on our cash balances in fiscal 2017 predominantly due to the strengthening of the U.S. dollar against the euro (6%), the British pound sterling (13%) and the Danish krone (6%), partially offset by the weakening of the U.S. dollar against the Brazilian real (15%) and the Israeli shekel (3%).
Off-Balance Sheet Arrangements
We do not have any off-balance sheet arrangements with unconsolidated entities or related parties and, accordingly, off-balance sheet risks to our liquidity and capital resources from unconsolidated entities are limited.
Contractual Obligations and Commitments
We have commitments under certain contractual arrangements to make future payments for goods and services. These contractual arrangements secure the rights to various assets and services to be used in the future in the normal course of business. For example, we are contractually committed to make certain minimum lease payments for the use of property under operating lease agreements. In accordance with current accounting rules, the future rights and related obligations pertaining to such contractual arrangements are not reported as assets or liabilities on our Consolidated Balance Sheets. We expect to fund these contractual arrangements with cash generated from operations in the normal course of business.
The following table summarizes our contractual arrangements at March 31, 2018 and the timing and effect that those commitments are expected to have on our liquidity and cash flow in future periods. In addition, the table summarizes the timing of payments on our debt obligations as reported on our Consolidated Balance Sheet at March 31, 2018.
Payments Due By Period | ||||||||||||||||||||
Contractual Obligations | Total | Less Than 1 Year | 1–3 Years | 3–5 Years | More Than 5 Years | |||||||||||||||
(in millions) | ||||||||||||||||||||
Long-term debt obligations (inclusive of interest) | $ | 3,244 | $ | 381 | $ | 1,357 | $ | 835 | $ | 671 | ||||||||||
Operating lease obligations (1) | 458 | 97 | 159 | 92 | 110 | |||||||||||||||
Purchase obligations | 110 | 75 | 27 | 4 | 4 | |||||||||||||||
Other obligations (2) | 78 | 24 | 25 | 16 | 13 | |||||||||||||||
Total | $ | 3,890 | $ | 577 | $ | 1,568 | $ | 947 | $ | 798 | ||||||||||
(1) | The contractual obligations for noncurrent operating leases exclude sublease income totaling $33 million expected to be received in the following periods: $11 million (less than 1 year); $18 million (1–3 years); and $4 million (3–5 years). |
(2) | $150 million of estimated liabilities related to unrecognized tax benefits are excluded from the contractual obligations table because we could not make a reasonable estimate of when those amounts will become payable. |
46
Critical Accounting Policies and Estimates
We review our financial reporting and disclosure practices and accounting policies quarterly to help ensure that they provide accurate and transparent information relative to the current economic and business environment. Note 1, “Significant Accounting Policies” in the Notes to the Consolidated Financial Statements contains a summary of the significant accounting policies that we use. Many of these accounting policies involve complex situations and require a high degree of judgment, either in the application and interpretation of existing accounting literature or in the development of estimates that affect our financial statements. On an ongoing basis, we evaluate our estimates and judgments based on historical experience as well as other factors that we believe to be reasonable under the circumstances. These estimates may change in the future if underlying assumptions or factors change.
We consider the following significant accounting policies to be critical because of their complexity and the high degree of judgment involved in implementing them.
Revenue Recognition
We generate revenue from the following primary sources: (1) licensing software products, including SaaS license agreements; (2) providing customer technical support (referred to as maintenance); and (3) providing professional services, such as product implementation, consulting, customer education and customer training services.
Software license agreements under our subscription model include the right to receive and use unspecified future software products for no additional fee during the term of the agreement. We are required under GAAP to recognize revenue from these subscription licenses ratably over the term of the agreement. These amounts are recorded as subscription and maintenance revenue.
We also license our software products without the right to unspecified future software products. Revenue from these arrangements is either recognized at the inception of the license agreement (i.e., upfront basis) or ratably over the term of any maintenance agreement that is bundled with the license. Revenue is recognized upfront only when we have established VSOE for all of the undelivered elements of the agreement. We use the residual method to determine the amount of license revenue to be recognized upfront. The residual method allocates arrangement consideration to the undelivered elements based upon VSOE of the fair value of those elements, with the residual of the arrangement consideration allocated to the license. The portion allocated to the license is recognized upfront once all four of the revenue recognition criteria are met as described below. We establish VSOE of the fair value of maintenance from either contractually stated renewal rates or using the bell-shaped curve method. VSOE of the fair value of professional services is established using the bell-shaped curve method based on hourly rates when sold on a stand-alone basis. Upfront revenue is recorded as Software Fees and Other. Revenue recognized on an upfront model will result in higher total revenue in a reporting period than if that revenue was recognized ratably.
If VSOE does not exist for all undelivered elements of an arrangement, we recognize total revenue from the arrangement ratably over the term of the maintenance agreement. Revenue recognized ratably is recorded as “Subscription and maintenance revenue.”
Revenue recognition does not commence until (1) we have evidence of an arrangement with a customer; (2) we deliver the specified products; (3) license agreement terms are fixed or determinable and free of contingencies or uncertainties that may alter the agreement such that it may not be complete and final; and (4) collection is probable. Revenue from sales to distributors and volume partners, value-added resellers and exclusive representatives commences, either on an upfront basis or ratably as described above, when these entities sell the software product to their customers. This is commonly referred to as the sell-through method.
Revenue from professional services arrangements is generally recognized as the services are performed. Revenue and costs from committed professional services that are sold as part of a software license agreement are deferred and recognized on a ratable basis over the life of the related software transaction.
In the event that agreements with our customers are executed in close proximity of other software license agreements with the same customer, we evaluate whether the separate arrangements are linked, and, if so, the agreements are considered a single multi-element arrangement for which revenue is recognized ratably as “Subscription and maintenance” in the Consolidated Statements of Operations, except for SaaS and professional services agreements. In the case of a SaaS agreement that is linked to a subscription-based software license arrangement, revenue is recognized ratably as "Software fees and other" for its respective portion in the Consolidated Statements of Operations. In the case of a professional services agreement that is linked to a subscription-based software license arrangement, revenue is recognized as "Professional services" for its respective portion in the Consolidated Statements of Operations.
We have an established business practice of offering installment payment options to customers and a history of successfully collecting substantially all amounts due under those agreements. We assess collectability based on a number of factors, including past transaction history with the customer and the creditworthiness of the customer. If, in our judgment, collection of a fee is not probable, we will not recognize revenue until the uncertainty is removed through the receipt of cash payment. We do not typically offer installment payments for perpetual license agreements that are recognized upfront within “Software fees and other.”
47
In May 2014, the FASB issued Accounting Standards Update No. 2014-09, Revenue from Contracts with Customers, with amendments in 2015, 2016 and 2017, which creates new ASC Topic 606 (“Topic 606”) that will replace most existing revenue recognition guidance in GAAP when it becomes effective. Topic 606 requires an entity to recognize the amount of revenue to which it expects to be entitled for the transfer of promised goods or services to customers. The new standard will be adopted in our first quarter of fiscal year 2019 with the cumulative effect recognized as of the date of initial application (modified retrospective method).
Refer to Note 1, “Significant Accounting Policies” in the Notes to the Consolidated Financial Statements for additional information on our revenue recognition policy and Topic 606.
Accounts Receivable
The allowance for doubtful accounts is a reserve for the impairment of accounts receivable on the Consolidated Balance Sheets. In developing the estimate for the allowance for doubtful accounts, we rely on several factors, including:
• | Historical information, such as general collection history of multi-year software agreements; |
• | Current customer information and events, such as extended delinquency, requests for restructuring and filings for bankruptcy; |
• | Results of analyzing historical and current data; and |
• | The overall macroeconomic environment. |
The allowance includes two components: (1) specifically identified receivables that are reviewed for impairment when, based on current information, we do not expect to collect the full amount due from the customer; and (2) an allowance for losses inherent in the remaining receivable portfolio based on historical activity.
Income Taxes
We account for income taxes under the asset and liability method. We recognize deferred tax assets and liabilities for the future tax consequences attributable to differences between the financial statement carrying amounts of existing assets and liabilities and their respective tax bases, along with net operating loss and tax credit carryforwards. We measure deferred tax assets and liabilities using enacted tax rates expected to apply to taxable income in the years in which those temporary differences are expected to be recovered or settled. We recognize the effect on deferred tax assets and liabilities from a change in tax rates on income in the period that includes the enactment date.
We recognize the effect of income tax positions only if those positions are more likely than not of being sustained. We reflect changes in recognition or measurement in the period in which the change in judgment occurs. We record interest and penalties related to uncertain tax positions in income tax expense.
The Tax Act introduced significant changes to U.S. income tax law, including a mandatory one-time transition tax on accumulated earnings of foreign subsidiaries and a reduction of the U.S. statutory corporate income tax rate from 35% to 21%, effective January 1, 2018. As a result, we have computed our income tax expense for fiscal 2018 using a blended federal tax rate of 31.55%. The 21% federal tax rate will apply to fiscal 2019 and each fiscal year thereafter. During December 2017, the SEC staff issued Staff Accounting Bulletin No. 118, Income Tax Accounting Implications of the Tax Cuts and Jobs Act, which allows recognition of provisional tax amounts during a measurement period not to extend beyond one year of the enactment date. Due to the timing of the enactment and the complexity involved in applying the provisions of the Tax Act, we have made reasonable estimates for these effects and recorded provisional amounts, including the estimated transition tax and the remeasurement of U.S. deferred tax assets and liabilities, in our consolidated financial statements for fiscal 2018. We will continue to refine the provisional amounts as we review and analyze the historic unremitted earnings of our foreign subsidiaries and take into consideration any additional regulatory guidance published by the U.S. tax authorities in respect of the Tax Act. We expect to finalize the tax expense as soon as practical, but not later than the third quarter of fiscal 2019. Refer to Note 14, “Income Taxes,” in the Notes to the Consolidated Financial Statements for additional information.
Beginning with fiscal 2019, the global intangible low-taxed income (“GILTI”) provisions of the Tax Act requires us to subject to U.S. income tax foreign subsidiary earnings in excess of an allowable return on the foreign subsidiary’s tangible assets. GAAP allows us to choose between an accounting policy that treats the U.S. tax under the GILTI provisions as either a current expense as incurred or as a component of our measurement of deferred taxes. Due to the timing of the enactment and the complexity involved in applying the GILTI provisions, we do not currently have sufficient information available to develop a reasonable estimate or establish an accounting policy for GILTI. Therefore, we have not recorded any tax impacts associated with GILTI on our consolidated financial statements for fiscal 2018. We will continue to analyze the GILTI provisions in fiscal 2019 as information becomes available to finalize a decision on an accounting policy.
48
Goodwill, Capitalized Software Products, and Other Intangible Assets
Goodwill represents the excess of the purchase price over the fair value of net assets acquired in connection with business combinations accounted for using the purchase method of accounting. Goodwill is not amortized, but instead goodwill is required to be tested for impairment annually and under certain circumstances. We review goodwill for impairment on an annual basis on the first day of the fourth quarter of each fiscal year, and on an interim basis whenever events or changes in circumstances indicate that the carrying value may not be recoverable, at the reporting unit level. Our reporting units are the same as our operating segments.
When evaluating goodwill for impairment, based upon our annual test or due to changes in circumstances described above, we first can opt to perform a qualitative assessment to determine if the fair value of a reporting unit is more likely than not (i.e., a likelihood of more than 50%) less than the reporting unit's carrying amount, including goodwill, or we can directly perform the two-step impairment test. This qualitative assessment includes, among other things, consideration of: (i) identifying inputs and assumptions that most affect fair value; (ii) identifying relevant events and circumstances that may have an impact on those inputs and assumptions; (iii) weighing the events and circumstances; and (iv) concluding on the totality of events and circumstances. If this assessment indicates that the fair value of the reporting unit exceeds the carrying value of the net assets assigned to that unit, goodwill is not considered impaired and we are not required to perform further testing. However, if the fair value of a reporting unit is more likely than not to be less than its carrying amount, the two-step impairment test will be performed.
When performing the two-step impairment test, we first determine the estimated fair value of our reporting units using the income approach. Under the income approach, we calculate the estimated fair value of a reporting unit based on the present value of estimated future cash flows. Under the market approach, we calculate the estimated fair value of a reporting unit based on market multiples of revenue or earnings of comparable companies. If the carrying value of the reporting unit exceeds the estimated fair value, we then calculate the implied fair value of goodwill for the reporting unit and compare it to the carrying amount of goodwill for the reporting unit. If the carrying amount of goodwill exceeds the implied fair value, an impairment charge is recorded to our statement of operations to reduce the carrying value to implied value.
Significant judgments and estimates are required in determining the reporting units and assessing the fair value of the reporting units. These estimates and assumptions are complex and subject to a significant degree of judgment with respect to certain factors including, but not limited to, revenue growth rates and operating profit margins that are used to project future cash flows, discount rates, future economic and market conditions and determination of appropriate market comparables. We make certain judgments and assumptions in allocating shared costs among reporting units. We base our fair value estimates on assumptions that are consistent with information used by the business for planning purposes and that we believe to be reasonable; however, actual future results may differ from those estimates. Changes in judgments on any of these factors could materially affect the estimated fair value of the reporting units.
Based on our impairment analysis performed for fiscal 2018, we determined that it was more likely than not that there was no impairment of any of our reporting units and that the estimated fair value of each of our reporting units exceeded the carrying amount of the unit by more than 10% of the carrying amount.
The carrying values of purchased software, internally developed software and other intangible assets are also reviewed for recoverability on a quarterly basis. The facts and circumstances considered include an assessment of the recoverability of the carrying amount of these assets by evaluating future cash flows to be derived from the use of these assets in relation to their unamortized costs. It is not possible for us to predict the likelihood of any possible future impairments or, if such an impairment were to occur, the magnitude of any impairment.
Intangible assets with finite useful lives are subject to amortization over the expected period of economic benefit to us. We evaluate whether events or circumstances have occurred that warrant a revision to the remaining useful lives of intangible assets. In cases where a revision is deemed appropriate, the remaining carrying amounts of the intangible assets are amortized over the revised remaining useful life.
Acquisitions
We apply the provisions of FASB ASC Topic 805, Business Combinations, in the accounting for our acquisitions. It requires us to recognize separately from goodwill the assets acquired and the liabilities assumed at the acquisition date fair values. Goodwill as of the acquisition date is measured as the excess of consideration transferred over the net of the acquisition date fair values of the assets acquired and the liabilities assumed. While we use our best estimates and assumptions to accurately value assets acquired and liabilities assumed at the acquisition date, our estimates are inherently uncertain and subject to refinement. As a result, during the measurement period, which may be up to one year from the acquisition date, we record adjustments to the assets acquired and liabilities assumed with the corresponding offset to goodwill. Upon the conclusion of the measurement period or final determination of the values of assets acquired or liabilities assumed, whichever comes first, any subsequent adjustments are recorded to our Consolidated Statements of Operations.
49
Accounting for business combinations requires us to make significant estimates and assumptions, including fair value estimates, to determine the fair value of assets acquired and liabilities assumed and the related useful lives of the acquired assets, when applicable, as of the acquisition date. Although we believe the assumptions and estimates we have made are reasonable, they are based in part on historical experience and information obtained from the management of the acquired companies and are inherently uncertain. Examples of critical estimates used in valuing certain of the intangible assets we have acquired or may acquire in the future include but are not limited to:
• | future expected cash flows from sales, maintenance agreements and acquired developed technologies; |
• | the acquired company’s trade names and customer relationships as well as assumptions about the period of time the acquired trade names and customer relationships will continue to be used in the combined company’s product portfolio; and |
• | discount rates used to determine the present value of estimated future cash flows. |
These estimates are inherently uncertain and unpredictable, and if different estimates were used, the purchase price for the acquisition could be allocated to the acquired assets and liabilities differently from the allocation that we have made. Additionally, unanticipated events and circumstances may occur which may affect the accuracy or validity of such assumptions, estimates or actual results.
Refer to Note 2, “Acquisitions,” in the Notes to the Consolidated Financial Statements for additional information.
Share-Based Compensation
We currently maintain several stock-based compensation plans. We use the Black-Scholes option-pricing model to compute the estimated fair value of certain share-based awards. The Black-Scholes model includes assumptions regarding dividend yields, expected volatility, expected lives, and risk-free interest rates. These assumptions reflect our best estimates, but these items involve uncertainties based on market and other conditions outside of our control. As a result, if other assumptions had been used, stock-based compensation expense could have been materially affected. Furthermore, if different assumptions are used in future periods, stock-based compensation expense could be materially affected in future years.
As described in Note 13, “Stock Plans,” in the Notes to the Consolidated Financial Statements, performance share units (“PSUs”) are awards under the long-term incentive programs for senior executives where the number of shares or restricted shares, as applicable, ultimately received by the senior executives depends on our performance measured against specified targets and will be determined at the conclusion of the three-year or one-year period, as applicable. The fair value of each award is estimated on the date that the performance targets are established based on the fair value of our stock and our estimate of the level of achievement of our performance targets. We are required to recalculate the fair value of issued PSUs each reporting period until the underlying shares are granted. The adjustment is based on the quoted market price of our stock on the reporting period date. Each quarter, we compare the actual performance we expect to achieve with the performance targets.
Fair Value of Financial Instruments
The measurement of fair value for our financial instruments is based on the authoritative guidance which establishes a fair value hierarchy that is based on three levels of inputs and requires an entity to maximize the use of observable inputs and minimize the use of unobservable inputs when measuring fair value. Refer to Note 9, “Fair Value Measurements,” in the Notes to the Consolidated Financial Statements for additional information.
We are exposed to financial market risks arising from changes in interest rates and foreign exchange rates. Changes in interest rates could affect our monetary assets and liabilities, and foreign exchange rate changes could affect our foreign currency denominated monetary assets and liabilities and forecasted transactions. We enter into derivative contracts with the intent of mitigating a portion of these risks. Refer to Note 8, “Derivatives,” in the Notes to the Consolidated Financial Statements for additional information.
Legal Contingencies
We are currently involved in various legal proceedings and claims. Periodically, we review the status of each significant matter and assess our potential financial exposure. If the potential loss from any legal proceeding or claim is considered probable and the amount can be reasonably estimated, we accrue a liability for the estimated loss. Due to the uncertainty of these matters, significant judgment is required in both the determination of the probability of a loss and the determination as to whether the amount of loss is reasonably estimable, and the decision to record an accrual and the amount of accruals recorded are based only on the information available at the time. As additional information becomes available, we reassess the potential liability related to our pending litigation and claims, and may revise our estimates. Any revisions could have a material effect on our results of operations. Refer to Note 10, “Commitments and Contingencies,” in the Notes to the Consolidated Financial Statements for additional information.
50
New Accounting Pronouncements
For information regarding new accounting pronouncements, and the impact of these pronouncements on our consolidated financial statements, if any, refer to Note 1, “Significant Accounting Policies,” in the Notes to the Consolidated Financial Statements.
Item 7A. Quantitative and Qualitative Disclosures About Market Risk.
Interest Rate Risk
Our exposure to market rate risk for changes in interest rates relates primarily to our investment portfolio and debt. We have a prescribed methodology whereby we invest our excess cash in investments that are composed of money market funds, debt instruments of government agencies and investment grade corporate issuers (Standard and Poor’s BBB or Moody's Investor Services Baa2 rating and higher).
At March 31, 2018, our outstanding debt was $2,783 million. Refer to Note 7, “Debt,” in the Notes to the Consolidated Financial Statements for additional information.
In the third quarter of fiscal 2016, we entered into a $300 million variable rate term loan agreement. A hypothetical 100 basis point increase in interest rates applied to the term loan as of March 31, 2018 would increase interest expense by approximately $3 million per year.
Foreign Exchange Risk
We conduct business on a worldwide basis through subsidiaries in 45 foreign countries and, as such, a portion of our revenues, earnings and net investments in foreign affiliates is exposed to changes in foreign exchange rates. We seek to manage our foreign exchange risk in part through operational means, including managing expected local currency revenues in relation to local currency costs and local currency assets in relation to local currency liabilities. The Board has adopted a Risk Management Policy and Procedure, which authorize us to manage, based on management’s assessment, our risks and exposures to foreign exchange rates through the use of derivative financial instruments (e.g., forward contracts, options and swaps) or other means. We only use derivative financial instruments in the context of hedging and do not use them for speculative purposes.
During fiscal 2018 and 2017, we did not designate our foreign exchange derivatives as hedges. Accordingly, all foreign exchange derivatives are recorded in our Consolidated Balance Sheets at fair value and unrealized or realized changes in fair value from these contracts are recorded as “Other expenses, net” in our Consolidated Statements of Operations.
Refer to Note 8, “Derivatives” in the Notes to the Consolidated Financial Statements for additional information regarding our derivative activities.
If foreign exchange rates affecting our business changed by 10% on an overall basis in comparison to the U.S. dollar, the amount of cash and cash equivalents we would report in U.S. dollars at March 31, 2018 would increase or decrease by approximately $180 million.
Item 8. Financial Statements and Supplementary Data.
Our consolidated financial statements are included in Part IV, Item 15 of this Form 10-K and are incorporated herein by reference.
The supplementary data specified by Item 302 of Regulation S-K as it relates to selected quarterly data is included in the “Selected Quarterly Information” section of Item 7, “Management’s Discussion and Analysis of Financial Condition and Results of Operations.” Information on the effects of changing prices is not required.
Item 9. Changes in and Disagreements with Accountants on Accounting and Financial Disclosure.
Not applicable.
51
Item 9A. Controls and Procedures.
(a) Evaluation of Disclosure Controls and Procedures
Under the supervision and with the participation of the Company’s management, including the Chief Executive Officer and the Chief Financial Officer, the Company has evaluated the effectiveness of its disclosure controls and procedures as such term is defined in Rules 13a-15(e) and 15d-15(e) under the Securities Exchange Act of 1934, as amended (“Exchange Act”). Based on that evaluation, the Chief Executive Officer and the Chief Financial Officer have concluded that the Company’s disclosure controls and procedures were effective as of the end of the period covered by this Form 10-K.
(b) Management’s Report on Internal Control Over Financial Reporting
The Company’s management is responsible for establishing and maintaining adequate internal control over financial reporting as defined in Exchange Act Rules 13a-15(f) and 15d-15(f). The Company’s internal control over financial reporting is a process designed to provide reasonable assurance regarding the reliability of financial reporting and the preparation of financial statements for external purposes in accordance with generally accepted accounting principles.
The Company’s internal control over financial reporting includes those policies and procedures that (i) pertain to the maintenance of records that, in reasonable detail, accurately and fairly reflect the transactions and dispositions of the assets of the Company; (ii) provide reasonable assurance that transactions are recorded as necessary to permit preparation of financial statements in accordance with generally accepted accounting principles, and that receipts and expenditures of the Company are being made only in accordance with authorizations of management and directors of the Company; and (iii) provide reasonable assurance regarding prevention or timely detection of unauthorized acquisition, use, or disposition of the Company’s assets that could have a material effect on the Company’s financial statements.
Because of its inherent limitations, internal control over financial reporting may not prevent or detect misstatements. Therefore, even those systems determined to be effective can provide only reasonable assurance with respect to financial statement preparation and presentation. Also, projections of any evaluation of effectiveness to future periods are subject to the risk that controls may become inadequate because of changes in conditions, or that the degree of compliance with the policies or procedures may deteriorate.
Management conducted its evaluation of the effectiveness of internal control over financial reporting at March 31, 2018 based on the framework in Internal Control — Integrated Framework (2013) issued by the Committee of Sponsoring Organizations of the Treadway Commission. Management’s evaluation included the design of the Company’s internal control over financial reporting and the operating effectiveness of the Company’s internal control over financial reporting. Based on that evaluation, the Company’s management concluded that the Company’s internal control over financial reporting was effective as of the end of the period covered by this Form 10-K.
The Company’s independent registered public accounting firm, KPMG LLP, has audited the effectiveness of the Company’s internal control over financial reporting as stated in their report which appears on page 61 of this Form 10-K.
(c) Changes in Internal Control Over Financial Reporting
There were no changes in the Company’s internal control over financial reporting, as that term is defined in Rules 13a-15(f) and 15d-15(f) under the Exchange Act, that occurred during the fourth fiscal quarter that have materially affected, or are reasonably likely to materially affect, the Company’s internal control over financial reporting.
The Company is adopting the new revenue recognition guidance under Accounting Standards Codification Topic 606 (“Topic 606”) in the first quarter of fiscal year 2019. The adoption of this guidance requires the implementation of a new revenue recognition software system in addition to new accounting processes, policies and procedures. The Company is also required to implement new internal controls for revenue recognition, including the adjustments to retained earnings required under the modified retrospective method of adoption, and the related disclosures required under the new guidance. As a result, during the first quarter of fiscal year 2019, the changes in the Company’s internal controls and processes to meet the requirements of Topic 606 are expected to have a material effect on its internal control over financial reporting. These controls will be newly implemented with limited history of operating effectiveness.
Item 9B. Other Information.
None.
52
Part III
Item 10. Directors, Executive Officers and Corporate Governance.
Information required by this Item that will appear under the headings “Election of Directors,” “Director Nominating Procedures,” “Board Committees and Meetings” and “Section 16(a) Beneficial Ownership Reporting Compliance” in the definitive proxy statement to be filed with the SEC relating to our 2018 Annual Meeting of Stockholders is incorporated herein by reference. Information regarding executive officers of the Company is incorporated in this Item 10 by reference to Part I of this Form 10-K under the heading “Executive Officers of the Registrant.”
We maintain a Code of Conduct that qualifies as a “code of ethics” within the meaning of Item 406 of the SEC’s Regulation S-K. Our Code of Conduct is applicable to all employees and directors, including our principal executive officer, principal financial officer, principal accounting officer and controller, or persons performing similar functions. Our Code of Conduct is available on our website at www.ca.com/invest. Any amendment to, or waiver of, the “code of ethics” provisions of our Code of Conduct that applies to our directors or executive officers will be disclosed on our website. The Code of Conduct is available without charge in print to any stockholder who requests a copy by writing to our Corporate Secretary, at CA, Inc., 520 Madison Avenue, New York, New York 10022.
Item 11. Executive Compensation.
Information required by this Item that will appear under the headings “Compensation and Other Information Concerning Executive Officers,” “Compensation Discussion and Analysis,” “Compensation of Directors,” “Compensation Committee Interlocks and Insider Participation” and “Compensation and Human Resources Committee Report on Executive Compensation” in the definitive proxy statement to be filed with the SEC relating to our 2018 Annual Meeting of Stockholders is incorporated herein by reference.
Item 12. Security Ownership of Certain Beneficial Owners and Management and Related Stockholder Matters.
Information required by this Item that will appear under the headings “Information Regarding Beneficial Ownership of Principal Stockholders, the Board and Management” and “Securities Authorized for Issuance under Equity Compensation Plans” in the definitive proxy statement to be filed with the SEC relating to our 2018 Annual Meeting of Stockholders is incorporated herein by reference.
Item 13. Certain Relationships and Related Transactions, and Director Independence.
Information required by this Item that will appear under the headings “Related Person Transactions,” “Related Person Transactions in Fiscal Year 2018” and “Director Independence” in the definitive proxy statement to be filed with the SEC relating to our 2018 Annual Meeting of Stockholders is incorporated herein by reference.
Item 14. Principal Accountant Fees and Services.
Information required by this Item that will appear under the heading “Ratification of Appointment of Independent Registered Public Accounting Firm” in the definitive proxy statement to be filed with the SEC relating to our 2018 Annual Meeting of Stockholders is incorporated herein by reference.
53
Part IV
Item 15. Exhibits and Financial Statement Schedules.
(a)(1) The Registrant’s financial statements together with a separate table of contents are annexed hereto.
(2) Financial Statement Schedules are listed in the separate table of contents annexed hereto.
(3) Exhibits.
54
Incorporated by Reference | |||||
Exhibit Number | Exhibit Description | Form | Exhibit | Filing Date | Filed or Furnished Herewith |
10.1* | 8-K | 10.1 | 08/02/05 | ||
10.2* | 10-Q | 10.1 | 02/06/07 | ||
10.3* | 10-K | 10.52 | 07/31/06 | ||
8-K | 10.2 | 08/21/06 | |||
10.5* | 8-K | 10.1 | 08/27/07 | ||
10.6* | 8-K | 10.2 | 08/27/07 | ||
10.7* | 8-K | 10.3 | 08/27/07 | ||
10.8* | 8-K | 10.4 | 08/27/07 | ||
10.9* | 10-K | 10.68 | 05/23/08 | ||
10-K | 10.69 | 05/23/08 | |||
10-Q | 10.9 | 10/23/09 | |||
10-Q | 10.3 | 01/29/10 | |||
10-K | 10.23 | 05/12/16 | |||
10-K | 10.24 | 05/12/16 | |||
10-Q | 10.1 | 01/26/11 | |||
10-Q | 10.2 | 01/26/11 | |||
10-Q | 10.1 | 07/22/11 | |||
DEF 14A | Exhibit B | 06/10/11 | |||
10-Q | 10.4 | 10/28/11 | |||
10-Q | 10.5 | 10/28/11 | |||
10-Q | 10.6 | 10/28/11 | |||
10-Q | 10.7 | 10/28/11 | |||
DEF 14A | Exhibit C | 06/10/11 | |||
10-K | 10.57 | 05/11/12 | |||
10-K | 10.58 | 05/11/12 | |||
55
Incorporated by Reference | |||||
Exhibit Number | Exhibit Description | Form | Exhibit | Filing Date | Filed or Furnished Herewith |
10-K | 10.59 | 05/11/12 | |||
10-K | 10.60 | 05/11/12 | |||
10-K | 10.61 | 05/11/12 | |||
DEF 14A | Exhibit B | 06/11/12 | |||
DEF 14A | Exhibit A | 06/22/17 | |||
10-Q | 10.1 | 10/26/12 | |||
8-K | 10.1 | 12/12/12 | |||
10-Q | 10.1 | 10/22/15 | |||
10-K | 10.62 | 05/09/13 | |||
8-K | 10.1 | 06/10/13 | |||
8-K | 10.1 | 04/14/15 | |||
8-K | 10.1 | 06/28/17 | |||
10-Q | 10.2 | 10/25/13 | |||
10-Q | 10.3 | 10/25/13 | |||
8-K | 10.1 | 01/21/14 | |||
10-K | 10.63 | 05/19/14 | |||
10-K | 10.64 | 05/19/14 | |||
10-Q | 10.2 | 07/24/14 | |||
10-Q | 10.4 | 07/24/14 | |||
10-Q | 10.5 | 07/24/14 | |||
10-Q | 10.6 | 07/24/14 | |||
10-Q | 10.7 | 07/24/14 | |||
56
Incorporated by Reference | |||||
Exhibit Number | Exhibit Description | Form | Exhibit | Filing Date | Filed or Furnished Herewith |
10-Q | 10.8 | 07/24/14 | |||
X | |||||
10-K | 10.63 | 05/08/15 | |||
10-Q | 10.3 | 10/22/15 | |||
X | |||||
8-K | 10.1 | 11/18/15 | |||
10-Q | 10.1 | 07/28/16 | |||
8-K | 10.1 | 09/27/16 | |||
10-Q | 10.2 | 10/28/16 | |||
8-K | 10.1 | 11/07/16 | |||
X | |||||
X | |||||
X | |||||
X | |||||
X | |||||
X | |||||
X | |||||
X | |||||
101.INS | XBRL Instance Document. | X | |||
101.SCH | XBRL Taxonomy Extension Schema Document. | X | |||
101.CAL | XBRL Taxonomy Extension Calculation Linkbase Document. | X | |||
101.DEF | XBRL Taxonomy Extension Definition Linkbase Document. | X | |||
101.LAB | XBRL Taxonomy Extension Label Linkbase Document. | X | |||
101.PRE | XBRL Taxonomy Extension Presentation Linkbase Document. | X | |||
‡ | Certain schedules referenced in this agreement have been omitted in accordance with Item 601(b)(2) of Regulation S-K. A copy of any omitted schedule will be furnished supplementally to the U.S. Securities and Exchange Commission upon request. |
* Management contract or compensatory plan or arrangement.
57
Item 16. Form 10-K Summary.
None.
Signatures
Pursuant to the requirements of Section 13 or 15(d) of the Securities Exchange Act of 1934, the registrant has duly caused this report to be signed on its behalf by the undersigned, thereunto duly authorized.
CA, INC. | |||
By: | /s/ Michael P. Gregoire | ||
Michael P. Gregoire | |||
Chief Executive Officer | |||
Dated: May 9, 2018
Pursuant to the requirements of the Securities Exchange Act of 1934, this report has been signed below by the following persons on behalf of the registrant and in the capacities and on the dates indicated.
By: | /s/ Michael P. Gregoire | ||
Michael P. Gregoire | |||
Chief Executive Officer | |||
(Principal Executive Officer) | |||
By: | /s/ Kieran J. McGrath | ||
Kieran J. McGrath | |||
Executive Vice President and Chief Financial Officer | |||
(Principal Financial Officer) | |||
By: | /s/ Anthony J. Radesca | ||
Anthony J. Radesca | |||
Senior Vice President, Chief Accounting Officer | |||
(Principal Accounting Officer) | |||
Dated: May 9, 2018
58
Signatures
Pursuant to the requirements of the Securities Exchange Act of 1934, this report has been signed below by the following persons on behalf of the registrant and in the capacities and on the dates indicated.
* | Director | |
Jens Alder | ||
* | Director | |
Raymond J. Bromark | ||
* | Director | |
Michael P. Gregoire | ||
* | Director | |
Jean M. Hobby | ||
* | Director | |
Rohit Kapoor | ||
* | Director | |
Jeffrey G. Katz | ||
* | Director | |
Kay Koplovitz | ||
* | Director | |
Christopher B. Lofgren | ||
* | Director | |
Richard Sulpizio | ||
* | Director | |
Laura S. Unger | ||
* | Director | |
Arthur F. Weinbach | ||
*By: | /s/ Ava M. Hahn |
Ava M. Hahn | |
Attorney-in-fact | |
Dated: May 9, 2018
59
CA, Inc. and Subsidiaries
New York, New York
Annual Report on Form 10-K Item 8, Item 9A, Item 15(a)(1) and (2), and Item 15(c)
List of Consolidated Financial Statements and Financial Statement Schedule
Consolidated Financial Statements and Financial Statement Schedule
Year ended March 31, 2018
PAGE | |
The following Consolidated Financial Statements of CA, Inc. and subsidiaries are included in Items 8 and 9A: | |
The following Consolidated Financial Statement Schedule of CA, Inc. and subsidiaries is included in Item 15(c): | |
All other schedules for which provision is made in the applicable accounting regulations of the Securities and Exchange Commission are not required under the related instructions or are inapplicable and, therefore, have been omitted.
60
Report of Independent Registered Public Accounting Firm
To the stockholders and board of directors
CA, Inc.:
Opinions on the Consolidated Financial Statements and Internal Control Over Financial Reporting
We have audited the accompanying consolidated balance sheets of CA, Inc. and subsidiaries (the “Company”) as of March 31, 2018 and 2017, the related consolidated statements of operations, comprehensive income, stockholders’ equity, and cash flows for each of the years in the three-year period ended March 31, 2018, and the related notes and financial statement schedule (collectively, the “consolidated financial statements”). We also have audited the Company’s internal control over financial reporting as of March 31, 2018, based on criteria established in Internal Control — Integrated Framework (2013) issued by the Committee of Sponsoring Organizations of the Treadway Commission.
In our opinion, the consolidated financial statements referred to above present fairly, in all material respects, the financial position of the Company as of March 31, 2018 and 2017, and the results of its operations and its cash flows for each of the years in the three-year period ended March 31, 2018, in conformity with U.S. generally accepted accounting principles. Also in our opinion, the Company maintained, in all material respects, effective internal control over financial reporting as of March 31, 2018, based on criteria established in Internal Control — Integrated Framework (2013) issued by the Committee of Sponsoring Organizations of the Treadway Commission.
Basis for Opinion
The Company’s management is responsible for these consolidated financial statements, for maintaining effective internal control over financial reporting, and for its assessment of the effectiveness of internal control over financial reporting, included in the accompanying Management’s Report on Internal Control Over Financial Reporting under Item 9A(b). Our responsibility is to express an opinion on the Company’s consolidated financial statements and an opinion on the Company’s internal control over financial reporting based on our audits. We are a public accounting firm registered with the Public Company Accounting Oversight Board (United States) (“PCAOB”) and are required to be independent with respect to the Company in accordance with the U.S. federal securities laws and the applicable rules and regulations of the Securities and Exchange Commission and the PCAOB.
We conducted our audits in accordance with the standards of the PCAOB. Those standards require that we plan and perform the audits to obtain reasonable assurance about whether the consolidated financial statements are free of material misstatement, whether due to error or fraud, and whether effective internal control over financial reporting was maintained in all material respects.
Our audits of the consolidated financial statements included performing procedures to assess the risks of material misstatement of the consolidated financial statements, whether due to error or fraud, and performing procedures that respond to those risks. Such procedures included examining, on a test basis, evidence regarding the amounts and disclosures in the consolidated financial statements. Our audits also included evaluating the accounting principles used and significant estimates made by management, as well as evaluating the overall presentation of the consolidated financial statements. Our audit of internal control over financial reporting included obtaining an understanding of internal control over financial reporting, assessing the risk that a material weakness exists, and testing and evaluating the design and operating effectiveness of internal control based on the assessed risk. Our audits also included performing such other procedures as we considered necessary in the circumstances. We believe that our audits provide a reasonable basis for our opinions.
Definition and Limitations of Internal Control Over Financial Reporting
A company’s internal control over financial reporting is a process designed to provide reasonable assurance regarding the reliability of financial reporting and the preparation of financial statements for external purposes in accordance with generally accepted accounting principles. A company’s internal control over financial reporting includes those policies and procedures that (1) pertain to the maintenance of records that, in reasonable detail, accurately and fairly reflect the transactions and dispositions of the assets of the company; (2) provide reasonable assurance that transactions are recorded as necessary to permit preparation of financial statements in accordance with generally accepted accounting principles, and that receipts and expenditures of the company are being made only in accordance with authorizations of management and directors of the company; and (3) provide reasonable assurance regarding prevention or timely detection of unauthorized acquisition, use, or disposition of the company’s assets that could have a material effect on the financial statements.
Because of its inherent limitations, internal control over financial reporting may not prevent or detect misstatements. Also, projections of any evaluation of effectiveness to future periods are subject to the risk that controls may become inadequate because of changes in conditions, or that the degree of compliance with the policies or procedures may deteriorate.
/s/ KPMG LLP
We have served as the Company’s auditor since 1999.
New York, New York
May 9, 2018
61
CA, Inc. and Subsidiaries
Consolidated Balance Sheets
March 31, | |||||||
(in millions, except share amounts) | 2018 | 2017 | |||||
Assets | |||||||
Current assets: | |||||||
Cash and cash equivalents | $ | 3,405 | $ | 2,771 | |||
Trade accounts receivable, net of allowance for doubtful accounts of $10 and $11, respectively | 793 | 764 | |||||
Other current assets | 210 | 198 | |||||
Total current assets | $ | 4,408 | $ | 3,733 | |||
Property and equipment, net of accumulated depreciation of $865 and $841, respectively | 237 | 237 | |||||
Goodwill | 6,804 | 6,857 | |||||
Capitalized software and other intangible assets, net | 1,111 | 1,307 | |||||
Deferred income taxes | 346 | 327 | |||||
Other noncurrent assets, net | 154 | 149 | |||||
Total assets | $ | 13,060 | $ | 12,610 | |||
Liabilities and stockholders' equity | |||||||
Current liabilities: | |||||||
Current portion of long-term debt | $ | 269 | $ | 18 | |||
Accounts payable | 85 | 91 | |||||
Accrued salaries, wages and commissions | 242 | 256 | |||||
Accrued expenses and other current liabilities | 340 | 326 | |||||
Deferred revenue (billed or collected) | 2,289 | 2,222 | |||||
Taxes payable, other than income taxes payable | 55 | 63 | |||||
Federal, state and foreign income taxes payable | 41 | 30 | |||||
Total current liabilities | $ | 3,321 | $ | 3,006 | |||
Long-term debt, net of current portion | 2,514 | 2,773 | |||||
Federal, state and foreign income taxes payable | 311 | 131 | |||||
Deferred income taxes | 111 | 119 | |||||
Deferred revenue (billed or collected) | 820 | 794 | |||||
Other noncurrent liabilities | 88 | 98 | |||||
Total liabilities | $ | 7,165 | $ | 6,921 | |||
Stockholders' equity: | |||||||
Preferred stock, no par value, 10,000,000 shares authorized; No shares issued and outstanding | $ | — | $ | — | |||
Common stock, $0.10 par value, 1,100,000,000 shares authorized; 589,695,081 and 589,695,081 shares issued; 412,056,923 and 413,409,346 shares outstanding, respectively | 59 | 59 | |||||
Additional paid-in capital | 3,744 | 3,702 | |||||
Retained earnings | 6,971 | 6,923 | |||||
Accumulated other comprehensive loss | (290 | ) | (483 | ) | |||
Treasury stock, at cost, 177,638,158 and 176,285,735 shares, respectively | (4,589 | ) | (4,512 | ) | |||
Total stockholders' equity | $ | 5,895 | $ | 5,689 | |||
Total liabilities and stockholders' equity | $ | 13,060 | $ | 12,610 | |||
See accompanying Notes to the Consolidated Financial Statements
62
CA, Inc. and Subsidiaries
Consolidated Statements of Operations
Year Ended March 31, | |||||||||||
(in millions, except per share amounts) | 2018 | 2017 | 2016 | ||||||||
Revenue: | |||||||||||
Subscription and maintenance | $ | 3,326 | $ | 3,279 | $ | 3,317 | |||||
Professional services | 311 | 301 | 326 | ||||||||
Software fees and other | 598 | 456 | 382 | ||||||||
Total revenue | $ | 4,235 | $ | 4,036 | $ | 4,025 | |||||
Expenses: | |||||||||||
Costs of licensing and maintenance | $ | 302 | $ | 273 | $ | 283 | |||||
Cost of professional services | 298 | 300 | 300 | ||||||||
Amortization of capitalized software costs | 271 | 243 | 256 | ||||||||
Selling and marketing | 1,061 | 1,028 | 1,006 | ||||||||
General and administrative | 406 | 375 | 367 | ||||||||
Product development and enhancements | 642 | 586 | 560 | ||||||||
Depreciation and amortization of other intangible assets | 107 | 77 | 106 | ||||||||
Other expenses, net | 29 | 19 | 12 | ||||||||
Total expenses before interest and income taxes | $ | 3,116 | $ | 2,901 | $ | 2,890 | |||||
Income from continuing operations before interest and income taxes | $ | 1,119 | $ | 1,135 | $ | 1,135 | |||||
Interest expense, net | 98 | 62 | 51 | ||||||||
Income from continuing operations before income taxes | $ | 1,021 | $ | 1,073 | $ | 1,084 | |||||
Income tax expense | 545 | 298 | 315 | ||||||||
Income from continuing operations | $ | 476 | $ | 775 | $ | 769 | |||||
Income from discontinued operations, net of income taxes | — | — | 14 | ||||||||
Net income | $ | 476 | $ | 775 | $ | 783 | |||||
Basic income per common share: | |||||||||||
Income from continuing operations | $ | 1.14 | $ | 1.85 | $ | 1.79 | |||||
Income from discontinued operations | — | — | 0.03 | ||||||||
Net income | $ | 1.14 | $ | 1.85 | $ | 1.82 | |||||
Basic weighted average shares used in computation | 414 | 414 | 426 | ||||||||
Diluted income per common share: | |||||||||||
Income from continuing operations | $ | 1.13 | $ | 1.85 | $ | 1.78 | |||||
Income from discontinued operations | — | — | 0.03 | ||||||||
Net income | $ | 1.13 | $ | 1.85 | $ | 1.81 | |||||
Diluted weighted average shares used in computation | 415 | 415 | 427 | ||||||||
See accompanying Notes to the Consolidated Financial Statements
63
CA, Inc. and Subsidiaries
Consolidated Statements of Comprehensive Income
Year Ended March 31, | |||||||||||
(in millions) | 2018 | 2017 | 2016 | ||||||||
Net income | $ | 476 | $ | 775 | $ | 783 | |||||
Other comprehensive income (loss): | |||||||||||
Foreign currency translation adjustments | 193 | (67 | ) | 2 | |||||||
Total other comprehensive income (loss) | $ | 193 | $ | (67 | ) | $ | 2 | ||||
Comprehensive income | $ | 669 | $ | 708 | $ | 785 | |||||
See accompanying Notes to the Consolidated Financial Statements
64
CA, Inc. and Subsidiaries
Consolidated Statements of Stockholders’ Equity
(in millions, except per share amounts) | Common Stock | Additional Paid-in Capital | Retained Earnings | Accumulated Other Comprehensive Loss | Treasury Stock | Total Stockholders' Equity | ||||||||||||||||||
Balance at March 31, 2015 | $ | 59 | $ | 3,631 | $ | 6,221 | $ | (418 | ) | $ | (3,868 | ) | $ | 5,625 | ||||||||||
Net income | 783 | 783 | ||||||||||||||||||||||
Other comprehensive income | 2 | 2 | ||||||||||||||||||||||
Comprehensive income | 785 | |||||||||||||||||||||||
Share-based compensation | 97 | 97 | ||||||||||||||||||||||
Dividends declared | (429 | ) | (429 | ) | ||||||||||||||||||||
Release of restricted stock, exercise of common stock options, ESPP and other items | (64 | ) | 71 | 7 | ||||||||||||||||||||
Treasury stock purchased | (707 | ) | (707 | ) | ||||||||||||||||||||
Balance at March 31, 2016 | $ | 59 | $ | 3,664 | $ | 6,575 | $ | (416 | ) | $ | (4,504 | ) | $ | 5,378 | ||||||||||
Net income | 775 | 775 | ||||||||||||||||||||||
Other comprehensive loss | (67 | ) | (67 | ) | ||||||||||||||||||||
Comprehensive income | 708 | |||||||||||||||||||||||
Share-based compensation | 108 | 108 | ||||||||||||||||||||||
Dividends declared | (428 | ) | (428 | ) | ||||||||||||||||||||
Release of restricted stock, exercise of common stock options, ESPP and other items | (70 | ) | 1 | 92 | 23 | |||||||||||||||||||
Treasury stock purchased | (100 | ) | (100 | ) | ||||||||||||||||||||
Balance at March 31, 2017 | $ | 59 | $ | 3,702 | $ | 6,923 | $ | (483 | ) | $ | (4,512 | ) | $ | 5,689 | ||||||||||
Net income | 476 | 476 | ||||||||||||||||||||||
Other comprehensive income | 193 | 193 | ||||||||||||||||||||||
Comprehensive income | 669 | |||||||||||||||||||||||
Share-based compensation | 120 | 120 | ||||||||||||||||||||||
Dividends declared | (428 | ) | (428 | ) | ||||||||||||||||||||
Release of restricted stock, exercise of common stock options, ESPP and other items | (78 | ) | 86 | 8 | ||||||||||||||||||||
Treasury stock purchased | (163 | ) | (163 | ) | ||||||||||||||||||||
Balance at March 31, 2018 | $ | 59 | $ | 3,744 | $ | 6,971 | $ | (290 | ) | $ | (4,589 | ) | $ | 5,895 | ||||||||||
See accompanying Notes to the Consolidated Financial Statements
65
CA, Inc. and Subsidiaries
Consolidated Statements of Cash Flows
Year Ended March 31, | |||||||||||
(in millions) | 2018 | 2017 | 2016 | ||||||||
Operating activities from continuing operations: | |||||||||||
Net income | $ | 476 | $ | 775 | $ | 783 | |||||
Income from discontinued operations | — | — | (14 | ) | |||||||
Income from continuing operations | $ | 476 | $ | 775 | $ | 769 | |||||
Adjustments to reconcile income from continuing operations to net cash provided by operating activities: | |||||||||||
Depreciation and amortization | 378 | 320 | 362 | ||||||||
Deferred income taxes | 39 | (21 | ) | (115 | ) | ||||||
Provision for bad debts | 2 | 4 | — | ||||||||
Share-based compensation expense | 120 | 108 | 97 | ||||||||
Other non-cash items | 4 | 5 | — | ||||||||
Foreign currency transaction losses (gains) | 3 | (4 | ) | 4 | |||||||
Changes in other operating assets and liabilities, net of effect of acquisitions: | |||||||||||
(Increase) decrease in trade accounts receivable | (10 | ) | (85 | ) | 54 | ||||||
Increase (decrease) in deferred revenue | 11 | 24 | (105 | ) | |||||||
Increase (decrease) in taxes payable, net | 126 | (106 | ) | 32 | |||||||
Increase (decrease) in accounts payable, accrued expenses and other | 15 | (25 | ) | (62 | ) | ||||||
(Decrease) increase in accrued salaries, wages and commissions | (21 | ) | 32 | (18 | ) | ||||||
Changes in other operating assets and liabilities, net | 55 | 51 | 48 | ||||||||
Net cash provided by operating activities - continuing operations | $ | 1,198 | $ | 1,078 | $ | 1,066 | |||||
Investing activities from continuing operations: | |||||||||||
Acquisitions of businesses, net of cash acquired, and purchased software | $ | (15 | ) | $ | (1,288 | ) | $ | (644 | ) | ||
Purchases of property and equipment | (48 | ) | (47 | ) | (48 | ) | |||||
Proceeds from sale of short-term investments | — | — | 48 | ||||||||
Other investing activities | (2 | ) | (2 | ) | (1 | ) | |||||
Net cash used in investing activities - continuing operations | $ | (65 | ) | $ | (1,337 | ) | $ | (645 | ) | ||
Financing activities from continuing operations: | |||||||||||
Dividends paid | $ | (428 | ) | $ | (428 | ) | $ | (429 | ) | ||
Purchases of common stock | (163 | ) | (100 | ) | (707 | ) | |||||
Notional pooling borrowings | 2,310 | 2,374 | 3,899 | ||||||||
Notional pooling repayments | (2,354 | ) | (2,351 | ) | (3,877 | ) | |||||
Debt borrowings | — | 850 | 1,100 | ||||||||
Debt repayments | (19 | ) | (6 | ) | (409 | ) | |||||
Debt issuance costs | (3 | ) | (5 | ) | (4 | ) | |||||
Exercise of common stock options | 16 | 22 | 4 | ||||||||
Payments related to tax withholding for share-based compensation | (36 | ) | (35 | ) | (28 | ) | |||||
Other financing activities | (3 | ) | — | (24 | ) | ||||||
Net cash (used in) provided by financing activities - continuing operations | $ | (680 | ) | $ | 321 | $ | (475 | ) | |||
Effect of exchange rate changes on cash, cash equivalents and restricted cash | 182 | (103 | ) | 24 | |||||||
Net change in cash, cash equivalents and restricted cash - continuing operations | $ | 635 | $ | (41 | ) | $ | (30 | ) | |||
Cash used in operating activities - discontinued operations | $ | — | $ | — | $ | (12 | ) | ||||
Cash provided by investing activities - discontinued operations | — | — | 50 | ||||||||
Net effect of discontinued operations on cash, cash equivalents and restricted cash | $ | — | $ | — | $ | 38 | |||||
Increase (decrease) in cash, cash equivalents and restricted cash | $ | 635 | $ | (41 | ) | $ | 8 | ||||
Cash, cash equivalents and restricted cash at beginning of period | 2,772 | 2,813 | 2,805 | ||||||||
Cash, cash equivalents and restricted cash at end of period | $ | 3,407 | $ | 2,772 | $ | 2,813 | |||||
See accompanying Notes to the Consolidated Financial Statements
66
Notes to the Consolidated Financial Statements
Note 1 — Significant Accounting Policies
(a) Description of Business: CA, Inc. and subsidiaries (the “Company”) develops, markets, delivers and licenses software products and services.
(b) Presentation of Financial Statements: The accompanying audited consolidated financial statements (“consolidated financial statements”) of the Company have been prepared in accordance with U.S. generally accepted accounting principles (“GAAP”), as defined in the Financial Accounting Standards Board (“FASB”) Accounting Standards Codification (“ASC”) Topic 205. The preparation of financial statements in conformity with GAAP requires management to make estimates and assumptions that affect the amounts reported in the financial statements and accompanying notes. Although these estimates are based on management’s knowledge of current events and actions it may undertake in the future, these estimates may ultimately differ from actual results. Significant items subject to such estimates and assumptions include: (i) the useful lives and expected future cash flows of long-lived assets, including capitalized software costs and other intangibles, (ii) allowances for doubtful accounts, (iii) the valuation of derivatives, deferred tax assets and assets acquired in business combinations, (iv) share-based compensation, (v) reserves for employee severance benefit obligations, (vi) income tax uncertainties, (vii) legal contingencies, (viii) the fair value of the Company’s reporting units, and (ix) U.S. income taxes associated with the Tax Cuts and Jobs Act enacted on December 22, 2017 (the “Tax Act”).
(c) Principles of Consolidation: The consolidated financial statements include the accounts of the Company and its majority-owned and controlled subsidiaries. Investments in affiliates owned 50% or less are accounted for by either the equity method or cost method. Intercompany balances and transactions have been eliminated in consolidation.
(d) Acquisitions: Companies acquired during each reporting period are reflected in the results of the Company effective from their respective dates of acquisition through the end of the reporting period. The Company applies the provisions of FASB ASC Topic 805, Business Combinations, in the accounting for its acquisitions. It requires the Company to recognize separately from goodwill the assets acquired and the liabilities assumed at the acquisition date fair values. Goodwill as of the acquisition date is measured as the excess of consideration transferred over the net of the acquisition date fair values of the assets acquired and the liabilities assumed. While the Company uses its best estimates and assumptions to accurately value assets acquired and liabilities assumed at the acquisition date, the estimates are inherently uncertain. During the measurement period, which may be up to one year from the acquisition date, the Company records adjustments to the assets acquired and liabilities assumed with the corresponding offset to goodwill. Upon the conclusion of the measurement period or final determination of the values of assets acquired or liabilities assumed, whichever comes first, any subsequent adjustments are recorded to the Company’s Consolidated Statements of Operations. Refer to Note 2, “Acquisitions,” for additional information.
(e) Divestitures: In the fourth quarter of fiscal year 2016, the Company sold its CA ERwin Data Modeling solution assets (ERwin). The results of operations associated with this business have been presented as discontinued operations in the accompanying Consolidated Statements of Operations and Consolidated Statements of Cash Flows for fiscal year 2016. Refer to Note 3, “Divestitures,” for additional information.
(f) Foreign Currencies: In general, the functional currency of the Company’s foreign subsidiaries is the local country's currency. Assets and liabilities of the Company’s foreign subsidiaries are translated using the exchange rates in effect at the balance sheet date. Results of operations are translated using average exchange rates. Adjustments arising from the translation of the foreign currency financial statements of the Company’s subsidiaries into U.S. dollars are reported as currency translation adjustments in “Accumulated other comprehensive loss” in the Consolidated Balance Sheets.
Foreign currency transaction losses (gains) were approximately $27 million, $(2) million and $26 million in fiscal years 2018, 2017 and 2016, respectively, and were included in “Other expenses, net” in the Consolidated Statements of Operations in the period in which they occurred. For fiscal year 2016, other expenses, net included a foreign currency transaction loss of approximately $11 million relating to the remeasurement of monetary assets and liabilities of the Company's Argentina subsidiary.
(g) Revenue Recognition: The Company derives revenues primarily from the licensing of subscription (i.e., time-based) and perpetual software licenses, related software maintenance, professional services and the use of the Company’s hosted software as a service (“SaaS”) offerings.
The Company begins to recognize revenue from software licensing and maintenance when all of the following criteria are met: (1) the Company has evidence of an arrangement with a customer; (2) the Company delivers the specified products; (3) license agreement terms are fixed or determinable and free of contingencies or uncertainties that may alter the agreement such that it may not be complete and final; and (4) collection is probable. Revenue is recorded net of applicable sales taxes.
67
The Company’s software licenses generally do not include acceptance provisions. An acceptance provision allows a customer to test the software for a defined period of time before committing to license the software. If a license agreement includes an acceptance provision, the Company does not recognize revenue until the earlier of the receipt of a written customer acceptance or when the acceptance right lapses. The Company’s standard licensing agreements include a product warranty provision for all products. The likelihood that the Company will be required to make refunds to customers under such provisions is considered remote.
Subscription and Maintenance Revenue: Software licenses that include the right to receive unspecified future software products are considered subscription arrangements under GAAP and are recognized ratably over the term of the license agreement. Subscription and maintenance revenue is the amount of revenue recognized ratably during the reporting period from either: (i) software usage fees and product sales that include subscription agreements and also generally include maintenance; (ii) maintenance agreements associated with providing customer technical support and access to software fixes and upgrades which are separately identifiable from software usage fees or product sales; or (iii) software license agreements bundled with elements (i.e., maintenance or professional services) for which vendor specific objective evidence (“VSOE”) has not been established. Revenue for these arrangements is recognized ratably over the term of the subscription or maintenance term.
Professional Services: Revenue from professional services arrangements is generally recognized as the services are performed. Revenue and costs from committed professional services that are sold as part of a subscription license agreement are deferred and recognized on a ratable basis over the term of the related software agreement. VSOE of professional services is established based on hourly rates when sold on a stand-alone basis. If it is not probable that a project will be completed or the payment will be received, revenue recognition is deferred until the uncertainty is removed.
Software Fees and Other: Software fees and other revenue consists primarily of revenue from the sale of perpetual software licenses that do not include the right to unspecified software products (i.e., a subscription agreement) in a bundled arrangement where VSOE exists for all undelivered elements, and revenue from SaaS offerings. For bundled arrangements that include either maintenance or both maintenance and professional services, the Company uses the residual method to determine the amount of license revenue to be recognized. Under the residual method, consideration is allocated to undelivered elements based upon VSOE of those elements, with the residual of the arrangement fee allocated to and recognized as license revenue. The Company determines VSOE of maintenance for its enterprise solutions products from contractually stated renewal rates.
In the event that agreements with the Company’s customers are executed in close proximity with other software license agreements with the same customer, the Company evaluates whether the separate arrangements are linked, and, if so, the agreements are considered a single multi-element arrangement for which revenue is recognized ratably as “Subscription and maintenance” in the Consolidated Statements of Operations, except for SaaS and professional services agreements. In the case of a SaaS agreement that is linked to a subscription-based software license arrangement, revenue is recognized ratably as “Software fees and other” for its respective portion, in the Consolidated Statements of Operations. In the case of a professional services agreement that is linked to a subscription-based software license arrangement, revenue is recognized as “Professional services” for its respective portion, in the Consolidated Statements of Operations.
(h) Sales Commissions: Sales commissions are recognized in the period the commissions are earned by employees, which is typically upon signing of the contract. Under the Company’s sales commissions policy, the amount of sales commissions expense attributable to the license agreements signed in the period is recognized fully, but the revenue from the license agreements may be recognized ratably over the subscription and maintenance term.
(i) Accounting for Share-Based Compensation: Share-based awards exchanged for employee services are accounted for under the fair value method. Accordingly, share-based compensation cost is measured at the grant date based on the fair value of the award. The expense for awards expected to vest is recognized over the employee’s requisite service period (generally the vesting period of the award). Awards expected to vest are estimated based on a combination of historical experience and future expectations.
The Company has elected to treat awards with only service conditions and with graded vesting as one award. Consequently, the total compensation expense is recognized straight-line over the entire vesting period, so long as the compensation cost recognized at any date at least equals the portion of the grant date fair value of the award that is vested at that date.
The Company uses the Black-Scholes option-pricing model to compute the estimated fair value of share-based awards in the form of options. The Black-Scholes model includes assumptions regarding dividend yields, expected volatility, expected term of the option and risk-free interest rates.
68
In addition to stock options, restricted share awards (“RSAs”) and restricted share units (“RSUs”) with time-based vesting, the Company issues performance share units (“PSUs”). Compensation costs for the PSUs are amortized over the requisite service periods based on the expected level of achievement of the performance targets. At the conclusion of the performance periods, the applicable number of shares of RSAs, RSUs or unrestricted shares granted may vary based on the level of achievement of the performance targets. Additionally, the grants are subject to the approval of the Company’s Compensation and Human Resources Committee of the Board of Directors (the “Compensation Committee”), which has discretion to reduce any award for any reason. The value of the PSU awards is remeasured each reporting period until the Compensation Committee approves attainment of the specified performance targets, at which time a grant date is deemed to have been achieved for accounting purposes, the value of the award is fixed and any remaining unrecognized compensation expense is recognized over the remaining time-based vesting period. Refer to Note 13, “Stock Plans,” for additional information.
(j) Net Income Per Common Share: Unvested share-based payment awards that contain non-forfeitable rights to dividends or dividend equivalents (whether paid or unpaid) are participating securities and are included in the computation of net income per share under the two-class method. Under the two-class method, net income is reduced by the amount of dividends declared in the period for each class of common stock and participating securities. The remaining undistributed income is then allocated to common stock and participating securities as if all of the net income for the period had been distributed. Basic net income per common share excludes dilution and is calculated by dividing net income allocable to common shares by the weighted average number of common shares outstanding for the period. Diluted net income per common share is calculated by dividing net income allocable to common shares by the weighted average number of common shares outstanding at the balance sheet date, as adjusted for the potential dilutive effect of non-participating share-based awards. Refer to Note 12, “Income from Continuing Operations Per Common Share,” for additional information.
(k) Concentration of Credit Risk: Financial instruments that potentially subject the Company to concentration of credit risk consist primarily of cash and cash equivalents, investments, derivatives and accounts receivable. The Company historically has not experienced any material losses in its cash and cash equivalent or investment portfolios.
Trade accounts receivable represents amounts due from the Company’s customers and includes revenue recognized in advance of customer billings, but does not include unbilled contractual commitments executed under license agreements. Amounts included in accounts receivable expected to be collected from customers have limited exposure to concentration of credit risk due to the diverse customer base and geographic areas covered by operations.
(l) Cash, Cash Equivalents and Restricted Cash: All financial instruments purchased with an original maturity of three months or less at the time of purchase are considered cash equivalents. The Company’s cash and cash equivalents are held by its subsidiaries throughout the world, frequently in each subsidiary’s respective functional currency which may not be the U.S. dollar. Approximately 53% and 60% of cash and cash equivalents were maintained outside the United States at March 31, 2018 and 2017, respectively.
Total interest income, which primarily relates to the Company’s cash and cash equivalent balances and investments, for fiscal years 2018, 2017 and 2016 was approximately $30 million, $28 million and $30 million, respectively, and is included in “Interest expense, net” in the Consolidated Statements of Operations.
At March 31, 2018 and 2017, the total amount of restricted cash included in “Other noncurrent assets, net” in the Company’s Consolidated Balance Sheets was approximately $2 million and $1 million, respectively. Restricted cash was included with cash and cash equivalents when reconciling the beginning-of-period and end-of-period amounts shown in the Company’s Consolidated Statements of Cash Flows.
(m) Fair Value Measurements: Fair value is the price that would be received for an asset or the amount paid to transfer a liability in an orderly transaction between market participants. The Company is required to classify certain assets and liabilities based on the following fair value hierarchy:
• | Level 1: Quoted prices in active markets that are unadjusted and accessible at the measurement date for identical, unrestricted assets or liabilities; |
• | Level 2: Quoted prices for identical assets and liabilities in markets that are not active, or quoted prices for similar assets and liabilities in active markets or financial instruments for which significant inputs are observable, either directly or indirectly; and |
• | Level 3: Prices or valuations that require inputs that are both significant to the fair value measurement and unobservable. |
Refer to Note 9, “Fair Value Measurements,” for additional information.
69
(n) Long-Lived Assets:
Impairment of Long-Lived Assets, Excluding Goodwill and Other Intangibles: Long-lived assets are reviewed for impairment whenever events or changes in circumstances indicate that the carrying amount of an asset may not be recoverable. If circumstances require a long-lived asset or asset group be tested for possible impairment, the Company first compares undiscounted cash flows expected to be generated by that asset or asset group to its carrying value. If the carrying value of the long-lived asset or asset group is not recoverable on an undiscounted cash flow basis, an impairment is recognized to the extent that the carrying value exceeds its fair value. Fair value is determined through various valuation techniques including discounted cash flow models or, when available, quoted market values and third-party appraisals.
Property and Equipment: Property and equipment are stated at cost. Depreciation and amortization expense is calculated based on the estimated useful lives of the assets, and is recognized by using the straight-line method. Building and improvements are generally estimated to have 5 to 39 year lives, and the remaining property and equipment are generally estimated to have 3 to 7 year lives.
Internally Developed Software Products: Internally developed software products, which are included in "Capitalized software and other intangible assets, net" in the Consolidated Balance Sheets, consist of capitalized costs associated with the development of computer software to be sold, leased or otherwise marketed. Software development costs associated with new products and significant enhancements to existing software products are expensed as incurred until technological feasibility, as defined in FASB ASC Topic 985-20, has been established. Costs incurred thereafter are capitalized until the product is made generally available. The stage during the Company's development process for a new product or new release at which technological feasibility requirements are established affects the amount of costs capitalized. Since fiscal year 2014, the Company has continued to leverage Agile development methodologies, which are characterized by a more dynamic development process with more frequent revisions to a product release’s features and functions as the software is being developed with technological feasibility being met shortly before the product revision is made generally available. As such, no amounts were capitalized for internally developed software costs in the Company’s consolidated financial statements for fiscal years 2018, 2017 and 2016.
Annual amortization of internally developed software products is the greater of the amount computed using the ratio that current gross revenues for a product bear to the total of current and anticipated future gross revenues for that product or the straight-line method over the remaining estimated economic life of the software product, generally estimated to be 5 years from the date the product became available for general release to customers. The Company generally recognizes amortization expense for capitalized software costs using the straight-line method, and such amortization is included in “Amortization of capitalized software costs” in the Consolidated Statements of Operations. Internally developed software products are reviewed for impairment quarterly and whenever events or changes in circumstances indicate that the carrying amount of an asset may not be recoverable.
Purchased Software Products: Purchased software products, which are included in "Capitalized software and other intangible assets, net" in the Consolidated Balance Sheets, consist primarily of the cost of software technology acquired in business combinations. The cost of such products is equal to the fair value of the acquired software technology at the acquisition date. Annual amortization of purchased software products is the greater of the amount computed using the ratio that current gross revenues for a product bear to the total of current and anticipated future gross revenues for that product or the straight-line method over the remaining estimated economic life of the software product. The Company generally amortizes capitalized software costs using the straight-line method over their remaining economic lives, estimated to be between 1 and 10 years from the date of acquisition, and such amortization is included in “Amortization of capitalized software costs” in the Consolidated Statements of Operations. Purchased software products are reviewed for impairment quarterly and whenever events or changes in circumstances indicate that the carrying amount of an asset may not be recoverable. The facts and circumstances considered include an assessment of the recoverability of the carrying amount of purchased software products by evaluating future cash flows to be derived from the use of the products in relation to their unamortized costs.
Other Intangible Assets: Other intangible assets, which is included in "Capitalized software and other intangible assets, net" in the Consolidated Balance Sheets, consist of customer relationships and trademarks/trade names. The Company generally amortizes all other intangible assets using the straight-line method over their remaining economic lives, estimated to be between 1 and 15 years from the date of acquisition, and such amortization is included in "Depreciation and amortization of other intangible assets" in the Consolidated Statements of Operations. Other intangible assets subject to amortization are reviewed for impairment quarterly and whenever events or changes in circumstances indicate that the carrying amount of an asset may not be recoverable.
70
Goodwill: Goodwill represents the excess of the purchase price over the fair value of net assets acquired in connection with business combinations accounted for using the purchase method of accounting. Goodwill is not amortized, but instead goodwill is required to be evaluated for impairment annually and under certain circumstances. The Company evaluates goodwill for impairment on an annual basis on the first day of the fourth quarter of each fiscal year, and on an interim basis whenever events or changes in circumstances indicate that the carrying value may not be recoverable, at the reporting unit level. The Company's reporting units are the same as its operating segments.
When evaluating goodwill for impairment, based upon the Company's annual test or due to changes in circumstances described above, the Company first can opt to perform a qualitative assessment to determine if the fair value of a reporting unit is more likely than not (i.e., a likelihood of more than 50%) less than the reporting unit's carrying amount, including goodwill, or it can directly perform the two-step impairment test. This qualitative assessment includes, among other things, consideration of: (i) identifying inputs and assumptions that most affect fair value; (ii) identifying relevant events and circumstances that may have an impact on those inputs and assumptions; (iii) weighing the events and circumstances; and (iv) concluding on the totality of events and circumstances. If this assessment indicates that the fair value of the reporting unit exceeds the carrying value of the net assets assigned to that unit, goodwill is not considered impaired and the Company is not required to perform further testing. However, if the fair value of a reporting unit is more likely than not to be less than its carrying amount, the two-step impairment test will be performed.
When performing the two-step impairment test, the Company evaluates the estimated fair value of its reporting units using both the income and market approaches. Under the income approach, the Company calculates the estimated fair value of a reporting unit based on the present value of estimated future cash flows. Under the market approach, the Company calculates the estimated fair value of a reporting unit based on market multiples of revenue or earnings of comparable companies. If the carrying value of the reporting unit exceeds the estimated fair value, the Company then calculates the implied fair value of goodwill for the reporting unit and compares it to the carrying amount of goodwill for the reporting unit. If the carrying amount of goodwill exceeds the implied fair value, an impairment charge is recorded to its statement of operations to reduce the carrying value to implied value.
Significant judgments and estimates are required in determining the reporting units and assessing the fair value of the reporting units. These estimates and assumptions are complex and subject to a significant degree of judgment with respect to certain factors including, but not limited to, revenue growth rates and operating profit margins that are used to project future cash flows, discount rates, future economic and market conditions and determination of appropriate market comparables. The Company makes certain judgments and assumptions in allocating shared costs among reporting units. The Company bases its fair value estimates on assumptions that are consistent with information used by the business for planning purposes and that it believes to be reasonable; however, actual future results may differ from those estimates. Changes in judgments on any of these factors could materially affect the estimated fair value of the reporting units.
Refer to Note 5, “Long-Lived Assets,” for additional information.
(o) Income Taxes: Income taxes are accounted for under the asset and liability method. Deferred tax assets and liabilities are recognized for the future tax consequences attributable to differences between the financial statement carrying amounts of existing assets and liabilities and their respective tax bases, along with net operating loss and tax credit carryforwards. Deferred tax assets and liabilities are measured using enacted tax rates expected to apply to taxable income in the years in which those temporary differences are expected to be recovered or settled. The effect on deferred tax assets and liabilities from a change in tax rates is recognized on income in the period that includes the enactment date.
The Company recognizes the effect of income tax positions only if those positions are more likely than not to be sustained. Changes in recognition or measurement are reflected in the period in which the change in judgment occurs. The Company records interest and penalties related to uncertain tax positions in income tax expense.
71
The Tax Act introduced significant changes to U.S. income tax law, including a mandatory one-time transition tax on accumulated earnings of foreign subsidiaries and a reduction of the U.S. statutory corporate income tax rate from 35% to 21%, effective January 1, 2018. As a result, the Company has computed its income tax expense for fiscal year 2018 using a blended federal tax rate of 31.55%. The 21% federal tax rate will apply to the Company’s fiscal year 2019 and each fiscal year thereafter. During December 2017, the SEC staff issued Staff Accounting Bulletin No. 118, Income Tax Accounting Implications of the Tax Cuts and Jobs Act, which allows recognition of provisional tax amounts during a measurement period not to extend beyond one year of the enactment date. Due to the timing of the enactment and the complexity involved in applying the provisions of the Tax Act, the Company has made reasonable estimates for these effects and recorded provisional amounts, including the estimated transition tax and the remeasurement of U.S. deferred tax assets and liabilities, in its consolidated financial statements for fiscal year 2018. The Company will continue to refine the provisional amounts as it reviews and analyzes the historic unremitted earnings of its foreign subsidiaries, as well as the attendant computations that impact the measurement of the taxation of unremitted earnings, and also takes into consideration any additional regulatory guidance published by the U.S. tax authorities in respect of the Tax Act. The Company expects to finalize the tax expense as soon as practical, but not later than the third quarter of fiscal year 2019. Refer to Note 14, “Income Taxes,” for additional information.
Beginning with fiscal year 2019, the global intangible low-taxed income (“GILTI”) provisions of the Tax Act requires the Company to subject to U.S. income tax foreign subsidiary earnings in excess of an allowable return on the foreign subsidiary’s tangible assets. GAAP allows the Company to choose between an accounting policy that treats the U.S. tax under the GILTI provisions as either a current expense as incurred or as a component of the Company’s measurement of deferred taxes. Due to the timing of the enactment and the complexity involved in applying the GILTI provisions, the Company does not currently have sufficient information available to develop a reasonable estimate or establish an accounting policy for GILTI. Therefore, the Company has not recorded any tax impacts associated with GILTI on its consolidated financial statements for fiscal year 2018. The Company will continue to analyze the GILTI provisions in fiscal year 2019 as information becomes available to finalize a decision on an accounting policy.
(p) Deferred Revenue (Billed or Collected): The Company accounts for unearned revenue on billed amounts due from customers on a gross basis. Unearned revenue on billed installments (collected or uncollected) is reported as deferred revenue in the liability section of the Company's Consolidated Balance Sheets.
Deferred revenue (billed or collected) excludes unbilled contractual commitments executed under license and maintenance agreements that will be billed in future periods. Refer to Note 6, “Deferred Revenue,” for additional information.
(q) Advertising: Advertising costs are expensed as incurred. Advertising expense was approximately $41 million, $37 million and $35 million, which was included in “Selling and marketing” in the Consolidated Statements of Operations, for fiscal years 2018, 2017 and 2016, respectively.
(r) Litigation: The Company records a provision with respect to a claim, suit, investigation or proceeding when it is probable that a liability has been incurred and the amount of the loss can be reasonably estimated. Claims and proceedings are reviewed at least quarterly and provisions are taken or adjusted to reflect the impact and status of settlements, rulings, advice of counsel and other information pertinent to a particular matter. Refer to Note 10, “Commitments and Contingencies,” for additional information.
(s) New Accounting Pronouncements:
New Accounting Pronouncements Recently Adopted:
In March 2016, the FASB issued Accounting Standards Update No. 2016-09 (“ASU 2016-09”), Improvements to Employee Share-Based Payment Accounting (Topic 718), which is intended to simplify several aspects of the accounting for share-based payment award transactions, including the income tax consequences and classification on the statements of cash flows. ASU 2016-09 was adopted by the Company when effective in the first quarter of fiscal year 2018. The adoption of ASU 2016-09 resulted in the presentation of cash flows for employee taxes paid by withholding shares of restricted stock as a financing activity within the Consolidated Statements of Cash Flows, which were previously presented as an operating activity. A retrospective method of adoption was required for this change, which resulted in the reclassification of cash outflows of approximately $35 million and $28 million for fiscal years 2017 and 2016, respectively, from operating activities to financing activities within the Consolidated Statements of Cash Flows. Although not material, ASU 2016-09 also requires that excess tax benefits on share-based compensation expense be recognized in the Consolidated Statements of Operations as a component of the provision for income taxes, rather than additional paid-in capital, on a prospective basis. As permitted by ASU 2016-09, although not material, the Company elected to retrospectively reclassify cash flows related to excess tax benefits on share-based compensation expense as an operating activity within the Consolidated Statements of Cash Flows, which were previously presented as a financing activity. In addition, as permitted by ASU 2016-09, the Company elected to continue to estimate forfeitures expected to occur to determine the amount of share-based compensation expense to be recognized in each period.
72
In August 2016, the FASB issued Accounting Standards Update No. 2016-15 (“ASU 2016-15”), Classification of Certain Cash Receipts and Cash Payments (Topic 230), which is intended to reduce diversity in practice on how certain cash receipts and cash payments are classified and presented in the statements of cash flows. In November 2016, the FASB issued Accounting Standards Update No. 2016-18 (“ASU 2016-18”), Restricted Cash (Topic 230), which is intended to reduce diversity in practice on how changes in restricted cash are classified and presented in the statements of cash flows. ASU 2016-18 requires amounts generally described as restricted cash to be included with cash and cash equivalents when reconciling the beginning-of-period and end-of-period total amounts shown on the statements of cash flows. The Company elected to early adopt both ASU 2016-15 and ASU 2016-18 in the first quarter of fiscal year 2018 using the retrospective transition method of adoption. The adoption of these standards did not have a material effect on the Company’s consolidated financial statements and related disclosures.
New Accounting Pronouncements Not Yet Adopted:
In May 2014, the FASB issued Accounting Standards Update No. 2014-09, Revenue from Contracts with Customers, with amendments in 2015, 2016 and 2017, which creates new ASC Topic 606 (“Topic 606”) that will replace most existing revenue recognition guidance in GAAP when it becomes effective. Topic 606 requires an entity to recognize the amount of revenue to which it expects to be entitled for the transfer of promised goods or services to customers. The new standard will be adopted in the Company’s first quarter of fiscal year 2019 with the cumulative effect recognized as of the date of initial application (modified retrospective method).
The Company has established a cross-functional implementation team consisting of representatives across the organization and a third-party service provider to develop a project plan, including the evaluation of customer contracts across the organization, the development of policies, processes and tools to report financial results, the consideration of new performance measurements, and the implementation and evaluation of the Company’s internal controls over financial reporting that will be necessary under the new standard.
While the Company is continuing to determine the full effect of the new standard, it currently anticipates that this standard will have a material effect on its consolidated financial statements and related disclosures, with the most significant effect relating to the timing of the recognition of its software license revenue. Specifically, under the new standard, the Company will recognize license revenue for its Mainframe Solutions and Enterprise Solutions products at the point-in-time the licensed software is transferred to the customer, rather than ratably over the term of the customer contract as required by existing GAAP for most of the Company’s software arrangements. As a result, a significant portion of the Company’s revenue backlog (i.e., deferred revenue and future billings on committed contracts) attributable to the license component of customer contracts at March 31, 2018 under existing GAAP will not be recognized as revenue in future periods but instead will be included as part of the cumulative effect adjustment within retained earnings upon adoption of Topic 606. Such cumulative effect adjustment will primarily result from (i) the significant reduction in deferred revenue relating to the license component of customer contracts as mentioned above, (ii) the establishment of a significant contract asset related to the Company’s contractual right to consideration for completed performance obligations not yet billed or collected (i.e., license revenue recognized in advance of billings), (iii) the increase in deferred tax liabilities arising from the increase in contract assets, and (iv) the increase in income taxes payable from both the increase in contract assets as a result of the Tax Act and the portion of deferred revenue included in the cumulative effect adjustment that has not been previously included as taxable income on a tax return. The increase in contract assets and decrease in deferred revenue, when taken together with those provisions of the Tax Act which affect tax method revenue recognition for accrual-method U.S. taxpayers, will result in an acceleration of the timing of the Company’s income tax payments. This acceleration of the timing of income tax payments will be significant in relation to the Company’s current annual income tax payments within cash flows from operations. While the Company has not finalized its assessment of the impact arising from the Topic 606 adoption and finalization of the assessment could result in revisions to these estimates, which could be material, the Company currently estimates additional income tax payments of approximately $150 million per year over a four-year period, beginning in fiscal year 2019. The Company currently expects these additional income tax payments will be largely offset by the benefit from the reduced U.S. corporate tax rate enacted by the Tax Act. The Company believes that taken together, the incremental income tax payments resulting from the Topic 606 adoption and enactment of the Tax Act will be approximately $50 million, on average, per year for the next four years, beginning in fiscal year 2019. Although the Company continues to evaluate the items listed above, it does not currently expect Topic 606 to have a significant effect on its customer billings and cash collections from customer billings.
The Company currently believes that the point-in-time recognition requirement of the new standard will increase the variability of its revenue and overall net income period-to-period. The Company does not currently expect Topic 606 will have a significant effect on the timing of revenue recognition for its maintenance, Software-as-a-Service and professional services contracts. However, under Topic 606, more judgment and estimates will be required within the revenue recognition process than are required under existing GAAP, including estimates of the standalone selling price for each performance obligation identified within the Company’s contracts. These judgments and estimates will also impact the proportion of a contract’s value that is reported as license, maintenance and other elements.
73
Topic 606 will also require the Company to capitalize a portion of its sales commissions and other incremental costs to acquire contracts (i.e., contract costs), which are currently expensed as incurred. Upon adoption of Topic 606, the capitalization of contract costs will be included as part of the cumulative effect adjustment within retained earnings. The Company currently anticipates it will amortize these capitalized contract costs over an expected period of benefit ranging from approximately three to seven years. The Company is currently evaluating the effect of this requirement on its consolidated financial statements and related disclosures.
In February 2016, the FASB issued Accounting Standards Update No. 2016-02 (“ASU 2016-02”), Leases (Topic 842), with amendments in 2018, which requires a lessee to recognize assets and liabilities on its consolidated balance sheet for leases with accounting lease terms of more than 12 months. ASU 2016-02 will replace most existing lease accounting guidance in GAAP when it becomes effective. The new standard states that a lessee will recognize a lease liability for the obligation to make lease payments and a right-of-use asset for the right to use the underlying asset for the lease term. Leases will be classified as either finance or operating, with classification affecting the pattern of expense recognition in the consolidated statements of operations. ASU 2016-02 will be effective for the Company’s first quarter of fiscal year 2020 and requires the modified retrospective method of adoption. Early adoption is permitted. Although the Company is currently evaluating the timing of adoption and the effect that ASU 2016-02 will have on its consolidated financial statements and related disclosures, the Company currently expects that most of its operating lease commitments will be subject to the new standard and recognized as operating lease liabilities and right-of-use assets upon adoption.
In October 2016, the FASB issued Accounting Standards Update No. 2016-16 (“ASU 2016-16”), Intra-Equity Transfers of Assets Other Than Inventory (Topic 740), which is intended to eliminate diversity in practice and provide a more accurate depiction of the tax consequences on intercompany asset transfers (excluding inventory). ASU 2016-16 requires entities to immediately recognize the tax consequences on intercompany asset transfers (excluding inventory) at the transaction date, rather than deferring the tax consequences under current GAAP. ASU 2016-16 will be effective for the Company’s first quarter of fiscal year 2019 and requires a modified retrospective method of adoption. The Company does not currently expect the adoption of ASU 2016-16 to have a material effect on its consolidated financial statements and related disclosures.
In January 2017, the FASB issued Accounting Standards Update No. 2017-04 (“ASU 2017-04”), Simplifying the Test for Goodwill Impairment (Topic 350), which is intended to simplify the subsequent measurement of goodwill. ASU 2017-04 eliminates Step 2 of the goodwill impairment test requiring the assessment of fair value of individual assets and liabilities of a reporting unit to measure goodwill impairments. Upon adoption of this new standard, goodwill impairments will be the amount by which a reporting unit's carrying value exceeds its fair value. ASU 2017-04 will be effective for the Company’s first quarter of fiscal year 2021 and requires a prospective method of adoption. Early adoption is permitted. Although the Company is currently evaluating the timing of adoption of ASU 2017-04, it does not currently expect the adoption to have a material effect on its consolidated financial statements and related disclosures.
In August 2017, the FASB issued Accounting Standards Update No. 2017-12 (“ASU 2017-12”), Targeted Improvements to Accounting for Hedging Activities (Topic 815), which is intended to improve the financial reporting of hedging relationships to better portray the economic results of risk management activities in financial statements. ASU 2017-12 makes certain targeted improvements to simplify the application of the hedge accounting guidance in current GAAP. ASU 2017-12 will be effective for the Company’s first quarter of fiscal year 2020 and requires a prospective method of adoption for the amended presentation and disclosure guidance. Early adoption is permitted. The Company is currently evaluating the timing of adoption and the effect that ASU 2017-12 will have on its consolidated financial statements and related disclosures.
In February 2018, the FASB issued Accounting Standards Update No. 2018-02 (“ASU 2018-02”), Reclassification of Certain Tax Effects from Accumulated Other Comprehensive Income (Topic 220), which allows stranded tax effects resulting from the Tax Act to be reclassified from accumulated other comprehensive income to retained earnings. Since ASU 2018-02 only relates to the income tax effects from the Tax Act, the underlying guidance that requires the effects from changes in tax laws or rates be included in income from continuing operations is not affected. ASU 2018-02 will be effective for the Company’s first quarter of fiscal year 2020. Early adoption is permitted. Although the Company is currently evaluating the timing of adoption of ASU 2018-02, it does not currently expect the adoption to have a material effect on its consolidated financial statements and related disclosures.
Note 2 — Acquisitions
On October 11, 2016, the Company acquired BlazeMeter Ltd. (“BlazeMeter”), a privately-held provider of open source-based continuous application performance testing. BlazeMeter will integrate with the Company’s continuous delivery solutions to further improve testing efficiency and accelerate the deployment of applications. The acquisition of BlazeMeter was not material to the Company’s financial position or results of operations for fiscal year 2017. The results of operations of BlazeMeter are reported predominantly in the Company’s Enterprise Solutions segment and were included in the consolidated results of operations of the Company from the date of acquisition.
74
On January 18, 2017, the Company completed its acquisition of Automic Holding GmbH (“Automic”), a privately-held provider of business process and IT automation software. With Automic, the Company added new cloud-enabled automation and orchestration capabilities across its portfolio and increased its ability to reach into the European market. The Company acquired 100% of the voting equity interest in Automic for approximately 630 million euros (which translated to approximately $675 million at January 18, 2017). The results of operations of Automic are reported predominantly in the Company’s Enterprise Solutions segment and were included in the consolidated results of operations of the Company from the date of acquisition.
On March 31, 2017, the Company completed its acquisition of Veracode, Inc. (“Veracode”), a privately-held provider of cloud-based security testing solutions for web, mobile and third-party applications across the software development lifecycle. With Veracode, the Company bridges its Security business with its broad DevOps portfolio and adds to its growing SaaS business. The Company acquired 100% of the voting equity interest in Veracode for approximately $618 million in cash. The results of operations of Veracode are reported predominantly in the Company’s Enterprise Solutions segment and were included in the consolidated results of operations of the Company from the date of acquisition.
The purchase price allocation for Automic, which was finalized during the third quarter of fiscal year 2018, and Veracode, which was finalized during the fourth quarter of fiscal year 2018, is provided within the table below.
(dollars in millions) | Automic | Veracode | Estimated Useful Life | ||||||
Finite-lived intangible assets (1) | $ | 174 | $ | 99 | 2-12 years | ||||
Purchased software | 273 | 240 | 1-8 years | ||||||
Goodwill | 303 | 336 | Indefinite | ||||||
Deferred tax liabilities, net | (92 | ) | (33 | ) | — | ||||
Other assets (liabilities), net (2) | 17 | (24 | ) | — | |||||
Purchase price | $ | 675 | $ | 618 | |||||
(1) | Includes customer relationships and trade names. |
(2) | Includes approximately $34 million and $16 million of cash acquired from Automic and Veracode, respectively. |
The excess purchase price over the estimated value of the net tangible and identifiable intangible assets was recorded to goodwill. The allocation of the purchase price to goodwill was predominantly due to synergies the Company expects to achieve through integration of the acquired technology with the Company’s existing product portfolio and the intangible assets that are not separable, such as assembled workforce and going concern. The goodwill relating to the Company’s acquisitions of Automic and Veracode was not deductible for tax purposes and was allocated to the Enterprise Solutions segment. During fiscal year 2018, the Company recorded $63 million of additional deferred tax assets relating to Veracode based on further review of their historical tax records.
Since Automic was acquired at the beginning of the fourth quarter of fiscal year 2017, the Consolidated Statement of Operations for fiscal year 2017 included approximately three months of revenue and expenses associated with this acquisition. The Consolidated Statement of Operations for fiscal year 2017 included total revenue of approximately $25 million and net loss of approximately $2 million from Automic from the date of acquisition through March 31, 2017. Veracode was acquired on the last day of fiscal year 2017 and did not contribute any revenue or operating expenses to the Company’s Consolidated Statement of Operations for fiscal year 2017.
The Consolidated Statement of Operations for fiscal year 2018 included total revenue of approximately $218 million and net loss of approximately $66 million from Automic and Veracode through their anniversary dates.
Transaction costs for the Company’s fiscal year 2017 acquisitions, which were primarily included in “General and administrative” in the Company’s Consolidated Statements of Operations, were approximately $10 million for fiscal year 2017.
The unaudited pro forma combined financial information in the table below summarizes the results of operations for the Company, Automic and Veracode as though the companies were combined as of the beginning of fiscal year 2016. The pro forma financial information presented below is for informational purposes only and is not indicative of the results of operations that would have been achieved if the acquisitions had taken place at the beginning of fiscal year 2016, nor does it attempt to represent the results of future operations of the combined entities under the ownership and operation of the Company. The pro forma results of operations also do not include any cost savings or other synergies that may result from these acquisitions or any estimated costs that have been or will be incurred by the Company to integrate the acquired assets.
75
The pro forma results below were based on estimates and assumptions. The pro forma financial information for all periods presented also includes the business combination accounting effects resulting from these acquisitions, including the amortization charges from acquired intangible assets and other purchase accounting adjustments, employee retention costs and the related tax effects as though the Company, Automic and Veracode were combined as of the beginning of fiscal year 2016.
Year Ended March 31, | |||||||
(in millions, except per share amounts) | 2017 | 2016 | |||||
unaudited | |||||||
Total revenue | $ | 4,279 | $ | 4,215 | |||
Income from continuing operations | $ | 706 | $ | 652 | |||
Basic income from continuing operations per common share | $ | 1.68 | $ | 1.51 | |||
Diluted income from continuing operations per common share | $ | 1.68 | $ | 1.51 | |||
The pro forma effects of the Company’s other fiscal year 2017 acquisitions on the Company’s revenues and results of operations were considered immaterial.
On July 8, 2015, the Company completed its acquisition of Rally Software Development Corp. (“Rally”), a provider of Agile development software and services. The acquisition of Rally broadens the Company’s solution set and capabilities to better serve customers in the application economy. Pursuant to the terms of the acquisition agreement and related tender offer, the Company acquired 100% of the outstanding shares of Rally common stock for approximately $519 million. The purchase price allocation for Rally, which was finalized during the first quarter of fiscal year 2017, is provided within the table below. The results of operations of Rally are reported predominantly in the Company’s Enterprise Solutions segment and were included in the consolidated results of operations of the Company from the date of acquisition.
The purchase price allocation for the Company’s other acquisitions during fiscal year 2016, including the second quarter acquisition of Xceedium, Inc. (“Xceedium”), is included within the “Other Fiscal Year 2016 Acquisitions” column below. The acquisition of Xceedium and the Company’s other acquisitions during fiscal year 2016 were immaterial, both individually and in the aggregate.
(dollars in millions) | Rally | Other Fiscal Year 2016 Acquisitions | Estimated Useful Life | ||||||
Finite-lived intangible assets (1) | $ | 78 | $ | 14 | 1-15 years | ||||
Purchased software | 178 | 96 | 5-7 years | ||||||
Goodwill | 257 | 59 | Indefinite | ||||||
Deferred tax liabilities, net | (45 | ) | (24 | ) | — | ||||
Other assets, net (2) | 51 | 2 | — | ||||||
Purchase price | $ | 519 | $ | 147 | |||||
(1) | Includes customer relationships and trade names. |
(2) | Includes approximately $13 million of cash and approximately $48 million of short-term investments acquired relating to Rally. |
The excess purchase price over the estimated value of the net tangible and identifiable intangible assets was recorded to goodwill. The allocation of purchase price to goodwill was predominantly due to synergies the Company expects to achieve through integration of the acquired technology with the Company’s existing product portfolio and the intangible assets that are not separable, such as assembled workforce and going concern. The goodwill relating to the Company’s fiscal year 2016 acquisitions was not deductible for tax purposes and was allocated to the Enterprise Solutions segment. The pro forma effects of the Company’s fiscal year 2016 acquisitions on the Company’s revenues and results of operations during fiscal year 2016 were considered immaterial.
The Consolidated Statement of Operations for fiscal year 2016 included total revenue of approximately $97 million and net loss of approximately $33 million from Rally and Xceedium from the date of acquisition through March 31, 2016. Revenues and results of operations since the date of acquisition for the Company’s other fiscal 2016 acquisitions were considered immaterial.
Transaction costs for the Company’s fiscal year 2016 acquisitions, which were primarily included in “General and administrative” in the Company’s Consolidated Statement of Operations, were approximately $20 million for fiscal year 2016.
The Company had approximately $11 million and $12 million of accrued acquisition-related costs at March 31, 2018 and 2017, respectively, related to purchase price amounts withheld subject to indemnification protections.
76
Note 3 — Divestitures
In the fourth quarter of fiscal year 2016, the Company sold ERwin for approximately $50 million and recognized a gain on disposal of approximately $4 million, including tax expense of approximately $24 million. The effective tax rate on the disposal was unfavorably affected by non-deductible goodwill of approximately $36 million.
In the fourth quarter of fiscal year 2016, the Company also recognized a loss from a prior period divestiture of approximately $2 million.
The divestiture of ERwin resulted from an effort to rationalize the Company’s product portfolio within the Enterprise Solutions segment.
The income from discontinued operations for fiscal year 2016 consisted of the following:
Year Ended March 31, | |||
(in millions) | 2016 | ||
Subscription and maintenance | $ | 20 | |
Software fees and other | 7 | ||
Total revenue | $ | 27 | |
Income from operations of discontinued components, net of tax expense of $7 million | $ | 12 | |
Gain on disposal of discontinued components, net of tax | 2 | ||
Income from discontinued operations, net of tax | $ | 14 | |
Note 4 — Restructuring
Accrued restructuring severance and exit costs and changes in the accruals for fiscal years 2018, 2017 and 2016 were as follows:
(in millions) | Accrued Balance at March 31, 2017 | Expense | Change in Estimate | Payments | Accretion and Other | Accrued Balance at March 31, 2018 | |||||||||||||||||
Severance charges | $ | 1 | $ | — | $ | — | $ | (1 | ) | $ | — | $ | — | ||||||||||
Facility exit charges | 11 | — | — | (3 | ) | (1 | ) | 7 | |||||||||||||||
Total accrued liabilities | $ | 12 | $ | 7 | |||||||||||||||||||
(in millions) | Accrued Balance at March 31, 2016 | Expense | Change in Estimate | Payments | Accretion and Other | Accrued Balance at March 31, 2017 | |||||||||||||||||
Severance charges | $ | 3 | $ | — | $ | (1 | ) | $ | (1 | ) | $ | — | $ | 1 | |||||||||
Facility exit charges | 16 | — | — | (4 | ) | (1 | ) | 11 | |||||||||||||||
Total accrued liabilities | $ | 19 | $ | 12 | |||||||||||||||||||
(in millions) | Accrued Balance at March 31, 2015 | Expense | Change in Estimate | Payments | Accretion and Other | Accrued Balance at March 31, 2016 | |||||||||||||||||
Severance charges | $ | 28 | $ | — | $ | (3 | ) | $ | (22 | ) | $ | — | $ | 3 | |||||||||
Facility exit charges | 21 | — | — | (5 | ) | — | 16 | ||||||||||||||||
Total accrued liabilities | $ | 49 | $ | 19 | |||||||||||||||||||
The severance liabilities are included in “Accrued salaries, wages and commissions” in the Consolidated Balance Sheets. The facility exit liabilities are included in “Accrued expenses and other current liabilities” and “Other noncurrent liabilities” in the Consolidated Balance Sheets.
77
Accretion and other includes accretion of the Company’s lease obligations related to facility exits as well as changes in the assumptions related to future sublease income. These costs are included in “General and administrative” expense in the Consolidated Statements of Operations.
Note 5 — Long-Lived Assets
Property and Equipment: A summary of property and equipment was as follows:
At March 31. | |||||||
(in millions) | 2018 | 2017 | |||||
Land and buildings | $ | 190 | $ | 172 | |||
Equipment, software developed for internal use, furniture and leasehold improvements | 912 | 906 | |||||
Total property and equipment | $ | 1,102 | $ | 1,078 | |||
Accumulated depreciation | (865 | ) | (841 | ) | |||
Property and equipment, net | $ | 237 | $ | 237 | |||
Capitalized Software and Other Intangible Assets: The gross carrying amounts and accumulated amortization for capitalized software and other intangible assets at March 31, 2018 were as follows:
At March 31, 2018 | |||||||||||||||||||
(in millions) | Gross Amortizable Assets | Less: Fully Amortized Assets | Remaining Amortizable Assets | Accumulated Amortization on Remaining Amortizable Assets | Net Assets | ||||||||||||||
Purchased software products | $ | 6,572 | $ | 4,961 | $ | 1,611 | $ | 845 | $ | 766 | |||||||||
Internally developed software products | 1,467 | 1,347 | 120 | 109 | 11 | ||||||||||||||
Other intangible assets | 1,226 | 823 | 403 | 69 | 334 | ||||||||||||||
Total capitalized software and other intangible assets | $ | 9,265 | $ | 7,131 | $ | 2,134 | $ | 1,023 | $ | 1,111 | |||||||||
The gross carrying amounts and accumulated amortization for capitalized software and other intangible assets at March 31, 2017 were as follows:
At March 31, 2017 | |||||||||||||||||||
(in millions) | Gross Amortizable Assets | Less: Fully Amortized Assets | Remaining Amortizable Assets | Accumulated Amortization on Remaining Amortizable Assets | Net Assets | ||||||||||||||
Purchased software products | $ | 6,496 | $ | 4,914 | $ | 1,582 | $ | 667 | $ | 915 | |||||||||
Internally developed software products | 1,467 | 1,029 | 438 | 391 | 47 | ||||||||||||||
Other intangible assets | 1,193 | 812 | 381 | 36 | 345 | ||||||||||||||
Total capitalized software and other intangible assets | $ | 9,156 | $ | 6,755 | $ | 2,401 | $ | 1,094 | $ | 1,307 | |||||||||
There were no impairments recorded for internally developed software products or purchased software products during fiscal years 2018 and 2017.
During fiscal year 2016, the Company recorded impairments of approximately $3 million within the Enterprise Solutions segment relating to purchased software products. These impairments were a result of the Company’s continued effort to rationalize its product portfolio. The impairments were included in “Amortization of capitalized software costs” in the Consolidated Statement of Operations for fiscal year 2016. Amortization of capitalized software costs was not included in segment expenses (refer to Note 16, “Segment and Geographic Information,” for additional information). There were no impairments recorded for internally developed software products during fiscal year 2016.
78
The Company evaluates the useful lives and recoverability of capitalized software and other intangible assets when events or changes in circumstances indicate that an impairment may exist. These evaluations require complex assumptions about key factors such as future customer demand, technology trends and the impact of those factors on the technology the Company acquires and develops for its products. Impairments or revisions to useful lives could result from the use of alternative assumptions that reflect reasonably possible outcomes related to future customer demand or technology trends for assets within the Enterprise Solutions segment.
Depreciation and Amortization Expense: A summary of depreciation and amortization expense was as follows:
Year Ended March 31, | |||||||||||
(in millions) | 2018 | 2017 | 2016 | ||||||||
Depreciation | $ | 66 | $ | 58 | $ | 62 | |||||
Amortization of purchased software products | 235 | 164 | 146 | ||||||||
Amortization of internally developed software products | 36 | 79 | 110 | ||||||||
Amortization of other intangible assets | 41 | 19 | 44 | ||||||||
Total depreciation and amortization expense | $ | 378 | $ | 320 | $ | 362 | |||||
Based on the capitalized software and other intangible assets recognized at March 31, 2018, the annual amortization expense over the next five fiscal years is expected to be as follows:
Year Ended March 31, | |||||||||||||||||||
(in millions) | 2019 | 2020 | 2021 | 2022 | 2023 | ||||||||||||||
Purchased software products | $ | 186 | $ | 163 | $ | 119 | $ | 110 | $ | 83 | |||||||||
Internally developed software products | 9 | 2 | — | — | — | ||||||||||||||
Other intangible assets | 41 | 37 | 37 | 36 | 32 | ||||||||||||||
Total | $ | 236 | $ | 202 | $ | 156 | $ | 146 | $ | 115 | |||||||||
Goodwill: The accumulated goodwill impairment losses previously recognized by the Company totaled approximately $111 million at March 31, 2018 and 2017. These losses were recognized in fiscal years 2003 and 2002. There were no impairments recognized in fiscal years 2018, 2017 and 2016.
Goodwill activity by segment for fiscal years 2018 and 2017 was as follows:
(in millions) | Mainframe Solutions | Enterprise Solutions | Services | Total | |||||||||||
Balance at March 31, 2016 | $ | 4,178 | $ | 1,827 | $ | 81 | $ | 6,086 | |||||||
Acquisitions | — | 771 | — | 771 | |||||||||||
Balance at March 31, 2017 | $ | 4,178 | $ | 2,598 | $ | 81 | $ | 6,857 | |||||||
Acquisitions (1) | — | (105 | ) | — | (105 | ) | |||||||||
Foreign currency translation adjustment | — | 52 | — | 52 | |||||||||||
Balance at March 31, 2018 | $ | 4,178 | $ | 2,545 | $ | 81 | $ | 6,804 | |||||||
(1) | Acquisitions amount relates to purchase price allocation adjustments that occurred during fiscal year 2018. |
79
Note 6 — Deferred Revenue
The current and noncurrent components of “Deferred revenue (billed or collected)” at March 31, 2018 and March 31, 2017 were as follows:
At March 31, | |||||||
(in millions) | 2018 | 2017 | |||||
Current: | |||||||
Subscription and maintenance | $ | 1,953 | $ | 1,948 | |||
Professional services | 140 | 135 | |||||
Software fees and other | 196 | 139 | |||||
Total deferred revenue (billed or collected) – current | $ | 2,289 | $ | 2,222 | |||
Noncurrent: | |||||||
Subscription and maintenance | $ | 798 | $ | 769 | |||
Professional services | 15 | 19 | |||||
Software fees and other | 7 | 6 | |||||
Total deferred revenue (billed or collected) – noncurrent | $ | 820 | $ | 794 | |||
Total deferred revenue (billed or collected) | $ | 3,109 | $ | 3,016 | |||
Note 7 — Debt
At March 31, 2018 and 2017, the Company’s debt obligations consisted of the following:
At March 31, | |||||||
(in millions) | 2018 | 2017 | |||||
Revolving credit facility | $ | — | $ | — | |||
2.875% Senior Notes due August 2018 | 250 | 250 | |||||
5.375% Senior Notes due December 2019 | 750 | 750 | |||||
3.600% Senior Notes due August 2020 | 400 | 400 | |||||
3.600% Senior Notes due August 2022 | 500 | 500 | |||||
4.500% Senior Notes due August 2023 | 250 | 250 | |||||
4.700% Senior Notes due March 2027 | 350 | 350 | |||||
Term Loan due April 2023 | 285 | 300 | |||||
Other indebtedness, primarily capital leases | 10 | 8 | |||||
Unamortized debt issuance costs | (11 | ) | (14 | ) | |||
Unamortized discount for Senior Notes | (1 | ) | (3 | ) | |||
Total debt outstanding | $ | 2,783 | $ | 2,791 | |||
Less the current portion | (269 | ) | (18 | ) | |||
Total long-term debt portion | $ | 2,514 | $ | 2,773 | |||
Interest expense for fiscal years 2018, 2017 and 2016 was $127 million, $90 million and $81 million, respectively.
The maturities of outstanding debt are as follows:
Year Ended March 31, | |||||||||||||||||||||||
(in millions) | 2019 | 2020 | 2021 | 2022 | 2023 | Thereafter | |||||||||||||||||
Amount due | $ | 269 | $ | 767 | $ | 414 | $ | 31 | $ | 710 | $ | 592 | |||||||||||
Revolving Credit Facility: In June 2017, the Company amended its revolving credit facility to extend the termination date from June 2019 to June 2022. The maximum committed amount available under the revolving credit facility is $1 billion. The facility also provides the Company with an option to increase the available credit by an amount up to $500 million. This option is subject to certain conditions and the agreement of the facility lenders.
80
There was no borrowing activity under the revolving credit facility for fiscal years 2018 and 2017. In July 2015 and in connection with the acquisition of Rally, the Company borrowed $400 million under its revolving credit facility. The interest rate applicable to the Company at the time of borrowing under the revolving credit facility was approximately 1.19%. In August 2015, the Company repaid the $400 million borrowing under its revolving credit facility with proceeds received from the Company’s issuance of the 3.600% Notes described below. Interest expense in connection with the borrowing under the revolving credit facility was less than $1 million for fiscal year 2016.
At March 31, 2018 and 2017, there were no outstanding borrowings under the revolving credit facility.
Advances under the revolving credit facility bear interest at a rate dependent on the Company’s credit ratings at the time of those borrowings and are calculated according to a Base Rate or a Eurocurrency Rate, as the case may be, plus an applicable margin. The Company must also pay facility commitment fees quarterly on the full revolving credit commitment at rates dependent on the Company’s credit ratings. Based on the Company’s credit ratings, the rates applicable to the facility at March 31, 2018 and 2017 were as follows:
At March 31, | |||||
2018 | 2017 | ||||
Applicable margin on Base Rate borrowing | 0.125 | % | 0.125 | % | |
Weighted average interest rate on outstanding borrowings | — | % | — | % | |
Applicable margin on Eurocurrency Rate borrowing | 1.000 | % | 1.000 | % | |
Facility commitment fee | 0.125 | % | 0.125 | % | |
The interest rate that would have applied at March 31, 2018 to a borrowing under the amended revolving credit facility would have been 4.88% for Base Rate borrowings and 2.88% for Eurocurrency Rate borrowings.
The revolving credit facility contains customary covenants for borrowings of this type, including two financial covenants: (i) as of any date, for the period of four fiscal quarters ended on or immediately prior to such date, the ratio of consolidated debt for borrowed money to consolidated cash flow, each as defined in the revolving credit facility agreement, must not exceed 4.00 to 1.00; and (ii) as of any date, for the period of four fiscal quarters ended on or immediately prior to such date, the ratio of consolidated cash flow to the sum of interest payable on, and amortization of debt discount in respect of, all consolidated debt for borrowed money, as defined in the credit agreement, must not be less than 3.50 to 1.00. At March 31, 2018, the Company was in compliance with all covenants.
In addition, future borrowings under the revolving credit facility require, at the date of a borrowing, that (i) no event of default shall have occurred and be continuing and (ii) the Company reaffirm the representations and warranties it made in the credit agreement.
Senior Notes: The Company’s Senior Notes (“Notes”) are senior unsecured obligations that rank equally in right of payment with all of the Company’s other existing and future senior unsecured and unsubordinated indebtedness. The Notes are senior in right of payment to all of the Company's existing and future senior subordinated or subordinated indebtedness. The Notes are subordinated to any future secured indebtedness to the extent of the assets securing such future indebtedness and structurally subordinated to any indebtedness of the Company’s subsidiaries. The Company has the option to redeem the Notes at any time, at redemption prices equal to the greater of (i) the principal amount of the securities to be redeemed or (ii) the sum of the present values of the remaining scheduled payments of principal thereof and interest thereon that would be due on the securities to be redeemed, discounted to the date of redemption on a semi-annual basis at the treasury rate plus the basis points specified for each series of Notes. The Notes contain customary covenants and events of default. The maturity of the Notes may be accelerated by the holders upon certain events of default, including failure to make payments when due and failure to comply with covenants or agreements of the Company set forth in the Notes or the Indenture after notice and failure to cure.
2.875% Senior Notes due August 2018: In August 2013, the Company issued $250 million of 2.875% Senior Notes due August 2018 for proceeds of approximately $249 million, reflecting a discount of approximately $1 million. The 2.875% Notes due August 2018 are redeemable by the Company at any time, subject to a “make-whole” premium of 25 basis points. Interest is payable semiannually in February and August. In the event of a change of control, each note holder will have the right to require the Company to repurchase all or any part of the holder’s 2.875% Notes due August 2018 in cash at a price equal to 101% of the principal amount of such notes plus accrued and unpaid interest, if any, to the date of repurchase (subject to the right of holders of record on the relevant interest payment date to receive interest due).
5.375% Senior Notes due December 2019: In November 2009, the Company issued $750 million of 5.375% Senior Notes due December 2019. The 5.375% Notes due December 2019 are redeemable by the Company at any time, subject to a “make-whole” premium of 30 basis points. Interest is payable semiannually in June and December. In the event of a change of control, each note holder will have the right to require the Company to repurchase all or any part of the holder’s 5.375% Notes due December 2019 in cash at a price equal to 101% of the principal amount of such notes plus accrued and unpaid interest, if any, to the date of repurchase (subject to the right of holders of record on the relevant interest payment date to receive interest due).
81
3.600% Senior Notes due August 2020: In August 2015, the Company issued $400 million of 3.600% Senior Notes due August 2020 for proceeds of approximately $400 million, reflecting a discount of less than $1 million. The 3.600% Notes due August 2020 are redeemable by the Company at any time, subject to a “make-whole” premium of 30 basis points. Interest is payable semiannually in February and August. In the event of a change of control, each note holder will have the right to require the Company to repurchase all or any part of the holder’s 3.600% Notes due August 2020 in cash at a price equal to 101% of the principal amount of such notes plus accrued and unpaid interest, if any, to the date of repurchase (subject to the right of holders of record on the relevant interest payment date to receive interest due). The Company incurred transaction costs of approximately $3 million associated with the 3.600% Notes due August 2020 and is amortizing these costs to “Interest expense, net” in the Company's Consolidated Statements of Operations.
3.600% Senior Notes due August 2022: In March 2017, the Company issued $500 million of 3.600% Senior Notes due August 2022 for proceeds of approximately $500 million, reflecting a discount of less than $1 million. The 3.600% Notes due August 2022 are redeemable by the Company at any time, subject to a “make-whole” premium of 25 basis points. Interest is payable semiannually in February and August. In the event of a change of control, each note holder will have the right to require the Company to repurchase all or any part of the holder’s 3.600% Notes due August 2022 in cash at a price equal to 101% of the principal amount of such notes plus accrued and unpaid interest, if any, to the date of repurchase (subject to the right of holders of record on the relevant interest payment date to receive interest due). The Company incurred transaction costs of approximately $4 million associated with the 3.600% Notes due August 2022 and is amortizing these costs to “Interest expense, net” in the Company's Consolidated Statements of Operations.
4.500% Senior Notes due August 2023: In August 2013, the Company issued $250 million of 4.500% Senior Notes due August 2023 for proceeds of approximately $249 million, reflecting a discount of approximately $1 million. The 4.500% Notes due August 2023 are redeemable by the Company at any time, subject to a “make-whole” premium of 30 basis points. Interest is payable semiannually in February and August. In the event of a change of control, each note holder will have the right to require the Company to repurchase all or any part of the holder’s 4.500% Notes due August 2023 in cash at a price equal to 101% of the principal amount of such notes plus accrued and unpaid interest, if any, to the date of repurchase (subject to the right of holders of record on the relevant interest payment date to receive interest due).
4.700% Senior Notes due March 2027: In March 2017, the Company issued $350 million of 4.700% Senior Notes due March 2027 for proceeds of $350 million. The 4.700% Notes due March 2027 are redeemable by the Company at any time, subject to a “make-whole” premium of 35 basis points. Interest is payable semiannually in March and September. In the event of a change of control, each note holder will have the right to require the Company to repurchase all or any part of the holder’s 4.700% Notes due March 2027 in cash at a price equal to 101% of the principal amount of such notes plus accrued and unpaid interest, if any, to the date of repurchase (subject to the right of holders of record on the relevant interest payment date to receive interest due). The Company incurred transaction costs of approximately $3 million associated with the 4.700% Notes due March 2027 and is amortizing these costs to “Interest expense, net” in the Company's Consolidated Statements of Operations.
Term Loan due April 2023: In October 2015, the Company entered into a term loan agreement with Bank of America, N.A. (“Term Loan Agreement”). The Term Loan Agreement provided for a $300 million term loan (“Term Loan”) with a maturity date of April 20, 2022. In April 2018, the Company amended its Term Loan Agreement to extend the maturity date to April 20, 2023.
The Term Loan Agreement requires quarterly principal amortization payments in an amount equal to, from April 1, 2017 through January 1, 2021, 1.25%, and, from April 1, 2021 through January 1, 2022, 2.50%, of the original stated principal amount of the Term Loan, with the balance of the Term Loan due in full on April 20, 2023. The Company may prepay the outstanding principal amount of the Term Loan in whole or in part without premium or penalty.
The Term Loan bears interest at a rate dependent on the Company’s credit ratings applicable from time to time and, at the Company’s option, is calculated according to a base rate or a Eurodollar rate, as the case may be, plus an applicable margin. Based on the April 2018 amendment and depending on the Company’s credit ratings, the applicable margin for any portion of the Term Loan accruing interest based on the base rate ranges from 0.000% to 0.500% and the applicable margin for any portion of the Term Loan accruing interest based on the Eurodollar rate ranges from 0.875% to 1.500%. At the Company’s current credit ratings, the applicable margin would be 0.125% for interest at the base rate and 1.125% for interest at the Eurodollar rate.
The Term Loan Agreement provides that the Company may use the proceeds of the Term Loan for general corporate purposes of the Company and its subsidiaries, which may include, but is not limited to, share repurchases, acquisitions and the refinancing of existing indebtedness. The Term Loan Agreement also contains covenants and events of default consistent with the Company’s revolving credit facility.
82
Other Indebtedness: The Company had approximately $114 million of unsecured and uncommitted multi-currency lines of credit at both March 31, 2018 and 2017 available to meet short-term working capital needs for the Company’s subsidiaries. The Company uses guarantees and letters of credit issued by financial institutions to guarantee performance on certain contracts and other items. At March 31, 2018 and 2017, approximately $60 million and $51 million, respectively, of these lines of credit were pledged in support of bank guarantees and other local credit lines. At March 31, 2018 and 2017, none of these arrangements were drawn down by third parties.
The Company uses a notional pooling arrangement with an international bank to help manage global liquidity. Under this pooling arrangement, the Company and its participating subsidiaries may maintain either cash deposit or borrowing positions through local currency accounts with the bank, so long as the aggregate position of the global pool is a notionally calculated net cash deposit. Because it maintains a security interest in the cash deposits and has the right to offset the cash deposits against the borrowings, the bank provides the Company and its participating subsidiaries favorable interest terms on both. At March 31, 2018 and 2017, the borrowings outstanding under this notional pooling arrangement, and changes therein, were as follows:
At March 31, | |||||||
(in millions) | 2018 | 2017 | |||||
Total borrowings outstanding at beginning of year (1) | $ | 137 | $ | 139 | |||
Borrowings | 2,310 | 2,374 | |||||
Repayments | (2,354 | ) | (2,351 | ) | |||
Foreign exchange effect | 44 | (25 | ) | ||||
Total borrowings outstanding at end of year (1) | $ | 137 | $ | 137 | |||
(1) | Included in “Accrued expenses and other current liabilities” in the Company’s Consolidated Balance Sheets. |
Note 8 — Derivatives
The Company is exposed to financial market risks arising from changes in interest rates and foreign exchange rates. Changes in interest rates could affect the Company’s monetary assets and liabilities, and foreign exchange rate changes could affect the Company’s foreign currency denominated monetary assets and liabilities and forecasted transactions. The Company enters into derivative contracts with the intent of mitigating a portion of these risks.
Foreign Currency Contracts: The Company enters into foreign currency option and forward contracts to manage balance sheet and forecasted transaction foreign currency risks. The Company has not designated its foreign currency derivatives as hedges for accounting purposes. The Company’s foreign currency derivative trading strategy is to economically hedge a majority of its material exposures due to forecasted and actual intercompany cash flows, such as royalties and development costs. The Company also economically hedges its material receivable, payable and cash balances held in non-functional currencies. The Company’s foreign currency contracts are generally short-term in duration. Primary currencies hedged include the euro, the British pound sterling, the Australian dollar, the Brazilian real, the Japanese yen, the Canadian dollar, the Israeli shekel, the Indian rupee and the Czech koruna. Changes in fair value from these contracts are recorded as “Other expenses, net” in the Company’s Consolidated Statements of Operations.
At March 31, 2018, foreign currency contracts outstanding consisted of purchase and sale contracts with a total gross notional value of approximately $456 million, and durations of less than three months. The net fair value of these contracts at March 31, 2018 was a net asset of approximately $1 million, of which approximately $2 million was included in “Other current assets” and approximately $1 million was included in “Accrued expenses and other current liabilities” in the Company’s Consolidated Balance Sheet.
At March 31, 2017, foreign currency contracts outstanding consisted of purchase and sale contracts with a total gross notional value of approximately $336 million and durations of less than three months. The net fair value of these contracts at March 31, 2017 was a net asset of approximately $1 million, of which approximately $2 million was included in “Other current assets” and approximately $1 million was included in “Accrued expenses and other current liabilities” in the Company’s Consolidated Balance Sheet.
A summary of the effect of foreign currency derivatives on the Company’s Consolidated Statements of Operations was as follows:
Amount of Net Loss Recognized in the Consolidated Statements of Operations | |||||||||||
Location of Amounts Recognized | Year Ended March 31, | ||||||||||
(in millions) | 2018 | 2017 | 2016 | ||||||||
Other expenses, net – foreign currency contracts | $ | 13 | $ | 4 | $ | 6 | |||||
83
The Company is subject to collateral security arrangements with most of its major counterparties. These arrangements require the Company or the counterparty to post collateral when the derivative fair values exceed contractually established thresholds. The aggregate fair values of all derivative instruments under these collateralized arrangements were either in a net asset position or under the established threshold at March 31, 2018 and 2017. The Company posted no collateral at March 31, 2018 or 2017. Under these agreements, if the Company’s credit ratings had been downgraded one rating level, the Company would still not have been required to post collateral.
Note 9 — Fair Value Measurements
The following table presents the Company’s assets and liabilities that were measured at fair value on a recurring basis at March 31, 2018 and 2017:
At March 31, 2018 | At March 31, 2017 | ||||||||||||||||||||||
Fair Value Measurement Using Input Types | Estimated Fair Value | Fair Value Measurement Using Input Types | Estimated Fair Value | ||||||||||||||||||||
(in millions) | Level 1 | Level 2 | Total | Level 1 | Level 2 | Total | |||||||||||||||||
Assets: | |||||||||||||||||||||||
Money market funds (1) | $ | 1,281 | $ | — | $ | 1,281 | $ | 1,077 | $ | — | $ | 1,077 | |||||||||||
Foreign exchange derivatives (2) | — | 2 | 2 | — | 2 | 2 | |||||||||||||||||
Total assets | $ | 1,281 | $ | 2 | $ | 1,283 | $ | 1,077 | $ | 2 | $ | 1,079 | |||||||||||
Liabilities: | |||||||||||||||||||||||
Foreign exchange derivatives (2) | $ | — | $ | 1 | $ | 1 | $ | — | $ | 1 | $ | 1 | |||||||||||
Total liabilities | $ | — | $ | 1 | $ | 1 | $ | — | $ | 1 | $ | 1 | |||||||||||
(1) | The Company’s investments in money market funds are classified as “Cash and cash equivalents” in its Consolidated Balance Sheets. |
(2) | Refer to Note 8, “Derivatives” for additional information. |
At March 31, 2018 and 2017, the Company did not have any assets or liabilities measured at fair value on a recurring basis using significant unobservable inputs (Level 3).
The carrying values of financial instruments classified as current assets and current liabilities, such as cash and cash equivalents, short-term investments, accounts payable, accrued expenses, and short-term borrowings, approximate fair value due to the short-term maturity of the instruments.
The following table presents the carrying amounts and estimated fair values of the Company’s other financial instruments that were not measured at fair value on a recurring basis at March 31, 2018 and 2017:
At March 31, 2018 | At March 31, 2017 | ||||||||||||||
(in millions) | Carrying Value | Estimated Fair Value | Carrying Value | Estimated Fair Value | |||||||||||
Liabilities: | |||||||||||||||
Total debt (1) | $ | 2,783 | $ | 2,844 | $ | 2,791 | $ | 2,903 | |||||||
Facility exit reserve (2) | $ | 7 | $ | 8 | $ | 11 | $ | 12 | |||||||
(1) | Estimated fair value of total debt is based on quoted prices for similar liabilities for which significant inputs are observable except for certain long-term lease obligations, for which fair value approximates carrying value (Level 2). |
(2) | Estimated fair value for the facility exit reserve is determined using the Company’s incremental borrowing rate at March 31, 2018 and 2017. At March 31, 2018 and 2017, the facility exit reserve included approximately $2 million and $3 million, respectively, in “Accrued expenses and other current liabilities” and approximately $5 million and $8 million, respectively, in “Other noncurrent liabilities” in the Company’s Consolidated Balance Sheets (Level 3). |
Note 10 — Commitments and Contingencies
The Company leases real estate and equipment with lease terms expiring through fiscal year 2029. Certain leases provide for renewal options and additional rentals based on escalations in operating expenses and real estate taxes.
Rental expense, including short-term leases, maintenance charges and taxes on leased facilities, was approximately $142 million, $138 million and $142 million for fiscal years 2018, 2017 and 2016, respectively. Rental expense does not include rent expense associated with facilities exited as part of previous restructuring plans and actions.
84
Future minimum lease payments under non-cancelable operating leases, including facilities exited as part of previous restructuring plans and actions, at March 31, 2018 were as follows:
Fiscal Year | (in millions) | ||
2019 | $ | 97 | |
2020 | 85 | ||
2021 | 74 | ||
2022 | 54 | ||
2023 | 38 | ||
Thereafter | 110 | ||
Total | $ | 458 | |
Less income from subleases | (33 | ) | |
Net minimum operating lease payments | $ | 425 | |
The Company has additional commitments to purchase goods and services of approximately $181 million in future periods, approximately $164 million of which expires by fiscal year 2023.
In connection with the share repurchase arrangement with Careal Holding AG (“Careal”), the Company agreed that it will indemnify Careal for certain potential tax matters resulting solely from the Company’s breach of the covenant relating to the post-closing holding of the repurchased shares under this arrangement. The Company believes that the occurrence of an event that could trigger the indemnification is within its control and is remote. Therefore, the Company has not recorded a liability related to such indemnification. The maximum potential future payment under this indemnification, excluding interest and penalties, if any, is estimated to be approximately CHF 101 million (which translated to approximately $106 million at March 31, 2018). Any changes to the Company’s assessment of the probability of the occurrence of an event that could trigger the indemnification provision may result in the Company recording a liability in the future, which would impact the results of operations for that period. Refer to Note 11, “Stockholders’ Equity” for additional information.
Litigation: The Company, from time to time, may be named as a defendant in various lawsuits and claims arising in the normal course of business. The Company may also become involved with contract issues and disputes with customers.
Based on the Company’s experience, management believes that the damages amounts claimed in a case are not a meaningful indicator of the potential liability. Claims, suits, investigations and proceedings are inherently uncertain and it is not possible to predict the ultimate outcome of cases. The Company believes that it has meritorious defenses in connection with its current lawsuits and material claims and disputes, and intends to vigorously contest each of them.
In the opinion of the Company’s management based upon information currently available to the Company, while the outcome of its lawsuits, claims and disputes is uncertain, the likely results of these lawsuits, claims and disputes are not expected, either individually or in the aggregate, to have a material adverse effect on the Company’s financial position, results of operations or cash flows, although the effect could be material to the Company’s results of operations or cash flows for any interim reporting period. For some matters, the Company is unable to estimate a range of reasonably possible loss due to the stage of the matter and/or other particular circumstances of the matter. For others, a range of reasonably possible loss can be estimated. For those matters for which such a range can be estimated, the Company estimates that, in the aggregate, the range of reasonably possible loss does not exceed $20 million. This is in addition to any amounts that have been accrued.
Note 11 — Stockholders’ Equity
Stock Repurchases: On November 13, 2015, the Board of Directors (the “Board”) approved a stock repurchase program that authorized the Company to acquire up to $750 million of its common stock. During fiscal year 2018, the Company repurchased approximately 5.0 million shares of its common stock for approximately $163 million. At March 31, 2018, the Company remained authorized to purchase approximately $487 million of its common stock under its current stock repurchase program.
During fiscal year 2017, the Company repurchased approximately 3.1 million shares of its common stock for approximately $100 million.
85
In November 2015, the Company entered into and closed on an arrangement with Careal to repurchase 22 million shares of its common stock in a private transaction. The transaction was valued with an effective share repurchase price of $26.81 per share, which represented a 3% discount to the 10-trading day volume weighted average price of the Company’s common stock using a reference date of November 5, 2015. The Company’s payment to Careal upon closing was reduced by $0.25 per share to account for the Company’s dividend that was paid on December 8, 2015 to stockholders of record on November 19, 2015. As a result of the share repurchase and dividend payment, in total the Company paid Careal approximately $590 million during the third quarter of fiscal year 2016 in connection with the 22 million shares repurchased. The transaction was funded with U.S. cash on hand and effectively concluded CA's prior $1 billion stock repurchase program approved by the Board on May 14, 2014.
Including the share repurchase arrangement with Careal, the Company repurchased approximately 26 million shares of its common stock for approximately $707 million during fiscal year 2016.
Prior to entering into and closing on the share repurchase arrangement, Careal held approximately 28.7% of the Company’s total outstanding stock. As of March 31, 2018, Careal and its shareholders collectively owned, directly and indirectly, approximately 25.2% of the Company’s total outstanding common stock.
Accumulated Other Comprehensive Loss: Foreign currency translation losses included in "Accumulated other comprehensive loss" in the Company's Consolidated Balance Sheets at March 31, 2018, 2017 and 2016 were approximately $290 million, $483 million and $416 million, respectively.
Cash Dividends: The Board declared the following dividends during fiscal years 2018 and 2017:
Year Ended March 31, 2018:
(in millions, except per share amounts)
Declaration Date | Dividend Per Share | Record Date | Total Amount | Payment Date | ||||
May 9, 2017 | $0.255 | May 25, 2017 | $107 | June 13, 2017 | ||||
August 9, 2017 | $0.255 | August 24, 2017 | $108 | September 12, 2017 | ||||
November 9, 2017 | $0.255 | November 30, 2017 | $106 | December 12, 2017 | ||||
February 7, 2018 | $0.255 | February 22, 2018 | $107 | March 13, 2018 | ||||
Year Ended March 31, 2017:
(in millions, except per share amounts)
Declaration Date | Dividend Per Share | Record Date | Total Amount | Payment Date | ||||
May 4, 2016 | $0.255 | May 26, 2016 | $107 | June 14, 2016 | ||||
August 3, 2016 | $0.255 | August 25, 2016 | $107 | September 13, 2016 | ||||
November 2, 2016 | $0.255 | November 17, 2016 | $107 | December 6, 2016 | ||||
February 1, 2017 | $0.255 | February 16, 2017 | $107 | March 14, 2017 | ||||
86
Rights Plan: Under the Stockholder Protection Rights Agreement dated November 30, 2015 (“Rights Agreement”), each outstanding share of the Company's common stock carries a right (“Right”). The Rights will trade with the common stock until the Separation Time, which is the next business day following the earlier of (i) the tenth business day (or such later day designated by resolution of the Board) after any person commences a tender or exchange offer that would result in such person (together with its affiliates and associates) becoming the beneficial owner of 20% or more of the Company’s common stock (other than Martin Haefner and Eva Maria Bucher-Haefner and their respective affiliates and associates, who are “grandfathered” under this provision so long as their aggregate ownership of common stock does not exceed 25% of the shares of the Company’s outstanding common stock) (“Acquiring Person”); or (ii) the date of a “Flip-in” Trigger. A “Flip-in” Trigger will occur upon the earlier of (i) a public announcement by the Company that any person has become an Acquiring Person or (ii) an Acquiring Person acquires more than 50% of the Company’s outstanding shares of common stock. On or after the Separation Time, each Right would initially entitle the holder to purchase, for $120, one one-thousandth (0.001) of a share of the Company’s participating preferred stock. The participating preferred stock would be designed so that each one one-thousandth of a share of participating preferred stock has economic and voting terms similar to those of one share of common stock. If a “Flip-in” Trigger occurs, the Rights owned by the Acquiring Person, its affiliates and associates, or transferees thereof would automatically become void and each other Right will automatically become a right to buy, for the exercise price of $120, that number of shares of the Company’s common stock (or, at the Company’s option, participating preferred stock) having a market value of twice the exercise price. The Rights may also be redeemed by the Board, at any time until a “Flip‑in” Trigger has occurred, at a redemption price of $0.001 per Right. In addition, in connection with a Qualified Offer, holders of 10% of the Company’s common stock (excluding shares held by the offeror and its affiliates and associates), upon providing proper written notice, may direct the Board to call a special meeting of shareholders for the purposes of voting on a resolution authorizing the redemption of the Rights pursuant to the provisions of the Rights Agreement. Such meeting must be held on or prior to the 90th business day following the Company’s receipt of such written notice. A Qualified Offer means an offer that, among other things, is a fully financed all-cash tender offer or an exchange offer offering common shares of the offeror or a combination thereof; is an offer with respect to which the Board has not received an inadequacy opinion from its financial advisors; is an offer that is subject only to the minimum tender condition and other usual and customary terms and conditions; is an offer that includes a commitment of the offeror that the offer will remain open for a certain prescribed period of time; is an offer that contains a minimum tender condition of at least 50%; and is an offer pursuant to which the offeror has committed to consummate a prompt second step transaction. The Rights will expire on November 30, 2018, unless earlier redeemed by the Board.
Note 12 — Income from Continuing Operations Per Common Share
The following table presents basic and diluted income from continuing operations per common share information for fiscal years 2018, 2017 and 2016, respectively:
Year Ended March 31, | |||||||||||
(in millions, except per share amounts) | 2018 | 2017 | 2016 | ||||||||
Basic income from continuing operations per common share: | |||||||||||
Income from continuing operations | $ | 476 | $ | 775 | $ | 769 | |||||
Less: Income from continuing operations allocable to participating securities | (6 | ) | (9 | ) | (8 | ) | |||||
Income from continuing operations allocable to common shares | $ | 470 | $ | 766 | $ | 761 | |||||
Weighted average common shares outstanding | 414 | 414 | 426 | ||||||||
Basic income from continuing operations per common share | $ | 1.14 | $ | 1.85 | $ | 1.79 | |||||
Diluted income from continuing operations per common share: | |||||||||||
Income from continuing operations | $ | 476 | $ | 775 | $ | 769 | |||||
Less: Income from continuing operations allocable to participating securities | (6 | ) | (9 | ) | (8 | ) | |||||
Income from continuing operations allocable to common shares | $ | 470 | $ | 766 | $ | 761 | |||||
Weighted average shares outstanding and common share equivalents: | |||||||||||
Weighted average common shares outstanding | 414 | 414 | 426 | ||||||||
Weighted average effect of share-based payment awards | 1 | 1 | 1 | ||||||||
Denominator in calculation of diluted income per share | 415 | 415 | 427 | ||||||||
Diluted income from continuing operations per common share | $ | 1.13 | $ | 1.85 | $ | 1.78 | |||||
87
For fiscal years 2018, 2017 and 2016, respectively, approximately 2 million, 1 million and 2 million shares of Company common stock underlying restricted stock awards and options to purchase common stock were excluded from the calculation because their effect on income per share was anti-dilutive during the respective periods. Weighted average restricted stock awards of approximately 5 million, 5 million and 4 million for fiscal years 2018, 2017 and 2016, respectively, were considered participating securities in the calculation of net income allocable to common stockholders.
Note 13 — Stock Plans
Share-based incentive awards are provided to employees under the terms of the Company’s equity incentive compensation plans (the “Plans”). The Plans are administered by the Compensation Committee. Awards under the Plans may include stock options, RSAs, RSUs, PSUs, stock appreciation rights or any combination thereof. The non-employee members of the Board receive deferred stock units under a separate director compensation plan. The Company typically settles awards under employee and non-employee director compensation plans with stock held in treasury.
All Plans, with the exception of acquired companies’ stock plans, have been approved by the Company’s shareholders. The Company grants all new annual performance cash incentive bonuses, long-term performance bonuses, non-statutory stock options, RSAs, RSUs and other equity-based awards under the 2011 Incentive Plan, which replaced the 2007 Incentive Plan. Outstanding awards under the 2007 Incentive Plan and 2002 Incentive Plan, as amended, are satisfied under their respective Plans. Approximately 45 million shares of common stock were originally available to be granted to select employees and consultants under the 2011 Incentive Plan, of which no more than 10 million incentive stock options may be granted. The 2011 Incentive Plan will continue until the earlier of (i) termination by the Board or (ii) the tenth anniversary of the date of the Company’s 2011 Annual Meeting of Stockholders. Awards to the non-employee directors are granted under the 2012 Compensation Plan for Non-Employee Directors, as amended, which replaced the 2003 Compensation Plan for Non-Employee Directors, as amended.
Share-Based Compensation: The Company recognized share-based compensation in the following line items in the Consolidated Statements of Operations for the periods indicated:
Year Ended March 31, | |||||||||||
(in millions) | 2018 | 2017 | 2016 | ||||||||
Costs of licensing and maintenance | $ | 8 | $ | 7 | $ | 7 | |||||
Cost of professional services | 3 | 3 | 4 | ||||||||
Selling and marketing | 38 | 37 | 34 | ||||||||
General and administrative | 45 | 38 | 35 | ||||||||
Product development and enhancements | 26 | 23 | 17 | ||||||||
Share-based compensation expense before tax | $ | 120 | $ | 108 | $ | 97 | |||||
Income tax benefit | (37 | ) | (35 | ) | (31 | ) | |||||
Net share-based compensation expense | $ | 83 | $ | 73 | $ | 66 | |||||
The following table summarizes information about unrecognized share-based compensation costs at March 31, 2018:
Unrecognized Share-Based Compensation Costs | Weighted Average Period Expected to be Recognized | ||||
(in millions) | (in years) | ||||
Stock option awards | $ | 4 | 1.8 | ||
Restricted stock units | 18 | 1.8 | |||
Restricted stock awards | 64 | 1.8 | |||
Performance share units | 33 | 2.2 | |||
Total unrecognized share-based compensation costs | $ | 119 | 1.9 | ||
There were no capitalized share-based compensation costs at March 31, 2018, 2017 or 2016.
88
Stock Option Awards: Stock options are awards issued to employees that entitle the holder to purchase shares of the Company’s stock at a fixed price. Stock option awards are generally granted at an exercise price equal to the Company’s fair market value on the date of grant and with a contractual term of 10 years, unless the Compensation Committee establishes a shorter expiration period or the stock options are forfeited. Stock option awards generally vest one-third per year and become fully vested three years from the grant date.
At March 31, 2018, options outstanding that have vested and are expected to vest were as follows:
Number of Shares (in millions) | Weighted Average Exercise Price | Weighted Average Remaining Contractual Life (in years) | Aggregate Intrinsic Value (1) (in millions) | |||||||||
Vested | 2.4 | $ | 27.79 | 5.9 | $ | 14.6 | ||||||
Expected to vest (2) | 1.7 | 31.57 | 8.5 | 4.1 | ||||||||
Total | 4.1 | $ | 29.37 | 7.0 | $ | 18.7 | ||||||
(1) | These amounts represent the difference between the exercise price and $33.90, the closing price of the Company’s common stock on March 29, 2018, the last trading day of the Company’s fiscal year as reported on the NASDAQ Stock Market for all in-the-money options. |
(2) | Outstanding options expected to vest are net of estimated future forfeitures. |
Additional information with respect to stock option activity was as follows:
Number of Shares | Weighted Average Exercise Price | |||||
(in millions) | ||||||
Outstanding at March 31, 2015 | 3.2 | $ | 27.02 | |||
Granted | 0.8 | 30.39 | ||||
Exercised | (0.2 | ) | 25.58 | |||
Expired or terminated | (0.1 | ) | 31.08 | |||
Outstanding at March 31, 2016 | 3.7 | $ | 27.72 | |||
Granted | 1.1 | 31.84 | ||||
Exercised | (0.8 | ) | 27.09 | |||
Expired or terminated | (0.2 | ) | 30.82 | |||
Outstanding at March 31, 2017 | 3.8 | $ | 28.88 | |||
Granted | 1.0 | 31.69 | ||||
Exercised | (0.5 | ) | 29.36 | |||
Expired or terminated | — | — | ||||
Outstanding at March 31, 2018 | 4.3 | $ | 29.48 | |||
Number of Shares | Weighted Average Exercise Price | |||||
(in millions) | ||||||
Options exercisable at: | ||||||
March 31, 2016 | 2.0 | $ | 26.16 | |||
March 31, 2017 | 2.1 | $ | 27.09 | |||
March 31, 2018 | 2.4 | $ | 27.79 | |||
89
The following table summarizes stock option information at March 31, 2018:
Options Outstanding | Options Exercisable | ||||||||||||||||||||||||
Range of Exercise Prices | Shares | Aggregate Intrinsic Value | Weighted Average Remaining Contractual Life | Weighted Average Exercise Price | Shares | Aggregate Intrinsic Value | Weighted Average Remaining Contractual Life | Weighted Average Exercise Price | |||||||||||||||||
(in millions) | (in millions) | (in years) | (in millions) | (in millions) | (in years) | ||||||||||||||||||||
$22.82 — $25.00 | 0.7 | $ | 7.1 | 4.8 | $ | 23.50 | 0.7 | $ | 7.1 | 4.8 | $ | 23.50 | |||||||||||||
$25.01 — $30.00 | 0.8 | 4.6 | 5.7 | 27.85 | 0.7 | 4.5 | 5.6 | 27.81 | |||||||||||||||||
$30.01 — over | 2.8 | 7.4 | 8.0 | 31.34 | 1.0 | 3.0 | 6.9 | 30.82 | |||||||||||||||||
4.3 | $ | 19.1 | 7.1 | $ | 29.48 | 2.4 | $ | 14.6 | 5.9 | $ | 27.79 | ||||||||||||||
The fair value of each option is estimated on the date of grant using the Black-Scholes option pricing model. The Company believes that the valuation technique and the approach utilized to develop the underlying assumptions are appropriate in calculating the fair value of the Company’s stock options. Estimates of fair value are not intended to predict actual future events or the value ultimately realized by employees who receive equity awards.
The weighted average estimated values of employee stock option grants, as well as the weighted average assumptions that were used in calculating such values during fiscal years 2018, 2017 and 2016 were based on estimates at the date of grant as follows:
Year Ended March 31, | |||||||||||
2018 | 2017 | 2016 | |||||||||
Weighted average fair value | $ | 4.72 | $ | 4.42 | $ | 4.68 | |||||
Dividend yield | 3.17 | % | 3.56 | % | 3.37 | % | |||||
Expected volatility factor (1) | 21 | % | 22 | % | 23 | % | |||||
Risk-free interest rate (2) | 2.1 | % | 1.5 | % | 1.9 | % | |||||
Expected life (in years) (3) | 6.0 | 6.0 | 6.0 | ||||||||
(1) | Expected volatility is measured using historical daily price changes of the Company’s stock over the respective expected term of the options and the implied volatility derived from the market prices of the Company’s traded options. |
(2) | The risk-free rate for periods within the contractual term of the stock options is based on the U.S. Treasury yield curve in effect at the time of grant. |
(3) | The expected life is the number of years the Company estimates that options will be outstanding prior to exercise. The Company’s computation of expected life was determined based on the simplified method (the average of the vesting period and option term). |
The following table summarizes information on options exercised for the periods indicated:
Year Ended March 31, | |||||||||||
(in millions) | 2018 | 2017 | 2016 | ||||||||
Cash received from options exercised | $ | 16 | $ | 22 | $ | 4 | |||||
Intrinsic value of options exercised | $ | 3 | $ | 5 | $ | 1 | |||||
RSAs and RSUs: RSAs are shares of common stock awarded to employees, subject to restrictions on transfer and subject to forfeiture until the awards vest, typically over a three-year period. RSAs entitle holders to vote and receive dividends on the shares awarded. The fair value of the awards is determined and fixed based on the closing market value of the Company’s stock on the grant date.
RSUs are awards issued to employees that entitle the holder to receive shares of common stock as the awards vest, typically over a three-year period. RSUs do not entitle holders to vote or receive dividends on the shares underlying the RSUs. The fair value of the awards is determined and fixed based on the market value of the Company’s stock on the grant date reduced by the present value of dividends expected to be paid on the Company’s stock prior to vesting of the RSUs, which is calculated using a risk-free interest rate.
90
The following table summarizes the activity of RSAs and RSUs under the Plans:
RSAs | RSUs | ||||||||||||
Shares | Weighted Average Grant Date Fair Value | Shares | Weighted Average Grant Date Fair Value | ||||||||||
(in millions) | (in millions) | ||||||||||||
Outstanding at March 31, 2015 | 4.3 | $ | 27.99 | 1.4 | $ | 25.74 | |||||||
Granted | 2.8 | 30.59 | 0.9 | 28.72 | |||||||||
Released | (2.1 | ) | 27.95 | (0.8 | ) | 26.17 | |||||||
Forfeitures | (0.8 | ) | 29.44 | (0.2 | ) | 26.88 | |||||||
Outstanding at March 31, 2016 | 4.2 | $ | 29.51 | 1.3 | $ | 27.35 | |||||||
Granted | 2.9 | 31.56 | 1.0 | 30.17 | |||||||||
Released | (2.1 | ) | 29.27 | (0.9 | ) | 28.51 | |||||||
Forfeitures | (0.5 | ) | 30.66 | (0.1 | ) | 28.71 | |||||||
Outstanding at March 31, 2017 | 4.5 | $ | 30.83 | 1.3 | $ | 28.67 | |||||||
Granted | 3.0 | 31.76 | 1.1 | 30.47 | |||||||||
Released | (2.3 | ) | 30.51 | (1.0 | ) | 29.61 | |||||||
Forfeitures | (0.6 | ) | 31.41 | (0.1 | ) | 29.31 | |||||||
Outstanding at March 31, 2018 | 4.6 | $ | 31.52 | 1.3 | $ | 29.47 | |||||||
The total fair value on the vesting date of RSAs and RSUs released during fiscal years 2018, 2017 and 2016 was approximately $98 million, $88 million and $78 million, respectively.
Performance Awards: The Company rewards certain senior executives with performance awards under its long-term incentive plans. PSUs are awards of the right to receive grants of unrestricted shares of Common Stock, RSAs or RSUs if and when the performance conditions are met and after approval by the Compensation Committee. These PSUs include 1-year and 3-year performance periods for senior executives and a 1-year performance period for members of the sales team.
The table below summarizes the RSAs and RSUs granted under the 1-year PSUs for the Company's fiscal year 2017, 2016 and 2015 incentive plan years. The RSAs and RSUs were granted in the first quarter of fiscal years 2018, 2017 and 2016, respectively. The RSAs and RSUs vest 34% on the date of grant and 33% on the first and second anniversaries of the date of grant.
RSAs | RSUs | ||||||||||||||
Incentive Plans for Fiscal Years | Performance Period | Shares (in millions) | Weighted Average Grant Date Fair Value | Shares (in millions) | Weighted Average Grant Date Fair Value | ||||||||||
2017 | 1 year | 0.6 | $ | 31.69 | 0.1 | $ | 30.69 | ||||||||
2016 | 1 year | 0.6 | $ | 31.53 | 0.1 | $ | 30.53 | ||||||||
2015 | 1 year | 0.5 | $ | 31.41 | 0.1 | $ | 30.42 | ||||||||
The table below summarizes the shares of common stock issued under the 3-year PSUs for the Company's fiscal year 2015, 2014 and 2013 incentive plan years in the first quarter of fiscal years 2018, 2017 and 2016, respectively.
Incentive Plans for Fiscal Years | Performance Period | Shares of Common Stock (in millions) | Weighted Average Grant Date Fair Value | |||||
2015 | 3 years | 0.4 | $ | 31.69 | ||||
2014 | 3 years | 0.3 | $ | 31.53 | ||||
2013 | 3 years | 0.1 | $ | 31.41 | ||||
91
The table below summarizes the RSAs and RSUs granted under the 1-year PSUs for the Company's fiscal year 2017, 2016 and 2015 sales retention equity programs. The RSAs and RSUs were granted in the first quarter of fiscal years 2018, 2017 and 2016, respectively. The RSAs and RSUs vest on the third anniversary of the grant date.
RSAs | RSUs | ||||||||||||||
Incentive Plans for Fiscal Years | Performance Period | Shares (in millions) | Weighted Average Grant Date Fair Value | Shares (in millions) | Weighted Average Grant Date Fair Value | ||||||||||
2017 | 1 year | 0.2 | $ | 31.69 | 0.1 | $ | 28.70 | ||||||||
2016 | 1 year | 0.3 | $ | 31.53 | 0.1 | $ | 28.52 | ||||||||
2015 | 1 year | 0.2 | $ | 30.45 | 0.1 | $ | 27.50 | ||||||||
Employee Stock Purchase Plan: The Company maintains the 2012 Employee Stock Purchase Plan (“ESPP”) for all eligible employees. The ESPP offer period is semi-annual and allows participants to purchase the Company’s common stock at 95% of the closing price of the stock on the last day of each offer period, on June 30 and December 31, respectively. The ESPP is non-compensatory. During each of the fiscal years ended March 31, 2018, 2017 and 2016, the Company issued approximately 0.2 million shares under the ESPP at an average price of $32.15, $30.65 and $27.47 per share, respectively. As of March 31, 2018, approximately 28.8 million shares were available for future issuances under the ESPP.
Note 14 – Income Taxes
The amounts of income from continuing operations before income taxes attributable to domestic and foreign operations were as follows:
Year Ended March 31, | |||||||||||
(in millions) | 2018 | 2017 | 2016 | ||||||||
Domestic | $ | 704 | $ | 787 | $ | 729 | |||||
Foreign | 317 | 286 | 355 | ||||||||
Income from continuing operations before income taxes | $ | 1,021 | $ | 1,073 | $ | 1,084 | |||||
Income tax expense (benefit) from continuing operations consisted of the following:
Year Ended March 31, | |||||||||||
(in millions) | 2018 | 2017 | 2016 | ||||||||
Current: | |||||||||||
Federal | $ | 385 | $ | 215 | $ | 285 | |||||
State | 36 | 30 | 50 | ||||||||
Foreign | 85 | 74 | 95 | ||||||||
Total current | $ | 506 | $ | 319 | $ | 430 | |||||
Deferred: | |||||||||||
Federal | $ | 60 | $ | 2 | $ | (86 | ) | ||||
State | (10 | ) | (5 | ) | (20 | ) | |||||
Foreign | (11 | ) | (18 | ) | (9 | ) | |||||
Total deferred | $ | 39 | $ | (21 | ) | $ | (115 | ) | |||
Total: | |||||||||||
Federal | $ | 445 | $ | 217 | $ | 199 | |||||
State | 26 | 25 | 30 | ||||||||
Foreign | 74 | 56 | 86 | ||||||||
Total income tax expense from continuing operations | $ | 545 | $ | 298 | $ | 315 | |||||
92
The income tax expense from continuing operations was reconciled to the tax expense computed at the U.S. federal statutory tax rate as follows:
Year Ended March 31, | |||||||||||
(in millions) | 2018 | 2017 | 2016 | ||||||||
Tax expense at U.S. federal statutory tax rate | $ | 322 | $ | 376 | $ | 379 | |||||
Tax Cuts and Jobs Act | 290 | — | — | ||||||||
Effect of international operations | (61 | ) | (70 | ) | (77 | ) | |||||
U.S. federal and state tax contingencies | (2 | ) | — | 8 | |||||||
Domestic manufacturing deduction | (21 | ) | (23 | ) | (27 | ) | |||||
State taxes, net of U.S. federal tax benefit | 16 | 16 | 16 | ||||||||
Valuation allowance | (9 | ) | (16 | ) | 3 | ||||||
Other, net | 10 | 15 | 13 | ||||||||
Income tax expense from continuing operations | $ | 545 | $ | 298 | $ | 315 | |||||
Income tax expense from continuing operations includes approximately $290 million resulting from reasonable estimates of the impact of changes in tax law in the United States from the Tax Act. The amounts recorded for the impacts of the Tax Act are provisional amounts of approximately $194 million related to the taxation of unremitted earnings of the Company’s foreign subsidiaries, which is payable over eight years, and approximately $96 million related to the remeasurement of deferred tax assets and liabilities for the change in income tax rates. The provisional amounts were reduced by approximately $28 million from the Company's prior estimate due to results from the full fiscal year 2018 operations needed for calculations under the Tax Act and analysis of the historic unremitted earnings of the Company's foreign subsidiaries. The Company will continue to refine the provisional amounts as it reviews and analyzes the historic unremitted earnings of its foreign subsidiaries, as well as the attendant computations that impact the measurement of the taxation of unremitted earnings, and also takes into consideration any additional regulatory guidance published by the U.S. tax authorities in respect of the Tax Act. The Company expects to finalize the tax expense as soon as practical, but not later than the third quarter of fiscal year 2019.
Deferred income taxes reflect the effect of temporary differences between the carrying amounts of assets and liabilities recognized for financial reporting purposes and the amounts recognized for tax purposes. The tax effects of the temporary differences from continuing operations were as follows:
At March 31, | |||||||
(in millions) | 2018 | 2017 | |||||
Deferred tax assets: | |||||||
Modified accrual basis accounting for revenue | $ | 283 | $ | 364 | |||
Share-based compensation | 31 | 41 | |||||
Accrued expenses | 12 | 11 | |||||
Net operating losses | 125 | 149 | |||||
Deductible state tax and interest benefits | 10 | 19 | |||||
Other | 51 | 62 | |||||
Total deferred tax assets | $ | 512 | $ | 646 | |||
Valuation allowance | (72 | ) | (89 | ) | |||
Total deferred tax assets, net of valuation allowance | $ | 440 | $ | 557 | |||
Deferred tax liabilities: | |||||||
Purchased software | $ | 129 | $ | 207 | |||
Depreciation | — | 3 | |||||
Other intangible assets | 70 | 116 | |||||
Internally developed software | 5 | 23 | |||||
Total deferred tax liabilities | $ | 204 | $ | 349 | |||
Net deferred tax asset | $ | 236 | $ | 208 | |||
93
In management’s judgment, it is more likely than not that the total deferred tax assets, net of valuation allowance, of approximately $440 million will be realized in the foreseeable future. Realization of the net deferred tax assets is dependent on the Company’s generation of sufficient future taxable income in the related tax jurisdictions to obtain benefit from the reversal of temporary differences, net operating loss carryforwards, and tax credit carryforwards. The amount of deferred tax assets considered realizable is subject to adjustments in future periods if estimates of future taxable income change.
U.S. federal, state and foreign net operating loss carryforwards (“NOLs”) totaled approximately $734 million and $702 million at March 31, 2018 and 2017, respectively. The NOLs will expire as follows: $526 million between 2019 and 2038 and $208 million may be carried forward indefinitely.
A valuation allowance has been provided for deferred tax assets that are not expected to be realized. The valuation allowance decreased approximately $17 million and $7 million at March 31, 2018 and 2017, respectively. The decrease in the valuation allowance at both March 31, 2018 and 2017 primarily related to the release of valuation allowances in certain foreign jurisdictions due to the change in management's judgment of estimated future taxable income, partially offset by an increase in valuation allowance related to acquired NOLs.
Previously, the Company did not recognize a deferred tax liability related to undistributed foreign earnings of its subsidiaries because such earnings were considered to be indefinitely reinvested in its foreign operations. Under the Tax Act, all foreign earnings are subject to U.S. taxation and the Company has recorded a provisional estimate of approximately $194 million for the deemed repatriation tax on these earnings. Except to the extent of the U.S. income tax recognized under the Tax Act, the Company has not recognized other income taxes (e.g., state and foreign) and withholding taxes that would be incurred upon remittance of approximately $2,274 million and $3,202 million at March 31, 2018 and 2017, respectively, of unremitted earnings of the Company’s foreign subsidiaries since the Company plans to permanently reinvest all such earnings outside the United States. Due to complexities in the laws of the foreign jurisdictions and the assumptions that would have to be made, it is not practicable to estimate the amount of tax associated with such unremitted earnings.
At March 31, 2018, the gross liability for income taxes associated with uncertain tax positions, including interest and penalties, was approximately $157 million (of which approximately $7 million was classified as current). In addition, at March 31, 2018, the Company recorded approximately $10 million of deferred tax assets for future deductions of interest and state income taxes related to these uncertain tax positions. At March 31, 2017, the gross liability for income taxes associated with uncertain tax positions, including interest and penalties, was approximately $161 million (of which approximately $16 million was classified as current). In addition, at March 31, 2017, the Company recorded approximately $19 million of deferred tax assets for future deductions of interest and state income taxes related to these uncertain tax positions.
A roll-forward of the Company’s uncertain tax positions for all U.S. federal, state and foreign tax jurisdictions was as follows:
At March 31, | |||||||
(in millions) | 2018 | 2017 | |||||
Balance at beginning of year | $ | 132 | $ | 143 | |||
Additions for tax positions related to the current year | 11 | 13 | |||||
Additions for tax positions from prior years | 25 | 4 | |||||
Reductions for tax positions from prior years | (8 | ) | (9 | ) | |||
Settlement payments | (16 | ) | (3 | ) | |||
Statute of limitations expiration | (16 | ) | (13 | ) | |||
Translation and other | 5 | (3 | ) | ||||
Balance at end of year | $ | 133 | $ | 132 | |||
The amount of unrecognized tax benefits excluding interest and penalties that, if recognized, would affect the effective tax rate was approximately $124 million and $116 million at March 31, 2018 and 2017, respectively. The gross amount of interest and penalties accrued, reported in “Total liabilities,” was approximately $24 million and $29 million for fiscal years 2018 and 2017, respectively. The amount of interest and penalties decreased approximately $5 million for fiscal year 2018 and increased approximately $9 million for fiscal year 2017.
A number of years may elapse before a particular uncertain tax position for which the Company has not recorded a financial statement benefit is audited and finally resolved. The number of years with open tax audits varies depending on the tax jurisdiction. The Company is subject to tax audits in the following major taxing jurisdictions:
• | United States — federal tax years are open for years 2015 and forward; |
• | Brazil — tax years are open for years 2008 and forward; and |
• | Canada — tax years are open for years 2008 and forward. |
94
In November 2013, the Company received a tax assessment from the Brazilian tax authority relating to fiscal years 2008 - 2013. The assessment included a report of findings in connection with the examination. The Company disagrees with the proposed adjustments in the assessment and intends to vigorously dispute these matters through applicable judicial procedures, as appropriate. As the result of decisions at the administrative courts, the total potential liability from the tax assessment at March 31, 2018 was approximately 228 million Brazilian reais (which translated to approximately $69 million at March 31, 2018), including interest and penalties accumulated through March 31, 2018 and further regulatory assessments associated with appealing to the judicial courts. While the Company believes that it will ultimately prevail, if the assessment is not resolved in favor of the Company, it would have an impact on the Company’s consolidated financial position, cash flows and results of operations.
The Company does not believe it is reasonably possible that the amount of unrecognized tax benefits will significantly increase or decrease within the next 12 months.
Note 15 — Supplemental Statement of Cash Flows Information
Interest payments for fiscal years 2018, 2017 and 2016 were approximately $122 million, $86 million and $75 million, respectively. Income taxes paid, net from continuing operations for fiscal years 2018, 2017 and 2016 were approximately $350 million, $384 million and $365 million, respectively.
Non-cash financing activities for fiscal years 2018, 2017 and 2016 consisted of treasury common shares issued in connection with the following: share-based incentive awards issued under the Company’s equity compensation plans of approximately $47 million (net of approximately $36 million of income taxes withheld), $44 million (net of approximately $33 million of income taxes withheld) and $43 million (net of approximately $28 million of income taxes withheld), respectively; discretionary stock contributions to the CA, Inc. Savings Harvest Plan of approximately $23 million, $24 million and $24 million, respectively; and the Company’s ESPP of approximately $5 million, $5 million and $5 million, respectively.
Note 16 — Segment and Geographic Information
In accordance with FASB ASC Topic 280, Segment Reporting, the Company disaggregates its operations into Mainframe Solutions, Enterprise Solutions and Services segments, which is utilized by the Chief Operating Decision Maker, who is the Company's Chief Executive Officer, for evaluating segment performance and allocating resources.
The Company’s Mainframe Solutions and Enterprise Solutions segments are comprised of its software business organized by the nature of the Company’s software offerings and the platforms on which the products operate. The Services segment is comprised of product implementation, consulting, customer education and customer training services, including those directly related to the Mainframe Solutions and Enterprise Solutions software that the Company sells to its customers.
The Company regularly enters into a single arrangement with a customer that includes mainframe solutions, enterprise solutions and services. The amount of contract revenue assigned to operating segments is generally based on the manner in which the proposal is made to the customer. The software product revenue assigned to the Mainframe Solutions and Enterprise Solutions segments is based on either: (1) a list price allocation method (which allocates a discount in the total contract price to the individual products in proportion to the list price of the products); (2) allocations included within internal contract approval documents; or (3) the value for individual software products as stated in the customer contract. The price for the implementation, consulting, education and training services is separately stated in the contract and these amounts of contract revenue are assigned to the Services segment. The contract value assigned to each operating segment is then recognized in a manner consistent with the revenue recognition policies the Company applies to the customer contract for purposes of preparing the consolidated financial statements.
Segment expenses include costs that are controllable by segment managers (i.e., direct costs) and, in the case of the Mainframe Solutions and Enterprise Solutions segments, an allocation of shared and indirect costs (i.e., allocated costs). Segment-specific direct costs include a portion of selling and marketing costs, licensing and maintenance costs, product development costs and general and administrative costs. Allocated segment costs primarily include indirect and non-segment-specific direct selling and marketing costs and general and administrative costs that are not directly attributable to a specific segment. The basis for allocating shared and indirect costs between the Mainframe Solutions and Enterprise Solutions segments is dependent on the nature of the cost being allocated and is generally either in proportion to segment revenues or in proportion to the related direct cost category. Expenses for the Services segment consist of cost of professional services and other direct costs included within selling and marketing and general and administrative expenses. There are no allocated or indirect costs for the Services segment.
Segment expenses do not include amortization of purchased software, amortization of other intangible assets, amortization of internally developed software products, share-based compensation expense, severance and facility actions approved by the Board and other miscellaneous costs. A measure of segment assets is not currently provided to the Company’s Chief Executive Officer and has therefore not been disclosed.
95
The Company’s segment information for fiscal years 2018, 2017 and 2016 was as follows:
Year Ended March 31, 2018 | Mainframe Solutions | Enterprise Solutions | Services | Total | ||||||||||||
(dollars in millions) | ||||||||||||||||
Revenue | $ | 2,176 | $ | 1,748 | $ | 311 | $ | 4,235 | ||||||||
Expenses | 785 | 1,597 | 302 | 2,684 | ||||||||||||
Segment profit | $ | 1,391 | $ | 151 | $ | 9 | $ | 1,551 | ||||||||
Segment operating margin | 64 | % | 9 | % | 3 | % | 37 | % | ||||||||
Depreciation | $ | 37 | $ | 29 | $ | — | $ | 66 | ||||||||
Reconciliation of segment profit to income from continuing operations before income taxes for fiscal year 2018:
Segment profit | $ | 1,551 | |
Less: | |||
Purchased software amortization | 235 | ||
Other intangibles amortization | 41 | ||
Internally developed software products amortization | 36 | ||
Share-based compensation expense | 120 | ||
Interest expense, net | 98 | ||
Income from continuing operations before income taxes | $ | 1,021 | |
Year Ended March 31, 2017 | Mainframe Solutions | Enterprise Solutions | Services | Total | ||||||||||||
(dollars in millions) | ||||||||||||||||
Revenue | $ | 2,182 | $ | 1,553 | $ | 301 | $ | 4,036 | ||||||||
Expenses | 851 | 1,378 | 302 | 2,531 | ||||||||||||
Segment profit (loss) | $ | 1,331 | $ | 175 | $ | (1 | ) | $ | 1,505 | |||||||
Segment operating margin | 61 | % | 11 | % | — | % | 37 | % | ||||||||
Depreciation | $ | 34 | $ | 24 | $ | — | $ | 58 | ||||||||
Reconciliation of segment profit to income from continuing operations before income taxes for fiscal year 2017:
Segment profit | $ | 1,505 | |
Less: | |||
Purchased software amortization | 164 | ||
Other intangibles amortization | 19 | ||
Internally developed software products amortization | 79 | ||
Share-based compensation expense | 108 | ||
Interest expense, net | 62 | ||
Income from continuing operations before income taxes | $ | 1,073 | |
Year Ended March 31, 2016 | Mainframe Solutions | Enterprise Solutions | Services | Total | ||||||||||||
(dollars in millions) | ||||||||||||||||
Revenue | $ | 2,215 | $ | 1,484 | $ | 326 | $ | 4,025 | ||||||||
Expenses | 854 | 1,337 | 303 | 2,494 | ||||||||||||
Segment profit | $ | 1,361 | $ | 147 | $ | 23 | $ | 1,531 | ||||||||
Segment operating margin | 61 | % | 10 | % | 7 | % | 38 | % | ||||||||
Depreciation | $ | 36 | $ | 26 | $ | — | $ | 62 | ||||||||
96
Reconciliation of segment profit to income from continuing operations before income taxes for fiscal year 2016:
Segment profit | $ | 1,531 | |
Less: | |||
Purchased software amortization | 146 | ||
Other intangibles amortization | 44 | ||
Internally developed software products amortization | 110 | ||
Share-based compensation expense | 97 | ||
Other gains, net (1) | (1 | ) | |
Interest expense, net | 51 | ||
Income from continuing operations before income taxes | $ | 1,084 | |
(1) | Other gains, net consists of miscellaneous items. |
The following table presents information about the Company by geographic area for fiscal years 2018, 2017 and 2016:
(in millions) | United States | EMEA (1) | Other | Eliminations | Total | ||||||||||||||
Year Ended March 31, 2018 | |||||||||||||||||||
Revenue: | |||||||||||||||||||
From unaffiliated customers | $ | 2,674 | $ | 979 | $ | 582 | $ | — | $ | 4,235 | |||||||||
Between geographic areas (2) | 416 | — | — | (416 | ) | — | |||||||||||||
Total revenue | $ | 3,090 | $ | 979 | $ | 582 | $ | (416 | ) | $ | 4,235 | ||||||||
Property and equipment, net | $ | 94 | $ | 106 | $ | 37 | $ | — | $ | 237 | |||||||||
Total assets | $ | 9,464 | $ | 2,638 | $ | 958 | $ | — | $ | 13,060 | |||||||||
Total liabilities | $ | 5,753 | $ | 986 | $ | 426 | $ | — | $ | 7,165 | |||||||||
Year Ended March 31, 2017 | |||||||||||||||||||
Revenue: | |||||||||||||||||||
From unaffiliated customers | $ | 2,586 | $ | 887 | $ | 563 | $ | — | $ | 4,036 | |||||||||
Between geographic areas (2) | 419 | — | — | (419 | ) | — | |||||||||||||
Total revenue | $ | 3,005 | $ | 887 | $ | 563 | $ | (419 | ) | $ | 4,036 | ||||||||
Property and equipment, net | $ | 105 | $ | 93 | $ | 39 | $ | — | $ | 237 | |||||||||
Total assets | $ | 9,018 | $ | 2,736 | $ | 856 | $ | — | $ | 12,610 | |||||||||
Total liabilities | $ | 5,502 | $ | 934 | $ | 485 | $ | — | $ | 6,921 | |||||||||
Year Ended March 31, 2016 | |||||||||||||||||||
Revenue: | |||||||||||||||||||
From unaffiliated customers | $ | 2,585 | $ | 903 | $ | 537 | $ | — | $ | 4,025 | |||||||||
Between geographic areas (2) | 400 | — | — | (400 | ) | — | |||||||||||||
Total revenue | $ | 2,985 | $ | 903 | $ | 537 | $ | (400 | ) | $ | 4,025 | ||||||||
Property and equipment, net | $ | 109 | $ | 96 | $ | 37 | $ | — | $ | 242 | |||||||||
Total assets | $ | 8,185 | $ | 2,170 | $ | 849 | $ | — | $ | 11,204 | |||||||||
Total liabilities | $ | 4,646 | $ | 728 | $ | 452 | $ | — | $ | 5,826 | |||||||||
(1) | Consists of Europe, the Middle East and Africa. |
(2) | Represents royalties from foreign subsidiaries determined as a percentage of certain amounts invoiced to customers. |
Revenue is allocated to a geographic area based on the location of the sale, which is generally the customer’s country of domicile. No single customer accounted for 10% or more of total revenue for fiscal year 2018, 2017 or 2016.
97
Note 17 — Profit Sharing Plan
The Company maintains a defined contribution plan for the benefit of its U.S. employees. The plan is intended to be a tax qualified plan under Section 401(a) of the Internal Revenue Code, and contains a qualified cash or deferred arrangement as described under Section 401(k) of the Internal Revenue Code. Eligible participants may elect to contribute a percentage of their base compensation and the Company may make matching contributions.
The Company recognized costs associated with this plan of approximately $37 million, $37 million and $38 million for fiscal years 2018, 2017 and 2016, respectively. Included in these amounts were discretionary stock contributions of approximately $24 million, $24 million and $25 million for fiscal years 2018, 2017 and 2016, respectively.
Note 18 — Subsequent Events
On May 2, 2018, the Company's Board of Directors approved a restructuring plan (“Fiscal 2019 Plan”) to better align its business priorities. The Fiscal 2019 Plan comprises the termination of approximately 800 employees and global facility exits and consolidations. The Company intends to fill many of the positions involved in the Fiscal 2019 Plan with new employees who have different skill sets. These actions are intended to better align the Company’s cost structure with the skills and resources required to more effectively pursue opportunities in the marketplace and execute the Company’s long-term growth strategy. Severance and facility exit and consolidation actions under the Fiscal 2019 Plan are expected to be substantially completed by the end of fiscal year 2019. Under the Fiscal 2019 Plan, the Company expects to incur a pre-tax charge between approximately $140 million and $160 million (including severance costs between approximately $90 million and $100 million and facility exit and consolidation costs between approximately $50 million and $60 million).
98
SCHEDULE II
CA, Inc. and Subsidiaries
Valuation and Qualifying Accounts
Description | Balance at Beginning of Period | Additions/(Deductions) Charged/(Credited) to Costs and Expenses | Deductions (1) | Balance at End of Period | ||||||||||||
Allowance for doubtful accounts (in millions) | ||||||||||||||||
Year Ended March 31, 2018 | $ | 11 | $ | 2 | $ | (3 | ) | $ | 10 | |||||||
Year Ended March 31, 2017 | $ | 9 | $ | 3 | $ | (1 | ) | $ | 11 | |||||||
Year Ended March 31, 2016 | $ | 17 | $ | (2 | ) | $ | (6 | ) | $ | 9 | ||||||
(1) | Write-off of amounts against allowance provided. |
99