Attached files
| file | filename |
|---|---|
| EX-99.1 - EX-99.1 PRESS RELEASE - MYRIAD GENETICS INC | mygn-ex991_6.htm |
| 8-K - 8-K - Q318 - EARNINGS RELEASE - MYRIAD GENETICS INC | mygn-8k_20180508.htm |

Myriad Genetics Fiscal Third-Quarter 2018 Earnings Call 05/08/2018 Exhibit 99.2
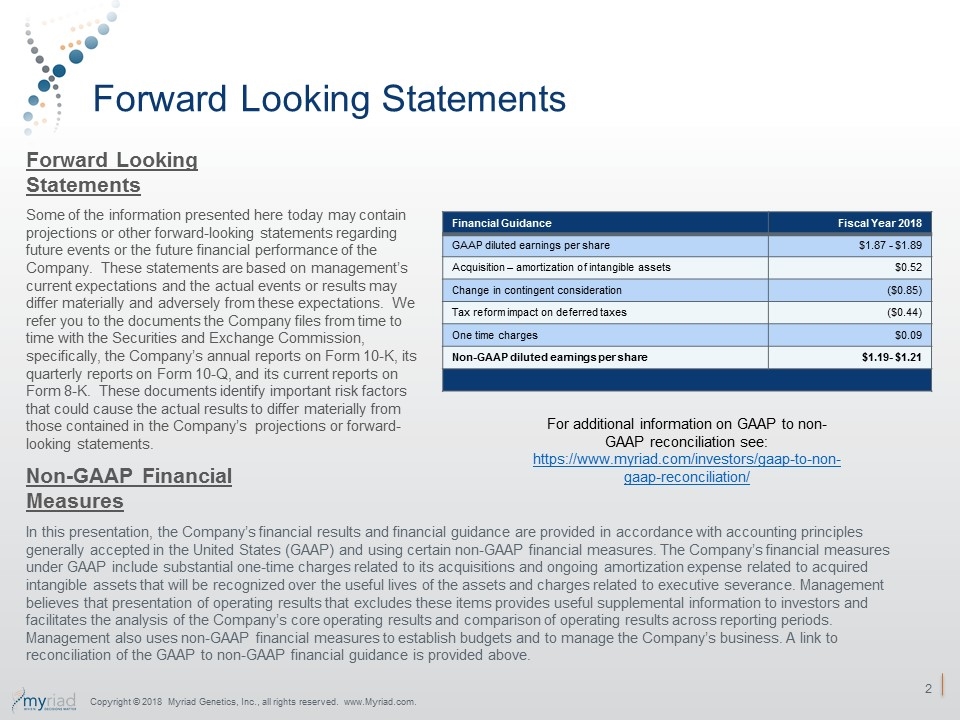
Forward Looking Statements Some of the information presented here today may contain projections or other forward-looking statements regarding future events or the future financial performance of the Company. These statements are based on management’s current expectations and the actual events or results may differ materially and adversely from these expectations. We refer you to the documents the Company files from time to time with the Securities and Exchange Commission, specifically, the Company’s annual reports on Form 10-K, its quarterly reports on Form 10-Q, and its current reports on Form 8-K. These documents identify important risk factors that could cause the actual results to differ materially from those contained in the Company’s projections or forward-looking statements. In this presentation, the Company’s financial results and financial guidance are provided in accordance with accounting principles generally accepted in the United States (GAAP) and using certain non-GAAP financial measures. The Company’s financial measures under GAAP include substantial one-time charges related to its acquisitions and ongoing amortization expense related to acquired intangible assets that will be recognized over the useful lives of the assets and charges related to executive severance. Management believes that presentation of operating results that excludes these items provides useful supplemental information to investors and facilitates the analysis of the Company’s core operating results and comparison of operating results across reporting periods. Management also uses non-GAAP financial measures to establish budgets and to manage the Company’s business. A link to reconciliation of the GAAP to non-GAAP financial guidance is provided above. Forward Looking Statements Non-GAAP Financial Measures Financial Guidance Fiscal Year 2018 GAAP diluted earnings per share $1.87 - $1.89 Acquisition – amortization of intangible assets $0.52 Change in contingent consideration ($0.85) Tax reform impact on deferred taxes ($0.44) One time charges $0.09 Non-GAAP diluted earnings per share $1.19- $1.21 For additional information on GAAP to non-GAAP reconciliation see: https://www.myriad.com/investors/gaap-to-non-gaap-reconciliation/ Copyright © 2018 Myriad Genetics, Inc., all rights reserved. www.Myriad.com.
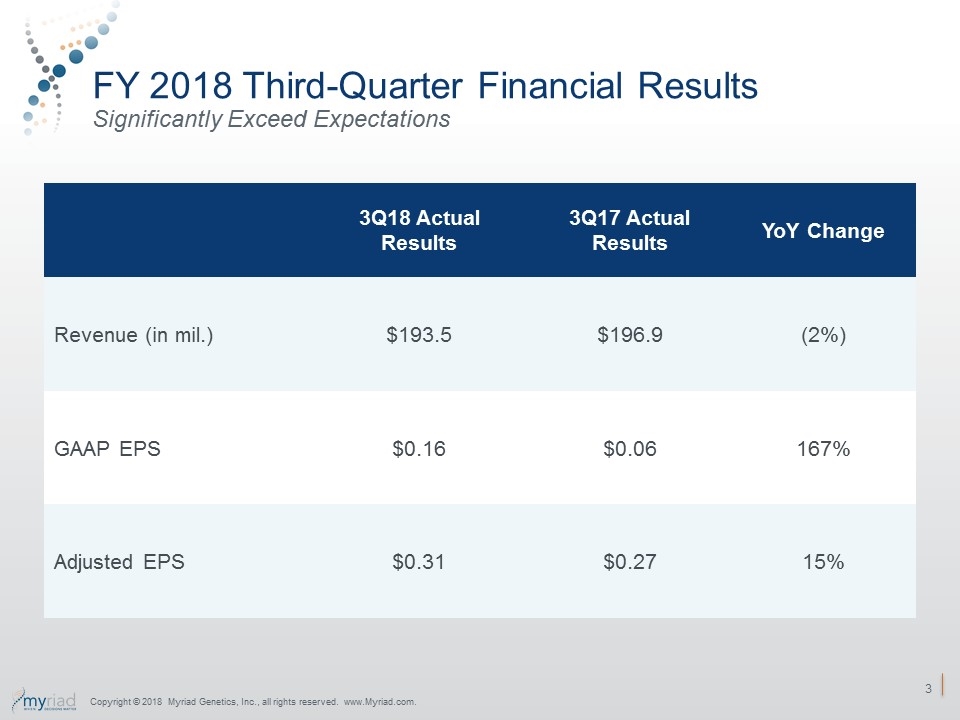
FY 2018 Third-Quarter Financial Results Significantly Exceed Expectations 3Q18 Actual Results 3Q17 Actual Results YoY Change Revenue (in mil.) $193.5 $196.9 (2%) GAAP EPS $0.16 $0.06 167% Adjusted EPS $0.31 $0.27 15% Copyright © 2018 Myriad Genetics, Inc., all rights reserved. www.Myriad.com.
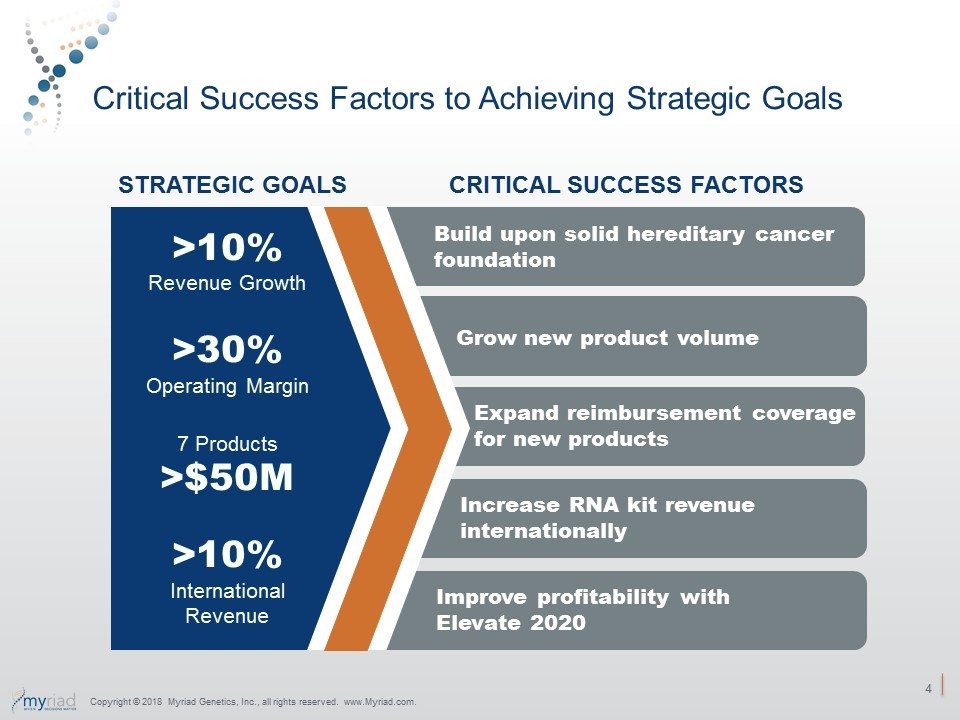
Critical Success Factors to Achieving Strategic Goals Grow new product volume STRATEGIC GOALS CRITICAL SUCCESS FACTORS >10% Revenue Growth >30% Operating Margin 7 Products >$50M >10% International Revenue Expand reimbursement coverage for new products Increase RNA kit revenue internationally Improve profitability with Elevate 2020 Copyright © 2018 Myriad Genetics, Inc., all rights reserved. www.Myriad.com. Build upon solid hereditary cancer foundation
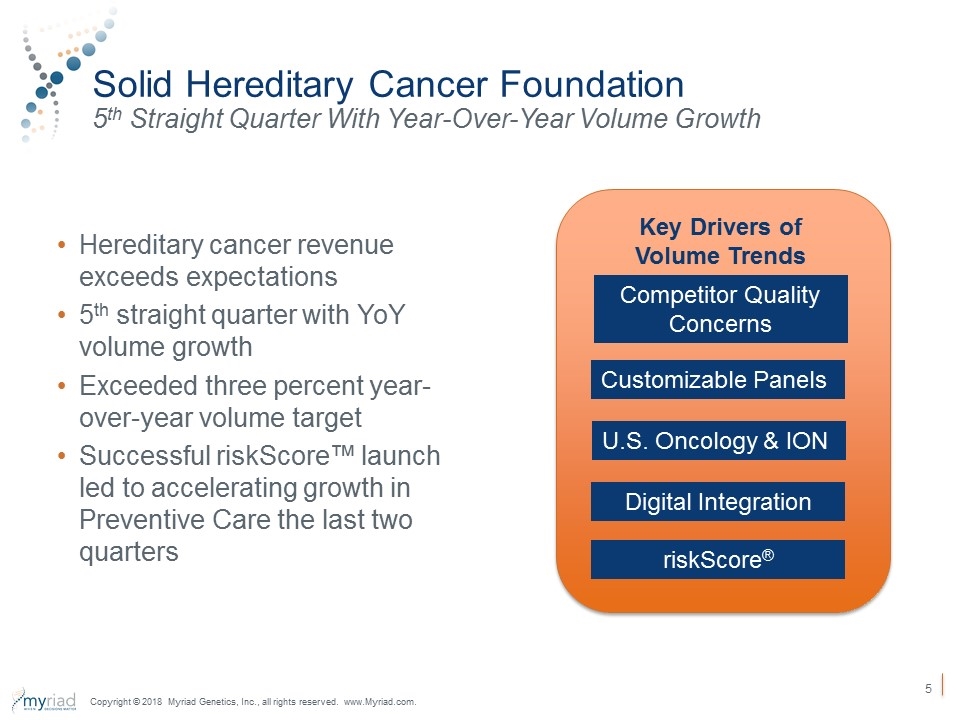
Solid Hereditary Cancer Foundation 5th Straight Quarter With Year-Over-Year Volume Growth Hereditary cancer revenue exceeds expectations 5th straight quarter with YoY volume growth Exceeded three percent year-over-year volume target Successful riskScore™ launch led to accelerating growth in Preventive Care the last two quarters Copyright © 2018 Myriad Genetics, Inc., all rights reserved. www.Myriad.com. U.S. Oncology & ION Customizable Panels Digital Integration riskScore® Competitor Quality Concerns Key Drivers of Volume Trends
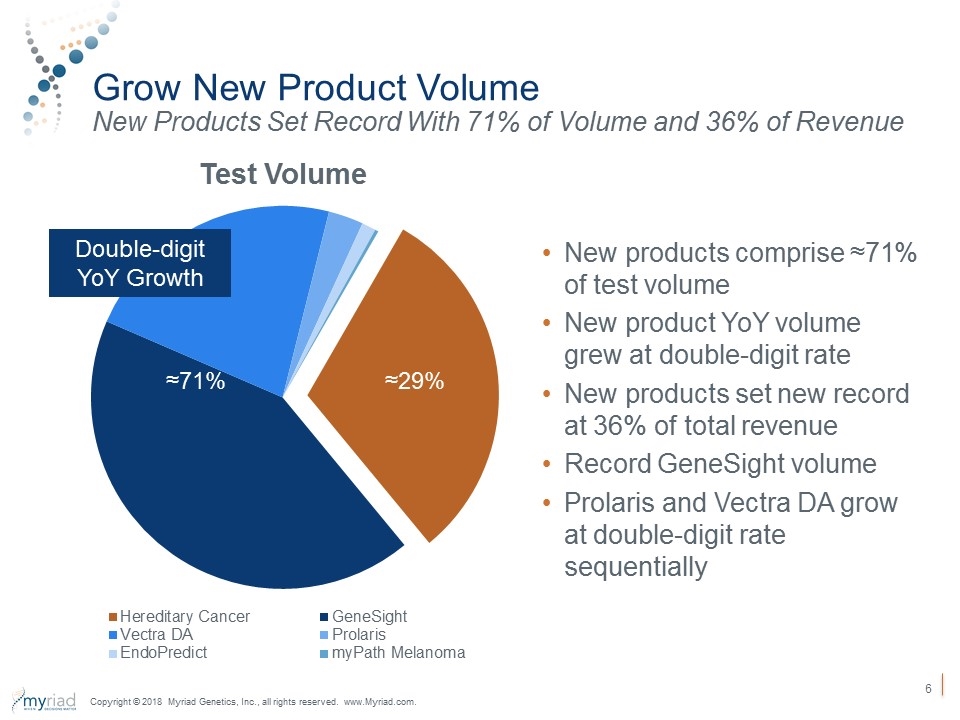
Grow New Product Volume New Products Set Record With 71% of Volume and 36% of Revenue Double-digit YoY Growth ≈29% ≈71% New products comprise ≈71% of test volume New product YoY volume grew at double-digit rate New products set new record at 36% of total revenue Record GeneSight volume Prolaris and Vectra DA grow at double-digit rate sequentially Copyright © 2018 Myriad Genetics, Inc., all rights reserved. www.Myriad.com.
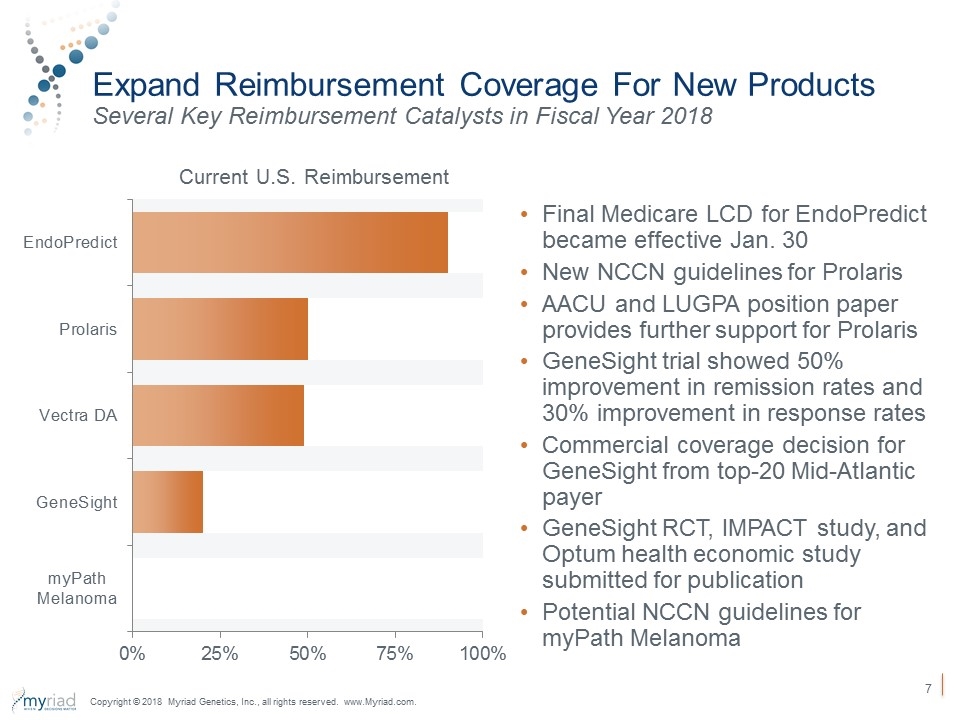
Expand Reimbursement Coverage For New Products Several Key Reimbursement Catalysts in Fiscal Year 2018 Current U.S. Reimbursement Final Medicare LCD for EndoPredict became effective Jan. 30 New NCCN guidelines for Prolaris AACU and LUGPA position paper provides further support for Prolaris GeneSight trial showed 50% improvement in remission rates and 30% improvement in response rates Commercial coverage decision for GeneSight from top-20 Mid-Atlantic payer GeneSight RCT, IMPACT study, and Optum health economic study submitted for publication Potential NCCN guidelines for myPath Melanoma Copyright © 2018 Myriad Genetics, Inc., all rights reserved. www.Myriad.com.
International Restructuring and Approvals Kit-Based Strategy With Global LDT Laboratory Shift LDT testing to single U.S. based laboratory Selling German clinic and closing Munich laboratory Continue with kit manufacturing and laboratory in Cologne Germany Received pre-market approval for BRACAnalysis CDx in Japan for HER2- metastatic breast cancer = 15,000 patients per year Revised NICE draft guidance document on breast cancer prognostics recommends EndoPredict as one of three approved diagnostic tests Copyright © 2018 Myriad Genetics, Inc., all rights reserved. www.Myriad.com.
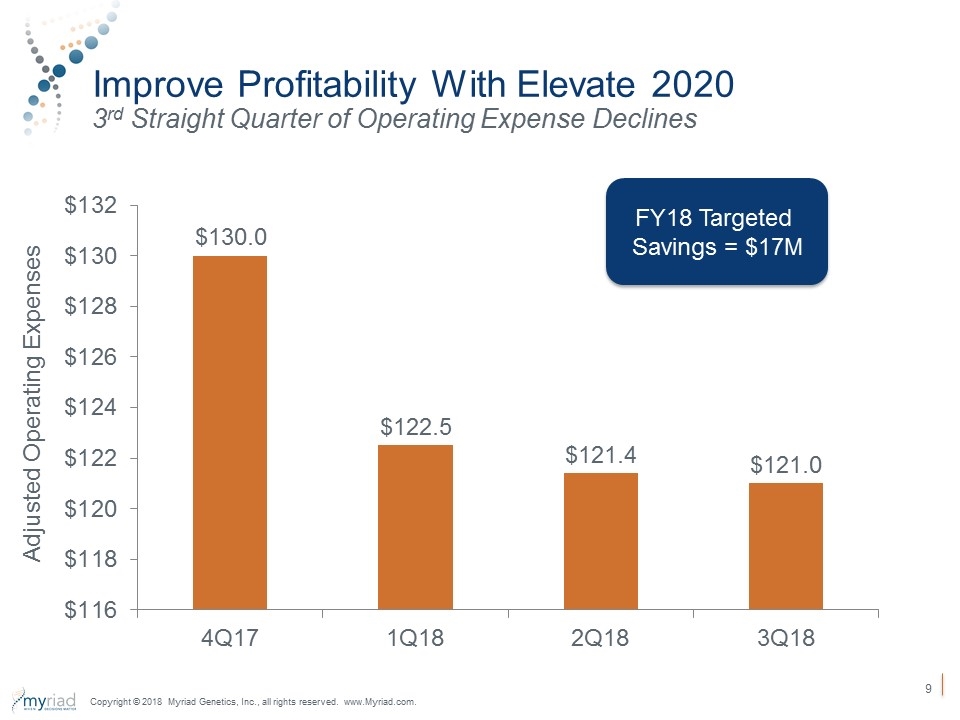
Improve Profitability With Elevate 2020 3rd Straight Quarter of Operating Expense Declines Adjusted Operating Expenses FY18 Targeted Savings = $17M Copyright © 2018 Myriad Genetics, Inc., all rights reserved. www.Myriad.com.
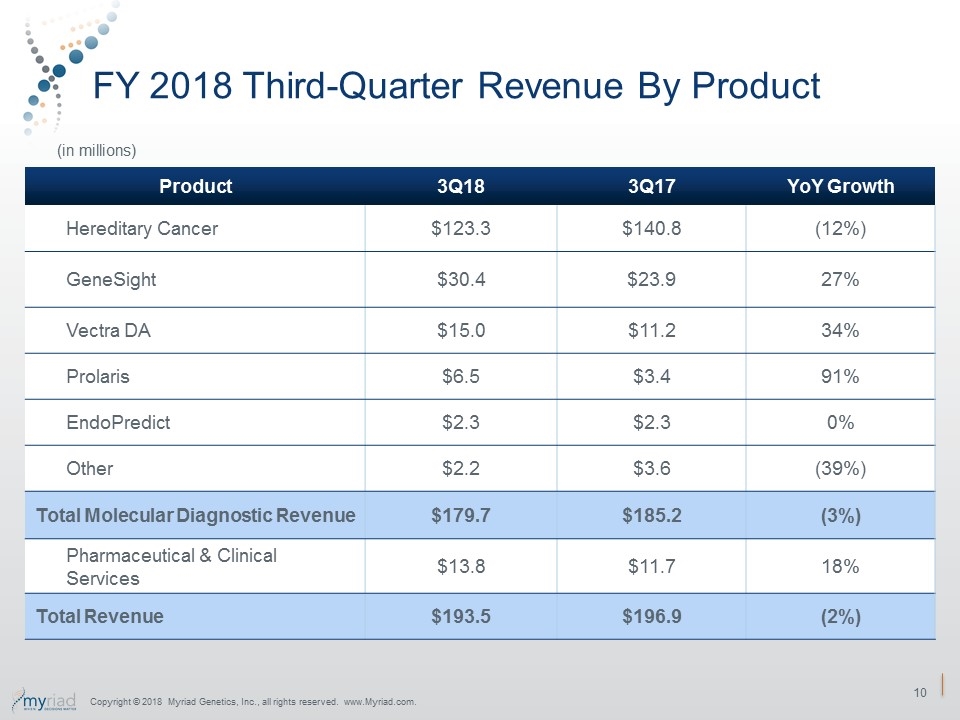
FY 2018 Third-Quarter Revenue By Product Product 3Q18 3Q17 YoY Growth Hereditary Cancer $123.3 $140.8 (12%) GeneSight $30.4 $23.9 27% Vectra DA $15.0 $11.2 34% Prolaris $6.5 $3.4 91% EndoPredict $2.3 $2.3 0% Other $2.2 $3.6 (39%) Total Molecular Diagnostic Revenue $179.7 $185.2 (3%) Pharmaceutical & Clinical Services $13.8 $11.7 18% Total Revenue $193.5 $196.9 (2%) (in millions) Copyright © 2018 Myriad Genetics, Inc., all rights reserved. www.Myriad.com.
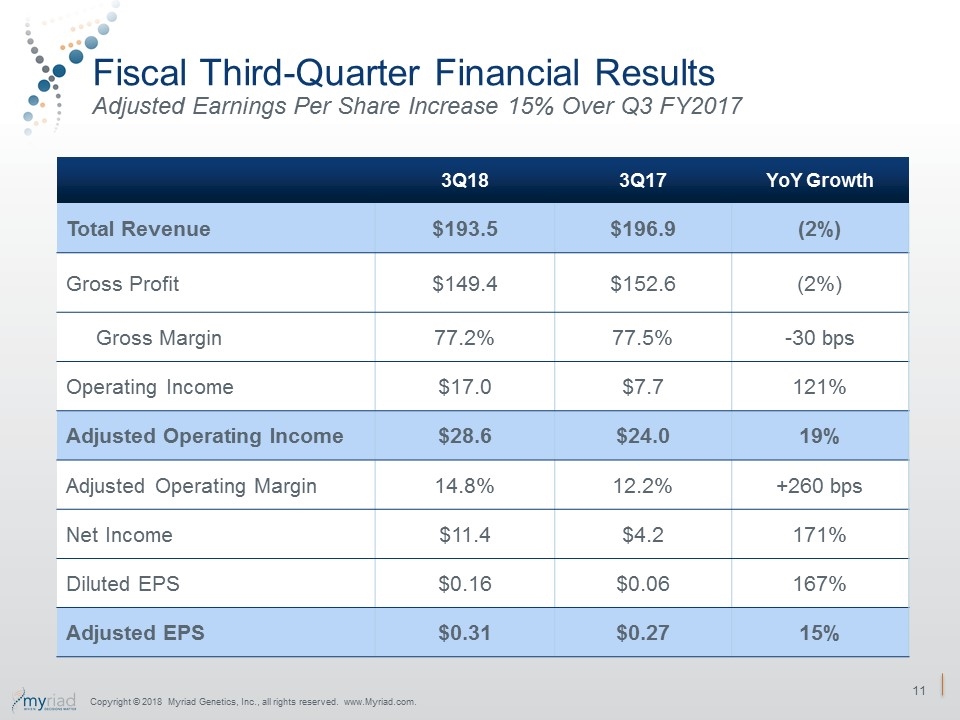
Fiscal Third-Quarter Financial Results Adjusted Earnings Per Share Increase 15% Over Q3 FY2017 3Q18 3Q17 YoY Growth Total Revenue $193.5 $196.9 (2%) Gross Profit $149.4 $152.6 (2%) Gross Margin 77.2% 77.5% -30 bps Operating Income $17.0 $7.7 121% Adjusted Operating Income $28.6 $24.0 19% Adjusted Operating Margin 14.8% 12.2% +260 bps Net Income $11.4 $4.2 171% Diluted EPS $0.16 $0.06 167% Adjusted EPS $0.31 $0.27 15% Copyright © 2018 Myriad Genetics, Inc., all rights reserved. www.Myriad.com.
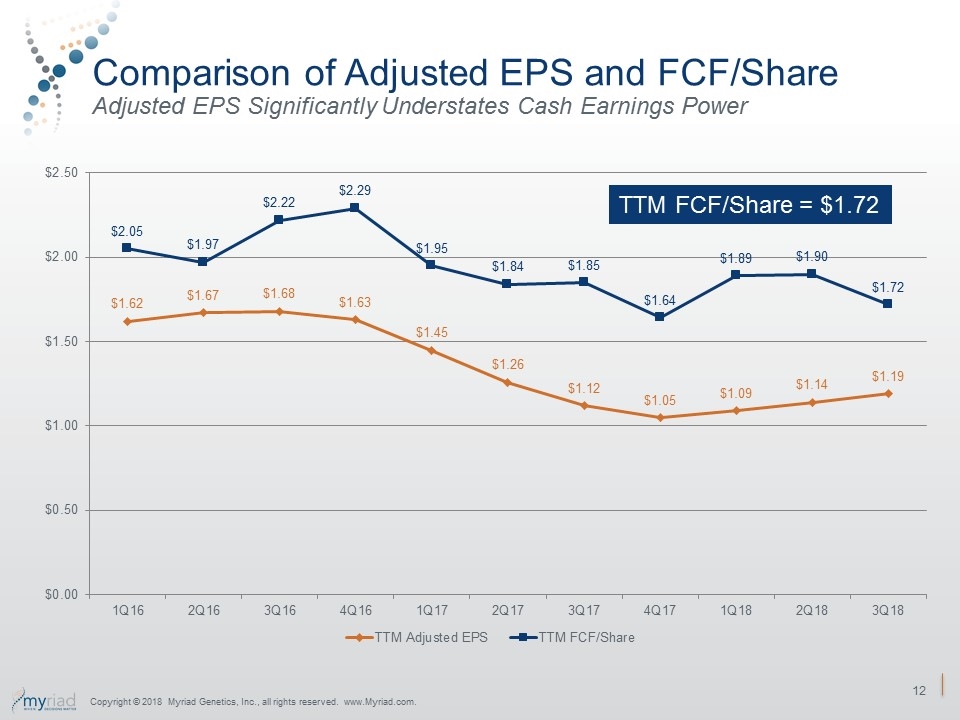
Comparison of Adjusted EPS and FCF/Share Adjusted EPS Significantly Understates Cash Earnings Power Copyright © 2018 Myriad Genetics, Inc., all rights reserved. www.Myriad.com. TTM FCF/Share = $1.72
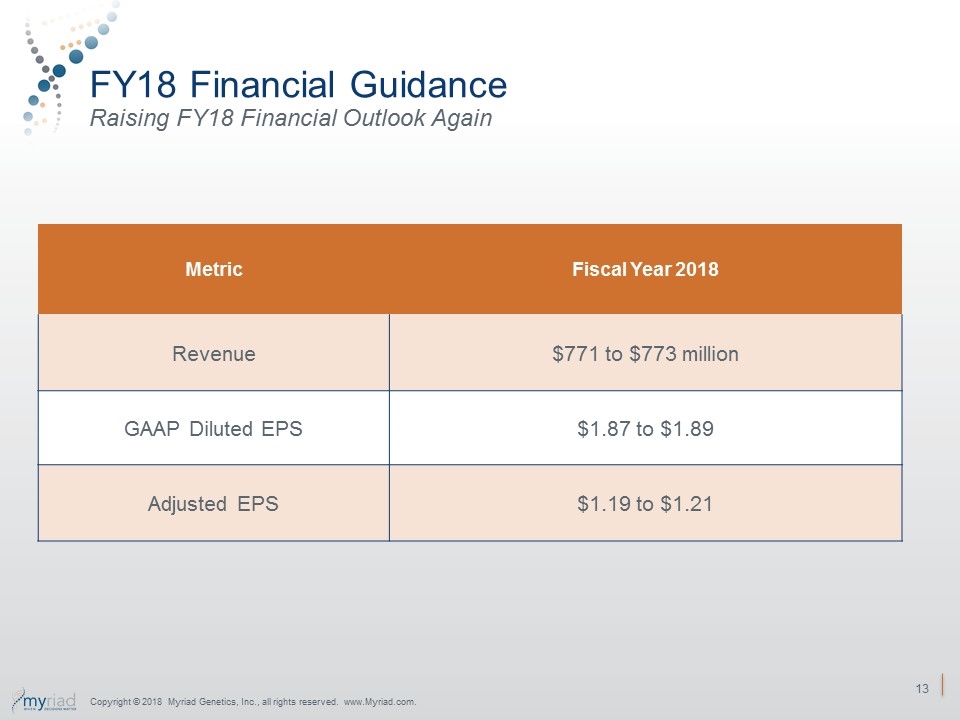
FY18 Financial Guidance Raising FY18 Financial Outlook Again Metric Fiscal Year 2018 Revenue $771 to $773 million GAAP Diluted EPS $1.87 to $1.89 Adjusted EPS $1.19 to $1.21 Copyright © 2018 Myriad Genetics, Inc., all rights reserved. www.Myriad.com.

GeneSight® Psychotropic for the management of major depressive disorder 14
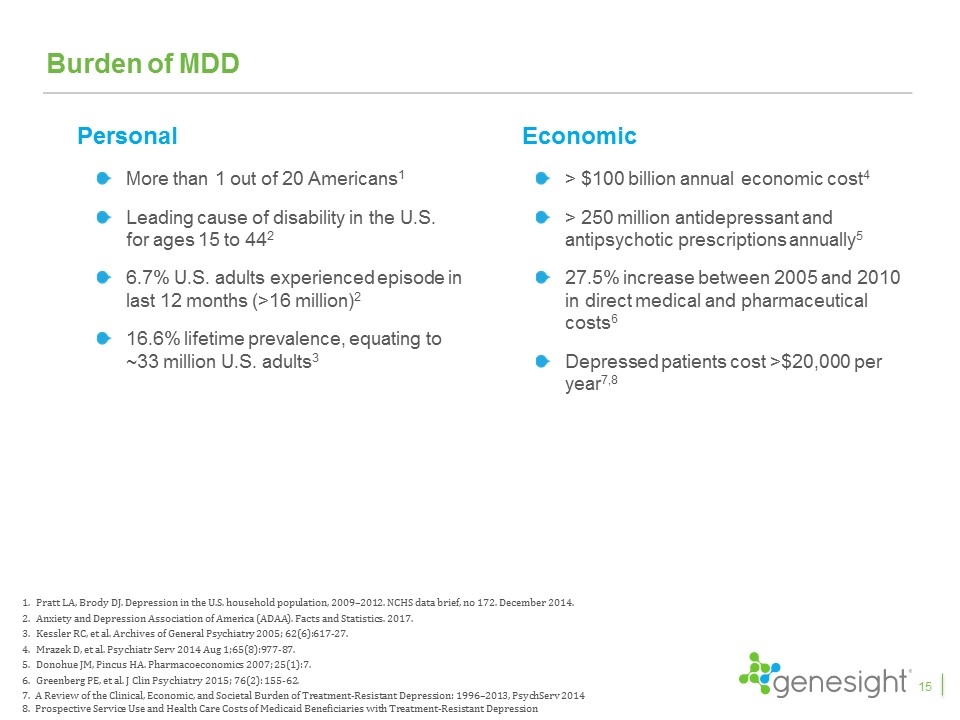
Burden of MDD More than 1 out of 20 Americans1 Leading cause of disability in the U.S. for ages 15 to 442 6.7% U.S. adults experienced episode in last 12 months (>16 million)2 16.6% lifetime prevalence, equating to ~33 million U.S. adults3 Pratt LA, Brody DJ. Depression in the U.S. household population, 2009–2012. NCHS data brief, no 172. December 2014. Anxiety and Depression Association of America (ADAA). Facts and Statistics. 2017. Kessler RC, et al. Archives of General Psychiatry 2005; 62(6):617-27. Mrazek D, et al. Psychiatr Serv 2014 Aug 1;65(8):977-87. Donohue JM, Pincus HA. Pharmacoeconomics 2007; 25(1):7. Greenberg PE, et al. J Clin Psychiatry 2015; 76(2): 155-62. 7. A Review of the Clinical, Economic, and Societal Burden of Treatment-Resistant Depression: 1996–2013, PsychServ 2014 8. Prospective Service Use and Health Care Costs of Medicaid Beneficiaries with Treatment-Resistant Depression Personal Economic > $100 billion annual economic cost4 > 250 million antidepressant and antipsychotic prescriptions annually5 27.5% increase between 2005 and 2010 in direct medical and pharmaceutical costs6 Depressed patients cost >$20,000 per year7,8 15
Remission is the Treatment Goal Treatment in the acute phase (6-12 weeks) should be aimed at inducing remission of the major depressive episode.” – American Psychiatric Association Depression Treatment Guidelines [T]he most robust body of evidence would support continuation or maintenance of pharmacotherapeutic regimens […] that resulted in remission during the acute phase.” – Florida Medication Guidelines for MDD 2017 The target goal for acute treatment should be remission: a resolution of depressive symptoms.” – Canadian Network for Mood and Anxiety Treatments (CANMAT) Guidelines for Depression 16 Remission and response included in HEDIS quality measures used by the National Committee for Quality Assurance to assess health plans
Historical Outcomes for Approved Antidepressant Studies 40 consecutive antidepressant studies submitted to FDA in past 20 years Statistically significant improvement was only observed over placebo Only 13% of trials showed statistically significant improvement in remission over placebo Only 30% of trials showed statistically significant improvement in response over placebo Only 70% of trials showed statistically significant improvement in symptoms over placebo No drug showed statistically significant results compared to the active drug arm 17
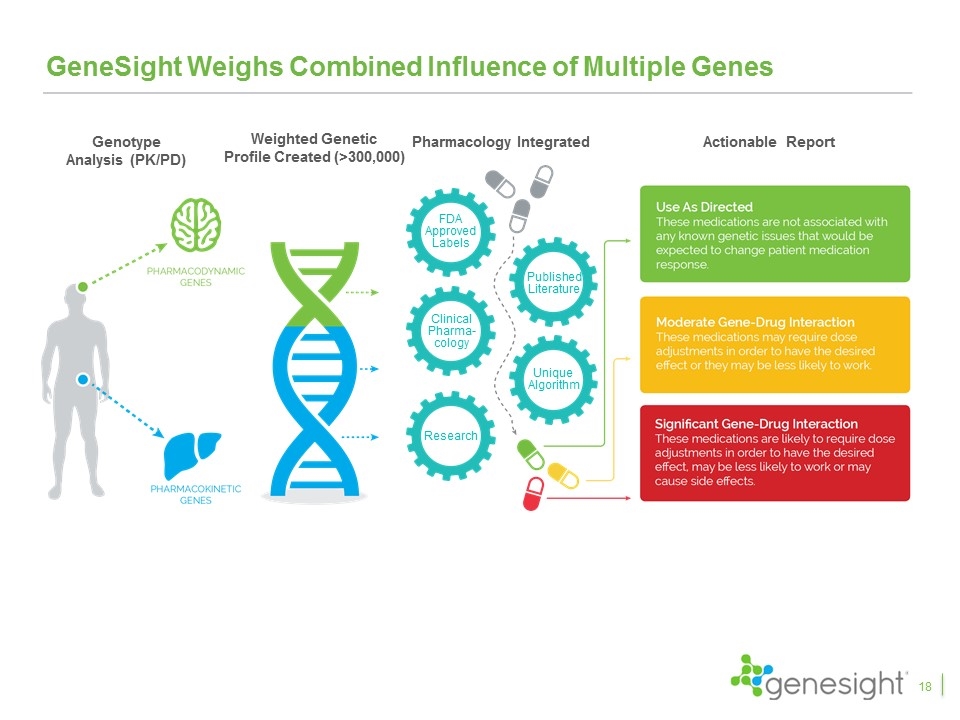
GeneSight Weighs Combined Influence of Multiple Genes Genotype Analysis (PK/PD) Weighted Genetic Profile Created (>300,000) Pharmacology Integrated Actionable Report FDA Approved Labels Published Literature Clinical Pharma-cology Unique Algorithm Research 18
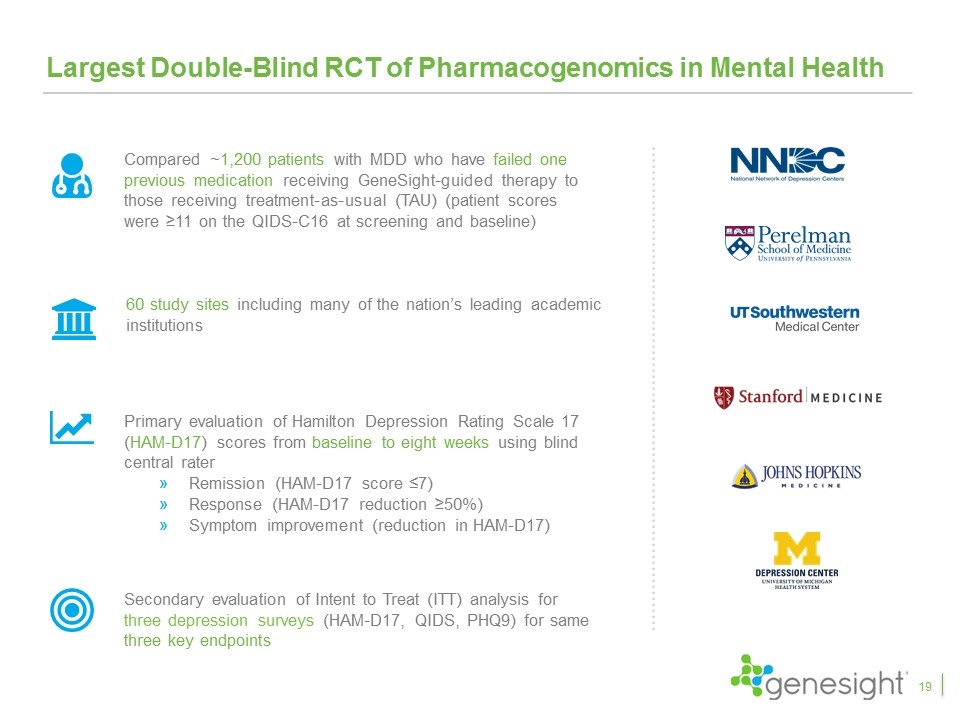
Largest Double-Blind RCT of Pharmacogenomics in Mental Health Compared ~1,200 patients with MDD who have failed one previous medication receiving GeneSight-guided therapy to those receiving treatment-as-usual (TAU) (patient scores were ≥11 on the QIDS-C16 at screening and baseline) Primary evaluation of Hamilton Depression Rating Scale 17 (HAM-D17) scores from baseline to eight weeks using blind central rater Remission (HAM-D17 score ≤7) Response (HAM-D17 reduction ≥50%) Symptom improvement (reduction in HAM-D17) Secondary evaluation of Intent to Treat (ITT) analysis for three depression surveys (HAM-D17, QIDS, PHQ9) for same three key endpoints 60 study sites including many of the nation’s leading academic institutions 19
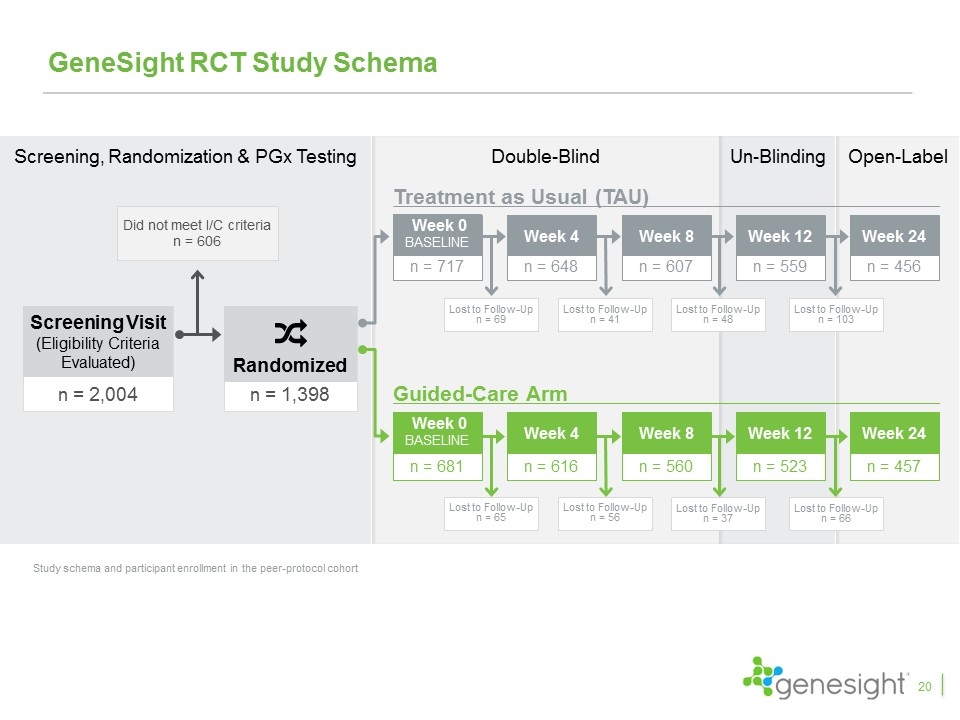
n = 2,004 Screening Visit (Eligibility Criteria Evaluated) Did not meet I/C criteria n = 606 n = 1,398 Randomized Screening, Randomization & PGx Testing GeneSight RCT Study Schema Study schema and participant enrollment in the peer-protocol cohort Treatment as Usual (TAU) Guided-Care Arm n = 456 Week 24 n = 457 Week 24 Double-Blind Un-Blinding Open-Label n = 607 Week 8 Lost to Follow-Up n = 48 n = 648 Week 4 Lost to Follow-Up n = 41 n = 717 Week 0 baseline Lost to Follow-Up n = 69 n = 559 Week 12 Lost to Follow-Up n = 103 Lost to Follow-Up n = 65 n = 681 Week 0 baseline n = 616 Week 4 Lost to Follow-Up n = 56 n = 560 Week 8 Lost to Follow-Up n = 37 n = 523 Week 12 Lost to Follow-Up n = 66 20
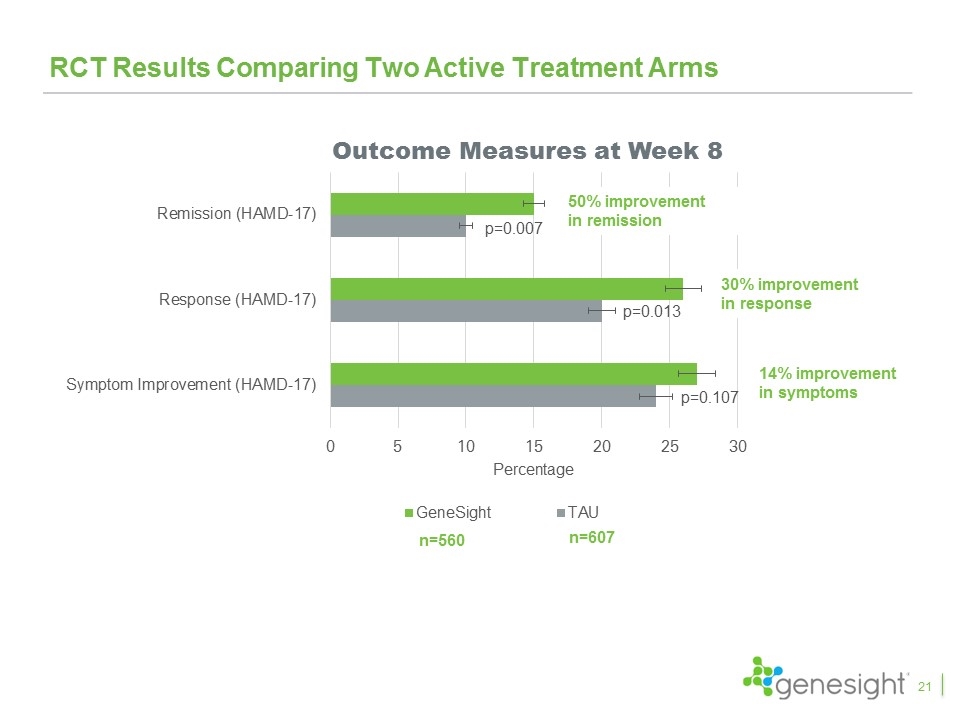
RCT Results Comparing Two Active Treatment Arms p=0.013 p=0.007 Outcome Measures at Week 8 50% improvement in remission n=560 n=607 p=0.107 30% improvement in response 21 14% improvement in symptoms
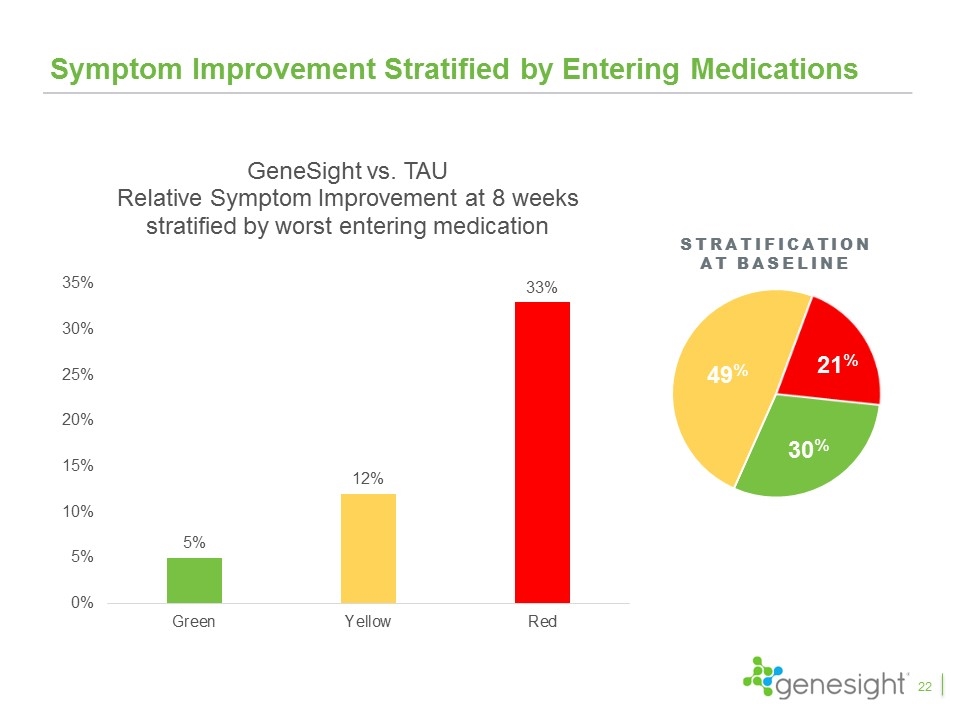
Stratification at baseline Symptom Improvement Stratified by Entering Medications 22
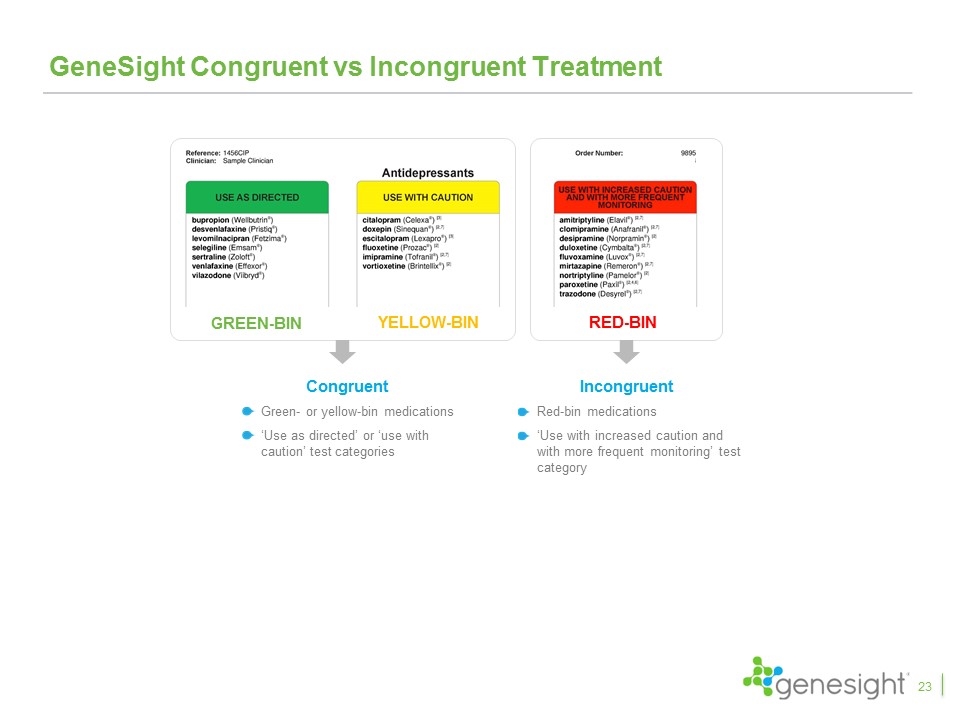
GeneSight Congruent vs Incongruent Treatment Congruent Green- or yellow-bin medications ‘Use as directed’ or ‘use with caution’ test categories YELLOW-BIN GREEN-BIN RED-BIN Incongruent Red-bin medications ‘Use with increased caution and with more frequent monitoring’ test category 23
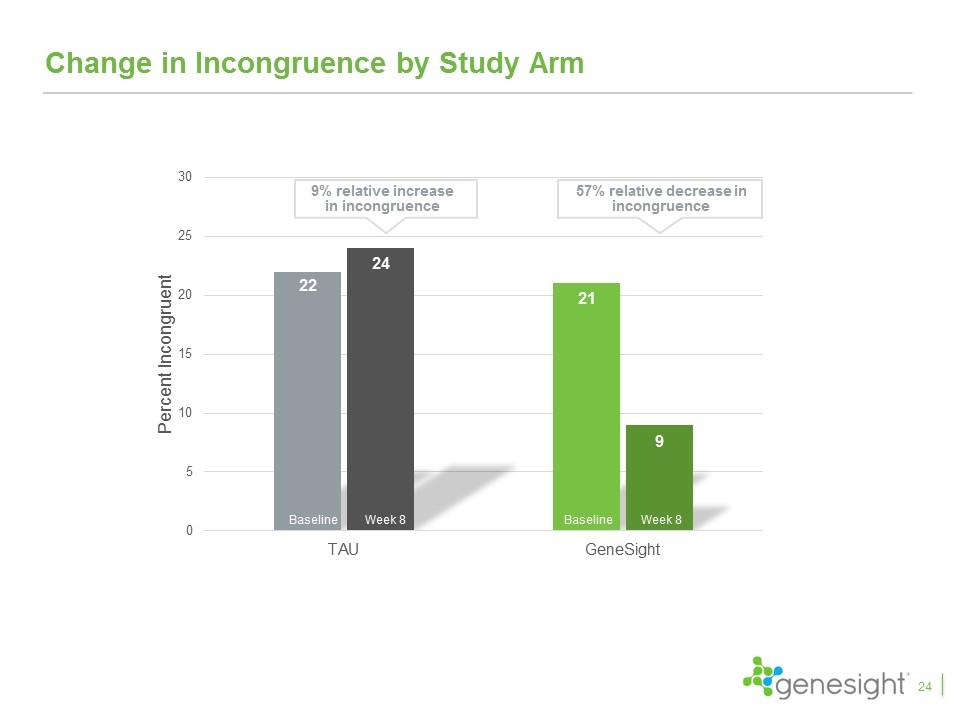
Change in Incongruence by Study Arm Baseline Week 8 Baseline Week 8 9% relative increase in incongruence 57% relative decrease in incongruence 24
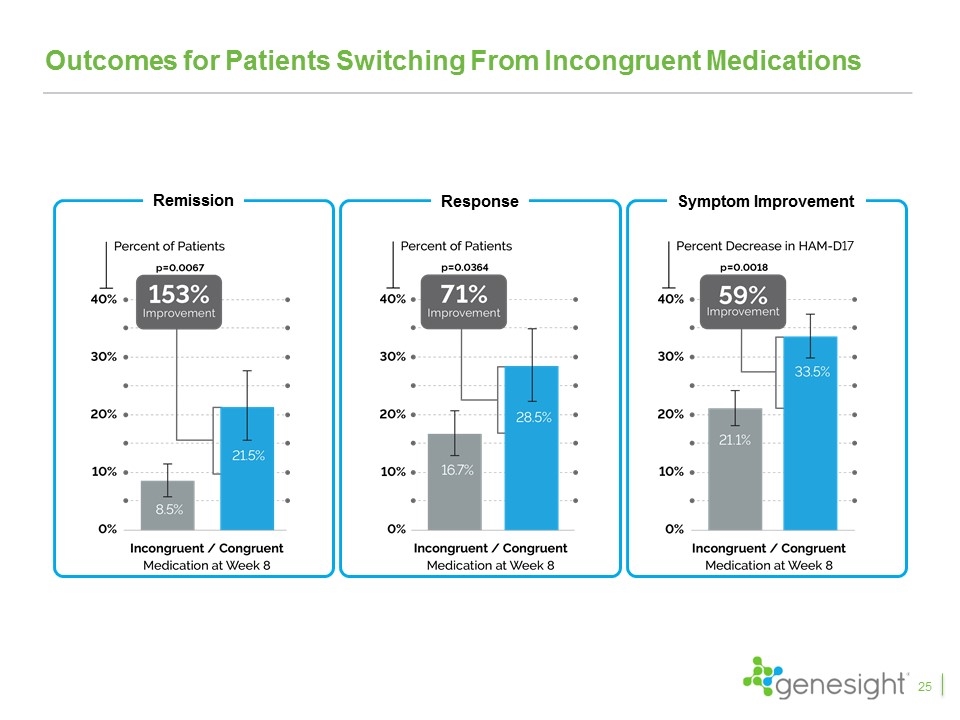
Outcomes for Patients Switching From Incongruent Medications Baseline Week 8 Baseline Week 8 25 Remission Symptom Improvement Response
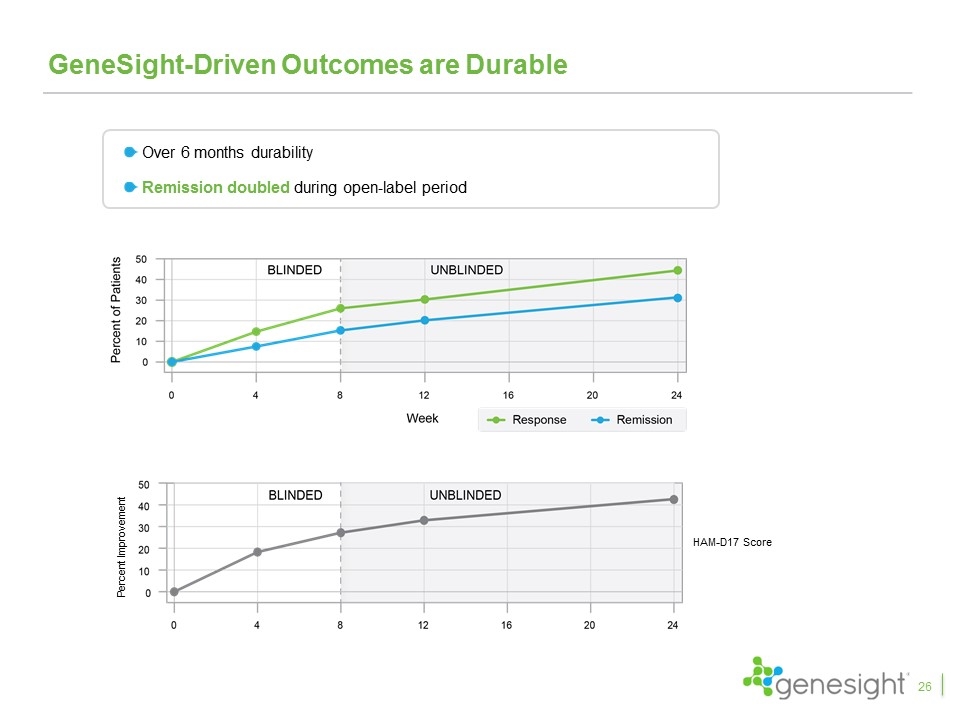
GeneSight-Driven Outcomes are Durable Over 6 months durability Remission doubled during open-label period HAM-D17 Score Percent Improvement 26
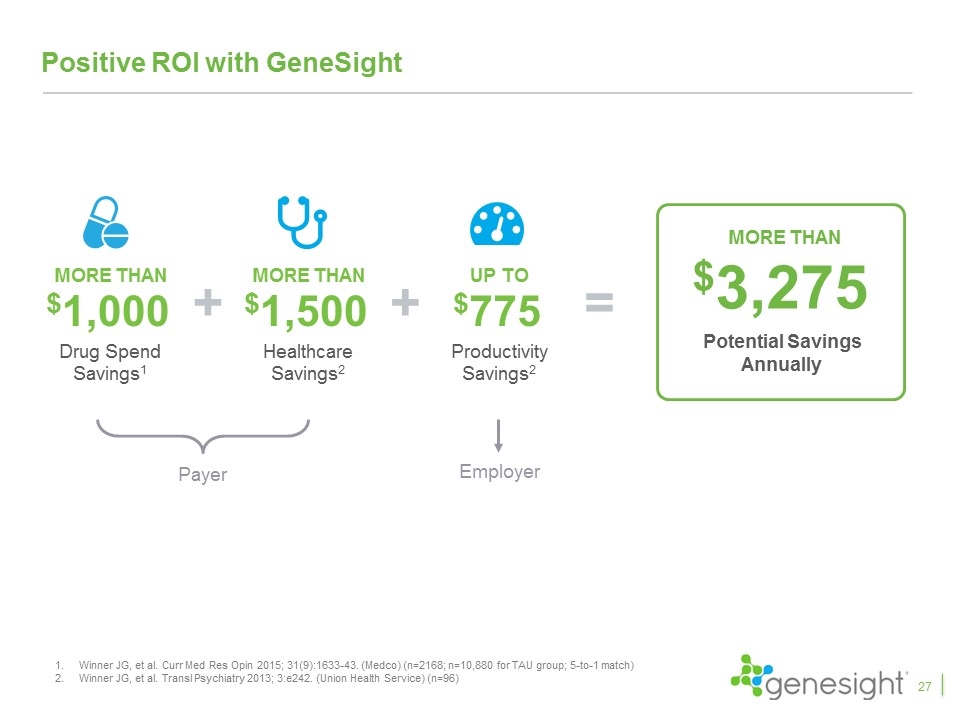
Positive ROI with GeneSight MORE THAN $1,000 Drug Spend Savings1 MORE THAN $1,500 Healthcare Savings2 MORE THAN $3,275 Potential Savings Annually + = + UP TO $775 Productivity Savings2 Payer Employer Winner JG, et al. Curr Med Res Opin 2015; 31(9):1633-43. (Medco) (n=2168; n=10,880 for TAU group; 5-to-1 match) Winner JG, et al. Transl Psychiatry 2013; 3:e242. (Union Health Service) (n=96) 27
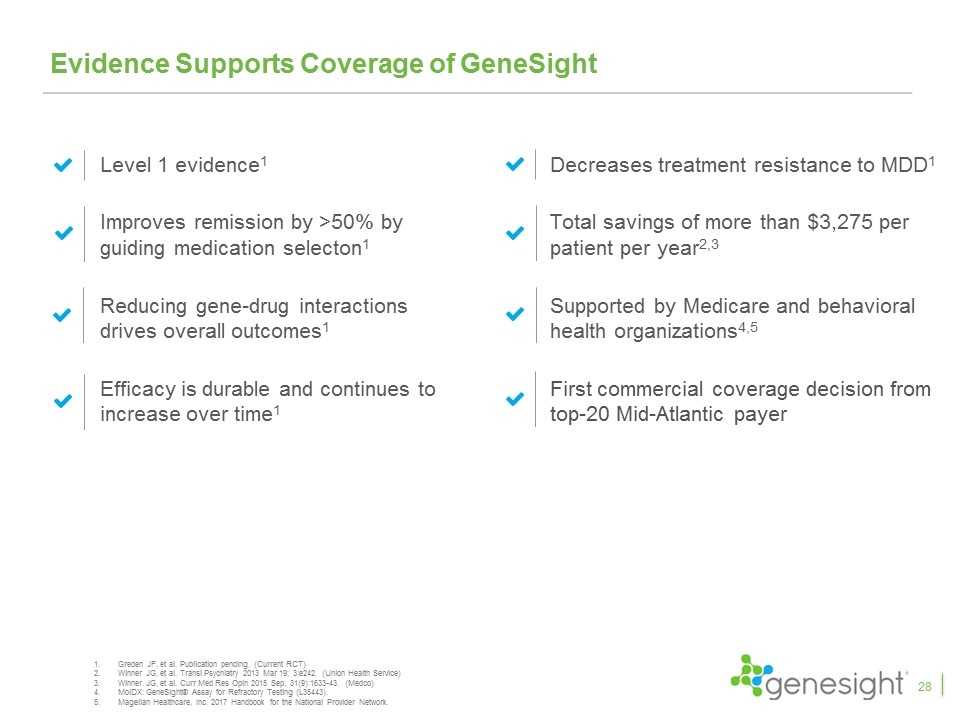
Evidence Supports Coverage of GeneSight Level 1 evidence1 Improves remission by >50% by guiding medication selecton1 Reducing gene-drug interactions drives overall outcomes1 Efficacy is durable and continues to increase over time1 Greden JF, et al. Publication pending. (Current RCT) Winner JG, et al. Transl Psychiatry 2013 Mar 19; 3:e242. (Union Health Service) Winner JG, et al. Curr Med Res Opin 2015 Sep; 31(9):1633-43. (Medco) MolDX: GeneSight® Assay for Refractory Testing (L35443). Magellan Healthcare, Inc. 2017 Handbook for the National Provider Network. Decreases treatment resistance to MDD1 Total savings of more than $3,275 per patient per year2,3 Supported by Medicare and behavioral health organizations4,5 First commercial coverage decision from top-20 Mid-Atlantic payer 28
