Attached files
| file | filename |
|---|---|
| 8-K - 8-K - Garrison Capital Inc. | gars-8k_20180508.htm |
Earnings Presentation First Quarter ended March 31, 2018 EXHIBIT 99.1
DISCLAIMER Some of the statements in this presentation constitute forward-looking statements, which relate to future events or our future performance or financial condition. The forward-looking statements contained in this presentation involve risks and uncertainties, including statements as to: our future operating results; changes in political, economic or industry conditions, the interest rate environment or conditions affecting the financial and capital markets, which could result in changes to the value of our assets; our business prospects and the prospects of our current and prospective portfolio companies; the impact of investments that we expect to make; the impact of increased competition; our contractual arrangements and relationships with third parties; the dependence of our future success on the general economy, including general economic trends, and its impact on the industries in which we invest; the ability of our prospective portfolio companies to achieve their objectives; the relative and absolute performance of our investment adviser, including in identifying suitable investments for us; our expected financings and investments; the adequacy of our cash resources and working capital; our ability to make distributions to our stockholders; the effects of legislation and regulations and changes thereto; the timing of cash flows, if any, from the operations of our prospective portfolio companies; and the impact of future acquisitions and divestitures. We use words such as “anticipates,” “believes,” “expects,” “intends” and similar expressions to identify forward-looking statements. Actual results could differ materially from those implied or expressed in our forward-looking statements for any reason, and future results could differ materially from historical performance. We have based the forward-looking statements included in this presentation on information available to us on the date of this presentation, and we assume no obligation to update any such forward-looking statements. Although we undertake no obligation to revise or update any forward-looking statements, whether as a result of new information, future events or otherwise, you are advised to consult any additional disclosures that we may make directly to you or through reports that we have filed or in the future may file with the U.S. Securities and Exchange Commission, including annual reports on Form 10-K, quarterly reports on Form 10-Q and current reports on Form 8-K.
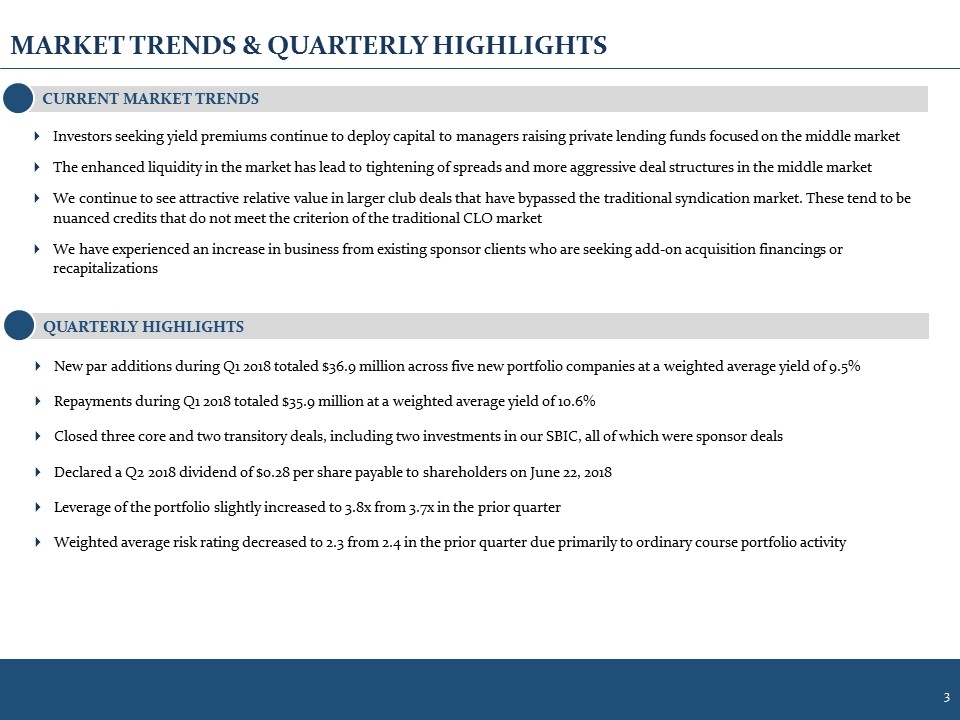
MARKET TRENDS & QUARTERLY HIGHLIGHTS Investors seeking yield premiums continue to deploy capital to managers raising private lending funds focused on the middle market The enhanced liquidity in the market has lead to tightening of spreads and more aggressive deal structures in the middle market We continue to see attractive relative value in larger club deals that have bypassed the traditional syndication market. These tend to be nuanced credits that do not meet the criterion of the traditional CLO market We have experienced an increase in business from existing sponsor clients who are seeking add-on acquisition financings or recapitalizations CURRENT MARKET TRENDS QUARTERLY HIGHLIGHTS New par additions during Q1 2018 totaled $36.9 million across five new portfolio companies at a weighted average yield of 9.5% Repayments during Q1 2018 totaled $35.9 million at a weighted average yield of 10.6% Closed three core and two transitory deals, including two investments in our SBIC, all of which were sponsor deals Declared a Q2 2018 dividend of $0.28 per share payable to shareholders on June 22, 2018 Leverage of the portfolio slightly increased to 3.8x from 3.7x in the prior quarter Weighted average risk rating decreased to 2.3 from 2.4 in the prior quarter due primarily to ordinary course portfolio activity
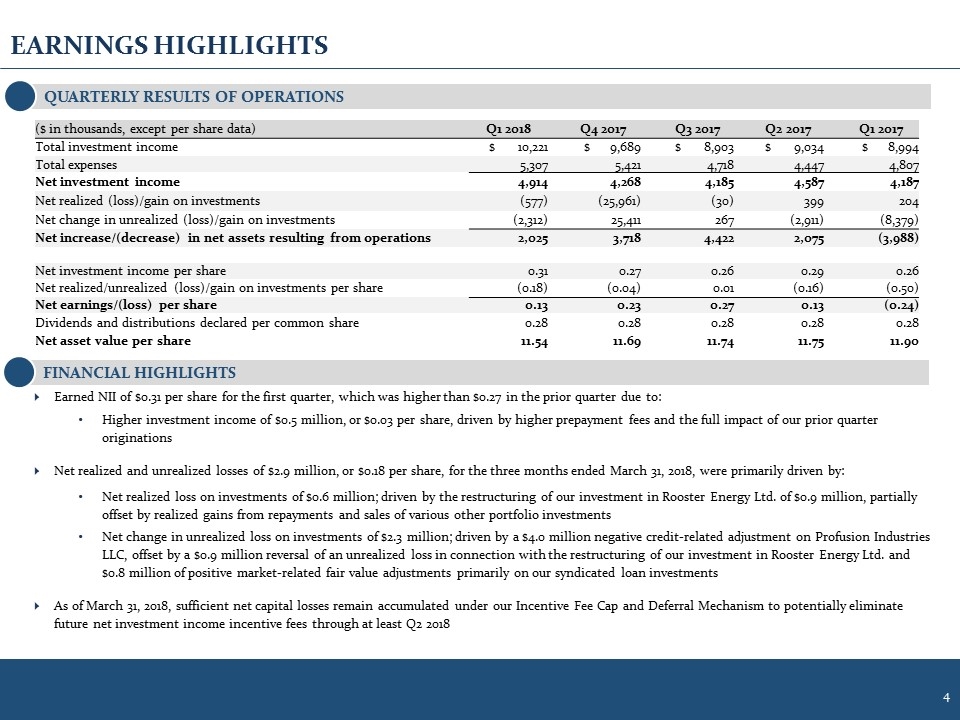
EARNINGS HIGHLIGHTS FINANCIAL HIGHLIGHTS Earned NII of $0.31 per share for the first quarter, which was higher than $0.27 in the prior quarter due to: Higher investment income of $0.5 million, or $0.03 per share, driven by higher prepayment fees and the full impact of our prior quarter originations Net realized and unrealized losses of $2.9 million, or $0.18 per share, for the three months ended March 31, 2018, were primarily driven by: Net realized loss on investments of $0.6 million; driven by the restructuring of our investment in Rooster Energy Ltd. of $0.9 million, partially offset by realized gains from repayments and sales of various other portfolio investments Net change in unrealized loss on investments of $2.3 million; driven by a $4.0 million negative credit-related adjustment on Profusion Industries LLC, offset by a $0.9 million reversal of an unrealized loss in connection with the restructuring of our investment in Rooster Energy Ltd. and $0.8 million of positive market-related fair value adjustments primarily on our syndicated loan investments As of March 31, 2018, sufficient net capital losses remain accumulated under our Incentive Fee Cap and Deferral Mechanism to potentially eliminate future net investment income incentive fees through at least Q2 2018 ($ in thousands, except per share data) Q1 2018 Q4 2017 Q3 2017 Q2 2017 Q1 2017 Total investment income $ 10,221 $ 9,689 $ 8,903 $ 9,034 $ 8,994 Total expenses 5,307 5,421 4,718 4,447 4,807 Net investment income 4,914 4,268 4,185 4,587 4,187 Net realized (loss)/gain on investments (577) (25,961) (30) 399 204 Net change in unrealized (loss)/gain on investments (2,312) 25,411 267 (2,911) (8,379) Net increase/(decrease) in net assets resulting from operations 2,025 3,718 4,422 2,075 (3,988) Net investment income per share 0.31 0.27 0.26 0.29 0.26 Net realized/unrealized (loss)/gain on investments per share (0.18) (0.04) 0.01 (0.16) (0.50) Net earnings/(loss) per share 0.13 0.23 0.27 0.13 (0.24) Dividends and distributions declared per common share 0.28 0.28 0.28 0.28 0.28 Net asset value per share 11.54 11.69 11.74 11.75 11.90 QUARTERLY RESULTS OF OPERATIONS
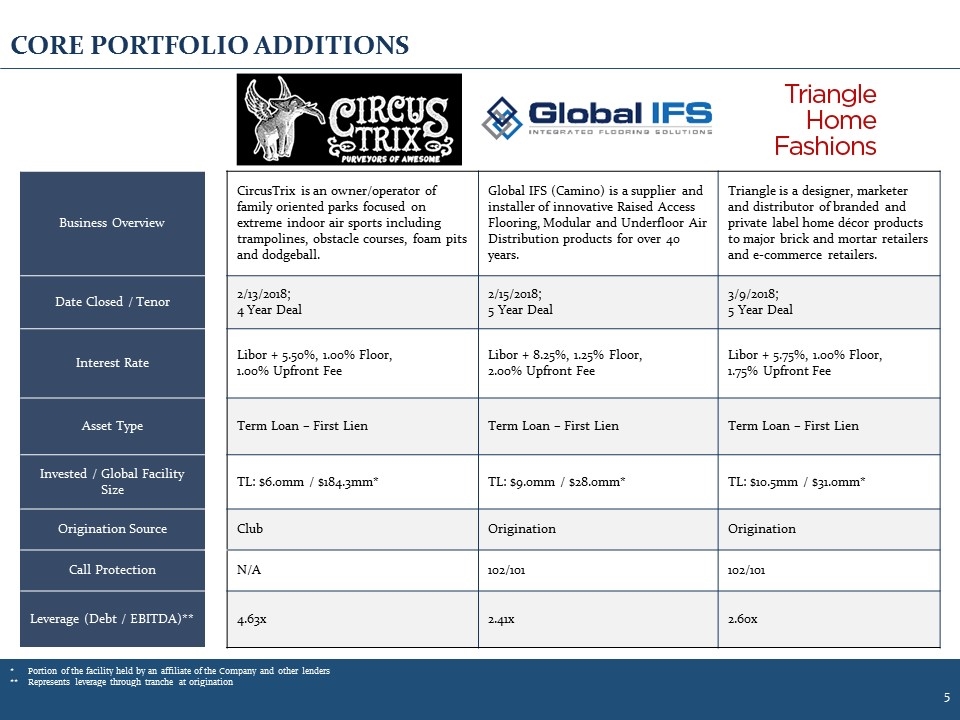
CORE PORTFOLIO ADDITIONS Business Overview CircusTrix is an owner/operator of family oriented parks focused on extreme indoor air sports including trampolines, obstacle courses, foam pits and dodgeball. Global IFS (Camino) is a supplier and installer of innovative Raised Access Flooring, Modular and Underfloor Air Distribution products for over 40 years. Triangle is a designer, marketer and distributor of branded and private label home décor products to major brick and mortar retailers and e-commerce retailers. Date Closed / Tenor 2/13/2018; 4 Year Deal 2/15/2018; 5 Year Deal 3/9/2018; 5 Year Deal Interest Rate Libor + 5.50%, 1.00% Floor, 1.00% Upfront Fee Libor + 8.25%, 1.25% Floor, 2.00% Upfront Fee Libor + 5.75%, 1.00% Floor, 1.75% Upfront Fee Asset Type Term Loan – First Lien Term Loan – First Lien Term Loan – First Lien Invested / Global Facility Size TL: $6.0mm / $184.3mm* TL: $9.0mm / $28.0mm* TL: $10.5mm / $31.0mm* Origination Source Club Origination Origination Call Protection N/A 102/101 102/101 Leverage (Debt / EBITDA)** 4.63x 2.41x 2.60x *Portion of the facility held by an affiliate of the Company and other lenders ** Represents leverage through tranche at origination
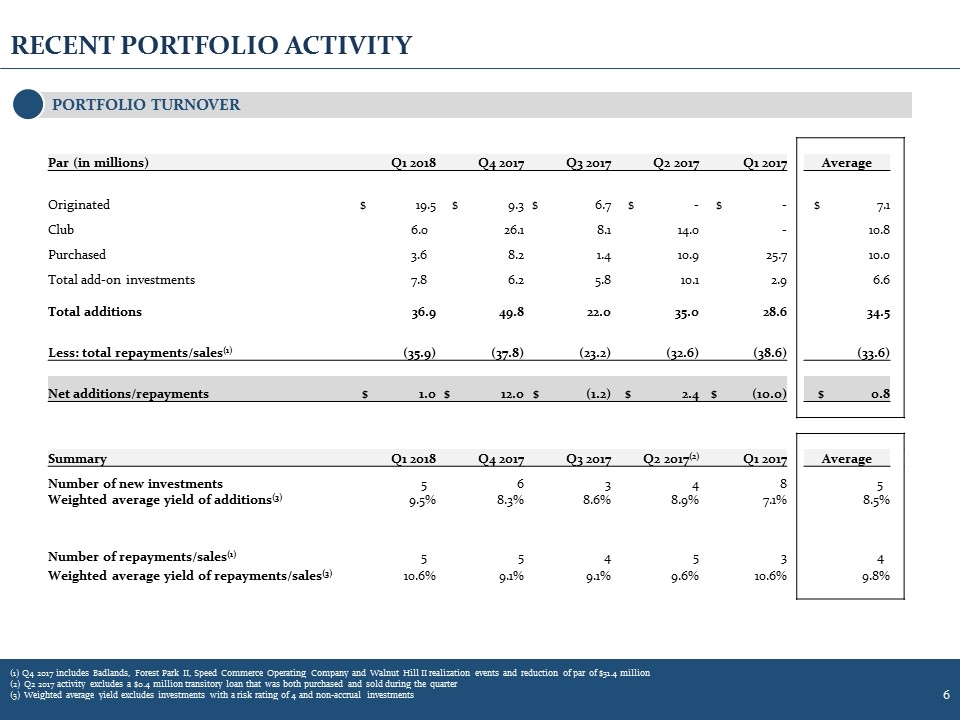
RECENT PORTFOLIO ACTIVITY (1) Q4 2017 includes Badlands, Forest Park II, Speed Commerce Operating Company and Walnut Hill II realization events and reduction of par of $31.4 million (2) Q2 2017 activity excludes a $0.4 million transitory loan that was both purchased and sold during the quarter (3) Weighted average yield excludes investments with a risk rating of 4 and non-accrual investments PORTFOLIO TURNOVER Par (in millions) Q1 2018 Q4 2017 Q3 2017 Q2 2017 Q1 2017 Average Originated $ 19.5 $ 9.3 $ 6.7 $ - $ - $ 7.1 Club 6.0 26.1 8.1 14.0 - 10.8 Purchased 3.6 8.2 1.4 10.9 25.7 10.0 Total add-on investments 7.8 6.2 5.8 10.1 2.9 6.6 Total additions 36.9 49.8 22.0 35.0 28.6 34.5 Less: total repayments/sales(1) (35.9) (37.8) (23.2) (32.6) (38.6) (33.6) Net additions/repayments $ 1.0 $ 12.0 $ (1.2) $ 2.4 $ (10.0) $ 0.8 Summary Q1 2018 Q4 2017 Q3 2017 Q2 2017(2) Q1 2017 Average Number of new investments 5 6 3 4 8 5 Weighted average yield of additions(3) 9.5% 8.3% 8.6% 8.9% 7.1% 8.5% Number of repayments/sales(1) 5 5 4 5 3 4 Weighted average yield of repayments/sales(3) 10.6% 9.1% 9.1% 9.6% 10.6% 9.8%
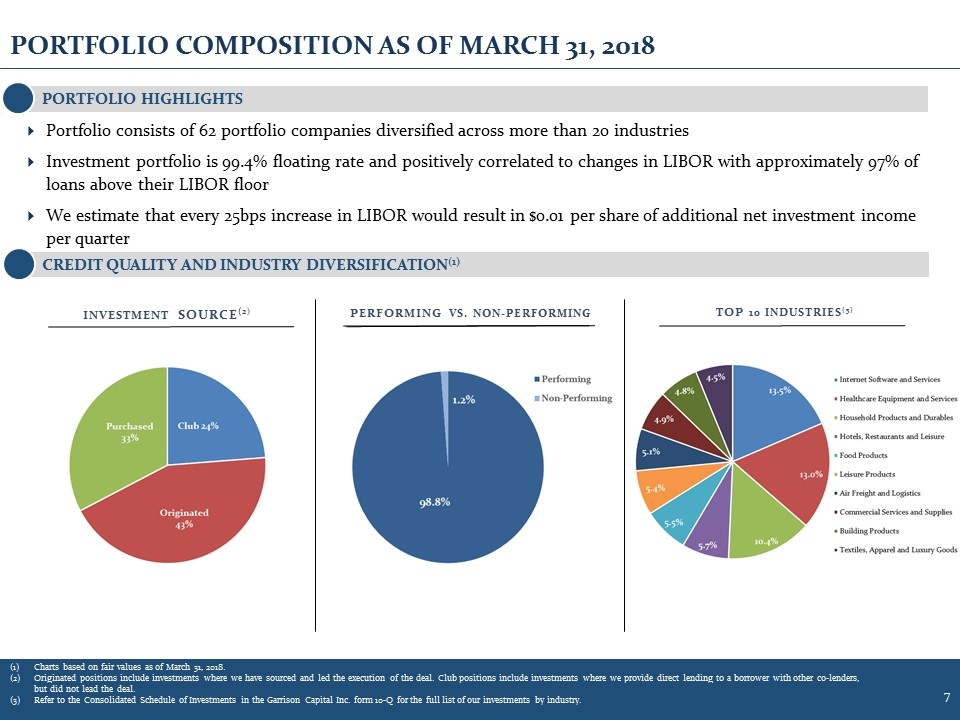
PORTFOLIO COMPOSITION AS OF MARCH 31, 2018 Portfolio consists of 62 portfolio companies diversified across more than 20 industries Investment portfolio is 99.4% floating rate and positively correlated to changes in LIBOR with approximately 97% of loans above their LIBOR floor We estimate that every 25bps increase in LIBOR would result in $0.01 per share of additional net investment income per quarter PERFORMING VS. NON-PERFORMING PORTFOLIO HIGHLIGHTS CREDIT QUALITY AND INDUSTRY DIVERSIFICATION(1) TOP 10 INDUSTRIES(3) Charts based on fair values as of March 31, 2018. Originated positions include investments where we have sourced and led the execution of the deal. Club positions include investments where we provide direct lending to a borrower with other co-lenders, but did not lead the deal. Refer to the Consolidated Schedule of Investments in the Garrison Capital Inc. form 10-Q for the full list of our investments by industry. INVESTMENT SOURCE(2)
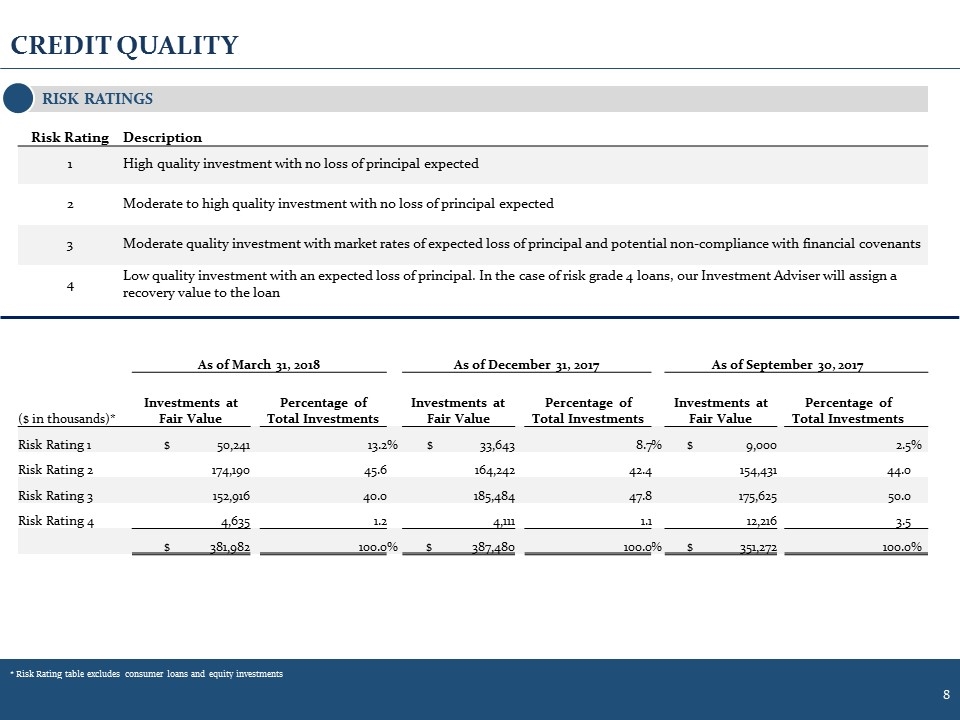
CREDIT QUALITY RISK RATINGS * Risk Rating table excludes consumer loans and equity investments As of March 31, 2018 As of December 31, 2017 As of September 30, 2017 ($ in thousands)* Investments at Fair Value Percentage of Total Investments Investments at Fair Value Percentage of Total Investments Investments at Fair Value Percentage of Total Investments Risk Rating 1 $ 50,241 13.2 % $ 33,643 8.7 % $ 9,000 2.5 % Risk Rating 2 174,190 45.6 164,242 42.4 154,431 44.0 Risk Rating 3 152,916 40.0 185,484 47.8 175,625 50.0 Risk Rating 4 4,635 1.2 4,111 1.1 12,216 3.5 $ 381,982 100.0 % $ 387,480 100.0 % $ 351,272 100.0 % Risk Rating Description 1 High quality investment with no loss of principal expected 2 Moderate to high quality investment with no loss of principal expected 3 Moderate quality investment with market rates of expected loss of principal and potential non-compliance with financial covenants 4 Low quality investment with an expected loss of principal. In the case of risk grade 4 loans, our Investment Adviser will assign a recovery value to the loan
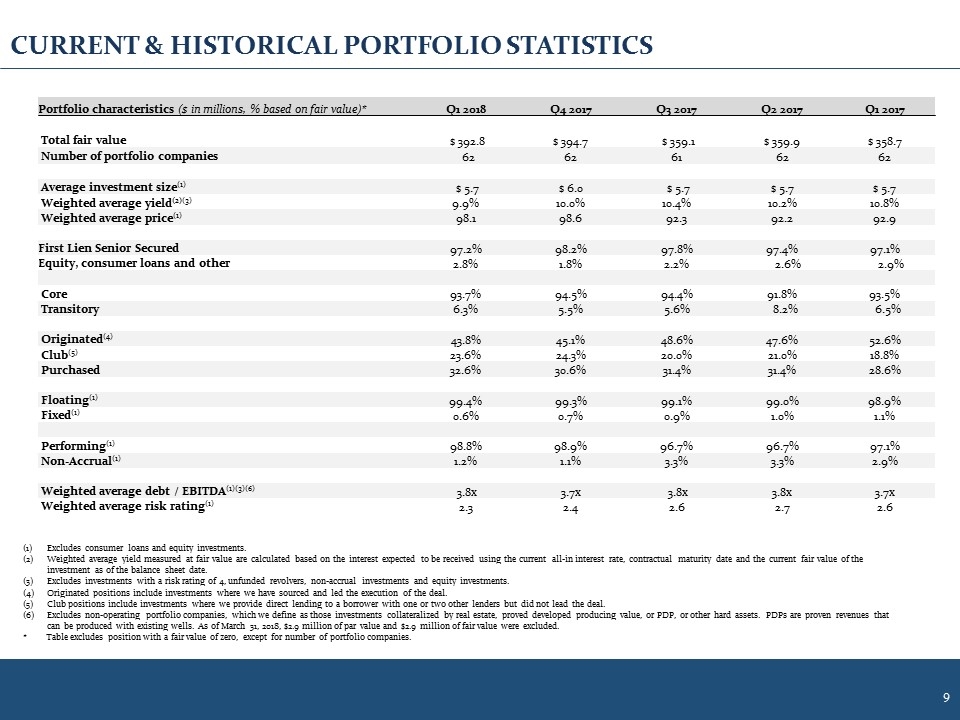
CURRENT & HISTORICAL PORTFOLIO STATISTICS Portfolio characteristics ($ in millions, % based on fair value)* Q1 2018 Q4 2017 Q3 2017 Q2 2017 Q1 2017 Total fair value $ 392.8 $ 394.7 $ 359.1 $ 359.9 $ 358.7 Number of portfolio companies 62 62 61 62 62 Average investment size(1) $ 5.7 $ 6.0 $ 5.7 $ 5.7 $ 5.7 Weighted average yield(2)(3) 9.9% 10.0% 10.4% 10.2% 10.8% Weighted average price(1) 98.1 98.6 92.3 92.2 92.9 First Lien Senior Secured 97.2% 98.2% 97.8% 97.4% 97.1% Equity, consumer loans and other 2.8% 1.8% 2.2% 2.6% 2.9% Core 93.7% 94.5% 94.4% 91.8% 93.5% Transitory 6.3% 5.5% 5.6% 8.2% 6.5% Originated(4) 43.8% 45.1% 48.6% 47.6% 52.6% Club(5) 23.6% 24.3% 20.0% 21.0% 18.8% Purchased 32.6% 30.6% 31.4% 31.4% 28.6% Floating(1) 99.4% 99.3% 99.1% 99.0% 98.9% Fixed(1) 0.6% 0.7% 0.9% 1.0% 1.1% Performing(1) 98.8% 98.9% 96.7% 96.7% 97.1% Non-Accrual(1) 1.2% 1.1% 3.3% 3.3% 2.9% Weighted average debt / EBITDA(1)(3)(6) 3.8x 3.7x 3.8x 3.8x 3.7x Weighted average risk rating(1) 2.3 2.4 2.6 2.7 2.6 Excludes consumer loans and equity investments. Weighted average yield measured at fair value are calculated based on the interest expected to be received using the current all-in interest rate, contractual maturity date and the current fair value of the investment as of the balance sheet date. Excludes investments with a risk rating of 4, unfunded revolvers, non-accrual investments and equity investments. Originated positions include investments where we have sourced and led the execution of the deal. Club positions include investments where we provide direct lending to a borrower with one or two other lenders but did not lead the deal. Excludes non-operating portfolio companies, which we define as those investments collateralized by real estate, proved developed producing value, or PDP, or other hard assets. PDPs are proven revenues that can be produced with existing wells. As of March 31, 2018, $2.9 million of par value and $2.9 million of fair value were excluded. * Table excludes position with a fair value of zero, except for number of portfolio companies.
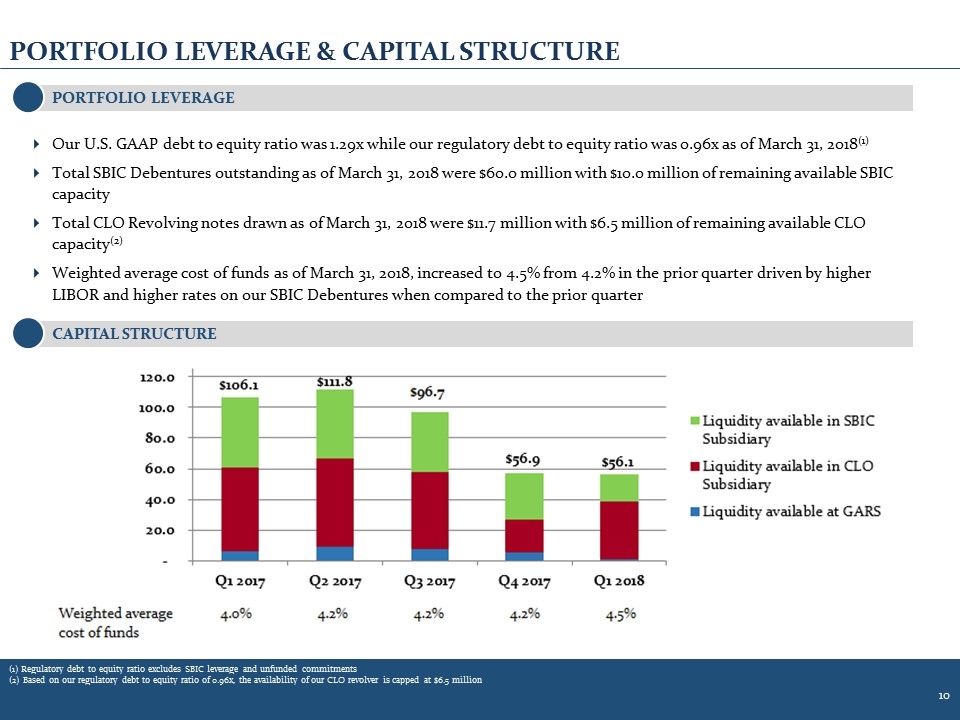
Our U.S. GAAP debt to equity ratio was 1.29x while our regulatory debt to equity ratio was 0.96x as of March 31, 2018(1) Total SBIC Debentures outstanding as of March 31, 2018 were $60.0 million with $10.0 million of remaining available SBIC capacity Total CLO Revolving notes drawn as of March 31, 2018 were $11.7 million with $6.5 million of remaining available CLO capacity(2) Weighted average cost of funds as of March 31, 2018, increased to 4.5% from 4.2% in the prior quarter driven by higher LIBOR and higher rates on our SBIC Debentures when compared to the prior quarter PORTFOLIO LEVERAGE & CAPITAL STRUCTURE CAPITAL STRUCTURE PORTFOLIO LEVERAGE (1) Regulatory debt to equity ratio excludes SBIC leverage and unfunded commitments (2) Based on our regulatory debt to equity ratio of 0.96x, the availability of our CLO revolver is capped at $6.5 million
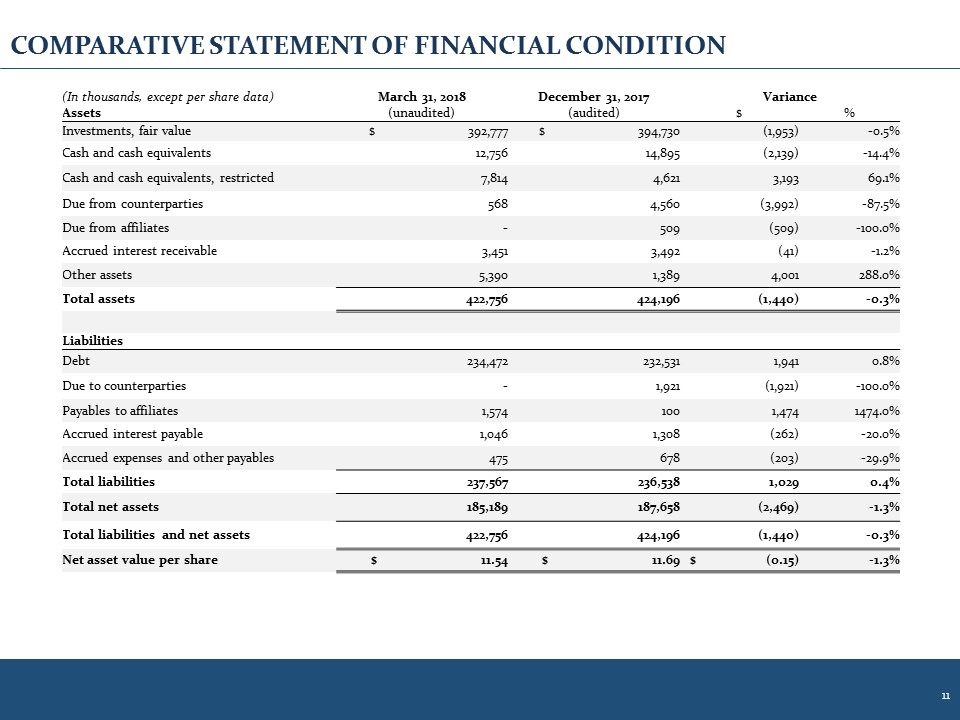
COMPARATIVE STATEMENT OF FINANCIAL CONDITION (In thousands, except per share data) March 31, 2018 December 31, 2017 Variance Assets (unaudited) (audited) $ % Investments, fair value $ 392,777 $ 394,730 (1,953) -0.5% Cash and cash equivalents 12,756 14,895 (2,139) -14.4% Cash and cash equivalents, restricted 7,814 4,621 3,193 69.1% Due from counterparties 568 4,560 (3,992) -87.5% Due from affiliates - 509 (509) -100.0% Accrued interest receivable 3,451 3,492 (41) -1.2% Other assets 5,390 1,389 4,001 288.0% Total assets 422,756 424,196 (1,440) -0.3% Liabilities Debt 234,472 232,531 1,941 0.8% Due to counterparties - 1,921 (1,921) -100.0% Payables to affiliates 1,574 100 1,474 1474.0% Accrued interest payable 1,046 1,308 (262) -20.0% Accrued expenses and other payables 475 678 (203) -29.9% Total liabilities 237,567 236,538 1,029 0.4% Total net assets 185,189 187,658 (2,469) -1.3% Total liabilities and net assets 422,756 424,196 (1,440) -0.3% Net asset value per share $ 11.54 $ 11.69 $ (0.15) -1.3%
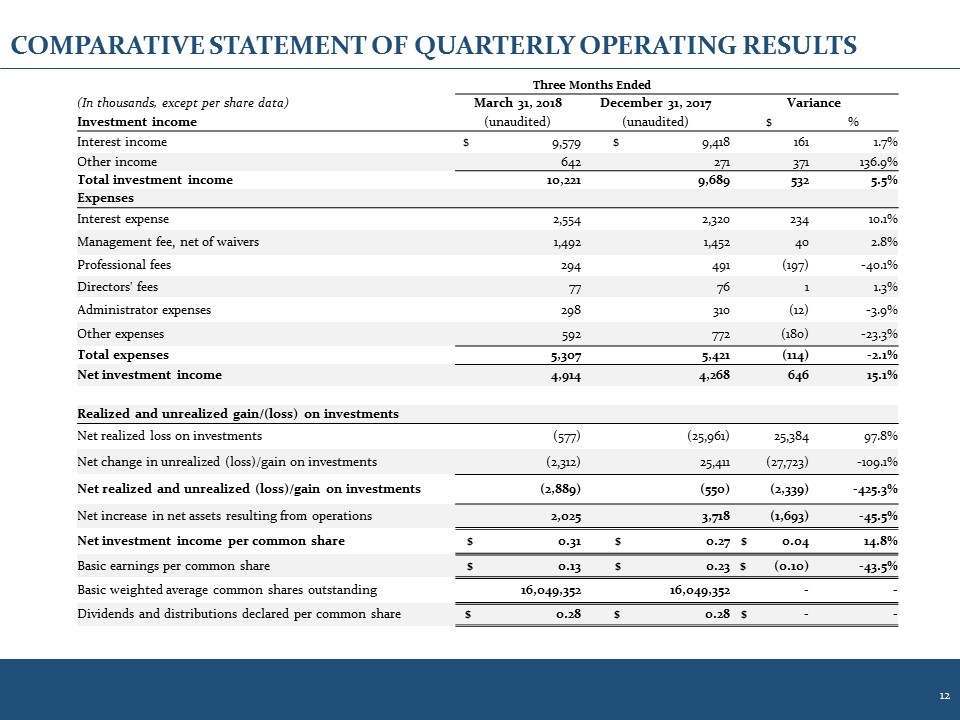
COMPARATIVE STATEMENT OF QUARTERLY OPERATING RESULTS Three Months Ended (In thousands, except per share data) March 31, 2018 December 31, 2017 Variance Investment income (unaudited) (unaudited) $ % Interest income $ 9,579 $ 9,418 161 1.7% Other income 642 271 371 136.9% Total investment income 10,221 9,689 532 5.5% Expenses Interest expense 2,554 2,320 234 10.1% Management fee, net of waivers 1,492 1,452 40 2.8% Professional fees 294 491 (197) -40.1% Directors' fees 77 76 1 1.3% Administrator expenses 298 310 (12) -3.9% Other expenses 592 772 (180) -23.3% Total expenses 5,307 5,421 (114) -2.1% Net investment income 4,914 4,268 646 15.1% Realized and unrealized gain/(loss) on investments Net realized loss on investments (577) (25,961) 25,384 97.8% Net change in unrealized (loss)/gain on investments (2,312) 25,411 (27,723) -109.1% Net realized and unrealized (loss)/gain on investments (2,889) (550) (2,339) -425.3% Net increase in net assets resulting from operations 2,025 3,718 (1,693) -45.5% Net investment income per common share $ 0.31 $ 0.27 $ 0.04 14.8% Basic earnings per common share $ 0.13 $ 0.23 $ (0.10) -43.5% Basic weighted average common shares outstanding 16,049,352 16,049,352 - - Dividends and distributions declared per common share $ 0.28 $ 0.28 $ - -
GARRISON CAPITAL INC. 1290 Avenue of the Americas, 9th Floor New York, NY 10104 Tel: 212-372-9590 Fax: 212-372-9525 Contact Information CONTACT INFORMATION
