Attached files
| file | filename |
|---|---|
| EX-99.1 - EXHIBIT 99.1 - Garrison Capital Inc. | exh_991.htm |
| EX-32.2 - EXHIBIT 32.2 - Garrison Capital Inc. | exh_322.htm |
| EX-32.1 - EXHIBIT 32.1 - Garrison Capital Inc. | exh_321.htm |
| EX-31.2 - EXHIBIT 31.2 - Garrison Capital Inc. | exh_312.htm |
| EX-31.1 - EXHIBIT 31.1 - Garrison Capital Inc. | exh_311.htm |
| EX-21.1 - EXHIBIT 21.1 - Garrison Capital Inc. | exh_211.htm |
UNITED STATES
SECURITIES AND EXCHANGE COMMISSION
Washington, D.C. 20549
FORM 10-K
| x | ANNUAL REPORT PURSUANT TO SECTION 13 OR 15(d) OF THE SECURITIES EXCHANGE ACT OF 1934 |
For the fiscal year ended December 31, 2016
OR
| o | TRANSITION REPORT PURSUANT TO SECTION 13 OR 15(d) OF THE SECURITIES EXCHANGE ACT OF 1934 |
For the transition period from to
Commission File Number 814-00878
Garrison Capital Inc.
(Exact name of registrant as specified in its charter)
| Delaware | 90-0900145 |
| (State or other jurisdiction of incorporation or organization) |
(I.R.S. Employer Identification No.) |
1290 Avenue of the Americas, Suite 914
New York, New York 10104
(Address of principal executive offices)
(212) 372-9590
(Registrant's telephone number, including area code)
Indicate by check mark if the registrant is a well-known seasoned issuer, as defined in Rule 405 of the Securities Act. Yes o No x
Indicate by check mark if the registrant is not required to file reports pursuant to Section 13 or 15(d) of the Act. Yes o No x
Indicate by check mark whether the registrant (1) has filed all reports required to be filed by Section 13 or 15(d) of the Securities Exchange Act of 1934 during the preceding 12 months (or for such shorter period that the registrant was required to file such reports), and (2) has been subject to such filing requirements for the past 90 days. Yes x No o
Indicate by check mark whether the registrant has submitted electronically and posted on its corporate Web site, if any, every Interactive Data File required to be submitted and posted pursuant to Rule 405 of Regulation S-T during the preceding 12 months (or for such shorter period that the registrant was required to submit and post such files). Yes o No o
Indicate by check mark if disclosure of delinquent filers pursuant to Item 405 of Regulation S-K is not contained herein, and will not be contained, to the best of the registrant’s knowledge, in definitive proxy or information statements incorporated by reference in Part III of this Form 10-K or any amendment to this Form 10-K. ☒
Indicate by check mark whether the registrant is a large accelerated filer, an accelerated filer, a non-accelerated filer, or a smaller reporting company. See definitions of “large accelerated filer,” “accelerated filer” and “smaller reporting company” in Rule 12b-2 of the Exchange Act.
| Large accelerated filer o | Accelerated filer x | ||
| Non-accelerated filer o (Do not check if a smaller reporting company) | Smaller reporting company o |
Indicate by check mark whether the registrant is a shell company (as defined in Rule 12b-2 of the Exchange Act). Yes o No x
The aggregate market value of common stock held by non-affiliates of the registrant on June 30, 2016 based on the closing price on June 30, 2016 of $10.09 on the NASDAQ Global Select Market was approximately $152.4 million. For the purposes of calculating this amount only, all directors and executive officers of the registrant have been treated as affiliates. There were 16,049,352 shares of the registrant’s common stock outstanding as of March 3, 2017.
DOCUMENTS INCORPORATED BY REFERENCE
Portions of the registrant’s definitive proxy statement to be filed with the Securities and Exchange Commission pursuant to Regulation 14A in connection with the registrant’s 2017 Annual Meeting of Stockholders, which will be filed subsequent to the date hereof, are incorporated by reference into Part III of this Form 10-K. Such proxy statement will be filed with the Securities and Exchange Commission not later than 120 days following the end of the registrant’s fiscal year ended December 31, 2016.
TABLE OF CONTENTS
| i |
PART I
In this Annual Report on Form 10-K, except as otherwise indicated, the terms:
| • | “we,” “us,” “our” and “Garrison Capital” refer to Garrison Capital Inc., a Delaware corporation, and its consolidated subsidiaries; |
| • | “Garrison Capital Advisers” or the “Investment Adviser” refers to Garrison Capital Advisers LLC, a Delaware limited liability company; |
| • | “Garrison Capital Administrator” or the “Administrator” refers to Garrison Capital Administrator LLC, a Delaware limited liability company; |
| • | “2016-2 CLO” refers to the $300.0 million collateralized loan obligation completed on September 29, 2016 in which Garrison Funding 2016-2 Ltd., an exempted company incorporated with limited liability under the laws of the Cayman Islands and our wholly-owned subsidiary, and Garrison Funding 2016-2 LLC, a Delaware limited liability company and our indirectly wholly-owned subsidiary, which we refer to collectively as “GF 2016-2,” issued: (i) $25.00 million of AAA(sf) Class A-1R Senior Secured Revolving Floating Rate Notes, or the “2016 Class A-1R Notes,” which bear interest at the CP Rate, as defined in the indenture governing the 2016-2 Notes, plus 2.20% or the London Interbank Offered Rate, or “LIBOR,” plus 2.20%; (ii) $88.15 million of AAA(sf) Class A-1T Senior Secured Floating Rate Notes, or the “2016 Class A-1T Notes,” which bear interest at LIBOR plus 2.20%; (iii) $25.00 million of AAA(sf) Class A-1F Senior Secured Fixed Rate Notes, or the “2016 Class A-1F Notes,” which bear interest at 3.41%; (iv) $20.70 million of AA(sf) Class A-2 Senior Secured Floating Rate Notes, or the “2016 Class A-2 Notes,” which bear interest at LIBOR plus 3.15%; (v) $21.45 million of A(sf) Class B Secured Deferrable Floating Rate Notes, or the “2016 Class B Notes,” which bear interest at LIBOR plus 4.00%; (vi) $11.70 million of BBB(sf) Class C Secured Deferrable Floating Rate Notes, or the “2016 Class C Notes,” which bear interest at LIBOR plus 6.00%; and (vii) $108.00 million of subordinated notes, or the “2016 Subordinated Notes,” which do not have a stated interest rate. We refer to the 2016 Class A-1R Notes, the 2016 Class A-1T Notes, the 2016 Class A-1F Notes and the 2016 Class A-2 Notes collectively as the “2016 Class A Notes”; the 2016 Class A Notes, 2016 Class B Notes and 2016 Class C Notes collectively as the “2016 Secured Notes”; and the 2016 Secured Notes and 2016 Subordinated Notes collectively as the “2016-2 Notes”.; |
| • | “2013-2 CLO” refers to the $350.0 million collateralized loan obligation completed on September 25, 2013; |
| • | “the CLOs” refers to the 2013-2 CLO and 2016-2 CLO collectively, refer to Notes 1 and 7 of our consolidated financials for additional disclosures around our CLOs; |
| • | “GLC Trust 2013-2” refers to GLC Trust 2013-2, a Delaware statutory trust; |
| • | “GARS Equity Holdings Entities”, “Walnut Hill II LLC” and “Forest Park II LLC” refer to limited liability companies formed for the purpose of holding minority equity investments, a senior secured equipment loan and a first lien equipment loan, respectively; |
| • | “Garrison Investment Group” refers to Garrison Investment Group LP, a Delaware limited partnership, and its affiliates; and |
| • | “Garrison SBIC” refers to Garrison Capital SBIC LP, a Delaware limited partnership. |
Our predecessor, Garrison Capital LLC, commenced operations on December 17, 2010. On October 9, 2012, we converted from a limited liability company into a corporation. In this conversion, Garrison Capital Inc. succeeded to the business of Garrison Capital LLC and its consolidated subsidiaries, and the members of Garrison Capital LLC became stockholders of Garrison Capital Inc.
GENERAL
We are an externally managed, non-diversified, closed-end management investment company that has elected to be treated as a business development company under the Investment Company Act of 1940, as amended, or the 1940 Act. In addition, for tax purposes we have elected to be treated as a regulated investment company, or RIC, under Subchapter M of the Internal Revenue Code of 1986, as amended, or the Code, and intend to qualify annually for such treatment.
Our investment objective is to generate current income and capital appreciation by making investments generally in the range of $5.0 million to $25.0 million primarily in debt securities and loans of U.S. based middle-market companies, which we define as those having annual earnings before interest, taxes, depreciation, and amortization, or EBITDA, of between $5.0 million and $50.0 million. Our goal is to generate attractive risk-adjusted returns by assembling a broad portfolio of investments. Our principal investment strategies and risks reflect our operations and the operations of our subsidiaries, including the CLOs, on a consolidated basis. We comply with the provisions of the 1940 Act, including those governing investment policies, capital structure, leverage, affiliated transactions and the custody of assets, on a consolidated basis with our subsidiaries, including the CLOs.
We invest primarily in (1) first lien senior secured loans, (2) second lien senior secured loans, (3) “one-stop” senior secured or “unitranche” loans, (4) subordinated or mezzanine loans, (5) unsecured consumer loans and (6) to a lesser extent, selected equity co-investments in middle-market companies.
| 1 |
We use the term “one-stop” or “unitranche” to refer to a loan that combines characteristics of traditional first lien senior secured loans and second lien or subordinated loans. We use the term “mezzanine” to refer to a loan that ranks senior only to a borrower’s equity securities and ranks junior in right of payment to all of such borrower’s other indebtedness.
We believe that the middle market offers attractive risk-adjusted returns for debt investors. Historically, we believe there has been a persistent scarcity of available capital relative to demand, which, from a lender’s perspective, has generally resulted in more favorable transaction structures, including enhanced covenant protection and increased pricing relative to larger companies. In addition, we believe that middle-market companies traditionally have exhibited lower default rates and improved recoveries compared to larger borrowers and typically offer greater access to key senior managers, which we believe further enhances the attractiveness of lending to this market segment and facilitates due diligence investigations and regular monitoring.
As of December 31, 2016, we held investments in 58 portfolio companies with a fair value of $376.7 million, including investments in 41 portfolio companies held through the 2016-2 CLO. The investments held by the 2016-2 CLO as of December 31, 2016 consisted of senior secured loans fair valued at $260.2 million and related indebtedness of $164.3 million. The loans held by the 2016-2 CLO (held at fair value), together with cash and other assets held by the 2016-2 CLO, equaled approximately $275.6 million as of December 31, 2016. As of December 31, 2016, our portfolio had an average investment size of approximately $6.2 million, a weighted average yield of 10.9% and a weighted average contractual maturity of 37 months. Weighted average yield is calculated based on the fair value of the investments and interest expected to be received using the current rate of interest at the balance sheet date to maturity, excluding the effects of future scheduled principal amortizations. Weighted average yield represents the portfolio yield and may be higher than what investors will realize because it does not reflect our expenses or any sales load paid by investors. Our shares of common stock had a total market return of (11.8)% during the year ended December 31, 2016. Total market return is calculated based on the change in market price per share during the period and taking into account distributions, reinvested in accordance with our dividend reinvestment plan.
As of December 31, 2015, we held investments in 67 portfolio companies with a fair value of $415.0 million, including investments in 50 portfolio companies held through the 2013-2 CLO. The investments held by the 2013-2 CLO as of December 31, 2015 consisted of senior secured loans fair valued at $306.6 million and related indebtedness of $194.8 million. The loans held by the 2013-2 CLO (held at fair value), together with cash and other assets held by the 2013-2 CLO, equaled approximately $323.5 million as of December 31, 2015. As of December 31, 2015, our portfolio had an average investment size of approximately $6.2 million, a weighted average yield of 10.8% and a weighted average contractual maturity of 44 months. Weighted average yield represents the portfolio yield and may be higher than what investors will realize because it does not reflect our expenses or any sales load paid by investors. Our shares of common stock had a total market return of (7.05)% during the year ended December 31, 2015. Total market return is calculated based on the change in market price per share during the period and taking into account distributions reinvested in accordance with our dividend reinvestment plan.
Information Available
Our address is 1290 Avenue of the Americas, Suite 914, New York, NY 10104. Our phone number is (212) 372-9590, and our internet address is www.garrisoncapitalbdc.com. We make available, free of charge, on our website, our proxy statement, annual report on Form 10-K, quarterly reports on Form 10-Q, current reports on Form 8-K and amendments to those reports as soon as reasonably practicable after we electronically file such material with, or furnish it to, the U.S. Securities and Exchange Commission, or the SEC. Information contained on our website is not incorporated by reference into this Annual Report on Form 10-K and you should not consider information contained on our website to be part of this Annual Report on Form 10-K or any other report we file with the SEC.
The SEC also maintains a website that contains reports, proxy and information statements and other information we file with the SEC at www.sec.gov. Copies of these reports, proxy and information statements and other information may also be obtained, after paying a duplicating fee, by electronic request at publicinfo@sec.gov, or by writing the SEC’s Public Reference Section, 100 F Street, N.E., Washington, D.C. 20549-0102. Information on the operation of the Public Reference Room may be obtained by calling the SEC at 1-800-SEC-0330.
| 2 |
Our Investment Adviser
Our investment activities are managed by our Investment Adviser. Our Investment Adviser is responsible for sourcing potential investments, conducting research and diligence on prospective investments and equity sponsors, analyzing investment opportunities, structuring our investments and monitoring our investments and portfolio companies on an ongoing basis. Garrison Capital Advisers was organized in November 2010 and is a registered investment adviser under the Investment Advisers Act of 1940, as amended, or the Advisers Act. See “Business — Investment Advisory Agreements” for a discussion of the fees that are payable by us to our Investment Adviser.
Garrison Capital Advisers is an affiliate of Garrison Investment Group. Garrison Capital Advisers has entered into a staffing agreement, or the Staffing Agreement, with Garrison Investment Group. See “Business — Staffing Agreement” for a discussion of the Staffing Agreement. We believe that the Staffing Agreement provides our Investment Adviser with access to investment opportunities, which we refer to in the aggregate as deal flow, generated by Garrison Investment Group in the ordinary course of its business and commits the members of Garrison Investment Group’s investment committee to serve as members of our investment committee. Garrison Investment Group has conducted due diligence on more than 500 middle-market companies since July 2007.
An affiliate of Garrison Capital Advisers, the Administrator, provides the administration services necessary for us to operate. See “Business — Administration Agreement” for a discussion of the fees and expenses we are required to reimburse to the Administrator.
Garrison Investment Group
Garrison Investment Group is an alternative investment and asset management firm founded in March 2007. As of December 31, 2016, Garrison Investment Group had approximately $3.5 billion of committed and invested capital under management and a team of 79 employees, including 41 investment professionals. Garrison Investment Group is headquartered in New York, New York. Garrison Investment Group invests opportunistically in the debt of middle-market companies, primarily in the areas of corporate finance, real estate finance and structured finance.
Since the formation of Garrison Investment Group, Mr. Joseph Tansey and his team of investment professionals, including Brian Chase, Mitch Drucker, Susan George, Robert Chimenti and Joshua Brandt, have been investors and lenders to middle-market companies. These investment professionals have significant experience investing in a broad range of industries and types of debt over the course of several economic cycles.
Before joining Garrison Investment Group, Mr. Tansey was a Managing Director at Fortress Investment Group LLC, or Fortress, and was also a partner of the Drawbridge Special Opportunities Fund, or Drawbridge, one of Fortress’ hybrid hedge funds, from its inception in August 2002 to March 2007. Drawbridge focused primarily on investments in opportunistic debt and equity securities and asset-based transactions. His responsibilities included sourcing, evaluating, structuring, managing and monitoring corporate, structured finance and real estate investments, including both debt and equity. Mr. Tansey has 22 years of investment experience.
Investment Criteria/Guidelines
Our investment objective is to generate current income and capital appreciation by making investments generally in the range of $5.0 million to $25.0 million primarily in debt securities and loans of U.S. based middle-market companies. We may also selectively make investments in amounts larger than $25.0 million in certain of our portfolio companies. We generally expect that the size of our individual investments will vary proportionately with the size of our capital base. Our goal is to generate attractive risk-adjusted returns by assembling a broad portfolio of investments.
| 3 |
Target businesses typically exhibit some or all of the following characteristics:
| • | annual EBITDA between $5.0 million and $50.0 million; |
| • | annual revenue between $75.0 million and $400.0 million; |
| • | a U.S. base of operations; |
| • | an experienced management team executing a long-term growth strategy; |
| • | discernable downside protection through recurring revenue or strong tangible asset coverage; |
| • | defensible niche product/service; |
| • | products and services with distinctive competitive advantages or other barriers to entry; |
| • | stable and predictable free cash flows; |
| • | existing indebtedness that may be refinanced on attractive terms; |
| • | low technology and market risk; |
| • | strong customer relationships; and |
| • | low to moderate capital expenditure requirements. |
While we believe that the criteria listed above are important in identifying and investing in prospective portfolio companies, not all of these criteria will be met by each prospective portfolio company.
Investment Strategy
We seek to create a broad portfolio consisting of investments generally in the range of $5.0 million to $25.0 million primarily in debt securities and loans of U.S. based middle-market companies. The companies to which we extend credit typically are moderately leveraged, and, excluding investments held in the 2016-2 CLO, do not have their loans rated by national rating agencies. If such companies were rated, we believe that they would typically receive a rating below investment grade. In addition, our investments typically range in maturity from one to six years. However, we may make investments in securities with any maturity or duration.
We invest opportunistically in middle-market loans that we believe have attractive risk adjusted returns. We also, to a lesser extent, make select equity investments in non-investment grade companies and have acquired consumer loans. We expect the majority of our focus to generally be centered upon traditional direct lending but at times will seek to enhance returns by purchasing loans in the secondary market, which purchases we refer to as capital markets activities, and extending credit for certain restructuring of financially troubled companies, which we refer to as special situations. We organize these lending opportunities in four categories.
Traditional Direct Lending. We focus on direct origination of first lien senior secured loans, second lien senior secured loans and unitranche loans as well as select mezzanine loans. With respect to these loans, we identify lending opportunities through the extensive origination network to which we have access and serve as either sole lender or as a partner with like-minded creditors. We expect that we will typically extend floating-rate, first lien secured term loans, the proceeds of which may be used to refinance existing indebtedness or support acquisitions, growth initiatives, general corporate liquidity or operational turnarounds.
Capital Markets Activities. We may also acquire loans in the secondary market, generally at favorable discounts, or seek to refinance outstanding loans through anchoring or co-anchoring a new issuance of debt. We believe the experience of the investment professionals to whom our Investment Adviser has access allows us to react quickly in executing acquisitions of loans in the secondary market on favorable terms and permit us to refinance loans on a streamlined basis.
Consumer Loans. We may also opportunistically acquire unsecured consumer loans that we believe have attractive risk adjusted returns.
Special Situations. We may also extend credit for out-of-court restructurings, rescue financings, debtor-in-possession financings and acquisition financings. We expect that, in extending credit to special situations borrowers, we will seek to structure our investments to remain high in the borrower’s capital structure, generate returns through the duration of the loan and obtain call protection or opportunities for enhanced returns through equity participation.
| 4 |
We expect that, from time to time, our investments may include certain non-qualifying assets, including assets of non-U.S. companies, certain publicly traded companies and, to a lesser extent and subject to certain limits under the 1940 Act, registered or unregistered investment companies, to the extent permissible under the 1940 Act. See “Risk Factors — Risks Relating to Our Business and Structure — The constraints imposed on us as a business development company and RIC may hinder the achievement of our investment objectives, and any failure to maintain our status as a business development company or RIC may adversely affect us.” and “Regulation — Qualifying Assets.”
Due Diligence
We believe it is critical to conduct extensive due diligence on investment targets and in evaluating new investments. We, through our Investment Adviser, conduct a rigorous due diligence process that draws from our Investment Adviser’s investment experience, industry expertise and network of contacts. Our Investment Adviser conducts extensive due diligence and performs thorough credit analysis on each potential portfolio company investment. In conducting due diligence, our Investment Adviser uses publicly available information and private information provided by borrowers, their financial sponsors and their advisors. Our Investment Adviser uses its relationships with former and current management teams, consultants, competitors and investment bankers to gain further insights into businesses and industries, generally, and our potential portfolio companies, specifically.
Our due diligence typically includes the following elements (although not all elements will necessarily form part of each due diligence review):
| • | thorough review of historical and prospective financial information, including an analysis of collateral coverage, cash flow and valuation multiples and quality of earnings; |
| • | review of capital structure, including leverage and equity amounts and participants; |
| • | analysis of the business of the prospective portfolio company, including drivers of growth, customer and supplier concentrations, fixed versus variable costs and sensitivity analyses (with a focus on downside scenario analysis); |
| • | analysis of the industry in which the prospective portfolio company operates, including its competitive position, industry size and growth rates, competitive outlook, barriers to entry and technological, regulatory and similar considerations; |
| • | interviews with management, employees, customers and vendors and analysis of management’s track record, quality, breadth and depth; |
| • | preparation or review of material contracts and loan documents; |
| • | when appropriate, background checks on key managers and research relating to the company’s business, industry, markets, products and services; and |
| • | third-party research relating to the company’s management, industry, markets, products and services and competitors. |
Additional due diligence with respect to any investment may be conducted on our behalf by attorneys and independent accountants as well as other outside advisers, as appropriate.
| 5 |
Investment Committee
Upon the completion of due diligence and a decision to proceed with an investment in a prospective portfolio company, the principals leading the investment present the investment opportunity to our Investment Adviser’s investment committee, which determines whether to pursue the potential investment. All new investments are required to be reviewed by the investment committee of our Investment Adviser, which currently consists of the following six members: Joseph Tansey, Brian Chase, Mitch Drucker, Susan George, Robert Chimenti and Joshua Brandt. As our Investment Adviser adds senior investment professionals, our Investment Adviser may add them to its investment committee. The members of our investment committee receive no compensation from us. These members are employees or partners of Garrison Investment Group and receive no direct compensation from us or our Investment Adviser.
Investment Structure
When our Investment Adviser determines that a prospective portfolio company is suitable for investment, it works with the company’s management and its other capital providers to structure an investment. Our Investment Adviser negotiates among these parties to agree how our investment should be structured relative to the other capital in such company’s capital structure.
We structure our loans as follows:
Secured Loans. We typically structure these loans, which include unitranche loans, with either a first or second lien security interest in the portfolio company’s assets that will support the repayment of such loans. First and second lien senior secured loans may provide for moderate loan amortization in the early years of the loan, with the majority of the amortization deferred until loan maturity, but in all cases amortization will be based on the free cash flows generated by the portfolio company and available for debt service. Unitranche loans typically provide for moderate loan amortization in the initial years of the facility, with the majority of the amortization deferred until loan maturity. Unitranche loans also generally allow the borrower to make a large lump sum payment of principal at the end of the loan term. There is a risk of loss if the borrower is unable to pay the lump sum or refinance the amount owed at maturity. In these cases, maturity extension or restructuring may be necessary to preserve collateral and enterprise value. Secured loans may include a payment-in-kind, or PIK, interest feature, although we typically structure loans so that a majority of the interest will be paid in cash.
Special Situations Loans. These loans may be either secured or unsecured and often support an operational or financial restructuring. These loans may also include situations that require unusual speed to closing or structural flexibility. In some cases we structure these loans as secured debtor-in-possession or bankruptcy exit loans. We seek to obtain security interests in the assets of the portfolio company borrowers, which serve as collateral in support of the repayment of such loans. Such collateral may take the form of first-priority or second-priority liens on the assets of the portfolio company borrower. Our special situation loans may provide for moderate loan amortization in the early years of the loan, with the majority of the amortization deferred until loan maturity, and may include a PIK interest feature, although we expect that a majority of the interest will be paid in cash.
Unsecured Loans. We typically structure unsecured loans as subordinated loans that provide for relatively high, fixed interest rates and provide us with significant current interest income, with the exception of unsecured consumer loans, which are not subordinated. These loans typically have interest-only payments (often representing a combination of cash pay and PIK interest) in the early years, with the amortization of principal deferred to maturity. Mezzanine loans, which are often unsecured, generally allow the borrower to make a large lump sum payment of principal at the end of the loan term. There is a risk of loss if the borrower is unable to pay the lump sum or refinance the amount owed at maturity. We expect that mezzanine loans will typically provide for a portion of the interest to be PIK. In these cases, maturity extension or restructuring could be necessary to preserve collateral and enterprise value.
Warrants and Minority Equity Securities. In some cases, we may receive a minority equity interest in a portfolio company in connection with a loan. These minority equity interests may come in the form of common or preferred equity securities or nominally priced warrants or options to purchase a minority equity interest. As a result, if such a portfolio company appreciates in value, we may achieve additional investment return. We may also structure warrants to include provisions protecting our rights as a minority-interest holder, as well as a “put,” or right to sell such securities back to the issuer upon the occurrence of specified events. In many cases, we may seek to obtain registration rights in connection with these equity interests, which may include demand and “piggy-back” registration rights.
| 6 |
We tailor the terms of each investment to the facts and circumstances of the transaction and the prospective portfolio company, negotiating a structure that protects our rights and manages risk while creating incentives for the portfolio company to achieve its business plan and improve its operating results. We typically seek to limit the downside potential of our investments by:
| • | investing between $5.0 million and $25.0 million per transaction; |
| • | maintaining an emphasis on capital preservation; |
| • | targeting an unlevered annual effective yield of between 7% and 11%, excluding any warrants or other equity interests received by us as part of an investment; |
| • | making investments which afford us a significant capital cushion in the form of junior capital and/or asset coverage as well as adequate lender protections in loan documentation; and |
| • | selecting investments that our Investment Adviser believes have a low probability of loss. |
We expect to hold most of our investments to maturity or repayment but may sell some investments earlier if liquidity events occur, such as a sale, recapitalization or worsening of the credit quality of the portfolio company.
Ongoing Monitoring
We view active portfolio monitoring as a vital part of the investment process. Our Investment Adviser monitors the financial trends of each portfolio company to determine if it is meeting its respective business plan and to assess the appropriate course of action for each company.
Our Investment Adviser uses several methods of evaluating and monitoring the performance and fair value of our investments, which may include the following:
| • | assessment of success in adhering to portfolio company’s business plan and compliance with covenants; |
| • | periodic and regular contact with portfolio company management and, if appropriate, the financial or strategic sponsor, to discuss financial position, requirements and accomplishments; |
| • | comparisons to other portfolio companies in the industry, if any; |
| • | attendance at and participation in board meetings; and |
| • | review of monthly and quarterly financial statements and financial projections for portfolio companies. |
Our Investment Adviser assigns an internal rating for each of our portfolio companies. The rating scale is a numeric scale of 1 to 4 based on the credit attributes and prospects of the portfolio company’s business. In general, we use the ratings as follows:
| • | a rating of 1 denotes a high quality investment with no loss of principal expected; |
| • | a rating of 2 denotes a moderate to high quality investment with no loss of principal expected; |
| • | a rating of 3 denotes a moderate quality investment with market rates of expected loss of principal and potential non-compliance with financial covenants; and |
| • | a rating of 4 denotes a low quality investment with an expected loss of principal. In the case of risk rating 4 loans, our Investment Adviser will assign a recovery value to the loan. |
| 7 |
The following table shows the distribution of our investments on the 1 to 4 investment risk rating scale at fair value, excluding our interest in GLC Trust 2013-2 and equity investments as of both December 31, 2016 and December 31, 2015.
| As of December 31, 2016 | As of December 31, 2015 | |||||||||||||||
| ($ in thousands) | Investments at Fair Value | Percentage of Total Investments | Investments at Fair Value | Percentage of Total Investments | ||||||||||||
| Risk Rating 1 | $ | 34,695 | 9.5 | % | $ | 20,455 | 5.3 | % | ||||||||
| Risk Rating 2 | 152,762 | 42.0 | 139,048 | 35.8 | ||||||||||||
| Risk Rating 3 | 163,854 | 45.0 | 205,995 | 53.0 | ||||||||||||
| Risk Rating 4 | 12,649 | 3.5 | 22,826 | 5.9 | ||||||||||||
| $ | 363,960 | 100.0 | % | $ | 388,324 | 100.0 | % | |||||||||
The weighted average risk rating of the portfolio was 2.49 and 2.66 as of December 31, 2016 and December 31, 2015, respectively.
Investments
We seek to create a portfolio that includes senior secured, unitranche, mezzanine and unsecured loans and warrants and minority equity securities by making investments generally in the range of $5.0 million to $25.0 million in U.S. based middle-market companies. Set forth below is a list of our ten largest portfolio company investments as of December 31, 2016, as a percentage of our total investments at fair value as of such date.
| Portfolio Company | Fair Value of Investments | Percentage of Total Investments | ||||||
| ($ in thousands) | ||||||||
| MXD Group, Inc. (fka Exel Direct Inc.) | $ | 14,618 | 3.9 | % | ||||
| Worley Claims Services, LLC | 10,291 | 2.7 | ||||||
| CF Entertainment Inc. (Entertainment Studios) | 10,133 | 2.7 | ||||||
| AP Gaming I, LLC | 10,050 | 2.7 | ||||||
| Interior Specialists, Inc. | 10,040 | 2.7 | ||||||
| ShelterLogic Corp. | 9,752 | 2.6 | ||||||
| Specialty Bakers LLC | 9,720 | 2.6 | ||||||
| CR Brands, Inc. | 9,681 | 2.6 | ||||||
| ActivStyle, Inc. | 9,656 | 2.6 | ||||||
| AbelConn, LLC (Atrenne Computing) | 9,589 | 2.5 | ||||||
| $ | 103,530 | 27.5 | % | |||||
| 8 |
Set forth below is a list of the top ten industries in which we are invested as of December 31, 2016, as a percentage of our total investments at fair value as of such date.
| Industry | Fair Value of Investments | Percentage of Total Investments | ||||||
| ($ in thousands) | ||||||||
| Miscellaneous Manufacturing | $ | 68,901 | 18.2 | % | ||||
| Miscellaneous Retail | 41,640 | 11.1 | ||||||
| Health Services | 34,879 | 9.3 | ||||||
| Consumer Finance Services | 19,665 | 5.2 | ||||||
| Oil & Gas | 19,648 | 5.2 | ||||||
| Miscellaneous Services | 19,644 | 5.2 | ||||||
| Transportation Services | 18,471 | 4.9 | ||||||
| Computer Programming, Data Processing, & Other Computer Related Services | 18,591 | 4.9 | ||||||
| Food Stores & Distributors - Retail | 15,180 | 4.0 | ||||||
| Communications | 12,081 | 3.2 | ||||||
| $ | 268,700 | 71.2 | % | |||||
Managerial Assistance
As a business development company, we offer, and must provide upon request, managerial assistance to our portfolio companies. This assistance could involve monitoring the operations of our portfolio companies, participating in board and management meetings, consulting with and advising officers of portfolio companies and providing other organizational and financial guidance. Garrison Capital Administrator or an affiliate of Garrison Capital Administrator provides such managerial assistance on our behalf to portfolio companies that request this assistance. We may receive fees for these services and reimburse Garrison Capital Administrator or an affiliate of Garrison Capital Administrator for its allocated costs in providing such assistance, subject to the review and approval by our board of directors, including our independent directors.
Competition
Our primary competitors who provide financing to middle-market companies include public and private funds, including other business development companies, commercial and investment banks, commercial financing companies, and, to the extent they provide an alternative form of financing, private equity funds. In periods of economic recovery and expansion, we expect that we may face enhanced competition. Many of our competitors are substantially larger and have considerably greater financial, technical and marketing resources than we do. For example, some competitors may have a lower cost of funds and access to funding sources that are not available to us. In addition, some of our competitors may have higher risk tolerances or different risk assessments, which could allow them to consider a wider variety of investments and establish more relationships than us. Furthermore, many of our competitors are not subject to the regulatory restrictions that the 1940 Act imposes on us as a business development company and that the Code imposes on us as a RIC. For additional information concerning the competitive risks we face, see “Risk Factors — Risks Relating to Our Business and Structure — The highly competitive market for investment opportunities in which we operate may limit our investment opportunities.”
Administration
We do not have any direct employees, and our day-to-day operations are managed by our Investment Adviser. We have a chief executive officer, chief financial officer, and chief compliance officer and, to the extent necessary, our board of directors may elect to appoint additional personnel going forward. Our officers are employees of Garrison Investment Group, an affiliate of our Investment Adviser, and our allocable portion of the cost of our chief financial officer and chief compliance officer and their respective staffs are paid by us pursuant to an administration agreement with the Administrator, or the Administration Agreement. Our executive officers are also officers of Garrison Capital Advisers. See “Business — Administration Agreement.”
INVESTMENT ADVISORY AGREEMENT
Garrison Capital Advisers is a Delaware limited liability company that is registered as an investment adviser under the Advisers Act. The principal executive offices of Garrison Capital Advisers are located at 1290 Avenue of the Americas, Suite 914, New York, New York 10104.
| 9 |
Garrison Capital Advisers serves as our Investment Adviser in accordance with the terms of an investment advisory agreement, or the Investment Advisory Agreement. Subject to the overall supervision of our board of directors, the Investment Adviser manages the day-to-day operations of, and provides investment management services to us. Under the terms of the Investment Advisory Agreement, Garrison Capital Advisers:
| • | determines the composition of our portfolio, the nature and timing of the changes to our portfolio and the manner of implementing such changes; |
| • | identifies, evaluates and negotiates the structure of the investments we make (including performing due diligence on our prospective portfolio companies); and |
| • | closes, monitors and administers the investments we make, including the exercise of any voting or consent rights. |
Garrison Capital Advisers’ services under the Investment Advisory Agreement are not exclusive, and it is free to furnish similar services to other entities so long as its services to us are not impaired. Under the Investment Advisory Agreement, we pay Garrison Capital Advisers a fee for investment management services consisting of a base management fee and an incentive fee.
Effective as of October 1, 2016, the Investment Adviser, in consultation with our board of directors, agreed to irrevocably waive any fees payable to the Investment Adviser under the Investment Advisory Agreement with respect to a calendar quarter in excess of the sum of (i) 0.375% per quarter (1.50% annualized) of our gross assets, excluding cash and cash equivalents but including assets purchased with borrowed funds, calculated based on the average carrying value of our gross assets at the end of the two most recently completed calendar quarters, (ii) 20% of Pre-Incentive Fee Net Investment Income (as defined below), expressed as a rate of return on the value of our net assets at the end of the immediately preceding calendar quarter, in excess of a “hurdle rate” of 1.75% per quarter (7.00% annualized) and (iii) in the case of the final calendar quarter of each year, the capital gains incentive fee. This waiver will be in effect until the earlier of (i) June 30, 2017 and (ii) approval by our stockholders of an amendment to the Investment Advisory Agreement to decrease the base management fee to an annual rate of 1.50% and to decrease the “hurdle rate” for the income-based portion of the incentive fee to 1.75% per quarter (7.00% annualized). We currently intend to present such an amendment for the consideration of our stockholders at the 2017 Annual Meeting of Stockholders.
Management Fee
The base management fee is calculated at an annual rate of 1.75% of our gross assets, excluding cash and cash equivalents but including assets purchased with borrowed funds, and is payable quarterly in arrears. The base management fee is calculated based on the average carrying value of our gross assets at the end of the two most recently completed calendar quarters, and appropriately adjusted for any share issuances or repurchases during such calendar quarters. Base management fees for any partial month or quarter are appropriately pro rated. For purposes of the Investment Advisory Agreement, cash equivalents means U.S. government securities and commercial paper maturing within 270 days of purchase. We made management fee payments to the Investment Adviser of $8.8 million and $6.2 million, respectively, for the years ended December 31, 2016 and December 31, 2015. For the years ended December 31, 2016 and December 31, 2015 the Investment Adviser earned management fees under the Investment Advisory Agreement of $7.0 million and $7.8 million, respectively, of which $0.1 million and $1.8 million remained payable as of December 31, 2016 and December 31, 2015, respectively.
Incentive Fee
The incentive fee consists of two components, the income-based incentive fee and the capital gains-based incentive fee, that are independent of each other (except as provided in the Incentive Fee Cap and Deferral Mechanism described below), with the result that one component may be payable even if the other is not.
Incentive Fee Cap and Deferral Mechanism.
We have structured the calculation of these incentive fees to include a fee limitation, which we refer to as the Incentive Fee Cap and Deferral Mechanism, such that no incentive fee will be paid to our Investment Adviser for any fiscal quarter if, after such payment, the cumulative incentive fees paid to our Investment Adviser for the period that includes such fiscal quarter and the 11 full preceding fiscal quarters, which we refer to as the “Incentive Fee Look-back Period”, would exceed 20.0% of our Cumulative Pre-Incentive Fee Net Return during the Incentive Fee Look-back Period.
The Incentive Fee Look-back Period commenced on April 1, 2013. Prior to April 1, 2016, the Incentive Fee Look-back Period consisted of fewer than 12 full fiscal quarters.
For example, at the end of our second full fiscal quarter after our initial public offering, or the IPO, the Incentive Fee Look-back Period consisted of two full fiscal quarters and our Cumulative Pre-Incentive Fee Net Return equaled the sum of (a) the Pre-Incentive Fee Net Investment Income during those two fiscal quarters and (b) our cumulative realized capital gains, cumulative realized capital losses, cumulative unrealized capital depreciation and cumulative unrealized capital appreciation, with “cumulative” meaning occurring during the two full fiscal quarters elapsed since April 1, 2013.
The deferral component of the Incentive Fee Cap and Deferral Mechanism may cause incentive fees that were accrued during one fiscal quarter to be paid to our Investment Adviser at any time during the 11 full fiscal quarters following such initial full fiscal quarter.
| 10 |
We accomplish this incentive fee limitation by subjecting each incentive fee payable to a cap, which we refer to as the “Incentive Fee Cap”. The Incentive Fee Cap in any quarter is equal to (a) 20.0% of Cumulative Pre-Incentive Fee Net Return during the Incentive Fee Look-back Period less (b) cumulative incentive fees of any kind paid to our Investment Adviser by us during the Incentive Fee Look-back Period. To the extent the Incentive Fee Cap is zero or a negative value in any quarter, we will pay no incentive fee to our Investment Adviser in that quarter. We only pay incentive fees to the extent allowed by the Incentive Fee Cap and Deferral Mechanism. To the extent that the payment of incentive fees is limited by the Incentive Fee Cap and Deferral Mechanism, the payment of such fees may be deferred and paid in subsequent quarters up to three years after their date of deferment, subject to applicable limitations included in the Investment Advisory Agreement.
Cumulative Pre-Incentive Fee Net Return refers to the sum of (a) Pre-Incentive Fee Net Investment Income for each period during the Incentive Fee Look-back Period and (b) the sum of cumulative realized capital gains, cumulative realized capital losses, cumulative unrealized capital depreciation and cumulative unrealized capital appreciation during the applicable Incentive Fee Look-back Period.
Income-Based Incentive Fee
The first component of the incentive fee, which is income-based, is calculated and payable quarterly in arrears based on our Pre-Incentive Fee Net Investment Income for the immediately preceding calendar quarter, subject to a catch-up feature and the Incentive Fee Cap and Deferral Mechanism. For this purpose, “Pre-Incentive Fee Net Investment Income” means interest income, distribution income and any other income (including any other fees (other than fees for providing managerial assistance), such as commitment, origination, structuring, diligence and consulting fees or other fees that we receive from portfolio companies) accrued during the calendar quarter, minus our operating expenses for the quarter (including the base management fee, expenses payable under the Administration Agreement, any interest expense and any distributions paid on any issued and outstanding preferred stock, but excluding the incentive fee). “Pre-Incentive Fee Net Investment Income” includes, in the case of investments with a deferred interest feature (such as original issue discount, debt instruments with PIK interest or original issue discount and zero coupon securities), accrued income that we have not yet received in cash. “Pre Incentive Fee Net Investment Income” does not include any realized capital gains or realized capital losses or unrealized capital appreciation or depreciation.
The operation of the first component of the incentive fee for each quarter is as follows:
| • | no incentive fee is payable to our Investment Adviser in any calendar quarter in which our Pre-Incentive Fee Net Investment Income does not exceed a hurdle rate of 2.00% (8.00% annualized), or the “Hurdle Rate”; |
| • | 100% of our Pre-Incentive Fee Net Investment Income with respect to that portion of such Pre-Incentive Fee Net Investment Income, if any, that exceeds the Hurdle Rate but is less than 2.50% in any calendar quarter (10.00% annualized) is payable to our Investment Adviser. We refer to this portion of our Pre-Incentive Fee Net Investment Income (which exceeds the Hurdle Rate but is less than 2.50%) as the “catch-up.” The effect of the “catch-up” provision is that, if such Pre-Incentive Fee Net Investment Income exceeds 2.50% in any calendar quarter, our Investment Adviser will receive 20% of such Pre-Incentive Fee Net Investment Income as if the Hurdle Rate did not apply; and |
| • | 20% of the amount of such Pre-Incentive Fee Net Investment Income, if any, that exceeds 2.50% in any calendar quarter (10.00% annualized) is payable to our Investment Adviser (once the Hurdle Rate is reached and the catch-up is achieved). |
| 11 |
The portion of such incentive fee that is attributable to deferred interest (such as PIK interest or original issue discount) is paid to our Investment Adviser, together with any other interest accrued on the loan from the date of deferral to the date of payment, only if and to the extent we actually receive such interest in cash, and any accrual thereof is reversed if and to the extent such interest is reversed in connection with any write-off or similar treatment of the investment giving rise to any deferred interest accrual. Any reversal of such amounts reduces net income for the quarter by the net amount of the reversal (after taking into account the reversal of incentive fees payable) and results in a reduction and possibly elimination of the incentive fees for such quarter. For the avoidance of doubt, no interest is paid to Garrison Capital Advisers on amounts accrued and not paid in respect of deferred interest.
There is no accumulation of amounts on the Hurdle Rate from quarter to quarter and, accordingly, there is no clawback of amounts previously paid if subsequent quarters are below the quarterly Hurdle Rate and there is no delay of payment if prior quarters are below the quarterly Hurdle Rate. Since the Hurdle Rate is fixed, as interest rates rise, it will be easier for our Investment Adviser to surpass the Hurdle Rate and receive an incentive fee based on Pre-Incentive Fee Net Investment Income.
Our net investment income used to calculate this component of the incentive fee is also included in the amount of our gross assets used to calculate the 1.75% base management fee. These calculations are appropriately prorated for any period of less than three months and adjusted for any share issuances or repurchases during the applicable quarter.
The following is a graphical representation of the calculation of the income-based component of the incentive fee:
Quarterly Incentive Fee based on Pre-Incentive
Fee Net Investment Income
(expressed as a percentage of the value of net assets)
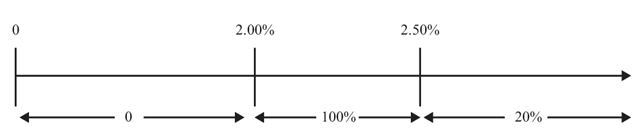
Percentage of Pre-Incentive Fee Net Investment Income allocated to first component of incentive fee
Capital Gains-Based Incentive Fee
The second, capital gains component of the incentive fee is determined and payable in arrears as of the end of each calendar year (or upon termination of the Investment Advisory Agreement, as of the termination date), commencing on December 31, 2013, and equals 20% of our cumulative aggregate realized capital gains through the end of each calendar year, computed net of our aggregate cumulative realized capital losses and our aggregate cumulative unrealized capital depreciation through the end of such year, less the aggregate amount of any previously paid capital gains incentive fees and subject to the Incentive Fee Cap and Deferral Mechanism. If such amount is negative, then no capital gains incentive fee is payable for such year. Additionally, if the Investment Advisory Agreement is terminated as of a date that is not a calendar year end, the termination date is treated as though it were a calendar year end for purposes of calculating and paying the capital gains incentive fee. The capital gains component of the incentive fee is not subject to any minimum return to stockholders. We accrue the capital gains incentive fee if, on a cumulative basis, the sum of net realized gains/(losses) plus net unrealized gains/(losses) is positive.
Because of the structure of the incentive fee, it is possible that we may pay an incentive fee in a quarter where we incur a loss. For example, if we receive Pre-Incentive Fee Net Investment Income in excess of the Hurdle Rate, we will pay the applicable incentive fee even if we have incurred a loss in that quarter due to realized and unrealized capital losses.
Under U.S. generally accepted accounting principles, or U.S. GAAP, we are required to accrue a capital gains incentive fee based upon the aggregate cumulative realized capital gains and losses and aggregate cumulative unrealized capital appreciation and depreciation on investments held at the end of each period. If such amount is positive at the end of a period, then we will record a capital gains incentive fee equal to 20% of such amount, less the aggregate amount of actual capital gains related incentive fees paid in all prior years. If such amount is negative, then there is no accrual for such period. The Investment Advisory Agreement does not permit unrealized capital appreciation for purposes of calculating the amount payable to the Investment Adviser. Amounts due related to unrealized capital appreciation, if any, will not be paid to the Investment Adviser until realized under the terms of the Investment Advisory Agreement (as described above).
| 12 |
Examples of Quarterly Incentive Fee Calculation
Example 1: Income Related Portion of Incentive Fee (*):
Alternative 1
Assumptions
Investment income (including interest, distributions, fees, etc.) = 1.25%
Hurdle Rate (1) = 2.00%
Base management fee (2) = 0.4375%
Other expenses (legal, accounting, custodian, transfer agent, etc.) (3) = 0.25%
Pre-Incentive Fee Net Investment Income
(investment income - (base management fee + other expenses)) = 0.5625%
Pre-Incentive Fee Net Investment Income does not exceed the Hurdle Rate, therefore there is no incentive fee.
Alternative 2
Assumptions
Investment income (including interest, distributions, fees, etc.) = 3.00%
Hurdle Rate (1) = 2.00%
Base management fee (2) = 0.4375%
Other expenses (legal, accounting, custodian, transfer agent, etc.) (3) = 0.25%
Pre-Incentive Fee Net Investment Income
(investment income - (base management fee + other expenses)) = 2.3125%
Pre-Incentive Fee Net Investment Income exceeds the Hurdle Rate, therefore there is an incentive fee.
Incentive fee = (100% × “Catch-Up”) + (the greater of 0% AND (20% × (Pre-Incentive Fee Net Investment Income - 2.50%)))
= (100.0% × (Pre-Incentive Fee Net Investment Income - 2.00%))
+ 0%
= 100.0% × (2.3125% - 2.00%)
= 100.0% × 0.3125%
= 0.3125%
Alternative 3
Assumptions
Investment income (including interest, distributions, fees, etc.) = 3.50%
Hurdle Rate (1) = 2.00%
Base management fee (2) = 0.4375%
Other expenses (legal, accounting, custodian, transfer agent, etc.) (3) = 0.25%
Pre-Incentive Fee Net Investment Income
(investment income - (base management fee + other expenses)) = 2.8125%
Pre-Incentive Fee Net Investment Income exceeds the Hurdle Rate, therefore there is an incentive fee.
Incentive fee = (100% × “Catch-Up”) + (the greater of 0% AND (20% × (Pre-Incentive Fee Net Investment Income - 2.50%)))
= (100% × (2.50% - 2.00%)) + (20.0% × (2.8125% - 2.50%))
= 0.50% + (20.0% × 0.3125%)
= 0.50% + 0.0625%
= 0.5625%
| (*) | The hypothetical amount of Pre-Incentive Fee Net Investment Income shown is based on a percentage of net assets. |
| (1) | Represents 8.00% annualized Hurdle Rate. |
| 13 |
| (2) | Represents 1.75% annualized base management fee. Our Investment Adviser waived its base management fee from the IPO Pricing Date through September 30, 2013. |
| (3) | Excludes organizational and offering expenses. |
Example 2: Capital Gains Portion of Incentive Fee:
Alternative 1
Assumptions
| • | Year 1: $20.0 million investment made in Company A (“Investment A”), and $30.0 million investment made in Company B (“Investment B”) |
| • | Year 2: Investment A sold for $50.0 million and fair market value, or FMV, of Investment B determined to be $32.0 million |
| • | Year 3: FMV of Investment B determined to be $25.0 million |
| • | Year 4: Investment B sold for $31.0 million |
The capital gains portion of the incentive fee would be:
| • | Year 1: None |
| • | Year 2: Capital gains incentive fee of $6.0 million ($30.0 million realized capital gains on sale of Investment A multiplied by 20.0%) |
| • | Year 3: None; $5.0 million (20.0% multiplied by ($30.0 million cumulative capital gains less $5.0 million cumulative capital depreciation)) less $6.0 million (previous capital gains fee paid in Year 2) |
| • | Year 4: Capital gains incentive fee of $0.2 million; $6.2 million ($31.0 million cumulative realized capital gains multiplied by 20.0%) less $6.0 million (capital gains fee paid in Year 2) |
Alternative 2
Assumptions
| • | Year 1: $20.0 million investment made in Company A (“Investment A”), $30.0 million investment made in Company B (“Investment B”) and $25.0 million investment made in Company C (“Investment C”) |
| • | Year 2: Investment A sold for $50.0 million, FMV of Investment B determined to be $25.0 million and FMV of Investment C determined to be $25.0 million |
| • | Year 3: FMV of Investment B determined to be $27.0 million and Investment C sold for $30.0 million |
| • | Year 4: FMV of Investment B determined to be $35.0 million |
| • | Year 5: Investment B sold for $20.0 million |
The capital gains portion of the incentive fee would be:
| • | Year 1: None |
| • | Year 2: Capital gains incentive fee of $5.0 million; 20.0% multiplied by $25.0 million ($30.0 million realized capital gains on Investment A less $5.0 million unrealized capital depreciation on Investment B) |
| • | Year 3: Capital gains incentive fee of $1.4 million; $6.4 million (20.0% multiplied by $32.0 million ($35.0 million cumulative realized capital gains less $3.0 million unrealized capital depreciation on Investment B)) less $5.0 million (capital gains fee received in Year 2) |
| • | Year 4: None |
| 14 |
| • | Year 5: None; $5.0 million of capital gains incentive fee (20.0% multiplied by $25.0 million (cumulative realized capital gains of $35.0 million less realized capital losses of $10.0 million)) less $6.4 million (cumulative capital gains fee paid in Year 2 and Year 3) (1) |
| (1) | The cumulative aggregate capital gains fee received by Garrison Capital Advisers in this hypothetical example ($6.4 million) may be effectively greater than 20.0% of cumulative aggregate realized capital gains less net realized capital losses and aggregate cumulative net unrealized depreciation ($5.0 million). |
Example 3: Application of the Incentive Fee Cap and Deferral Mechanism:
Assumptions
| • | In each of Years 1 through 4 in this example, as well as in each preceding year from the date of the IPO, Pre-Incentive Fee Net Investment Income equals $40.0 million per year, which we recognized evenly in each quarter of each year and paid quarterly. This amount exceeds the hurdle rate and the requirement of the “catch-up” provision in each quarter of such year. As a result, the annual income related portion of the incentive fee, before the application of the Incentive Fee Cap and Deferral Mechanism in any year is $8.0 million ($40.0 million multiplied by 20%), and the cumulative income related portion of the incentive fee before the application of the Incentive Fee Cap and Deferral Mechanism over any Incentive Fee Look-back Period prior to any payment of incentive fees during such year is $16.0 million ($8.0 million multiplied by two). All income-related incentive fees were paid quarterly in arrears. |
| • | In each year preceding Year 1, we did not generate realized or unrealized capital gains or losses, no capital gain-related incentive fee was paid and there was no deferral of incentive fees |
| • | Year 1: We did not generate realized or unrealized capital gains or losses |
| • | Year 2: We realized a $30.0 million capital gain and did not otherwise generate realized or unrealized capital gains or losses |
| • | Year 3: We recognized a $5.0 million unrealized capital depreciation and did not otherwise generate realized or unrealized capital gains or losses |
| • | Year 4: We realized a $6.0 million capital gain and did not otherwise generate realized or unrealized capital gains or losses |
| Income Related Incentive Fee Accrued Before Application of Incentive Fee Cap and Deferral Mechanism |
Capital Gains Related Incentive Fee Accrued Before Application of Incentive Fee Cap and Deferral Mechanism |
Incentive Fee Cap | Incentive Fees Paid and Deferred | |||||
| Year 1 | $8.0 million ($40.0 million multiplied by 20%) | None | $8.0 million (20% of Cumulative Pre-Incentive Fee Net Return during Incentive Fee Look-back Period of $120.0 million less $16.0 million of cumulative incentive fees paid) | Incentive fees of $8.0 million paid; no incentive fees deferred |
| 15 |
| Income Related Incentive Fee Accrued Before Application of Incentive Fee Cap and Deferral Mechanism |
Capital Gains Related Incentive Fee Accrued Before Application of Incentive Fee Cap and Deferral Mechanism |
Incentive Fee Cap | Incentive Fees Paid and Deferred | |||||
| Year 2 | $8.0 million ($40.0 million multiplied by 20%) | $6.0 million (20% of $30.0 million) | $14.0 million (20% of Cumulative Pre-Incentive Fee Net Return during Incentive Fee Look-back Period of $150.0 million ($120.0 million plus $30.0 million) less $16.0 million of cumulative incentive fees paid) | Incentive fees of $14.0 million paid; no incentive fees deferred | ||||
| Year 3 | $8.0 million ($40.0 million multiplied by 20%) | None (20% of cumulative net capital gains of $25.0 million ($30.0 million in cumulative realized gains less $5.0 million in cumulative unrealized capital depreciation) less $6.0 million of capital gains fee paid in Year 2) | $7.0 million (20% of Cumulative Pre-incentive Fee Net Return during Incentive Fee Look-back Period of $145.0 million ($120.0 million plus $25.0 million) less $22.0 million of cumulative incentive fees paid) | Incentive fees of $7.0 million paid; $8.0 million of incentive fees accrued but payment restricted to $7.0 million by the Incentive Fee Cap; $1.0 million of incentive fees deferred | ||||
| Year 4 | $8.0 million ($40.0 million multiplied by 20%) | $0.2 million (20% of cumulative net capital gains of $31.0 million ($36.0 million cumulative realized capital gains less $5.0 million cumulative unrealized capital depreciation) less $6.0 million of capital gains fee paid in Year 2) | $9.2 million (20% of Cumulative Pre-Incentive Fee Net Return during Incentive Fee Look-back Period of $151.0 million ($120.0 million plus $31.0 million) less $21.0 million of cumulative incentive fees paid) | Incentive fees of $9.2 million paid ($8.2 million of incentive fees accrued in Year 4 plus $1.0 million of deferred incentive fees); no incentive fees deferred |
As of December 31, 2016, the Investment Adviser had calculated an aggregate of $16.1 million of income-based incentive fees, since January 1, 2014, of which $10.6 million had been paid as of December 31, 2016. However, the Cumulative Pre-Incentive Fee Net Return has been decreased by the aggregate cumulative net realized and unrealized capital losses, as calculated under U.S. GAAP, experienced through the Incentive Fee Look-back Period. As a result, as of December 31, 2016, aggregate incentive fees payable to the Investment Adviser during the Incentive Fee Look-back Period were capped by the Incentive Fee Cap and Deferral Mechanism at $6.9 million (i.e., 20% of Cumulative Pre-Incentive Fee Net Return during the Incentive Fee Look-back Period). Due to the fact that there is no clawback of amounts previously paid to the Investment Adviser in accordance with the Investment Advisory Agreement, we have not recorded a receivable for the $3.7 million difference between amounts paid under the Investment Advisory Agreement in prior quarters and the Incentive Fee Cap based on our Cumulative Pre-Incentive Fee Net Return as of December 31, 2016.
The $3.7 million difference may be used to reduce future amounts earned by the Investment Adviser. However, as noted above, no incentive fee will be paid to the Investment Adviser for any fiscal quarter if, after such payment, the cumulative incentive fees paid to our Investment Adviser for the Incentive Fee Look-back Period would exceed 20% of our Cumulative Pre-Incentive Fee Net Return during the applicable Incentive Fee Look-back Period. To the extent unrealized capital losses incurred as of December 31, 2016 are reversed within the applicable Incentive Fee Look-back Period, the corresponding increase in our Cumulative Pre-Incentive Fee Net Return may result in the Investment Adviser earning and being paid up to $5.5 million of income based incentive fees which are currently subject to the Incentive Fee Cap.
As of December 31, 2016, the Incentive Fee Look-back Period is in effect through December 31, 2019 and realized and unrealized capital gains and losses and pre-incentive net investment income earned through December 31, 2016 will cease to impact the Incentive Fee Cap and Deferral after this date. The Investment Adviser earned aggregate incentive fees of $3.2 million and $1.1 million for the years ended December 31, 2016 and December 31, 2015, respectively. However, no incentive fees were payable on the consolidated statements of financial condition as of December 31, 2016 and December 31, 2015 due to the Incentive Fee Cap.
Payment of Our Expenses
All investment professionals of the Investment Adviser and their respective staffs when and to the extent engaged in providing investment advisory and management services, and the compensation and routine overhead expenses of such personnel allocable to such services, are provided and paid for by our Administrator. We bear all other costs and expenses of our operations and transactions. See “Management’s Discussion and Analysis of Financial Condition and Results of Operations — Overview — Expenses.”
Duration and Termination
The Investment Advisory Agreement was most recently approved by our board of directors, including a majority of our directors who are not interested persons of us or Garrison Capital Advisers, in January 2017. Unless terminated earlier as described below, the Investment Advisory Agreement will continue in effect from year to year if approved annually by our board of directors, or by the affirmative vote of the holders of a majority of our outstanding voting securities, including, in either case, approval by a majority of our directors who are not interested persons of Garrison Capital. The Investment Advisory Agreement will automatically terminate in the event of its assignment. The Investment Advisory Agreement may be terminated by either party without penalty upon not less than 60 days’ written notice to the other. Any termination by us must be authorized either by our board of directors or by vote of our stockholders. See “Risk Factors — Risks Relating to Our Business and Structure — We depend upon key personnel of Garrison Investment Group and its affiliates.”
A new investment advisory agreement, which has the same terms as the Investment Advisory Agreement, was approved by our stockholders and our board of directors, including a majority of our directors who are not interested person of us or Garrison Capital Advisers, in anticipation of a deemed assignment of the Investment Advisory Agreement for purposes of the 1940 Act in connection with pending changes in the ownership of our Investment Adviser and certain of its affiliates.
| 16 |
Limitation of Liability and Indemnification
The Investment Advisory Agreement provides that Garrison Capital Advisers and its officers, managers, partners, agents, employees, controlling persons, members and affiliates are not liable to us for any act or omission by it in connection with its duties or obligations under the Investment Advisory Agreement or otherwise as our Investment Adviser, except that the foregoing exculpation does not extend to any act or omission constituting willful misfeasance, bad faith, gross negligence or reckless disregard of its duties or obligations under the Investment Advisory Agreement. The Investment Advisory Agreement also provides for indemnification by us of Garrison Capital Advisers and its managers, partners, officers, employees, agents, controlling persons, members and affiliates for damages, liabilities, costs and expenses (including reasonable attorneys’ fees and amounts reasonably paid in settlement) incurred by them in or by reason of any pending, threatened or completed action, suit, investigation or other proceeding (including an action or suit by us or our stockholders or in our or our stockholders’ right) arising out of or based on Garrison Capital Advisers’ duties or obligations under the Investment Advisory Agreement or otherwise as our Investment Adviser, subject to the same limitations and conditions.
Board of Directors Approval of the Investment Advisory Agreement
Our board of directors determined at a meeting held in January 2017 to approve the renewal of the Investment Advisory Agreement. In its consideration of the Investment Advisory Agreement, the board of directors focused on information it had received relating to, among other things:
| • | the nature, quality and extent of the advisory and other services to be provided to us by the Investment Adviser; |
| • | our investment performance and that of our Investment Adviser; |
| • | the costs of providing services to us; |
| • | the profitability of the relationship between us and our Investment Adviser; |
| • | comparative information on fees and expenses borne by other comparable business development companies or registered investment companies; |
| • | comparative business development companies or registered investment companies’ performance and other competitive factors; |
| • | the extent to which economies of scale would be realized as we grow; and |
| • | whether fee levels reflect these economies of scale, if any, for the benefit of our stockholder. |
Based on the information reviewed and the considerations detailed above, the board of directors, including all of the directors who are not “interested persons,” as that term is defined in the 1940 Act, of us or Garrison Capital Advisers, concluded that the investment advisory fee rates and terms are fair and reasonable in relation to the services provided and approved the Investment Advisory Agreement, as well as the Administration Agreement, as being in the best interests of our stockholders.
| 17 |
Administration Agreement
Pursuant to the Administration Agreement, Garrison Capital Administrator furnishes us with office facilities, equipment and clerical, bookkeeping and record keeping services. Under the Administration Agreement, Garrison Capital Administrator also performs, or oversees the performance of, our required administrative services, which includes being responsible for the financial records which we are required to maintain and preparing reports to our stockholders and reports filed with the SEC. In addition, Garrison Capital Administrator assists us in determining and publishing our net asset value, oversees the preparation and filing of our tax returns and the printing and dissemination of reports to our stockholders and generally oversees the payment of our expenses and the performance of administrative and professional services rendered to us by others. Under the Administration Agreement, the Administrator also provides managerial assistance on our behalf to those portfolio companies that have accepted our offer to provide such assistance. Payments under the Administration Agreement are equal to an amount based upon our allocable portion of Garrison Capital Administrator’s overhead in performing its obligations under the Administration Agreement, including rent and our allocable portion of the cost of our chief compliance officer and chief financial officer and their respective staffs. Under the Administration Agreement, Garrison Capital Administrator also provides on our behalf managerial assistance to those portfolio companies to which we are required to provide such assistance. The Administration Agreement may be terminated by either party without penalty upon 60 days’ written notice to the other party. The Administrator may retain third parties to assist in providing administrative services to us. To the extent that our Administrator outsources any of its functions we pay the fees associated with such functions on a direct basis without any profit to Garrison Capital Administrator.
Limitation of Liability and Indemnification
The Administration Agreement provides that Garrison Capital Administrator and its officers, managers, partners, agents, employees, controlling persons, members and affiliates are not liable to us or any of our stockholders for any act or omission by it or such other persons or entities in connection with its duties or obligations under the Administration Agreement or otherwise as our Administrator, except that the foregoing exculpation does not extend to any act or omission constituting willful misfeasance, bad faith, gross negligence or reckless disregard of its duties or obligations under the Administration Agreement. The Administration Agreement also provides for indemnification by us of Garrison Capital Administrator and its managers, partners, officers, employees, agents, controlling persons, members and affiliates for damages, liabilities, costs and expenses (including reasonable attorneys’ fees and amounts reasonably paid in settlement) incurred by them in or by reason of any pending, threatened or completed action, suit, investigation or other proceeding (including an action or suit by us or our stockholders or in our or our stockholders’ right) arising out of or otherwise based on Garrison Capital Administrator’s duties or obligations under the Administration Agreement or otherwise as our Administrator, subject to the same limitations and conditions.
License Agreement
We have entered into a license agreement, or the License Agreement, with Garrison Investment Group pursuant to which Garrison Investment Group has agreed to grant us a non-exclusive, royalty-free license to use the name “Garrison.” Under the License Agreement, we will have a right to use the Garrison name, for so long as Garrison Capital Advisers or one of its affiliates remains our Investment Adviser. The License Agreement is terminable by either party at any time in its sole discretion upon 60 days prior written notice and is also terminable by Garrison Investment Group in the case of certain events of non-compliance. Other than with respect to this limited license, we will have no legal right to the “Garrison” name.
Staffing Agreement
We do not have any internal management capacity or employees. We depend on the diligence, skill and network of business contacts of the senior investment professionals of Garrison Capital Advisers to achieve our investment objective. Garrison Capital Advisers is an affiliate of Garrison Investment Group and depends upon access to the investment professionals and other resources of Garrison Investment Group and its affiliates to fulfill its obligations to us under the Investment Advisory Agreement. Garrison Capital Advisers also depends upon Garrison Investment Group to obtain access to deal flow generated by the professionals of Garrison Investment Group and its affiliates. Under the Staffing Agreement, Garrison Investment Group provides Garrison Capital Advisers with the resources necessary to fulfill these obligations. The Staffing Agreement provides that Garrison Investment Group will make available to Garrison Capital Advisers experienced investment professionals and access to the senior investment personnel of Garrison Investment Group for purposes of evaluating, negotiating, structuring, closing and monitoring our investments. The Staffing Agreement also includes a commitment that the members of Garrison Capital Advisers’ investment committee serve in such capacity. The Staffing Agreement remains in effect until terminated and may be terminated by either party without penalty upon 60 days’ written notice to the other party. Services under the Staffing Agreement are provided to Garrison Capital Advisers on a direct cost reimbursement basis, and such fees are not our obligation.
| 18 |
REGULATION
General
We have elected to be treated as a business development company under the 1940 Act and have elected be treated as a RIC under Subchapter M of the Code and intend to qualify annually for such treatment. The 1940 Act contains prohibitions and restrictions relating to transactions between business development companies and their affiliates (including any investment advisers or sub-advisers), principal underwriters and affiliates of those affiliates or underwriters. The 1940 Act (and the corporate governance rules of the NASDAQ Global Select Market) requires that a majority of the directors of a business development company be persons other than “interested persons,” as that term is defined in the 1940 Act. With the passing of Bruce Shewmaker in December 2016, a majority of our directors were no longer not “interested parties” of us. With the resignation of Rafael Astruc in January 2017, we were again in compliance with the applicable 1940 Act and NASDAQ requirements prior to the annual renewal of our Investment Advisory Agreement, as three of our five currently serving directors are not “interested persons” of us. In addition, the 1940 Act provides that we may not change the nature of our business so as to cease to be, or to withdraw our election as, a business development company unless approved by a majority of our outstanding voting securities.
Our board of directors may decide to issue common stock to finance our operations rather than issuing debt or other senior securities. As a business development company, we are not generally able to issue and sell our common stock at a price below current net asset value per share. We may, however, issue or sell our common stock at a price below the current net asset value of the common stock, or sell warrants, options or rights to acquire such common stock at a price below the current net asset value of the common stock if our board of directors determines that such sale is in the best interests of us and our stockholders, and if our stockholders approve such sale within the preceding 12 months. In any such case, the price at which our securities are to be issued and sold may not be less than a price which, in the determination of our board of directors, closely approximates the market value of such securities (less any distributing commission or discount).
We may invest up to 100% of our assets in securities acquired directly from issuers in privately negotiated transactions. With respect to such securities, we may, for the purpose of public resale, be deemed an “underwriter” as that term is defined in the Securities Act of 1933, as amended, or the Securities Act. Our intention is to not write (sell) or buy put or call options to manage risks associated with the publicly traded securities of our portfolio companies, except that we may enter into hedging transactions to manage the risks associated with interest rate fluctuations. However, we may purchase or otherwise receive warrants to purchase the common stock of our portfolio companies in connection with acquisition financing or other investments. Similarly, in connection with an acquisition, we may acquire rights to require the issuers of acquired securities or their affiliates to repurchase them under certain circumstances. We also do not intend to acquire securities issued by any investment company that exceed the limits imposed by the 1940 Act. Under these limits, we generally cannot acquire more than three percent of the voting stock of any registered investment company, invest more than five percent of the value of our total assets in the securities of one investment company or invest more than 10% of the value of our total assets in the securities of investment companies. With regard to that portion of our portfolio invested in securities issued by investment companies, it should be noted that such investments might subject our stockholders to an additional layer of expenses. None of these policies is fundamental, and all may be changed without stockholder approval.
Qualifying Assets
Under the 1940 Act, a business development company may not acquire any asset other than assets of the type listed in Section 55(a) of the 1940 Act, which are referred to as qualifying assets, unless, at the time the acquisition is made, qualifying assets represent at least 70% of the company’s total assets. The principal categories of qualifying assets relevant to our proposed business are the following:
| (1) | Securities purchased in transactions not involving any public offering from the issuer of such securities, which issuer (subject to certain limited exceptions) is an eligible portfolio company, or from any person who is, or has been during the preceding 13 months, an affiliated person of an eligible portfolio company, or from any other person, subject to such rules as may be prescribed by the SEC. An eligible portfolio company is defined in the 1940 Act as any issuer which: |
| (a) | is organized under the laws of, and has its principal place of business in, the United States; |
| 19 |
| (b) | is not an investment company (other than a small business investment company, or SBIC, wholly owned by the business development company) or a company that would be an investment company but for certain exclusions under the 1940 Act; and |
| (c) | satisfies any of the following: |
| • | does not have any class of securities listed on a national securities exchange or has any class of securities listed on a national securities exchange subject to a $250.0 million market capitalization maximum; or |
| • | is controlled by a business development company or a group of companies including a business development company, the business development company actually exercises a controlling influence over the management or policies of the eligible portfolio company, and, as a result, the business development company has an affiliated person who is a director of the eligible portfolio company. |
| (2) | Securities of any eligible portfolio company which we control. |
| (3) | Securities purchased in a private transaction from a U.S. issuer that is not an investment company or from an affiliated person of the issuer, or in transactions incident thereto, if the issuer is in bankruptcy and subject to reorganization or if the issuer, immediately prior to the purchase of its securities was unable to meet its obligations as they came due without material assistance other than conventional lending or financing arrangements. |
| (4) | Securities of an eligible portfolio company purchased from any person in a private transaction if there is no ready market for such securities and we already own 60% of the outstanding equity of the eligible portfolio company. |
| (5) | Securities received in exchange for or distributed on or with respect to securities described in (1) through (4) above, or pursuant to the exercise of warrants or rights relating to such securities. |
| (6) | Cash, cash equivalents, U.S. Government securities or other high-quality debt securities maturing in one year or less from the time of investment. |
The regulations defining and interpreting qualifying assets may change over time. We expect to adjust our investment focus as needed to comply with and/or take advantage of any regulatory, legislative, administrative or judicial actions in this area.
Managerial Assistance to Portfolio Companies
In addition, a business development company must have been organized and have its principal place of business in the United States and must be operated for the purpose of making investments in the types of securities described in (1), (2) or (3) above. However, in order to count portfolio securities as qualifying assets for the purpose of the 70% test, the business development company must either control the issuer of the securities or must offer to make available to the issuer of the securities (other than small and solvent companies described above) significant managerial assistance; except that, where the business development company purchases such securities in conjunction with one or more other persons acting together, one of the other persons in the group may make available such managerial assistance. Making available managerial assistance means, among other things, any arrangement whereby the business development company, through its directors, officers or employees, offers to provide, and, if accepted, does so provide, significant guidance and counsel concerning the management, operations or business objectives and policies of a portfolio company.
Temporary Investments
Pending investment in other types of qualifying assets, as described above, our investments may consist of cash, cash equivalents, U.S. Government securities or other high-quality debt securities maturing in one year or less from the time of investment, which we refer to, collectively, as temporary investments, so that 70% of our assets are qualifying assets. Typically, we will invest in U.S. Treasury bills or may invest in repurchase agreements, provided that such agreements are fully collateralized by cash or securities issued by the U.S. Government or its agencies. A repurchase agreement involves the purchase by an investor, such as us, of a specified security and the simultaneous agreement by the seller to repurchase it at an agreed-upon future date and at a price which is greater than the purchase price by an amount that reflects an agreed-upon interest rate. There is no percentage restriction on the proportion of our assets that may be invested in such repurchase agreements. However, if more than 25% of our total assets constitute repurchase agreements from a single counterparty, we would not meet the Diversification Tests in order to qualify as a RIC for U.S. federal income tax purposes. Thus, we do not intend to enter into repurchase agreements with a single counterparty in excess of this limit. Our Investment Adviser will monitor the creditworthiness of the counterparties with which we enter into repurchase agreement transactions. See “– Taxation as a RIC” for a definition of “Diversification Tests.”
| 20 |
Senior Securities
We are permitted, under specified conditions, to issue multiple classes of indebtedness and one class of stock senior to our common stock if our asset coverage, as defined in the 1940 Act, is at least equal to 200% immediately after each such issuance. In addition, while any senior securities remain outstanding, we must make provisions to prohibit any distribution to our stockholders or the repurchase of such securities or shares unless we meet the applicable asset coverage ratios at the time of the distribution or repurchase. We may also borrow amounts up to five percent of the value of our total assets for temporary purposes without regard to asset coverage. We consolidate our financial results with those of the CLOs, GLC Trust 2013-2, the GARS Equity Holdings Entities, Walnut Hill II LLC, Forest Park II LLC and Garrison SBIC for financial reporting purposes and measure our compliance with the leverage test applicable to business development companies under the 1940 Act on a consolidated basis. On September 30, 2014, we received exemptive relief from the SEC to permit us to exclude the debt of Garrison SBIC subsidiary from our 200% asset coverage test under the 1940 Act. As such, our ratio of total consolidated assets to outstanding indebtedness may be less than 200%. This provides us with increased investment flexibility but also increases our risks related to leverage. For a discussion of the risks associated with leverage, see “Risk Factors — Risks Relating to Our Business and Structure — Regulations governing our operation as a business development company, including those related to the issuance of senior securities, will affect our ability to, and the way in which we, raise additional debt or equity capital.”
Code of Ethics
We and Garrison Capital Advisers have adopted a joint code of ethics pursuant to Rule 17j-1 under the 1940 Act that establishes procedures for personal investments and restricts certain personal securities transactions. Personnel subject to the code may invest in securities for their personal investment accounts, including securities that may be purchased or held by us, so long as such investments are made in accordance with the code’s requirements. You may read and copy the joint code of ethics at the SEC’s Public Reference Room in Washington, D.C. You may obtain information on the operation of the Public Reference Room by calling the SEC at (202) 551-8090. In addition, the joint code of ethics is attached as an exhibit to the registration statement, and is available on the EDGAR Database on the SEC’s Internet site at http://www.sec.gov . You may also obtain copies of the joint code of ethics, after paying a duplicating fee, by electronic request at the following email address: publicinfo@sec.gov, or by writing the SEC’s Public Reference Section, 100 F Street, N.E., Washington, D.C. 20549.
Proxy Voting Policies and Procedures
We have delegated our proxy voting responsibility to our Investment Adviser. The Proxy Voting Policies and Procedures of our Investment Adviser are set forth below. The guidelines are reviewed periodically by our Investment Adviser and our non-interested directors, and, accordingly, are subject to change. For purposes of these Proxy Voting Policies and Procedures described below, “we” “our” and “us” refers to our Investment Adviser.
Introduction
As an investment adviser registered under the Advisers Act, we have a fiduciary duty to act solely in the best interests of our clients. As part of this duty, we recognize that we must vote client securities in a timely manner free of conflicts of interest and in the best interests of our clients.
These policies and procedures for voting proxies for our investment advisory clients are intended to comply with Section 206 of, and Rule 206(4)-6 under, the Advisers Act.
| 21 |
Proxy Policies
We vote proxies relating to our clients’ portfolio securities in what we perceive to be the best interest of our clients’ shareholders. We review on a case-by-case basis each proposal submitted to a shareholder vote to determine its impact on the portfolio securities held by our clients. In most cases, we will vote in favor of proposals that we believe are likely to increase the value of our clients’ portfolio securities. Although we will generally vote against proposals that may have a negative impact on our clients’ portfolio securities, we may vote for such a proposal if there exists compelling long-term reasons to do so.
Our proxy voting decisions are made by the senior officers who are responsible for monitoring each of our clients’ investments. To ensure that our vote is not the product of a conflict of interest, we require that: (1) anyone involved in the decision making process disclose to our Chief Compliance Officer any potential conflict that he or she is aware of and any contact that he or she has had with any interested party regarding a proxy vote; and (2) employees involved in the decision making process or vote administration are prohibited from revealing how we intend to vote on a proposal in order to reduce any attempted influence from interested parties. Where conflicts of interest may be present, we will disclose such conflicts, including to Garrison Investment Group, and may request guidance on how to vote such proxies.
Proxy Voting Records
You may obtain information without charge about how we voted proxies by making a written request for proxy voting information to: Investor Relations, 1290 Avenue of the Americas, Suite 914, New York, New York 10104 or by calling us collect at (212) 372-9590.
Privacy Principles
We are committed to maintaining the privacy of our stockholders and to safeguarding their non-public personal information. The following information is provided to help you understand what personal information we collect, how we protect that information and why, in certain cases, we may share information with select other parties.
Generally, we do not receive any non-public personal information relating to our stockholders, although certain non-public personal information of our stockholders may become available to us. We do not disclose any non-public personal information about our stockholders or former stockholders to anyone, except as permitted by law or as is necessary in order to service stockholder accounts (for example, to a transfer agent or third party administrator).
We restrict access to non-public personal information about our stockholders to employees of our Investment Adviser and its affiliates with a legitimate business need for the information. We will maintain physical, electronic and procedural safeguards designed to protect the non-public personal information of our stockholders.
Other
Under the 1940 Act, we are required to provide and maintain a bond issued by a reputable fidelity insurance company to protect us against larceny and embezzlement. Furthermore, as a business development company, we are prohibited from protecting any director or officer against any liability to us or our stockholders arising from willful misfeasance, bad faith, gross negligence or reckless disregard of the duties involved in the conduct of such person’s office. We will be periodically examined by the SEC for compliance with the 1940 Act.
We and the Investment Advisor are each required to adopt and implement written policies and procedures reasonably designed to prevent violation of the U.S. federal securities laws, review these policies and procedures annually for their adequacy and the effectiveness of their implementation, and designate a chief compliance officer to be responsible for administering the policies and procedures.
We may also be prohibited under the 1940 Act from knowingly participating in certain transactions with our affiliates, including the Investment Adviser, without the prior approval of our board of directors who are not interested persons and, in some cases, prior approval by the SEC. The SEC has interpreted the prohibition on transactions by business development companies with affiliates to prohibit “joint” transactions among entities that share a common Investment Adviser. The staff of the SEC has granted no-action relief permitting purchases of a single class of privately placed securities provided that the adviser negotiates no term other than price and certain other conditions are met. Except in certain limited circumstances, we will be unable to invest in any issuer in which another account sponsored or managed by our Investment Adviser has previously invested.
| 22 |
On January 12, 2015, we and the Investment Adviser and other affiliates received exemptive relief from the SEC to permit greater flexibility to negotiate the terms of co-investments because we believe that it will be advantageous for us to co-invest with accounts sponsored or managed by the Investment Adviser where such investment is consistent with our investment objectives, positions, policies, strategies and restrictions, as well as regulatory requirements and other pertinent factors. We believe that co-investment by us and accounts sponsored or managed by the Investment Adviser may afford us additional investment opportunities and the ability to achieve greater diversification.
Under the terms of our exemptive relief, a “required majority” (as defined in Section 57(o) of the 1940 Act) of our independent directors is required to make certain conclusions in connection with a co-investment transaction, including that (1) the terms of the proposed transaction are reasonable and fair to us and our stockholders and do not involve overreaching of us or our stockholders on the part of any person concerned and (2) the transaction is consistent with the interests of our stockholders and is consistent with our investment strategies and policies.
Sarbanes-Oxley Act of 2002
The Sarbanes-Oxley Act of 2002, or the Sarbanes-Oxley Act, imposes a wide variety of new regulatory requirements on publicly held companies and their insiders. Many of these requirements affect us. For example:
| • | pursuant to Rule 13a-14 of the Securities Exchange Act of 1934, or the Exchange Act, our Chief Executive Officer and Chief Financial Officer must certify the accuracy of the financial statements contained in our periodic reports; |
| • | pursuant to Item 307 of Regulation S-K, our periodic reports must disclose our conclusions about the effectiveness of our disclosure controls and procedures; |
| • | pursuant to Rule 13a-15 of the Exchange Act, our management must prepare an annual report regarding its assessment of our internal control over financial reporting, which must be audited by our independent registered public accounting firm beginning with the first fiscal year in which we do not qualify as an emerging growth company; and |
| • | pursuant to Item 308 of Regulation S-K and Rule 13a-15 of the Exchange Act, our periodic reports must disclose whether there were significant changes in our internal controls over financial reporting or in other factors that could significantly affect these controls subsequent to the date of their evaluation, including any corrective actions with regard to significant deficiencies and material weaknesses. |
The Sarbanes-Oxley Act requires us to review our current policies and procedures to determine whether we comply with the Sarbanes-Oxley Act and the regulations promulgated thereunder. We will continue to monitor our compliance with all regulations that are adopted under the Sarbanes-Oxley Act and will take actions necessary to ensure that we are in compliance with that act.
JOBS Act
We are an “emerging growth company,” as defined in the Jumpstart Our Business Startups Act, or the JOBS Act, signed into law in April 2012 until the earliest of:
| • | the last day of our fiscal year ending December 31, 2018; |
| • | the last day of the fiscal year in which our total annual gross revenues first exceed $1.0 billion; |
| • | the date on which we have, during the prior three-year period, issued more than $1.0 billion in non-convertible debt; or |
| 23 |
| • | the last day of a fiscal year in which we (1) have an aggregate worldwide market value of our common stock held by non-affiliates of $700.0 million or more, computed at the end of each fiscal year as of the last business day of our most recently completed second fiscal quarter and (2) have been an Exchange Act reporting company for at least one year (and filed at least one annual report under the Exchange Act). |
Under the JOBS Act, we are currently exempt from the provisions of Section 404(b) of the Sarbanes-Oxley Act, which would require that our independent registered public accounting firm provide an attestation report on the effectiveness of our internal control over financial reporting. This may increase the risk that material weaknesses or other deficiencies in our internal control over financial reporting go undetected.
Under the JOBS Act, emerging growth companies can delay adopting new or revised accounting standards until such time as those standards apply to private companies. We have made an irrevocable election not to take advantage of this exemption from new or revised accounting standards. We are therefore subject to the same new or revised accounting standards as other public companies that are not emerging growth companies.
Small Business Investment Company Regulations
SBICs are designed to stimulate the flow of private equity capital to eligible small businesses. Under SBIC regulations, SBICs may make loans to certain eligible small businesses, invest in the equity securities of such businesses and provide them with consulting and advisory services.
The Small Business Administration, or SBA, prohibits an SBIC from providing funds to small businesses for certain purposes, such as relending or investing outside the United States, to businesses engaged in a few prohibited industries, and to certain “passive” (i.e., non-operating) companies. In addition, without prior SBA approval, a SBIC may not invest an amount equal to more than approximately 30% of the SBIC’s regulatory capital in any one company and its affiliates.
The SBA places certain limitations on the financing terms of investments by SBICs in portfolio companies (such as limiting the permissible interest rate on debt securities held by a SBIC in a portfolio company). Regulations adopted by the SBA allow a SBIC to exercise control over a small business for a period of up to seven years from the date on which the SBIC initially acquires its control position. This control period may be extended for an additional period of time with the SBA’s prior written approval.
An SBIC (or group of SBICs under common control) may generally have outstanding debentures guaranteed by the SBA in amounts up to twice the amount of the privately raised funds of the SBIC(s). Debentures guaranteed by the SBA have a maturity of ten years, require semi-annual payments of interest and do not require any principal payments prior to maturity.
Currently, the maximum amount of combined leverage for affiliated SBIC funds is $350.0 million, with a single SBIC using up to $150.0 million in leverage.
SBICs must invest idle funds that are not being used to make loans in investments permitted under SBIC regulations in the following limited types of securities: (1) direct obligations of, or obligations guaranteed as to principal and interest by, the U.S. government, which mature within 15 months from the date of the investment; (2) repurchase agreements with federally insured institutions with a maturity of seven days or less (and the securities underlying the repurchase obligations must be direct obligations of or guaranteed by the U.S. federal government); (3) certificates of deposit with a maturity of one year or less, issued by a federally insured institution; (4) a deposit account in a federally insured institution that is subject to a withdrawal restriction of one year or less; (5) a checking account in a federally insured institution; or (6) a reasonable petty cash fund.
Neither the SBA nor the U.S. government or any of its agencies or officers has approved any ownership interest to be issued by us or any obligation that we or any of our subsidiaries may incur.
| 24 |
Election to Be Taxed as a RIC
As a business development company, we have elected to be treated as a RIC under Subchapter M of the Code and intend to qualify annually for such treatment. As a RIC, we generally will not have to pay corporate-level U.S. federal income taxes on any net ordinary income or capital gains that we timely distribute to our stockholders as dividends. To qualify as a RIC, we must, among other things, meet certain source-of-income and asset diversification requirements (as described below). In addition, we must distribute to our stockholders, for each taxable year, an amount at least equal to 90% of our “investment company taxable income,” which is generally our net ordinary income plus the excess of realized net short-term capital gains over realized net long-term capital losses, or the Annual Distribution Requirement.
Taxation as a RIC
If we:
| • | qualify as a RIC; and |
| • | satisfy the Annual Distribution Requirement; |
then we will not be subject to U.S. federal income tax on the portion of our investment company taxable income and net capital gain, defined as net long-term capital gains in excess of net short-term capital losses, we distribute to stockholders. We will be subject to U.S. federal income tax at regular corporate rates on any net income or net capital gain not distributed to our stockholders. We may choose to retain our net capital gains or any investment company taxable income, and pay the associated U.S. federal corporate income tax, including the U.S. federal excise tax described below.
We will be subject to a 4% nondeductible U.S. federal excise tax on our undistributed income unless we distribute in a timely manner an amount at least equal to the sum of (1) 98% of our ordinary income (taking into account certain deferrals and elections) for each calendar year, (2) 98.2% of our capital gain net income (adjusted for certain net ordinary losses) for the one-year period ending October 31 in that calendar year and (3) any income realized, but not distributed, in the preceding year, or the Excise Tax Avoidance Requirement. For this purpose, however, any ordinary income or capital gain net income retained by us that is subject to corporate income tax in the taxable year ending within the relevant calendar year will be considered to have been distributed.
In order to qualify as a RIC for U.S. federal income tax purposes, we must, among other things:
| • | qualify to be treated as a business development company under the 1940 Act at all times during each taxable year; |
| • | derive in each taxable year at least 90% of our gross income from dividends, interest, payments with respect to certain securities loans, gains from the sale of stock or other securities, or other income derived with respect to our business of investing in such stock or securities, and net income derived from interests in “qualified publicly traded partnerships” (partnerships that are traded on an established securities market or tradable on a secondary market, other than partnerships that derive 90% of their income from interest, dividends and other permitted RIC income), or the 90% Income Test; and |
| • | diversify our holdings, or the Diversification Tests, so that at the end of each quarter of the taxable year: |
| • | at least 50% of the value of our assets consists of cash, cash equivalents, U.S. government securities, securities of other RICs, and other securities if such other securities of any one issuer do not represent more than 5% of the value of our assets or more than 10% of the outstanding voting securities of the issuer; and |
| • | no more than 25% of the value of our assets is invested in the securities, other than U.S. government securities or securities of other RICs, of one issuer or of two or more issuers that are controlled, as determined under applicable tax rules, by us and that are engaged in the same or similar or related trades or businesses or in the securities of one or more qualified publicly traded partnerships. |
| 25 |
We may invest in partnerships, including qualified publicly traded partnerships, which may result in our being subject to state, local or foreign income, franchise or withholding liabilities.
In addition, we are subject to ordinary income and capital gain net income distribution requirements under U.S. federal excise tax rules for each calendar year. If we do not meet the required distributions we will be subject to a 4% nondeductible federal excise tax on the undistributed amount. The failure to meet U.S. federal excise tax distribution requirements will not cause us to lose our RIC status. Depending on the level of taxable income earned in a tax year, we may choose to retain taxable income in excess of current year dividend distributions, and would distribute such taxable income in the next tax year. In such case, we may be subject to the 4% excise tax on such taxable income, as required. To the extent that we determine that our estimated current year annual taxable income, determined on a calendar basis, could exceed estimated current calendar year dividend distributions, we accrue excise tax, if any, on estimated excess taxable income as taxable income is earned.
Any underwriting fees paid by us are not deductible. We may be required to recognize taxable income in circumstances in which we do not receive cash. For example, if we hold debt obligations that are treated under applicable tax rules as having original issue discount (such as debt instruments with PIK interest or, in certain cases, with increasing interest rates or issued with warrants), we must include in income each year a portion of the original issue discount that accrues over the life of the obligation, regardless of whether cash representing such income is received by us in the same taxable year. Because any original issue discount accrued will be included in our investment company taxable income for the year of accrual, we may be required to make a distribution to our stockholders in order to satisfy the Annual Distribution Requirement, even though we will not have received any corresponding cash amount.
Certain of our investment practices may be subject to special and complex U.S. federal income tax provisions that may, among other things, (1) treat dividends that would otherwise constitute qualified dividend income as non-qualified dividend income, (2) treat dividends that would otherwise be eligible for the corporate dividends received deduction as ineligible for such treatment, (3) disallow, suspend or otherwise limit the allowance of certain losses or deductions, (4) convert lower-taxed long-term capital gain into higher-taxed short-term capital gain or ordinary income, (5) convert an ordinary loss or a deduction into a capital loss (the deductibility of which is more limited), (6) cause us to recognize income or gain without a corresponding receipt of cash, (7) adversely affect the time as to when a purchase or sale of stock or securities is deemed to occur, (8) adversely alter the characterization of certain complex financial transactions and (9) produce income that will not be qualifying income for purposes of the 90% Income Test. We intend to monitor our transactions and may make certain tax elections to mitigate the effect of these provisions and prevent our disqualification as a RIC.
Gain or loss realized by us from warrants acquired by us as well as any loss attributable to the lapse of such warrants generally will be treated as capital gain or loss. Such gain or loss generally will be long term or short term, depending on how long we held a particular warrant.
Although we do not presently expect to do so, we are authorized to borrow funds and to sell assets in order to satisfy distribution requirements. However, under the 1940 Act, we are not permitted to make distributions to our stockholders while our debt obligations and other senior securities are outstanding unless certain “asset coverage” tests are met. See “Regulation — Senior Securities.” Moreover, our ability to dispose of assets to meet our distribution requirements may be limited by (1) the illiquid nature of our portfolio and/or (2) other requirements relating to our qualification as a RIC, including the Diversification Tests. If we dispose of assets in order to meet the Annual Distribution Requirement or the Excise Tax Avoidance Requirement, we may make such dispositions at times that, from an investment standpoint, are not advantageous.
We generally invest in securities that have been rated below investment grade by independent rating agencies or that would be rated below investment grade if they were rated. Investments in these types of instruments may present special tax issues for us. U.S. federal income tax rules are not entirely clear about issues such as when we may cease to accrue interest, original issue discount or market discount, when and to what extent deductions may be taken for bad debts or worthless instruments, how payments received on obligations in default should be allocated between principal and income and whether exchanges of debt obligations in a bankruptcy or workout context are taxable. These and other issues will be addressed by us to the extent necessary in order to seek to ensure that we distribute sufficient income such that we do not become subject to U.S. federal income or excise tax.
| 26 |
Some of the income and fees that we may recognize will not satisfy the 90% Income Test. In order to ensure that such income and fees do not disqualify us as a RIC for a failure to satisfy the 90% Income Test, we may be required to recognize such income and fees indirectly through one or more entities treated as corporations for U.S. federal income tax purposes. Such corporations will be required to pay U.S. corporate income tax on their earnings, which ultimately will reduce our return on such income and fees.
Failure to Qualify as a RIC
If we were unable to qualify for treatment as a RIC and are unable to cure the failure, for example, by disposing of certain investments quickly or raising additional capital to prevent the loss of RIC status, we would be subject to tax on all of our taxable income at regular corporate rates. The Code provides some relief from RIC disqualification due to failures of the source of income and asset diversification requirements, although there may be additional taxes due in such cases. We cannot assure you that we would qualify for any such relief should we fail the 90% Income Test or the Diversification Tests.
Should failure occur not only would all our taxable income be subject to tax at regular corporate rates, we would not be able to deduct distributions to stockholders, nor would they be required to be made. Distributions, including distributions of net long-term capital gain, would generally be taxable to our stockholders as ordinary dividend income to the extent of our current and accumulated earnings and profits. Subject to certain limitations under the Code, corporate stockholders would be eligible to claim a dividends received deduction with respect to such dividends, and non-corporate stockholders would generally be able to treat such dividends as “qualified dividend income,” which is subject to reduced rates of U.S. federal income tax. Distributions in excess of our current and accumulated earnings and profits would be treated first as a return of capital to the extent of the stockholder’s tax basis, and any remaining distributions would be treated as a capital gain. If we fail to qualify as a RIC for a period greater than two consecutive taxable years, to qualify as a RIC in a subsequent year we may be subject to regular corporate tax on any net built-in gains with respect to certain of our assets ( i.e. , the excess of the aggregate gains, including items of income, over aggregate losses that would have been realized with respect to such assets if we had been liquidated) that we elect to recognize on requalification or when recognized over the next five years.
| 27 |
You should carefully consider these risk factors, together with all of the other information included in this Annual Report on Form 10-K and the other reports and documents filed by us with the SEC. The risks set out below are not the only risks we face. Additional risks and uncertainties not presently known to us or not presently deemed material by us may also impair our operations and performance. If any of the following events occur, our business, financial condition, results of operations and cash flows could be materially and adversely affected. In such case, our net asset value and the trading price of our common stock could decline, and you may lose all or part of your investment. The risk factors described below are the principal risk factors associated with an investment in us as well as those factors generally associated with an investment company with investment objectives, investment policies, capital structure or trading markets similar to ours.
Risks Relating to Our Business and Structure
The constraints imposed on us as a business development company and RIC may hinder the achievement of our investment objectives, and any failure to maintain our status as a business development company or RIC may adversely affect us.
The 1940 Act and the Code impose numerous constraints on the operations of business development companies and RICs. Business development companies are required, for example, to invest at least 70% of their total assets in qualifying assets, including U.S. private or thinly-traded public companies, cash, cash equivalents, U.S. government securities and other high-quality debt instruments that mature in one year or less from the date of investment. Subject to certain exceptions for follow-on investments and distressed companies, an investment in an issuer that has outstanding securities listed on a national securities exchange may be treated as a qualifying asset only if such issuer has a common equity market capitalization that is less than $250.0 million at the time of such investment. Moreover, qualification for taxation as a RIC requires satisfaction of source-of-income, asset diversification and distribution requirements. Any failure to operate in compliance with these constraints could subject us to enforcement action by the SEC, cause us to fail to satisfy the requirements associated with RIC status, cause us to fail the 70% test described above or otherwise have a material adverse effect on our business, financial condition or results of operations.
We may be precluded from investing in what we believe are attractive investments if such investments are not qualifying assets for purposes of the 1940 Act. If we do not invest a sufficient portion of our assets in qualifying assets, we could be found to be in violation of the 1940 Act provisions applicable to business development companies and possibly lose our status as a business development company. If we do not remain a business development company, we might be regulated as a closed-end investment company under the 1940 Act, which would subject us to substantially more regulatory restrictions under the 1940 Act and correspondingly decrease our operating flexibility. In addition, these rules could prevent us from making follow-on investments in existing portfolio companies (which could result in the dilution of our position) or could require us to dispose of investments at inopportune times in order to come into compliance with the 1940 Act. If we need to dispose of such investments quickly, it may be difficult to dispose of such investments on favorable terms, or at all. For example, we may have difficulty in finding a buyer and, even if we do find a buyer, we may have to sell the investments at a substantial loss or otherwise for less than we could have received if we were able to sell them at a later time.
| 28 |
We depend upon key personnel of Garrison Investment Group and its affiliates.
We are an externally managed business development company, and therefore we do not have any internal management capacity or employees. We depend on the diligence, skill and network of business contacts of our Investment Adviser to achieve our investment objective. We expect that our Investment Adviser will evaluate, negotiate, structure, close and monitor our investments in accordance with the terms of the Investment Advisory Agreement.
Our Investment Adviser is an affiliate of Garrison Investment Group and, in turn, depends upon access to the investment professionals and other resources of Garrison Investment Group and its affiliates to fulfill its obligations to us under the Investment Advisory Agreement. Garrison Capital Advisers also depends upon Garrison Investment Group to obtain access to deal flow generated by the professionals of Garrison Investment Group. Under the Staffing Agreement, Garrison Investment Group has agreed to provide our Investment Adviser with the resources necessary to fulfill these obligations. The Staffing Agreement provides that Garrison Investment Group will make available to Garrison Capital Advisers experienced investment professionals and access to the senior investment personnel of Garrison Investment Group for purposes of evaluating, negotiating, structuring, closing and monitoring our investments. We are not a party to the Staffing Agreement and cannot assure you that Garrison Investment Group will fulfill its obligations under the agreement. If Garrison Investment Group fails to perform, we cannot assure you that Garrison Capital Advisers will enforce the Staffing Agreement, that such agreement will not be terminated by either party or that we will continue to have access to the investment professionals of Garrison Investment Group and its affiliates or their market knowledge and deal flow.
We depend upon the senior professionals of Garrison Investment Group to maintain relationships with potential sources of lending opportunities, and we rely to a significant extent upon these relationships to provide us with potential investment opportunities. We cannot assure you that these individuals will continue to indirectly provide investment advice to us. If these individuals, including the members of our investment committee, do not maintain their existing relationships with Garrison Investment Group, maintain existing relationships or develop new relationships with other sources of investment opportunities, we may not be able to grow our investment portfolio. The loss of any of these individuals or the ability to attract and retain appropriate replacements and/or additional resources could have a material adverse effect on our business, financial condition, results of operations and cash flows. In addition, individuals with whom the senior professionals of Garrison Investment Group have relationships are not obligated to provide us with investment opportunities. Therefore, we cannot assure you that such relationships will generate investment opportunities for us.
If our Investment Adviser is unable to manage our investments effectively, we may be unable to achieve our investment objective.
Our ability to achieve our investment objective depends on our ability to manage our business and to grow our business. This depends, in turn, on our Investment Adviser’s ability to identify, invest in and monitor companies that meet our investment criteria. This, in turn, depends on the ability of Garrison Investment Group’s investment professionals to identify, invest in and monitor companies that meet our investment criteria. The achievement of our investment objectives on a cost-effective basis will depend upon our Investment Adviser’s execution of our investment process, its ability to provide competent, attentive and efficient services to us and our access to financing on acceptable terms. Our Investment Adviser has substantial responsibilities under the Investment Advisory Agreement. The personnel of Garrison Investment Group who are made available to our Investment Adviser under the Staffing Agreement are engaged in other business activities and may be called upon to provide managerial assistance to our portfolio companies, either of which could distract them, divert their time and attention or otherwise cause them not to dedicate a significant portion of their time to our businesses which could slow our rate of investment. Any failure to manage our business and our future growth effectively could have a material adverse effect on our business, financial condition, results of operations and cash flows.
| 29 |
The highly competitive market for investment opportunities in which we operate may limit our investment opportunities.
A number of entities continue to compete with us to make investments in middle-market companies. We compete with public and private funds, including other business development companies, commercial and investment banks, commercial financing companies, and, to the extent they provide an alternative form of financing, private equity funds.
Additionally, as competition for investment opportunities increases, alternative investment vehicles, such as hedge funds and collateralized loan obligations, may invest in middle-market companies. As a result of these new entrants, competition for investment opportunities in middle-market companies could intensify. Many of our potential competitors are substantially larger and have considerably greater financial, technical and marketing resources than we do. For example, some competitors may have a lower cost of funds and access to funding sources that are not available to us. In addition, some of our competitors have higher risk tolerances or different risk assessments, which could allow them to consider a wider variety of investments and establish more relationships than us. Furthermore, many of our competitors are not subject to the regulatory restrictions that the 1940 Act imposes on us as a business development company. We cannot assure you that the competitive pressures we face will not have a material adverse effect on our business, financial condition and results of operations. Also, as a result of this competition, we may not be able to take advantage of attractive investment opportunities from time to time, and we cannot assure you that we will be able to identify and make investments that are consistent with our investment objective.
Entrants in our industry compete on several factors, including price, flexibility in transaction structuring, customer service, reputation, market knowledge and speed in decision-making. We do not intend to compete primarily based on the interest rates we offer, and we believe that some of our competitors may make loans with interest rates that are lower than the rates we offer. We may lose investment opportunities if we do not match our competitors’ pricing, terms and structure. However, if we match our competitors’ pricing, terms and structure, we may reduce our net investment income and increase our risk of credit loss.
Global capital markets could enter a period of severe disruption and instability. These conditions have historically affected and could again materially and adversely affect debt and equity capital markets in the United States and around the world and our business.
Since mid-2007, the global capital markets have experienced a period of disruption resulting in increased spreads between the yields realized on riskier debt securities and those realized on securities perceived to be risk-free, such as U.S. treasuries, a lack of liquidity in parts of the debt capital markets, significant write-offs in the financial services sector relating to subprime mortgages and the re-pricing of credit risk in the syndicated loan market. Signs of deteriorating sovereign debt conditions in Europe and elsewhere, the United Kingdom’s referendum decision to leave the European Union (“Brexit”) and other nationalist movements and policies, concerns related to economic slowdown in China and volatile energy prices create uncertainty that could lead to further disruption. Interest rates have remained low despite recent increases. Because longer-term inflationary pressure is likely to result from the U.S. government’s fiscal policies and challenges during this time, we will likely experience rising interest rates, rather than falling rates, in the near term. A prolonged period of market illiquidity or uncertainty regarding U.S. government deficit and spending levels, including negotiation of federal spending cuts, and implementation of global fiscal austerity measures may lead to a general decline in economic conditions, which could materially and adversely affect the broader financial and credit markets and reduce the availability of debt and equity capital for the market as a whole and to financial firms in particular. This may cause our lenders to attempt to accelerate our indebtedness and, to the extent that we wish to incur additional indebtedness to fund new investments, to renew or refinance existing indebtedness, to obtain other lines of credit or to issue senior securities during such unfavorable economic conditions, including future recessions, the debt capital that will be available to us, if any, may be at a higher cost or on terms and conditions that may be less favorable than we expect, which could negatively affect our financial performance and results. In addition, uncertainty regarding the policies of the incoming U.S. presidential administration or further downgrades to the U.S. government’s sovereign credit rating or perceived creditworthiness of the United States or other large global economies could adversely affect global financial markets and economic conditions.
| 30 |
We have elected to be treated as a RIC and intend to qualify annually for such treatment. If we are unable to qualify as a RIC, we will be subject to corporate-level income tax.
We have elected to be treated as a RIC under the Code and intend to qualify annually for such treatment. To qualify as a RIC under the Code and obtain RIC tax benefits, we must meet certain income source, asset diversification and annual distribution requirements. The Annual Distribution Requirement is satisfied if we distribute at least 90% of our ordinary income and realized net short term capital gains in excess of realized net short term capital losses, if any, to our stockholders on an annual basis. To the extent we use preferred stock or debt financing, we are subject to certain asset coverage ratio requirements under the 1940 Act and may be subject to financial covenants under preferred stock or loan and credit agreements that could, under certain circumstances, restrict us from making distributions necessary to qualify for RIC tax benefits. If we fail to make sufficient distributions, as a result of contractual restrictions or otherwise, we may fail to qualify for such benefits and, thus, may be subject to corporate-level income tax. To qualify as a RIC, we must also meet certain asset diversification requirements at the end of each calendar quarter. Failure to meet these requirements may result in our having to dispose of certain investments quickly in order to prevent the loss of RIC status. Because we anticipate that most of our investments will be in the debt of relatively illiquid middle-market private companies, any such dispositions could be made at disadvantageous prices and may result in substantial losses. If we fail to qualify for RIC tax benefits for any reason and remain or become subject to corporate-level income tax, the resulting corporate taxes could substantially reduce our net assets, the amount of income available for distribution and the amount of our distributions. Such a failure would have a material adverse effect on us and our stockholders.
Our returns will be reduced by any U.S. corporate income tax that our subsidiaries pay.
Some of the income and fees that we recognize will not satisfy the 90% Income Test described above. In order to ensure that such income and fees do not disqualify us as a RIC for a failure to satisfy the 90% Income Test or for other reasons, we may be required to recognize certain income and fees indirectly through one or more entities treated as corporations for U.S. federal income tax purposes. Such corporations will be required to pay U.S. corporate income tax on their earnings, which ultimately will reduce our return on such income and fees. In addition, we may invest in partnerships, including qualified publicly traded partnerships and limited liability companies treated as partnerships for tax purposes, which may result in our being subject to state, local or foreign income, franchise or withholding liabilities.
We may have difficulty paying our required distributions if we recognize income before or without receiving cash representing such income.
For U.S. federal income tax purposes, we include in income certain amounts that we have not yet received in cash, such as original issue discount, which may arise if we receive warrants in connection with the making of a loan or possibly in other circumstances, or PIK interest, which represents contractual interest added to the loan balance and due at the end of the loan term. The credit risk associated with the collectability of deferred payments may be increased as and when a portfolio company increases the amount of interest on which it is deferring cash payment through deferred interest features. Such original issue discount, which could be significant relative to our overall investment assets, and increases in loan balances as a result of PIK interest will be included in income before we receive any corresponding cash payments. We also may be required to include in income certain other amounts that we will not receive in cash. Our investments with a deferred interest feature, such as PIK interest, may represent a higher credit risk than loans for which interest must be paid in full in cash on a regular basis. For example, even if the accounting conditions for income accrual are met, the borrower could still default when our actual collection is scheduled to occur upon maturity of the obligation.
| 31 |
As a result, we may have difficulty meeting the Annual Distribution Requirement. Accordingly, we may have to sell some of our investments at times we would not consider advantageous, raise additional debt or equity capital or reduce new investment originations to meet these distribution requirements. If we are not able to obtain cash from other sources, we may fail to qualify for RIC tax benefits and thus be subject to corporate level income tax.
Regulations governing our operation as a business development company, including those related to the issuance of senior securities, will affect our ability to, and the way in which we, raise additional debt or equity capital.
We expect that we will require a substantial amount of additional capital in order to grow our business. We may issue debt securities or preferred stock and/or borrow money from banks or other financial institutions, which we refer to collectively as “senior securities,” up to the maximum amount permitted by the 1940 Act. Under the provisions of the 1940 Act, we are permitted as a business development company to issue senior securities only in amounts such that our asset coverage, as defined in the 1940 Act, equals at least 200% after each issuance of senior securities (other than the SBA debentures of an SBIC subsidiary, as permitted by exemptive relief we have been granted by the SEC). If the value of our assets declines, we may be unable to satisfy this requirement. If that happens, we may be required to sell a portion of our investments at a time when such sales may be disadvantageous and, depending on the nature of our leverage, repay a portion of our indebtedness.
Our board of directors may decide to issue common stock to finance our operations rather than issuing debt or other senior securities. As a business development company, we are not generally able to issue and sell our common stock at a price below current net asset value per share. We may, however, issue or sell our common stock at a price below the current net asset value of the common stock, or sell warrants, options or rights to acquire such common stock at a price below the current net asset value of the common stock if our board of directors determines that such sale is in the best interests of us and our stockholders, and if our stockholders approve such sale within the preceding 12 months. In any such case, the price at which our securities are to be issued and sold may not be less than a price which, in the determination of our board of directors, closely approximates the market value of such securities (less any distributing commission or discount). We also may conduct rights offerings at prices per share less than the net asset value per share, subject to the requirements of the 1940 Act. If we raise additional funds by issuing additional common stock or senior securities convertible into, or exchangeable for, our common stock, the percentage ownership of our stockholders at that time would decrease, and our stockholders may experience dilution.
Our strategy involves a high degree of leverage. We intend to continue to finance our investments with borrowed money, which will magnify the potential for gain or loss on amounts invested and may increase the risk of investing in us. The risks of investment in a highly leverage fund include volatility and possible distribution restrictions.
Our strategy involves a high degree of leverage. The use of leverage, including through the issuance of senior securities, magnifies the potential for gain or loss on amounts invested. We have incurred leverage in the past and currently incur leverage through the 2016-2 CLO, Garrison SBIC and the notes issued by GLC Trust 2013-2, or the GLC Trust 2013-2 Notes, and, from time to time, intend to incur additional leverage to the extent permitted under the 1940 Act. The use of leverage is generally considered a speculative investment technique and increases the risks associated with investing in our securities. The risks of investing in a highly leveraged fund include volatility and possible distribution restrictions. In the future, we may borrow from, and issue senior securities, to banks, insurance companies and other lenders. Holders of these senior securities will have fixed dollar claims on our assets that are superior to the claims of our common stockholders, and we would expect such holders to seek recovery against our assets in the event of a default. We may pledge up to 100% of our assets and may grant a security interest in all of our assets under the terms of any debt instruments into which we may enter. In addition, under the terms of any credit facility or other debt instrument we enter into, we are likely to be required by its terms to use the net proceeds of any investments that we sell to repay a portion of the amount borrowed under such facility or instrument before applying such net proceeds to any other uses.
| 32 |
If the value of our assets decreases, leverage would cause net asset value to decline more sharply than it otherwise would have had we not leveraged, thereby magnifying losses or eliminating our equity stake in a leveraged investment. Similarly, any decrease in our revenue or income will cause our net income to decline more sharply than it would have had we not borrowed. Such a decline would also negatively affect our ability to make distributions on our common stock or preferred stock. Our ability to service our debt will depend largely on our financial performance and will be subject to prevailing economic conditions and competitive pressures. In addition, our common stockholders will bear the burden of any increase in our expenses as a result of our use of leverage, including interest expenses and any increase in the management fee payable to our Investment Adviser.
As a business development company, we generally are required to meet a coverage ratio of total assets to total borrowings and other senior securities, which include all of our borrowings and any preferred stock that we may issue in the future, of at least 200% (other than the SBA debentures of an SBIC subsidiary, as permitted by exemptive relief we have been granted by the SEC). If this ratio declines below 200% (other than the SBA debentures of an SBIC subsidiary, as permitted by exemptive relief we have been granted by the SEC), we cannot incur additional debt and could be required to sell a portion of our investments to repay certain types of debt when it is disadvantageous to do so. This could have a material adverse effect on our operations, and we may not be able to make distributions. The amount of leverage that we employ will depend on our Investment Adviser’s and our board of directors’ assessment of market and other factors at the time of any proposed borrowing. We cannot assure you that we will be able to obtain credit at all or on terms acceptable to us. We may also borrow amounts up to 5% of the value of our total assets for temporary purposes without regard to asset coverage.
In addition, the terms governing the 2016-2 CLO, the GLC Trust 2013-2 Notes and any indebtedness that we incur in the future could impose financial and operating covenants that restrict our business activities, including limitations that may hinder our ability to finance additional loans and investments or make the distributions required to maintain our status as a RIC under the Code.
The following table illustrates the effect of leverage on returns from an investment in our common stock assuming various annual returns, net of expenses, as of December 31, 2016. The calculations in the table below are hypothetical and actual returns may be higher or lower than those appearing in the table below.
| Assumed Return on Our Portfolio (Net of Expenses) | ||||||||||||||||||||
| -10% | -5% | 0% | 5% | 10% | ||||||||||||||||
| Corresponding return to common stockholder (1) | -24.46% | -14.26% | -4.07% | 6.13% | 16.33% | |||||||||||||||
______________
| (1) | Assumes $406.5 million in total assets, $167.0 million of debt outstanding under the 2016-2 CLO, $37.0 million of debt outstanding under Garrison SBIC, $5.0 million of debt outstanding under the GLC Trust 2013-2 Notes, $199.4 million in net assets as of December 31, 2016 and an average cost of funds of 3.55%, 3.35%, 4.26%, 5.22%, 7.25%, 3.40% and 3.35%, which is the weighted average effective interest rates of the Class A-1F Notes, Class A-1T Notes, Class A-2 Notes, the Class B Notes, the Class C Notes issued as a part of our 2016-2 CLO, the debentures issued by Garrison SBIC and the GLC Trust 2013-2 Notes, respectively, for the year ended December 31, 2016, and includes the effects of the amortization of deferred debt issuance costs. The weighted average effective interest rate for our total outstanding debt was 3.88% as of December 31, 2016. |
Based on our outstanding indebtedness of $209.0 million as of December 31, 2016 and an average cost of funds of 3.62% as of that date, our investment portfolio must experience an annual return of at least 2.00% to cover annual interest payments on the 2016-2 CLO Notes, the SBA debentures of Garrison SBIC and the GLC Trust 2013-2 Notes.
In addition to issuing securities to raise capital as described above, in connection with the formation of the CLOs we securitized a large portion of our loans to generate cash for funding new investments and may seek to securitize additional loans in the future. To securitize additional loans in the future, we may create a wholly-owned subsidiary and contribute a pool of loans to the subsidiary. This could include the sale of interests in the subsidiary on a non-recourse basis to purchasers who we would expect to be willing to accept a lower interest rate to invest in investment grade loan pools, and we would retain a portion of the equity in any such securitized pool of loans. An inability to securitize part of our loan portfolio could limit our ability to grow our business, fully execute our business strategy and increase our earnings. Moreover, certain types of securitization transactions may expose us to greater risk of loss.
| 33 |
Because we expect to distribute substantially all of our ordinary income and net realized capital gains to our stockholders, we will need additional capital to finance our growth and such capital may not be available on favorable terms, or at all.
We will need additional capital to fund growth in our investment portfolio. We may issue debt or equity securities or borrow from financial institutions in order to obtain this additional capital. A reduction in the availability of new capital could limit our ability to grow. We are required to distribute at least 90% of our ordinary income and realized net short-term capital gains in excess of realized net long-term capital losses, if any, to our stockholders to maintain our RIC status. As a result, these earnings will not be available to fund new investments. If we fail to obtain additional capital to fund new investments, this could limit our ability to grow, which may have an adverse effect on the value of our securities.
We are subject to risks associated with the 2016-2 CLO.
The 2016-2 CLO involves a number of significant risks, including those set forth below.
The 2016 Subordinated Notes are subordinated obligations of the 2016-2 CLO.
We directly own all of the 2016 Subordinated Notes. We consolidate the financial statements of the 2016-2 CLO in our consolidated financial statements and treat the 2016 Secured Notes as leverage.
The 2016 Subordinated Notes are the most junior class of securities issued under the indenture governing the 2016-2 CLO. They are subordinated in priority of payment to certain administrative expenses of the 2016-2 CLO and every other class of notes issued by the 2016-2 CLO and are subject to certain payment restrictions set forth in the indenture governing the 2016-2 Notes. In addition, the 2016 Subordinated Notes generally have only limited voting rights and generally do not benefit from any creditors’ rights or ability to exercise remedies under the indenture governing 2016-2 Notes. The holders of the 2016 Subordinated Notes have expressly disclaimed voting rights in certain votes related to certain matters relating to the collateral management agreement. The 2016 Subordinated Notes are not guaranteed by another party.
The 2016 Subordinated Notes do not bear a stated rate of interest. We receive cash distributions on the 2016 Subordinated Notes only if 2016-2 CLO has made all required cash interest payments on all of the 2016 Secured Notes it has issued and each of the applicable coverage tests is satisfied and certain other conditions are met. The 2016 Subordinated Notes represent an equity investment in the 2016-2 CLO, and we cannot assure you that distributions on the assets held by the 2016-2 CLO will be sufficient to make any distributions to us or that the yield on the 2016 Subordinated Notes will meet our expectations.
The 2016 Subordinated Notes are unsecured and rank behind all of the secured creditors, known or unknown, of the 2016-2 CLO, including the holders of the 2016 Secured Notes. Consequently, to the extent that the value of the 2016-2 CLO’s portfolio of loan investments has been reduced as a result of conditions in the credit markets, defaulted loans, losses on the underlying assets, prepayment or changes in interest rates, the value of the 2016 Subordinated Notes realized at their redemption could be reduced. Accordingly, the 2016 Subordinated Notes may not be paid in full and may be subject to up to 100% loss.
The 2016 Subordinated Notes are a highly leveraged investment.
As of December 31, 2016, the 2016-2 CLO owed approximately $167.0 million under the 2016 Secured Notes, and the fair value of the investments held by the 2016-2 CLO was $260.2 million. The leveraged nature of the 2016 Subordinated Notes may magnify the adverse impact on the 2016 Subordinated Notes of changes in the market value of the investments held by the 2016-2 CLO, changes in the distributions on those investments, defaults and recoveries on those investments, capital gains and losses on those investments, prepayments on those investments and availability, prices and interest rates of those investments. We are prepared to hold the 2016 Subordinated Notes until their stated maturity.
| 34 |
The interests of investors in certain of the 2016 Secured Notes may not be aligned with our interests, and we may have no control over remedies.
Generally, institutional investors hold the 2016 Secured Notes. These securities rank senior in right of payment to the 2016 Subordinated Notes. There are circumstances in which the interests of investors in a class of notes may not be aligned with the interests of holders of the other classes of notes issued by the 2016-2 CLO. For example, under the terms of the indenture, investors in the 2016 Class A Notes, have the right to receive payments of principal and interest prior to investors in all other classes of notes.
As the holder of the 2016 Subordinated Notes, we are generally not entitled to exercise remedies under the indenture governing the notes issued by the 2016-2 CLO. For example, for as long as the 2016 Class A-1R Notes remain outstanding, investors in the 2016 Class A-1R Notes comprise the most senior class of notes of the 2016-2 CLO then outstanding, or the Controlling Class, under the 2016-2 CLO. Upon repayment of the 2016 Class A-1R Notes, investors in the 2016 Class A-1T Notes will become the Controlling Class and so on. The Controlling Class has the right to act in certain circumstances with respect to the portfolio loans in ways that may benefit their interests but not in the interests of other investors in more junior classes of notes, including by exercising remedies, waiving events of default or rescinding declaration of acceleration of the notes under the indenture governing the notes issued by the 2016-2 CLO. The Controlling Class has no obligation to consider any possible adverse effect on any other class of notes. For example, upon the occurrence and during the continuance of an event of default with respect to the notes issued by the 2016-2 CLO, the trustee, Deutsche Bank Trust Company Americas, or holders of a majority of the Controlling Class may declare the principal of all the 2016 Secured Notes and all other amounts payable by the 2016-2 CLO to be immediately due and payable. This would have the effect of accelerating the principal on such notes and triggering a repayment obligation on the part of the 2016-2 CLO. The 2016-2 CLO may not have sufficient proceeds available to enable the trustee under the indenture to repay the obligations to us. The Controlling Class may be less likely to waive an event of default or rescind declaration of acceleration of outstanding amounts than lenders under traditional senior secured credit facilities.
We cannot assure you that any remedies pursued by the Controlling Class will be in our best interests or that we will receive any payments or distributions upon an acceleration of the notes. Any failure of the 2016-2 CLO to make distributions on the 2016 Subordinated Notes, whether as a result of an event of default or otherwise, could have a material adverse effect on our business, financial condition, results of operations and cash flows and may result our inability to make distributions sufficient to allow our qualification as a RIC.
The 2016-2 CLO may fail to meet certain asset coverage tests, which would have an adverse effect on the time of payments to us.
Under the documents governing the 2016-2 CLO, there are coverage tests applicable to each class of the 2016 Secured Notes. The first test compares the amount of interest received on the collateral loans held by the 2016-2 CLO (net of certain fees and expenses) to the amount of interest payable in respect of the 2016 Secured Notes. To meet this first test, the aggregate amount of interest received on the portfolio loans must equal, after the payment of certain fees and expenses, at least 135% of the interest payable in respect of the 2016 Class A Notes, 125% of the interest payable on the 2016 Class A Notes and the 2016 Class B Notes, taken together, and 115% of the interest payable on the 2016 Secured Notes, taken together. The second test compares the aggregate principal amount of the collateral loans (which in certain cases may be less than the actual par amount of such collateral loan), as calculated in accordance with the indenture, to the aggregate outstanding principal amount of the 2016 Secured Notes. To meet this second test at any time, the aggregate principal amount of the collateral loans (subject to potential adjustments as indicated above) must equal at least 173.4% of the aggregate outstanding principal amount of the 2016 Class A Notes, 156.1% of the aggregate outstanding principal amount of the 2016 Class A Notes and the 2016 Class B Notes, taken together, and 148.1% of the aggregate outstanding principal amount of the 2016 Secured Notes, taken together. If any coverage test is not satisfied with respect to a quarterly payment date, the 2016-2 CLO is required to apply available amounts to the repayment of interest on and principal of the 2016 Class A Notes, then the 2016 Class B Notes and then the 2016 Class C Notes to the extent necessary to satisfy the applicable coverage tests. In addition, if the aggregate principal amount of the collateral loans (subject to potential adjustments as indicated above) to the aggregate outstanding principal amount of the 2016 Class A Notes is less than or equal to 125% as of any measurement date, a majority of the Controlling Class may direct the sale and liquidation of assets held by the 2016-2 CLO, which could have a material adverse effect on our business, financial condition and results of operations.
| 35 |
Restructurings of investments held by the 2016-2 CLO may decrease their value and reduce amounts payable on the 2016 Subordinated Notes.
Under a collateral management agreement, we serve as collateral manager of the 2016-2 CLO. In addition, we have entered into a sub-collateral management agreement with our Investment Adviser, whereby we delegated certain of our obligations and duties under the collateral management agreement to our Investment Adviser.
As a result of these arrangements, our Investment Adviser indirectly has broad authority to direct and supervise the investment and reinvestment of the investments held by the 2016-2 CLO, which may include exercising or enforcing, or refraining from exercising or enforcing, any or all of the 2016-2 CLO’s rights in connection with the execution of amendments, waivers, modifications and other changes to the investment documentation in accordance with the collateral management agreement, and subject to the right of the Controlling Class to consent to certain amendments and certain other restrictions contained in the indenture. During periods of economic uncertainty and recession, the incidence of amendments, waivers, modifications and restructurings of investments may increase. Such amendments, waivers, modifications and other restructurings will change the terms of the investments and in some cases may result in the 2016-2 CLO holding assets not meeting its criteria for investments. This could adversely impact the coverage tests under the indenture governing the notes issued by the 2016-2 CLO. Any amendment, waiver, modification or other restructuring that reduces the 2016-2 CLO’s compliance with certain financial tests will make it more likely that the 2016-2 CLO will need to utilize cash to pay down the unpaid principal amount of the 2016 Secured Notes to cure any breach in such test instead of making payments on the 2016 Subordinated Notes. Any such use of cash would reduce distributions available and delay the timing of payments to us.
We may not receive cash from the 2016-2 CLO.
We receive cash from the 2016-2 CLO only to the extent that we receive payments on the 2016 Subordinated Notes. The 2016-2 CLO may make payments on such notes only to the extent permitted by certain payment priority provisions of the indenture governing the 2016-2 Notes, which generally provide that principal payments on the 2016 Subordinated Notes may not be made on any payment date unless all other amounts owing are paid in full. In addition, if the 2016-2 CLO does not meet the asset coverage tests or the interest coverage test set forth in the documents governing the 2016-2 CLO, cash would be diverted from the ordinary priority of payments to first make payments on the 2016 Secured Notes in amounts sufficient to cause such tests to be satisfied. In the event that we fail to receive cash from the 2016-2 CLO, we could be unable to make distributions to our stockholders in amounts sufficient to maintain our status as a RIC, or at all. We also could be forced to sell investments in portfolio companies or the notes that we own at less than their fair value in order to continue making such distributions.
| 36 |
Our ability to transfer the 2016 Subordinated Notes is limited.
The notes issued by the 2016-2 CLO are illiquid investments and subject to extensive transfer restrictions, and no party is under any obligation to make a market for the notes. In addition, we have agreed to not transfer the 2016 Subordinated Notes except in limited circumstances. There is no market for the notes, and we may not be able to sell or otherwise transfer the 2016 Subordinated Notes at their fair value, or at all, in the event that we determine to sell them. During economic downturns, notes issued in securitization transactions may experience high volatility and significant fluctuations in market value. Additionally, some potential buyers of such notes may view securitization products as an inappropriate investment, thereby reducing the number of potential buyers and/or potentially affecting liquidity in the secondary market.
The holders of the 2016 Class A-1R Notes may fail to advance funds to us as required.
If a holder of a 2016 Class A-1R Note should fail to advance funds to us in a timely manner, as required under the documents governing the 2016-2 CLO, we may be forced to obtain alternative sources of liquidity, including by selling assets or seeking new financing arrangements. If we are unable to find such sources of liquidity, we may be unable to fund obligations to our portfolio companies or be forced to break trades that have been entered into but not yet settled, either of which could adversely affect our reputation, cause portfolio companies to seek recourse against us, including litigation, and otherwise have a material adverse effect on our business, financial condition and results of operations.
The 2016-2 CLO may be required to redeem the 2016 Secured Notes upon the occurrence of certain tax events.
In certain circumstances, we or a majority of the holders of any class of the 2016 Secured Notes that has not received 100% of the principal and interest that would otherwise be due and payable to such class on any quarterly payment date can require the 2016-2 CLO to redeem such notes in whole in the event that any U.S. or foreign tax statute or treaty requires withholding of more than 5% of the scheduled payments by the 2016-2 CLO on any date or any jurisdiction imposes a net income, profits or similar tax on the 2016-2 CLO in an aggregate amount in excess of $0.1 million in any quarter. This could cause the 2016-2 CLO to sell all or a portion of its investments in order to fund the necessary redemption, including on unfavorable terms, which could have a material adverse effect on our business, financial condition and results of operations.
Failure of a court to enforce certain non-petition obligations may adversely affect us.
Each holder of 2016 Secured Notes has agreed, and each beneficial owner of the 2016 Secured Notes will be deemed to agree, that it will not cause the filing of a petition in bankruptcy against, or present a winding up action petition in respect of, the 2016-2 CLO for at least 366 days after payment in full of such notes. If such provision is determined to be unenforceable under applicable bankruptcy laws or is violated by one or more holders of 2016 Secured Notes, then the applicable court could liquidate the 2016-2 CLO’s assets without regard to the voting instructions of the Controlling Class. Any such liquidation of the 2016-2 CLO’s assets could have a material adverse effect on our business, financial condition and results of operations.
The 2016-2 CLO is subject to various conflicts of interest involving Deutsche Bank Trust Company Americas.
Deutsche Bank Trust Company Americas is the trustee and custodian with respect to the indenture governing the notes issued by the 2016-2 CLO. Various potential and actual conflicts of interest may arise as a result of the investment banking, commercial banking, asset management, financing and financial advisory services and products provided by affiliates of Deutsche Bank Trust Company Americas, or, collectively, the Deutsche Bank Companies, to us and the 2016-2 CLO. When acting in service capacities with respect to investments held by the 2016-2 CLO, the Deutsche Bank Companies are entitled to fees and expenses senior in priority to payments to the distributions on our equity interests in the 2016-2 CLO. In addition, the Deutsche Bank Companies may act as trustee for other classes of securities issued by one of our portfolio companies or make or administer loans to such portfolio companies and would owe fiduciary duties to the holders of such other classes of securities, which classes of securities may have differing interests from us, and may take actions that are adverse to us, including restructuring a loan, exercising remedies under a loan, foreclosing on collateral, requiring additional collateral, charging significant fees or placing the obligor in bankruptcy. The Deutsche Bank Companies might act as a counterparty under swaps or any other derivative agreements for transactions involving issuers of investments held by the 2016-2 CLO and could take actions adverse to the interests of the 2016-2 CLO, including demanding collateralization of its exposure under such agreements (if provided for thereunder) or terminating such swaps or agreements in accordance with the terms thereof. As a result of all such transactions or arrangements between the Deutsche Bank Companies and issuers of investments held by the 2016-2 CLO or their respective affiliates, the Deutsche Bank Companies may have interests that are contrary to the interests of the 2016-2 CLO.
| 37 |
We are exposed to risks associated with changes in interest rates.
Since we are using debt to finance investments, our net investment income will depend, in part, upon the difference between the rate at which we borrow funds and the rate at which we invest those funds. As a result, we cannot assure you that a significant change in market interest rates will not have a material adverse effect on our net investment income. In periods of rising interest rates when we have debt outstanding, our cost of funds will increase, which could reduce our net investment income. We expect that our investments will be financed primarily with equity and medium to long-term debt. We may use interest rate risk management techniques in an effort to limit our exposure to interest rate fluctuations. These techniques may include various interest rate hedging activities to the extent permitted by the 1940 Act. These activities may limit our ability to benefit from lower interest rates with respect to the hedged portfolio. Adverse developments resulting from changes in interest rates or hedging transactions could have a material adverse effect on our business, financial condition and results of operations.
Interest rate fluctuations may have a substantial negative impact on our investments, the value of our common stock and our rate of return on invested capital. A reduction in the interest rates on new investments relative to interest rates on current investments or a reduction in the spread between the interest rates on our investments and the interest rates payable on our borrowings could have an adverse impact on our net investment income. A rise in the general level of interest rates can be expected to lead to higher interest rates applicable to our debt investments. There is a risk that the portfolio companies in which we hold floating rate debt investments will be unable to pay escalating interest amounts if general interest rates rise, resulting in a default under their loan documents with us. In addition, increasing payment obligations under floating rate loans may cause our portfolio companies to refinance or otherwise repay our loans prior to maturity. Higher interest rates applicable to our debt investments would make it easier for us to meet or exceed the incentive fee Hurdle Rate and may result in a substantial increase in the amount of incentive fees payable to our Investment Adviser with respect to Pre-Incentive Fee Net Investment Income.
In addition, a decline in the prices of the debt due to rising market interest rates not reflected in such debt investments we own could adversely affect the trading price of our common stock and our net asset value. Also, an increase in interest rates available to investors could make investment in our common stock less attractive if we are not able to increase our dividend rate, which could reduce the market value of our common stock.
We may not receive cash from GLC Trust 2013-2.
We receive cash from GLC Trust 2013-2 only to the extent that dividends on our equity interests are approved by the securities administrator under the indenture governing the GLC Trust 2013-2 Notes. In addition, in the event that GLC Trust 2013-2 fails to receive cash from its underlying portfolio of consumer loans, it could be unable to service the GLC Trust 2013-2 Notes as required under the indenture. If GLC Trust 2013-2 fails to meet certain portfolio and other covenants as set forth in the indenture, the GLC Trust 2013-2 Notes may be immediately terminated and all outstanding amounts could become immediately due and payable. We cannot assure you that we would be able to refinance the GLC Trust 2013-2 Notes at such time or otherwise be able to satisfy the obligations thereunder, particularly if the quality of the underlying portfolio of consumer loans has deteriorated since the time of their acquisition.
| 38 |
We may not replicate the results achieved by other entities managed or sponsored by members of our investment committee or by Garrison Investment Group or its affiliates.
Our primary focus in making investments generally differs from that of many of the investment funds, accounts or other investment vehicles that are or have been managed by members of our investment committee or sponsored by Garrison Investment Group or its affiliates. In addition, investors in our common stock do not acquire an interest in any such investment funds, accounts or other investment vehicles that are or have been managed by members of our investment committee or sponsored by Garrison Investment Group or its affiliates. We cannot assure you that we will replicate the results achieved by members of the investment committee, and we caution you that our investment returns could be substantially lower than the returns achieved by them in current or prior periods. Additionally, all or a portion of the prior results may have been achieved in particular market conditions which may never be repeated. Moreover, current or future market volatility and regulatory uncertainty may have an adverse impact on our future performance.
There are significant potential conflicts of interest that could affect our investment returns.
As a result of our arrangements with Garrison Investment Group and our investment committee, there may be times when Garrison Investment Group or such persons have interests that differ from those of our stockholders, giving rise to a conflict of interest.
There may be conflicts related to obligations our investment committee, our Investment Adviser or its affiliates have to other clients.
The members of our investment committee serve or may serve as officers, directors or principals of entities that operate in the same or a related line of business as we do, or of investment funds managed by our Investment Adviser or its affiliates. Similarly, our Investment Adviser or its affiliates may have other clients with similar, different or competing investment objectives. In serving in these multiple capacities, they may have obligations to other clients or investors in those entities, the fulfillment of which may not be in the best interests of us or our stockholders. For example, the members of our investment committee have, and will continue to have, management responsibilities for other investment funds, accounts or other investment vehicles managed or sponsored by our Investment Adviser and its affiliates, including entities that may raise additional capital from time to time. These other investment funds, accounts, or other investment vehicles may have different fee and expense arrangements, including requirements to share or offset certain fees from portfolio companies, than those paid by us to the Investment Adviser. Our investment objective overlaps or may overlap with the investment objectives of such affiliated investment funds, accounts or other investment vehicles. As a result, those individuals may face conflicts in the allocation of investment opportunities among us and other investment funds or accounts advised by or affiliated with our Investment Adviser. Our Investment Adviser will seek to allocate investment opportunities among eligible accounts in a manner that is fair and equitable over time and consistent with the written allocation policy of Garrison Investment Group and its affiliated investment advisers, including our Investment Adviser. However, we cannot assure you that such opportunities will be allocated to us fairly or equitably in the short-term or over time. Where we are able to co-invest consistent with the requirements of the 1940 Act, if sufficient securities or loan amounts are available to satisfy our and each such account’s proposed demand, we expect that the opportunity will be allocated in accordance with our Investment Adviser’s pre-transaction determination. If there is an insufficient amount of an investment opportunity to satisfy our demand and that of other accounts sponsored or managed by our Investment Adviser or its affiliates, the allocation policy further provides that allocations among us and such other accounts will generally be made pro rata based on each account’s available capital in the asset class being allocated, up to the amount proposed to be invested by each account. However, there can be no assurance that we will be able to participate in all suitable investment opportunities. Where we are unable to co-invest consistent with the requirements of the 1940 Act, the allocation policy of Garrison Investment Group and its affiliated investment advisers provides for investments to be allocated on a rotational basis to assure that all clients have fair and equitable access to such investment opportunities.
| 39 |
Our investment committee, our Investment Adviser or its affiliates may, from time to time, possess material non-public information, limiting our investment discretion.
Principals of our Investment Adviser and its affiliates and members of our investment committee may serve as directors of, or in a similar capacity with, companies in which we invest, the securities of which are purchased or sold on our behalf. If we obtain material nonpublic information with respect to such companies, or we become subject to trading restrictions under the internal trading policies of those companies or as a result of applicable law or regulations, we could be prohibited for a period of time from purchasing or selling the securities of such companies, and this prohibition may have an adverse effect on us.
Our incentive fee structure may create incentives for our Investment Adviser that are not fully aligned with the interests of our stockholders and may induce our Investment Adviser to make speculative investments.
In the course of our investing activities, we pay management and incentive fees to our Investment Adviser. The incentive fee payable by us to our Investment Adviser may create an incentive for our Investment Adviser to make investments on our behalf that are risky or more speculative than would be the case in the absence of such compensation arrangement. The management fee is based on our gross assets excluding cash and cash equivalents. As a result, investors in our common stock invest on a “gross” basis and receive distributions on a “net” basis after expenses, resulting in a lower rate of return than one might achieve through direct investments. Because the management fee is based on our gross assets, our Investment Adviser will benefit when we incur debt or use leverage. The use of leverage increases the likelihood of default, which disfavors the holders of our common stock.
Additionally, under the incentive fee structure, our Investment Adviser may benefit when capital gains are recognized and, because our Investment Adviser determines when a holding is sold, our Investment Adviser controls the timing of the recognition of such capital gains. Our board of directors is charged with protecting our interests by monitoring how our Investment Adviser addresses these and other conflicts of interest associated with its management services and compensation. While they are not expected to review or approve each investment or realization, our independent directors periodically review our Investment Adviser’s services and fees as well as its portfolio management decisions and portfolio performance. In connection with these reviews, our independent directors consider whether such fees and our expenses (including those related to leverage) remain appropriate. As a result of this arrangement, our Investment Adviser or its affiliates may from time to time have interests that differ from those of our stockholders, giving rise to a conflict.
Unlike that portion of the incentive fee based on income, there is no Hurdle Rate applicable to the incentive fee based on net capital gains. As a result, our Investment Adviser may seek to invest more capital in investments that are likely to result in capital gains as compared to income producing securities. This practice could result in our investing in more speculative securities than would otherwise be the case, which could result in higher investment losses, particularly during economic downturns.
In addition, under the terms of the Incentive Fee Cap and Deferral Mechanism, the amount of incentive fees earned by our Investment Adviser depends, in part, upon the timing of capital gains or losses in our investment portfolio, as well as the timing of our recognition of income. Depending on the circumstances, there may be a lag of as long as 12 fiscal quarters between the occurrence of an event giving rise to an obligation to pay incentive fees to the Investment Adviser and the payment of such incentive fees. Therefore, investors who acquire our shares of common stock may pay indirectly to our Investment Adviser incentive fees in respect of income or capital gains that were received by or paid to us prior to such investor becoming a stockholder. As a result, such investors may not participate in the income or capital gains giving rise to such indirect expense.
Effective as of October 1, 2016, the Investment Adviser, in consultation with our board of directors, agreed to irrevocably waive any fees payable to the Investment Adviser under the Investment Advisory Agreement with respect to a calendar quarter in excess of the sum of (i) 0.375% per quarter (1.50% annualized) of our gross assets, excluding cash and cash equivalents but including assets purchased with borrowed funds, calculated based on the average carrying value of our gross assets at the end of the two most recently completed calendar quarters, (ii) 20% of Pre-Incentive Fee Net Investment Income, expressed as a rate of return on the value of our net assets at the end of the immediately preceding calendar quarter, in excess of a “hurdle rate” of 1.75% per quarter (7.00% annualized) and (iii) in the case of the final calendar quarter of each year, the capital gains incentive fee. This waiver will be in effect until the earlier of (i) June 30, 2017 and (ii) approval by our stockholders of an amendment to the Investment Advisory Agreement to decrease the base management fee to an annual rate of 1.50% and to decrease the “hurdle rate” for the income-based portion of the Incentive Fee to 1.75% per quarter (7.00% annualized). We currently intend to present such an amendment for the consideration of our stockholders at the 2017 Annual Meeting of Stockholders. We cannot assure you that our stockholders will approve the amendment or that our Investment Adviser will agree to further waivers if the amendment is not approved.
The valuation process for certain of our portfolio holdings creates a conflict of interest.
We expect to make many portfolio investments in the form of securities that are not publicly traded. As a result, our board of directors determines the fair value of these securities in good faith. In connection with that determination, investment professionals from our Investment Adviser provide our board of directors with portfolio company valuations based upon the most recent portfolio company financial statements available and projected financial results of each portfolio company. In addition, certain members of our board of directors, including Messrs. Chase and Tansey, have an indirect pecuniary interest in our Investment Adviser. The participation of our Investment Adviser’s investment professionals in our valuation process, and the indirect pecuniary interest in our Investment Adviser by certain members of our board of directors, could result in a conflict of interest as the management fee paid to our Investment Adviser is based, in part, on our gross assets.
| 40 |
We have conflicts related to other arrangements with our Investment Adviser or its affiliates.
We have entered into the License Agreement with Garrison Investment Group under which Garrison Investment Group has granted us a non-exclusive, royalty-free license to use the name “Garrison”. In addition, we pay to Garrison Capital Administrator our allocable portion of overhead and other expenses incurred by Garrison Capital Administrator in performing its obligations under the Administration Agreement, such as rent and our allocable portion of the cost of our chief financial officer and chief compliance officer and their respective staffs. This creates conflicts of interest that our board of directors must monitor.
The Investment Advisory Agreement with Garrison Capital Advisers, the Administration Agreement with Garrison Capital Administrator and the sub-collateral management agreement with Garrison Capital Advisers were not negotiated on an arm’s length basis and may not be as favorable to us as if they had been negotiated with an unaffiliated third party.
The Investment Advisory Agreement, the Administration Agreement and the sub-collateral management agreement were negotiated between related parties. Consequently, their terms, including fees payable to our Investment Adviser, may not be as favorable to us as if they had been negotiated with an unaffiliated third party. In addition, we may choose not to enforce, or to enforce less vigorously, our rights and remedies under these agreements because of our desire to maintain our ongoing relationship with our Investment Adviser, our Administrator, the collateral manager and their respective affiliates. Any such decision, however, would breach our fiduciary obligations to our stockholders.
Our ability to enter into transactions with our affiliates is restricted, which may limit the scope of investments available to us.
We are prohibited under the 1940 Act from participating in certain transactions with our affiliates without the prior approval of our independent directors and, in some cases, of the SEC. Any person that owns, directly or indirectly, five percent or more of our outstanding voting securities is our affiliate for purposes of the 1940 Act, and we are generally prohibited from buying or selling any security from or to, or entering into certain “joint” transactions (which could include investments in the same portfolio company) with such affiliates, absent the prior approval of our independent directors. Our Investment Adviser and its affiliates, including persons that control, or are under common control with, us or our Investment Adviser, are also considered to be our affiliates under the 1940 Act, and we are generally prohibited from buying or selling any security from or to, or entering into “joint” transactions with such affiliates without prior approval of our independent directors and, in some cases, additional exemptive relief from the SEC.
We may, however, invest alongside other clients of our Investment Adviser and its affiliates in certain circumstances where doing so is consistent with applicable law, SEC staff interpretations and/or exemptive relief issued by the SEC. For example, we may invest alongside such accounts consistent with guidance promulgated by the staff of the SEC permitting us and such other accounts to purchase interests in a single class of privately placed securities so long as certain conditions are met, including that our Investment Adviser, acting on our behalf and on behalf of other clients, negotiates no term other than price. We may also invest alongside our Investment Adviser’s and certain of its affiliates’ other clients as otherwise permissible under regulatory guidance, applicable regulations, the terms of our exemptive relief and the written allocation policy of Garrison Investment Group and its affiliated investment advisers, including our Investment Adviser. Under this allocation policy, a fixed calculation, based on the type of investment, will be applied to determine the amount of each opportunity to be allocated to us. This allocation policy will be periodically approved by our Investment Adviser and reviewed by our independent directors. We expect that these determinations will be made similarly for other accounts sponsored or managed by our Investment Adviser and its affiliates. If sufficient securities or loan amounts are available to satisfy our and each such account’s proposed demand, we expect that the opportunity will be allocated to us in accordance with our Investment Adviser’s pre-transaction determination. Where there is an insufficient amount of an investment opportunity to satisfy us and other accounts sponsored or managed by our Investment Adviser or its affiliates, the allocation policy further provides that allocations among us and such other accounts will generally be made pro rata based on each account’s available capital in the asset class being allocated, up to the amount proposed to be invested by each account. However, we cannot assure you that investment opportunities will be allocated to us fairly or equitably in the short-term or over time.
We, Garrison Investment Group and our Investment Adviser have received exemptive relief to permit greater flexibility to negotiate the terms of co-investments if our board of directors determines that it would be advantageous for us to co-invest with other accounts sponsored or managed by our Investment Adviser or its affiliates in a manner consistent with our investment objective, positions, policies, strategies and restrictions, as well as regulatory requirements and other relevant factors. We cannot assure you, however, that we will develop opportunities that comply with such limitations.
In situations where co-investment with other accounts managed by our Investment Adviser or its affiliates is not permitted or appropriate, Garrison Investment Group and our Investment Adviser must decide which client will proceed with the investment. The written allocation policy of Garrison Investment Group and its affiliated investment advisers, including our Investment Adviser, in such circumstances provides for investments to be allocated on a rotational basis to assure that all clients have fair and equitable access to such investment opportunities. Moreover, except in certain circumstances, we are unable to invest in any issuer in which a fund managed by our Investment Adviser or its affiliates has a current investment. Similar restrictions limit our ability to transact business with our officers or directors or their affiliates. These restrictions may limit the scope of investment opportunities that would otherwise be available to us.
| 41 |
Our Investment Adviser may be paid incentive compensation even if we incur a net loss, and we cannot recover any portion of the incentive fee previously paid.
Our Investment Adviser is entitled to incentive compensation for each fiscal quarter in an amount equal to a percentage of our Pre-Incentive Fee Net Investment Income, subject to the Hurdle Rate, a catch-up provision and the Incentive Fee Cap and Deferral Mechanism. Our Pre-Incentive Fee Net Investment Income excludes realized and unrealized capital losses that we may incur in the fiscal quarter, even if such capital losses result in a net loss for that quarter. Thus, we may be required to pay our Investment Adviser incentive compensation for a fiscal quarter even if we incur a net loss. In addition, if we pay the capital gains portion of the incentive fee and thereafter experience additional realized capital losses or unrealized capital depreciation, we will not be able to recover any portion of the incentive fee previously paid.
Our portfolio investments will be recorded at fair value as determined in good faith by our board of directors. As a result, there will be uncertainty as to the value of our portfolio investments.
Many of our portfolio investments will take the form of securities that are not publicly traded. The fair value of securities and other investments that are not publicly traded may not be readily determinable, and we value these securities at fair value as determined in good faith by our board of directors, including to reflect significant events affecting the value of our securities. As discussed in more detail under “Management’s Discussion and Analysis of Financial Condition and Results of Operations — Critical Accounting Policies,” all of our investments (other than cash and cash equivalents) are classified as Level 3 under Financial Accounting Standards Board, or FASB, Accounting Standards Codification, or ASC, Topic 820, Fair Value Measurements and Disclosures, or ASC Topic 820. This means that our portfolio valuations are based on unobservable inputs and our own assumptions about how market participants would price the asset or liability in question. Inputs into the determination of fair value of our portfolio investments require significant management judgment or estimation. Even if observable market data are available, such information may be the result of consensus pricing information or broker quotes, which include a disclaimer that the broker would not be held to such a price in an actual transaction. The non-binding nature of consensus pricing and/or quotes accompanied by disclaimers materially reduces the reliability of such information. We have retained the services of several independent service providers to review the valuation of these securities. To the extent a security is reviewed in a particular quarter, it is reviewed and valued by only one service provider. The types of factors that the board of directors may take into account in determining the fair value of our investments generally include, as appropriate, comparison to publicly traded securities, including such factors as yield, maturity and measures of credit quality, the enterprise value of a portfolio company, the nature and realizable value of any collateral, the portfolio company’s ability to make payments and its earnings, the markets in which the portfolio company does business and other relevant factors. Because such valuations, and particularly valuations of private securities and private companies, are inherently uncertain, may fluctuate over short periods of time and may be based on estimates, our determinations of fair value may differ materially from the values that would have been used if a ready market for these securities existed. In addition, the determination of fair value and thus the amount of unrealized losses we may incur in any year, is, to a degree, subjective, in that it is based on unobservable inputs and certain assumptions. Our net asset value could be adversely affected if our determinations regarding the fair value of our investments were materially higher than the values that we ultimately realize upon the disposal of such securities.
We adjust quarterly the valuation of our portfolio to reflect our board of directors’ determination of the fair value of each investment in our portfolio. Any changes in fair value are recorded in our consolidated statements of operations as net change in unrealized appreciation or depreciation.
Our Investment Adviser’s liability is limited under the Investment Advisory Agreement and the sub-collateral management agreement, and we have agreed to indemnify our Investment Adviser against certain liabilities, which may lead our Investment Adviser to act in a riskier manner on our behalf than it would when acting for its own account.
Under the Investment Advisory Agreement and the sub-collateral management agreement, our Investment Adviser does not assume any responsibility to us other than to render the services called for under those agreements, and it is not responsible for any action of our board of directors in following or declining to follow our Investment Adviser’s advice or recommendations. Our Investment Adviser maintains a contractual and fiduciary relationship with us. Under the terms of the Investment Advisory Agreement and the sub-collateral management agreement, our Investment Adviser, its officers, members, personnel, any person controlling or controlled by our Investment Adviser are not be liable to us, any subsidiary of ours, our directors, our stockholders or any subsidiary’s stockholders or partners for acts or omissions performed in accordance with and pursuant to the Investment Advisory Agreement and the sub-collateral management agreement, except those resulting from acts constituting gross negligence, willful misconduct, bad faith or reckless disregard of our Investment Adviser’s duties under the Investment Advisory Agreement and the sub-collateral management agreement. In addition, we have agreed to indemnify our Investment Adviser and each of its officers, directors, members, managers and employees from and against any claims or liabilities, including reasonable legal fees and other expenses reasonably incurred, arising out of or in connection with our business and operations or any action taken or omitted on our behalf pursuant to authority granted by the Investment Advisory Agreement and the sub-collateral management agreement, except where attributable to gross negligence, willful misconduct, bad faith or reckless disregard of such person’s duties under the Investment Advisory Agreement and the sub-collateral management agreement. These protections may lead our Investment Adviser to act in a riskier manner when acting on our behalf than it would when acting for its own account.
| 42 |
Our Investment Adviser can resign on 60 days’ notice, and we may not be able to find a suitable replacement within that time, resulting in a disruption in our operations that could adversely affect our financial condition, business and results of operations.
Our Investment Adviser has the right, under the Investment Advisory Agreement, to resign at any time upon not less than 60 days’ written notice, whether we have found a replacement or not. If our Investment Adviser resigns, we may not be able to find a new Investment Adviser or hire internal management with similar expertise and ability to provide the same or equivalent services on acceptable terms within 60 days, or at all. If we are unable to do so quickly, our operations are likely to experience a disruption, our financial condition, business and results of operations as well as our ability to pay distributions are likely to be adversely affected and the market price of our shares may decline. In addition, the coordination of our internal management and investment activities is likely to suffer if we are unable to identify and reach an agreement with a single institution or group of executives having the expertise possessed by our Investment Adviser and its affiliates. Even if we are able to retain comparable management, whether internal or external, the integration of such management and their lack of familiarity with our investment objective may result in additional costs and time delays that may adversely affect our business, financial condition, results of operations and cash flows.
Our Administrator can resign on 60 days’ notice, and we may not be able to find a suitable replacement within that time, resulting in a disruption in our operations that could adversely affect our financial condition, business and results of operations.
Our Administrator has the right, under the Administration Agreement, to resign at any time upon not less than 60 days’ notice, whether we have found a replacement or not. If our Administrator resigns, we may not be able to find a new administrator or hire internal management with similar expertise and ability to provide the same or equivalent services on acceptable terms within 60 days, or at all. If we are unable to do so quickly, our operations are likely to experience a disruption, our financial condition, business and results of operations as well as our ability to pay distributions are likely to be adversely affected and the market price of our shares may decline. In addition, the coordination of our internal management and administrative activities is likely to suffer if we are unable to identify and reach an agreement with a service provider or individuals with the expertise possessed by our Administrator. Even if we are able to retain a comparable service provider or individuals to perform such services, whether internal or external, their integration into our business and lack of familiarity with our operations may result in additional costs and time delays that may adversely affect our business, financial condition, results of operations and cash flows.
The lack of liquidity in our investments may adversely affect our business.
We generally make investments in private companies. Substantially all of these investments are subject to legal and other restrictions on resale or will otherwise be less liquid than publicly traded securities. The illiquidity of our investments may make it difficult for us to sell such investments if the need arises. In addition, if we are required to liquidate all or a portion of our portfolio quickly, we may realize significantly less than the value at which we have previously recorded our investments. In addition, we may face other restrictions on our ability to liquidate an investment in a portfolio company to the extent that we have material non-public information regarding such portfolio company.
Price declines and illiquidity in the corporate debt markets may adversely affect the fair value of our portfolio investments, reducing our net asset value through increased net unrealized depreciation.
As a business development company, we are required to carry our investments at market value or, if no market value is ascertainable, at fair value as determined in good faith by our board of directors under our valuation policy and process. As part of the valuation process, we may take into account the following types of factors, if relevant, in determining the fair value of our investments:
| • | a comparison of the portfolio company’s securities to publicly traded securities; |
| • | the enterprise value of the portfolio company; |
| • | the nature and realizable value of any collateral; |
| • | the portfolio company’s ability to make payments and its earnings; |
| • | the markets in which the portfolio company does business; and |
| • | changes in the interest rate environment and the credit markets generally that may affect the price at which similar investments may be made in the future and other relevant factors. |
When an external event such as a purchase transaction, public offering or subsequent equity sale occurs, we use the pricing indicated by the external event to corroborate our valuation. We record decreases in the market values or fair values of our investments as unrealized depreciation. Declines in prices and liquidity in the corporate debt markets may result in significant net unrealized depreciation in our portfolio. The effect of all of these factors on our portfolio may reduce our net asset value by increasing net unrealized depreciation in our portfolio. Depending on market conditions, we could incur substantial realized losses and may suffer additional unrealized losses in future periods, which could have a material adverse effect on our business, financial condition, results of operations and cash flows.
| 43 |
We may experience fluctuations in our quarterly results.
We could experience fluctuations in our quarterly operating results due to a number of factors, including the interest rate payable on the debt securities and loans we acquire, the default rate on such securities, the level of our expenses, variations in, and the timing of the recognition of, realized and unrealized gains or losses, the degree to which we encounter competition in our markets and general economic conditions. As a result of these factors, results for any period should not be relied upon as being indicative of performance in future periods.
Changes in laws or regulations governing our operations may adversely affect our business or cause us to alter our business strategy.
We and our portfolio companies are subject to regulation at the local, state and federal level. We are also subject to federal, state and local laws and regulations and are subject to judicial and administrative decisions that affect our operations, including maximum interest rates, fees and other charges, disclosures to portfolio companies, the terms of secured transactions, collection and foreclosure proceedings and other trade practices. If these laws, regulations or decisions change, or if we expand our business into additional jurisdictions, we may have to incur significant expenses in order to comply or we might have to restrict our operations. New legislation may be enacted or new interpretations, rulings or regulations could be adopted, including those governing the types of investments we or our portfolio companies are permitted to make, any of which could harm us and our stockholders, potentially with retroactive effect.
In particular, the scope of the Dodd-Frank Wall Street Reform and Consumer Protection Act, or the Dodd-Frank Act, impacts many aspects of the financial services industry, and it requires the development and adoption of many implementing regulations over the next several years. The effects of the Dodd-Frank Act on the financial services industry will depend, in large part, upon the extent to which regulators exercise the authority granted to them and the approaches taken in implementing regulations. While the impact of the Dodd-Frank Act on us and our portfolio companies is subject to continuing uncertainty, the Dodd-Frank Act, including future rules implementing its provisions and the interpretation of those rules, along with other legislative and regulatory proposals directed at the financial services industry or affecting taxation that are proposed or pending in the U.S. Congress, may negatively impact the operations, cash flows or financial condition of us or our portfolio companies, impose additional costs on us or our portfolio companies, intensify the regulatory supervision of us or our portfolio companies or otherwise adversely affect our business or the business of our portfolio companies. In addition, uncertainty regarding legislation and regulations affecting the financial services industry or taxation could also adversely impact our business or the business of our portfolio companies. If we do not comply with applicable laws and regulations, we could lose any licenses that we then hold for the conduct of our business and may be subject to civil fines and criminal penalties.
Additionally, changes to or repeal of the laws and regulations governing our operations related to permitted investments may cause us to alter our investment strategy in order to avail ourselves of new or different opportunities. Such changes could result in material differences to the strategies and plans set forth in this Annual Report on Form 10-K and may shift our investment focus from the areas of expertise of our Investment Adviser to other types of investments in which our Investment Adviser may have little or no expertise or experience. Any such changes, if they occur, could have a material adverse effect on our results of operations and the value of your investment.
We may expose ourselves to risks if we engage in hedging transactions.
We may engage in currency or interest rate hedging transactions to the extent such transactions are permitted under the 1940 Act and applicable commodities law. If we engage in hedging transactions, we may expose ourselves to risks associated with such transactions, including the risk of counterparty default. In this regard, we may utilize instruments such as futures, forward contracts, currency options and interest rate swaps, caps, collars and floors to seek to hedge against fluctuations in the relative values of our portfolio positions from changes in currency exchange rates and market interest rates. Hedging against a decline in the values of our portfolio positions does not eliminate the possibility of fluctuations in the values of such positions or prevent losses if the values of such positions decline. However, such hedging can establish other positions designed to gain from those same developments, thereby offsetting the decline in the value of such portfolio positions. Such hedging transactions may also limit the opportunity for us to realize a gain on a net basis if the values of the underlying portfolio positions should increase. Moreover, it may not be possible to hedge against an exchange rate or interest rate fluctuation that is so generally anticipated that we are not able to enter into a hedging transaction at an acceptable price.
| 44 |
Currently, we do not hold any securities denominated in foreign currencies and do not hedge any foreign currency exposure. While we may enter into transactions to seek to reduce currency exchange rate and interest rate risks, unanticipated changes in currency exchange rates or interest rates or counterparty default may result in poorer overall investment performance than if we had not engaged in any hedging transactions. In addition, the degree of correlation between price movements of the instruments used in a hedging strategy and price movements in the portfolio positions being hedged may vary. Moreover, for a variety of reasons, we may not seek or be able to establish a perfect correlation between such hedging instruments and the portfolio holdings being hedged. Any such imperfect correlation may prevent us from achieving the intended hedge position and expose us to risk of loss. In addition, it may not be possible to hedge fully or perfectly against currency fluctuations affecting the value of securities denominated in non-U.S. currencies because the value of those securities may also fluctuate as a result of factors not related to currency fluctuations.
Our board of directors may change our investment objective, operating policies and strategies without prior notice or stockholder approval.
Our board of directors has the authority to modify or waive certain of our operating policies and strategies without prior notice and without stockholder approval (except as required by the 1940 Act). However, absent stockholder approval, we may not change the nature of our business so as to cease to be, or withdraw our election as, a business development company. We cannot predict the effect any changes to our current operating policies and strategies would have on our business, operating results and value of our stock. Nevertheless, the effects of any such changes may adversely affect our business and impact our ability to make distributions.
We are highly dependent on information systems and systems failures or attacks could significantly disrupt our business, which may, in turn, negatively affect the market price of our common stock and our ability to pay dividends and other distributions.
We are highly dependent on the communications and information systems of our Investment Adviser and its affiliates as well as certain third-party service providers. As our reliance on these systems has increased, so have the risks posed to these communications and information systems. Any failure or interruption in these systems could cause disruptions in our activities. In addition, these systems are subject to potential attacks, including through adverse events that threaten the confidentiality, integrity or availability of our information resources. These attacks, which may include cyber incidents, may involve a third party gaining unauthorized access to our communications or information systems for purposes of misappropriating assets, stealing confidential information, corrupting data or causing operational disruption. Any such attack could result in disruption to our business, misstated or unreliable financial data, liability for stolen assets or information, increased cybersecurity protection and insurance costs, litigation and damage to our business relationships, any of which could have a material adverse effect on our operating results, the market price of our securities and our ability to pay dividends and other distributions to our securityholders.
We and our Investment Adviser could be the target of litigation.
We or our Investment Adviser could become the target of securities class action litigation or other similar claims if our stock price fluctuates significantly or for other reasons. The outcome of any such proceedings could have a material adverse effect on our business, financial condition, and/or operating results and could continue without resolution for long periods of time. Any litigation or other similar claims could consume substantial amounts of our management’s time and attention, and that time and attention and the devotion of associated resources could, at times, be disproportionate to the amounts at stake. Litigation and other claims are subject to inherent uncertainties, and a material adverse impact on our financial statements could occur for the period in which the effect of an unfavorable final outcome in litigation or other similar claims becomes probable and reasonably estimable. In addition, we could incur expenses associated with defending ourselves against litigation and other similar claims, and these expenses could be material to our earnings in future periods.
Risks Related to our Investments
Our investments may be risky, and you could lose all or part of your investment.
We invest primarily in (1) first lien senior secured loans, (2) second lien senior secured loans, (3) “one-stop” senior secured or “unitranche” loans, (4) subordinated or mezzanine loans, (5) unsecured consumer loans and (6), to a lesser extent, selected equity co-investments in middle-market companies.
| 45 |
Secured Loans. When we extend first lien senior secured, second lien senior secured and unitranche loans, we generally take a security interest in the available assets of these portfolio companies, including the equity interests of their subsidiaries. We expect this security interest to help mitigate the risk that we will not be repaid. However, there is a risk that the collateral securing our loans may decrease in value over time, may be difficult to sell in a timely manner, may be difficult to appraise and may fluctuate in value based upon the success of the business and market conditions, including as a result of the inability of the portfolio company to raise additional capital. Also, in the case of first lien senior secured loans, our lien may be subordinated to claims of other creditors and, in the case of second lien senior secured loans, our lien will be subordinated to claims of certain other creditors. In addition, deterioration in a portfolio company’s financial condition and prospects, including its inability to raise additional capital, may be accompanied by deterioration in the value of the collateral for the loan. Consequently, the fact that a loan is secured does not guarantee that we will receive principal and interest payments according to the loan’s terms, or at all, or that we will be able to collect on the loan should we be forced to enforce our remedies.
Mezzanine Loans. Our mezzanine investments generally are subordinated to senior loans and will generally be unsecured. This may result in an above average amount of risk and volatility or a loss of principal. These investments may involve additional risks that could adversely affect our investment returns. To the extent interest payments associated with such debt are deferred, such debt may be subject to greater fluctuations in valuations, and such debt could subject us and our stockholders to non-cash income as described above under “ — We may have difficulty paying our required distributions if we recognize income before or without receiving cash representing such income.” Since we will not receive any substantial repayments of principal prior to the maturity of our mezzanine debt investments, such investments are riskier than amortizing loans.
Unsecured Consumer Loans. Our consumer loans are unsecured. This may result in an above average amount of risk and volatility or a loss of principal. These investments may involve additional risks that could adversely affect our investment returns. See “ — We are subject to risks associated with unsecured consumer loans.”
Equity Investments. We may make selected equity investments. In addition, when we invest in first lien, second lien, unitranche or mezzanine loans, we may acquire warrants to purchase equity securities. Our goal is ultimately to dispose of these equity interests and realize gains upon our disposition of such interests. However, the equity interests we receive may not appreciate in value and, in fact, may decline in value. Accordingly, we may not be able to realize gains from our equity interests, and any gains that we do realize on the disposition of any equity interests may not be sufficient to offset any other losses we experience.
We are subject to risks associated with middle-market companies.
Investing in middle-market companies involves a number of significant risks, including:
| • | these companies may have limited financial resources and may be unable to meet their obligations under their debt securities that we hold, which may be accompanied by a deterioration in the value of any collateral and a reduction in the likelihood of us realizing any guarantees we may have obtained in connection with our investment; |
| • | they typically have shorter operating histories, narrower product lines and smaller market shares than larger businesses, which tend to render them more vulnerable to competitors’ actions and changing market conditions, as well as general economic downturns; |
| • | they are more likely to depend on the management talents and efforts of a small group of persons; therefore, the death, disability, resignation or termination of one or more of these persons could have a material adverse impact on our portfolio company and, in turn, on us; |
| • | generally little public information exists about these companies, and we are required to rely on our Investment Adviser to obtain adequate information to evaluate the potential returns from investing in these companies; |
| • | they generally have less predictable operating results, may from time to time be parties to litigation, may be engaged in rapidly changing businesses with products subject to a substantial risk of obsolescence, and may require substantial additional capital to support their operations, finance expansion or maintain their competitive position. In addition, our executive officers, directors and our Investment Adviser may, in the ordinary course of business, be named as defendants in litigation arising from our investments in the portfolio companies; and |
| 46 |
| • | they may have difficulty accessing the capital markets to meet future capital needs, which may limit their ability to grow or to repay their outstanding indebtedness upon maturity. |
We are a non-diversified investment company within the meaning of the 1940 Act, and therefore we are not limited with respect to the proportion of our assets that may be invested in securities of a single issuer.
We are classified as a non-diversified investment company within the meaning of the 1940 Act, which means that we are not limited by the 1940 Act with respect to the proportion of our assets that we may invest in securities of a single issuer. To the extent that we assume large positions in the securities of a small number of issuers, our net asset value may fluctuate to a greater extent than that of a diversified investment company as a result of changes in the financial condition or the market’s assessment of the issuer. We may also be more susceptible to any single economic or regulatory occurrence than a diversified investment company. Beyond the asset diversification requirements associated with our qualification as a RIC under the Code and the requirements under the documents governing the CLOs, we do not have fixed guidelines for diversification, and our investments could be concentrated in relatively few portfolio companies.
Our portfolio may be concentrated in a limited number of portfolio companies and industries, which would subject us to a risk of significant loss if any of these companies defaults on its obligations under any of its debt instruments or if there is a downturn in a particular industry.
Our portfolio may be concentrated in a limited number of portfolio companies and industries. As a result, the aggregate returns we realize may be significantly and adversely affected if a small number of investments perform poorly or if we need to write down the value of any one investment. Additionally, while we are not targeting any specific industries, our investments may be concentrated in relatively few industries. As a result, a downturn in any particular industry in which we are invested could also significantly impact the aggregate returns we realize. As of December 31, 2016, the largest industry concentrations in our portfolio were Miscellaneous Manufacturing, Miscellaneous Retail and Health Services, which represented 18.2%, 11.1% and 9.3%, respectively, of our portfolio at fair value.
We may hold the debt securities and loans of leveraged companies that may, due to the significant volatility of such companies, enter into bankruptcy proceedings.
Leveraged companies may experience bankruptcy or similar financial distress. The bankruptcy process has a number of significant inherent risks. Many events in a bankruptcy proceeding are the product of contested matters and adversary proceedings and are beyond the control of the creditors. A bankruptcy filing by a portfolio company may adversely and permanently affect such portfolio company. If the proceeding is converted to a liquidation, the value of the issuer may not equal the liquidation value that was believed to exist at the time of our investment. The duration of a bankruptcy proceeding is also difficult to predict, and a creditor’s return on investment can be adversely affected by delays until a plan of reorganization or liquidation ultimately becomes effective. The administrative costs in connection with a bankruptcy proceeding are frequently high and would be paid out of the debtor’s estate prior to any return to creditors. Because the standards for classification of claims under bankruptcy law are vague, our influence with respect to the class of securities or other obligations we own may be lost by increases in the number and amount of claims in the same class or by different classification and treatment. In the early stages of the bankruptcy process, it is often difficult to estimate the extent of, or even to identify, any contingent claims that might be made. In addition, certain claims that have priority by law (for example, claims for taxes) may be substantial, eroding the value of any recovery by holders of other securities of the bankrupt entity.
Depending on the facts and circumstances of our investments and the extent of our involvement in the management of a portfolio company, upon the bankruptcy of a portfolio company, a bankruptcy court may recharacterize our debt investments as equity interests and subordinate all or a portion of our claim to that of other creditors. This could occur even though we may have structured our investment as senior debt.
| 47 |
Our portfolio companies may experience financial distress, and our investments in such portfolio companies may be restructured.
Our portfolio companies may experience financial distress from time to time. The debt investments of these companies may not produce income, may require us to bear certain expenses to protect our investment and may subject us to uncertainty as to when, in what manner and for what value such distressed debt will eventually be satisfied, including through liquidation, reorganization or bankruptcy. If an exchange offer is made or plan of reorganization is adopted with respect to the debt securities we currently hold, there can be no assurance that the securities or other assets received by us in connection with such exchange offer or plan of reorganization will have a value or income potential similar to what we anticipated when our original investment was made or even at the time of restructuring. Any restructuring could alter, reduce or delay the payment of interest or principal on the investment, which could delay or reduce the amount of payments made to us. In addition, we may receive equity securities in exchange for the debt investment that we currently hold, which may require significantly more of our management’s time and attention or carry restrictions on their disposition.
Our portfolio companies may be unable to repay or refinance outstanding principal on their loans at or prior to maturity, and rising interests rates may make it more difficult for portfolio companies to make periodic payments on their loans.
Our portfolio companies may be unable to repay or refinance outstanding principal on their loans at or prior to maturity. This risk and the risk of default is increased to the extent that the loan documents do not require the portfolio companies to pay down the outstanding principal of such debt prior to maturity. In addition, if general interest rates rise, there is a risk that our portfolio companies will be unable to pay escalating interest amounts, which could result in a default under their loan documents with us. Rising interest rates could also cause portfolio companies to shift cash from other productive uses to the payment of interest, which may have a material adverse effect on their business and operations and could, over time, lead to increased defaults. Any failure of one or more portfolio companies to repay or refinance its debt at or prior to maturity or the inability of one or more portfolio companies to make ongoing payments following an increase in contractual interest rates could have a material adverse effect on our business, financial condition, results of operations and cash flows.
Economic recessions or downturns could impair our portfolio companies and harm our operating results.
Many of our portfolio companies may be susceptible to economic slowdowns or recessions and may be unable to repay our loans during these periods. Therefore, our non-performing assets are likely to increase and the value of our portfolio is likely to decrease during these periods. Adverse economic conditions may decrease the value of collateral securing some of our loans and the value of our equity investments. Economic slowdowns or recessions could lead to financial losses in our portfolio and a decrease in revenues, net income and assets. Unfavorable economic conditions also could increase our funding costs, limit our access to the capital markets or result in a decision by lenders not to extend credit to us. These events could prevent us from increasing our investments and harm our operating results, which could have an adverse effect on our financial condition.
A portfolio company’s failure to satisfy financial or operating covenants imposed by us or other lenders could lead to defaults and, potentially, termination of its loans and foreclosure on its assets, which could trigger cross-defaults under other agreements and jeopardize our portfolio company’s ability to meet its obligations under the debt securities that we hold. We may incur expenses to the extent necessary to seek recovery upon default or to negotiate new terms with a defaulting portfolio company. In addition, lenders in certain cases can be subject to lender liability claims for actions taken by them when they become too involved in the borrower’s business or exercise control over a borrower. It is possible that we could become subject to a lender’s liability claim, including as a result of actions taken if we render significant managerial assistance to the borrower. Furthermore, if one of our portfolio companies were to file for bankruptcy protection, even though we may have structured our investment as senior secured debt, depending on the facts and circumstances, including the extent to which we provided managerial assistance to that portfolio company, a bankruptcy court might re-characterize our debt holding and subordinate all or a portion of our claim to claims of other creditors.
We may be subject to risks associated with syndicated loans.
Under the documentation for syndicated loans, a financial institution or other entity typically is designated as the administrative agent and/or collateral agent. This agent is granted a lien on any collateral on behalf of the other lenders and distributes payments on the indebtedness as they are received. The agent is the party responsible for administering and enforcing the loan and generally may take actions only in accordance with the instructions of a majority or two-thirds in commitments and/or principal amount of the associated indebtedness. In most cases, we do not expect to hold a sufficient amount of the indebtedness to be able to compel any actions by the agent. Consequently, we would only be able to direct such actions if instructions from us were made in conjunction with other holders of associated indebtedness that together with us compose the requisite percentage of the related indebtedness then entitled to take action. Conversely, if holders of the required amount of the associated indebtedness other than us desire to take certain actions, such actions may be taken even if we did not support such actions. Furthermore, if an investment is subordinated to one or more senior loans made to the applicable obligor, our ability to exercise such rights may be subordinated to the exercise of such rights by the senior lenders. Accordingly, we may be precluded from directing such actions unless we act together with other holders of the indebtedness. If we are unable to direct such actions, we cannot assure you that the actions taken will be in our best interests.
| 48 |
If an investment is a syndicated revolving loan or delayed drawdown loan, other lenders may fail to satisfy their full contractual funding commitments for such loan, which could create a breach of contract, result in a lawsuit by the obligor against the lenders and adversely affect the fair market value of our investment.
There is a risk that a loan agent may become bankrupt or insolvent. Such an event would delay, and possibly impair, any enforcement actions undertaken by holders of the associated indebtedness, including attempts to realize upon the collateral securing the associated indebtedness and/or direct the agent to take actions against the related obligor or the collateral securing the associated indebtedness and actions to realize on proceeds of payments made by obligors that are in the possession or control of any other financial institution. In addition, we may be unable to remove the agent in circumstances in which removal would be in our best interests. Moreover, agented loans typically allow for the agent to resign with certain advance notice.
We are subject to risks associated with unsecured consumer loans.
Investing in unsecured consumer loans involves a number of significant risks, including those set forth below.
Unsecured consumer loans are not secured by any collateral or guaranteed or insured by any third party, and we must rely on our third party servicer(s) to pursue collection against any borrower.
Unsecured consumer loans are unsecured obligations and are not guaranteed or insured by any third party or backed by any governmental authority in any way. We must rely on our third party servicer(s) to pursue collection against any borrower if an event of default occurs.
We may acquire consumer loans from borrowers who have tarnished credit ratings or limited credit history, are considered higher than average credit risks, and may present a higher risk of loan delinquency or default.
We may acquire consumer loans from borrowers who have below prime or tarnished credit ratings, which is traditionally defined as a FICO score below 640 or limited credit history. Loans may be offered to such borrowers when there is reason to believe that the risk profile of such loans is such that their loss rates fall within the loss rate range expected under the current underwriting policies. However, these borrowers still may present a higher risk of loan delinquency or default than prime borrowers.
We do not have significant historical performance data about performance on the consumer loans. Loss rates on the consumer loans may increase.
Consumer lending platforms from which we may acquire unsecured consumer loans are evolving quickly and may have limited operating histories or limited histories of operating at their current scales. The performance of consumer loans purchased to date may not be indicative of the future performance of consumer loans. Due to the limited operational history of consumer lending platforms, we do not have significant historical data regarding the performance of the consumer loans, and we do not yet know what our long-term loan loss experience will be.
Loss rates on the consumer loans may increase as a result of economic conditions beyond our control and beyond the control of the borrower.
Borrower loan loss rates may be significantly affected by economic downturns or general economic conditions beyond our control and beyond the control of individual borrowers. In particular, loss rates on consumer loans may increase due to factors such as prevailing interest rates, the rate of unemployment, the level of consumer confidence, residential real estate values, the value of the U.S. dollar, energy prices, changes in consumer spending, the number of personal bankruptcies, disruptions in the credit markets and other factors.
| 49 |
Our failure to make follow-on investments in our portfolio companies could impair the value of our portfolio, and our ability to make follow-on investments in certain portfolio companies may be restricted.
Following an initial investment in a portfolio company, we may make additional investments in that portfolio company as “follow-on” investments, in order to:
| • | increase or maintain in whole or in part our equity ownership percentage; |
| • | exercise warrants, options or convertible securities that were acquired in the original or subsequent financing; or |
| • | attempt to preserve or enhance the value of our investment. |
We have the discretion to make any follow-on investments, subject to the availability of capital resources, the limitations of the 1940 Act and the requirements associated with our status as a RIC. We may elect not to make follow-on investments or otherwise lack sufficient funds to make those investments. The failure to make follow-on investments may, in some circumstances, jeopardize the continued viability of a portfolio company and our initial investment, or may result in a missed opportunity for us to increase our participation in a successful portfolio company. Even if we have sufficient capital to make a desired follow-on investment, we may elect not to make a follow-on investment because we do not want to increase our exposure to the portfolio company, because we prefer other opportunities or because we are inhibited by compliance with business development company requirements or the desire to maintain our tax status.
Because we generally do not hold controlling equity interests in our portfolio companies, we will not be in a position to exercise control over our portfolio companies or to prevent decisions by management of our portfolio companies that could decrease the value of our investments.
We do not currently anticipate taking controlling equity positions in our portfolio companies. In addition, we may not be in a position to control any portfolio company by investing in its debt securities or loans. As a result, we are subject to the risk that a portfolio company may make business decisions with which we disagree, and the stockholders and management of a portfolio company may take risks or otherwise act in ways that are adverse to our interests. Due to the lack of liquidity for the debt and equity investments that we typically hold in our portfolio companies, we may not be able to dispose of our investments in the event we disagree with the actions of a portfolio company, and we may therefore suffer a decrease in the value of our investments.
Defaults by our portfolio companies will harm our operating results.
A portfolio company’s failure to satisfy financial or operating covenants imposed by us or other lenders could lead to defaults and, potentially, termination of its loans and foreclosure on its assets. This could trigger cross-defaults under other agreements and jeopardize such portfolio company’s ability to meet its obligations under the debt or equity securities that we hold. We may incur expenses to the extent necessary to seek recovery upon default or to negotiate new terms, which may include the waiver of certain financial covenants, with a defaulting portfolio company.
Our portfolio companies may incur debt that ranks equally with, or senior to, our investments in such companies.
We generally intend to invest a portion of our capital in first lien, second lien and unitranche loans and, to a lesser extent, mezzanine loans and equity securities of U.S. middle-market companies. The portfolio companies usually have, or may be permitted to incur, other debt that ranks equally with, or senior to, the debt securities in which we invest. By their terms, such debt instruments may provide that the holders are entitled to receive payment of interest or principal on or before the dates on which we are entitled to receive payments in respect of the debt securities in which we invest. Also, in the event of insolvency, liquidation, dissolution, reorganization or bankruptcy of a portfolio company, holders of debt instruments ranking senior to our investment in that portfolio company would typically be entitled to receive payment in full before we receive any distribution in respect of our investment. After repaying senior creditors, the portfolio company may not have sufficient assets to use for repaying its obligation to us in full, or at all. In the case of debt ranking equally with debt securities in which we invest, we would have to share any distributions on an equal and ratable basis with other creditors holding such debt in the event of an insolvency, liquidation, dissolution, reorganization or bankruptcy of the relevant portfolio company.
| 50 |
Additionally, certain loans that we make to portfolio companies may be secured on a second-priority basis by the same collateral securing senior secured debt of such companies. The first-priority liens on the collateral secure the portfolio company’s obligations under any outstanding senior debt and may secure certain other future debt that may be permitted to be incurred by the portfolio company under the agreements governing the loans. The holders of obligations secured by first-priority liens on the collateral will generally control the liquidation of, and be entitled to receive proceeds from, any realization of the collateral to repay their obligations in full before us.
In addition, the value of the collateral in the event of liquidation depends on market and economic conditions, the availability of buyers and other factors. There can be no assurances that the proceeds, if any, from sales of all of the collateral would be sufficient to satisfy the loan obligations secured by the second-priority liens after payment in full of all obligations secured by the first-priority liens on the collateral. If such proceeds were not sufficient to repay amounts outstanding under the loan obligations secured by the second-priority liens, then we, to the extent not repaid from the proceeds of the sale of the collateral, only have an unsecured claim against the portfolio company’s remaining assets, if any.
The rights we may have with respect to the collateral securing the loans we make to our portfolio companies with senior debt outstanding may also be limited pursuant to the terms of one or more intercreditor agreements that we enter into with the holders of such senior debt. Under a typical intercreditor agreement, at any time that obligations that have the benefit of the first-priority liens are outstanding, any of the following actions that may be taken in respect of the collateral will be at the direction of the holders of the obligations secured by the first-priority liens:
| • | the ability to cause the commencement of enforcement proceedings against the collateral; |
| • | the ability to control the conduct of such proceedings; |
| • | the approval of amendments to collateral documents; |
| • | releases of liens on the collateral; and |
| • | waivers of past defaults under collateral documents. |
We may not have the ability to control or direct such actions, even if our rights are adversely affected.
We may also make unsecured loans to portfolio companies, meaning that such loans will not benefit from any security interest over the assets of such companies. Liens on such portfolio companies’ assets, if any, will secure the portfolio company’s obligations under its outstanding secured debt and may secure certain future debt that is permitted to be incurred by the portfolio company under its secured loan agreements. The holders of obligations secured by such liens will generally control the liquidation of, and be entitled to receive proceeds from, any realization of such collateral to repay their obligations in full before us. In addition, the value of such collateral in the event of liquidation will depend on market and economic conditions, the availability of buyers and other factors. There can be no assurance that the proceeds, if any, from sales of such collateral would be sufficient to satisfy our unsecured obligations after payment in full of all secured loan obligations. If such proceeds were not sufficient to repay the outstanding secured loan obligations, then our unsecured claims would rank equally with the unpaid portion of such secured creditors’ claims against the portfolio company’s remaining assets, if any.
| 51 |
Our portfolio companies may prepay loans, which prepayment may reduce our yields if capital returned cannot be invested in transactions with equal or greater expected yields.
The loans in our investment portfolio generally are prepayable at any time, some of which have no premium to par. It is not clear at this time when each loan may be prepaid. Whether a loan is prepaid will depend both on the continued positive performance of the portfolio company and the existence of favorable financing market conditions that allow such company the ability to replace existing financing with less expensive capital. As market conditions change frequently, it is unknown when, and if, this may be possible for each portfolio company. In the case of some of these loans, having the loan prepaid may reduce the achievable yield for us if the capital returned cannot be invested in transactions with equal or greater expected yields, which could have a material adverse effect on our business, financial condition and results of operations.
The disposition of our investments may result in contingent liabilities.
A significant portion of our investments involve private securities. In connection with the disposition of an investment in private securities, we may be required to make representations about the business and financial affairs of the portfolio company typical of those made in connection with the sale of a business. We may also be required to indemnify the purchasers of such investment to the extent that any such representations turn out to be inaccurate or with respect to certain potential liabilities. These arrangements may result in contingent liabilities that ultimately yield funding obligations that must be satisfied through our return of certain distributions previously made to us.
| 52 |
Investments in securities of foreign companies, if any, may involve significant risks in addition to the risks inherent in U.S. investments.
We may make investments in securities of foreign companies. Investing in foreign companies may expose us to additional risks not typically associated with investing in U.S. companies. These risks include changes in exchange control regulations, political and social instability, expropriation, imposition of foreign taxes, less liquid markets and less available information than is generally the case in the United States, higher transaction costs, less government supervision of exchanges, brokers and issuers, less developed bankruptcy laws, difficulty in enforcing contractual obligations, lack of uniform accounting and auditing standards and greater price volatility.
In addition, any investments that we make that are denominated in a foreign currency will be subject to the risk that the value of a particular currency will change in relation to one or more other currencies. Among the factors that may affect currency values are trade balances, the level of short-term interest rates, differences in relative values of similar assets in different currencies, long-term opportunities for investment and capital appreciation, and political developments. We may employ hedging techniques to minimize these risks, but we cannot assure you that we will, in fact, hedge currency risk, or, that if we do, such strategies will be effective.
We incur significant costs as a result of being a publicly traded company.
As a publicly traded company, we incur legal, accounting and other expenses, including costs associated with the periodic reporting requirements applicable to a company whose securities are registered under the Exchange Act as well as additional corporate governance requirements, including requirements under the Sarbanes-Oxley Act and other rules implemented by the SEC and of NASDAQ Global Select Market.
We are an “emerging growth company,” and we do not know if such status will make our common stock less attractive to investors.
We currently are an “emerging growth company,” as defined in the JOBS Act until the earliest of:
| • | the last day of our fiscal year ending December 31, 2018; |
| • | the last day of the fiscal year in which our total annual gross revenues first exceed $1.0 billion; |
| • | the date on which we have, during the prior three-year period, issued more than $1.0 billion in non-convertible debt; and |
| • | the last day of a fiscal year in which we (1) have an aggregate worldwide market value of our common stock held by non-affiliates of $700.0 million or more, computed at the end of each fiscal year as of the last business day of our most recently completed second fiscal quarter, and (2) have been an Exchange Act reporting company for at least one year (and filed at least one annual report under the Exchange Act). |
We are taking advantage of some of the reduced regulatory and disclosure requirements permitted by the JOBS Act and, as a result, some investors may consider our common stock less attractive, which could reduce the market value of our common stock. For example, while we are an emerging growth company, we are taking advantage of exemption from the provisions of Section 404(b) of the Sarbanes-Oxley Act requiring that our independent registered public accounting firm provide an attestation report on the effectiveness of our internal control over financial reporting. This may increase the risk that material weaknesses or other deficiencies in our internal control over financial reporting go undetected. See “Business — Regulation — JOBS Act.”
Our compliance with Section 404 of the Sarbanes-Oxley Act involves significant expenditures, and non-compliance with Section 404 of the Sarbanes-Oxley Act may adversely affect us and the market price of our common stock.
Under current SEC rules, we are required to report on our internal control over financial reporting pursuant to Section 404 of the Sarbanes-Oxley Act and related rules and regulations of the SEC and, under the JOBS Act, beginning with the first fiscal year in which we no longer qualify as an emerging growth company, our independent registered public accounting firm must audit this report. We are required to review on an annual basis our internal control over financial reporting, and on a quarterly and annual basis to evaluate and disclose changes in our internal control over financial reporting.
| 53 |
As a result, we incur additional expenses that may negatively impact our financial performance and our ability to make distributions. This process also diverts management’s time and attention. We cannot ensure that the evaluation process is effective or that our internal control over financial reporting will be effective. In the event that we are unable to maintain compliance with Section 404 of the Sarbanes-Oxley Act and related rules, we and the market price of our common stock may be adversely affected.
Risks Relating to Our Common Stock
Investing in our common stock may involve an above average degree of risk.
The investments we make in accordance with our investment objective may result in a higher amount of risk than alternative investment options and a higher risk of volatility or loss of principal. Our investments in portfolio companies involve higher levels of risk, and therefore, an investment in our shares may not be suitable for someone with lower risk tolerance.
Shares of closed-end investment companies, including business development companies, often trade at a discount to their net asset value.
Shares of closed-end investment companies, including business development companies, may trade at a discount from net asset value. This characteristic of closed-end investment companies and business development companies is separate and distinct from the risk that our net asset value per share may decline. We cannot predict whether our common stock will trade at, above or below net asset value.
There is a risk that investors in our equity securities may not receive distributions or that our distributions may not grow over time and a portion of our distributions may be a return of capital.
We intend to make distributions on a quarterly basis to our stockholders out of assets legally available for distribution. We cannot assure you that we will achieve investment results that will allow us to make a specified level of cash distributions or year-to-year increases in cash distributions. Our ability to pay distributions might be adversely affected by the impact of one or more of the risk factors described in this Annual Report on Form 10-K. Due to the asset coverage test applicable to us under the 1940 Act as a business development company, we may be limited in our ability to make distributions. If we declare a distribution and if more stockholders opt to receive cash distributions rather than participate in our dividend reinvestment plan, we may be forced to sell some of our investments in order to make cash distribution payments.
The market price of our securities may fluctuate significantly.
The market price and liquidity of the market for our securities may be significantly affected by numerous factors, some of which are beyond our control and may not be directly related to our operating performance. These factors include:
| • | significant volatility in the market price and trading volume of securities of business development companies or other companies in our sector, which are not necessarily related to the operating performance of the companies; |
| • | changes in, or uncertainty regarding, regulatory policies, accounting pronouncements or tax guidelines, particularly with respect to RICs and business development companies; |
| • | loss of our qualification as a RIC or business development company; |
| • | changes in earnings or variations in operating results; |
| • | changes in the value of our portfolio investments; |
| 54 |
| • | changes in accounting guidelines governing valuation of our investments; |
| • | any shortfall in revenue or net income or any increase in losses from levels expected by investors or securities analysts; |
| • | departure of Garrison Capital Advisers’ or any of its affiliates’ key personnel; |
| • | operating performance of companies comparable to us; |
| • | general economic trends and other external factors; and |
| • | loss of a major funding source. |
Our stockholders could experience dilution in their ownership percentage if they do not participate in our dividend reinvestment plan.
All distributions declared in cash payable to stockholders that are participants in our dividend reinvestment plan are automatically reinvested in shares of our common stock. As a result, our stockholders that do not participate in our dividend reinvestment plan could experience dilution in their ownership percentage of our common stock over time if we issue additional shares of our common stock.
Sales of substantial amounts of our common stock in the public market may have an adverse effect on the market price of our common stock.
Sales of substantial amounts of our common stock, or the availability of such common stock for sale, could adversely affect the prevailing market prices for our common stock. If this occurs and continues, it could impair our ability to raise additional capital through the sale of securities should we desire to do so.
Provisions of the General Corporation Law of the State of Delaware and our certificate of incorporation and bylaws could deter takeover attempts and have an adverse effect on the price of our common stock and the rights of our common stockholders.
The General Corporation Law of the State of Delaware, or the DGCL, contains provisions that may discourage, delay or make more difficult a change in control of us or the removal of our directors. Our certificate of incorporation and bylaws contain provisions that limit liability and provide for indemnification of our directors and officers. These provisions and others also may have the effect of deterring hostile takeovers or delaying changes in control or management. We are subject to Section 203 of the DGCL, the application of which is subject to any applicable requirements of the 1940 Act. This section generally prohibits us from engaging in mergers and other business combinations with stockholders that beneficially own 15% or more of our voting stock, or with their affiliates, unless our directors or stockholders approve the business combination in the prescribed manner. If our board of directors does not approve a business combination, Section 203 of the DGCL may discourage third parties from trying to acquire control of us and increase the difficulty of consummating such an offer.
We have also adopted measures that may make it difficult for a third party to obtain control of us, including provisions of our certificate of incorporation classifying our board of directors in three classes serving staggered three-year terms, and provisions of our certificate of incorporation authorizing our board of directors to classify or reclassify shares of our preferred stock in one or more classes or series and to cause the issuance of additional shares of our stock. These provisions, as well as other provisions of our certificate of incorporation and bylaws, may delay, defer or prevent a transaction or a change in control that might otherwise be in the best interests of our stockholders. In addition, if we issue preferred stock, such securities would rank “senior” to common stock in our capital structure, resulting in preferred stockholders having separate voting rights, dividend and liquidation rights, and possibly other rights, preferences or privileges more favorable than those granted to holders of our common stock.
Item 1B. Unresolved Staff Comments
None.
Properties
We do not own any real estate or other physical properties materially important to our operation. Our headquarters are located at 1290 Avenue of the Americas, Suite 914, New York, NY 10104 and are provided by Garrison Capital Administrator pursuant to the Administration Agreement. We believe that our office facilities are suitable and adequate to our business.
We, Garrison Capital Advisers, the Administrator and our wholly-owned subsidiaries are not currently subject to any material legal proceedings.
Item 4. Mine Safety Disclosures
Not applicable.
| 55 |
PART II
Item 5. Market for Registrant’s Common Equity, Related Stockholder Matters and Issuer Purchases of Equity Securities
Price Range of Common Stock
Our common stock began trading on March 27, 2013 and is currently traded on The NASDAQ Global Select Market under the symbol “GARS”. The following table lists the high and low closing sale price for our common stock, the high and low closing sale price as a percentage of net asset value, or NAV, and distributions declared per share for each quarter during the years ended December 31, 2016 and December 31, 2015.
| Closing Sales Price | (Discount) Premium of High Sales Price to | (Discount) of Low Sales Price | Distributions | |||||||||||||||||||||
| Period | NAV(1) | High | Low | NAV(2) | to NAV(2) | Declared | ||||||||||||||||||
| Fiscal year ended December 31, 2016 | ||||||||||||||||||||||||
| Fourth quarter | $ | 12.42 | $ | 10.16 | $ | 8.98 | (18.2 | )% | (27.7 | )% | $ | 0.28 | ||||||||||||
| Third quarter | 12.53 | 10.91 | 10.06 | (12.9 | ) | (19.7 | ) | 0.35 | ||||||||||||||||
| Second quarter | 12.94 | 10.72 | 9.67 | (17.2 | ) | (25.3 | ) | 0.35 | ||||||||||||||||
| First quarter | 13.50 | 12.60 | 9.90 | (6.7 | ) | (26.7 | ) | 0.35 | ||||||||||||||||
| Fiscal year ended December 31, 2015 | ||||||||||||||||||||||||
| Fourth quarter | $ | 13.98 | $ | 14.39 | $ | 11.97 | 2.9 | % | (14.4 | )% | $ | 0.35 | ||||||||||||
| Third quarter | 14.92 | 15.39 | 13.42 | 3.2 | (10.1 | ) | 0.35 | |||||||||||||||||
| Second quarter | 15.29 | 15.30 | 14.82 | 0.1 | (3.1 | ) | 0.35 | |||||||||||||||||
| First quarter | 15.41 | 15.29 | 14.07 | (0.8 | ) | (8.7 | ) | 0.35 | ||||||||||||||||
______________
| (1) | NAV per share is determined as of the last day in the relevant quarter and therefore may not reflect the NAV per share on the date of the high and low sales prices. The NAVs shown are based on outstanding shares at the end of the applicable period. |
| (2) | Calculated as of the respective high or low closing sales price divided by the quarter end NAV. |
The last reported price for our common stock on March 3, 2017 was $10.01 per share. As of March 3, 2017, we had 16 stockholders of record. This does not include the number of stockholders that hold shares through banks or broker-dealers.
Issuer Purchases of Equity Securities
The following table provides information regarding our purchases of our common stock for the three months ended December 31, 2016:
| Period | Total Number of Shares Purchased | Average Price Paid per Share | Total Number of Shares Purchased as Part of Publicly Announced Plans or Programs(1) | Approximate Dollar Value of Shares that May Yet Be Purchased Under the Plans or Programs | ||||||||||||
| ($ in thousands, except share and per share amounts) | ||||||||||||||||
| October 1, 2016 through October 31, 2016 | - | - | - | - | ||||||||||||
| November 1, 2016 through November 30, 2016 | - | - | - | - | ||||||||||||
| December 1, 2016 through December 31, 2016 | - | - | - | - | ||||||||||||
| - | $ | - | - | $ | - | |||||||||||
___________________
| (1) | On October 5, 2016, the share repurchase plan expired by its terms. From October 5, 2015 until the plan’s expiration, GARS purchased a total of 709,427 shares at an aggregate purchase price of $8.4 million, and at a 17.14% weighted average discount to net asset value. |
Distributions
Our distributions, if any, are determined by the board of directors. We elected to be treated as a RIC under Subchapter M of the Code. To maintain RIC qualification each taxable year, we must distribute an amount at least equal to 90% of our net ordinary income and net short-term capital gains in excess of our net long-term capital losses, if any. In addition, we are subject to ordinary income and capital gain distribution requirements under U.S. federal excise tax rules for each calendar year. If we do not meet the required distributions we will generally be subject to a 4% nondeductible federal excise tax on the undistributed amount.
| 56 |
The following tables reflect the cash distributions that we have declared on our common stock for the fiscal years ended December 31, 2016 and December 31, 2015.
| Record Dates ($ in thousands except per share data) | Board Approval Date | Payment Date | Distribution Declared | Distribution Declared per Share | ||||||||
| Year Ended December 31, 2016(1) | ||||||||||||
| December 9, 2016 | November 1, 2016 | December 23, 2016 | $ | 4,494 | $ | 0.28 | ||||||
| September 9, 2016 | August 2, 2016 | September 23, 2016 | 5,617 | 0.35 | ||||||||
| June 10, 2016 | May 2, 2016 | June 24, 2016 | 5,655 | 0.35 | ||||||||
| March 8, 2016 | February 24, 2016 | March 28, 2016 | 5,685 | 0.35 | ||||||||
| $ | 21,451 | $ | 1.33 | |||||||||
______________
| (1) | Does not include any return of capital for tax purposes. |
| Record Dates ($ in thousands except per share data) | Board Approval Date | Payment Date | Distribution Declared | Distribution Declared per Share | ||||||||
| Year ended December 31, 2015 (1) | ||||||||||||
| December 11, 2015 | November 2, 2015 | December 28, 2015 | $ | 5,820 | $ | 0.35 | ||||||
| September 10, 2015 | July 30, 2015 | September 25, 2015 | 5,866 | 0.35 | ||||||||
| June 12, 2015 | April 30, 2015 | June 26, 2015 | 5,866 | 0.35 | ||||||||
| March 20, 2015 | March 3, 2015 | March 27, 2015 | 5,866 | 0.35 | ||||||||
| $ | 23,418 | $ | 1.40 | |||||||||
______________
| (1) | Does not include any return of capital for tax purposes. |
On February 28, 2017, our board of directors declared a quarterly distribution of $0.28 per share payable on March 30, 2017 to holders of record as of March 23, 2017.
We have adopted a dividend reinvestment plan that provides for reinvestment of our dividends and other distributions on behalf of our stockholders. As a result, if our board of directors declares a cash dividend or other distribution, then our stockholders who have not “opted out” of our dividend reinvestment plan will have their cash distribution automatically reinvested in additional shares of our common stock, rather than receiving the cash distribution.
| 57 |
Stock Performance Graph
This graph compares the stockholder return on our common stock from March 27, 2013 (IPO) to December 31, 2016 with that of the NASDAQ Financial 100 Stock Index and the Standard & Poor’s 500 Stock Index. This graph assumes that on March 27, 2013, $100 was invested in our common stock, the NASDAQ Financial 100 Stock Index, and the Standard & Poor’s 500 Stock Index. The graph also assumes the reinvestment of all cash dividend distributions prior to any tax effect. The graph and other information furnished under this Part II Item 5 of this Annual Report on Form 10-K shall not be deemed to be “soliciting material” or to be “filed” with the SEC or subject to Regulation 14A or 14C under, or to the liabilities of Section 18 of, the Exchange Act. The stock price performance included in the below graph is not necessarily indicative of future stock performance.
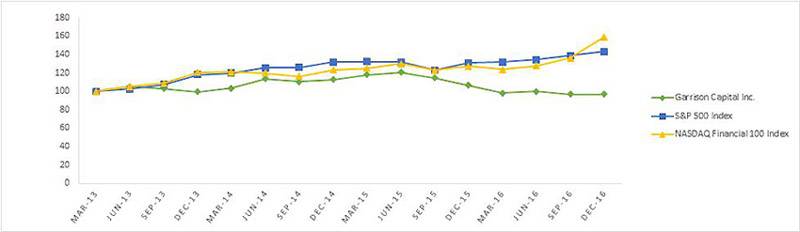
| 58 |
Item 6. Selected Financial Data
The following selected consolidated financial data as of and for the years ended December 31, 2016, 2015 and 2014 are derived from the consolidated financial statements that have been audited by RSM US LLP (formerly McGladrey LLP through October 25, 2015), an independent registered public accounting firm. The following selected consolidated financial data as of and for the years ended December 31, 2013 and December 31, 2012 are derived from the consolidated financial statements that have been audited by our prior independent registered public accounting firm. The audited Consolidated Statements of Financial Condition as of December 31, 2016 and 2015 and the Consolidated Statements of Operations for the years ended December 31, 2016, 2015 and 2014 are included elsewhere in this Form 10-K. The audited Consolidated Statements of Financial Condition as of December 31, 2014, 2013, and 2012 and the Consolidated Statements of Operations for the years ended December 31, 2013 and 2012 are not included in this Form 10-K. Historical results are not necessarily indicative of results for any future period.
The selected consolidated financial data should be read in conjunction with “Item 7. Management’s Discussion and Analysis of Financial Condition and Results of Operations” and our consolidated financial statements and related notes included elsewhere in this Form 10-K:
| Year Ended December 31, | ||||||||||||||||||||
| ($ in thousands except per share/unit data) | 2016 | 2015 | 2014 | 2013 | 2012(3) | |||||||||||||||
| Statement of operations data: | ||||||||||||||||||||
| Total investment income(1) | $ | 42,951 | $ | 51,317 | $ | 50,459 | $ | 33,805 | $ | 23,649 | ||||||||||
| Interest expense | 9,859 | 7,428 | 7,157 | 6,575 | 6,155 | |||||||||||||||
| Management fees (net of waived fees) | 6,972 | 7,755 | 8,065 | 2,510 | 2,277 | |||||||||||||||
| Incentive fees (net of waived fees) | - | 1,135 | 8,409 | 1,099 | - | |||||||||||||||
| Other expenses | 7,035 | 5,055 | 4,819 | 4,286 | 6,895 | |||||||||||||||
| Net investment income | 19,085 | 29,944 | 22,009 | 19,335 | 8,322 | |||||||||||||||
| Net realized (loss)/gain from investments(2) | (30,591 | ) | (11,685 | ) | 10,702 | (11,770 | ) | 3,374 | ||||||||||||
| Net change in unrealized gain/(loss) on investments(2) | 6,696 | (21,919 | ) | (2,227 | ) | 15,935 | (7,322 | ) | ||||||||||||
| Net (decrease)/increase in net assets resulting from operations | (4,810 | ) | (3,660 | ) | 30,484 | 23,500 | 4,374 | |||||||||||||
Basic weighted average common shares outstanding | 16,149,866 | 16,742,531 | 16,758,779 | 10,498,544 | 15,203,166 | |||||||||||||||
| Basic (loss)/earnings per common share/unit | (0.30 | ) | (0.22 | ) | 1.82 | 1.55 | 0.42 | |||||||||||||
| Distributions per share/unit | 1.33 | 1.40 | 1.40 | 1.97 | 0.17 | |||||||||||||||
| Other data*: | ||||||||||||||||||||
| Weighted average yield (4) | 10.9 | % | 10.8 | % | 10.5 | % | 9.8 | % | 9.6 | % | ||||||||||
| Number of portfolio companies at period end | 57 | 66 | 57 | 70 | 49 | |||||||||||||||
| Year Ended December 31, | ||||||||||||||||||||
($ in thousands except per share/unit data) | 2016 | 2015 | 2014 | 2013 | 2012(3) | |||||||||||||||
Statement of financial condition data: | ||||||||||||||||||||
| Investments, fair value (5) | $ | 376,704 | $ | 415,001 | $ | 467,769 | $ | 429,081 | $ | 220,106 | ||||||||||
| Cash | 10,378 | 24,985 | 13,651 | 13,665 | 21,681 | |||||||||||||||
| Restricted cash | 12,568 | 11,833 | 14,260 | 27,965 | 69,902 | |||||||||||||||
| Total assets | 406,547 | 460,301 | 505,842 | 485,080 | 315,989 | |||||||||||||||
| Debt outstanding | 205,112 | 225,649 | 240,259 | 219,419 | 125,000 | |||||||||||||||
| Net assets | 199,408 | 230,710 | 261,103 | 254,081 | 173,669 | |||||||||||||||
| Shares of common stock outstanding | 16,049,352 | 16,507,594 | 16,758,779 | 16,758,779 | 10,498,544 | |||||||||||||||
| Per share/unit data: | ||||||||||||||||||||
| Net asset value per common share/unit | $ | 12.42 | $ | 13.98 | $ | 15.58 | $ | 15.16 | $ | 16.54 | ||||||||||
______________
| (1) | Includes income from affiliate investments of $0.2 million, $0.8 million and $1.2 million for the years ended December 31, 2016, December 31, 2014 and December 31, 2013, respectively. | |
| (2) | Includes net realized gain from affiliate investments of $8.5 million for the year ended December 31, 2014. Includes net change in unrealized gain/(loss) from affiliate investments of $(1.7) million, $(1.8) million and $1.8 million for the years ended December 31, 2016, December 31, 2014 and December 31, 2013, respectively. | |
| (3) | Each of the outstanding units of Garrison Capital LLC was converted into one share of common stock of Garrison Capital Inc. in connection with our conversion to a corporation on October 9, 2012. We subsequently declared a reverse stock split on February 25, 2013, which resulted in the conversion of one share of common stock into 0.9805106 shares of common stock. All amounts related to shares/units and share/unit price have been retroactively restated. As a result, the 10,707,221 shares of common stock issued in our conversion to a corporation have been retroactively restated to 10,498,544 shares. | |
| (4) | Weighted average yield is calculated based on the fair value of the investments and interest expected to be received (excluding investments with a risk rating of 4, unfunded revolvers and equity investments) using the current rate of interest at the balance sheet date to contractual maturity, excluding the effects of future scheduled principal amortizations. | |
| (5) | Includes affiliate investments of $3.1 million and $19.0 million as of December 31, 2016 and December 31, 2013, respectively. There were no affiliated investments as of either December 31, 2015, December 31, 2014 or December 31, 2012. | |
| * | Table excludes positions with a fair value of zero. |
| 59 |
Item 7. Management’s Discussion and Analysis of Financial Condition and Results of Operations
The information contained in this section should be read in conjunction with our audited consolidated financial statements and related notes thereto appearing elsewhere in this Annual Report on Form 10-K.
Forward-Looking Statements
Some of the statements in this Annual Report on Form 10-K constitute forward-looking statements, which relate to future events or our future performance or financial condition. The forward-looking statements contained in this Annual Report on Form 10-K involve risks and uncertainties, including statements as to:
| • | our future operating results; |
| • | changes in political, economic or industry conditions, the interest rate environment or conditions affecting the financial and capital markets, which could result in changes to the value of our assets; |
| • | our business prospects and the prospects of our current and prospective portfolio companies; |
| • | the impact of investments that we expect to make; |
| • | the impact of increased competition; |
| • | our contractual arrangements and relationships with third parties; |
| • | the dependence of our future success on the general economy, including general economic trends, and its impact on the industries in which we invest; |
| • | the ability of our portfolio companies to achieve their objectives; |
| • | the relative and absolute performance of our Investment Adviser, including in identifying suitable investments for us; |
| • | our expected financings and investments; |
| • | the adequacy of our cash resources and working capital; |
| • | our ability to make distributions to our stockholders; |
| • | the effects of applicable legislation and regulations and changes thereto; |
| • | the timing of cash flows, if any, from the operations of our prospective portfolio companies; and |
| • | the impact of future acquisitions and divestitures. |
| 60 |
We use words such as “anticipate,” “believe,” “expect,” “intend,” “may,” “might,” “will,” “should,” “could,” “can,” “would,” “believe,” “estimate,” “anticipate,” “predict,” “potential” and similar words to identify forward-looking statements. Our actual results could differ materially from those projected in the forward-looking statements for any reason, including the factors set forth as “Risk Factors” and elsewhere in this Annual Report on Form 10-K.
We have based the forward-looking statements included in this Annual Report on Form 10-K on information available to us on the date of this report, and we assume no obligation to update any such forward-looking statements. Actual results could differ materially from those anticipated in our forward-looking statements and future results could differ materially from historical performance. Although we undertake no obligation to revise or update any forward-looking statements, whether as a result of new information, future events or otherwise, you are advised to consult any additional disclosures that we may make directly to you or through reports that we in the future may file with the SEC, including Annual Reports on Form 10-K, Quarterly Reports on Form 10-Q and Current Reports on Form 8-K.
You should understand that, under Section 27A(b)(2)(B) of the Securities Act and Section 21E(b)(2)(B) of the Exchange Act, the “safe harbor” provisions of the Private Securities Litigation Reform Act of 1995 do not apply to statements made in connection with this Annual Report on Form 10-K or any periodic reports we file under the Exchange Act.
Overview
We are an externally managed, non-diversified, closed-end management investment company that has elected to be treated as a business development company under the 1940 Act. In addition, for tax purposes, we have elected to be treated as a RIC under Subchapter M of Code and intend to qualify annually for such treatment. Our shares are currently listed on The NASDAQ Global Select Market under the symbol “GARS”.
| 61 |
Our investment objective is to generate current income and capital appreciation by making investments generally in the range of $5.0 million to $25.0 million primarily in debt securities and loans of U.S. based middle-market companies, which we define as those having EBITDA of between $5.0 million and $50.0 million. Our goal is to generate attractive risk-adjusted returns by assembling a broad portfolio of investments.
We invest primarily in (1) first lien senior secured loans, (2) second lien senior secured loans, (3) “one-stop” senior secured or “unitranche” loans, (4) subordinated or mezzanine loans, (5) unsecured consumer loans and (6) to a lesser extent, selected equity co-investments in middle-market companies. We use the term “one-stop” or “unitranche” to refer to a loan that combines characteristics of traditional first lien senior secured loans and second lien or subordinated loans. We use the term “mezzanine” to refer to a loan that ranks senior only to a borrower’s equity securities and ranks junior in right of payment to all of such borrower’s other indebtedness.
We believe that the middle market offers attractive risk-adjusted returns for debt investors. Historically, we believe there has been a persistent scarcity of available capital relative to demand, which, from a lender’s perspective, has generally resulted in more favorable transaction structures, including enhanced covenant protection and increased pricing relative to larger companies. In addition, we believe that middle-market companies traditionally have exhibited lower default rates and improved recoveries compared to larger borrowers and typically offer greater access to key senior managers, which we believe further enhances the attractiveness of lending to this market segment and facilitates due diligence investigations and regular monitoring.
Our investment activities are managed by Garrison Capital Advisers LLC, our Investment Adviser. The six member investment committee of our Investment Adviser is comprised of Joseph Tansey, Brian Chase, Mitch Drucker, Susan George, Robert Chimenti and Joshua Brandt. Our Investment Adviser is responsible for sourcing potential investments, conducting research and diligence on prospective investments and equity sponsors, analyzing investment opportunities, structuring our investments and monitoring our investments and portfolio companies on an ongoing basis. Under the Investment Advisory Agreement, we pay a base management fee and an incentive fee to our Investment Adviser for its services. The Administrator provides certain administrative services and facilities necessary for us to operate, including office facilities and equipment and clerical, bookkeeping and record-keeping services, pursuant to the Administration Agreement. The Administrator oversees our financial reporting and prepares our reports to stockholders and reports required to be filed with the SEC.
The Administrator also manages the determination and publication of our net asset value, the preparation and filing of our tax returns and generally monitors the payment of our expenses and the performance of administrative and professional services rendered to us by others. The Administrator may retain third parties to assist in providing administrative services to us. To the extent that the Administrator outsources any of its functions, we pay the fees associated with such functions on a direct basis without any profit to the Administrator.
As of December 31, 2016, we held investments in 58 portfolio companies with a fair value of $376.7 million, including investments in 41 portfolio companies held through the 2016-2 CLO. The investments held by the 2016-2 CLO as of December 31, 2016 consisted of senior secured loans fair valued at $260.2 million and related indebtedness of $164.3 million. As of that date, the loans held by the 2016-2 CLO (held at fair value), together with cash and other assets held by the 2016-2 CLO, equaled approximately $275.6 million. As of December 31, 2016, our portfolio had an average investment size of approximately $6.2 million, a weighted average yield on debt investments of 10.9% and a weighted average contractual maturity of 37 months.
| 62 |
As of December 31, 2015, we held investments in 67 portfolio companies with a fair value of $415.0 million, including investments in 50 portfolio companies held through the 2013-2 CLO. The investments held by the 2013-2 CLO as of December 31, 2015 consisted of senior secured loans fair valued at $306.6 million and related indebtedness of $194.8 million. As of that date, the loans held by the 2013-2 CLO (held at fair value), together with cash and other assets held by the 2013-2 CLO, equaled approximately $323.5 million. As of December 31, 2015, our portfolio had an average investment size of approximately $6.2 million, a weighted average yield on debt investments of 10.8% and a weighted average contractual maturity of 44 months.
Revenues
We generate revenue in the form of interest earned on the debt investments that we hold and capital gains and distributions, if any, on the equity interests or warrants that we may acquire in portfolio companies. Our debt investments, whether in the form of senior secured, unitranche or mezzanine loans, typically have a term of one to six years and bear interest at a fixed or floating rate. Interest is generally payable quarterly or semiannually, and in some cases, loans may have a PIK feature. The principal amount of the debt securities and any accrued but unpaid interest will generally become due at the maturity date. In addition, we may generate revenue in the form of loan origination, prepayment, facility, commitment, forbearance and amendment fees. We also may receive structuring or diligence fees, consulting fees and possibly fees for providing managerial assistance. Origination fees received by us are initially deferred and reduced from the cost basis of the investment and subsequently accreted into interest income over the remaining stated term of the loan.
Upon the prepayment of a loan or debt security, any unamortized loan origination fees are recorded as interest income. We record prepayment premiums on loans and debt securities as interest income when we receive such amounts. Facility fees, sometimes referred to as asset management fees, are accrued as a percentage periodic fee on the base amount (either the funded facility amount or the committed principal amount). Commitment fees are based upon the undrawn portion committed by us and are accrued over the life of the loan.
Amendment and forbearance fees are paid in connection with loan amendments and waivers and are recognized upon completion of the amendments or waivers, generally when such fees are receivable. Any such fees are recorded and classified as other income and included in investment income on the consolidated statements of operations. As these fees are paid and recognized in connection with specific loan amendments or forbearance, they are typically non-recurring in nature.
Expenses
Our primary operating expenses include the payment of (1) the base management fee and incentive fee to the Investment Adviser under the Investment Advisory Agreement; (2) the allocable portion of overhead to the Administrator under the Administration Agreement; (3) the interest expense on our outstanding debt, if any; and (4) our other operating costs, as detailed below. We bear all other costs and expenses of our operations and transactions, including:
| • | our organization; |
| • | calculating our net asset value and net asset value per share (including the cost and expenses of any independent valuation firms); |
| • | fees and expenses, including travel expenses, incurred by the Investment Adviser or payable to third parties in performing due diligence on prospective portfolio companies, monitoring our investments and, if necessary, enforcing our rights; |
| • | offerings of our common stock and other securities; |
| • | distributions on our shares; |
| • | transfer agent and custody fees and expenses; |
| • | amounts payable to third parties relating to, or associated with, evaluating, making and disposing of investments; |
| • | brokerage fees and commissions; |
| • | registration fees; |
| • | listing fees; |
| • | taxes; |
| • | independent director fees and expenses; |
| • | costs associated with our reporting and compliance obligations under the 1940 Act and applicable U.S. federal and state securities laws; |
| • | the costs of any reports, proxy statements or other notices to our stockholders, including printing costs; |
| • | costs of holding stockholder meetings; |
| • | our fidelity bond; |
| • | directors and officers/errors and omissions liability insurance and any other insurance premiums; |
| 63 |
| • | litigation, indemnification and other non-recurring or extraordinary expenses; |
| • | direct costs and expenses of administration and operation, including audit and legal costs; |
| • | fees and expenses associated with marketing efforts; |
| • | dues, fees and charges of any trade association of which we are a member; and |
| • | all other expenses reasonably incurred by us or the Administrator in connection with administering our business, including rent and our allocable portion of the costs and expenses of our chief compliance officer, chief financial officer and their respective staffs. |
During periods of asset growth, we expect our general and administrative expenses to be relatively stable or decline as a percentage of total assets and increase during periods of asset declines.
Recent Developments
On February 28, 2017 the Board approved a distribution in the amount of $4.5 million, or $0.28 a share, which will be paid on March 30, 2017 to stockholders of record as of March 23, 2017.
Portfolio Activity
For the year ended December 31, 2016, we made investments of $101.3 million to 12 new portfolio companies and $14.0 million of add-on investments to existing portfolio companies resulting in aggregate $115.3 million of portfolio additions at a weighted average yield of 10.0%. For the year ended December 31, 2016, repayments in our portfolio consisted of 17 early full repayments and partial repayments and sales totaling an aggregate par of $139.1 million with a weighted average yield of 10.2%.
For the three months ended December 31, 2016, we made investments of $15.7 million to two new portfolio companies and $2.9 million of add-on investments to existing portfolio companies resulting in aggregate $18.6 million of portfolio additions at a weighted average yield of 8.0%. For the three months ended December 31, 2016, repayments in our portfolio consisted of seven early full repayments and partial repayments and sales totaling an aggregate par of $42.8 million with a weighted average yield of 11.5%.
Consolidated Results of Operations
As a business development company and a RIC, we are subject to certain constraints on our operations, including limitations imposed by the 1940 Act and the Code.
| 64 |
Consolidated operating results for the years ended December 31, 2016, December 31, 2015 and December 31, 2014 are as follows:
| Year Ended | Year Ended | Year Ended | 2016 vs. 2015 | 2015 vs. 2014 | ||||||||||||||||
| ($ in thousands, except per share data) | December 31, 2016 | December 31, 2015 | December 31, 2014 | Variance | Variance | |||||||||||||||
| Net investment income | $ | 19,085 | $ | 29,944 | $ | 22,009 | $ | (10,859 | ) | $ | 7,935 | |||||||||
| Total investment income | 42,951 | 51,317 | 50,459 | (8,366 | ) | 858 | ||||||||||||||
| Total expenses | 23,866 | 21,373 | 28,450 | 2,493 | (7,077 | ) | ||||||||||||||
| Net realized (loss)/gain on investments | (30,591 | ) | (11,685 | ) | 10,702 | (18,906 | ) | (22,387 | ) | |||||||||||
| Net change in unrealized gain/(loss) on investments | 6,696 | (21,919 | ) | (2,227 | ) | 28,615 | (19,692 | ) | ||||||||||||
| Net (decrease)/increase in net assets resulting from operations | (4,810 | ) | (3,660 | ) | 30,484 | (1,150 | ) | (34,144 | ) | |||||||||||
| Net investment income per share | 1.18 | 1.79 | 1.31 | (0.61 | ) | 0.48 | ||||||||||||||
| Net realized/unrealized (loss)/gain from investments per share | (1.48 | ) | (2.01 | ) | 0.51 | 0.53 | (2.52 | ) | ||||||||||||
| Net (loss)/earnings per share | (0.30 | ) | (0.22 | ) | 1.82 | (0.08 | ) | (2.04 | ) | |||||||||||
| Net asset value per share | 12.42 | 13.98 | 15.58 | (1.56 | ) | (1.60 | ) | |||||||||||||
Net Investment Income
Net investment income for the years ended December 31, 2016, December 31, 2015 and December 31, 2014 was $19.1 million, $29.9 million and $22.0 million, respectively. Net investment income decreased by $10.9 million for the year ended December 31, 2016 from the year ended December 31, 2015, and increased $7.9 million for the year ended December 31, 2015 from the year ended December 31, 2014, as described below under “Total Investment Income” and “Expenses.”
Total Investment Income
Total investment income for the years ended December 31, 2016, December 31, 2015 and December 31, 2014 was $43.0 million, $51.3 million and $50.5 million, respectively.
Total investment income decreased by $(8.4) million for the year ended December 31, 2016 from the year ended December 31, 2015 due to a decrease in interest income in the amount of $(6.9) million and a decrease in other income of $(1.5) million.
The decrease in interest income was largely driven by our non-performing assets and lower investment balances during the year ended December 31, 2016 as compared to the year ended December 31, 2015. The decrease in other income was primarily driven by lower prepayment and amendment fees recognized during 2016 as compared to 2015.
Total investment income increased by $0.9 million for the year ended December 31, 2015 from the year ended December 31, 2014 due to an increase in interest income in the amount of $1.5 million, offset by a decrease in dividend income in the amount of $(0.4) million and a decrease in net accretion from the amortization of discounts in the amount of $(0.2) million.
The increase in interest income was largely driven by an increase in the weighted average yield of our debt investments to 10.8% in 2015 from 10.5% in 2014. The decrease in dividend income was primarily driven by decrease in dividend income from one portfolio investment that was sold in 2014.
Expenses
Total expenses for the years ended December 31, 2016, December 31, 2015 and December 31, 2014 were $23.9 million, $21.4 million and $28.5 million, respectively.
During the year ended December 31, 2016, the increase in total expenses of $2.5 million was driven primarily by (i) non-recurring expenses in the amount of $3.4 million related to the refinancing of the 2013-2 CLO and (ii) higher interest expense on our debt outstanding offset by lower management and incentive fees recorded.
The $3.4 million of non-recurring expenses related to the refinancing of the 2013-2 CLO was comprised of (i) a $1.8 million write-off of third party expenses associated with our 2013-2 CLO which had been previously deferred and were being amortized over the stated life of the 2013-2 CLO and (ii) the acceleration of $1.6 million of third party expenses associated with the execution of the 2016-2 CLO.
| 65 |
The following table summarizes our expenses, net of fee waivers and excluding the losses on the refinancing of the secured notes offered in the 2013-2 CLO and the $10.0 million revolving facility of GLC Trust 2013-2, or the GLC Trust 2013-2 Revolver, for the years ended December 31, 2016 and December 31, 2014, respectively, and the acceleration of deferred financing costs included in interest expense for the years ended December 31, 2016, December 31, 2015 and December 31, 2014.
| Year Ended | Year Ended | Year Ended | 2016 vs. 2015 | 2015 vs. 2014 | ||||||||||||||||
| ($ in thousands) | December 31, 2016 | December 31, 2015 | December 31, 2014 | Variance | Variance | |||||||||||||||
| Interest | $ | 8,313 | $ | 7,428 | $ | 7,157 | $ | 885 | $ | 271 | ||||||||||
| Management fees (net of waivers) | 6,972 | 7,755 | 8,065 | (783 | ) | (310 | ) | |||||||||||||
| Incentive fees | - | 1,135 | 8,409 | (1,135 | ) | (7,274 | ) | |||||||||||||
| Professional fees | 1,369 | 1,309 | 1,160 | 60 | 149 | |||||||||||||||
| Directors fees | 379 | 405 | 379 | (26 | ) | 26 | ||||||||||||||
| Administrator expenses | 1,260 | 1,052 | 712 | 208 | 340 | |||||||||||||||
| Other expenses | 2,199 | 2,289 | 2,324 | (90 | ) | (35 | ) | |||||||||||||
| Total expenses | $ | 20,492 | $ | 21,373 | $ | 28,206 | $ | (881 | ) | $ | (6,833 | ) | ||||||||
Interest expense increased $0.9 million, for the year ended December 31, 2016 from the year ended December 31, 2015, due to an increase in the average effective interest rate on debt outstanding. As of December 31, 2016 and December 31, 2015, the weighted average effective interest rate for total outstanding debt was 3.88% and 3.20%, respectively.
Interest expense increased $0.3 million, for the year ended December 31, 2015 from the year ended December 31, 2014, due to an increase in the average effective interest rate on debt outstanding. As of December 31, 2015 and December 31, 2014, the weighted average effective interest rate for total outstanding debt was 3.20% and 3.04%, respectively.
Management fees decreased $(0.8) million for the year ended December 31, 2016 as compared to the year ended December 31, 2015. This decrease was driven by a reduction in total assets and the irrevocable waiver of certain fees during the three months ended December 31, 2016. Refer to Note 8 of our consolidated financial statements for additional disclosures around these fee waivers.
| 66 |
Management fees decreased $(0.3) million for the year ended December 31, 2015 from the year ended December 31, 2014 primarily due to the decrease in total assets.
Incentive fees decreased $(1.1) million for the year ended December 31, 2016 from the year ended December 31, 2015. Incentive fees decreased in the year ended December 31, 2016 primarily due to the reversal of Income-based incentive fees that were subject to the Incentive Fee Cap & Deferral Mechanism, as a result of realized and unrealized losses on investments. Refer to Note 8 of our consolidated financial statements for additional discussion of our incentive fee.
Incentive fees decreased $(7.3) million in the year ended December 31, 2015 from the year ended December 31, 2014. Incentive fees decreased in the year ended December 31, 2015 primarily driven by the reversal of Capital Gains based incentive fees that were previously accrued under U.S. GAAP and the reversal of Income-based incentive fees that were subject to the Incentive Fee Cap & Deferral Mechanism. These reversals were driven by realized and unrealized losses on investments.
Administrator expenses increased $0.2 million for the year ended December 31, 2016 as compared to the year ended December 31, 2015 due primarily to higher overhead staffing costs. Administrator expenses for the year ended December 31, 2015 increased $0.3 million from the year ended December 31, 2014, primarily driven by higher allocation of overhead costs due to the hiring of additional personnel.
Net Realized Gain (Loss) and Net Change in Unrealized Gain (Loss) on Investments
For the year ended December 31, 2016, we realized a net loss on investments of $(30.6) million. Net realized losses for the year ended December 31, 2016 were primarily driven by a $(12.7) million loss in connection with the restructuring of our investment in Speed Commerce Inc., a $(11.1) million loss on BFN Operations LLC, a $(5.8) million loss on Forest Park Medical Center at Fort Worth, a $(1.3) million loss on SC Academy Holdings, Inc. and $(1.3) million of realized losses in the GLC Trust 2013-2’s consumer loan portfolio. This was partially offset by a $0.3 million realized gain on Ellman International, Inc., a $0.3 million realized gain on Provo Craft Holdings, LLC and $1.0 million of gains from the partial and full repayments and sales of other portfolio investments.
For the year ended December 31, 2015, we realized a net loss on investments of $(11.7) million. Net realized losses for the year ended December 31, 2015 were primarily driven by $(8.5) million of realized losses incurred from the significant restructurings of two portfolio investments, a realized loss of $(4.4) million from the early full repayment of one portfolio investment, and $(2.8) million of realized losses in GLC Trust 2013-2’s consumer loan portfolio. This was offset by a $2.5 million realized gain incurred from the partial sale of one portfolio investment and net realized gains of $1.5 million incurred from the early full repayment of 17 portfolio investments, the sale of one portfolio investment and other partial repayments.
| 67 |
For the year ended December 31, 2014, we realized net gains on investments of $10.7 million. Net realized gains for the year ended December 31, 2014 were driven primarily by $8.4 million of realized gains incurred from the sale of the parent company of one portfolio company, Anchor Drilling Fluids USA, Inc., resulting in the early full repayment of the debt and sale of the equity, with the remaining net realized gain of $2.3 million resulting from the sale of 15 portfolio investments, early full repayment of 33 portfolio investments and other partial repayments.
The net change in unrealized gain on investments of $6.7 million for the year ended December 31, 2016 was primarily driven by $16.9 million from the reversal of prior period net unrealized losses across 16 investments and positive fair value adjustments of $3.6 million, partially offset by $(10.2) million of negative credit-related adjustments across 6 portfolio investments and $(3.6) million of negative market-related adjustments across 4 portfolio investments. The $16.9 million of reversals of prior period net unrealized losses included $9.8 million from Speed Commerce, Inc., $5.3 million from BFN Operations LLC and $1.8 million from Forest Park Medical Center at Fort Worth. The $2.8 million of positive fair value adjustments were primarily driven by yield adjustments due to tightening credit spreads and higher bid quotations on our syndicated credits. The $(10.2) million of negative credit-related adjustments included unrealized losses from the Forest Park Medical Center at San Antonio, Badlands Production Company and Speed Commerce Investment Partners investments in the amounts of $(3.9) million, $(3.8) million and $(1.7) million, respectively. The $(3.6) million of market-related adjustments was comprised of $(2.2) million from our equity investment in Prosper Marketplace, $(0.8) million from Rooster Energy Inc., $(0.3) million from Confluence Outdoors, LLC and $(0.3) million from Profusion Industries, LLC.
For the year ended December 31, 2015, the net change in unrealized loss on investments was $(21.9) million. The net change in unrealized loss for the year ended December 31, 2015 was primarily driven by $(20.8) million of negative credit related adjustment of four portfolio investments, $(4.0) million of negative market-related adjustment on 20 portfolio investments, a net $(1.3) million reversal of prior period unrealized gains resulting from the full repayment of five portfolio investments and the partial sale of one portfolio investment and $(0.4) million negative adjustment related to the GLC Trust consumer loan portfolio. This was offset by $4.3 million from the reversal of prior period unrealized losses resulting from the significant restructuring of two portfolio investments, and an increase of $0.4 million in the value of two portfolio investment. The remaining net change in unrealized loss on investments was due to the decrease in the market value of the remaining portfolio in the amount of $(0.1) million.
For the year ended December 31, 2014, the net change in unrealized loss on investments was $(2.2) million. The net change in unrealized loss for year ended December 31, 2014 was driven primarily by the reversal of prior period unrealized gain in the amount of $(1.8) million as a result of the sale of the parent company of Anchor Drilling Fluids USA, Inc. and the negative credit related adjustment of three portfolio investments in the amount of $(5.3) million, offset by the increase in value of two portfolio investments in the amount of $6.1 million. The remaining net change in unrealized loss on investments was due to the reversal of prior period unrealized loss of $0.3 million and the decrease in the market value of the remaining portfolio in the amount of $(1.5) million.
Net (Decrease) / Increase in Net Assets from Operations
We had a net asset value per common share outstanding on December 31, 2016, December 31, 2015 and December 31, 2014 of $12.42, $13.98 and $15.58, respectively.
Based on basic weighted average shares outstanding of 16,149,866, the net decrease in net assets from operations per share for the year ended December 31, 2016 was $(0.31). This decrease was primarily driven by net realized losses from investments incurred during the year ended December 31, 2016.
Based on basic weighted average shares outstanding of 16,742,531, the net decrease in net assets from operations per share for the year ended December 31, 2015 was $(0.22).
Based on basic weighted average shares outstanding of 16,758,779, the net increase in net assets from operations per share for the year ended December 31, 2014 was $1.82.
Liquidity and Capital Resources
As a business development company, we distribute substantially all of our net income to our stockholders and will have an ongoing need to raise additional capital for investment purposes. We generate cash primarily from offerings of our equity securities and the issuance of debt securities including the 2016-2 Notes, as described below, Garrison SBIC Debentures and any repayments of portfolio investments. In addition, our cash flows from operations, including interest earned from the temporary investment of cash in U.S. government securities and other high-quality debt investments that mature in one year or less also provide liquidity.
| 68 |
As of December 31, 2016 and December 31, 2015 we had cash of $10.4 million and $25.0 million, respectively. Also, as of December 31, 2016 and December 31, 2015 we had restricted cash of $12.6 million and $11.8 million, respectively.
In addition to proceeds from public and private offerings of our debt and equity securities, we have identified three portfolio companies with a total par value of $10.0 million and a fair value of $9.9 million which we view as transitory investments. Transitory investments are generally those investments that we view as an additional source of liquidity that we are able to sell in order to fund investments that fit our core investment strategy. These transitory investments are generally at the lower end of our target portfolio yield range.
Our primary use of funds from operations includes investments in portfolio companies, cash distributions to holders of our common stock, payments of interest on our debt, and payments of fees and other operating expenses we incur. We believe that our existing cash and cash equivalents, available borrowings and our transitory portfolio as of December 31, 2016 will be sufficient to fund our anticipated funding requirements through at least December 31, 2017.
| 69 |
The following tables reflect the cash distributions per share that we have declared on our common stock for the fiscal years ended December 31, 2016 and December 31, 2015.
| Record Dates ($ in thousands except per share data) | Board Approval Date | Payment Date | Distribution Declared | Distribution Declared per Share | ||||||||
| Year Ended December 31, 2016 (1) | ||||||||||||
| December 9, 2016 | November 1, 2016 | December 23, 2016 | $ | 4,494 | $ | 0.28 | ||||||
| September 9, 2016 | August 2, 2016 | September 23, 2016 | 5,617 | 0.35 | ||||||||
| June 10, 2016 | May 2, 2016 | June 24, 2016 | 5,655 | 0.35 | ||||||||
| March 8, 2016 | February 24, 2016 | March 28, 2016 | 5,685 | 0.35 | ||||||||
| $ | 21,451 | $ | 1.33 | |||||||||
______________
| (1) | Does not include any return of capital for tax purposes. |
| Record Dates ($ in thousands except per share data) | Board Approval Date | Payment Date | Distribution Declared | Distribution Declared per Share | ||||||||
| Year ended December 31, 2015 (1) | ||||||||||||
| December 11, 2015 | November 2, 2015 | December 28, 2015 | $ | 5,820 | $ | 0.35 | ||||||
| September 10, 2015 | July 30, 2015 | September 25, 2015 | 5,866 | 0.35 | ||||||||
| June 12, 2015 | April 30, 2015 | June 26, 2015 | 5,866 | 0.35 | ||||||||
| March 20, 2015 | March 3, 2015 | March 27, 2015 | 5,866 | 0.35 | ||||||||
| $ | 23,418 | $ | 1.40 | |||||||||
______________
| (1) | Does not include any return of capital for tax purposes. |
During the year ended December 31, 2016, cash decreased by $(14.6) million as a result of net cash provided by operating activities of $37.0 million offset by cash used in financing activities in the amount of $(51.6) million.
During the year ended December 31, 2016, cash provided by operating activities resulted mainly from net investment income in the amount of $19.1 million, repayments and sales of investments in the amount of $107.2 million and $34.1 million, respectively, offset by purchases of investments in the amount of $123.9 million, and net realized loss from investments in the amount of $30.6 million. Net cash used in financing activities resulted from cash distributions in the amount of $21.5 million, repayment of the senior secured revolving notes of the CLOs in the amount of $35.0 million, repayment of the GLC Trust 2013-2 Class A notes in the amount of $10.9 million, repurchases of common stock in the amount of $5.0 million and debt issuance costs of $2.8 million, offset by proceeds from the Garrison SBIC borrowings in the amount of $17.7 million and net proceeds from the borrowing on senior secured term notes of the CLOs in the amount of $6.0 million.
During the year ended December 31, 2015, cash increased by $11.3 million as a result of net cash provided by operating activities of $49.5 million offset by cash used in financing activities in the amount of $(38.2) million.
During the year ended December 31, 2015, cash provided by operating activities resulted mainly from net investment income in the amount of $29.9 million, repayments and sales of investments in the amount of $198.2 million and $6.1 million, respectively, offset by purchases of investments in the amount of $181.0 million, and realized losses in the amount of $11.7 million. Net cash used in financing activities resulted from cash distributions in the amount of $23.4 million, repayment of the senior secured revolving notes in the amount of $15.0 million, repayment of the GLC Trust 2013-2 Class A notes in the amount of $14.9 million, repurchases of common stock in the amount of $3.3 million, and debt issuance costs of $0.8 million, offset by proceeds from the Garrison SBIC borrowings in the amount of $19.3 million.
During the year ended December 31, 2014, cash remained unchanged as a result of net cash provided by operating activities of $3.3 million offset by cash used in financing activities in the amount of $3.3 million.
During the year ended December 31, 2014, cash provided by operating activities resulted mainly from net investment income in the amount of $22.0 million, realized gains in the amount of $10.7 million, repayments and sales of investments in the amount of $293.8 million and $105.6 million, respectively, as well as a decrease in due from counterparties in the amount of $5.1 million, offset by purchases of investments in the amount of $427.1 million and a decrease in due to counterparties in the amount of $7.7 million. Net cash used in financing activities resulted from cash distributions in the amount of $23.5 million, repayment of the GLC Trust 2013-2 Revolver in the amount of $9.7 million and debt issuance costs of $0.5 million, offset by proceeds from the GLC Trust 2013-2 Notes in the amount of $30.4 million.
| 70 |
As of December 31, 2016 and December 31, 2015 we had $4.8 million and $6.9 million of unfunded commitments, respectively, with a fair value of $(0.1) million and $(0.1) million, respectively. These amounts may or may not be funded to the borrowing party now or in the future. The unfunded commitments relate to loans with various maturity dates, but the entire amount was eligible for funding to the borrowers as of December 31, 2016 and December 31, 2015, respectively, subject to the terms of each loan’s respective credit agreement.
Subject to leverage and borrowing base restrictions, as of December 31, 2016, we had approximately $25.0 million available for additional borrowings under our senior secured revolving notes of the 2016-2 CLO, $33.0 million of available SBIC leverage and no available borrowings under the GLC Trust 2013-2 Revolver. As of December 31, 2015, we had approximately $15.0 million available for additional borrowings under our senior secured revolving notes of the 2013-2 CLO, $15.7 million of available SBIC leverage and no available borrowings under the GLC Trust 2013-2 Revolver.
Portfolio Composition and Select Portfolio Information
As of December 31, 2016, we held investments in 58 portfolio companies with a fair value of $376.7 million. As of December 31, 2016, our portfolio had an average investment size of approximately $6.2 million, a weighted average yield on debt investments of 10.9% and a weighted average contractual maturity of 37 months.
As of December 31, 2015, we held investments in 67 portfolio companies with a fair value of $415.0 million. As of December 31, 2015, our portfolio had an average investment size of approximately $6.2 million, a weighted average yield on debt investments of 10.8% and a weighted average contractual maturity of 44 months.
| 71 |
The following table shows select information of our portfolio as of December 31, 2016 and December 31, 2015.
| Portfolio characteristics ($ in millions, % based on fair market value)* | December 31, 2016 | December 31, 2015 | ||||||
| Total fair market value | $ | 376.7 | $ | 415.0 | ||||
| Number of portfolio companies | 57 | 66 | ||||||
| Average investment size (1) | $ | 6.2 | $ | 6.2 | ||||
| Weighted average yield (2) | 10.9 | % | 10.8 | % | ||||
| Weighted average price (1) | 95.0 | 92.9 | ||||||
| First lien | 96.6 | % | 91.8 | % | ||||
| Second lien & mezzanine/subordinated | - | % | 1.8 | % | ||||
| Consumer loans | 1.8 | % | 4.2 | % | ||||
| Equity & other | 1.6 | % | 2.2 | % | ||||
| Core | 97.3 | % | 91.2 | % | ||||
| Transitory | 2.7 | % | 8.8 | % | ||||
| Originated (3) | 53.0 | % | 56.4 | % | ||||
| Club (4) | 27.0 | % | 26.1 | % | ||||
| Purchased | 20.0 | % | 17.5 | % | ||||
| Floating (1) | 96.8 | % | 93.2 | % | ||||
| Fixed (1) | 3.2 | % | 6.8 | % | ||||
| Performing (1) | 97.5 | % | 94.1 | % | ||||
| Non-accrual (1) | 2.5 | % | 5.9 | % | ||||
| Weighted average debt/EBITDA (1) (2) (5) | 3.6 | x | 3.6 | x | ||||
| Weighted average risk rating (1) | 2.49 | 2.66 | ||||||
______________
| (1) | Excludes consumer loans and equity investments. | |
| (2) | Excludes investments with a risk rating of 4, unfunded revolvers and equity investments. | |
| (3) | Originated positions include investments where we have sourced and led the execution of the deal. | |
| (4) | Club positions include investments where we provide direct lending to a borrower with one or two other lenders but did not lead the deal. | |
| (5) | Excludes non-operating portfolio companies, which we define as those investments collateralized by real estate, proved developed producing value, or PDP, or other hard assets. PDPs are proven revenues that can be produced with existing wells. As of December 31, 2016, $49.6 million of par value and $36.0 million of fair market value was excluded. As of December 31, 2015, $33.5 million of par value and $32.7 million of fair market value was excluded. | |
| * | Table excludes positions with a fair market value of zero. |
Inflation
Inflation has not had a significant effect on our results of operations in any of the reporting periods presented in our financial statements. However, from time to time, inflation may impact the operating results of our portfolio companies.
Off-Balance Sheet Arrangements
We may become a party to financial instruments with off-balance sheet risk in the normal course of our business to meet the financial needs of our portfolio companies. These instruments may include commitments to extend credit and involve, to varying degrees, elements of liquidity and credit risk in excess of the amount recognized in the balance sheet. As of December 31, 2016 and December 31, 2015, we had $4.8 million and $6.9 million of outstanding commitments to fund such investments, respectively. As of December 31, 2016 and December 31, 2015, we had $22.9 million and $36.8 million of cash and restricted cash, respectively.
| 72 |
Contractual Obligations
A summary of our significant contractual payment obligations as of December 31, 2016 is as follows:
| Payments Due by Period | ||||||||||||||||||||
| Less Than | 1 - 3 | 3 - 5 | More Than | |||||||||||||||||
| ($ in thousands) | 1 Year | Years | Years | 5 Years | Total | |||||||||||||||
| 2016-2 Secured Notes | $ | - | $ | - | $ | - | $ | 167,000 | $ | 167,000 | ||||||||||
| GLC Trust 2013-2 Class A Note | - | - | 5,048 | - | 5,048 | |||||||||||||||
| SBIC Borrowings(1) | - | - | - | 37,000 | 37,000 | |||||||||||||||
| Total contractual obligations | $ | - | $ | - | $ | 5,048 | $ | 204,000 | $ | 209,048 | ||||||||||
| (1) | Includes $7.0 million of interim financings which mature on March 29, 2017, upon which we expect them to be pooled in ten year, SBA-guaranteed debentures. |
We have certain contracts under which we have material future commitments. Under the Investment Advisory Agreement, the Investment Adviser provides us with investment advisory and management services. We have agreed to pay for these services (1) a base management fee equal to a percentage of the average adjusted value of our gross assets and (2) an incentive fee based on our performance.
We entered into the Administration Agreement on October 9, 2012 with the Administrator. Under the Administration Agreement, the Administrator furnishes us with office facilities and equipment, provides us clerical, bookkeeping and record keeping services and provides us with other administrative services necessary to conduct our day-to-day operations.
If any of the contractual obligations discussed above are terminated, our costs under any new agreements that we enter into may increase. In addition, we would likely incur significant time and expense in locating alternative parties to provide the services we expect to receive under our Investment Advisory Agreement and our Administration Agreement. Any new investment advisory agreement would also be subject to approval by our stockholders.
Both the Investment Advisory Agreement and the Administration Agreement may be terminated by either party without penalty upon no fewer than 60 days’ written notice to the other.
Related Party Transactions
We have entered into a number of business relationships with affiliated or related parties, including the following:
| • | We entered into the Investment Advisory Agreement with Garrison Capital Advisers LLC, under which our Investment Adviser is responsible for sourcing potential investments, conducting research and diligence on prospective investments and equity sponsors, analyzing investment opportunities, structuring our investments and monitoring our investments and portfolio companies on an ongoing basis. |
| • | Garrison Capital Administrator provides us with the office facilities and administrative services necessary to conduct day-to-day operations pursuant to our Administration Agreement. |
| • | We have entered into the License Agreement with Garrison Investment Group pursuant to which Garrison Investment Group has agreed to grant us a non-exclusive, royalty-free license to use the name “Garrison.” | |
| • | GLC Trust 2013-2 entered into the GLC Trust 2013-2 Administration Agreement with the Administrator, fees incurred under this agreement are included in total administrator expenses presented on the consolidated statement of operations. |
| • | Under the Staffing Agreement, Garrison Investment Group provides Garrison Capital Advisers with the resources necessary to fulfill these obligations. The Staffing Agreement provides that Garrison Investment Group will make available to Garrison Capital Advisers experienced investment professionals and access to the senior investment personnel of Garrison Investment Group for purposes of evaluating, negotiating, structuring, closing and monitoring our investments. The Staffing Agreement also includes a commitment that the members of Garrison Capital Advisers’ investment committee serve in such capacity. The Staffing Agreement remains in effect until terminated and may be terminated by either party without penalty upon 60 days’ written notice to the other party. Services under the Staffing Agreement are provided to Garrison Capital Advisers on a direct cost reimbursement basis, and such fees are not our obligation. |
| 73 |
| • | In connection with the 2016-2 CLO, we retained the Investment Adviser to furnish collateral management sub-management services to us pursuant to a sub-collateral management agreement. The Investment Adviser does not receive a fee for providing such services. | |
| • | Effective as of October 1, 2016, the Investment Adviser, in consultation with our board of directors agreed to irrevocably waive any fees payable to the Investment Adviser under the Investment Advisory Agreement with respect to a calendar quarter in excess of the sum of (i) 0.375% per quarter (1.50% annualized) of our gross assets, excluding cash and cash equivalents but including assets purchased with borrowed funds, calculated based on the average carrying value of our gross assets at the end of the two most recently completed calendar quarters, (ii) 20% of Pre-Incentive Fee Net Investment Income, expressed as a rate of return on the value of our net assets at the end of the immediately preceding calendar quarter, in excess of a “hurdle rate” of 1.75% per quarter (7.00% annualized) and (iii) in the case of the final calendar quarter of each year, the capital gains incentive fee. This waiver will be in effect until the earlier of (i) June 30, 2017 and (ii) approval by our stockholders of an amendment to the Investment Advisory Agreement to decrease the base management fee to an annual rate of 1.50% and to decrease the “hurdle rate” for the income-based portion of the Incentive Fee to 1.75% per quarter (7.00% annualized). |
We have adopted a joint code of ethics that governs the conduct of our and our Investment Adviser’s officers, directors and employees. Our officers and directors also remain subject to the duties imposed by both the 1940 Act and the DGCL.
Critical Accounting Policies
The preparation of our financial statements in accordance with U.S. GAAP requires management to make estimates and assumptions that affect the reported amounts of assets, liabilities, revenues and expenses. Changes in the economic environment, financial markets and any other parameters used in determining such estimates could cause actual results to differ. We have identified the following as critical accounting policies.
Basis for Consolidation
The consolidated financial statements include the accounts of Garrison Capital Inc. and its wholly owned subsidiaries. Intercompany accounts and transactions have been eliminated in consolidation. The accounts of the subsidiaries are prepared for the same reporting period as us using consistent accounting policies. Under the investment company rules and regulations pursuant to the American Institute of Certified Public Accountants Audit and Accounting Guide for Investment Companies, codified in ASC Topic 946, we are precluded from consolidating any entity other than another investment company.
We generally consolidate any investment company when we own 100% of its partners’ or members’ capital or equity units or 100% of the economic equity interest. ASC Topic 946 provides for the consolidation of a controlled operating company that provides substantially all of its services to the investment company or its consolidated subsidiaries.
Garrison Funding 2013-2 Manager LLC owns a 100% economic interest in Garrison Funding 2013-2 Ltd., which was an investment company for accounting purposes, and also provided collateral management services solely to Garrison Funding 2013-2 Ltd.. As such, we consolidated the accounts of these entities into these consolidated financial statements. As a result of this consolidation, the amounts outstanding under the 2013-2 CLO are treated as our indebtedness.
Garrison Capital Inc. owns a 100% economic interest in GF 2016-2, which was an investment company for accounting purposes, and also provides collateral management services solely to GF 2016-2. As such, hawse have consolidated the accounts of these entities into its consolidated financial statements. As a result of this consolidation, the amounts outstanding under the 2016-2 CLO are treated as our indebtedness.
The GARS Equity Holdings Entities, Walnut Hill II LLC, Forest Park II LLC, Garrison SBIC and GLC Trust 2013-2 are 100% owned investment companies for accounting purposes. As such, we have consolidated the accounts of these entities into these consolidated financial statements. As a result of this consolidation, indebtedness of Garrison SBIC and the amounts outstanding under the GLC Trust 2013-2 Notes are treated as our indebtedness.
Valuation of Portfolio Investments
We value our investments in accordance with ASC Topic 820. ASC Topic 820 defines fair value, establishes a framework for measuring fair value and expands disclosures about assets and liabilities measured at fair value. ASC Topic 820’s definition of fair value focuses on exit price in the principal, or most advantageous, market and prioritizes the use of market-based inputs over entity-specific inputs within a measurement of fair value. ASC Topic 820 classifies the inputs used to measure these fair values into the following hierarchy:
| 74 |
| Level 1 — | quoted unadjusted prices in active markets for identical investments as of the reporting date |
| Level 2 — | other significant observable inputs (including quoted prices for similar investments, interest rates, prepayments, credit risk, etc.) |
| Level 3 — | significant unobservable inputs (including the Investment Adviser’s own assumptions about the assumptions market participants would use in determining the fair values of investments) |
The valuation process is conducted at the end of each fiscal quarter, with a portion of our valuations of portfolio companies without market quotations subject to review by the independent valuation firms each quarter.
Our portfolio consists of primarily debt investments and unsecured consumer loans. The fair value of our investments is initially determined by investment professionals of our Investment Adviser and ultimately determined by our board of directors on a quarterly basis.
In valuing our debt investments, the Investment Adviser generally uses various approaches, including proprietary models that consider the analyses of independent valuation agents as well as credit risk, liquidity, market credit spreads, other applicable factors for similar transactions and bid quotations obtained from other financial institutions that trade in similar investments or based on bid prices provided by independent third party pricing services.
The types of factors that the board of directors may take into account when reviewing the fair value initially derived by the Investment Adviser and determining the fair value of the our debt investments generally include, as appropriate, comparison to publicly traded securities, including such factors as yield, maturity and measures of credit quality, the enterprise value of a portfolio company, the nature and realizable value of any collateral, the portfolio company’s ability to make payments and its earnings and discounted cash flow, the markets in which the portfolio company does business and other relevant factors.
In valuing our unsecured consumer loans, the Investment Adviser generally uses a discounted cash flow methodology based upon a set of assumptions. The primary assumptions used to value the unsecured consumer loans include prepayment and default rates derived from historical performance, actual performance as compared to historical projections and discount rates.
The types of factors that the board of directors may take into account when reviewing the fair value initially derived by the Investment Adviser and determining the fair value of our consumer loan investments generally include, as appropriate, prepayment and default rates derived from historical performance, actual performance as compared to historical projections and discount rates.
Our board of directors has retained several independent valuation firms to review the valuation of each portfolio investment that does not have a readily available market quotation at least once during each 12-month period. To the extent a security is reviewed in a particular quarter, it is reviewed and valued by only one service provider. However, our board of directors does not intend to have de minimis investments of less than 0.5% of our total assets (up to an aggregate of 10% of our total assets) independently reviewed. Our board of directors is responsible for determining the fair value of our assets in good faith using a documented valuation policy and consistently applied valuation process.
Due to the nature of our strategy, our portfolio includes relatively illiquid investments that are privately held. Inputs into the determination of fair value of our portfolio investments require significant management judgment or estimation. This means that our portfolio valuations are based on unobservable inputs and our own assumptions about how market participants would price the asset or liability in question. Valuations of privately held investments are inherently uncertain, may fluctuate over short periods of time and may be based on estimates. The determination of fair value by our board of directors may differ materially from the values that would have been used if a ready market for these investments existed. Our net asset value could be materially affected if the determinations regarding the fair value of our investments were materially higher or lower than the values that we ultimately realized upon the disposal of such investments.
The valuation process is conducted at the end of each fiscal quarter, with a portion of our valuations of portfolio companies without market quotations subject to review by the independent valuation firms each quarter. When an external event with respect to one of our portfolio companies, such as a purchase transaction, public offering or subsequent equity sale occurs, we expect to use the pricing indicated by the external event to corroborate our valuation .
| 75 |
With respect to investments for which market quotations are not readily available, our board of directors will undertake a multi-step valuation process each quarter, as described below:
| • | Our quarterly valuation process begins with each portfolio company or investment being initially valued by investment professionals of our Investment Adviser responsible for credit monitoring. |
| • | Preliminary valuation conclusions are then documented and discussed with our senior management and our Investment Adviser. |
| • | The valuation committee of the board of directors reviews these preliminary valuations. |
| • | At least once annually, the valuation for each portfolio investment that does not have a readily available quotation is reviewed by an independent valuation firm, subject to the de minimis exception above. |
| • | The board of directors discusses valuations and determines the fair value of each investment in our portfolio in good faith. |
Net assets could be materially affected if the determinations regarding the fair value of the investments were materially higher or lower than the values that are ultimately realized upon the disposal of such investments.
Investment Transactions and Related Investment Income and Expense
We record our investment transactions on a trade date basis, which is the date when we have determined that all material terms have been defined for the transactions. These transactions could possibly settle on a subsequent date depending on the transaction type. All related revenue and expenses attributable to these transactions are reflected on the consolidated statements of operations commencing on the trade date unless otherwise specified by the transaction documents. Realized gains and losses on investment transactions are recorded on the specific identification method.
We accrue interest income if we expect that ultimately we will be able to collect it. Generally, when an interest default occurs on a loan in our portfolio, or if our management otherwise believes that the issuer of the loan will not be able to service the loan and other obligations, we will place the loan on non-accrual status and will cease recognizing interest income on that loan until all principal and interest is current through payment or until a restructuring occurs, such that the interest income is deemed to be collectible. However, we remain contractually entitled to this interest. We may make exceptions to this policy if the loan has sufficient collateral value and is in the process of collection. Accrued interest is written off when it becomes probable that the interest will not be collected and the amount of uncollectible interest can be reasonably estimated. For consumer loans, any loan which is 120 days past due is considered defaulted and 100% of the principal is charged off with no expected recovery or sale of defaulted receivables. We had two investments placed on non-accrual status as of December 31, 2016 and four investments placed on non-accrual status as of December 31, 2015.
Any original issue discounts, as well as any other purchase discounts or premiums on debt investments, are accreted or amortized and included in interest income over the maturity periods of the investments.
Interest Expense
Interest expense is recorded on an accrual basis and is adjusted for amortization of deferred debt issuance costs.
Other Expenses
Expenses related to, but not limited to, ratings expenses, due diligence, valuation expenses and independent collateral appraisals may arise when we make certain investments. These expenses, as well as insurance expenses and trustee expenses are recognized as incurred in the consolidated statements of operations within other expenses.
| 76 |
Loan Origination, Facility, Commitment and Amendment Fees
We may receive loan origination fees when making a new investment, as well as prepayment, facility, commitment, forbearance, and amendment fees during the life of the investment.
Origination fees received by us are initially deferred and reduced from the cost basis of the investment and subsequently accreted into interest income over the remaining stated term of the loan.
Upon the prepayment of a loan or debt security, any unamortized loan origination fees are recorded as interest income. We record prepayment premiums on loans and debt securities as interest income when we receive such amounts. Facility fees, sometimes referred to as asset management fees, are accrued as a percentage periodic fee on the base amount (either the funded facility amount or the committed principal amount). Commitment fees are based upon the undrawn portion committed by us and are accrued over the life of the loan.
Amendment and forbearance fees are paid in connection with loan amendments and waivers and are recognized upon completion of the amendments or waivers, generally when such fees are receivable. Any such fees are recorded and classified as other income and included in investment income on the consolidated statements of operations. As these fees are paid and recognized in connection with specific loan amendments or forbearance, they are typically non-recurring in nature.
Share Repurchase
Share repurchase transactions are recorded on a trade date basis, which is the date when management has determined that all material legal terms have been contractually defined for the transactions. The aggregate cost of common stock repurchased, including any direct transaction costs, will be recorded as a reduction of the par and paid-in-capital in excess of par value accounts, respectively.
Distributions
Dividends and distributions to common stockholders are recorded on the ex-dividend date. The amount to be paid out as a distribution is determined by our board of directors each quarter and is generally based upon the earnings estimated by management. Net realized capital gains, if any, are distributed at least annually, although we may decide to retain such capital gains for investment.
We have adopted a dividend reinvestment plan that provides for reinvestment of our dividends and other distributions on behalf of our stockholders, unless a stockholder elects to receive cash as provided below. As a result, if our board of directors declares a cash dividend or other distribution, then our stockholders who have not ‘opted out’ of our dividend reinvestment plan will have their cash distribution automatically reinvested in additional shares of our common stock, rather than receiving the cash distribution.
No action is required on the part of a registered stockholder to have their cash dividend or other distribution reinvested in shares of our common stock. A registered stockholder may elect to receive an entire distribution in cash by notifying American Stock Transfer & Trust Company, LLC, the plan administrator and our transfer agent and registrar, in writing so that such notice is received by the plan administrator no later than the record date for distributions to stockholders. The plan administrator will set up an account for shares acquired through the plan for each stockholder who has not elected to receive dividends or other distributions in cash and hold such shares in non-certificated form. Upon request by a stockholder participating in the plan, received in writing not less than 10 days prior to the record date, the plan administrator will, instead of crediting shares to the participant’s account, issue a certificate registered in the participant’s name for the number of whole shares of our common stock and a check for any fractional share. The plan administrator is authorized to deduct a $15.00 transaction fee plus a $0.10 per share brokerage commission from the proceeds of the sale of any fractional share of common stock.
Those stockholders whose shares are held by a broker or other financial intermediary may receive dividends and other distributions in cash by notifying their broker or other financial intermediary of their election.
Income Tax
As a business development company, we elected to be treated as a RIC under Subchapter M of the Code, and intend to qualify annually for such treatment.
We intend to comply with all RIC qualification provisions contained in the Code including certain source-of-income and asset diversification requirements as well as the Annual Distribution Requirements. As a RIC, we do not have to pay corporate-level U.S. federal income taxes on any net ordinary income or capital gains that we distribute to our stockholders in a timely manner. However, we are subject to U.S. federal income taxes at regular corporate tax rates on any net ordinary income or net capital gain not distributed to our stockholders assuming we meet the Annual Distribution Requirement.
| 77 |
Depending on the level of taxable income earned in a tax year, we may choose to retain taxable income in excess of current year dividend distributions, and would distribute such taxable income in the next tax year. We would then pay a 4% excise tax on such taxable income, as required. To the extent that we determine that its estimated current year annual taxable income, determined on a calendar basis, could exceed estimated current calendar year dividend distributions, we accrue excise tax, if any, on estimated excess taxable income as taxable income is earned. For the years ended December 31, 2016, December 31, 2015 and December 31, 2014, $0.1 million, $0.2 million and $0.1 million, respectively, was recorded for U.S. federal excise tax, respectively.
Item 7A. Quantitative and Qualitative Disclosures About Market Risk
We are subject to financial market risks, including changes in interest rates. During the period covered by our financial statements, the majority of the loans in our portfolio had floating interest rates, and we expect that our loans in the future will also have floating interest rates. These loans are usually based on a floating LIBOR and typically have interest rate re-set provisions that adjust applicable LIBOR under such loans to current market rates on a regular basis. In addition, the 2016-2 CLO has a floating interest rate provision based on a cost of funds that approximates LIBOR and we expect that any credit facilities or other financing arrangements into which we enter in the future may have floating interest rate provisions.
Assuming that the consolidated statement of financial condition as of December 31, 2016 were to remain constant and that we took no actions to alter our existing interest rate sensitivity, the following table shows the annualized impact of hypothetical base rate changes in interest rates.
| (Decrease)/increase | Net increase | |||||||||||
| in | (Decrease)/increase | in | ||||||||||
| Change in interest rates | interest income | in interest expense | investment income | |||||||||
| ($ in thousands) | ||||||||||||
| Down 25 basis points | $ | (156 | ) | $ | (372 | ) | $ | 216 |
||||
| Up 50 basis points | 1,907 | 939 | 968 | |||||||||
| Up 100 basis points | 3,701 | 1,684 |
2,017 | |||||||||
| Up 200 basis points | 7,306 | 3,174 | 4,132 | |||||||||
| Up 300 basis points | 10,911 | 4,664 | 6,247 | |||||||||
Although management believes that this analysis is indicative of our existing sensitivity to interest rate changes, it does not adjust for changes in the credit markets, the size, credit quality or composition of the assets in our portfolio and other business developments, including indebtedness under the 2016-2 CLO, Garrison SBIC borrowings or additional borrowings, that could affect our net increase in net assets resulting from operations or net income. Accordingly, we cannot assure you that actual results would not differ materially from the statement above.
We may in the future hedge against currency and interest rate fluctuations by using standard hedging instruments such as futures, forward contracts, currency options and interest rate swaps, caps, collars and floors, including with respect to the obligations of the 2016-2 CLO, to the extent permitted under the 1940 Act and applicable commodities laws. While hedging activities may insulate us against adverse changes in currency exchange and interest rates, they may also limit our ability to participate in the benefits of lower interest rates with respect to the investments in our portfolio with fixed interest rates. We and our Investment Adviser have not hedged any of the obligations of the 2016-2 CLO.
| 78 |
Item 8. Financial Statements and Supplementary Data
Index to Consolidated Financial Statements
| 79 |
Management’s Report on Internal Control over Financial Reporting
The management of Garrison Capital, Inc. (collectively with its subsidiaries, the “Company,” “we,” “us,” “our” and “Garrison Capital”) is responsible for establishing and maintaining adequate internal control over financial reporting. Our internal control system is a process designed to provide reasonable assurance to our management and board of directors regarding the preparation and fair presentation of published consolidated financial statements.
Garrison Capital’s internal control over financial reporting includes policies and procedures that pertain to the maintenance of records that, in reasonable detail, accurately and fairly reflect transactions recorded necessary to permit the preparation of consolidated financial statements in accordance with U.S. generally accepted accounting principles. Our policies and procedures also provide reasonable assurance that receipts and expenditures are being made only in accordance with authorizations of management and the directors of Garrison Capital, and provide reasonable assurance regarding prevention or timely detection of unauthorized acquisition, use or disposition of our assets that could have a material effect on our consolidated financial statements.
All internal control systems, no matter how well designed, have inherent limitations. Therefore, even those systems determined to be effective can provide only reasonable assurance with respect to financial statement preparation and presentation. Also, projections of any evaluation of effectiveness as to future periods are subject to the risk that controls may become inadequate because of changes in conditions, or that the degree of compliance with the policies or procedures may deteriorate.
Management assessed the effectiveness of Garrison Capital’s internal control over financial reporting as of December 31, 2016. In making this assessment, we used the criteria set forth by the Committee of Sponsoring Organizations of the Treadway Commission in Internal Control — Integrated Framework issued in 2013. Based on the assessment, management believes that, as of December 31, 2016, our internal control over financial reporting is effective based on those criteria.
| 80 |
Report of Independent Registered Public Accounting Firm
To the Board of Directors and Stockholders of
Garrison Capital Inc. and Subsidiaries:
We have audited the accompanying consolidated statements of financial condition, including the consolidated schedules of investments, of Garrison Capital Inc. and Subsidiaries (the Company) as of December 31, 2016 and 2015, and the related consolidated statements of operations, changes in net assets and cash flows for each of the three years in the period ended December 31, 2016, the GLC Trust 2013-2 schedule of investments as of December 31, 2016 included as Exhibit 99.1, and the GLC Trust 2013-2 schedule of investments as of December 31, 2015 included as Exhibit 99.2 (not filed herewith). These consolidated financial statements and GLC Trust 2013-2 schedules of investments are the responsibility of the Company’s management. Our responsibility is to express an opinion on these financial statements and GLC Trust 2013-2 schedules of investments based on our audits.
We conducted our audits in accordance with the standards of the Public Company Accounting Oversight Board (United States). Those standards require that we plan and perform the audit to obtain reasonable assurance about whether the financial statements are free of material misstatement. The Company is not required to have, nor were we engaged to perform an audit of its internal control over financial reporting. Our audit included consideration of internal control over financial reporting as a basis for designing audit procedures that are appropriate in the circumstances, but not for the purpose of expressing an opinion on the effectiveness of the Company’s internal control over financial reporting. Accordingly, we express no such opinion. An audit also includes examining, on a test basis, evidence supporting the amounts and disclosures in the financial statements, assessing the accounting principles used and significant estimates made by management, as well as evaluating the overall financial statement presentation. Our procedures included confirmation of investments owned as of December 31, 2016, by correspondence with the custodians, loan agents, trustees or management of the underlying investments, as applicable, or by other appropriate auditing procedures where replies from these parties, as applicable, were not received. We believe that our audits provide a reasonable basis for our opinion.
In our opinion, the consolidated financial statements and GLC Trust 2013-2 schedules of investments referred to above present fairly, in all material respects, the financial position of Garrison Capital Inc. and Subsidiaries as of December 31, 2016 and 2015, and the results of its operations and its cash flows for each of the years in the three-year period ended December 31, 2016, in conformity with U.S. generally accepted accounting principles.
/s/ RSM US LLP
New York, New York
March 7, 2017
| 81 |
Garrison Capital Inc. and Subsidiaries
Consolidated Statements of Financial Condition
($ in thousands, except share and per share amounts)
| December 31, 2016 | December 31, 2015 | |||||||
| Assets | ||||||||
| Cash | $ | 10,378 | $ | 24,985 | ||||
| Restricted cash | 12,568 | 11,833 | ||||||
| Due from counterparties | 2,083 | 1,564 | ||||||
| Investments, at fair value | ||||||||
| Non-control/non-affiliate investments (amortized cost of $387,265 and $437,053, respectively) | 373,601 | 415,001 | ||||||
| Non-control/affiliate investments (amortized cost of $4,796 and $0, respectively) | 3,103 | - | ||||||
| Accrued interest receivable | 3,387 | 5,919 | ||||||
| Other assets | 1,427 | 999 | ||||||
| Total assets | $ | 406,547 | $ | 460,301 | ||||
| Liabilities | ||||||||
| Due to counterparties | $ | - | $ | 368 | ||||
| Management fee payable (Note 8) | 42 | 1,828 | ||||||
| GLC Trust 2013-2 Class A note (Note 7) | 4,953 | 15,664 | ||||||
| Senior secured revolving note (Note 7) | - | 35,000 | ||||||
| Senior secured term notes (Note 7) | 164,308 | 156,439 | ||||||
| SBIC borrowings (Note 7) | 35,851 | 18,546 | ||||||
| Interest payable | 1,089 | 807 | ||||||
| Accrued expenses and other payables | 896 | 939 | ||||||
| Total liabilities | $ | 207,139 | $ | 229,591 | ||||
| Commitments and contingencies (Note 13) | ||||||||
| Net assets | ||||||||
| Common stock, par value $0.001 per share, 100,000,000 shares authorized, | ||||||||
| 16,758,779 shares issued and 16,049,352 shares outstanding as of December 31, 2016 | ||||||||
| and 100,000,000 shares authorized,16,758,779 shares issued and 16,507,594 shares | ||||||||
| outstanding as of December 31, 2015 | $ | 17 | $ | 17 | ||||
| Paid-in-capital in excess of par | 249,148 | 254,239 | ||||||
| Underdistributed net investment income | 5,165 | 8,782 | ||||||
| Accumulated net realized (loss) from investments | (39,565 | ) | (10,275 | ) | ||||
| Net unrealized (loss) from investments | (15,357 | ) | (22,053 | ) | ||||
| Total net assets | 199,408 | 230,710 | ||||||
| Total liabilities and net assets | $ | 406,547 | $ | 460,301 | ||||
| Shares of common stock outstanding | 16,049,352 | 16,507,594 | ||||||
| Net asset value per share | $ | 12.42 | $ | 13.98 | ||||
See accompanying notes to consolidated financial statements.
| 82 |
Garrison Capital Inc. and Subsidiaries
Consolidated Schedule of Investments
December 31, 2016
($ in thousands, except share amounts)
| Security Description | Par / Shares | Cost | Fair Value | % of Net Assets | |||||||||||||
| Non-Control/Non-Affiliate Investments | |||||||||||||||||
| Investments - United States | |||||||||||||||||
| Common Equity | |||||||||||||||||
| Apparel Products | |||||||||||||||||
| Everyware Global, Inc., Common | 242,035 | $ | 2,714 | $ | 1,815 | 0.91 | % | ||||||||||
| Total Apparel Products | 2,714 | 1,815 | 0.91 | ||||||||||||||
| Health Services | |||||||||||||||||
| Juniper TGX Investment Partners, LLC, Common | 3,146 | 671 | 1,129 | 0.57 | |||||||||||||
| Total Health Services | 671 | 1,129 | 0.57 | ||||||||||||||
| Miscellaneous Manufacturing | |||||||||||||||||
| Valterra Products Holdings, LLC, Class A | 185,847 | 186 | 673 | 0.33 | |||||||||||||
| Valterra Products Holdings, LLC, Class B | 20,650 | 21 | 75 | 0.04 | |||||||||||||
| Total Miscellaneous Manufacturing | 207 | 748 | 0.37 | ||||||||||||||
| Miscellaneous Retail | |||||||||||||||||
| Faraday Holdings, LLC, Common | 2,752 | 140 | 210 | 0.11 | |||||||||||||
| Total Miscellaneous Retail | 140 | 210 | 0.11 | ||||||||||||||
| Transportation Services | |||||||||||||||||
| EZE Trucking, LLC, Common | 2,898 | 268 | - | - | |||||||||||||
| Total Transportation Services | 268 | - | - | ||||||||||||||
| Total Common Equity | $ | 4,000 | $ | 3,902 | 1.96 | % | |||||||||||
| Preferred Equity | |||||||||||||||||
| Consumer Finance Services | |||||||||||||||||
| Prosper Marketplace Series B Preferred Stock(1)(2) | 912,865 | $ | 551 | $ | 2,086 | 1.05 | % | ||||||||||
| Total Consumer Finance Services | 551 | 2,086 | 1.05 | ||||||||||||||
| Total Preferred Equity | $ | 551 | $ | 2,086 | 1.05 | % | |||||||||||
| Debt Investments | |||||||||||||||||
| Apparel Products | |||||||||||||||||
| League Collegiate Holdings, LLC, Term Loan* | |||||||||||||||||
| LIBOR ("L")+ 8.00%, 0.77% L, 6/28/2021 | 7,604 | $ | 7,501 | $ | 7,501 | 3.77 | % | ||||||||||
| Total Apparel Products | 7,501 | 7,501 | 3.77 | ||||||||||||||
| Automotive | |||||||||||||||||
| FRAM Group Holdings Inc. (Autoparts Holdings), Term Loan* | |||||||||||||||||
| L+ 6.75%,1.00% L Floor, 12/23/2021 | 9,000 | 8,821 | 8,910 | 4.47 | |||||||||||||
| Total Automotive | 8,821 | 8,910 | 4.47 | ||||||||||||||
See accompanying notes to consolidated financial statements.
| 83 |
Garrison Capital Inc. and Subsidiaries
Consolidated Schedule of Investments – (continued)
December 31, 2016
(in thousands)
| Security Description | Par / Shares | Cost | Fair Value | % of Net Assets | |||||||||||||
| Non-Control/Non-Affiliate Investments (continued) | |||||||||||||||||
| Investments - United States (continued) | |||||||||||||||||
| Debt Investments (continued) | |||||||||||||||||
| Broadcasting & Entertainment | |||||||||||||||||
| CF Entertainment Inc. (Entertainment Studios), Term Loan* | |||||||||||||||||
| L + 11.00%,1.00% L Floor, 6/26/2020 | 10,032 | $ | 9,979 | $ | 10,133 | 5.08 | % | ||||||||||
| Total Broadcasting & Entertainment | 9,979 | 10,133 | 5.08 | ||||||||||||||
| Building & Real Estate | |||||||||||||||||
| ShelterLogic Corp., Term Loan* | |||||||||||||||||
| L+ 9.50%,1.00% L Floor, 7/30/2019 | 9,854 | 9,752 | 9,752 | 4.89 | |||||||||||||
| Total Building & Real Estate | 9,752 | 9,752 | 4.89 | ||||||||||||||
| Chemicals | |||||||||||||||||
| Aristech Surfaces LLC, Term Loan B* | |||||||||||||||||
| L+ 8.00%,1.00% L Floor, 10/17/2019 | 9,595 | 9,501 | 9,501 | 4.76 | |||||||||||||
| Total Chemicals | 9,501 | 9,501 | 4.76 | ||||||||||||||
| Communications | |||||||||||||||||
| Sirva Worldwide, Term Loan* | |||||||||||||||||
| L+ 6.50%,1.00% L Floor, 11/22/2022 | 5,900 | 5,755 | 5,767 | 2.89 | |||||||||||||
| TableTop Media, LLC, Lease** | |||||||||||||||||
| 10.00%, 10/15/2019 | 4,354 | 4,344 | 4,347 | 2.18 | |||||||||||||
| U.S. Telepacific Corp., Term Loan* | |||||||||||||||||
| L+ 5.00%,1.00% L Floor, 11/25/2020 | 1,971 | 1,961 | 1,967 | 0.99 | |||||||||||||
| Total Communications | 12,060 | 12,081 | 6.06 | ||||||||||||||
| Computer Programming, Data Processing, & Other Computer Related Services | |||||||||||||||||
| Emtec Global Services Holdings, LLC, Term Loan**(3) | |||||||||||||||||
| L+ 8.25% Cash, 2.00% PIK, 0.57% L, 11/30/2020 | 2,820 | 2,791 | 2,790 | 1.40 | |||||||||||||
| Emtec Global Services Holdings, LLC, Revolver(3) | |||||||||||||||||
| L+ 8.25% Cash, 2.00% PIK, 0.57% L, 11/30/2020 | 335 | 335 | 332 | 0.17 | |||||||||||||
| Aptos, Inc., Term Loan B* | |||||||||||||||||
| L+ 6.75%,1.00% L Floor, 9/1/2022 | 8,978 | 8,808 | 8,808 | 4.41 | |||||||||||||
| Syncsort Incorporated, Term Loan* | |||||||||||||||||
| L+ 5.25%,1.00% L Floor, 12/23/2022 | 6,729 | 6,662 | 6,662 | 3.34 | |||||||||||||
| Total Computer Programming, Data Processing, & Other Computer Related Services | 18,596 | 18,592 | 9.32 | ||||||||||||||
| Consumer Finance Services | |||||||||||||||||
| Affiliated Wealth Partners Holdings LLC, Term Loan*(1) | |||||||||||||||||
| L+ 8.00%,1.00% L Floor, 9/15/2020 | 2,868 | 2,836 | 2,836 | 1.42 | |||||||||||||
| PlanMember Financial Corporation, Term Loan*(1) | |||||||||||||||||
| L+ 6.50%,1.50% L Floor, 12/31/2020 | 1,154 | 1,139 | 1,154 | 0.58 | |||||||||||||
| Project Sunshine IV Pty Ltd (Sensis), New Term Loans*(1) | |||||||||||||||||
| L+ 7.00%,1.00% L Floor, 9/23/2019 | 6,876 | 6,747 | 6,833 | 3.42 | |||||||||||||
| Total Consumer Finance Services | 10,722 | 10,823 | 5.42 | ||||||||||||||
| Cosmetics/Toiletries | |||||||||||||||||
| ActivStyle, Inc., Term Loan** | |||||||||||||||||
| L+ 9.00%,0.88% L, 7/9/2020 | 9,656 | 9,537 | 9,656 | 4.84 | |||||||||||||
| Total Cosmetics/Toiletries | 9,537 | 9,656 | 4.84 | ||||||||||||||
| Electrical Equipment | |||||||||||||||||
| AbelConn, LLC (Atrenne Computing), Term Loan* | |||||||||||||||||
| L+ 8.50%,1.00% L Floor, 7/17/2019 | 9,688 | 9,589 | 9,589 | 4.81 | |||||||||||||
| Total Electrical Equipment | 9,589 | 9,589 | 4.81 | ||||||||||||||
| Equipment Rental & Leasing | |||||||||||||||||
| University Furnishings, L.P., Term Loan B** | |||||||||||||||||
| L+ 6.75%, 0.77% L, 12/17/2020 | 7,102 | 7,006 | 6,990 | 3.51 | |||||||||||||
| Total Equipment Rental & Leasing | 7,006 | 6,990 | 3.51 | ||||||||||||||
| Food Stores & Distributors - Retail | |||||||||||||||||
| Diamond Crystal Brands, Inc., Term Loan** | |||||||||||||||||
| L+ 7.75%, 0.77% L, 7/29/2021 | 5,460 | 5,408 | 5,460 | 2.74 | |||||||||||||
| Specialty Bakers LLC, Term Loan* | |||||||||||||||||
| L+ 7.50%,1.00% L Floor, 8/7/2019 | 9,818 | 9,707 | 9,720 | 4.87 | |||||||||||||
| Total Food Stores & Distributors - Retail | 15,115 | 15,180 | 7.61 | ||||||||||||||
See accompanying notes to consolidated financial statements.
| 84 |
Garrison Capital Inc. and Subsidiaries
Consolidated Schedule of Investments – (continued)
December 31, 2016
(in thousands)
| Security Description | Par / Shares | Cost | Fair Value | % of Net Assets | |||||||||||||
| Non-Control/Non-Affiliate Investments (continued) | |||||||||||||||||
| Investments - United States (continued) | |||||||||||||||||
| Debt Investments (continued) | |||||||||||||||||
| Health Services | |||||||||||||||||
| Aurora Diagnostics, LLC, Delayed Draw Term Loan* | |||||||||||||||||
| L+ 7.13%,1.25% L Floor, 7/31/2019 | 850 | $ | 850 | $ | 850 | 0.42 | % | ||||||||||
| Aurora Diagnostics, LLC, Delayed Draw Term Loan B* | |||||||||||||||||
| L+ 7.13%,1.25% L Floor, 7/31/2019 | 598 | 598 | 598 | 0.30 | |||||||||||||
| Aurora Diagnostics, LLC, Term Loan* | |||||||||||||||||
| L+ 7.13%,1.25% L Floor, 7/31/2019 | 5,506 | 5,476 | 5,507 | 2.76 | |||||||||||||
| Forest Park Medical Center at San Antonio, LLC, Lease(4) | |||||||||||||||||
| 13.00%, 2/11/2020 | 8,982 | 8,832 | 2,392 | 1.20 | |||||||||||||
| Forest Park Medical Center at San Antonio, LLC, Term Loan(4) | |||||||||||||||||
| 14.00%, on Demand | 1,951 | 1,914 | 520 | 0.26 | |||||||||||||
| RCS Management Corporation (SMS), Term Loan B** | |||||||||||||||||
| L+ 10.50%,1.00% L Floor, 7/29/2018 | 9,500 | 9,351 | 9,350 | 4.69 | |||||||||||||
| SCG Capital Corporation (Radiation Therapy), Term Note | |||||||||||||||||
| 12.00%, 5/1/2017 | 822 | 822 | 822 | 0.41 | |||||||||||||
| Theragenics Corporation, Term Loan** | |||||||||||||||||
| L+ 12.00%,1.00% L Floor, 12/23/2020 | 6,977 | 6,877 | 6,952 | 3.49 | |||||||||||||
| Walnut Hill Physicians' Hospital, LLC, Lease | |||||||||||||||||
| 12.50%, 4/30/2019 | 6,765 | 6,765 | 6,765 | 3.39 | |||||||||||||
| Total Health Services | 41,485 | 33,756 | 16.92 | ||||||||||||||
| Insurance Agents | |||||||||||||||||
| Worley Claims Services, LLC, Term Loan* | |||||||||||||||||
| L+ 8.00%,1.00% L Floor, 10/31/2020 | 10,290 | 10,238 | 10,291 | 5.16 | |||||||||||||
| Total Insurance Agents | 10,238 | 10,291 | 5.16 | ||||||||||||||
| Metal Mining | |||||||||||||||||
| Metal Services LLC (Phoenix), New Term Loans* | |||||||||||||||||
| L+ 7.50%,1.00% L Floor, 6/30/2019 | 6,081 | 6,010 | 6,096 | 3.06 | |||||||||||||
| Total Metal Mining | 6,010 | 6,096 | 3.06 | ||||||||||||||
| Miscellaneous Manufacturing | |||||||||||||||||
| AP Gaming I, LLC, Term B Loan* | |||||||||||||||||
| L+ 8.25%,1.00% L Floor, 12/21/2020 | 10,117 | 9,998 | 10,050 | 5.04 | |||||||||||||
| CR Brands, Inc., Term Loan* | |||||||||||||||||
| L+ 9.25%,1.00% L Floor, 8/23/2017 | 9,722 | 9,685 | 9,681 | 4.85 | |||||||||||||
| Inteva Products, LLC, Term Loan* | |||||||||||||||||
| L+ 8.50%,1.25% L Floor, 9/8/2021 | 4,960 | 4,914 | 4,985 | 2.50 | |||||||||||||
| Kranos Acquisition Corp., Term Loan* | |||||||||||||||||
| L+ 10.00%,1.00% L Floor, 6/15/2017 | 8,293 | 8,277 | 8,281 | 4.15 | |||||||||||||
| Lexmark Carpet Mills, Inc., Term Loan* | |||||||||||||||||
| L+ 10.00%,1.00% L Floor, 12/19/2019 | 9,578 | 9,436 | 9,436 | 4.73 | |||||||||||||
| PCCR USA, Inc., Term Loan A* | |||||||||||||||||
| L+ 8.00%,1.00% L Floor, 12/1/2019 | 6,650 | 6,573 | 6,650 | 3.33 | |||||||||||||
| PCCR USA, Inc., Term Loan B* | |||||||||||||||||
| L+ 8.00%,1.00% L Floor, 12/1/2019 | 1,709 | 1,685 | 1,709 | 0.86 | |||||||||||||
| Profusion Industries, LLC, Term Loan* | |||||||||||||||||
| L+ 9.00%, 0.82% L, 6/19/2020 | 9,785 | 9,649 | 9,296 | 4.66 | |||||||||||||
| Texas Hydraulics Holding, Inc., Term Loan** | |||||||||||||||||
| L+ 6.50%,0.77% L, 2/17/2021 | 8,200 | 8,065 | 8,065 | 4.04 | |||||||||||||
| Total Miscellaneous Manufacturing | 68,282 | 68,153 | 34.16 | ||||||||||||||
See accompanying notes to consolidated financial statements.
| 85 |
Garrison Capital Inc. and Subsidiaries
Consolidated Schedule of Investments – (continued)
December 31, 2016
(in thousands)
| Security Description | Par / Shares | Cost | Fair Value | % of Net Assets | |||||||||||||
| Non-Control/Non-Affiliate Investments (continued) | |||||||||||||||||
| Investments - United States (continued) | |||||||||||||||||
| Debt Investments (continued) | |||||||||||||||||
| Miscellaneous Retail | |||||||||||||||||
| 360 Holdings III Corp., Term Loan* | |||||||||||||||||
| L+ 9.00%, 1.00% L Floor, 10/1/2021 | 7,308 | $ | 7,067 | $ | 7,067 | 3.54 | % | ||||||||||
| Confluence Outdoor, LLC, Term Loan* | |||||||||||||||||
| L+ 7.00%,1.00% L Floor, 4/18/2019 | 6,657 | 6,604 | 6,324 | 3.17 | |||||||||||||
| Confluence Outdoor, LLC, Delayed Draw Term Loan | |||||||||||||||||
| L+ 7.00%,1.00% L Floor, 4/18/2019 | 999 | 991 | 949 | 0.48 | |||||||||||||
| HRI Holding Corp. (Houlihans Restaurants), Term Loan* | |||||||||||||||||
| L+ 6.25%,1.00% L Floor, 12/17/2020 | 6,800 | 6,688 | 6,692 | 3.36 | |||||||||||||
| Interior Specialists, Inc., Term Loan* | |||||||||||||||||
| L+ 8.00%,1.00% L Floor, 6/30/2020 | 10,040 | 9,900 | 10,040 | 5.04 | |||||||||||||
| Sears Holdings Corporation, Term Loan* | |||||||||||||||||
| L+ 7.50%, 1.00% L Floor, 7/20/2020 | 1,600 | 1,561 | 1,598 | 0.80 | |||||||||||||
| Western Convenience Stores, Inc., Term Loan* | |||||||||||||||||
| L+ 11.00%, 0.63% L, 9/1/2019 | 9,000 | 8,760 | 8,760 | 4.39 | |||||||||||||
| Total Miscellaneous Retail | 41,571 | 41,430 | 20.78 | ||||||||||||||
| Miscellaneous Services | |||||||||||||||||
| Simmons Research LLC, Term Loan* | |||||||||||||||||
| L+ 10.50%,0.88% L, 12/11/2020 | 3,810 | 3,750 | 3,750 | 1.88 | |||||||||||||
| Sprint Industrial Holdings, LLC, Term Loan (First Lien)* | |||||||||||||||||
| L+ 5.75%,1.25% L Floor, 5/14/2019 | 4,774 | 4,759 | 3,437 | 1.73 | |||||||||||||
| YourMembership Holding Company, Term Loan A** | |||||||||||||||||
| L+ 7.00%,1.00% L Floor, 9/12/2019 | 9,371 | 9,328 | 9,371 | 4.70 | |||||||||||||
| Total Miscellaneous Services | 17,837 | 16,558 | 8.31 | ||||||||||||||
| Oil & Gas | |||||||||||||||||
| Badlands Production Company (fka Gasco), Term Loan(4) | |||||||||||||||||
| L+ 17.50%, 1.00% L Floor, 5/14/2018 | 10,500 | 10,403 | 6,300 | 3.17 | |||||||||||||
| Iracore International Holdings, Inc., Term Loan* | |||||||||||||||||
| L+ 9.00%,1.00% L Floor, 7/10/2020 | 8,878 | 8,784 | 8,878 | 4.45 | |||||||||||||
| Rooster Energy Ltd., Term Loan*(3) | |||||||||||||||||
| L+ 11.50%, Cash, 8.00% PIK, 1.50% L Floor, 6/25/2018 | 5,587 | 5,517 | 4,470 | 2.24 | |||||||||||||
| Total Oil & Gas | 24,704 | 19,648 | 9.86 | ||||||||||||||
| Printing & Publishing | |||||||||||||||||
| Dodge Data & Analytics LLC, Term Loan* | |||||||||||||||||
| L+ 8.75%,1.00% L Floor, 10/31/2019 | 9,023 | 8,921 | 8,921 | 4.47 | |||||||||||||
| Total Printing & Publishing | 8,921 | 8,921 | 4.47 | ||||||||||||||
See accompanying notes to consolidated financial statements.
| 86 |
Garrison Capital Inc. and Subsidiaries
Consolidated Schedule of Investments – (continued)
December 31, 2016
(in thousands)
| Security Description | Par / Shares | Cost | Fair Value | % of Net Assets | |||||||||||||
| Non-Control/Non-Affiliate Investments (continued) | |||||||||||||||||
| Investments - United States (continued) | |||||||||||||||||
| Debt Investments (continued) | |||||||||||||||||
| Specialty Services | |||||||||||||||||
| Del Mar Recovery Solutions, Inc., Term Loan** | |||||||||||||||||
| L+ 8.50%,0.61% L, 6/27/2021 | 8,526 | $ | 8,392 | $ | 8,392 | 4.21 | % | ||||||||||
| Del Mar Recovery Solutions, Inc., Revolver* | |||||||||||||||||
| L+ 8.50%,0.61% L, 6/27/2021 | 495 | 495 | 487 | 0.24 | |||||||||||||
| Total Specialty Services | 8,887 | 8,879 | 4.45 | ||||||||||||||
| Transportation Services | |||||||||||||||||
| Fleetgistics Holdings, Inc., Term Loan* | |||||||||||||||||
| L+ 6.13%,2.00% L Floor, 12/31/2018 | 900 | 900 | 810 | 0.41 | |||||||||||||
| Gruden Acquisition, Inc., Term Loan (First Lien)* | |||||||||||||||||
| L+ 4.75%,1.00% L Floor, 8/18/2022 | 1,980 | 1,947 | 1,881 | 0.93 | |||||||||||||
| MXD Group, Inc. (fka Exel Direct Inc.), Term Loan*(3) | |||||||||||||||||
| L+ 11.00% Cash, 2.00% PIK, 1.00% L Floor, 5/31/2018 | 15,380 | 15,229 | 14,618 | 7.34 | |||||||||||||
| Raymond Express International, LLC, Term Loan* | |||||||||||||||||
| L+ 7.75%,1.75% L Floor, 2/28/2018 | 1,507 | 1,503 | 1,205 | 0.60 | |||||||||||||
| Total Transportation Services | 19,579 | 18,514 | 9.28 | ||||||||||||||
| Total Debt Investments | $ | 375,693 | $ | 360,954 | 180.99 | % | |||||||||||
| Financial Assets | |||||||||||||||||
| Consumer Finance Services | |||||||||||||||||
| GLC Trust 2013-2 Consumer Loan Pool(1)(5) | 7,086 | $ | 7,086 | $ | 6,756 | 3.39 | % | ||||||||||
| Total Consumer Finance Services | 7,086 | 6,756 | 3.39 | ||||||||||||||
| Total Financial Assets | $ | 7,086 | $ | 6,756 | 3.39 | % | |||||||||||
| Unfunded Commitments | |||||||||||||||||
| Apparel Products | |||||||||||||||||
| League Collegiate Holdings, LLC Revolver*(6) | |||||||||||||||||
| 0.75%, 6/28/2021 | 2,200 | $ | (30 | ) | $ | (30 | ) | (0.02 | )% | ||||||||
| Total Apparel Products | (30 | ) | (30 | ) | (0.02 | ) | |||||||||||
| Computer Programming, Data Processing, & Other Computer Related Services | |||||||||||||||||
| Emtec Global Services Holdings, LLC, Revolver(6) | |||||||||||||||||
| 0.00%, 11/30/2020 | 123 | (5 | ) | (1 | ) | - | |||||||||||
| Total Computer Programming, Data Processing, & Other Computer Related Services | (5 | ) | (1 | ) | - | ||||||||||||
| Health Services | |||||||||||||||||
| Aurora Diagnostics, LLC, Revolver*(6) | |||||||||||||||||
| 0.38%, 7/31/2019 | 1,020 | (6 | ) | (6 | ) | - | |||||||||||
| Total Health Services | (6 | ) | (6 | ) | - | ||||||||||||
See accompanying notes to consolidated financial statements.
| 87 |
Garrison Capital Inc. and Subsidiaries
Consolidated Schedule of Investments – (continued)
December 31, 2016
(in thousands)
| Security Description | Par / Shares | Cost | Fair Value | % of Net Assets | |||||||||||||
| Non-Control/Non-Affiliate Investments (continued) | |||||||||||||||||
| Investments - United States (continued) | |||||||||||||||||
| Unfunded Commitments (continued) | |||||||||||||||||
| Miscellaneous Services | |||||||||||||||||
| Del Mar Recovery Solutions, Inc. Revolver*(6) | |||||||||||||||||
| 0.75%, 6/27/2021 | 825 | $ | (21 | ) | $ | (14 | ) | (0.01 | )% | ||||||||
| YourMembership Holding Company, Revolver*(6) | |||||||||||||||||
| 0.00%, 9/12/2019 | 441 | (2 | ) | (3 | ) | - | |||||||||||
| Total Miscellaneous Services | (23 | ) | (17 | ) | (0.01 | ) | |||||||||||
| Transportation Services | |||||||||||||||||
| Raymond Express International, LLC Revolver*(6) | |||||||||||||||||
| 0.50%, 2/28/2018 | 215 | (1 | ) | (43 | ) | (0.02 | ) | ||||||||||
| Total Transportation Services | (1 | ) | (43 | ) | (0.02 | ) | |||||||||||
| Total Unfunded Commitments | $ | (65 | ) | $ | (97 | ) | (0.05 | )% | |||||||||
| Total Non-Control/Non-Affiliate Investments | $ | 387,265 | $ | 373,601 | 187.34 | % | |||||||||||
| Control/Affiliate Investments | |||||||||||||||||
| Investments - United States | |||||||||||||||||
| Common Equity | |||||||||||||||||
| Miscellaneous Services | |||||||||||||||||
| Speed Commerce Investment Partners LLC, Class A Unit | 1,780 | $ | 1,693 | $ | - | - | % | ||||||||||
| Total Miscellaneous Services | 1,693 | - | - | ||||||||||||||
| Total Common Equity | $ | 1,693 | $ | - | - | % | |||||||||||
| Debt Investments | |||||||||||||||||
| Miscellaneous Services | |||||||||||||||||
| Speed Commerce Operating Company LLC, Closing Date Term Loan B(3) | |||||||||||||||||
| L+ 16.00% PIK, 1.00% L Floor, 12/8/2017 | 1,879 | $ | 1,879 | $ | 1,879 | 0.95 | % | ||||||||||
| Speed Commerce Operating Company LLC, Delayed Draw Term Loan B(3) | |||||||||||||||||
| L+ 16.00% PIK, 1.00% L Floor, 12/8/2017 | 1,224 | 1,224 | 1,224 | 0.62 | |||||||||||||
| Total Miscellaneous Services | 3,103 | 3,103 | 1.57 | ||||||||||||||
| Total Debt Investments | $ | 3,103 | $ | 3,103 | 1.57 | % | |||||||||||
| Unfunded Commitments | |||||||||||||||||
| Miscellaneous Services | |||||||||||||||||
| Speed Commerce Operating Company LLC, Delayed Draw Term Loan B | |||||||||||||||||
| 0.00%, 12/8/2017 | 18 | $ | - | $ | - | - | % | ||||||||||
| Total Miscellaneous Services | - | - | - | ||||||||||||||
| Total Unfunded Commitments | $ | - | $ | - | - | % | |||||||||||
| Total Control/Affiliate Investments | $ | 4,796 | $ | 3,103 | 1.57 | % | |||||||||||
| Total Investments – United States | $ | 392,061 | $ | 376,704 | 188.91 | % | |||||||||||
______________
| * | Denotes that all or a portion of the investment is held as collateral by the 2016-2 CLO (see Notes 1 and 7). |
| ** | Denotes that all or a portion of the loan is held by Garrison SBIC. |
L = London Interbank Offered Rate.
P = Prime Rate
| (1) | Not a qualifying asset under Section 55(a) of the Investment Company Act of 1940, as amended (the “1940 Act”). Under the 1940 Act, the Company may not acquire any non-qualifying asset unless, at the time the acquisition is made, qualifying assets represent at least 70% of the Company’s total assets. As of December 31, 2016, 95.2% of the Company’s assets were qualifying assets. | |
| (2) | Net of incentive fee payable to a third party equal to 20% of any distribution after the Company has received its full net capital investment plus a 12% preferred return in GLC Trust 2013-2 and Prosper Marketplace Series B Preferred Stock. | |
| (3) | Coupon is payable in cash, and/or payment-in-kind (“PIK”), or a combination thereof. | |
| (4) | Investment is currently not income producing and placed on non-accrual status. | |
| (5) | GLC Trust 2013-2 includes 1,458 small balance consumer loans with an average par of $4,860, a weighted average rate of 16.0% and a weighted average maturity of November 16, 2018. See Note 4 for additional information. See Exhibit 99.1 to the Company’s Annual Report on Form 10-K for the year ended December 31, 2016 for detail on underlying loans. | |
| (6) | The negative fair value is the result of the unfunded commitments being valued below par. These amounts may or may not be funded to the borrowing party currently or in the future. |
As required by the 1940 Act, investments are classified by level of control. “Control Investments” are investments in those companies that the Company is deemed to control as defined in the 1940 Act. “Affiliate Investments” are investments in those companies that are affiliated companies, as defined in the 1940 Act, other than Control Investments. “Non-Control/Non-Affiliate Investments” are those that are neither Control Investments nor Affiliate Investments.
Generally, under the 1940 Act, the Company is deemed to control a company in which it has invested if it owns more than 25% of the voting securities of such company. The Company is deemed to be an affiliate of a company in which it has invested if it owns 5% or more of the voting securities of such company.
All debt investments were income producing as of December 31, 2016, unless otherwise noted. Common and preferred equity investments are non income-producing unless otherwise noted.
See accompanying notes to consolidated financial statements.
| 88 |
Garrison Capital Inc. and Subsidiaries
Consolidated Schedule of Investments
December 31, 2015
($ in thousands, except share amounts)
| Security Description | Par / Shares | Cost | Fair Value | % of Net Assets | ||||||||||||
| Non-Control/Non-Affiliate Investments | ||||||||||||||||
| Investments - United States | ||||||||||||||||
| Common Equity | ||||||||||||||||
| Apparel Products | ||||||||||||||||
| Everyware Global, Inc., Common | 242,035 | $ | 2,714 | $ | 1,815 | 0.78 | % | |||||||||
| Total Apparel Products | 2,714 | 1,815 | 0.78 | |||||||||||||
| Health Services | ||||||||||||||||
| Juniper TGX Investment Partners, LLC, Common | 3,146 | 671 | 1,023 | 0.44 | ||||||||||||
| Total Health Services | 671 | 1,023 | 0.44 | |||||||||||||
| Miscellaneous Manufacturing | ||||||||||||||||
| Valterra Products Holdings, LLC, Class A | 185,847 | 186 | 456 | 0.21 | ||||||||||||
| Valterra Products Holdings, LLC, Class B | 20,650 | 21 | 51 | 0.02 | ||||||||||||
| Total Miscellaneous Manufacturing | 207 | 507 | 0.23 | |||||||||||||
| Miscellaneous Retail | ||||||||||||||||
| Faraday Holdings, LLC, Common | 2,265 | 110 | 123 | 0.05 | ||||||||||||
| Provo Craft Holdings, LLC, Common | 2,436,157 | - | - | - | ||||||||||||
| Total Miscellaneous Retail | 110 | 123 | 0.05 | |||||||||||||
| Transportation Services | ||||||||||||||||
| EZE Trucking, LLC, Common | 2,898 | 268 | - | - | ||||||||||||
| Total Transportation Services | 268 | - | - | |||||||||||||
| Total Common Equity | $ | 3,970 | $ | 3,468 | 1.50 | % | ||||||||||
| Preferred Equity | ||||||||||||||||
| Consumer Finance Services | ||||||||||||||||
| Prosper Marketplace Series B Preferred Stock(1)(2) | 182,573 | $ | 551 | $ | 4,236 | 1.84 | % | |||||||||
| Total Consumer Finance Services | 551 | 4,236 | 1.84 | |||||||||||||
| Miscellaneous Services | ||||||||||||||||
| SC Academy Holdings, Inc., Preferred Equity | 25,000 | 1,250 | 1,250 | 0.54 | ||||||||||||
| Total Miscellaneous Services | 1,250 | 1,250 | 0.54 | |||||||||||||
| Total Preferred Equity | $ | 1,801 | $ | 5,486 | 2.38 | % | ||||||||||
| Debt Investments | ||||||||||||||||
| Agricultural Services | ||||||||||||||||
| BFN Operations LLC , Term Loan*(4) | ||||||||||||||||
| LIBOR ("L") + 10.00%,1.00% Floor, 12/29/2017 | 10,500 | $ | 10,339 | $ | 5,040 | 2.18 | % | |||||||||
| Total Agricultural Services | 10,339 | 5,040 | 2.18 | |||||||||||||
| Automotive | ||||||||||||||||
| Penda Corporation, Term Loan(3) | ||||||||||||||||
| 14.00% Cash, 2.00% PIK, 1/26/2019 | 7,512 | 7,431 | 7,512 | 3.26 | ||||||||||||
| Total Automotive | 7,431 | 7,512 | 3.26 | |||||||||||||
See accompanying notes to consolidated financial statements.
| 89 |
Garrison Capital Inc. and Subsidiaries
Consolidated Schedule of Investments – (continued)
December 31, 2015
(in thousands)
| Security Description | Par / Shares | Cost | Fair Value | % of Net Assets | ||||||||||||
| Non-Control/Non-Affiliate Investments (continued) | ||||||||||||||||
| Investments - United States (continued) | ||||||||||||||||
| Debt Investments (continued) | ||||||||||||||||
| Broadcasting & Entertainment | ||||||||||||||||
| CF Entertainment Inc. (Entertainment Studios), Term Loan* | ||||||||||||||||
| L + 11.00%,1.00% L Floor, 6/26/2020 | 10,135 | $ | 10,063 | $ | 10,063 | 4.36 | % | |||||||||
| Sesac Holdco II, LLC, Term Loan (First Lien)* | ||||||||||||||||
| L+ 4.25%,1.00% L Floor, 2/8/2019 | 1,100 | 1,098 | 1,082 | 0.47 | ||||||||||||
| Total Broadcasting & Entertainment | 11,161 | 11,145 | 4.83 | |||||||||||||
| Building & Real Estate | ||||||||||||||||
| ShelterLogic Corp., Term Loan* | ||||||||||||||||
| L+ 9.50%,1.00% L Floor, 7/30/2019 | 10,106 | 9,962 | 9,961 | 4.32 | ||||||||||||
| Total Building & Real Estate | 9,962 | 9,961 | 4.32 | |||||||||||||
| Business Services | ||||||||||||||||
| Connexity, Inc., Term Loan* | ||||||||||||||||
| L+ 10.00%,1.00% L Floor, 2/13/2020 | 10,171 | 9,989 | 9,988 | 4.33 | ||||||||||||
| Total Business Services | 9,989 | 9,988 | 4.33 | |||||||||||||
| Chemicals | ||||||||||||||||
| Aristech Surfaces LLC, Term Loan B* | ||||||||||||||||
| L+ 8.00%,1.00% L Floor, 10/17/2019 | 10,238 | 10,102 | 10,101 | 4.38 | ||||||||||||
| Total Chemicals | 10,102 | 10,101 | 4.38 | |||||||||||||
| Communications | ||||||||||||||||
| HC Cable OpCo, LLC, Term Loan* | ||||||||||||||||
| L+ 8.50%,1.00% L Floor, 7/17/2018 | 10,760 | 10,665 | 10,760 | 4.66 | ||||||||||||
| Sirva Worldwide, Loan* | ||||||||||||||||
| L+ 6.25%,1.25% L Floor, 3/27/2019 | 8,090 | 8,069 | 7,807 | 3.38 | ||||||||||||
| TableTop Media, LLC, Lease** | ||||||||||||||||
| 10.00%, 10/15/2019 | 5,729 | 5,716 | 5,718 | 2.48 | ||||||||||||
| U.S. Telepacific Corp., Term Loan* | ||||||||||||||||
| L+ 5.00%,1.00% L Floor, 11/25/2020 | 1,995 | 1,983 | 1,898 | 0.83 | ||||||||||||
| Total Communications | 26,433 | 26,183 | 11.35 | |||||||||||||
| Consumer Finance Services | ||||||||||||||||
| Affiliated Wealth Partners Holdings LLC, Term Loan*(1) | ||||||||||||||||
| L+ 8.00%,1.00% L Floor, 9/15/2020 | 4,236 | 4,177 | 4,177 | 1.81 | ||||||||||||
| PlanMember Financial Corporation, Term Loan*(1) | ||||||||||||||||
| 6.50%,1.50% L Floor, 12/31/2020 | 1,245 | 1,231 | 1,245 | 0.54 | ||||||||||||
| Project Sunshine IV Pty Ltd (Sensis), New Term Loans*(1) | ||||||||||||||||
| L+ 7.00%,1.00% L Floor, 9/23/2019 | 9,627 | 9,437 | 9,146 | 3.97 | ||||||||||||
| Total Consumer Finance Services | 14,845 | 14,568 | 6.32 | |||||||||||||
| Computer Programming, Data Processing, & Other Computer Related Services | ||||||||||||||||
| Emtec Global Services Holdings, LLC, Term Loan** | ||||||||||||||||
| L+ 8.25%, 0.25% L Floor 11/30/2020 | 2,834 | 2,797 | 2,797 | 1.21 | ||||||||||||
| Emtec Global Services Holdings, LLC, Revolver | ||||||||||||||||
| L+ 8.25%, 0.25% L Floor 11/30/2020 | 131 | 131 | 129 | 0.06 | ||||||||||||
| Total Computer Programming, Data Processing, & Other Computer Related Services | 2,928 | 2,926 | 1.27 | |||||||||||||
| Cosmetics/Toiletries | ||||||||||||||||
| ActivStyle, Inc., Term Loan** | ||||||||||||||||
| L+ 9.00%, 0.50% L Floor, 7/9/2020 | 10,171 | 10,010 | 10,010 | 4.34 | ||||||||||||
| Total Cosmetics/Toiletries | 10,010 | 10,010 | 4.34 | |||||||||||||
| Electrical Equipment | ||||||||||||||||
| AbelConn, LLC (Atrenne Computing), Term Loan* | ||||||||||||||||
| L+ 8.50%,1.00% L Floor, 7/17/2019 | 10,375 | 10,228 | 10,228 | 4.43 | ||||||||||||
| Otter Products, LLC (OtterBox Holdings, Inc.), Term B Loan* | ||||||||||||||||
| L+ 4.75%,1.00% L Floor, 6/3/2020 | 2,000 | 1,957 | 1,908 | 0.83 | ||||||||||||
| Total Electrical Equipment | 12,185 | 12,136 | 5.26 | |||||||||||||
| Equipment Rental & Leasing, Not Elsewhere Classified | ||||||||||||||||
| University Furnishings, L.P., Term Loan B** | ||||||||||||||||
| L+ 6.75%, 0.50% L Floor, 12/17/2020 | 7,102 | 6,985 | 6,961 | 3.02 | ||||||||||||
| Total Equipment Rental & Leasing, Not Elsewhere Classified | 6,985 | 6,961 | 3.02 | |||||||||||||
| Food Stores - Retail | ||||||||||||||||
| Specialty Bakers LLC, Term Loan* | ||||||||||||||||
| L+ 7.25%,1.00% L Floor, 8/7/2019 | 9,435 | 9,290 | 9,290 | 4.03 | ||||||||||||
| Total Food Stores - Retail | 9,290 | 9,290 | 4.03 | |||||||||||||
See accompanying notes to consolidated financial statements.
| 90 |
Garrison Capital Inc. and Subsidiaries
Consolidated Schedule of Investments – (continued)
December 31, 2015
(in thousands)
| Security Description | Par / Shares | Cost | Fair Value | % of Net Assets | ||||||||||||
| Non-Control/Non-Affiliate Investments (continued) | ||||||||||||||||
| Investments - United States (continued) | ||||||||||||||||
| Debt Investments (continued) | ||||||||||||||||
| Health Services | ||||||||||||||||
| Aurora Diagnostics, LLC, Delayed Draw Term Loan | ||||||||||||||||
| L+ 7.13%,1.25% L Floor, 7/31/2019 | 850 | $ | 846 | $ | 846 | 0.37 | % | |||||||||
| Aurora Diagnostics, LLC, Term Loan* | ||||||||||||||||
| L+ 7.13%,1.25% L Floor, 7/31/2019 | 5,574 | 5,532 | 5,532 | 2.40 | ||||||||||||
| eResearchTechnology, Inc., Term Loan* | ||||||||||||||||
| L+ 4.50%,1.00% L Floor, 5/8/2022 | 1,995 | 1,980 | 1,952 | 0.85 | ||||||||||||
| Forest Park Medical Center at Fort Worth, LLC, Lease(4) | ||||||||||||||||
| 13.00%, 2/11/2020 | 9,246 | 9,114 | 7,397 | 3.21 | ||||||||||||
| Forest Park Medical Center at Fort Worth, LLC, Term Loan(4) | ||||||||||||||||
| 14.00%, on Demand | 344 | 337 | 276 | 0.12 | ||||||||||||
| Forest Park Medical Center at San Antonio, LLC, Lease(4) | ||||||||||||||||
| 13.00%, 2/11/2020 | 8,982 | 8,832 | 5,636 | 2.44 | ||||||||||||
| Forest Park Medical Center at San Antonio, LLC, Term Loan(4) | ||||||||||||||||
| 14.00%, on Demand | 1,951 | 1,914 | 1,224 | 0.53 | ||||||||||||
| SCG Capital Corporation (Radiation Therapy), Term Note | ||||||||||||||||
| 12.00%, 5/1/2017 | 3,656 | 3,656 | 3,656 | 1.58 | ||||||||||||
| Theragenics Corporation, Term Loan** | ||||||||||||||||
| L+ 12.00%,1.00% L Floor, 12/23/2020 | 6,324 | 6,216 | 6,233 | 2.70 | ||||||||||||
| Walnut Hill Physicians' Hospital, LLC, Lease | ||||||||||||||||
| 12.50%, 4/30/2019 | 7,725 | 7,725 | 7,725 | 3.35 | ||||||||||||
| Total Health Services | 46,152 | 40,477 | 17.55 | |||||||||||||
| Insurance Agents | ||||||||||||||||
| Worley Claims Services, LLC, Term Loan* | ||||||||||||||||
| L+ 8.00%,1.00% L Floor, 10/31/2020 | 10,395 | 10,325 | 10,311 | 4.47 | ||||||||||||
| Total Insurance Agents | 10,325 | 10,311 | 4.47 | |||||||||||||
| Metal Mining | ||||||||||||||||
| Metal Services LLC (Phoenix), New Term Loans* | ||||||||||||||||
| L+ 5.00%,1.00% L Floor, 6/30/2017 | 1,995 | 1,946 | 1,761 | 0.76 | ||||||||||||
| Total Metal Mining | 1,946 | 1,761 | 0.76 | |||||||||||||
| Miscellaneous Manufacturing | ||||||||||||||||
| AP Gaming I, LLC, Term B Loan* | ||||||||||||||||
| L+ 8.25%,1.00% L Floor, 12/21/2020 | 10,222 | 10,071 | 9,826 | 4.26 | ||||||||||||
| A.S.V., Inc., Term Loan* | ||||||||||||||||
| L+ 9.50%,1.00% L Floor, 12/19/2019 | 9,138 | 8,993 | 8,993 | 3.90 | ||||||||||||
| CR Brands, Inc., Term Loan* | ||||||||||||||||
| L+ 9.25%,1.00% L Floor, 8/23/2017 | 10,500 | 10,398 | 10,386 | 4.50 | ||||||||||||
| Gardner Denver, Inc., Initial Dollar Term Loan* | ||||||||||||||||
| L+ 3.25%,1.00% L Floor, 7/30/2020 | 1,995 | 1,879 | 1,797 | 0.78 | ||||||||||||
| Kranos Acquisition Corp., Term Loan* | ||||||||||||||||
| L+ 10.00% Cash,1.00% L Floor, 6/15/2017 | 9,338 | 9,282 | 9,295 | 4.03 | ||||||||||||
| Lexmark Carpet Mills, Inc., Term Loan* | ||||||||||||||||
| L+ 10.00%,1.00% L Floor, 12/19/2019 | 10,500 | 10,292 | 10,292 | 4.46 | ||||||||||||
| Pelican Products, Inc., Term Loan* | ||||||||||||||||
| L+ 4.25%,1.00% L Floor, 4/10/2020 | 1,995 | 1,976 | 1,955 | 0.85 | ||||||||||||
| PCCR USA, Inc., Term Loan A* | ||||||||||||||||
| L+ 8.00%,1.00% L Floor, 12/1/2019 | 6,825 | 6,718 | 6,718 | 2.91 | ||||||||||||
| PCCR USA, Inc., Term Loan B* | ||||||||||||||||
| L+ 8.00%,1.00% L Floor, 12/1/2019 | 3,413 | 3,346 | 3,346 | 1.45 | ||||||||||||
| Profusion Industries, LLC, Term Loan* | ||||||||||||||||
| L+ 9.00%,0.50% L Floor, 6/19/2020 | 10,300 | 10,116 | 10,116 | 4.38 | ||||||||||||
| Total Miscellaneous Manufacturing | 73,071 | 72,724 | 31.52 | |||||||||||||
See accompanying notes to consolidated financial statements.
| 91 |
Garrison Capital Inc. and Subsidiaries
Consolidated Schedule of Investments – (continued)
December 31, 2015
(in thousands)
| Security Description | Par / Shares | Cost | Fair Value | % of Net Assets | ||||||||||||
| Non-Control/Non-Affiliate Investments (continued) | ||||||||||||||||
| Investments - United States (continued) | ||||||||||||||||
| Debt Investments (continued) | ||||||||||||||||
| Miscellaneous Retail | ||||||||||||||||
| 360 Holdings III Corp., Term Loan* | ||||||||||||||||
| Prime Rate ("P") + 8.00%, 3.50% P, 10/1/2021 | 7,382 | $ | 7,088 | $ | 7,087 | 3.07 | % | |||||||||
| Confluence Outdoor, LLC, Term Loan* | ||||||||||||||||
| L+ 7.00%,1.00% L Floor, 4/18/2019 | 6,657 | 6,580 | 6,580 | 2.85 | ||||||||||||
| Confluence Outdoor, LLC, Delayed Draw Term Loan | ||||||||||||||||
| L+ 7.00%,1.00% L Floor, 4/18/2019 | 999 | 987 | 987 | 0.43 | ||||||||||||
| Interior Specialists, Inc., Term Loan* | ||||||||||||||||
| L+ 8.00%,1.00% L Floor, 6/30/2020 | 10,248 | 10,064 | 10,064 | 4.37 | ||||||||||||
| PD Products, LLC, Term Loan*(3) | ||||||||||||||||
| L+ 10.50%,1.50% L Floor, 10/4/2018 | 9,644 | 9,540 | 9,644 | 4.18 | ||||||||||||
| PD Products, LLC, Revolver | ||||||||||||||||
| L+ 10.50%,1.50% L Floor, 10/4/2018 | 673 | 673 | 673 | 0.29 | ||||||||||||
| Total Miscellaneous Retail | 34,932 | 35,035 | 15.19 | |||||||||||||
| Miscellaneous Services | ||||||||||||||||
| Simmons Research LLC, Term Loan* | ||||||||||||||||
| L+ 10.50%, 0.56% L, 12/11/2020 | 3,959 | 3,880 | 3,880 | 1.68 | ||||||||||||
| Speed Commerce, Inc., Term Loan*(4) | ||||||||||||||||
| P+ 13.00%,3.50% P, 11/21/2019 | 13,226 | 13,063 | 3,254 | 1.41 | ||||||||||||
| Sprint Industrial Holdings, LLC, Term Loan (First Lien)* | ||||||||||||||||
| L+ 5.75%,1.25% L Floor, 5/14/2019 | 4,824 | 4,802 | 4,028 | 1.75 | ||||||||||||
| YourMembership Holding Company, Term Loan A** | ||||||||||||||||
| L+ 7.00%,1.00% L Floor, 9/12/2019 | 10,056 | 9,992 | 9,978 | 4.32 | ||||||||||||
| Total Miscellaneous Services | 31,737 | 21,140 | 9.16 | |||||||||||||
| Nonferrous Metal/Minerals | ||||||||||||||||
| NN, Inc., Initial Term Loan* | ||||||||||||||||
| L+ 4.75%,1.00% L Floor, 10/19/2022 | 1,995 | 1,976 | 1,968 | 0.85 | ||||||||||||
| Total Nonferrous Metal/Minerals | 1,976 | 1,968 | 0.85 | |||||||||||||
| Oil & Gas | ||||||||||||||||
| Badlands Production Company (fka Gasco) , Term Loan* | ||||||||||||||||
| L+ 12.50%,1.00% L Floor, 5/14/2018 | 10,500 | 10,332 | 9,975 | 4.32 | ||||||||||||
| Rooster Energy Ltd., Term Loan* | ||||||||||||||||
| L+ 11.50%,1.50% L Floor, 6/25/2018 | 5,938 | 5,863 | 5,641 | 2.44 | ||||||||||||
| Iracore International Holdings, Inc., Term Loan* | ||||||||||||||||
| L+ 9.00%,1.00% L Floor, 7/10/2020 | 8,878 | 8,757 | 8,433 | 3.66 | ||||||||||||
| Total Oil & Gas | 24,952 | 24,049 | 10.42 | |||||||||||||
| Printing & Publishing | ||||||||||||||||
| Dodge Data & Analytics LLC, Term Loan* | ||||||||||||||||
| L+ 8.75%,1.00% L Floor, 10/31/2019 | 9,286 | 9,143 | 9,143 | 3.96 | ||||||||||||
| Total Printing & Publishing | 9,143 | 9,143 | 3.96 | |||||||||||||
| Retail-Building Materials, Hardware, Garden Supply & Mobile Home Dealers | ||||||||||||||||
| Builders FirstSource, Inc., Initial Term Loan* | ||||||||||||||||
| L+ 5.00%,1.00% L Floor, 7/31/2022 | 1,995 | 1,986 | 1,967 | 0.85 | ||||||||||||
| Total Retail-Building Materials, Hardware, Garden Supply & Mobile Home Dealers | 1,986 | 1,967 | 0.85 | |||||||||||||
See accompanying notes to consolidated financial statements.
| 92 |
Garrison Capital Inc. and Subsidiaries
Consolidated Schedule of Investments – (continued)
December 31, 2015
(in thousands)
| Security Description | Par / Shares | Cost | Fair Value | % of Net Assets | ||||||||||||
| Non-Control/Non-Affiliate Investments (continued) | ||||||||||||||||
| Investments - United States (continued) | ||||||||||||||||
| Debt Investments (continued) | ||||||||||||||||
| Specialty Services | ||||||||||||||||
| Vencore, Inc. (fka The SI Organization, Inc.), Initial Term Loan (First Lien)* | ||||||||||||||||
| L+ 4.75%,1.00% L Floor, 11/23/2019 | 1,995 | $ | 1,995 | $ | 1,982 | 0.86 | % | |||||||||
| Vistronix, LLC, Term Loan* | ||||||||||||||||
| L+ 8.50%, 0.50% L Floor, 12/4/2018 | 9,510 | 9,453 | 9,453 | 4.09 | ||||||||||||
| Vistronix, LLC, Revolver | ||||||||||||||||
| L+ 8.50%, 0.50% L Floor, 12/4/2018 | 560 | 560 | 557 | 0.24 | ||||||||||||
| USAGM Holdco, LLC, Initial Term Loan (First Lien)* | ||||||||||||||||
| L+ 3.75%,1.00% L Floor, 7/28/2022 | 2,000 | 1,951 | 1,908 | 0.83 | ||||||||||||
| Total Specialty Services | 13,959 | 13,900 | 6.02 | |||||||||||||
| Stone, Clay, Glass, & Concrete Products | ||||||||||||||||
| Stardust Finance Holdings, Inc., Term Loan* | ||||||||||||||||
| L+ 5.50%,1.00% L Floor, 3/13/2022 | 1,995 | 1,973 | 1,928 | 0.84 | ||||||||||||
| Total Stone, Clay, Glass, & Concrete Products | 1,973 | 1,928 | 0.84 | |||||||||||||
| Transportation Services | ||||||||||||||||
| Gruden Acquisition, Inc., Term Loan (First Lien)* | ||||||||||||||||
| L+ 4.75%,1.00% L Floor, 8/18/2022 | 2,000 | 1,961 | 1,908 | 0.83 | ||||||||||||
| Fleetgistics Holdings, Inc., Term Loan* | ||||||||||||||||
| L+ 6.13%,2.00% L Floor, 12/31/2018 | 1,002 | 1,002 | 902 | 0.39 | ||||||||||||
| MXD Group, Inc. (fka Exel Direct Inc.), Term Loan*(3) | ||||||||||||||||
| L+ 3.00% Cash, 10.00% PIK, 1.00% L Floor, 5/31/2018 | 14,322 | 14,205 | 13,606 | 5.89 | ||||||||||||
| Raymond Express International, LLC, Term Loan* | ||||||||||||||||
| L+ 7.75%,1.75% L Floor, 2/28/2018 | 1,695 | 1,687 | 1,695 | 0.73 | ||||||||||||
| Total Transportation Services | 18,855 | 18,111 | 7.84 | |||||||||||||
| Total Debt Investments | $ | 412,667 | $ | 388,335 | 168.32 | % | ||||||||||
| Financial Assets | ||||||||||||||||
| Consumer Finance Services | ||||||||||||||||
| GLC Trust 2013-2 Consumer Loan Pool(1)(5) | 18,688 | $ | 18,688 | $ | 17,754 | 7.70 | % | |||||||||
| Total Consumer Finance Services | 18,688 | 17,754 | 7.70 | |||||||||||||
| Total Financial Assets | $ | 18,688 | $ | 17,754 | 7.70 | % | ||||||||||
| Unfunded Obligations | ||||||||||||||||
| Communications | ||||||||||||||||
| HC Cable OpCo, LLC, Revolver(6) | ||||||||||||||||
| 0.50%, 7/17/2018 | 955 | $ | (8 | ) | $ | - | - | % | ||||||||
| Total Communications | (8 | ) | - | - | ||||||||||||
| Computer Programming, Data Processing, & Other Computer Related Services | ||||||||||||||||
| Emtec Global Services Holdings, LLC, Revolver(6) | ||||||||||||||||
| 0.00%, 11/30/2020 | 327 | (6 | ) | (5 | ) | - | ||||||||||
| Emtec Global Services Holdings, LLC, Delayed Draw Term Loan(6) | ||||||||||||||||
| 0.00%, 11/30/2020 | 271 | (4 | ) | (4 | ) | - | ||||||||||
| Total Computer Programming, Data Processing, & Other Computer Related Services | (10 | ) | (9 | ) | - | |||||||||||
| Health Services | ||||||||||||||||
| Aurora Diagnostics, LLC, Delayed Draw Term Loan B(6) | ||||||||||||||||
| 2.25%, 7/31/2019 | 2,393 | (20 | ) | (20 | ) | (0.01 | ) | |||||||||
| Aurora Diagnostics, LLC, Revolver(6) | ||||||||||||||||
| 0.38%, 7/31/2019 | 1,020 | (8 | ) | (8 | ) | - | ||||||||||
| Total Health Services | (28 | ) | (28 | ) | (0.01 | ) | ||||||||||
| Miscellaneous Retail | ||||||||||||||||
| PD Products, LLC, Revolver(6) | ||||||||||||||||
| 0.50%, 10/4/2018 | 968 | (18 | ) | - | (0.01 | ) | ||||||||||
| Total Miscellaneous Retail | (18 | ) | - | (0.01 | ) | |||||||||||
See accompanying notes to consolidated financial statements.
| 93 |
Garrison Capital Inc. and Subsidiaries
Consolidated Schedule of Investments – (continued)
December 31, 2015
(in thousands)
| Security Description | Par / Shares | Cost | Fair Value | % of Net Assets | ||||||||||||
| Non-Control/Non-Affiliate Investments (continued) | ||||||||||||||||
| Investments - United States (continued) | ||||||||||||||||
| Unfunded Obligations (continued) | ||||||||||||||||
| Miscellaneous Services | ||||||||||||||||
| YourMembership Holding Company, Revolver(6) | ||||||||||||||||
| 0.00%, 9/12/2019 | 441 | $ | (3 | ) | $ | (3 | ) | - | % | |||||||
| Total Miscellaneous Services | (3 | ) | (3 | ) | - | |||||||||||
| Specialty Services | ||||||||||||||||
| Vistronix, LLC, Revolver(6) | ||||||||||||||||
| 0.50%, 12/4/2018 | 315 | (5 | ) | (2 | ) | - | ||||||||||
| Total Specialty Services | (5 | ) | (2 | ) | - | |||||||||||
| Transportation Services | ||||||||||||||||
| Raymond Express International, LLC, Revolver | ||||||||||||||||
| 0.50%, 2/28/2018 | 215 | (1 | ) | - | - | |||||||||||
| Total Transportation Services | (1 | ) | - | - | ||||||||||||
| Total Unfunded Obligations | $ | (73 | ) | $ | (42 | ) | (0.02 | )% | ||||||||
| Total Non-Control/Non-Affiliate Investments | $ | 437,053 | $ | 415,001 | 179.88 | % | ||||||||||
______________
| * | Denotes that all or a portion of the investment is held as collateral by the 2013-2 CLO (see Note 7). |
| ** | Denotes that all or a portion of the loan is held by Garrison SBIC. |
L = London Interbank Offered Rate.
P = Prime Rate
| (1) | Not a qualifying asset under Section 55(a) of the 1940 Act. Under the 1940 Act, the Company may not acquire any non-qualifying asset unless, at the time the acquisition is made, qualifying assets represent at least 70% of the Company’s total assets. | |
| (2) | Net of incentive fee payable to a third party equal to 20% of any distribution after the Company has received its full net capital investment plus a 12% preferred return in GLC Trust 2013-2 and Prosper Marketplace Series B Preferred Stock. | |
| (3) | Coupon is payable in cash, and/or PIK, or a combination thereof. | |
| (4) | Investment is currently not income producing and placed on non-accrual status. | |
| (5) | GLC Trust 2013-2 includes 2,637 small balance consumer loans with an average par of $7,087, a weighted average rate of 15.6% and a weighted average maturity of May 8, 2018. See Note 4 for additional information. See exhibit 99.1 to the Company’s Annual Report on Form 10-K for the year ended December 31, 2015 for detail on underlying loans. | |
| (6) | The negative fair value is the result of the unfunded commitments being valued below par. These amounts may or may not be funded to the borrowing party currently or in the future. |
All debt investments were income producing as of December 31, 2015, unless otherwise noted. Common and preferred equity investments are non-income producing unless otherwise noted.
See accompanying notes to consolidated financial statements.
| 94 |
Garrison Capital Inc. and Subsidiaries
Consolidated Statements of Operations
($ in thousands, except share and per share amounts)
| Year Ended | Year Ended | Year Ended | ||||||||||
| December 31, 2016 | December 31, 2015 | December 31, 2014 | ||||||||||
| Investment income | ||||||||||||
| Interest income | ||||||||||||
| Non-control/non-affiliate investments | $ | 41,586 | $ | 48,592 | $ | 46,788 | ||||||
| Non-control/affiliate investments | 179 | - | 462 | |||||||||
| Other income | 1,186 | 2,725 | 2,823 | |||||||||
| Dividend income | ||||||||||||
| Affiliate investments | - | - | 386 | |||||||||
| Total investment income | 42,951 | 51,317 | 50,459 | |||||||||
| Expenses | ||||||||||||
| Interest expense | 9,859 | 7,428 | 7,157 | |||||||||
| Loss on refinancing of secured notes (see Note 7) | 1,828 | - | - | |||||||||
| Loss on refinancing of GLC Trust 2013-2 revolver (see Note 7) | - | - | 243 | |||||||||
| Management fee | 7,221 | 7,755 | 8,065 | |||||||||
| Incentive fee | - | 1,135 | 8,409 | |||||||||
| Professional fees | 1,369 | 1,309 | 1,160 | |||||||||
| Directors' fees | 379 | 405 | 379 | |||||||||
| Administrator expenses | 1,260 | 1,052 | 712 | |||||||||
| Other expenses | 2,149 | 2,099 | 2,262 | |||||||||
| Total expenses | 24,065 | 21,183 | 28,387 | |||||||||
| Base management fee waived | (249 | ) | - | - | ||||||||
| Net expenses | 23,816 | 21,183 | 28,387 | |||||||||
| Net investment income before excise taxes | 19,135 | 30,134 | 22,072 | |||||||||
| Excise tax expense | (50 | ) | (190 | ) | (63 | ) | ||||||
| Net investment income | 19,085 | 29,944 | 22,009 | |||||||||
| Realized and unrealized gain/(loss) on investments | ||||||||||||
Net realized gain/(loss) from investments | ||||||||||||
| Non-control/non-affiliate investments | (30,591 | ) | (11,685 | ) | 2,200 | |||||||
| Affiliate investments | - | - | 8,502 | |||||||||
| Net change in unrealized gain/(loss) from investments | ||||||||||||
| Non-control/non-affiliate investments | 6,696 | (21,919 | ) | (389 | ) | |||||||
| Affiliate investments | - | - | (1,838 | ) | ||||||||
Net realized and unrealized gain/(loss) on investments | (23,895 | ) | (33,604 | ) | 8,475 | |||||||
| Net (decrease)/increase in net assets resulting from operations | $ | (4,810 | ) | $ | (3,660 | ) | $ | 30,484 | ||||
| Net investment income per common share | $ | 1.18 | $ | 1.79 | $ | 1.31 | ||||||
| Net (decrease)/increase in net assets resulting from operations per common share | $ | (0.30 | ) | $ | (0.22 | ) | $ | 1.82 | ||||
| Basic weighted average common shares outstanding(1) | 16,149,866 | 16,742,531 | 16,758,779 | |||||||||
| Dividends and distributions declared per common share | $ | 1.33 | $ | 1.40 | $ | 1.40 | ||||||
______________
| (1) | Calculated using basic weighted average common shares outstanding. |
See accompanying notes to consolidated financial statements.
| 95 |
Garrison Capital Inc. and Subsidiaries
Consolidated Statements of Changes in Net Assets
($ in thousands, except share and per share amounts)
| Year Ended | Year Ended | Year Ended | ||||||||||
| December 31, 2016 | December 31, 2015 | December 31, 2014 | ||||||||||
| (Decrease)/increase in net assets from operations: | ||||||||||||
| Net investment income | $ | 19,085 | $ | 29,944 | $ | 22,009 | ||||||
Net realized (loss)/gain from investments | (30,591 | ) | (11,685 | ) | 10,702 | |||||||
| Net change in unrealized gain/(loss) on investments | 6,696 | (21,919 | ) | (2,227 | ) | |||||||
| Net (decrease)/increase in net assets from operations | (4,810 | ) | (3,660 | ) | 30,484 | |||||||
| Dividends and distributions to stockholders: | ||||||||||||
| From net investment income | (21,451 | ) | (23,418 | ) | (20,907 | ) | ||||||
| From realized gains | - | - | (2,555 | ) | ||||||||
| Total dividends and distributions to stockholders(1) | (21,451 | ) | (23,418 | ) | (23,462 | ) | ||||||
| Common share transactions | ||||||||||||
| Repurchase of common stock (see Note 14) | (5,041 | ) | (3,314 | ) | - | |||||||
| Net (decrease) in net assets from common share transactions | (5,041 | ) | (3,314 | ) | - | |||||||
Total (decrease)/increase in net assets | (31,302 | ) | (30,393 | ) | 7,022 | |||||||
| Net assets at beginning of period | 230,710 | 261,103 | 254,081 | |||||||||
| Net assets at end of period | $ | 199,408 | $ | 230,710 | $ | 261,103 | ||||||
| Net asset value per common share | $ | 12.42 | $ | 13.98 | $ | 15.58 | ||||||
| Common shares outstanding at end of period | 16,049,352 | 16,507,594 | 16,758,779 | |||||||||
| Underdistributed net investment income included in net assets | $ | 5,165 | $ | 8,782 | $ | - | ||||||
| (1) | Dividends from net investment income are determined in accordance with U.S. federal income tax regulations, which may differ from those amounts determined in accordance with U.S. GAAP. |
See accompanying notes to consolidated financial statements.
| 96 |
Garrison Capital Inc. and Subsidiaries
Consolidated Statements of Cash Flows
($ in thousands, except share and per share amounts)
| Year Ended | Year Ended | Year Ended | ||||||||||
| December 31, 2016 | December 31, 2015 | December 31, 2014 | ||||||||||
| Cash flows from operating activities | ||||||||||||
| Net (decrease)/increase in net assets resulting from operations | $ | (4,810 | ) | $ | (3,660 | ) | 30,484 | |||||
| Adjustments to reconcile net increase in net assets resulting from operations to net cash provided by operating activities: | ||||||||||||
| Net accretion of discounts on investments | (1,536 | ) | (1,638 | ) | (1,883 | ) | ||||||
| Net realized loss/(gain) from investments | 30,591 | 11,685 | (10,702 | ) | ||||||||
| Amortization of discount on senior secured notes payable | 186 | 292 | 175 | |||||||||
| Loss on refinancing of secured notes | 1,828 | - | 243 | |||||||||
| Amortization of deferred debt issuance costs | 2,259 | 799 | 741 | |||||||||
| Net change in unrealized loss/(gain) on investments | (6,696 | ) | 21,919 | 2,227 | ||||||||
| Payment-in-kind interest | (1,494 | ) | (2,454 | ) | (679 | ) | ||||||
| Purchases of investments | (123,887 | ) | (181,042 | ) | (427,123 | ) | ||||||
| Paydowns of investments | 107,185 | 198,188 | 293,860 | |||||||||
| Sales of investments | 34,132 | 6,111 | 105,612 | |||||||||
| Changes in operating assets and liabilities: | ||||||||||||
| (Increase)/decrease in cash, restricted | (735 | ) | 2,427 | 13,704 | ||||||||
| (Increase)/decrease in due from counterparties | (519 | ) | 51 | 5,045 | ||||||||
| Decrease/(increase) in accrued interest receivable | 2,532 | (2,412 | ) | (842 | ) | |||||||
| Decrease/(increase) in prepaid administrator fee | - | 74 | (74 | ) | ||||||||
| (Increase) in other assets | (99 | ) | (315 | ) | (387 | ) | ||||||
| (Decrease)/increase in due to counterparties | (368 | ) | 259 | (7,731 | ) | |||||||
| (Decrease)/increase in payables to affiliates | (1,786 | ) | (1,257 | ) | 1,768 | |||||||
| Increase/(decrease) in interest payable on notes payable | 282 | 117 | (798 | ) | ||||||||
| (Decrease)/increase in accrued expenses and other payables | (40) | 342 | (339 | ) | ||||||||
| Net cash provided by operating activities | 37,025 | 49,486 | 3,301 | |||||||||
| Cash flows from financing activities | ||||||||||||
| Repurchase of common stock | (5,041 | ) | (3,314 | ) | - | |||||||
| Distributions paid to stockholders | (21,451 | ) | (23,418 | ) | (23,462 | ) | ||||||
| Payments for financing costs | (2,830 | ) | (828 | ) | (514 | ) | ||||||
| Proceeds of senior secured revolving notes | (35,000 | ) | (15,000 | ) | - | |||||||
| Repayment of GLC Trust 2013-2 Class A notes | (10,929 | ) | (14,932 | ) | - | |||||||
| Repayment of GLC Trust 2013-2 revolving notes | - | - | (9,742 | ) | ||||||||
| Net proceeds from GLC Trust 2013-2 notes | - | - | 30,403 | |||||||||
| Proceeds from SBIC borrowings | 17,660 | 19,340 | - | |||||||||
| Proceeds from borrowing on senior secured term notes | 5,959 | - | - | |||||||||
| Net cash (used in) financing activities | (51,632 | ) | (38,152 | ) | (3,315 | ) | ||||||
| Net increase/(decrease) in cash | (14,607 | ) | 11,334 | (14 | ) | |||||||
| Cash at beginning of period | 24,985 | 13,651 | 13,665 | |||||||||
| Cash at end of period | $ | 10,378 |
$ | 24,985 | $ | 13,651 | ||||||
| Supplemental disclosure of cash flow information | ||||||||||||
| Cash paid for interest expense | $ | 7,211 | $ | 6,097 | $ | 7,065 | ||||||
| Supplemental disclosure of non-cash activities | ||||||||||||
| Restructuring of portfolio investment | $ | 840 | $ | 3,986 | - | |||||||
See accompanying notes to consolidated financial statements.
| 97 |
Garrison Capital Inc. and Subsidiaries
Notes to Consolidated Financial Statements
December 31, 2016
1. Organization
Garrison Capital Inc. (“GARS” and, collectively with its subsidiaries, the “Company”, “we” or “our”) is a Delaware corporation and is an externally managed, closed-end, non-diversified management investment company that has filed an election to be treated as a business development company (“BDC”) under the Investment Company Act of 1940, as amended (the “1940 Act”). In addition, for tax purposes, GARS has elected to be treated as a regulated investment company (“RIC”) under Subchapter M of the Internal Revenue Code of 1986, as amended (the “Code”), for the period beginning October 9, 2012 and intends to qualify annually thereafter. GARS’ shares trade on the NASDAQ Global Select Market (“NASDAQ”) under the symbol “GARS”.
Our investment objective is to generate current income and capital appreciation by making investments generally in the range of $5.0 million to $25.0 million primarily in debt securities and loans of U.S. based middle-market companies, which we define as those having annual earnings before interest, taxes, depreciation and amortization (“EBITDA”) of between $5.0 million and $50.0 million. Our goal is to generate attractive risk-adjusted returns by assembling a broad portfolio of investments.
We invest or provide direct lending primarily in (1) first lien senior secured loans, (2) second lien senior secured loans, (3) “one-stop” senior secured or “unitranche” loans, (4) subordinated or mezzanine loans, (5) unsecured consumer loans and (6) to a lesser extent, selected equity co-investments in middle-market companies. We use the term “one-stop” or “unitranche” to refer to a loan that combines characteristics of traditional first lien senior secured loans and second lien or subordinated loans. We use the term “mezzanine” to refer to a loan that ranks senior only to a borrower’s equity securities and ranks junior in right of payment to all of such borrower’s other indebtedness.
The Company’s business and affairs are managed and controlled by the Company’s board of directors (the “Board”).
| 98 |
Garrison Capital Inc. and Subsidiaries
Notes to Consolidated Financial Statements
December 31, 2016
1. Organization – (continued)
On May 17, 2013, GARS formed GLC Trust 2013-2, a Delaware statutory trust (“GLC Trust 2013-2”). This entity is a wholly owned subsidiary of GARS created for the purpose of investing in a portfolio of small balance consumer loans. GLC Trust 2013-2 is 100% owned by GARS. On July 18, 2014, GARS completed a $39.2 million term debt securitization (the “GLC Trust 2013-2 Securitization” and the notes offered thereby, the “GLC Trust 2013-2 Notes”) collateralized by the GLC Trust 2013-2 consumer loan portfolio.
On September 25, 2013, Garrison Funding 2013-2 Ltd. (“GF 2013-2”) completed a $350.0 million collateralized loan obligation (the “2013-2 CLO”) through a private placement, the proceeds of which were utilized, along with cash on hand, to refinance an existing credit facility (see Note 7). Immediately following the completion of the 2013-2 CLO, Garrison Funding 2013-2 Manager LLC (“GF 2013-2 Manager”) owned 100% of the 2013-2 CLO Subordinated Notes (as defined below). GF 2013-2 Manager served as collateral manager to GF 2013-2 and entered into a sub-collateral management agreement with Garrison Capital Advisers LLC (the “Investment Adviser”).
On May 29, 2014, Garrison Capital SBIC LP (“Garrison SBIC”), which has an investment objective substantially similar to GARS, was formed in accordance with small business investment company (“SBIC”) regulations to acquire up to $150.0 million in financing. Garrison SBIC received a license from the U.S Small Business Administration (the “SBA”) on May 26, 2015. Garrison SBIC is 100% owned by GARS.
On August 18, 2016 and September 14, 2016, GARS formed Garrison Funding 2016-2 Ltd. and Garrison Funding 2016-2 LLC, respectively. Garrison Funding 2016-2 LLC is a wholly-owned and consolidated subsidiary of Garrison Funding 2016-2 Ltd. (collectively referred to as “GF 2016-2”). GF 2016-2 is a wholly-owned and consolidated subsidiary of GARS. GF 2016-2 completed a $300.0 million collateralized loan obligation (the “2016-2 CLO”) through a private placement, the proceeds of which were utilized, along with cash on hand, to refinance the 2013-2 CLO (see Note 7). GARS owns 100% of the 2016-2 CLO Subordinated Notes (as defined below). GARS serves as collateral manager to GF 2016-2 and has entered into a sub-collateral management agreement with the Investment Adviser. The 2013-2 CLO and 2016-2 CLO are collectively referred to as “the CLOs”.
GARS will periodically form limited liability companies for the purpose of holding minority equity investments (the “GARS Equity Holdings Entities”). GARS intends to form a new GARS Equity Holdings Entity for each minority equity investment in order to provide specific tax treatment for individual investments. The GARS Equity Holdings Entities are 100% owned by GARS.
American Stock Transfer & Trust Company, LLC (“AST”) serves as the transfer and dividend paying agent and registrar to GARS.
| 99 |
Garrison Capital Inc. and Subsidiaries
Notes to Consolidated Financial Statements
December 31, 2016
1. Organization – (continued)
GARS entered into a custody agreement, which was effective as of October 9, 2012 (the “Custody Agreement”), with Deutsche Bank Trust Company Americas (the “Custodian”) to act as custodian for GARS. The Custodian is also the trustee of the CLOs and the custodian for Garrison SBIC.
GARS entered into an administration agreement, which was effective as of October 9, 2012 (the “Administration Agreement”), with Garrison Capital Administrator LLC, a Delaware limited liability company (the “GARS Administrator”).
GARS entered into an investment advisory agreement with the Investment Adviser, which was most recently amended and restated on August 5, 2016 (the “Investment Advisory Agreement”).
The Investment Adviser is responsible for sourcing potential investments, conducting research and diligence on prospective investments and equity sponsors, analyzing investment opportunities, structuring our investments and monitoring our investments and portfolio companies on an ongoing basis subject to the supervision of the Board. The Investment Adviser was organized in November 2010 and is a registered investment adviser under the Investment Advisers Act of 1940, as amended. The Investment Adviser is an affiliate of Garrison Investment Group LP (the “Investment Manager”), which is also the investment manager of various stockholders of the Company.
GLC Trust 2013-2 has entered into agreements with Prosper Funding LLC, GARS Administrator, U.S. Bank National Association, Wilmington Trust, National Association and Manufacturers and Traders Trust Company to act as servicer, securities administrator, indenture trustee and custodian, respectively, for GLC Trust 2013-2.
2. Significant Accounting Policies and Recent Updates
Basis of Presentation
The Company is an investment company as defined in the accounting and reporting guidance under Financial Accounting Standards Board (“FASB”) Accounting Standards Codification (“ASC”) Topic 946 — Financial Services — Investment Companies (“ASC Topic 946”).
The accompanying consolidated financial statements have been prepared in accordance with generally accepted accounting principles in the United States of America (“U.S. GAAP”) for financial information and pursuant to the requirements for reporting on Form 10-K and Articles 6 or 10 of Regulation S-X. The consolidated financial statements include the accounts of GARS and its wholly-owned subsidiaries. In the opinion of management, the consolidated financial statements reflect all adjustments and reclassifications consisting solely of normal accruals that are necessary for the fair presentation of financial results as of and for the periods presented. All intercompany balances and transactions have been eliminated in consolidation. The accounts of the subsidiaries are prepared for the same reporting period as GARS using consistent accounting policies. Certain prior period amounts have been reclassified to conform to the current period presentation including but not limited to deferred financing costs and deferred offering costs.
Basis for Consolidation
The consolidated financial statements include the accounts of GARS and its wholly owned subsidiaries. Intercompany accounts and transactions have been eliminated in consolidation. The accounts of the subsidiaries are prepared for the same reporting period as GARS using consistent accounting policies. Under the investment company rules and regulations pursuant to the American Institute of Certified Public Accountants Audit and Accounting Guide for Investment Companies, codified in ASC Topic 946, the Company is precluded from consolidating any entity other than another investment company.
The Company generally consolidates any investment company when it owns 100% of its partners’ or members’ capital or equity units or 100% of the economic equity interest. ASC Topic 946 provides for the consolidation of a controlled operating company that provides substantially all of its services to the investment company or its consolidated subsidiaries.
GF 2013-2 Manager owns a 100% economic interest in GF 2013-2, which is an investment company for accounting purposes, and also provides collateral management services solely to GF 2013-2. As such, GARS has consolidated the accounts of these entities into these consolidated financial statements. As a result of this consolidation, the amounts that were outstanding under the 2013-2 CLO were treated as the Company’s indebtedness.
GARS owns a 100% economic interest in GF 2016-2, which is an investment company for accounting purposes. GARS provides collateral management services for 2016-2 CLO. As such, GARS has consolidated the accounts of these entities into these consolidated financial statements. As a result of this consolidation, the amounts outstanding under the 2016-2 CLO are treated as the Company’s indebtedness.
| 100 |
Garrison Capital Inc. and Subsidiaries
Notes to Consolidated Financial Statements
December 31, 2016
2. Significant Accounting Policies and Recent Updates – (continued)
The GARS Equity Holdings Entities, Walnut Hill II LLC, Forest Park II LLC, Garrison SBIC and GLC Trust 2013-2 are 100% owned investment companies for accounting purposes. As such, GARS has consolidated the accounts of these entities into these consolidated financial statements. As a result of this consolidation, indebtedness of Garrison SBIC and the amounts outstanding under the GLC Trust 2013-2 Class A Notes are treated as the Company’s indebtedness.
Investment Classification
As required by the 1940 Act, investments are classified by level of control. “Control Investments” are investments in those companies that the Company is deemed to control as defined in the 1940 Act. “Affiliate Investments” are investments in those companies that are affiliated companies, as defined in the 1940 Act, other than Control Investments. “Non-Control/Non-Affiliate Investments” are those that are neither Control Investments nor Affiliate Investments.
Generally, under the 1940 Act, the Company is deemed to control a company in which it has invested if it owns more than 25% of the voting securities of such company. The Company is deemed to be an affiliate of a company in which it has invested if it owns 5% or more of the voting securities of such company.
As of December 31, 2016, $373.6 million of the Company’s investments were made up of Non-Control/Non-Affiliate Investments and $3.1 million were Non-Control/Affiliate Investments. As of December 31, 2015, all of the Company’s investments were Non-Control/Non-Affiliate Investments.
Use of Estimates
The preparation of consolidated financial statements in conformity with U.S. GAAP requires management to make estimates and assumptions that affect the amounts and disclosures in the consolidated financial statements, including the estimated fair values of investments and the amount of income and expenses during the reporting period. Actual results could differ from those estimates.
Cash and Cash Equivalents
As of December 31, 2016 and December 31, 2015, cash held in designated bank accounts with the Custodian was $9.1 million and $23.4 million, respectively. As of December 31, 2016 and December 31, 2015, cash held in designated bank accounts with other major financial institutions was $1.3 million and $1.6 million, respectively. At times, these balances may exceed federally insured limits and this potentially subjects the Company to a concentration of credit risk. The Company believes it is not exposed to any significant credit risk associated with its cash custodian.
The Company defines cash equivalents as highly liquid financial instruments with original maturities of three months or less, including those held in overnight sweep bank deposit accounts. As of December 31, 2016 and December 31, 2015, the Company held no cash equivalents.
Cash and Cash Equivalents, restricted
Restricted cash as of December 31, 2016 and December 31, 2015 included cash of $11.3 million and $10.4 million, respectively, held by GF 2016-2 and GF 2013-2, respectively, in designated bank accounts with the Custodian. The CLOs are required to use a portion of these amounts to pay interest expense, reduce borrowings at the end of the investment period and to pay other amounts in accordance with the terms of the indentures of the CLOs. Funds held by GF 2016-2 and GF 2013-2 are not available for general use by the Company. Restricted cash as of December 31, 2016 and December 31, 2015 also included cash of $1.3 million and $1.4 million, respectively, held by GLC Trust 2013-2 in designated restricted bank accounts. GLC Trust 2013-2 is required to use a portion of these amounts to make principal payments and pay interest expense in accordance with the terms of the indenture governing the GLC Trust 2013-2 Notes.
As of both December 31, 2016 and December 31, 2015, the Company held no restricted cash equivalents.
| 101 |
Garrison Capital Inc. and Subsidiaries
Notes to Consolidated Financial Statements
December 31, 2016
2. Significant Accounting Policies and Recent Updates – (continued)
Investment Transactions and Related Investment Income and Expense
The Company records its investment transactions on a trade date basis, which is the date when management has determined that all material legal terms have been contractually defined for the transactions. These transactions could possibly settle on a subsequent date depending on the transaction type. All related revenue and expenses attributable to these transactions are reflected on the consolidated statements of operations commencing on the trade date unless otherwise specified by the transaction documents. Realized gains and losses on investment transactions are recorded using the specific identification method.
The Company accrues interest income if it expects that ultimately it will be able to collect such income. Generally, when a payment default occurs on a loan in the portfolio, or if management otherwise believes that the issuer of the loan will not be able to make contractual interest payments or principal payments, the Investment Adviser will place the loan on non-accrual status and will cease recognizing interest income on that loan until all principal and interest is current through payment or until a restructuring occurs, such that the interest income is deemed to be collectible. However, the Company remains contractually entitled to this interest.
The Company may make exceptions to this policy if the loan has sufficient collateral value and is in the process of collection. Accrued interest is written off when it becomes probable that the interest will not be collected and the amount of uncollectible interest can be reasonably estimated. For consumer loans, any loan which is 120 days past due is considered defaulted and 100% of the principal is charged off with no expected recovery or sale of defaulted receivables. The Company recognized $1.3 million and $2.7 million in charge offs in realized losses from investments for consumer loans held by GLC Trust 2013-2 for the years ended December 31, 2016 and December 31, 2015, respectively. As of December 31, 2016 and December 31, 2015, the Company had two investments and four investments, respectively, that were placed on non-accrual status.
Any original issue discounts, as well as any other purchase discounts or premiums on debt investments, are accreted or amortized and included in interest income over the maturity periods of the investments. If a loan is placed on non-accrual status, the Company will cease recognizing amortization of original issue discount and purchase discount until all principal and interest is current through payment or until a restructuring occurs, such that the income is deemed to be collectible.
Dividend income on preferred equity securities is recorded as dividend income on an accrual basis to the extent that such amounts are payable by the portfolio company and are expected to be collected.
Interest Expense
Interest expense is recorded on an accrual basis and is adjusted for amortization of deferred debt issuance costs and any original issue discount.
Expenses
Expenses related to, but not limited to, ratings expenses, due diligence, valuation expenses and independent collateral appraisals may arise when the Company makes certain investments. These expenses, as well as insurance expenses and trustee expenses are recognized as incurred in the consolidated statements of operations within other expenses.
Loan Origination, Facility, Commitment and Amendment Fees
The Company may receive loan origination, prepayment, facility, commitment, forbearance and amendment fees in addition to interest income during the life of the investment. The Company may receive origination fees upon the origination of an investment.
Origination fees received by the Company are initially deferred and reduced from the cost basis of the investment and subsequently accreted into interest income over the stated term of the loan.
| 102 |
Garrison Capital Inc. and Subsidiaries
Notes to Consolidated Financial Statements
December 31, 2016
2. Significant Accounting Policies and Recent Updates – (continued)
Upon the prepayment of a loan or debt security, any unamortized loan origination fees are recorded as interest income. We record prepayment premiums on loans and debt securities as interest income when we receive such amounts. Facility fees, sometimes referred to as asset management fees, are accrued as a percentage periodic fee on the base amount (either the funded facility amount or the committed principal amount). Commitment fees are based upon the undrawn portion committed by the Company and are accrued over the life of the loan.
Amendment and forbearance fees are paid in connection with loan amendments and waivers and are recognized upon completion of the amendments or waivers, generally when such fees are receivable. Any such fees are recorded and classified as other income and included in investment income on the consolidated statements of operations. As these fees are paid and recognized in connection with specific loan amendments or forbearance, they are typically non-recurring in nature.
Valuation of Investments
The Company values its investments in accordance with FASB ASC Topic 820, Fair Value Measurements and Disclosures (formerly FASB Statement No. 157, “ASC 820”). ASC 820 defines fair value, establishes a framework for measuring fair value and expands disclosures about assets and liabilities measured at fair value.
ASC 820’s definition of fair value focuses on exit price in the principal, or most advantageous, market and prioritizes the use of market-based inputs over entity-specific inputs within a measurement of fair value.
The Company’s portfolio consists of primarily debt investments and unsecured consumer loans. The fair value of the Company’s investments is initially determined by investment professionals of the Investment Adviser and ultimately determined by the Board on a quarterly basis. In valuing the Company’s debt investments, the Investment Adviser generally uses various approaches, including proprietary models that consider the analyses of independent valuation agents as well as credit risk, liquidity, market credit spreads, other applicable factors for similar transactions, and bid quotations obtained from other financial institutions that trade in similar investments or based on bid prices provided by independent third party pricing services.
The types of factors that the Board may take into account when reviewing the fair value initially derived by the Investment Adviser and determining the fair value of the Company’s debt investments generally include, as appropriate, comparison to publicly traded securities, including such factors as yield, maturity and measures of credit quality, the enterprise value of a portfolio company, the nature and realizable value of any collateral, the portfolio company’s ability to make payments and its earnings and discounted cash flow, the markets in which the portfolio company does business and other relevant factors.
In valuing the Company’s unsecured consumer loans, the Investment Adviser generally uses a discounted cash flow methodology based upon a set of assumptions. The primary assumptions used to value the unsecured consumer loans include prepayment and default rates derived from historical performance, actual performance as compared to historical projections and discount rate.
The types of factors that the Board may take into account when reviewing the fair value initially derived by the Investment Adviser and determining the fair value of the Company’s consumer loan investments generally include, as appropriate, prepayment and default rates derived from historical performance, actual performance as compared to historical projections and discount rates.
The Board has retained several independent valuation firms to review the valuation of each portfolio investment that does not have a readily available market quotation at least once during each 12-month period. To the extent a security is reviewed in a particular quarter, it is reviewed and valued by only one service provider.
However, the Board does not intend to have de minimis investments of less than 0.5% of the Company’s total assets (up to an aggregate of 10.0% of the Company’s total assets) independently reviewed.
The Board is responsible for determining the fair value of the Company’s assets in good faith using a documented valuation policy and consistently applied valuation process.
| 103 |
Garrison Capital Inc. and Subsidiaries
Notes to Consolidated Financial Statements
December 31, 2016
2. Significant Accounting Policies and Recent Updates – (continued)
Due to the nature of the Company’s strategy, the Company’s portfolio is primarily comprised of relatively illiquid investments that are privately held. Inputs into the determination of fair value of the Company’s portfolio investments require significant management judgment or estimation. This means that the Company’s portfolio valuations are based on unobservable inputs and the Investment Adviser’s own assumptions about how market participants would price the asset or liability in question. Valuations of privately held investments are inherently uncertain and they may fluctuate over short periods of time and may be based on estimates. The determination of fair value by the Board may differ materially from the values that would have been used if a ready market for these investments existed.
The valuation process is conducted at the end of each fiscal quarter, with a portion of the Company’s valuations of portfolio companies without market quotations subject to review by the independent valuation firms each quarter. When an external event with respect to one of the Company’s portfolio companies, such as a purchase transaction, public offering or subsequent equity sale occurs, we expect to use the pricing indicated by the external event to corroborate our valuation.
With respect to investments for which market quotations are not readily available, our Board will undertake a multi-step valuation process each quarter, as described below:
| • | The Company’s valuation process begins with each portfolio company or investment being initially valued by investment professionals of the Investment Adviser responsible for credit monitoring. |
| • | Preliminary valuation conclusions are then documented and discussed with our senior management and the Investment Adviser. |
| • | The valuation committee of the Board reviews these preliminary valuations. |
| • | At least once annually, the valuation for each portfolio investment that does not have a readily available quotation is reviewed by an independent valuation firm, subject to the de minimis exception described above. |
| • | The Board discusses valuations and determines the fair value of each investment in the Company’s portfolio in good faith. |
Net assets could be materially affected if the determinations regarding the fair value of the investments were materially higher or lower than the values that are ultimately realized upon the disposal of such investments.
Offering Costs
Deferred offering costs consist of fees paid in relation to legal, accounting, regulatory and printing work completed in preparation of equity or debt offerings and are charged against proceeds from the offerings when received. As of both December 31, 2016 and December 31, 2015, $0.5 million of expenses associated with the shelf registration statement initially filed with the Securities and Exchange Commission (the “SEC”) on April 3, 2014 (“Registration Statement”) were deferred and included in other assets. These amounts will be charged against proceeds from future offerings of securities when received.
Share Repurchase
Share repurchase transactions are recorded on a trade date basis, which is the date when management has determined that all material legal terms have been contractually defined for the transactions. The aggregate cost of common stock repurchased, including any direct transaction costs, will be recorded as a reduction of the par and paid-in-capital in excess of par value accounts, respectively.
Dividends and Distributions
Dividends and distributions to common stockholders are recorded on the ex-dividend date. The amount to be paid out as a dividend or distribution is determined by the Board each quarter and is generally based upon the earnings estimated by management. Net realized capital gains, if any, are distributed at least annually, although the Company may decide to retain such capital gains for investment.
| 104 |
Garrison Capital Inc. and Subsidiaries
Notes to Consolidated Financial Statements
December 31, 2016
2. Significant Accounting Policies and Recent Updates – (continued)
The Company adopted a dividend reinvestment plan that provides for reinvestment of our dividends and other distributions on behalf of our stockholders, unless a stockholder elects to receive cash as provided below. As a result, if the Board declares a cash dividend or other distribution, then our stockholders who have not ‘opted out’ of our dividend reinvestment plan will have their cash distribution automatically reinvested in additional shares of our common stock, which may be newly issued shares or shares acquired by AST through open-market purchases, rather than receiving the cash distribution. As of December 31, 2016 and December 31, 2015, no new shares were issued pursuant to the dividend reinvestment plan.
No action is required on the part of a registered stockholder to have its cash dividend or other distribution reinvested in shares of our common stock. A registered stockholder may elect to receive an entire distribution in cash by notifying AST in writing so that such notice is received by AST no later than the record date for distributions to stockholders.
Those stockholders whose shares are held by a broker or other financial intermediary may receive dividends and other distributions in cash by notifying their broker or other financial intermediary of their election.
Income Taxes
As discussed in Note 1, for tax purposes, GARS has elected to be treated as a RIC under Subchapter M of the Code, and intends to qualify each taxable year for such treatment In addition, GF 2016-2, GF 2013-2, GF 2013-2 Manager, the GARS Equity Holdings Entities, Walnut Hill II LLC and Forest Park II LLC are disregarded entities for tax purposes. GLC Trust 2013-2 is a grantor trust for U.S. taxable income purposes, whereby the income reverts to GARS, and accordingly, no provision for federal income tax was made in the consolidated financial statements for the years ended December 31, 2016 or December 31, 2015.
| 105 |
Garrison Capital Inc. and Subsidiaries
Notes to Consolidated Financial Statements
December 31, 2016
2. Significant Accounting Policies and Recent Updates – (continued)
Each taxable year, GARS intends to comply with all RIC qualification provisions contained in the Code including certain source-of-income and asset diversification requirements, as well as distribution requirements to our stockholders equal to at least 90% of “investment company taxable income”. “Investment company taxable income” is generally defined as net ordinary income plus the excess of realized net short-term capital gains over realized net long-term capital losses. As a RIC, GARS generally does not have to pay corporate-level U.S. federal income taxes on any net ordinary income or capital gains that it distributes to its stockholders in a timely manner.
However, GARS is subject to U.S. federal income taxes at regular corporate tax rates on any net ordinary income or net capital gain not distributed to its stockholders assuming at least 90% of its investment company taxable income is distributed timely.
Depending on the level of taxable income earned in a tax year, the Company may choose to retain taxable income in excess of current year dividend distributions, and distribute such taxable income in the next tax year. The Company would then pay a 4% excise tax on such taxable income, as required. To the extent that the Company determines that its estimated current year annual taxable income, determined on a calendar basis, could exceed estimated current calendar year dividend distributions, the Company accrues excise tax, if any, on estimated excess taxable income as taxable income is earned.
For the years ended December 31, 2016, December 31, 2015 and December 31, 2014, $0.1 million, $0.2 million and $0.1 million, respectively, of U.S. federal excise tax was recorded.
In addition, GARS has certain wholly owned taxable subsidiaries (the “Taxable Subsidiaries”), each of which holds a portion of one or more of our portfolio investments that are listed on the consolidated schedule of investments. The Taxable Subsidiaries are consolidated for financial reporting purposes in accordance with U.S. GAAP, so that our consolidated financial statements reflect our investments in the portfolio companies owned by the Taxable Subsidiaries. The purpose of the Taxable Subsidiaries is, among other things, to permit GARS to hold certain interests in portfolio companies that are organized as limited liability companies (“LLCs”) (or other forms of pass-through entities) and still satisfy the RIC tax requirement that at least 90.0% of the RIC’s gross income for federal income tax purposes must consist of qualifying investment income. Absent the Taxable Subsidiaries, a proportionate amount of any gross income of an LLC (or other pass-through entity) portfolio investment would flow through directly to the RIC. To the extent that such income did not consist of investment income, it could jeopardize GARS ability to qualify as a RIC and therefore cause GARS to incur significant amounts of corporate-level U.S. federal income taxes. Where interests in LLCs (or other pass-through entities) are owned by the Taxable Subsidiaries, however, the income from such interests is taxed to the Taxable Subsidiaries and does not flow through to the RIC, thereby helping GARS preserve its RIC status and resultant tax advantages. The Taxable Subsidiaries are not consolidated for U.S. federal income tax purposes and may generate income tax expense as a result of their ownership of the portfolio companies.
| 106 |
Garrison Capital Inc. and Subsidiaries
Notes to Consolidated Financial Statements
December 31, 2016
2. Significant Accounting Policies and Recent Updates – (continued)
Dividends from net investment income and distributions from net realized capital gains are determined in accordance with U.S. federal tax regulations, which may differ from amounts determined in accordance with U.S. GAAP and those differences could be material. These book-to-tax differences are either temporary or permanent in nature. Reclassifications due to permanent differences have no impact on net assets. The below were reclassifications made due to permanent differences for the tax years ended December 31, 2016 and December 31, 2015:
| ($ in thousands) | December 31, 2016 | December 31, 2015 | ||||||
| Accumulated net investment income/(loss) | $ | (1,251 | ) | $ | 2,259 | |||
| Accumulated net realized gain/(loss) on investments | 1,301 | (2,069 | ) | |||||
| Paid - in capital | (50 | ) | (190 | ) | ||||
The permanent book-to-tax differences arose primarily due to the tax classification of dividend distributions, tax basis differences on realized investments, tax characterization of certain realized losses and the accrual of nondeductible U.S. federal excise tax.
Taxable income differs from the net increase (decrease) in net assets resulting from operations primarily due to the exclusion of unrealized gain (loss) on investments from taxable income until they are realized, book-to-tax temporary differences related to the deductibility of accrued Incentive Fees payable to the Investment Adviser attributable to unrealized gain (loss) on investments, book-to-tax differences on the treatment of deferred financing costs, book-to-tax temporary differences on taxable income inclusions of investment income earned on certain securities that was accrued for tax but not for U.S. GAAP, and book-to-tax temporary differences related to net capital loss carryforwards and utilization of net capital gain loss carryforwards from prior years.
The following table reconciles net increase in net assets resulting from operations to taxable income for the tax years ended December 31, 2016, December 31, 2015 and December 31, 2014:
| ($ in thousands) | December 31, 2016 | December 31, 2015 | December 31, 2014 | |||||||||
| Net decrease in net assets resulting from operations | $ | (4,810 | ) | $ | (3,660 | ) | $ | 30,484 | ||||
| Net change in unrealized (gain)/loss from investments | (6,696 | ) | 21,919 | 2,228 | ||||||||
| Net capital loss carryforward | 29,290 | 10,275 | - | |||||||||
| Permanent book-to-tax differences | 50 | 190 | 63 | |||||||||
| Temporary book-to-tax differences | (53 | ) | (2,169 | ) | (3,664 | ) | ||||||
| Taxable income before deductions for distribution | $ | 17,781 | $ | 26,555 | $ | 29,111 | ||||||
As of December 31, 2016 and December 31, 2015, the accumulated earnings/(deficit) on a tax basis is:
| ($ in thousands) | December 31, 2016 | December 31, 2015 | ||||||
| Undistributed ordinary income | $ | 5,165 | $ | 8,782 | ||||
| Accumulated capital gain and other gains/(losses) | (39,565 | ) | (10,275 | ) | ||||
| Unrealized (losses) on investments | (15,410 | ) | (22,053 | ) | ||||
| Total accumulated (deficit) | $ | (49,810 | ) | $ | (23,546 | ) | ||
The tax character of all distributions paid for the years ended December 31, 2016 and December 31, 2015 were classified as ordinary income.
| 107 |
Garrison Capital Inc. and Subsidiaries
Notes to Consolidated Financial Statements
December 31, 2016
2. Significant Accounting Policies and Recent Updates – (continued)
As of December 31, 2016 and December 31, 2015, the components of accumulated losses on a tax basis, as detailed below, differ from the amounts reflected per our consolidated statement of assets and liabilities by temporary book-to-tax differences arising from book-to-tax differences related to the deductibility of accrued Incentive Fees payable to the Investment Adviser attributable to unrealized gains (losses) on investments, book-to-tax differences on the treatment of deferred financing costs and book-to-tax differences on taxable income inclusions of investment income earned on certain securities that was accrued for tax but not for U.S. GAAP.
| ($ in thousands) | December 31, 2016 | December 31, 2015 | ||||||
| Other temporary differences | $ | (53 | ) | $ | - | |||
| Unrealized (loss) from investments (GAAP) | (15,357 | ) | (22,053 | ) | ||||
| Total components of unrealized (losses) on investments (tax basis) | $ | (15,410 | ) | $ | (22,053 | ) | ||
As of December 31, 2016, the federal income tax basis of investments was $392.0 million resulting in net unrealized loss of $(15.4) million. As of December 31, 2015, the federal tax basis of investments was $437.1 million resulting in a net unrealized loss of $(22.1) million.
We are required to determine whether our tax position is more likely-than-not to be sustained upon examination by the applicable taxing authority, including resolution of any related appeals or litigation processes, based on the technical merits of the position. The tax benefit to be recognized is measured as the largest amount of benefit that is greater than fifty percent likely of being realized upon ultimate settlement. De-recognition of a tax benefit previously recognized could result in the recording of a tax liability that could negatively impact our net assets.
U.S. GAAP provides guidance on thresholds, measurement, de-recognition, classification, interest and penalties, accounting in interim periods, disclosure, and transition that is intended to provide better financial statement comparability among different entities.
We have concluded that it was not necessary to record a liability for any such tax positions as of December 31, 2016 and December 31, 2015. However, our conclusions regarding this policy may be subject to review and adjustment at a later date based on factors including ongoing analyses of, and changes to, tax laws, regulations and interpretations thereof.
Our activities from commencement of operations remain subject to examination by U.S. federal, state, and local tax authorities. No interest expense or penalties have been assessed as of December 31, 2016 and December 31, 2015.
If we were required to recognize interest and penalties, if any, related to unrecognized tax benefit this would be recognized as income tax expense in the consolidated statement of operations.
We had net long term capital loss carryforwards of $29.3 million and $10.3 million as of December 31, 2016 and December 31, 2015, respectively. During 2014, we utilized $5.8 million of net long term capital loss carryforwards resulting in no net long term capital loss carryforward as of December 31, 2014.
Recent accounting pronouncements
In November 2016, the FASB issued ASU 2016-18, Statement of Cash Flows (Topic 230): Restricted Cash. ASU 2016-18 requires a statement of cash flows explain the change during the period of total cash, cash equivalents, and amounts described as cash or restricted cash equivalents. This new guidance is effective for annual and interim periods beginning on or after December 15, 2017 and for interim periods within those fiscal years, with early adoption permitted. The Company is currently evaluating the impact ASU 2016-18 will have on the Company’s consolidated financial position and disclosures.
In August 2016, the FASB issued ASU 2016-15, Statement of Cash Flows (Topic 230): Classification of Certain Cash Receipts and Cash Payments. ASU 2016-15 amends the classification of certain cash receipts and cash payments presented and classified in the statement of cash flows. This new guidance is effective for annual and interim periods beginning on or after December 15, 2017 and for interim periods within those fiscal years, with early adoption permitted. The Company is currently evaluating the impact ASU 2016-15 will have on the Company’s consolidated financial position and disclosures.
In January 2016, the FASB issued ASU 2016-01, Financial Instruments-Overall (Topic 825): Recognition and Measurement of Financial Assets and Financial Liabilities. ASU 2016-01 changes how entities account for and measure the fair value of certain equity investments and updates the presentation and disclosure of certain financial assets and liabilities. This new guidance is effective for annual and interim periods beginning on or after December 15, 2017 and for interim periods within those fiscal years, with early adoption permitted. The Company is currently evaluating the impact ASU 2016-01 will have on the Company’s consolidated financial position and disclosures.
| 108 |
Garrison Capital Inc. and Subsidiaries
Notes to Consolidated Financial Statements
December 31, 2016
3. Investments
GARS investments include debt investments (both funded and unfunded, “Debt Investments”), preferred and minority equity investments (“Equity”) of diversified companies and a portfolio of unsecured small balance consumer loans (“Financial Assets”). These financial instruments may be purchased indirectly through an interest in a limited partnership or a limited liability company.
Certain of the risks of investing in the financial instruments of a borrower or a company experiencing various forms of financial, operational, legal, and/or other distress or impairment, including companies involved in bankruptcy or other reorganization or liquidation proceedings, and those which might become involved in such proceedings, are discussed herein. Through investing in these assets, GARS is exposed to credit risk relating to whether the borrower will meet its obligation to pay when it comes due until the investments are sold or mature. Any investment in a distressed company may involve special risks.
GARS transactions in Debt Investments are normally secured financings that are collateralized by physical assets and/or the enterprise value of the borrower. This collateral, and our rights to this collateral, are different depending on the specific transaction and are defined by the legal documents agreed to in the transaction.
The terms of the Debt Investments may provide for us to extend to a borrower additional credit or provide funding for any unfunded portion of such Debt Investments at the request of the borrower. This exposes us to potential liabilities that are not reflected on the consolidated statements of financial condition. As of December 31, 2016 and December 31, 2015, we had $4.8 million and $6.9 million of unfunded commitments with a fair value of $(0.1) million and $(0.1) million, respectively. The negative fair value is the result of the unfunded commitments being valued below par. These amounts may or may not be funded to the borrowing party now or in the future.
There is no central clearinghouse for our Debt Investments, Equity or Financial Assets, nor is there a central depository for custody of any such interests. The processes by which these interests are cleared, settled and held in custody are individually negotiated between the parties to the transaction. This subjects us to operational risk to the extent that there are delays and failures in these processes. The Custodian maintains records of the investments which are owned by us.
| 109 |
Garrison Capital Inc. and Subsidiaries
Notes to Consolidated Financial Statements
December 31, 2016
4. Fair Value of Financial Instruments
The fair value of our assets and liabilities which qualify as financial instruments approximate the carrying amounts presented in the consolidated statements of financial condition.
U.S. GAAP requires enhanced disclosures about investments that are measured and reported on a fair value basis. Under U.S. GAAP, fair value is the price that would be received to sell an asset or paid to transfer a liability in an orderly transaction between market participants at the measurement date.
Further, the guidance distinguishes between inputs that reflect the assumptions market participants would use in pricing an asset or liability developed based on market data obtained from sources independent of the reporting entity (observable inputs) and inputs that reflect the reporting entity’s own assumptions about the assumptions market participants would use in pricing an asset or liability developed based on the best information available in the circumstances (unobservable inputs). Various inputs are used in determining the values of the Company’s investments and these inputs are categorized as of each valuation date.
The inputs are summarized in three broad levels listed below:
| • | Level 1 — quoted unadjusted prices in active markets for identical investments as of the reporting date. |
| • | Level 2 — other significant observable inputs (including quoted prices for similar investments, interest rates, prepayments, credit risk, etc.). |
| • | Level 3 — significant unobservable inputs (including the reporting entity’s own assumptions about the assumptions market participants would use in determining the fair values of investments or indicative bid prices from unaffiliated market makers or independent third party pricing services). |
Fair value of publicly traded instruments is generally based on quoted market prices. Fair value of non-publicly traded instruments, and of publicly traded instruments for which quoted market prices are not readily available, may be determined based on other relevant factors, including bid quotations from unaffiliated market makers or independent third-party pricing services, the price activity of comparable instruments and valuation pricing models.
For those investments valued using quotations, the bid price is generally used, unless the Company determines that it is not representative of an exit price. To the extent observable market data is available, such information may be the result of indicative bid quotations obtained from independent third party pricing services (“consensus pricing”) or broker quotes. Due to the fact that the significant inputs used by the contributors of the consensus pricing source or the broker are unobservable and evidence with respect to trading levels is not available, any investments valued using indicative bid prices from unaffiliated market makers and independent third-party pricing services have been classified within Level 3.
Investments classified as Level 3 may be fair valued using the income and market approaches, using a market yield valuation methodology or enterprise value methodology.
Factors that could affect fair value measurements of debt investments using the above referenced approaches include assumed growth rates, capitalization rates, discount rates, loan-to-value ratios, liquidation value, relative capital structure priority, market comparables, compliance with applicable loan, covenant and interest coverage performance, book value, market derived multiples, reserve valuation, assessment of credit ratings of an underlying borrower, review of ongoing performance, review of financial projections as compared to actual performance, review of interest rate and yield risk.
| 110 |
Garrison Capital Inc. and Subsidiaries
Notes to Consolidated Financial Statements
December 31, 2016
4. Fair Value of Financial Instruments – (continued)
Factors that could affect fair value measurements of consumer loans using the above referenced approaches include prepayment rates, default rates, review of financial projections as compared to actual performance and discount rates.
Such factors may be given different weighting depending on management’s assessment of the underlying investment, and management may analyze apparently comparable investments in different ways. The Company has used, and intends to continue to use, independent valuation firms to provide additional corroboration for estimating the fair values of investments. Valuations performed by the independent valuation firms may utilize proprietary models and inputs. The inputs or methodology used for valuing securities are not necessarily an indication of the risk associated with investing in those securities.
As of each of December 31, 2016 and December 31, 2015, all of the Company’s investments (other than cash and cash equivalents) were classified as Level 3 under ASC 820.
The following table summarizes the valuation of the Company’s investments measured at fair value based on the fair value hierarchy detailed above as of December 31, 2016 and December 31, 2015:
| As of December 31, 2016 | ||||||||||||||||
| ($ in thousands) | Level 1 | Level 2 | Level 3 | Total | ||||||||||||
| Senior Secured (1)(2) | $ | - | $ | - | $ | 363,960 | $ | 363,960 | ||||||||
| Preferred Equity Investments | - | - | 2,086 | 2,086 | ||||||||||||
| Common Equity Investments | - | - | 3,902 | 3,902 | ||||||||||||
| Financial Assets | - | - | 6,756 | 6,756 | ||||||||||||
| $ | - | $ | - | $ | 376,704 | $ | 376,704 | |||||||||
______________
| (1) | Includes unfunded commitments with a fair value of $(0.1) million. | |
| (2) | Included in senior secured loans are loans structured as first lien last out loans. These loans may in certain cases be subordinated in payment priority to other senior secured lenders. |
| As of December 31, 2015 | ||||||||||||||||
| ($in thousands) | Level 1 | Level 2 | Level 3 | Total | ||||||||||||
| Senior Secured (1)(2) | $ | - | $ | - | $ | 380,780 | $ | 380,780 | ||||||||
| Mezzanine | - | - | 7,512 | 7,512 | ||||||||||||
| Preferred Equity Investments | - | - | 5,487 | 5,487 | ||||||||||||
| Common Equity Investments | - | - | 3,468 | 3,468 | ||||||||||||
| Financial Assets | - | - | 17,754 | 17,754 | ||||||||||||
| $ | - | $ | - | $ | 415,001 | $ | 415,001 | |||||||||
______________
| (1) | Includes unfunded commitments with a fair value of $(0.1) million. | |
| (2) | Included in senior secured loans are loans structured as first lien last out loans. These loans may in certain cases be subordinated in payment priority to other senior secured lenders. |
The net change in unrealized gain/(loss) attributable to the Company’s Level 3 assets for the years ended December 31, 2016 and December 31, 2015 included in the net change in unrealized gain/(loss) from investments in the Company’s consolidated statement of operations was $6.7 million and $(21.9) million, respectively.
| 111 |
Garrison Capital Inc. and Subsidiaries
Notes to Consolidated Financial Statements
December 31, 2016
4. Fair Value of Financial Instruments – (continued)
The following table is a reconciliation of investments in which significant unobservable inputs (Level 3) were used in determining fair value for the year ended December 31, 2016:
| Year Ended December 31, 2016 | ||||||||||||||||||||||||
| Senior Secured Investments | Mezzanine Investments | Preferred Equity Investments | Common Equity Investments | Financial Assets | Total | |||||||||||||||||||
| ($ in thousands) | ||||||||||||||||||||||||
| Fair value, beginning of period | $ | 380,780 | $ | 7,512 | $ | 5,487 | $ | 3,468 | $ | 17,754 | $ | 415,001 | ||||||||||||
| Total net realized and unrealized gain/(loss) on investments | (19,292 | ) | (25 | ) | (3,401 | ) | (680 | ) | (697 | ) | (24,095 | ) | ||||||||||||
| Total net accretion of discounts on investments | 1,511 | 25 | - | - | - | 1,536 | ||||||||||||||||||
| Purchases/issuances(1) | 123,503 | 155 | - | 1,723 | - | 125,381 | ||||||||||||||||||
| Sales | (33,822 | ) | - | - | (311 | ) | - | (34,133 | ) | |||||||||||||||
| Paydowns(1) | (88,720 | ) | (7,667 | ) | - | (298 | ) | (10,301 | ) | (106,986 | ) | |||||||||||||
| Fair value, end of period | $ | 363,960 | $ | - | $ | 2,086 | $ | 3,902 | $ | 6,756 | $ | 376,704 | ||||||||||||
| Net change in unrealized gain/(loss) from investments in our Consolidated Statement of Operations attributable to our Level 3 assets (2) | $ | (7,361 | ) | $ | - | $ | (2,150 | ) | $ | (1,289 | ) | $ | 604 | $ | (10,196 | ) | ||||||||
______________
| (1) | Includes non-cash restructuring of portfolio investments of $0.8 million. There were no transfers of investments between levels by the Company for the year ended December 31, 2016. | |
| (2) | Net change in unrealized gain/(loss) included in earnings related to investments still held at reporting date. |
The following table is a reconciliation of investments in which significant unobservable inputs (Level 3) were used in determining fair value for the year ended December 31, 2015:
| Year Ended December 31, 2015 | ||||||||||||||||||||||||||||||||
| Senior
Secured Investments | Second
Lien Investments | Mezzanine Investments | Subordinated Investments | Preferred
Equity Investments | Common
Equity Investments | Financial Assets | Total | |||||||||||||||||||||||||
| ($ in thousands) | ||||||||||||||||||||||||||||||||
| Fair value, beginning of period | $ | 399,188 | $ | 13,653 | $ | 7,361 | $ | 4,067 | $ | 5,791 | $ | 1,379 | $ | 36,330 | $ | 467,769 | ||||||||||||||||
| Total net realized and unrealized (loss)/gain on investments | (28,244 | ) | 284 | (26 | ) | (2,817 | ) | 1,186 | (736 | ) | (3,169 | ) | (33,522 | ) | ||||||||||||||||||
| Total net accretion of discounts on investments | 1,581 | 31 | 26 | - | - | - | - | 1,638 | ||||||||||||||||||||||||
| Purchases/issuances(1) | 183,287 | - | 151 | - | 1,250 | 2,825 | - | 187,513 | ||||||||||||||||||||||||
| Sales | 127 | (3,498 | ) | - | - | (2,740 | ) | - | - | (6,111 | ) | |||||||||||||||||||||
| Paydowns(1) | (175,159 | ) | (10,470 | ) | - | (1,250 | ) | - | - | (15,407 | ) | (202,286 | ) | |||||||||||||||||||
| Fair value, end of period | $ | 380,780 | $ | - | $ | 7,512 | $ | - | $ | 5,487 | $ | 3,468 | $ | 17,754 | $ | 415,001 | ||||||||||||||||
| Net change in unrealized gain/(loss) from investments in our Consolidated Statement of Operations attributable to our Level 3 assets(2) | $ | (23,745 | ) | $ | - | $ | (26 | ) | $ | - | $ | 136 | $ | (736 | ) | $ | (422 | ) | $ | (24,793 | ) | |||||||||||
______________
| (1) | Includes non-cash restructuring of portfolio investments of $4.0 million. There were no transfers of investments between levels by the Company for the year ended December 31, 2015. |
| (2) | Net change in unrealized gain/(loss) included in earnings related to investments still held at reporting date. |
| 112 |
Garrison Capital Inc. and Subsidiaries
Notes to Consolidated Financial Statements
December 31, 2016
4. Fair Value of Financial Instruments – (continued)
The following table is a quantitative disclosure about significant unobservable inputs (Level 3) that were used in determining fair value at December 31, 2016:
| Quantitative Information about Level 3 Fair Value Measurements | ||||||||||||||||||||
| Fair Value at | Valuation | Unobservable | Range | Weighted | ||||||||||||||||
| December 31, 2016 | Technique | Input | Low | High | Average | |||||||||||||||
| ($ in thousands) | ||||||||||||||||||||
| Senior Secured Investments (1) | $ | 363,960 | Comparable yield approach | Market rate (2) | 6.1 | % | 41.0 | % | 10.2 | % | ||||||||||
| Market comparable companies | EBITDA multiple (5) | 2.5 | x | 11.3 | x | 5.9 | x | |||||||||||||
| Equity Investments (3) | 5,988 | Market comparable companies | EBITDA multiple (5) | 5.0 | x | 7.5 | x | 6.5 | x | |||||||||||
| Market comparable companies | Origination fees multiple | 5.8 | x | 5.8 | x | 5.8 | x | |||||||||||||
| Financial Assets (4) | 6,756 | Discounted cash flows | Interest rate | 6.0 | % | 31.3 | % | 16.0 | % | |||||||||||
| Conditional prepayment rate (“CPR”) | 10.4 | % | 24.5 | % | 15.2 | % | ||||||||||||||
| Cumulative Default Rate | 0.0 | % | 17.9 | % | 11.1 | % | ||||||||||||||
| Discount rate | 9.0 | % | 9.0 | % | 9.0 | % | ||||||||||||||
| Total | $ | 376,704 | ||||||||||||||||||
______________
| (1) | Includes total unfunded commitments of $(0.1) million. |
| (2) | Market rate is calculated based on the fair value of the investments and interest expected to be received using the current rate of interest at the balance sheet date to maturity, excluding the effects of future scheduled principal amortizations. |
| (3) | Includes preferred and common equity. |
| (4) | Financial Assets are valued by the level of risk associated with the underlying loan measured by the estimated loss rate. The estimated loss rate is based on the historical performance of loans with similar characteristics, the borrowers credit score obtained from an official credit reporting agency at origination, debt-to-income ratios at origination, information from the borrower’s credit report at origination, as well as the borrower’s self-reported income range, occupation and employment status at origination. Financial Asset risk ratings are assigned on a scale from A through F, with A having the lowest level of risk and F having the highest level of risk. As of December 31, 2016, 16.6%, 35.4%, 37.4%, 8.1%, 2.5% and 0.0%, of the total fair value of Financial Assets was comprised of A, B, C, D, E and F risk rated loans, respectively. See Exhibit 99.1 to the Company’s Annual Report on Form 10-K for the year ended December 31, 2016 for detail on the underlying loans. |
| (5) | Excludes non-operating portfolio companies, which we define as those loans collateralized by proved developed producing (“PDP”), value, real estate or other hard assets. PDPs are proven revenues that can be produced with existing wells. As of December 31, 2016, $49.6 million of par value and $36.0 million of market value was excluded. |
| 113 |
Garrison Capital Inc. and Subsidiaries
Notes to Consolidated Financial Statements
December 31, 2016
4. Fair Value of Financial Instruments – (continued)
The following table is a quantitative disclosure about significant unobservable inputs (Level 3) that were used in determining fair value at December 31, 2015:
| Quantitative Information about Level 3 Fair Value Measurements | ||||||||||||||||||||
| Fair Value at | Valuation | Unobservable | Range | Weighted | ||||||||||||||||
| December 31, 2015 | Technique | Input | Low | High | Average | |||||||||||||||
| ($ in thousands) | ||||||||||||||||||||
| Senior Secured Investments (1) | $ | 380,780 | Comparable yield approach | Market rate (2) | 5.6 | % | 21.2 | % | 9.7 | % | ||||||||||
| Market comparable companies | EBITDA multiple (5) | 1.9 | x | 11.3 | x | 5.5 | x | |||||||||||||
| Mezzanine Investments | 7,512 | Comparable yield approach | Market rate (2) | 16.0 | % | 16.0 | % | 16.0 | % | |||||||||||
| Market comparable companies | EBITDA multiple (5) | 5.0 | x | 5.0 | x | 5.0 | x | |||||||||||||
| Equity Investments (3) | 8,955 | Market comparable companies | EBITDA multiple (5) | 4.3 | x | 8.0 | x | 6.0 | x | |||||||||||
| Market comparable companies | Origination fees multiple | 8.8 | x | 8.8 | x | 8.8 | x | |||||||||||||
| Financial Assets (4) | 17,754 | Discounted cash flows | Interest rate | 6.3 | % | 31.3 | % | 15.6 | % | |||||||||||
| CPR | 18.5 | % | 83.6 | % | 36.9 | % | ||||||||||||||
| Constant Default Rate | 8.4 | % | 40.8 | % | 18.1 | % | ||||||||||||||
| Default rate multiplier | 1.3 | x | 1.3 | x | 1.3 | x | ||||||||||||||
| Discount rate | 7.3 | % | 7.3 | % | 7.3 | % | ||||||||||||||
| Total | $ | 415,001 | ||||||||||||||||||
______________
| (1) | Includes total unfunded commitments of $(0.1) million. |
| (2) | Market rate is calculated based on the fair value of the investments and interest expected to be received using the current rate of interest at the balance sheet date to maturity, excluding the effects of future scheduled principal amortizations. |
| (3) | Includes preferred and common equity. |
| (4) | Financial Assets are valued by the level of risk associated with the underlying loan measured by the estimated loss rate. The estimated loss rate is based on the historical performance of loans with similar characteristics, the borrowers credit score obtained from an official credit reporting agency at origination, debt-to-income ratios at origination, information from the borrower’s credit report at origination, as well as the borrower’s self-reported income range, occupation and employment status at origination. Financial Asset risk ratings are assigned on a scale from A through F, with A having the lowest level of risk and F having the highest level of risk. As of December 31, 2015, 24.2%, 33.1%, 31.9%, 7.5%, 3.1% and 0.2%, of the total fair value of Financial Assets was comprised of A, B, C, D, E and F risk rated loans, respectively. See Exhibit 99.1 to the Company’s Annual Report on Form 10-K for the year ended December 31, 2015 for detail on the underlying loans. |
| (5) | Excludes non-operating portfolio companies, which we define as those loans collateralized by PDP or other hard assets. PDPs are proven revenues that can be produced with existing wells. |
Significant unobservable inputs used in the fair value measurement of the Companys’ Debt Investments include consensus pricing, multiples of market comparable companies, and relative comparable yields.
| 114 |
Garrison Capital Inc. and Subsidiaries
Notes to Consolidated Financial Statements
December 31, 2016
4. Fair Value of Financial Instruments – (continued)
Significant decreases (increases) in consensus pricing or market comparables could result in lower (higher) fair value measurements. Significant increases (decreases) in comparable yields could result in lower (higher) fair value measurements. Generally, a change in the assumption used for relative comparable yields is accompanied by a directionally opposite change in the assumptions used for pricing.
Significant unobservable inputs used in the fair value measurement of the Company’s Equity Investments include market comparables. Significant decreases (increases) in market comparables could result in lower (higher) fair value measurements.
Significant unobservable inputs used in the fair value measurement of the Company Financial Assets include interest rate, prepayment rate, unit loss rate, default rate multiplier and discount rate.
Significant decreases (increases) in interest rates or prepayment rates could result in significantly lower (higher) fair value measurements. Significant increases (decreases) in unit loss rates, default rate multiplier or discount rates could result in lower (higher) fair value measurements.
The composition of the Company’s portfolio by industry at cost and fair value as of December 31, 2016 was as follows:
| Industry | Cost of Investments | Fair Value of Investments | ||||||||||||||
| ($ in thousands) | ||||||||||||||||
| Miscellaneous Manufacturing | $ | 68,489 | 17.5 | % | $ | 68,901 | 18.2 | % | ||||||||
| Health Services | 42,147 | 10.8 | 34,879 | 9.3 | ||||||||||||
| Miscellaneous Retail | 41,710 | 10.6 | 41,640 | 11.1 | ||||||||||||
| Oil & Gas | 24,704 | 6.3 | 19,648 | 5.2 | ||||||||||||
| Miscellaneous Services | 22,611 | 5.8 | 19,644 | 5.2 | ||||||||||||
| Transportation Services | 19,847 | 5.1 | 18,471 | 4.9 | ||||||||||||
| Computer Programming, Data Processing, & Other Computer Related Services | 18,591 | 4.7 | 18,591 | 4.9 | ||||||||||||
| Consumer Finance Services | 18,359 | 4.7 | 19,665 | 5.2 | ||||||||||||
| Food Stores & Distributors - Retail | 15,116 | 3.9 | 15,180 | 4.0 | ||||||||||||
| Communications | 12,060 | 3.1 | 12,081 | 3.2 | ||||||||||||
| Insurance Agents | 10,238 | 2.6 | 10,291 | 2.7 | ||||||||||||
| Apparel Products | 10,186 | 2.6 | 9,286 | 2.5 | ||||||||||||
| Broadcasting & Entertainment | 9,979 | 2.5 | 10,133 | 2.7 | ||||||||||||
| Building & Real Estate | 9,752 | 2.5 | 9,752 | 2.6 | ||||||||||||
| Electrical Equipment | 9,589 | 2.4 | 9,589 | 2.5 | ||||||||||||
| Cosmetics/Toiletries | 9,537 | 2.4 | 9,656 | 2.6 | ||||||||||||
| Chemicals | 9,501 | 2.4 | 9,501 | 2.5 | ||||||||||||
| Printing & Publishing | 8,921 | 2.3 | 8,921 | 2.4 | ||||||||||||
| Specialty Services | 8,887 | 2.3 | 8,879 | 2.4 | ||||||||||||
| Automotive | 8,821 | 2.2 | 8,910 | 2.4 | ||||||||||||
| Equipment Rental & Leasing | 7,006 | 1.8 | 6,990 | 1.9 | ||||||||||||
| Metal Mining | 6,010 | 1.5 | 6,096 | 1.6 | ||||||||||||
| $ | 392,061 | 100.0 | % | $ | 376,704 | 100.0 | % | |||||||||
Refer to the consolidated schedule of investments for detailed disaggregation of the Company’s investments.
| 115 |
Garrison Capital Inc. and Subsidiaries
Notes to Consolidated Financial Statements
December 31, 2016
4. Fair Value of Financial Instruments – (continued)
The composition of the Company’s portfolio by industry at cost and fair value as of December 31, 2015 was as follows:
| Industry | Cost of Investments | Fair Value of Investments | ||||||||||||||
| ($ in thousands) | ||||||||||||||||
| Miscellaneous Manufacturing | $ | 73,278 | 16.6 | % | $ | 73,229 | 17.7 | % | ||||||||
| Health Services | 46,794 | 10.7 | 41,472 | 10.0 | ||||||||||||
| Miscellaneous Retail | 35,024 | 8.0 | 35,158 | 8.5 | ||||||||||||
| Consumer Finance Services | 34,083 | 7.8 | 36,558 | 8.8 | ||||||||||||
| Miscellaneous Services | 32,985 | 7.5 | 22,386 | 5.4 | ||||||||||||
| Communications | 26,424 | 6.0 | 26,182 | 6.3 | ||||||||||||
| Oil & Gas | 24,952 | 5.7 | 24,049 | 5.8 | ||||||||||||
| Transportation Services | 19,125 | 4.4 | 18,111 | 4.4 | ||||||||||||
| Specialty Services | 13,954 | 3.2 | 13,898 | 3.3 | ||||||||||||
| Electrical Equipment | 12,185 | 2.8 | 12,136 | 2.9 | ||||||||||||
| Broadcasting & Entertainment | 11,160 | 2.6 | 11,146 | 2.7 | ||||||||||||
| Agricultural Services | 10,339 | 2.4 | 5,040 | 1.2 | ||||||||||||
| Insurance Agents | 10,325 | 2.4 | 10,311 | 2.5 | ||||||||||||
| Chemicals | 10,102 | 2.3 | 10,102 | 2.4 | ||||||||||||
| Cosmetics/Toiletries | 10,010 | 2.3 | 10,010 | 2.4 | ||||||||||||
| Business Services | 9,989 | 2.3 | 9,988 | 2.4 | ||||||||||||
| Building & Real Estate | 9,962 | 2.3 | 9,962 | 2.4 | ||||||||||||
| Food Stores - Retail | 9,290 | 2.1 | 9,290 | 2.2 | ||||||||||||
| Printing & Publishing | 9,143 | 2.1 | 9,143 | 2.2 | ||||||||||||
| Automotive | 7,431 | 1.7 | 7,512 | 1.8 | ||||||||||||
| Equipment Rental & Leasing | 6,985 | 1.6 | 6,961 | 1.7 | ||||||||||||
| Computer Programming, Data Processing, & Other Computer Related Services | 2,918 | 0.7 | 2,918 | 0.7 | ||||||||||||
| Apparel Products | 2,714 | 0.6 | 1,815 | 0.4 | ||||||||||||
| Retail-Building Materials, Hardware, Garden Supply & Mobile Home Dealers | 1,986 | 0.5 | 1,967 | 0.5 | ||||||||||||
| Nonferrous metal/minerals | 1,976 | 0.5 | 1,968 | 0.5 | ||||||||||||
| Stone, Clay, Glass, & Concrete Products | 1,973 | 0.5 | 1,928 | 0.5 | ||||||||||||
| Metal Mining | 1,946 | 0.4 | 1,761 | 0.4 | ||||||||||||
| $ | 437,053 | 100.0 | % | $ | 415,001 | 100.0 | % | |||||||||
Refer to the consolidated schedules of investments for detailed disaggregation of the Company’s investments.
5. Indemnifications
In the normal course of business, the Company enters into certain contracts that provide a variety of indemnifications. The Company’s maximum exposure under these indemnifications is unknown. However, no liabilities have arisen under these indemnifications in the past and, while there can be no assurances in this regard, there is no expectation that any will occur in the future. Therefore, the Company does not consider it necessary to record a liability for any indemnifications under U.S. GAAP.
6. Due To and Due From Counterparties
The Company executes investment transactions with agents, brokers, investment companies, agent banks and other financial institutions. Due to and due from counterparties include amounts related to unsettled purchase and sale transactions of investments, and principal paydowns receivable from the borrowers.
| 116 |
Garrison Capital Inc. and Subsidiaries
Notes to Consolidated Financial Statements
December 31, 2016
6. Due To and Due From Counterparties – (continued)
No amounts were due to counterparties as of December 31, 2016. Amounts due to counterparties was $0.4 million as of December 31, 2015. Amounts due from counterparties were $2.1 million and $1.6 million as of December 31, 2016 and December 31, 2015, respectively.
7. Financing
As of December 31, 2016, the total carrying value of the Company’s aggregate debt outstanding was $205.1 million with a weighted average effective interest rate of 3.88%. The Company’s debt outstanding as of December 31, 2016 was comprised of notes issued by GF 2016-2, Garrison SBIC borrowings and GLC Trust 2013-2 Notes.
The table below provides details of our outstanding debt as of December 31, 2016
| December 31, 2016 | Amortized Carrying Value | Outstanding Principal at Par | Interest Rate | Rating(2) | Stated Maturity | |||||||||||
| ($ in thousands) | ||||||||||||||||
| GF 2016-2 Secured Notes: | ||||||||||||||||
| Class A-1R Notes | $ | - | $ | - | LIBOR + 2.20% | (1) | AAA(sf) | 9/29/2027 | ||||||||
| Class A-1F Notes | 24,699 | 25,000 | 3.41% | AAA(sf) | 9/29/2027 | |||||||||||
| Class A-1T Notes | 86,950 | 88,150 | LIBOR + 2.20% | AAA(sf) | 9/29/2027 | |||||||||||
| Class A-2 Notes | 20,342 | 20,700 | LIBOR + 3.15% | AA(sf) | 9/29/2027 | |||||||||||
| Class B Notes | 20,913 | 21,450 | LIBOR + 4.00% | A (sf) | 9/29/2027 | |||||||||||
| Class C Notes | 11,404 | 11,700 | LIBOR + 6.00% | BBB(sf) | 9/29/2027 | |||||||||||
| 164,308 | 167,000 | |||||||||||||||
| Garrison SBIC Borrowings: | ||||||||||||||||
| SBIC 2016-10 B | 3,210 | 3,320 | 2.79% | (3) | N/A | 9/1/2026 | ||||||||||
| SBIC 2016-10 A | 12,306 | 12,700 | 3.25% | (3) | N/A | 3/1/2026 | ||||||||||
| SBIC 2015-10 B | 13,589 | 14,000 | 3.57% | (3) | N/A | 9/1/2025 | ||||||||||
| SBIC Interim Financing | 6,746 | 6,980 | LIBOR + 0.93% | (4) | N/A | 3/29/2017 | ||||||||||
| 35,851 | 37,000 | |||||||||||||||
| GLC Trust 2013-2 Notes: | ||||||||||||||||
| Class A Notes | 4,953 | 5,048 | 3.00% | N/A | 7/15/2021 | |||||||||||
| 4,953 | 5,048 | |||||||||||||||
| $ | 205,112 | $ | 209,048 | |||||||||||||
______________
| (1) | May bear interest at either the CP Rate (as defined in the indenture governing the 2016-2 CLO) or the London Interbank Offered Rate (“LIBOR”). |
| (2) | Represents an S&P rating as of the closing of the 2016-2 CLO. |
| (3) | Represents the stated interest rate and annual charge of our SBA-guaranteed debentures. |
| (4) | These interim financings bear an interest rate of three month LIBOR + 0.93%, which is comprised of a weighted average annual charge of 0.63% and a spread of 0.30%. These interim financings have a maturity date of March 29, 2017, upon which we expect them to be pooled into the ten year SBA-guaranteed debentures. |
| 117 |
Garrison Capital Inc. and Subsidiaries
Notes to Consolidated Financial Statements
December 31, 2016
7. Financing – (continued)
The table below provides details of our outstanding debt as of December 31, 2015:
| Amortized | Outstanding | |||||||||||||||
| December 31, 2015 | Carrying Value | Principal at Par | Interest Rate | Rating(2) | Stated Maturity | |||||||||||
| ($ in thousands) | ||||||||||||||||
| GF 2013-2 Secured Notes: | ||||||||||||||||
| Class A-1R Notes | $ | 35,000 | $ | 35,000 | LIBOR + 1.90% | (1) | AAA(sf) | 9/25/2023 | ||||||||
| Class A-1T Notes | 108,248 | 111,175 | LIBOR + 1.80% | AAA(sf) | 9/25/2023 | |||||||||||
| Class A-2 Notes | 23,667 | 24,150 | LIBOR + 3.40% | AA(sf) | 9/25/2023 | |||||||||||
| Class B Notes | 24,524 | 25,025 | LIBOR + 4.65% | A (sf) | 9/25/2023 | |||||||||||
| 191,439 | 195,350 | |||||||||||||||
| Garrison SBIC Borrowings: | ||||||||||||||||
| SBIC 2015-10 B | 13,389 | 14,000 | 3.57% | (3) | N/A | 9/1/2025 | ||||||||||
| SBIC Interim Financing | 5,157 | 5,340 | LIBOR + 1.04% | (4) | N/A | 3/23/2016 | ||||||||||
| 18,546 | 19,340 | |||||||||||||||
| GLC Trust 2013-2 Notes: | ||||||||||||||||
| Class A Notes | 15,664 | 15,978 | 3.00% | N/A | 7/15/2021 | |||||||||||
| $ | 225,649 | $ | 230,668 | |||||||||||||
______________
| (1) | May bear interest at either the CP Rate (as defined in the indenture governing the 2013-2 CLO) or LIBOR. |
| (2) | Represents an S&P rating as of the closing of the 2013-2 CLO. |
| (3) | Represents the stated interest rate and annual charges of our SBA-guaranteed debentures. |
| (4) | These interim financings bore an interest rate of three month LIBOR + 1.04%, which is comprised of an annual charge of 0.74% and a spread of 0.30%. |
In accordance with the 1940 Act, with certain limited exceptions, the Company is only allowed to borrow amounts such that its asset coverage, as defined in the 1940 Act, is at least 200% after such borrowing (other than the SBA debentures of Garrison SBIC, as permitted by exemptive relief the Company has been granted by the SEC). As of December 31, 2016 and December 31, 2015, the Company’s asset coverage for borrowed amounts was 215.5% and 208.8%, respectively.
In accordance with the FASB issued ASU 2015-03, Interest – Imputation of Interest (Topic 835), deferred debt issuance costs were retrospectively adjusted for December 31, 2015 to be reflected as a liability, within the net carrying amount of the debt liabilities. As of December 31, 2015, these deferred debt issuance costs were reflected as an asset. As a result, total assets and total liabilities as of December 31, 2015 have both decreased by $4.3 million.
The table below shows the weighted average interest rates and weighted average effective interest rates, inclusive of deferred debt issuance costs, of our debt as of December 31, 2016 and December 31, 2015:
| December 31, 2016 | December 31, 2015 | |||||||
| Senior Secured Revolving Notes: | ||||||||
| Weighted average interest rate | 3.11 | % | 2.40 | % | ||||
| Weighted average effective interest rate(1) | 3.23 | 2.48 | ||||||
| Senior Secured Term Notes: | ||||||||
| Weighted average interest rate | 3.77 | 2.86 | ||||||
| Weighted average effective interest rate(1) | 4.01 | 3.26 | ||||||
| GLC Trust 2013-2 Class A Notes: | ||||||||
| Weighted average interest rate | 3.00 | 3.00 | ||||||
| Weighted average effective interest rate(1) | 3.35 | 3.09 | ||||||
| SBIC Borrowings: | ||||||||
| Weighted average interest rate | 3.00 | 3.02 | ||||||
| Weighted average effective interest rate(1) | 3.40 | 3.97 | ||||||
| Total | ||||||||
| Total weighted average interest rate | 3.62 | 2.81 | ||||||
| Total weighted average effective interest rate(1) | 3.88 | 3.20 |
______________
| (1) | Includes the effects of deferred debt issuance costs. |
| 118 |
Garrison Capital Inc. and Subsidiaries
Notes to Consolidated Financial Statements
December 31, 2016
7. Financing – (continued)
Refinancing of the 2013-2 Collateralized Loan Obligation
On September 25, 2013, GF 2013-2 closed the 2013-2 CLO securitization transaction. The notes offered in the 2013-2 CLO (the “2013-2 Notes”) were issued by GF 2013-2 through a private placement and were comprised of $50.0 million of senior secured revolving notes, $160.3 million of senior secured term notes and an aggregate of $139.7 million of notes that were retained by GARS. As of June 30, 2016 (as described below), $31.1 million of senior secured revolving notes and $160.3 million of senior secured term notes were outstanding.
On September 29, 2016, GF 2016-2 closed the 2016-2 CLO securitization transaction which included, through a private placement, the issuance of the 2016-2 Notes (as defined below). The notes offered in 2016-2 CLO (collectively referred to as the “2016-2 Notes”) were issued by GF 2016-2 and were comprised of: (i) $25.00 million of AAA(sf) Class A-1R Senior Secured Revolving Floating Rate Notes (“Class A-1R Notes”); (ii) $88.15 million of AAA(sf) Class A-1T Senior Secured Floating Rate Notes (“Class A-1T Notes”); (iii) $25.00 million of AAA(sf) Class A-1F Senior Secured Fixed Rate Notes (“Class A-1F Notes”); (iv) $20.70 million of AA(sf) Class A-2 Senior Secured Floating Rate Notes (“Class A-2 Notes” and collectively with the Class A-1R Notes, the Class A-1T Notes and the Class A-2F Notes, the “Class A Notes”); (v) $21.45 million of A(sf) Class B Secured Deferrable Floating Rate Notes (“Class B Notes”); (vi) $11.70 million of BBB(sf) Class C Secured Deferrable Floating Rate Notes (“Class C Notes” and collectively, the Class A Notes, Class B Notes and Class C Notes are referred to as the “Secured Notes”); and (vii) $108.00 million of subordinated notes (“Subordinated Notes”), which do not have a stated interest rate, are not rated and were retained by GARS. The 2016-2 Notes are scheduled to mature on September 29, 2027.
In connection with the closing of the sale of the 2016-2 Notes, substantially all of the net cash proceeds, along with existing cash, were used to purchase a portion of the portfolio of loans held by GF 2013-2. GF 2013-2 used the proceeds received in connection with such sale of loans to redeem in full all of the 2013-2 Notes. The refinance of the 2013-2 CLO resulted in a $1.8 million loss for the year ended December 31, 2016 due to the third party expenses incurred as part of the 2013-2 CLO which had initially been deferred over the stated life of the 2013-2 CLO. This loss was included in the consolidated statements of operations within loss on refinancing of secured notes.
Fees paid as part of the execution of the 2016-2 CLO, in the amount of $2.4 million, consisted of facility fees of $1.6 million and other costs of $0.8 million, which primarily included rating agency and legal fees. Pursuant to FASB ASC Topic 470, Debt, we accelerated the amortization of $1.6 million of these fees and included them in interest expense for the year ended December 31, 2016, and we initially deferred the remaining $0.9 million of these costs. These costs will be amortized into interest expense over the stated life of the 2016-2 Notes. As of December 31, 2016, $0.9 million of these costs are included in deferred debt issuance costs and presented net within the liability on the consolidated statements of financial condition and will be amortized over the stated maturity of the respective loans.
At December 31, 2016, the Class A-1R Notes under the 2016-2 CLO were fully undrawn. As of December 31, 2015, $15.0 million of the revolving notes under the 2013-2 CLO were undrawn. The fair value of the notes issued by the CLOs approximated their carrying values on the consolidated statements of financial condition as of December 31, 2016 and December 31, 2015.
The indenture governing the 2016-2 Notes provides that, to the extent cash is available from cash collections, the holders of the 2016-2 Notes are to receive quarterly interest payments on the 20th day or, if not a business day, the next succeeding business day of February, May, August and November of each year until the stated maturity.
Under the documents governing the 2016-2 CLO, there are two coverage tests applicable to the Secured Notes. The first test compares the amount of interest received on the collateral loans held by GF 2016-2 to the amount of interest payable on the Secured Notes under the 2016-2 CLO in respect of the amounts drawn and certain expenses. To meet this first test, at any time, the aggregate amount of interest received on the collateral loans must equal, after the payment of certain fees and expenses, at least 135.0% of the aggregate amount of interest payable on the Class A Notes, 125.0% of the interest payable on the Class A Notes and Class B Notes, taken together, and 115% of the interest payable on the Class A Notes, Class B Notes and Class C Notes, taken together.
The second test compares the aggregate principal amount of the collateral loans, as calculated in accordance with the indenture, to the aggregate outstanding principal amount of the Secured Notes in respect of the amounts drawn. To meet this second test at any time, the aggregate principal amount of the collateral loans must equal at least 173.4% of the aggregate outstanding principal amount of the Class A Notes, 156.1% of the aggregate principal amount of the Class A Notes and Class B Notes, taken together, and 148.1% of the aggregate outstanding principal amount of the Class A Notes, Class B Notes and Class C Notes, taken together.
If the coverage tests are not satisfied with respect to a quarterly payment date, GF 2016-2 will be required to apply available amounts to the repayment of interest on and principal of the 2016-2 Notes to the extent necessary to satisfy the applicable coverage tests and, as a result, there may be reduced funds available for GF 2016-2 to make additional investments or to make distributions on the Subordinated Notes held by the Company. Additionally, compliance is measured on each day collateral loans are purchased, originated or sold and in connection with monthly reporting to the note holders.
Furthermore, if under the second coverage test the aggregate principal amount of the collateral loans equals 125.0% or less of the aggregate outstanding principal amount on the Class A-1T Notes and Class A-1R Notes, taken together, and remains so for ten business days, an event of default will be deemed to have occurred. As of December 31, 2016 and December 31, 2015, the trustee for the 2016-2 CLO and 2013-2 CLO, respectively, has asserted that all of the coverage tests were met.
Garrison SBIC Borrowings
As discussed in Note 1, Garrison SBIC received a license to operate as an SBIC from the SBA on May 26, 2015. The SBIC license allows Garrison SBIC to obtain SBA-guaranteed debentures in an amount equal to twice its equity capitalization up to $150.0 million of leverage, subject to the issuance of a capital commitment by the SBA and other customary procedures. On June 16, 2015, the SBA issued Garrison SBIC a commitment to provide $35.0 million of leverage and on October 24, 2016 issued a second commitment to provide an additional $35.0 million of leverage.
The SBA issues SBA-guaranteed debentures bi-annually on pooling dates in March and September of each year. These debentures are non-recourse, interest only debentures with a 10 year stated maturity, but may be prepaid at any time without penalty. The interest rate of the debentures is fixed at the time of issuance and is based on a coupon rate over the ten year treasury rate at the time of issuance. Interest on the debentures is payable on a semi-annual basis. The SBA issues interim financings to SBICs on non-pooling dates that carry a lower interest rate than the debentures and mature on the next pooling date.
The SBA, as a creditor, will have a superior claim to Garrison SBIC’s assets over the Company’s stockholders if Garrison SBIC were to be liquidated, or if the SBA exercises its remedies under the SBA-guaranteed debentures issued by Garrison SBIC upon an event of default.
As of December 31, 2016, Garrison SBIC had regulatory capital of $36.1 million and total SBIC borrowings outstanding of $37.0 million. The SBIC borrowings include $14.0 million, $12.7 million and $3.3 million of SBA guaranteed debentures that mature on September 1, 2025, March 1, 2026 and September 1, 2026, respectively. In addition, SBIC interim financings of $7.0 million that mature on March 29, 2017 are included in our SBIC Borrowings. The fair value of the SBIC borrowings approximated its carrying value on the consolidated statements of financial condition as of December 31, 2016 and December 31, 2015. As of December 31, 2016, the Company had $33.0 million of available SBIC leverage capacity.
GLC Trust 2013-2 Notes
On July 18, 2014, GARS completed the GLC Trust 2013-2 Securitization. GLC Trust 2013-2 Notes were issued by GLC Trust 2013-2 and consisted of $36.9 million of Class A Notes (“GLC Trust 2013-2 Class A Notes”) and $2.3 million of Class B Notes (“GLC Trust 2013-2 Class B Notes”). As of December 31, 2016, GARS has retained all of the GLC Trust 2013-2 Class B Notes, which are eliminated in consolidation.
The GLC Trust 2013-2 Class A Notes bear interest at 3.00% per annum and are scheduled to mature on July 15, 2021. The proceeds of the GLC Trust 2013-2 Notes were used to refinance the $10.0 million revolving credit facility with Capital One, N.A. which was fully paid down and terminated concurrent with the issuance of the GLC Trust 2013-2 Notes.
The fair value of the GLC Trust 2013-2 Notes approximated the carrying value on the consolidated statements of financial condition as of December 31, 2016 and December 31, 2015, respectively.
The indenture governing the GLC Trust 2013-2 Notes provides that, to the extent cash is available from cash collections, the holders of the GLC Trust 2013-2 Notes are to receive monthly interest and principal payments on the 15th day or, if not a business day, the next succeeding business day, commencing in August 2014, until the stated maturity.
Under the indenture governing the GLC Trust 2013-2 Notes, there are two applicable monthly tests. The first test compares the principal balance of the underlying loans to the principal balance of the GLC Trust 2013-2 Notes. To meet this first test, the aggregate principal balance of the underlying loans less the aggregate principal balance of the GLC Trust 2013-2 Notes must equal, at least, the greater of (1) 13.00% of the aggregate principal balance of the underlying loans as of the end of the prior month and (2) 5.25% of the loan pool balance as of July 11, 2014.
The second test compares the ratio of the dollar amount of cumulative defaults to the original principal balance of the underlying loans as of July 11, 2014 (“Cumulative Default Ratio”) to the Cumulative Default Ratio trigger level, as stated in the indenture. To meet this second test, the Cumulative Default Ratio must not exceed the Cumulative Default Ratio trigger level.
If these tests are not satisfied with respect to a monthly payment date and are not cured within 45 days, an event of default will be deemed to have occurred and the GLC Trust 2013-2 Notes will become immediately due and payable, in accordance with the terms of the indenture. As of both December 31, 2016 and December 31, 2015, all of the coverage tests were met.
| 119 |
Garrison Capital Inc. and Subsidiaries
Notes to Consolidated Financial Statements
December 31, 2016
7. Financing – (continued)
Deferred Debt Issuance Costs and Other Fees
In connection with the issuance of our various debt instruments, GARS incurred aggregate fees in the amount of $6.2 million which consisted of facility fees of $4.3 million and other costs of $1.9 million, which included rating agency fees and legal fees. Fees paid as part of the execution of the GLC Trust 2013-2 Securitization in the amount of $0.4 million consisted of legal and other fees. For the year ended December 31, 2015, we paid total fees of $0.8 million on our SBIC borrowings. Fees paid as part of the execution of our SBIC borrowings include a 1.00% commitment fee on our $35.0 million commitment, 2.00% leverage fees and 0.43% of other fees on amounts drawn. Costs incurred in connection with the issuance of the Company’s debt instruments, are included as a reduction to the carrying amount of the related liability on the consolidated statements of financial condition and will be amortized over the stated maturity of the respective loans, with $4.0 million and $4.4 million of deferred debt issuance costs remaining as of December 31, 2016 and December 31, 2015, respectively.
| 120 |
Garrison Capital Inc. and Subsidiaries
Notes to Consolidated Financial Statements
December 31, 2016
8. Related Party Transactions
Investment Advisory Agreement
GARS entered into the Investment Advisory Agreement with the Investment Adviser, which was most recently amended and restated on August 5, 2016. The Investment Advisory Agreement entitles the Investment Adviser to a base management fee and an incentive fee, both of which are described further below.
Effective as of October 1, 2016, the Investment Adviser, in consultation with the Board, agreed to irrevocably waive any fees payable to the Investment Adviser under the Investment Advisory Agreement with respect to a calendar quarter in excess of the sum of (i) 0.375% per quarter (1.50% annualized) of the gross assets of the Company, excluding cash and cash equivalents but including assets purchased with borrowed funds, calculated based on the average carrying value of the gross assets of the Company at the end of the two most recently completed calendar quarters, (ii) 20% of pre-incentive fee net investment income, expressed as a rate of return on the value of the Company’s net assets at the end of the immediately preceding calendar quarter, in excess of a “hurdle rate” of 1.75% per quarter (7.00% annualized) and (iii) in the case of the final calendar quarter of each year, the capital gains incentive fee. This waiver will be in effect until the earlier of (i) June 30, 2017 and (ii) approval by the stockholders of the Company of an amendment to the Investment Advisory Agreement to decrease the base management fee to an annual rate of 1.50% and to decrease the “hurdle rate” for the income-based portion of the Incentive Fee to 1.75% per quarter (7.00% annualized).
Base Management Fee
Under the Investment Advisory Agreement, the Investment Adviser is entitled to a base management fee for its services calculated at an annual rate of 1.75% of gross assets, excluding cash and cash equivalents, and cash and cash equivalents, restricted, but including assets purchased with borrowed funds. For purposes of the Investment Advisory Agreement, cash equivalents means U.S. government securities and commercial paper maturing within 270 days of purchase.
The following table details our management fee expenses for the years ended December 31, 2016, 2015, and 2014:
| Year Ended | Year Ended | Year Ended | ||||||||||
| ($ in thousands) | December 31, 2016 | December 31, 2015 | December 31, 2014 | |||||||||
| Management fees | ||||||||||||
Gross management fees | $ | 7,221 | $ | 7,755 | $ | 8,065 | ||||||
| Management fees waived | (249 | ) | - | - | ||||||||
Total management fees, net of waived fees | $ | 6,972 | $ | 7,755 | $ | 8,065 | ||||||
Management fees in the amount of $0.1 million and $1.8 million were payable as of December 31, 2016 and December 31, 2015, respectively, and are included in management fee payable on the consolidated statements of financial condition.
Incentive Fee Overview
Under the current Investment Advisory Agreement, the Investment Adviser is entitled to an incentive fee consisting of two components and a cap and deferral mechanism. The two components are independent of each other, and may result in one component being payable even if the other is not.
The first component, which is income-based and payable quarterly in arrears, equals 20.00% of the amount, if any, that the Company’s pre-incentive fee net investment income exceeds a 2.00% quarterly (8.00% annualized) hurdle rate (the “Hurdle Rate”), subject to a “catch-up” provision measured at the end of each calendar quarter.
The operation of the first component of the incentive fee for each quarter is as follows:
| • | no incentive fee is payable to the Investment Adviser in any calendar quarter in which the Company’s pre-incentive fee net investment income does not exceed the Hurdle Rate; |
| • | 100.00% of the Company’s pre-incentive fee net investment income with respect to that portion of the Company’s pre-incentive fee net investment income, if any, that exceeds the Hurdle Rate but is less than 2.50% in any calendar quarter (10.00% annualized). We refer to this portion of the Company’s pre-incentive fee net investment income (which exceeds the Hurdle Rate but is less than 2.50%) as the “catch-up”. The effect of the “catch-up” provision is that, if the Company’s pre-incentive fee net investment income exceeds 2.50% in any calendar quarter, the Investment Adviser will receive 20.00% of such pre-incentive fee net investment income as if the Hurdle Rate did not apply; and |
| • | 20.00% of the amount of the Company’s pre-incentive fee net investment income, if any, that exceeds 2.50% in any calendar quarter (10.00% annualized) (once the Hurdle Rate is reached and the catch-up is achieved). |
| 121 |
Garrison Capital Inc. and Subsidiaries
Notes to Consolidated Financial Statements
December 31, 2016
8. Related Party Transactions – (continued)
The portion of such incentive fee that is attributable to deferred interest (such as PIK interest or original issue discount) will be paid to the Investment Adviser, together with any other interest accrued on the loan from the date of deferral to the date of payment, only if and to the extent the Company actually receives such interest in cash, and any accrual thereof will be reversed if and to the extent such interest is reversed in connection with any write-off or similar treatment of the investment giving rise to any deferred interest accrual. Any reversal of such amounts would reduce net income for the quarter by the net amount of the reversal (after taking into account the reversal of incentive fees payable) and would result in a reduction and possible elimination of the incentive fees for such quarter. For the avoidance of doubt, no incentive fee will be paid to the Investment Adviser on amounts accrued and not paid in respect of deferred interest.
The second component, which is capital gains-based, is determined and payable in arrears as of the end of each calendar year (or upon termination of the Investment Advisory Agreement, as of the termination date) and equals 20% of the Company’s cumulative aggregate realized capital gains through the end of such year, computed net of the Company’s aggregate cumulative realized capital losses and aggregate cumulative unrealized capital loss through the end of such year, less the aggregate amount of any previously paid capital gains incentive fees and subject to the Incentive Fee Cap and Deferral Mechanism described below. The capital-gains component of the incentive fee excludes any portion of realized gains (losses) that are associated with the reversal of any portion of unrealized gain/(loss) attributable to periods prior to April 1, 2013. The capital gains component of the incentive fee is not subject to any minimum return to stockholders.
In addition, under U.S. GAAP, we are required to accrue a capital gains incentive fee based upon the aggregate cumulative realized capital gains and losses and aggregate cumulative unrealized capital gain and loss on investments held at the end of each period. If such amount is positive at the end of a period, then the Company will record a capital gains incentive fee equal to 20.00% of such amount, less the aggregate amount of actual capital gains related incentive fees paid in all prior years. If such amount is negative, then there is no accrual for such period. For the year ended December 31, 2014, the Company accrued capital gains incentive fee in the amount of $1.6 million. There were not any accrued capital gains incentive fee for December 31, 2016 and December 31, 2015.
The Investment Advisory Agreement does not permit unrealized capital gains for purposes of calculating the amount payable to the Investment Adviser. Amounts due related to unrealized capital gains, if any, will not be paid to the Investment Adviser until realized under the terms of the Investment Advisory Agreement (as described above).
Incentive Fee Cap and Deferral Mechanism
We have structured the calculation of these incentive fees to include a fee limitation such that no incentive fee will be paid to our Investment Adviser for any fiscal quarter if, after such payment, the cumulative incentive fees paid to our Investment Adviser for the period that includes such fiscal quarter and the 11 full preceding fiscal quarters (the “Incentive Fee Look-back Period”) would exceed 20.00% of our Cumulative Pre-Incentive Fee Net Return during the applicable Incentive Fee Look-back Period. The “Cumulative Pre-Incentive Fee Net Return” is defined as the sum of (1) pre-incentive fee net investment income, (2) cumulative realized capital gains / (losses), and (3) cumulative unrealized capital gains / (losses) for the Incentive Fee Look-back Period. The Incentive Fee Look-back Period commenced on April 1, 2013. Prior to April 1, 2016, the Incentive Fee Look-back Period consisted of fewer than 12 full fiscal quarters.
The following table details our incentive fee expenses for the years ended December 31, 2016, 2015 and 2014.
| Year Ended | Year Ended | Year Ended | ||||||||||
| ($ in thousands) | December 31, 2016 | December 31, 2015 | December 31, 2014 | |||||||||
| Incentive fees | ||||||||||||
| Income-based incentive fees | $ | 3,234 | $ | 6,216 | $ | 6,069 | ||||||
| Capital gains-based incentive fees(1) | - | (2,447 | ) | 2,340 | ||||||||
| Incentive fees subject to cap & deferral mechanism(2) | (3,234 | ) | (2,634 | ) | - | |||||||
| Total incentive fees | $ | - | $ | 1,135 | $ | 8,409 | ||||||
______________
| (1) | Capital gains-based incentive fees for the year ended December 31, 2015 of $(2.4) million represents the reversal of capital gains-based incentive fees that were previously accrued in 2014 and 2013. |
| (2) |
As of December 31, 2016, the Investment Adviser had calculated an aggregate of $16.1 million of income-based incentive fees, since January 1, 2014, of which $10.6 million had been paid as of December 31, 2016. However, the Cumulative Pre-Incentive Fee Net Return has been decreased by the aggregate cumulative net realized and unrealized capital losses, as calculated under U.S. GAAP, experienced through the Incentive Fee Look-back Period. As a result, as of December 31, 2016, aggregate incentive fees payable to the Investment Adviser during the Incentive Fee Look-back Period were capped by the Incentive Fee Cap and Deferral Mechanism at $6.9 million (i.e., 20% of Cumulative Pre-Incentive Fee Net Return, during the Incentive Fee Look-back Period).
Due to the fact that there is no clawback of amounts previously paid to the Investment Adviser in accordance with the Investment Advisory Agreement, the Company has not recorded a receivable for the $3.7 million difference between amounts paid under the Investment Advisory Agreement in prior quarters and the Incentive Fee Cap based on the Company’s Cumulative Pre-Incentive Fee Net Return as of December 31, 2016.
The $3.7 million difference may be used to reduce future amounts earned by the Investment Adviser. However, as noted above, no incentive fee will be paid to the Investment Adviser for any fiscal quarter if, after such payment, the cumulative incentive fees paid to our Investment Adviser for the Incentive Fee Look-back Period would exceed 20% of our Cumulative Pre-Incentive Fee Net Return during the applicable Incentive Fee Look-back Period. To the extent unrealized capital losses incurred as of December 31, 2016 are reversed within the applicable Incentive Fee Look-back Period, the corresponding increase in our Cumulative Pre-Incentive Fee Net Return may result in the Investment Adviser earning and being paid up to $5.5 million of income based incentive fees which are currently subject to the Incentive Fee Cap.
As of December 31, 2016, the Incentive Fee Look-back Period is in effect through December 31, 2019 and realized and unrealized capital gains and losses and pre-incentive net investment income earned through December 31, 2016 will cease to impact the Incentive Fee Cap and Deferral after this date.
The Investment Adviser earned aggregate incentive fees of $3.2 million, $3.8 million and $8.4 million for the years ended December 31, 2016, December 31, 2015 and December 31, 2014, respectively. However, no incentive fees were payable on the consolidated statements of financial condition as of December 31, 2016 and December 31, 2015 due to the Incentive Fee Cap. |
| 122 |
Garrison Capital Inc. and Subsidiaries
Notes to Consolidated Financial Statements
December 31, 2016
8. Related Party Transactions – (continued)
Administration Agreement
As discussed in Note 1, GARS entered into the Administration Agreement with GARS Administrator. Under the Administration Agreement, the GARS Administrator provides the Company with office facilities, equipment, clerical, bookkeeping and record keeping services at such facilities and such other services as the GARS Administrator, subject to review by the Board, from time to time determines to be necessary or useful to perform its obligations under the Administration Agreement. The GARS Administrator is responsible for the financial and other records that the Company is required to maintain and prepares reports to stockholders, and reports and other materials filed with the SEC. The GARS Administrator provides on the Company’s behalf significant managerial assistance to those portfolio companies to which the Company is required to provide such assistance. No managerial assistance was provided to any portfolio companies for the years ended December 31, 2016 and December 31, 2015.
In addition, the GARS Administrator assists the Company in determining and publishing the Company’s net asset value, overseeing the preparation and filing of the Company’s tax returns, and the printing and dissemination of reports to stockholders of the Company, and generally oversees the payment of the Company’s expenses and the performance of administrative and professional services rendered to the Company by others. The Company reimburses the GARS Administrator for the costs and expenses incurred by the GARS Administrator in performing its obligations and providing personnel and facilities as described.
GLC Trust 2013-2 entered into the GLC Trust 2013-2 Administration Agreement with GARS Administrator, fees incurred under this agreement are included in total administrator expenses presented on the consolidated statement of operations.
Administrator charges for the years ended December 31, 2016, December 31, 2015 and December 31, 2014 were $1.3 million, $1.1 million, and $0.7 million, respectively. Charges were waived by the GARS Administrator for the year ended December 31, 2016. No charges were waived by the GARS Administrator for the years ended December 31, 2015, and December 31, 2014. No administration fees were payable to the GARS Administrator as of December 31, 2016 and December 31, 2015.
Directors’ Fees
The Company’s independent directors each receive an annual fee of $75,000. They also receive $2,500 plus reimbursement of reasonable out-of-pocket expenses incurred in connection with attending each in-person Board meeting and receive $1,000 plus reimbursement of reasonable out-of-pocket expenses incurred in connection with attending each committee meeting.
In addition, the chairman of the audit committee receives an annual fee of $10,000, the chairman of the valuation committee receives an annual fee of $10,000 and each chairman of any other committee receives an annual fee of $5,000 for their additional services in these capacities (all such fees and reimbursements collectively, “Directors’ Fees”). No compensation is paid to directors who are not independent of the Company and the Investment Adviser.
Independent directors earned $0.4 million for each of the years ended December 31, 2016, December 31, 2015 and December 31, 2014. No Directors’ Fees were payable as of December 31, 2016 and December 31, 2015.
Affiliated Stockholders
GSOF LLC, GSOF 2014 LLC, GSOF-SP LLC, GSOF-SP 2014 LLC, GSOF-SP II LLC, GSOF-SP 2014 II LLC, GSOF-SP DB LLC (subsidiaries of Garrison Special Opportunities Fund LP), GSOIF Corporate Loan Pools Ltd. (a subsidiary of Garrison Special Opportunities Institutional Fund LP), GCOH SubCo 2014-1 LLC (a subsidiary of Garrison Credit Opportunities Holdings L.P.), GCOH SubCo 2014-2 LLC (a subsidiary of Garrison Credit Opportunities Holdings L.P.), Garrison Capital Fairchild I Ltd. (a subsidiary of Fairchild Offshore Fund L.P.), Garrison Capital Fairchild II Ltd. (a subsidiary of Fairchild Offshore Fund II L.P.) and Garrison Capital Adviser Holdings MM LLC (collectively, the “Garrison Funds”) are all entities that are owned by funds that are managed by the Investment Manager.
| 123 |
Garrison Capital Inc. and Subsidiaries
Notes to Consolidated Financial Statements
December 31, 2016
8. Related Party Transactions – (continued)
As of December 31, 2014, the Garrison Funds owned an aggregate of 2,024,372, or 12.1%, of the total outstanding common shares of GARS, and the officers and directors of the Company directly owned an aggregate of 73,032, or 0.4%, of the total outstanding common shares of GARS. On March 19, 2015, GSOF LLC, GSOF-SP LLC, GSOF-SP II LLC, GSOF-SP DB LLC, GSOIF Corporate Loan Pools Ltd. and GCOH SubCo 2014-1 LLC. (collectively, the “Garrison Offering Funds”) sold an aggregate 884,990 shares of GARS common stock in a secondary offering. In connection with this sale, the Garrison Offering Funds agreed to reimburse the Company for certain fees and expenses in the amount of $18,654 incurred in connection with the filing of the Company’s Registration Statement. On March 23, 2015, the Garrison Offering Funds sold an aggregate of 125,000 shares of GARS common stock in a private offering. On May 8, 2015, Garrison Capital Fairchild I Ltd. and Garrison Capital Fairchild II Ltd sold an aggregate 200,000 shares of GARS common stock in a secondary offering.
On August 10, 2015, GSOF 2014 LLC, GSOF-SP 2014 LLC, GSOF-SP 2014 II LLC and GCOH SubCo 2014-2 LLC distributed an aggregate of 24,472 shares to certain officers and members of senior management of the Company. As of December 31, 2016, Garrison Capital Fairchild I Ltd., Garrison Capital Fairchild II Ltd. and Garrison Capital Adviser Holdings MM LLC owned an aggregate of 789,910, or 4.9%, of the total outstanding shares of GARS common stock. As of December 31, 2016. the officers and directors of the Company owned an aggregate of 140,471, or 0.9%, of the total outstanding shares of GARS common stock.
Other
Garrison Loan Agency Services LLC acts as the administrative and collateral agent for certain loans held by the Company. No fees were paid by the Company to Garrison Loan Agency Services LLC during the years ended December 31, 2016 and December 31, 2015.
The Company may invest alongside other clients of the Investment Manager and their affiliates in certain circumstances where doing so is consistent with applicable law, SEC staff interpretations and the terms of our exemptive relief.
For certain other expenses, the GARS Administrator facilitates payments by GARS to third parties through the Investment Adviser or other affiliate. Other than the amount of expenses paid to third parties and fees payable under the Investment Advisory Agreement, no additional charges or fees are assessed by the GARS Administrator, the Investment Adviser or other affiliates.
| 124 |
Garrison Capital Inc. and Subsidiaries
Notes to Consolidated Financial Statements
December 31, 2016
9. Financial Highlights
The following table represents financial highlights for the Company for the years ended December 31, 2016, December 31, 2015 and December 31, 2014.
| Per share data | December 31, 2016 | December 31, 2015 | December 31, 2014 | |||||||||
| ($ in thousands, except share and per share amounts) | ||||||||||||
| Net asset value per common share at beginning of period | $ | 13.98 | $ | 15.58 | $ | 15.16 | ||||||
| Increase in net assets from operations: | ||||||||||||
| Net investment income | 1.18 | 1.79 | 1.31 | |||||||||
| Net realized gain/(loss) on investments | (1.89 | ) | (0.70 | ) | 0.64 | |||||||
| Net unrealized gain/(loss) on investments | 0.41 | (1.31 | ) | (0.13 | ) | |||||||
| Net (decrease)/increase in net assets from operations | (0.30 | ) | (0.22 | ) | 1.82 | |||||||
| Stockholder transactions | ||||||||||||
| Repurchase of common stock | 0.07 | 0.02 | - | |||||||||
| Distributions from net investment income | (1.33 | ) | (1.40 | ) | (1.25 | ) | ||||||
| Distributions from realized gains | (0.15 | ) | ||||||||||
| Total stockholder transactions | (1.26 | ) | (1.38 | ) | (1.40 | ) | ||||||
| Net asset value per common share at end of period | $ | 12.42 | $ | 13.98 | $ | 15.58 | ||||||
| Per share market value at beginning of period | $ | 12.17 | $ | 14.44 | $ | 13.88 | ||||||
| Per share market value at end of period | 9.35 | 12.17 | 14.44 | |||||||||
| Total book return (1) | (1.65 | )% | (1.28 | )% | 12.01 | % | ||||||
| Total market return (2) | (11.80 | )% | (7.05 | )% | 14.35 | % | ||||||
| Common shares outstanding at beginning of period | 16,507,594 | 16,758,779 | 16,758,779 | |||||||||
| Common shares outstanding at end of period | 16,049,352 | 16,507,594 | 16,758,779 | |||||||||
| Weighted average common shares outstanding | 16,149,866 | 16,742,531 | 16,758,779 | |||||||||
| Net assets at beginning of period | $ | 230,710 | $ | 261,103 | $ | 254,081 | ||||||
| Net assets at end of period | $ | 199,408 | $ | 230,710 | $ | 261,103 | ||||||
| Average net assets (3) | $ | 215,212 | $ | 256,826 | $ | 261,834 | ||||||
| Ratio of net expenses to average net assets (4) | 11.09 | % | 8.32 | % | 10.87 | % | ||||||
| Ratio of net investment income to average net assets (4) | 8.87 | % | 11.66 | % | 8.41 | % | ||||||
| Ratio of portfolio turnover to average investments at fair value (5) | 30.05 | % | 41.42 | % | 90.57 | % | ||||||
| Asset coverage ratio (6) | 215.48 | % | 208.84 | % | 207.81 | % | ||||||
| Average outstanding debt (7) | $ | 221,373 | $ | 226,940 | $ | 228,162 | ||||||
| Average debt per common share | $ | 13.79 | $ | 13.75 | $ | 13.61 | ||||||
| 125 |
Garrison Capital Inc. and Subsidiaries
Notes to Consolidated Financial Statements
December 31, 2016
9. Financial Highlights – (continued)
| (1) | Total book return equals the net increase of ending net asset value from operations plus the effect of repurchases of common stock over the net asset value per common share at the beginning of the period. | |||||
| (2) | Based upon the change in market price per share during the period and takes into account distributions, if any, reinvested in accordance with our dividend reinvestment plan. | |||||
| (3) | Calculated utilizing monthly net assets. | |||||
| (4) | During the year ended December 31, 2016, $3.2 million of income-based incentive fees were capped as a result of the Incentive Fee Cap and Deferral Mechanism and $0.2 million of management fees were irrevocably waived. Had these management and incentive fees been earned, the ratio of net investment income to average net assets and the ratio of net expenses to average net assets would have been 7.25% and 12.71%, respectively. | |||||
| (5) | Calculated based on monthly average investments at fair value. | |||||
| (6) | In accordance with the 1940 Act, with certain limited exceptions, the Company is only allowed to borrow amounts such that its asset coverage, as defined in the 1940 Act, is at least 200% after such borrowing. Based on the exemptive relief received from the SEC, our SBIC Borrowings are excluded from the Company’s asset coverage test calculation. | |||||
| (7) | Calculated based on monthly average investments at fair value. | |||||
10. Net Assets
The Company’s authorized stock consists of 100,000,000 shares of common stock, par value $0.001 per share, and 1,000,000 shares of preferred stock, par value $0.001 per share.
We priced our initial public offering (“IPO”) on March 26, 2013, selling 6,133,334 shares at a public offering price of $15.00 per share. The closing of the IPO took place on April 2, 2013 and all shares were issued as of that date. Concurrent with the IPO, the Company’s directors, officers, employees and an affiliate of the Investment Adviser purchased an additional 126,901 shares through a concurrent private placement transaction at a price of $15.00 per share. An aggregate of 16,049,352 and 16,507,594 shares of common stock, par value $0.001 per share, were outstanding as of December 31, 2016 and December 31, 2015, respectively.
For the years ended December 31, 2016 and December 31, 2015, there were no shares of preferred stock issued.
| 126 |
Garrison Capital Inc. and Subsidiaries
Notes to Consolidated Financial Statements
December 31, 2016
11. Earnings per share
The following table sets forth the computation of the net increase in net assets per share resulting from operations, pursuant to FASB ASC Topic 260, Earnings per Share, for the years ended December 31, 2016, December 31, 2015 and December 31, 2014:
| Year Ended | Year Ended | Year Ended | ||||||||||
| ($ in thousands, except per share data) | December 31, 2016 | December 31, 2015 | December 31, 2014 | |||||||||
| Net (decrease)/increase in net asset resulting from operations | $ | (4,810 | ) | $ | (3,660 | ) | $ | 30,484 | ||||
| Basic weighted average shares outstanding | 16,149,866 | 16,742,531 | 16,758,779 | |||||||||
| Basic (loss)/earnings per share | $ | (0.30 | ) | $ | (0.22 | ) | $ | 1.82 | ||||
12. Dividends and Distributions
GARS dividends and distributions are recorded on the ex-dividend date. The following table reflects the cash distributions declared on common stock for the fiscal years ended December 31, 2016 and December 31, 2015.
| Record Dates ($ in thousands except per share data) | Board Approval Date | Payment Date | Distribution Declared | Distribution Declared per Share | ||||||||
| Year Ended December 31, 2016(1) | ||||||||||||
| December 9, 2016 | November 1, 2016 | December 23, 2016 | $ | 4,494 | $ | 0.28 | ||||||
| September 9, 2016 | August 2, 2016 | September 23, 2016 | 5,617 | 0.35 | ||||||||
| June 10, 2016 | May 2, 2016 | June 24, 2016 | 5,655 | 0.35 | ||||||||
| March 8, 2016 | February 24, 2016 | March 28, 2016 | 5,685 | 0.35 | ||||||||
| $ | 21,451 | $ | 1.33 | |||||||||
______________
| (1) | Does not include any return of capital for tax purposes. |
| Record Dates ($ in thousands except per share data) | Board Approval Date | Payment Date | Distribution
Declared | Distribution
Declared per Share | ||||||||
| Year Ended December 31, 2015(1) | ||||||||||||
| December 11, 2015 | November 2, 2015 | December 28, 2015 | $ | 5,820 | $ | 0.35 | ||||||
| September 10, 2015 | July 30, 2015 | September 25, 2015 | 5,866 | 0.35 | ||||||||
| June 12, 2015 | April 30, 2015 | June 26, 2015 | 5,866 | 0.35 | ||||||||
| March 20, 2015 | March 3, 2015 | March 27, 2015 | 5,866 | 0.35 | ||||||||
| $ | 23,418 | $ | 1.40 | |||||||||
______________
| (1) | Does not include any return of capital for tax purposes. |
| 127 |
Garrison Capital Inc. and Subsidiaries
Notes to Consolidated Financial Statements
December 31, 2016
12. Dividends and Distributions – (continued)
Dividends from net investment income and distributions from net realized capital gains are determined in accordance with U.S. Federal Income Tax regulations, which may differ from those amounts determined in accordance with U.S. GAAP.
13. Commitments and Contingencies
The Company had outstanding commitments to fund investments totaling $4.8 million and $6.9 million under various undrawn revolvers and other credit facilities as of December 31, 2016 and December 31, 2015, respectively.
In the ordinary course of business, the Company may be named as a defendant or a plaintiff in various lawsuits and other legal proceedings. Such proceedings include actions brought against the Company and others with respect to transactions to which the Company may have been a party. The outcomes of such lawsuits are uncertain and, based on these lawsuits, the values of the investments to which they relate could decrease. Management does not believe that as a result of litigation there would be any material impact on the consolidated financial condition of the Company. The Company has had no outstanding litigation proceedings brought against it since the commencement of operations on December 17, 2010.
14. Stock Repurchase Program
On October 5, 2015, we adopted a share repurchase plan that provided for repurchase of up to $10.0 million of our common stock at prices below our net asset value per share as reported in our most recent financial statements. Under the repurchase program, we repurchased shares of our outstanding common stock in the open market or in privately negotiated transactions from time to time. Repurchases by us complied with the requirements of Rule 10b-18 under the Securities Exchange Act of 1934, as amended, and any applicable requirements of the 1940 Act. The repurchase program terminated in accordance with its terms on October 5, 2016. Our net asset value per share was increased by approximately $0.10 as a result of the aggregate share repurchases.
| Year Ended | Year Ended | |||||||
| ($ in thousands, except per share data) | December 31, 2016 | December 31, 2015 | ||||||
| Dollar amount repurchased | $ | 5,041 | $ | 3,314 | ||||
| Shares repurchased | 458,242 | 251,185 | ||||||
| Average price per share | $ | 11.00 | $ | 13.19 | ||||
| Weighted average discount to net asset value | (20.14 | )% | (11.67 | )% | ||||
15. Transactions with Non-control/Affiliate Investments
As required by the 1940 Act, investments are classified by level of control. “Control Investments” are investments in those companies that the Company is deemed to control as defined in the 1940 Act. “Affiliate Investments” are investments in those companies that are affiliated companies, as defined in the 1940 Act, other than Control Investments. “Non-Control/Non-Affiliate Investments” are those that are neither Control Investments nor Affiliate Investments.
Generally, under the 1940 Act, the Company is deemed to control a company in which it has invested if it owns more than 25% of the voting securities of such company. The Company is deemed to be an affiliate of a company in which it has invested if it owns 5% or more of the voting securities of such company.
| Year Ended December 31, 2016 | ||||||||||||||||||||||||||||||||||||||||||||
| Fair value at | Purchases | Redemptions | Sales | Transfer in (out) | Discount | Net unrealized | Fair value at | Net realized | Interest and | Dividend | ||||||||||||||||||||||||||||||||||
| Portfolio Company | December 31, 2015 | (cost) | (cost) | (cost) | (cost) | accretion | gains / (losses) | December 31, 2016 | gains / (losses) | fee income | income | |||||||||||||||||||||||||||||||||
| Non-control affiliate investments | ||||||||||||||||||||||||||||||||||||||||||||
| Speed Commerce Operating Company LLC(1) | $ | - | $ | 3,103 | $ | - | $ | - | $ | - | $ | - | $ | - | $ | 3,103 | $ | - | $ | 179 | $ | - | ||||||||||||||||||||||
| Speed Commerce Investment Partners LLC | - | 1,693 | - | - | - | - | (1,693 | ) | - | - | - | - | ||||||||||||||||||||||||||||||||
| Total non-control affiliate investments | $ | - | $ | 4,796 | $ | - | $ | - | $ | - | $ | - | $ | (1,693 | ) | $ | 3,103 | $ | - | $ | 179 | $ | - | |||||||||||||||||||||
__________
| (1) | Comprised of two investments, including the Closing Date Term Loan and Delayed Draw Term Loan with both a cost and fair value of $1.9 million and $1.2 million, respectively. |
As of December 31, 2015, we had no investments with non-control/affiliated investments.
16. Subsequent Events
On February 28, 2017 the Board approved a distribution in the amount of $4.5 million, or $0.28 a share, which will be paid on March 30, 2017 to stockholders of record as of March 23, 2017.
These consolidated financial statements were approved by the Board and were available for issuance on March 7, 2017. Subsequent events have been evaluated through this date. No material subsequent events other than as disclosed above have occurred through this date.
17. Selected Quarterly Financial Data (Unaudited)
| ($ in thousands, except per share amounts) | December 31, 2016 | September 30, 2016 | June 30, 2016 | March 31, 2016 | ||||||||||||
| Total investment income | $ | 9,653 | $ | 11,104 | $ | 11,138 | $ | 11,056 | ||||||||
| Net investment income | 4,932 | 2,538 | 5,753 | 5,861 | ||||||||||||
| Net (loss) on investments | (2,079 | ) | (3,625 | ) | (9,635 | ) | (8,556 | ) | ||||||||
| Net increase/(decrease) in net assets resulting from operations | 2,853 | (1,087 | ) | (3,882 | ) | (2,695 | ) | |||||||||
| Earnings per share | 0.18 | (0.07 | ) | (0.24 | ) | (0.17 | ) | |||||||||
| Net asset value per share | 12.42 | 12.53 | 12.94 | 13.50 | ||||||||||||
| ($ in thousands, except per share amounts) | December 31, 2015 | September 30, 2015 | June 30, 2015 | March 31, 2015 | ||||||||||||
| Total investment income | $ | 11,480 | $ | 13,206 | $ | 13,152 | $ | 13,479 | ||||||||
| Net investment income | 6,842 | 8,244 | 7,176 | 7,682 | ||||||||||||
| Net (loss) on investments | (17,109 | ) | (8,485 | ) | (3,300 | ) | (4,710 | ) | ||||||||
| Net (decrease)/increase in net assets resulting from operations | (10,267 | ) | (241 | ) | 3,876 | 2,972 | ||||||||||
| Earnings per share | (0.62 | ) | (0.01 | ) | 0.23 | 0.18 | ||||||||||
| Net asset value per share | 13.98 | 14.92 | 15.29 | 15.41 | ||||||||||||
| ($ in thousands, except per share amounts) | December 31, 2014 | September 30, 2014 | June 30, 2014 | March 31, 2014 | ||||||||||||
| Total investment income | $ | 13,385 | $ | 12,944 | $ | 12,848 | $ | 11,282 | ||||||||
| Net investment income | 6,880 | 6,261 | 5,979 | 2,889 | ||||||||||||
| Net (loss)/gain on investments | (1,212 | ) | (1,180 | ) | 3,080 | 7,788 | ||||||||||
| Net increase in net assets resulting from operations | 5,668 | 5,081 | 9,059 | 10,676 | ||||||||||||
| Earnings per share | 0.34 | 0.30 | 0.54 | 0.64 | ||||||||||||
| Net asset value per share | 15.58 | 15.59 | 15.64 | 15.45 | ||||||||||||
| 128 |
Item 9. Changes in and Disagreements With Accountants on Accounting and Financial Disclosure
None.
Item 9A. Controls and Procedures
(a) Evaluation of Disclosure Controls and Procedures
As of December 31, 2016 (the end of the period covered by this report), management, with the participation of our chief executive officer and chief financial officer, evaluated the effectiveness of the design and operation of our disclosure controls and procedures (as defined in Rule 13a-15(e) and 15d-15(e) of the Exchange Act). Based on that evaluation, our management, including the chief executive officer and chief financial officer, concluded that, at the end of such period, our disclosure controls and procedures were effective and provided reasonable assurance that information required to be disclosed in our periodic SEC filings is recorded, processed, summarized and reported within the time periods specified in the SEC’s rules and forms, and that such information is accumulated and communicated to our management, including our chief executive officer and chief financial officer, as appropriate, to allow timely decisions regarding required disclosure. Notwithstanding the foregoing, a control system, no matter how well designed and operated, can provide only reasonable, not absolute, assurance that it will detect or uncover failures within the Company to disclose material information otherwise required to be set forth in the our periodic reports.
(b) Management’s Report on Internal Control Over Financial Reporting
Management’s Report on Internal Control Over Financial Reporting Firm is included in “Item 8. Financial Statements and Supplementary Data” of this Annual Report on Form 10-K.
(c) Changes in Internal Controls Over Financial Reporting
Management has not identified any change in our internal control over financial reporting that occurred during the fourth fiscal quarter of 2016 that has materially affected, or is reasonably likely to materially affect, our internal control over financial reporting.
N/A
| 129 |
PART III
Item 10. Directors, Executive Officers and Corporate Governance
The information required by Item 10 is hereby incorporated by reference from our definitive Proxy Statement relating to our 2017 Annual Meeting of Stockholders, to be filed with the SEC within 120 days following the end of our fiscal year.
Item 11. Executive Compensation
The information required by Item 11 is hereby incorporated by reference from our definitive Proxy Statement relating to our 2017 Annual Meeting of Stockholders, to be filed with the SEC within 120 days following the end of our fiscal year.
Item 12. Security Ownership of Certain Beneficial Owners and Management and Related Stockholder Matters
The information required by Item 12 is hereby incorporated by reference from our definitive Proxy Statement relating to our 2017 Annual Meeting of Stockholders, to be filed with the SEC within 120 days following the end of our fiscal year.
Item 13. Certain Relationships and Related Transactions, and Director Independence
The information required by Item 13 is hereby incorporated by reference from our definitive Proxy Statement relating to our 2017 Annual Meeting of Stockholders, to be filed with the SEC within 120 days following the end of our fiscal year.
Item 14. Principal Accountant Fees and Services
The information required by Item 14 is hereby incorporated by reference from our definitive Proxy Statement relating to our 2017 Annual Meeting of Stockholders, to be filed with the SEC within 120 days following the end of our fiscal year.
| 130 |
PART IV
Item 15. Exhibits and Financial Statement Schedules
The following documents are filed as part of this Annual Report on Form 10-K:
| (1) | Financial Statements — Refer to Item 8 starting on page 79. |
| (2) | Financial Statement Schedules — None. |
| (3) | Exhibits. |
| Number | Description | ||
| 3.1 | Certificate of Incorporation (Incorporated by reference to Exhibit 3.1 to the Registrant’s Quarterly Report on Form 10-Q (File No. 814-00878), filed on May 13, 2013). | ||
| 3.2 | Second Amended and Restated Bylaws (Incorporated by reference to Exhibit 3.1 to the Registrant’s Current Report on Form 8-K (File No. 814-00878), filed on March 1, 2016). | ||
| 4.1 | Form of Stock Certificate (Incorporated by reference to Exhibit (2)(d) to the Registrant’s Pre-effective Amendment No. 2 to the Registration Statement on Form N-2 (File No. 333-173026), filed on June 8, 2011). | ||
| 10.1 | Third Amended and Restated Investment Advisory Agreement between the Registrant and Garrison Capital Advisers LLC (Incorporated by reference to Exhibit 10.1 to the Registrant’s Quarterly Report on Form 10-Q (File No. 814-00878), filed on August 9, 2016). | ||
| 10.2 | Administration Agreement between the Registrant and Garrison Capital Administrator LLC (Incorporated by reference to Exhibit (2)(k)(2) to the Registrant’s Pre-effective Amendment No. 9 to the Registration Statement on Form N-2 (File No. 333-173026), filed on February 26, 2013). | ||
| 10.3 | Trademark License Agreement between the Registrant and Garrison Investment Group LP (Incorporated by reference to Exhibit (2)(k)(3) to the Registrant’s Registration Statement on Form N-2 (File No. 333-173026), filed on March 23, 2011). | ||
| 10.4 | Dividend Reinvestment Plan (Incorporated by reference to Exhibit (2)(e) to the Registrant’s Pre-effective Amendment No. 2 to the Registration Statement on Form N-2 (File No. 333-173026), filed on June 8, 2011). | ||
| 10.5 | Indenture dated as of September 29, 2016, among Garrison Funding 2016-2 Ltd., Garrison Funding 2016-2 LLC and Deutsche Bank Trust Company Americas (Incorporated by reference to Exhibit 10.1 to the Registrant’s Current Report on Form 8-K (File No. 814-00878), filed on October 3, 2016). | ||
| 10.6 | Class A-1R Note Purchase Agreement dated as of September 29, 2016, among Garrison Funding 2016-2 Ltd., Garrison Funding 2016-2 LLC, each of the Class A-1R Noteholders party thereto and Natixis, New York Branch (Incorporated by reference to Exhibit 10.2 to the Registrant’s Current Report on Form 8-K (File No. 814-00878), filed on October 3, 2016). | ||
| 10.7 | Collateral Management Agreement dated as of September 29, 2016, by and between Garrison Funding 2016-2 Ltd. and the Registrant (Incorporated by reference to Exhibit 10.3 to the Registrant’s Current Report on Form 8-K (File No. 814-00878), filed on October 3, 2016). | ||
| 10.8 | Sub-Collateral Management Agreement dated as of September 29, 2016, by and between the Registrant and Garrison Capital Advisers LLC (Incorporated by reference to Exhibit 10.4 to the Registrant’s Current Report on Form 8-K (File No. 814-00878), filed on October 3, 2016). | ||
| 11.1 | Computation of per share earnings (included in the notes to the audited financial statements included in this report). | ||
| 131 |
| Number | Description | ||
| 14.1 | Joint Code of Ethics of the Registrant and Garrison Capital Advisers LLC (Incorporated by reference to Exhibit (2)(r) to the Registrant’s Registration Statement on Form N-2 (File No. 333-195003), filed on April 3, 2014). | ||
| 21.1 | * | List of Subsidiaries | |
| 24 | Power of attorney (included on the signature page hereto) | ||
| 31.1 | * | Certifications by Chief Executive Officer pursuant to Exchange Act Rule 13a-14(a), as adopted pursuant to Section 302 of the Sarbanes-Oxley Act of 2002 | |
| 31.2 | * | Certifications by Chief Financial Officer pursuant to Exchange Act Rule 13a-14(a), as adopted pursuant to Section 302 of the Sarbanes-Oxley Act of 2002 | |
| 32.1 | * | Certification by Chief Executive Officer pursuant to 18 U.S.C. Section 1350, as adopted pursuant to Section 906 of the Sarbanes-Oxley Act of 2002 | |
| 32.2 | * | Certification by Chief Financial Officer pursuant to 18 U.S.C. Section 1350, as adopted pursuant to Section 906 of the Sarbanes-Oxley Act of 2002 | |
| 99.1 | * | GLC Trust 2013-2 Consumer Loan Pool Schedule of Investments as of December 31, 2016 | |
| 99.2 | GLC Trust 2013-2 Consumer Loan Pool Schedule of Investments as of December 31, 2015 (Incorporated by reference to Exhibit 99.1 to the Registrant’s Annual Report on Form 10-K, filed on March 2, 2016) | ||
| * | Filed herewith. |
| 132 |
Pursuant to the requirements of Section 13 or 15(d) of the Securities Exchange Act of 1934, the registrant has duly caused this Annual Report on Form 10-K to be signed on its behalf by the undersigned, thereunto duly authorized.
| GARRISON CAPITAL INC. | |||
| By: | /s/ Joseph Tansey | ||
| Name: Joseph Tansey | |||
| Title: Chief Executive Officer | |||
| Date: March 7, 2017 | |||
KNOW ALL MEN BY THESE PRESENT, each person whose signature appears below hereby constitutes and appoints each of Joseph Tansey and Brian Chase as his true and lawful attorney-in-fact and agent, with full power of substitution and resubstitution, for him and in his name, place and stead, in any and all capacities, to sign any and all amendments to this Annual Report on Form 10-K and to file the same, with exhibits thereto and other documents in connection therewith, with the Securities and Exchange Commission, hereby ratifying and confirming all that each of said attorneys-in-fact or their substitute or substitutes may do or cause to be done by virtue hereof.
Pursuant to the requirements of the Securities Exchange Act of 1934, this Annual Report on Form 10-K has been signed by the following persons in the capacities and on the dates indicated.
| Signature | Title | Date | ||
| /s/ Joseph Tansey Joseph Tansey |
Chief Executive Officer and Chairman of the Board of Directors (Principal Executive Officer) |
March 7, 2017 | ||
| /s/ Brian Chase Brian Chase |
Chief Financial Officer, Treasurer and Director (Principal Financial and Accounting Officer) |
March 7, 2017 | ||
| /s/ Cecil Martin Cecil Martin |
Director | March 7, 2017 | ||
| /s/ Joseph Morea Joseph Morea |
Director | March 7, 2017 | ||
| /s/ Matthew Westwood Matthew Westwood |
Director | March 7, 2017 |
133